the Creative Commons Attribution 4.0 License.
the Creative Commons Attribution 4.0 License.
An observation-based methodology and application for future atmosphere secondary pollution control via an atmospheric oxidation capacity path tracing approach
Ke Yue
Yulong Yan
Yueyuan Niu
Jiaqi Dong
Chao Yang
Yongqian Zhou
Danning Wang
Junjie Li
Zhen Li
Lin Peng
As China's emission reduction efforts enter a plateau phase due to the slow decline of secondary pollutants, existing strategies face diminishing returns. Atmospheric Oxidation Capacity (AOC), a key driver of secondary pollutant formation, represents a critical yet underutilized target for more effective control. In this study, the Atmospheric Oxidation Capacity Path Tracing (AOCPT) approach was proposed to quantitatively trace AOC to its precursors and sources. It facilitates coordinated control by integrating three core modules. It employs a Radiation Equivalent Oxidation Capacity (REOC) method to quantify precursor species contributions. Meanwhile, it utilizes a Relative Incremental AOC (RIA) metric derived from a coupled box-receptor model to assess source impacts. Finally, a modified source apportionment technique was applied to resolve the respective contributions of both precursor species and sources to AOC. Successfully applied in a field study in Changzhi, China. The AOCPT identified industrial processes (26.8 %) and diesel vehicle emissions (24.1 %) as the dominant AOC sources, driven largely by trans-2-butene. Notably, conventional sensitivity analyses based on ozone (O3)-targeted strategies were found to underestimate the contributions of these two sources by 28.7 % and 48.5 %, respectively. Furthermore, while O3-targeted abatement inadvertently enhanced secondary organic aerosols (SOA), an AOC-centric strategy enabled the co-mitigation of both pollutants. By enabling the precise regulation of AOC through direct quantification of precursor and source roles, the AOCPT approach facilitates the synergistic control of secondary pollutants. It provides a robust technical pathway and theoretical foundation to overcome current challenges in air quality management.
- Article
(5742 KB) - Full-text XML
-
Supplement
(1489 KB) - BibTeX
- EndNote
Atmospheric Oxidation Capacity (AOC), which comprises reactive oxidants such as hydroxyl radicals (OH•), ozone (O3), and nitrate radicals (NO3•), etc. acts as the chemical engine that governs the transformation efficiency of precursors such as volatile organic compounds (VOCs), nitrogen oxides (NOx) and sulfur dioxide (SO2) into secondary pollutants including O3, secondary organic aerosols (SOA), sulfates, and nitrates, etc. (Yu et al., 2022). Modulation of AOC, which directly affect the secondary pollutant formation potential.
In recent years, the Chinese government has achieved substantial reductions in primary pollutant emissions. With the implementation of “the Air Pollution Prevention and Control Action Plan” and “The Three-Year Action Plan on Defending the Blue Sky”, the NOx and CO, etc. concentrations of China were reduced by 31 % and 33.3 %, respectively, in 2024 compared to 2018 (MEP, 2024). However, the environmental risks stemming from secondary pollutants remain a major concern. In 2024, O3-8H concentration in key economic clusters like the Beijing-Tianjin-Hebei (187 µg m−3) and the Fenwei Plain region (187 µg m−3) remained high (MEP, 2024). Similarly, while primary organic aerosols (POA) have decreased significantly, the reduction in secondary organic aerosols (SOA) has been limited (Chen et al., 2024). This persistence of secondary pollution is directly correlated with strong AOC (Huang et al., 2014; Wang et al., 2022a; Hu et al., 2017). AOC not only drives the photochemical formation of O3 but also contributes of up to 80 % to SOA formation (Huang et al., 2014; Zhao et al., 2020). Consequently, the health burdens caused by secondary pollutants, such as respiratory and cardiovascular diseases, continue to rise (Zhang et al., 2022) These trends indicate that current precursor emission control policies have failed to effectively mitigate the impacts of secondary pollution.
Previous studies have indicated that refined emission control strategies are more effective than broad reduction policies. For instance, source-specific mitigation measures based on speciated emission inventories have been proposed to control O3 pollution (Wu and Xie, 2017). Others have highlighted the need for simultaneous control of VOCs and NOx (Ding et al., 2022) or identified critical VOC species based on RO2 radical chemistry (Liang et al., 2024). However, most of these studies neglected the importance of AOC, which acts as the principal driver of secondary pollution generation (Li et al., 2025). Even among existing studies of AOC, the focus predominately remains on chemical mechanisms and radical interactions (Yu et al., 2022; Mochida et al., 2003), with limited exploration of emission-driven oxidation dynamics. This gap is critical because attempts to control O3 alone can unexpectedly increase SOA levels in regions with high AOC due to complex, non-linear mechanisms (Niu et al., 2024; Lyu et al., 2022). Focusing solely on individual secondary pollutants creates a “survivor bias” and may result in deviations in emission reduction strategies (Le et al., 2020; Goldstein and Galbally, 2007). Therefore, it is essential to prioritize the investigation of AOC and identify source contributions to AOC for the coordinated control of secondary pollution. Consequently, current strategies relying on source analysis for individual secondary pollutants have limitations. In contrast, direct traceability analysis of AOC offers a more representative perspective and enhances regulatory efficacy for secondary pollution control.
Herein, we developed and applied an Atmospheric Oxidation Capacity Pathway Tracing (AOCPT) approach to advance secondary pollution control. This approach quantifies standardized precursor impacts on atmospheric oxidation capacity (AOC) using a metric, the Radiation Equivalent Oxidation Capacity (REOC). It then directly links emission sources to AOC by defining the Relative Incremental Atmospheric Oxidation Capacity (RIA) through coupled observation box model (OBM) – positive matrix factorization model (PMF) analysis. Finally, a refined source apportionment method was proposed to quantitatively resolve the contributions of both specific precursors and emission sources to total AOC. To demonstrate its efficacy, the AOCPT approach was applied in a field study in Changzhi, a typical industrial city in China. The study quantitatively traced the contributions of specific precursors and sources to AOC. Furthermore, the approach provided a scientific basis for the synergistic control of O3 and SOA, overcoming the limitations of single-pollutant strategies.
2.1 Site description and data collection
To test and apply the proposed methodology for secondary pollution control, a continuous field campaign was carried out in Changzhi, a typical industrial city in China, from 21 to 28 August 2024. A detailed description of the study site's industrial characteristics and the specific sampling locations is provided in Sect. S1 in the Supplement. The Environmental Monitoring Station of Changzhi provided hourly data for key trace gases, including O3, NO, NO2, and CO, as well as for meteorological parameters (temperature, relative humidity, and atmospheric pressure, etc.).
A total of 81 VOCs species were continuously sampled at 2 hours sampling frequency by using 3 L stainless steel canisters (SUMMA canister, Entech Instruments Inc., California, USA), and were then stored at indoor temperature and analyzed within a week of sampling. The ambient samples were analyzed using a pre-concentrator (Entech 7200A Instruments Inc., USA) coupled with a gas chromatograph–mass selective detector/flame ionization detector (GC–MSD/FID, Agilent 7890GC/5975MSD/FID, USA). The detailed sampling procedures, analytical protocols, and strict quality assurance and quality control (QA/QC) measures are presented in Sect. S2.
2.2 Atmospheric oxidation capacity path tracing approach (AOCPT)
2.2.1 Calculation of the initial concentration of VOCs
In this study, initial VOCs (InVOCs) were considered as VOCs directly emitted from sources, calculated by Eq. (1) (Wang et al., 2022b).
where [VOCi]In and [VOCi]M were initial VOCs and measured VOCs concentration for species i, respectively (ppbv); ki denotes reaction rate constant between VOCi and OH• radicals (cm3 molec.−1 s−1); [OH] represents the OH• radicals concentration (molec. cm−3), which was simulated by box model; and Δt represents the photochemical age or time that VOCi's reaction with OH• radicals (s), detail information for ki and Δt calculation are presented in Sect. S3.
2.2.2 Quantifying radical-specific contributions to AOC
Step 1: the AOC and the formation of secondary pollution O3 was simulated using the Master Chemical Mechanism (MCM) in Framework for 0-D Atmosphere Modeling (F0AM) software (Jenkin et al., 2015; Wolfe et al., 2016). This open-source, zero-dimensional (0-D) box model has been widely used (Nault et al., 2024), and a detailed introduction to its application can be found in our previous research (Niu et al., 2024).
The AOC could be represented by the sum of the reaction rates of VOCs, CO, etc. with OH•, O3, and NO3• (Yu et al., 2022).
where [X] and [Yi] are the number concentrations of molecule oxidant X and Yi, respectively, and is the bimolecular rate constant of molecule Yi with oxidant X. The oxidants included OH•, NO3•, and O3 (Chapleski et al., 2016). The AOC attributed to each reaction rates was extracted during observation box model (OBM) simulations using the model's built-in extract rates function. It should be noted that the F0AM is a zero-dimensional (0-D) box model, which focuses on chemical mechanisms while simplifying physical transport processes. Analyzing the atmospheric chemical reactions of typical secondary pollutant O3 based on the same principle.
Step 2: tracing and identified key precursor material species influencing AOC by examining their roles in photochemical reaction pathways. As a key oxidant and primary driver of AOC, OH• initiate VOCs oxidation to produce HO2• and RO2• radicals, which subsequently participate in O3 formation and SOA generation (Chen et al., 2022; Tadic et al., 2021). Controlling OH•, HO2•, and RO2• radicals is critical for regulating AOC, particularly through modulating OH• concentrations. The study of Yang et al. (2024) demonstrated that alkene-O3 reactions generate criegee intermediates (CI), which enhance OH•, HO2•, and RO2• radical concentrations and accelerate ROx• cycling (Yang et al., 2024). Elevated RO2• and HO2• concentrations during ROx• cycling enhances OH• production, which is the primary driver of AOC. We introduce the radiation equivalent oxidation capacity (REOC) metric based on radical generation pathways from intermediate species. REOC quantifies precursor contributions to OH•, HO2•, and RO2• radicals by normalizing their production to equivalent OH• oxidation capacity, providing a unified measure of VOCs species oxidative impacts. The REOC can be calculated by Eqs. (3)–(5).
where the d[OH•]t, d[HO2•]t and d[RO2•]t are the directly generated rates of OH•, HO2• and RO2• radicals at time t. Parameters α and β represent the conversion efficiencies of HO2• and RO2• to OH•, respectively, which can be calculated through dividing the rate of conversion of all HO2• and RO2• to OH• by the rate of generation of all HO2• and RO2•, respectively. Sensitivity analysis confirms that the reliability of identifying key reactive species was not compromised by parameter uncertainties (detailed in Sect. S4 and Fig. S1 in the Supplement). Reaction pathway tracing and analyzing enables systematic quantification of OH• radical production from VOCs, more effectively characterizing precursor-specific contributions to atmospheric oxidation processes.
2.2.3 Source-resolved AOC sensitivity and attribution framework
Step 1: VOCs and NOx source apportionments were calculated by the PMF model (US EPA 5.0). This study selected thirty-eight InVOCs species and NOx for PMF analysis, and applies its core principle of decomposing the sampling data matrix into two constituent matrices to estimate VOC species contributions (He et al., 2019; Yu et al., 2022; Liu et al., 2025).
where xij represents the concentration of species j in sample i; gik is the contribution of source k in the sample i; source profile fkj is the mass percentage of species j in source k; eij is the residual for species j in sample i; and p is the total number of source categories. For other relevant calculation formulas of the PMF model can be found in Sect. S5.
Step 2: the sensitivity of AOC to various emission sources was analyzed by calculating their Relative Incremental Atmospheric oxidation capacity (RIA). This was accomplished by integrating the OBM–PMF models to simulate AOC changes under various emission reduction scenarios. Through this systematic scenario modeling, we quantified source-specific sensitivity coefficients to identify the most influential sources. This methodology identifies dominant AOC-controlling emission sources through response quantification. The calculation equations of relative incremental reactivity (RIR) and RIA are shown in Eqs. (7) and (8), respectively.
where RIRt represents the sensitivity of different emission sources after emission reduction at time t, Net(X) represents the net production rate of a specific species X, Group X, or source X. Net(X−ΔX) refers to the net production rate of X caused by the hypothetical emission change ΔX. S(X) is the total observed mixing ratio of precursor X. ΔS(X) is the total mixing ratio change of precursor X caused by the hypothetical emission change (assumed to be 20 % in this study), n is the number of emission sources derived from PMF.
Step 3: we further establish a quantification framework assessing both emission source contributions and species-specific impacts on AOC. Integrating PMF source apportionment with relative AOC reactivity metrics, this method systematically determines (1) source-level AOC contributions and (2) within-source VOC species oxidation capacity, identifying dominant emission sources and pollutant species. The species and emission source contribution of AOC are shown in Eqs. (9) and (10).
where SCAOCij is the contribution of species j in source i to AOC, is the reaction rate constant between VOCs species and OH• radicals of species j in source i, which used to characterize the contribution of VOCs species to the chain reaction of free radicals, CAOCi is the contribution of source i to AOC, AOCi is the AOC of source i derived from OBM–PMF, n is the number of emission sources derived from PMF.
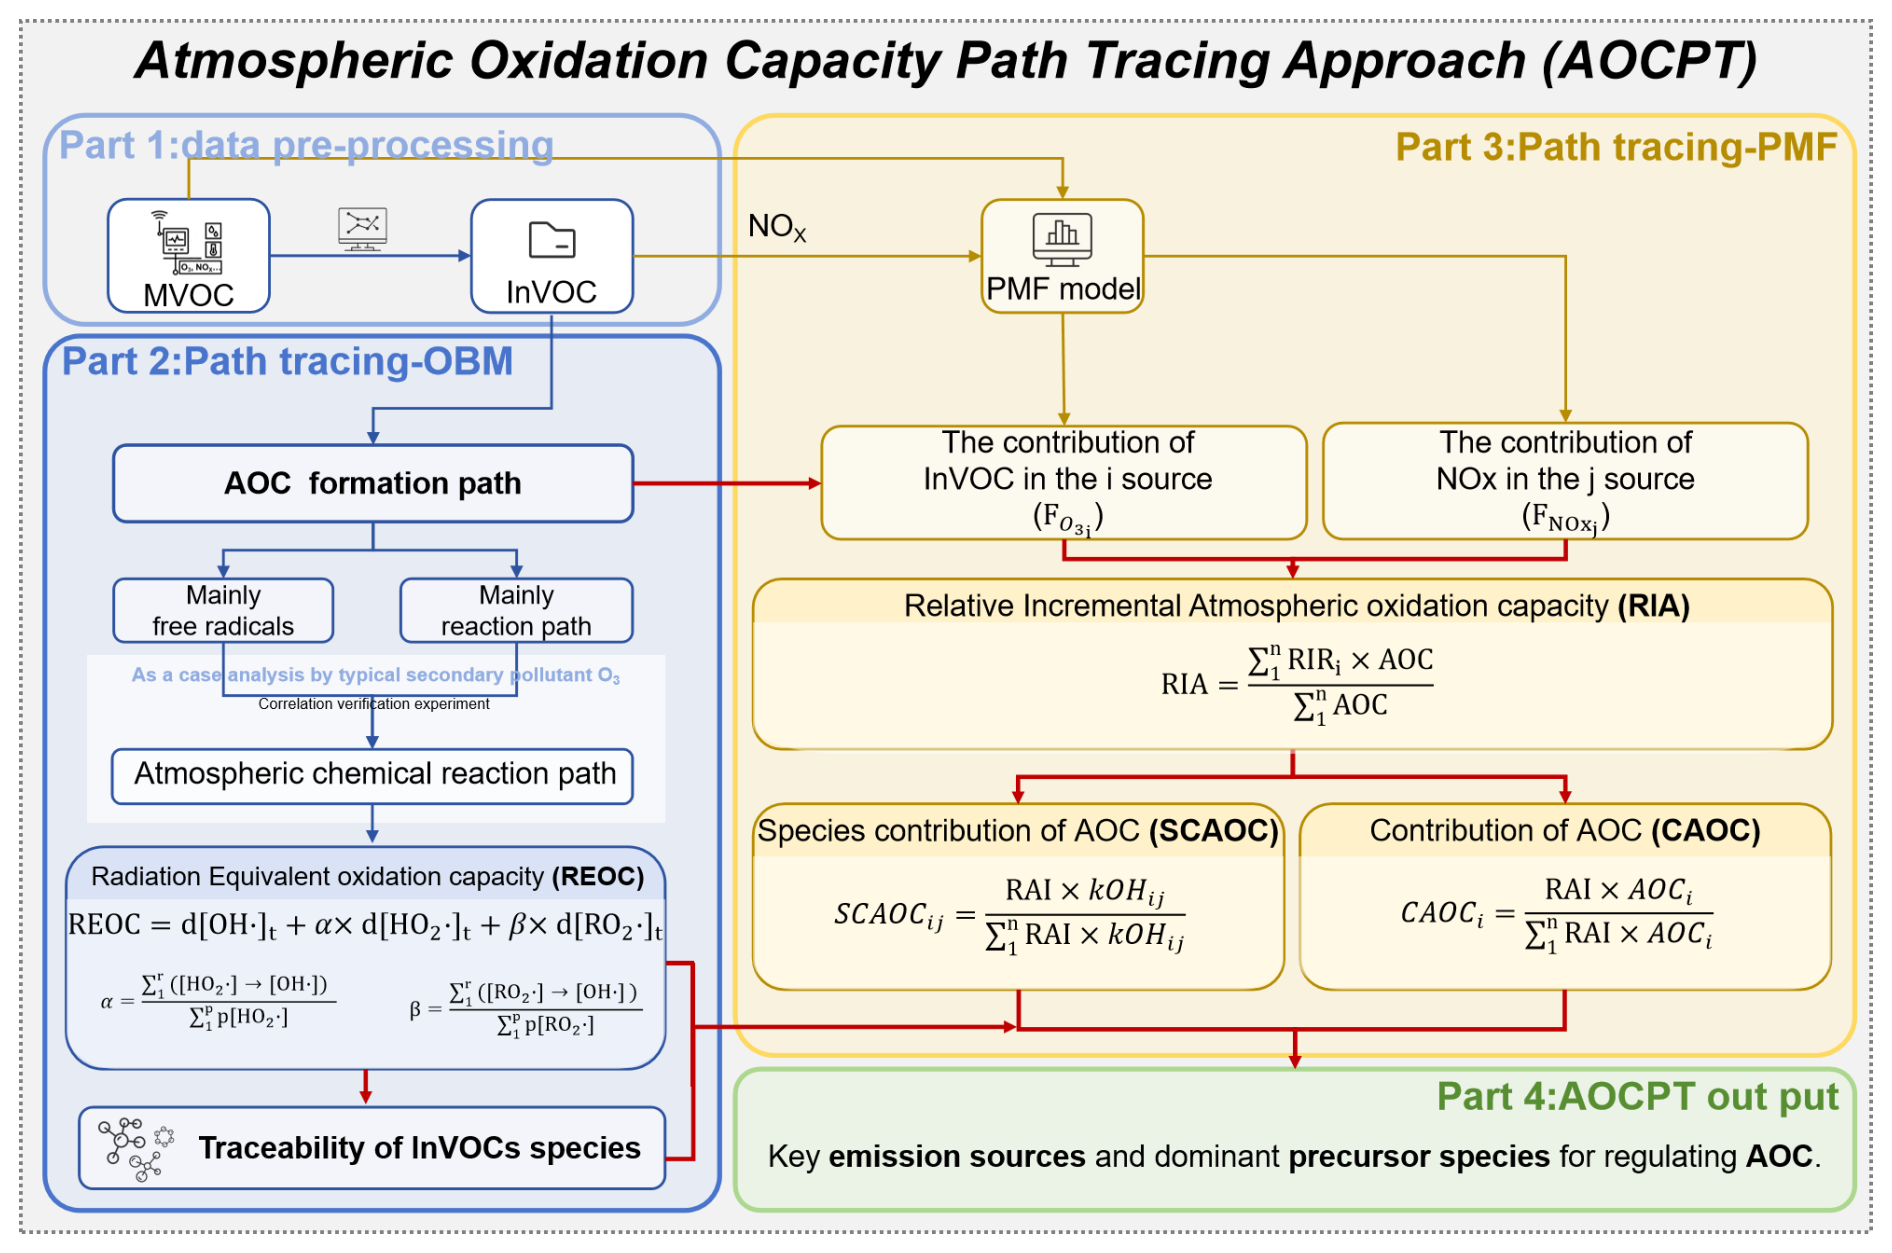
2.2.4 Workflow of the AOCPT method
Figure 1 shows the workflow of the AOCPT method. Briefly, (1) the AOC of each time steps during the study period was quantified by OBM, and identified the reactions and oxidants that contribute significant to AOC. (2) Through pathway tracing and analyzing of atmospheric chemical reactions, we developed the REOC metric to systematically quantify VOCs-driven OH• radical production, identifying key reactive VOCs species. (3) The PMF-based source apportionment identifies emission source sensitivities influencing AOC, while quantitatively assessing source-specific contributions from individual VOC species and NOx to AOC variations, and analyzed the contributions of different emission sources to AOC. Overall, achieving path tracing and traceability of AOC. Compared to existing studies that rely on individual secondary pollutants, the AOCPT method prioritizes the perspective of secondary pollutant formation through quantitative and qualitative analysis. It is primarily applicable to observation-based diagnoses of complex air pollution in urban environments across different seasons. Therefore, this approach provides a robust methodological basis and research direction for the synergistic control and management of secondary pollutants.
3.1 Overview characteristics
Studies have indicated that the concentration of measured volatile organic compounds (MVOCs) was lower than Initial VOCs (InVOCs) (Wang et al., 2022b). Therefore, the InVOCs have been analyzed in this study (Sect. S6 and Fig. S2). During the daytime (08:00 to 18:00 LT, UTC+08:00), the average concentration of InVOCs (20.1±1.0 ppbv) was 30.0 % higher than MVOCs (15.3±2.6 ppbv). Specifically, isoprene and anthropogenic alkenes were significantly underestimated by 34.8 % and 29.9 %, respectively, due to their rapid photochemical depletion (Yang et al., 2024). This difference was defined as consumed VOCs, which participated in atmospheric photochemical reactions (Wang et al., 2022b).
The average concentrations and diurnal variation characteristics of atmospheric pollutants (O3, InVOCs, CO and NO2) from study period were analyzed (Fig. S3). O3 is a typical representative of secondary pollutants in summer. During pollution period (O3 > 160 µg m−3), the average concentration of NO2, CO, O3 and InVOCs was higher than clean period (O3 ≤ 160 µg m−3) 21.9 %, 21.7 %, 22.9 % and 77.2 %, respectively. The increase in concentration of oxidants (NO2, CO and O3 etc.), which can helps to enhance the AOC capability (Liu et al., 2021). The CO and NO2 showed unimodal variation characteristics (the highest in 8:00), and the concentration of pollution period were higher than clean period during 08:00 to 12:00 LT 46.7 % and 119.6 %, respectively. However, the InVOCs showed bimodal variation characteristics (the highest in 08:00 and 14:00 LT), and the concentration of pollution period were higher than clean period during 08:00 to 12:00 LT 49.7 % and 89.8 %, respectively. This shown that the precursors were accumulation in the morning and increased in daytime, which may promote strong photochemical reactions, especially in the afternoon (12:00 to 16:00 LT), promote the enhancement of AOC capability and leading to O3 pollution (Liu et al., 2022). The highest d-value of InVOCs and MVOCs was in 14:00 LT (50.1 %), which also indicated the strong photochemical reactions in afternoon (Fig. S2). Notably, Isoprene and anthropogenic alkene between InVOCs and MVOCs, which d-value were largest, due to the strong photochemical reactions during 12:00 to 16:00 LT. Diurnal variation patterns demonstrate that enhanced precursor emissions coupled with chemical depletion drive summer secondary pollution events, which substantiating the implementation basis for the secondary pollution control methods in this study.
3.2 Species tracing and analyzing of atmospheric oxidizing capacity
3.2.1 Quantification of atmospheric oxidizing capacity
The AOC during the sampling periods was quantified, as shown in Fig. 2. The calculated averaged value of total AOC was 5.5×10⁷ molec. cm−3 s−1, with a pollution period AOC of 7.7×10⁷ molec. cm−3 s−1, which was 126.3 % higher than the clean period (3.4×10⁷ molec. cm−3 s−1). The AOC from pollution period was higher than Zhengzhou (6.2×10⁷ molec. cm−3 s−1 in 2020) (Yu et al., 2022), Shanghai (approx. 3.7×10⁷ molec. cm−3 s−1) (Zhu et al., 2020) and Hongkong (approx. 6.78×10⁷ molec. cm−3 s−1) (Xue et al., 2016). As a typical industrial city characterized by energy and heavy industries (Sect. S1), it emits substantial amounts of reactive precursors that serve as abundant fuel for photochemistry. Higher AOC serves as an important driver of secondary pollution incidents in summertime (Zhu et al., 2020). Meanwhile, this establishes favorable operational parameters for AOC investigations within the study framework. During pollution period, OH• exhibited the highest average concentration (3.8×10⁷ molec. cm−3 s−1) in AOC, followed by O3 (2.8×10⁷ molec. cm−3 s−1) and NO3• (1.2×10⁷ molec. cm−3 s−1), contributing 48.7 %, 35.7 %, and 15.5 %, respectively. Thus, OH• was the main contributor of atmospheric oxidation, aligning with findings from other studies in diverse geographical regions (Yu et al., 2022; Guo et al., 2022; Zhang et al., 2021).
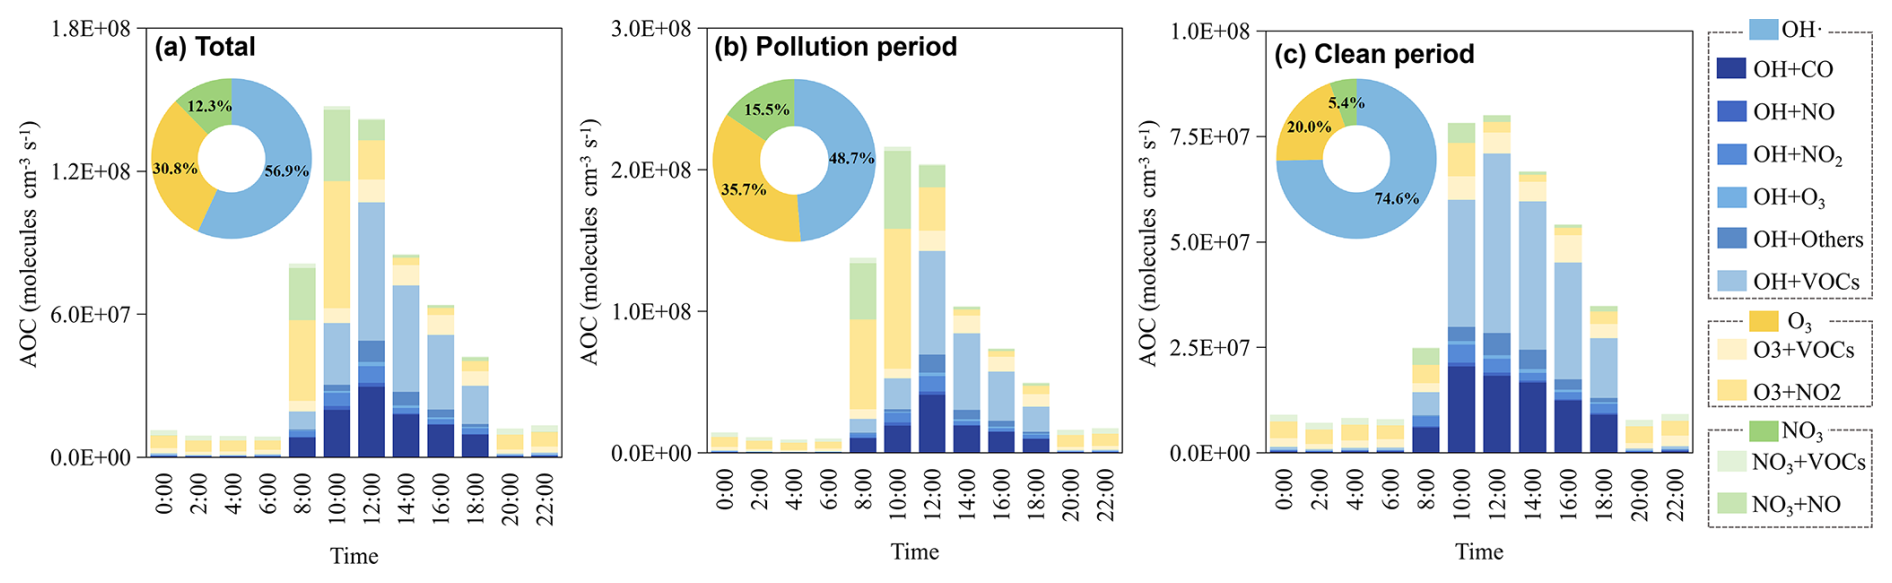
Our further mechanistic analysis of AOC associated reactions elucidates summertime secondary pollution formation (Fig. 2). The average contribution of O3 + NO2 reactions to AOC during pollution period (36.2 %) exceeds that during clean period (25.9 %), particularly between 08:00 to 12:00 LT, where it exceeded clean periods by an average of 20.7 %. Elevated ambient NO2 concentrations (Fig. S3c) combined with attenuated O3 titration establish critical preconditions for this reaction mechanism (Dong et al., 2023). The O3 + NO2• promotes O2 generation, facilitating RO• + O2 to HO2•, which enhances the production of OH• radical from HO2• + NO reaction and exacerbates the AOC (Wang et al., 2017). Diurnal NO2 decline and VOCs accumulation (Fig. S3), coupled with enhances photochemical activity driving intensified the OH• + VOCs reactions. Notably, polluted periods exhibit an 18.3 % higher daytime average in OH• + VOCs reactions compared to clean periods, which directly supports the reactions of RO2• + NO. That's explains why the maximum reaction rates of HO2• + NO and RO2• + NO during the pollution period were 85.5 % and 113.9 % higher than those during the clean period, respectively (Fig. S4). During the cleaning period, VOCs emissions are more prominent than NOx emissions (Fig. S3), make the daytime OH• + VOCs dominate OH• reactions contributions of AOC during clean period (37.9 %). Overall, O3 + NO2 and OH• + VOCs were the mainly reaction of AOC, which collectively accounted for 48.5 % to 56.1 % of daytime AOC during the sampling period. Therefore, controlling NO2 and InVOCs emissions were essential to mitigated AOC and secondary pollution incidents in summer. However, the emission sources and speciation of InVOCs are complex. Therefore, it is crucial to track and identify key VOC species that significantly impact AOC through radical chemistry.
3.2.2 Free radical budget analysis
The free radicals during different pollution periods in the study period were analyzed through the F0AM model (Fig. S6). The OH• and HO2• showed unimodal variation characteristics during the pollution period, average concentration were 3.6×10⁶ and 0.4×10⁹ molec. cm−3, which higher than clean period 62.3 % and 38.6 %, respectively. During the pollution period, the maximum of OH• in this study (13.0×10⁶ molec. cm−3) was higher than Shanghai (approx. 9.5×10⁶ molec. cm−3) (Zhang et al., 2021), Lanzhou (4.5×10⁶ molec. cm−3) (Guo et al., 2022), and Beijing (2.7×10⁶ molec. cm−3) (Slater et al., 2020), and the maximum of HO2• (1.31×10⁹ molec. cm−3) was higher than Beijing (7.3×10⁸ molec. cm−3) (Jia et al., 2023) and Shanghai (approx. 3.77×10⁸ molec. cm−3) (Zhu et al., 2020). The OH• constitute the predominant regulator of atmospheric oxidation processes (Yu et al., 2022), governing the initiation and propagation of radical chain reactions in the troposphere (George et al., 2023). Meanwhile, OH• contributed to the decomposition of precursor VOCs, which was important to the secondary pollution incidents in summer. Moreover, the reaction of HO2• + NO can further promote the generation of OH• radicals. The higher free radicals concentrations in this study indicated higher atmospheric oxidation, which the linear relationships between AOC and OH• radicals with a fitting degree of R2=0.77 (Sect. S8). Thus, the reaction pathways of OH• radicals in photochemical processes were employed to trace critical VOCs and primary emission sources, which enabled the regulation of AOC and thereby subsequent reduction of secondary pollution, establishing this approach as a viable control strategy.
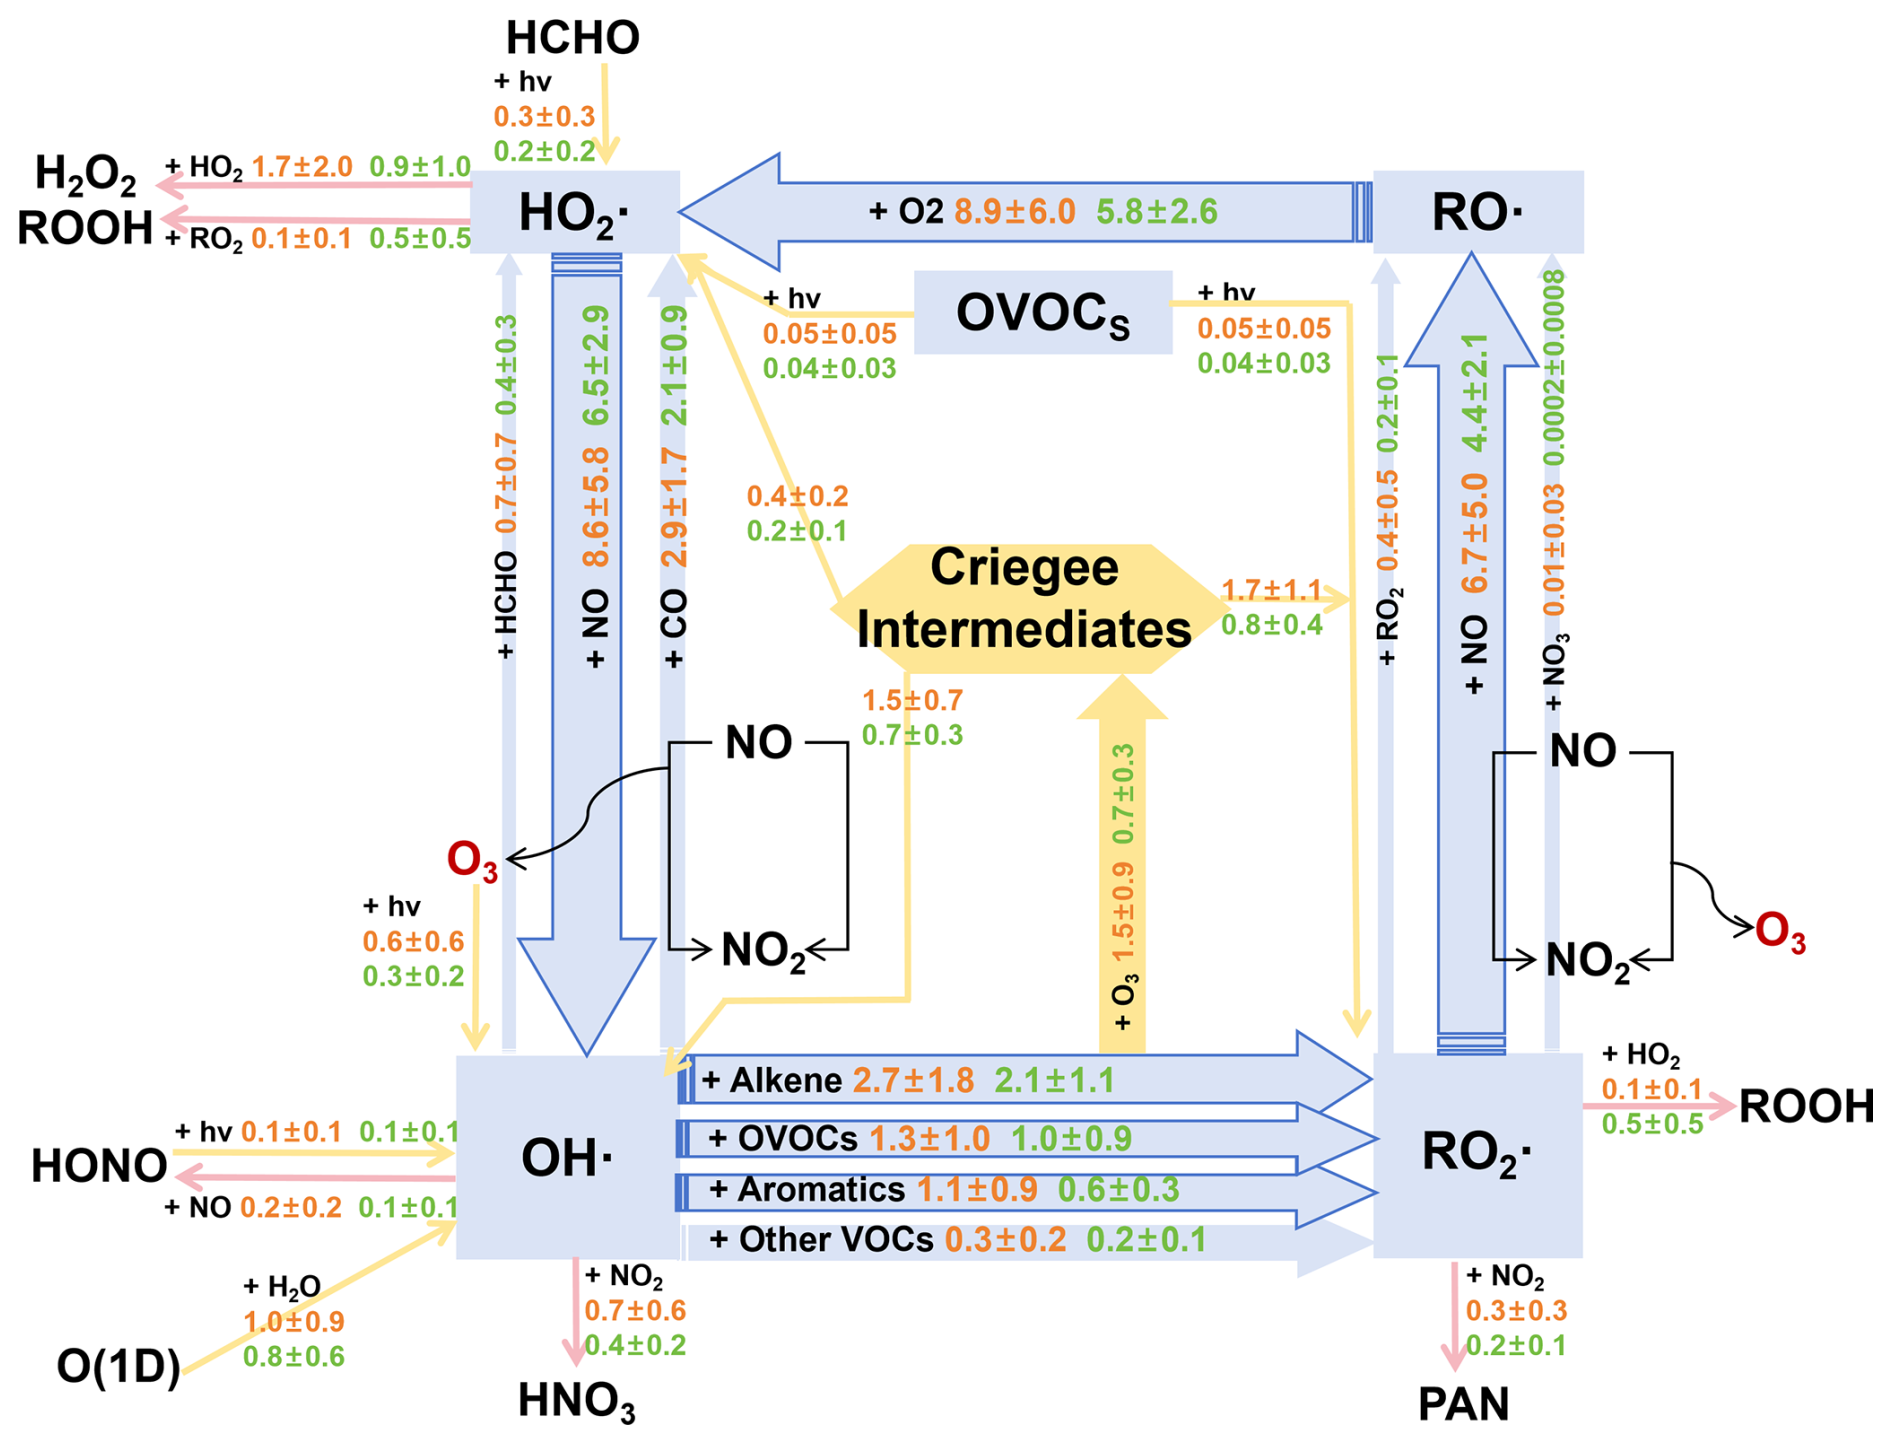
Figure 3The average daytime (08:00 to 18:00 LT) budget of the ROx• radical cycle, with reaction rates shown in ppbv h−1. Primary radical sources and sinks are highlighted in yellow and pink. Blue arrows denote ROx• recycling pathways. Reaction rates for polluted and clean periods are displayed in orange and green text, respectively.
3.2.3 Source of free radical
During the observation period, the radicals cycling process in the daytime (08:00 to 18:00 LT) was shown in Fig. 3. OH• plays a vital role in the ROx• (OH• + HO2• + RO• + RO2•) cycle in photochemical reactions through InVOCs to the secondary pollution formation in summer (Wei et al., 2023; George et al., 2023; Yang et al., 2024). The OH• was mainly productid by HO2• + NO, the reaction rate of pollution period was 8.6±5.8 ppbv h−1 higher than clean period 32.3 %, which was also the dominated reaction of the secondary pollution formation during summertime (as shown in Sect. 3.2.1). Subsequently, OH• + InVOCs to generated RO2•, which reaction rate was 5.3±3.6 ppbv h−1 in pollution period, higher than clean period (3.9±1.9 ppbv h−1). OH• + alkene was the dominated reaction, which accounted for 50.9 % during the pollution period. RO2• + NO to generated RO•, the rate during pollution period (6.7±5.0 ppbv h−1) was 52.3 % higher than the clean period (4.4±2.1 ppbv h−1), which was another dominated reaction the secondary pollution formation in summertime (as also shown in Sect. 3.2.1). Meanwhile, RO• + O2 to generated HO2• (reaction rate was 8.9±6.0 ppbv h−1), which increased rapidly the HO2•. Noteworthily that alkene can directly reacted with O3 to productid criegee intermediates (CI), which can increase the concentrations of RO2•, OH•, and HO2• radicals (Yang et al., 2024). Therefore, the reaction of alkene + O3 and OVOCs + hv can be considered as the direct source of OH•, RO2• and HO2• radicals, which produced from primary pollutant. To mitigate the radical reaction processes, it is essential to regulating their emission sources and mainly species.
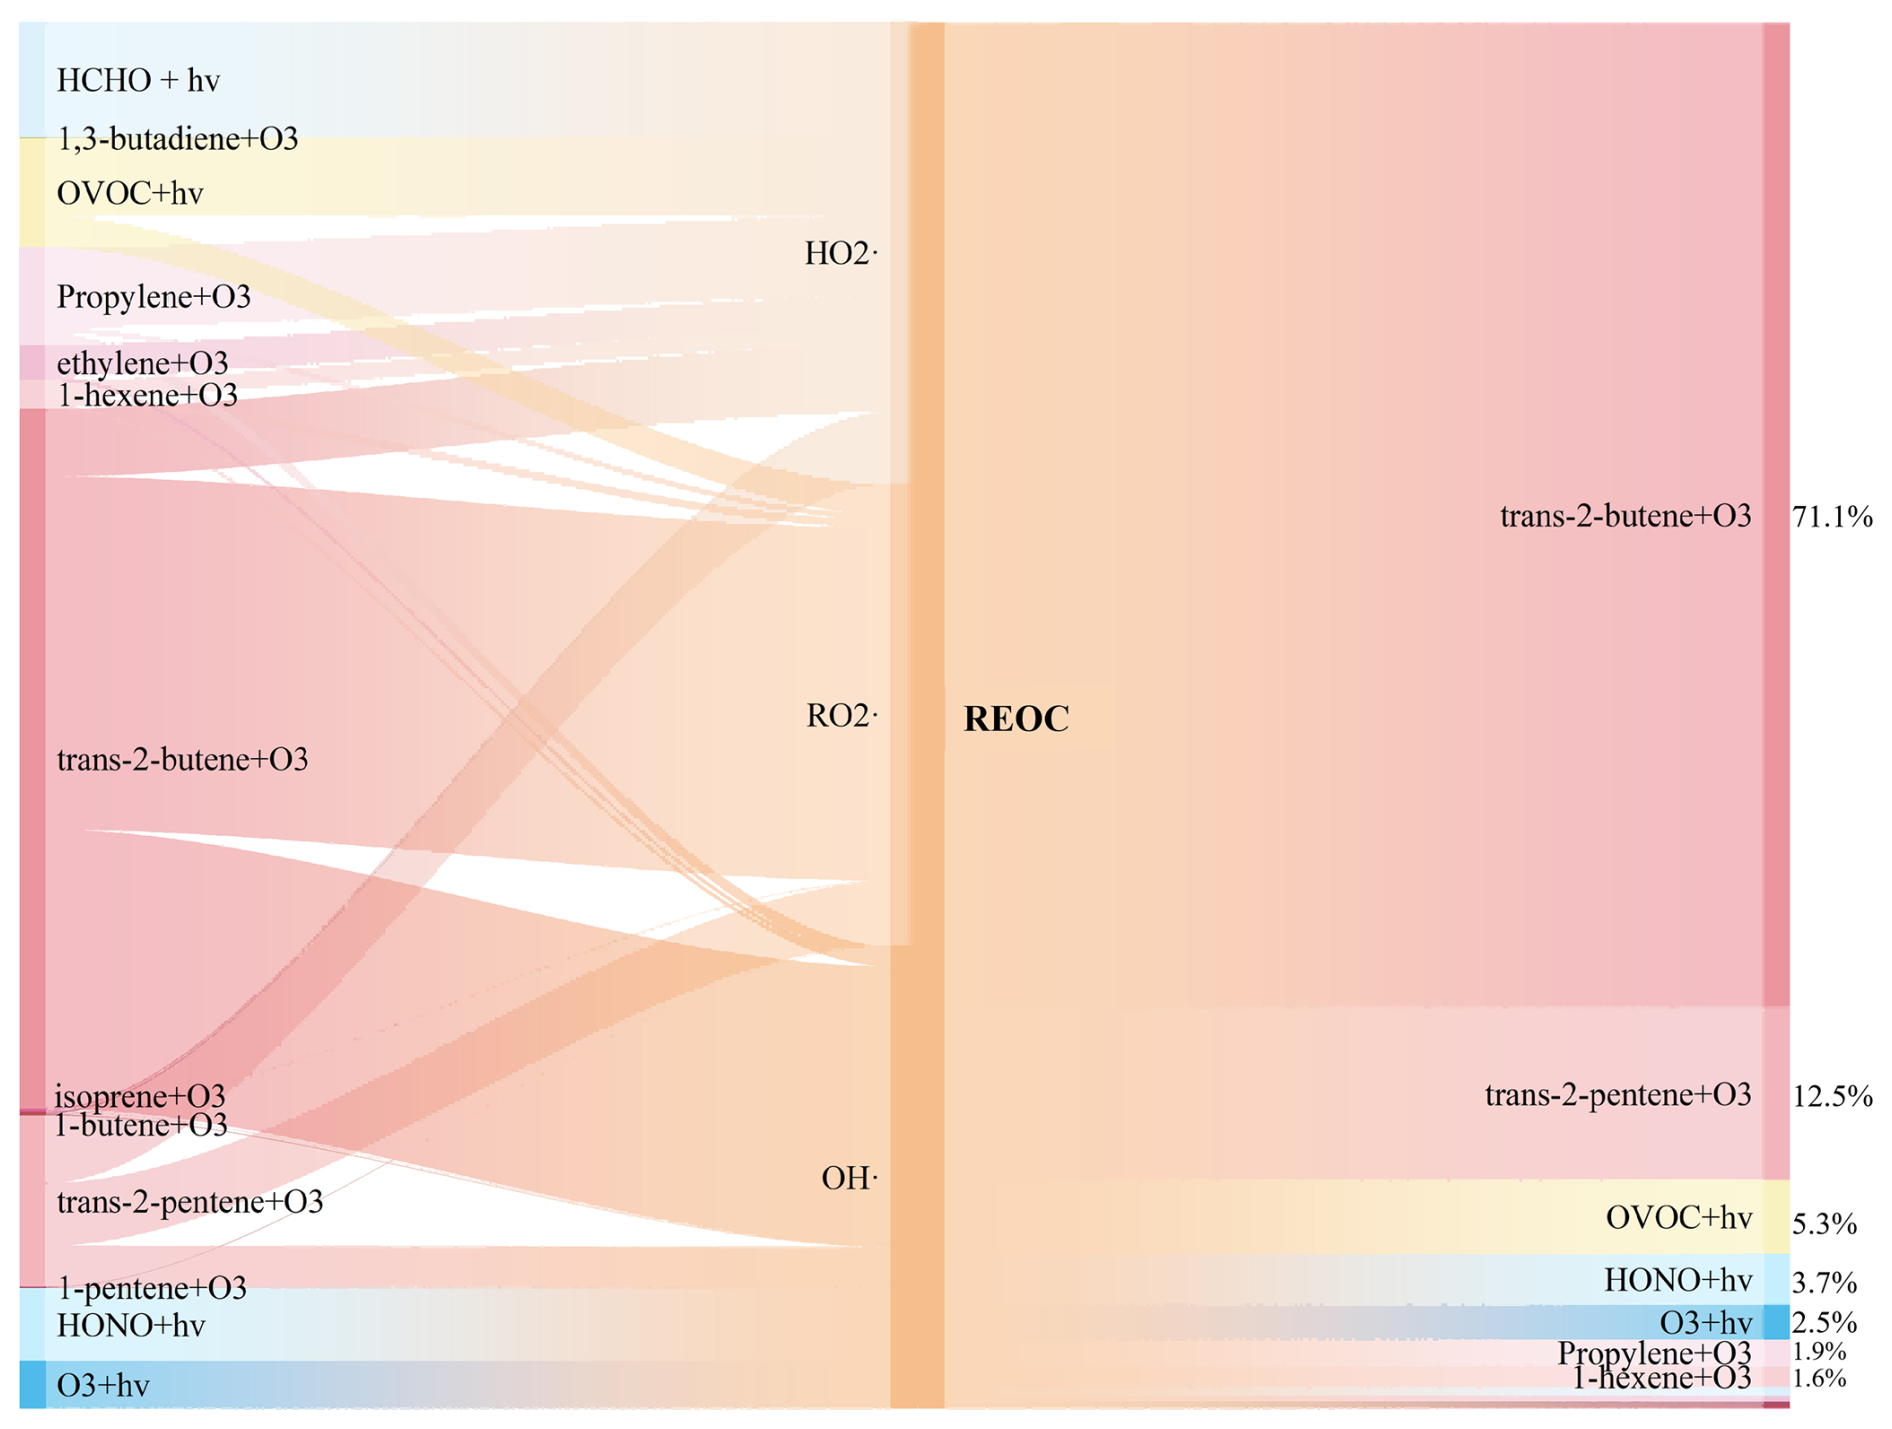
Figure 4Daytime (08:00 to 18:00 LT) average contributions of initial sources to OH•, HO2•, and RO2• during the observation period.
This study utilized the REOC concept (Eq. 3) to unify the quantification of InVOCs contributions to radical generation (Fig. 4). Given the dominance of OH•-related reactions in AOC (as also shown in Sect. 3.2.1), REOC normalizes the capacity of InVOCs to generate various radicals into an equivalent OH• generation capacity. This metric thus serves as an indirect indicator of InVOCs contributions to AOC. The reaction of alkene + O3 influenced the concentrations of RO2•, OH• and HO2• contributing 93.4 %, 73.9 % and 58.0 %, respectively. Trans-2-butene was identified as a key source species, contributing 76.3 % and 60.3 % to the formation of RO2•, and OH•, respectively. Previous studies have demonstrated that trans/cis-2-butene and pentenes readily react with O3, generating CH3CHOOB criegee intermediates, which rapidly decompose into CH3O2, OH•, and CO (Yang et al., 2024). This process propagates the ROx•cycle, especially the OH• and CO are both key oxidants in the AOC reaction (Fig. 2), which ultimately drives significant AOC and secondary pollution formation in summertime. Therefore, to better assess direct InVOCs contributions to AOC, we developed the REOC metric, which quantifies radical-mediated oxidative impacts by normalizing VOC-derived RO2• and HO2• production to OH•-equivalent values through chemical reaction pathways. This framework identifies localized InVOCs species critically influencing AOC, with trans-2-butene demonstrating predominant REOC contributions (71.1 %) followed by trans-2-pentene (12.5 %). Although the species identified by the method of REOC may have a relatively small proportion in TVOC, but high reactivity allows it to have a significant impact on atmospheric photochemical pollution even at lower concentrations (Yang et al., 2020). Thus, precursor emission control strategies must prioritize emission sources, that release key components and species demonstrating considerable impacts on AOC, rather than focusing solely on total emission reduction targets. The methodology of REOC establishes a reactivity-based prioritization system for targeted precursor species management.
3.3 Source apportionment and emission reduction
3.3.1 Secondary pollutant precursors source apportionment
This study applied the PMF 5.0 model to analyze the secondary pollutant precursors sources (Fig. 5). During the sampling period (Fig. 5a), InVOCs were predominantly contributed by diesel vehicle emissions (26.3 %), gasoline vehicle emissions (25.3 %), and industrial processes (18.0 %). In pollution episodes (Fig. 5b), the contribution from diesel vehicles rose to 30.7 %, becoming the dominant source, followed by industrial processes (20.6 %) gasoline vehicles emission (23.8 %). Notably, contributions from diesel vehicles and industrial processes were 11.5 % and 6.8 % higher, respectively, during pollution periods compared to clean periods. NOx primarily originated from diesel vehicles emission (30.2 %), gasoline vehicles emission (29.1 %), industrial process (20.6 %), and combustion source (20.2 %) (Fig. 5d). Contributions from diesel vehicles emission and industrial process to NOx during pollution period exceeded clean periods by 11.2 % and 6.3 %, respectively. Combined, diesel vehicles emission and industrial process contributed more to both InVOCs and NOx, particularly during pollution period, likely driven by industrial expansion and heightened transport demands. In 2024, the mining industry (accounting for 76.2 % of the industrial total) registering a 6.3 % growth in Changzhi City (CZMBS, 2024). Coupled with an energy mix heavily reliant on thermal power (91.8 % vs. 8.5 % from renewables) intensified emission pressures (CZMBS, 2024). Thus, to mitigate the precursors of secondary pollution, industrial cities should prioritize emission controls for heavy industries.
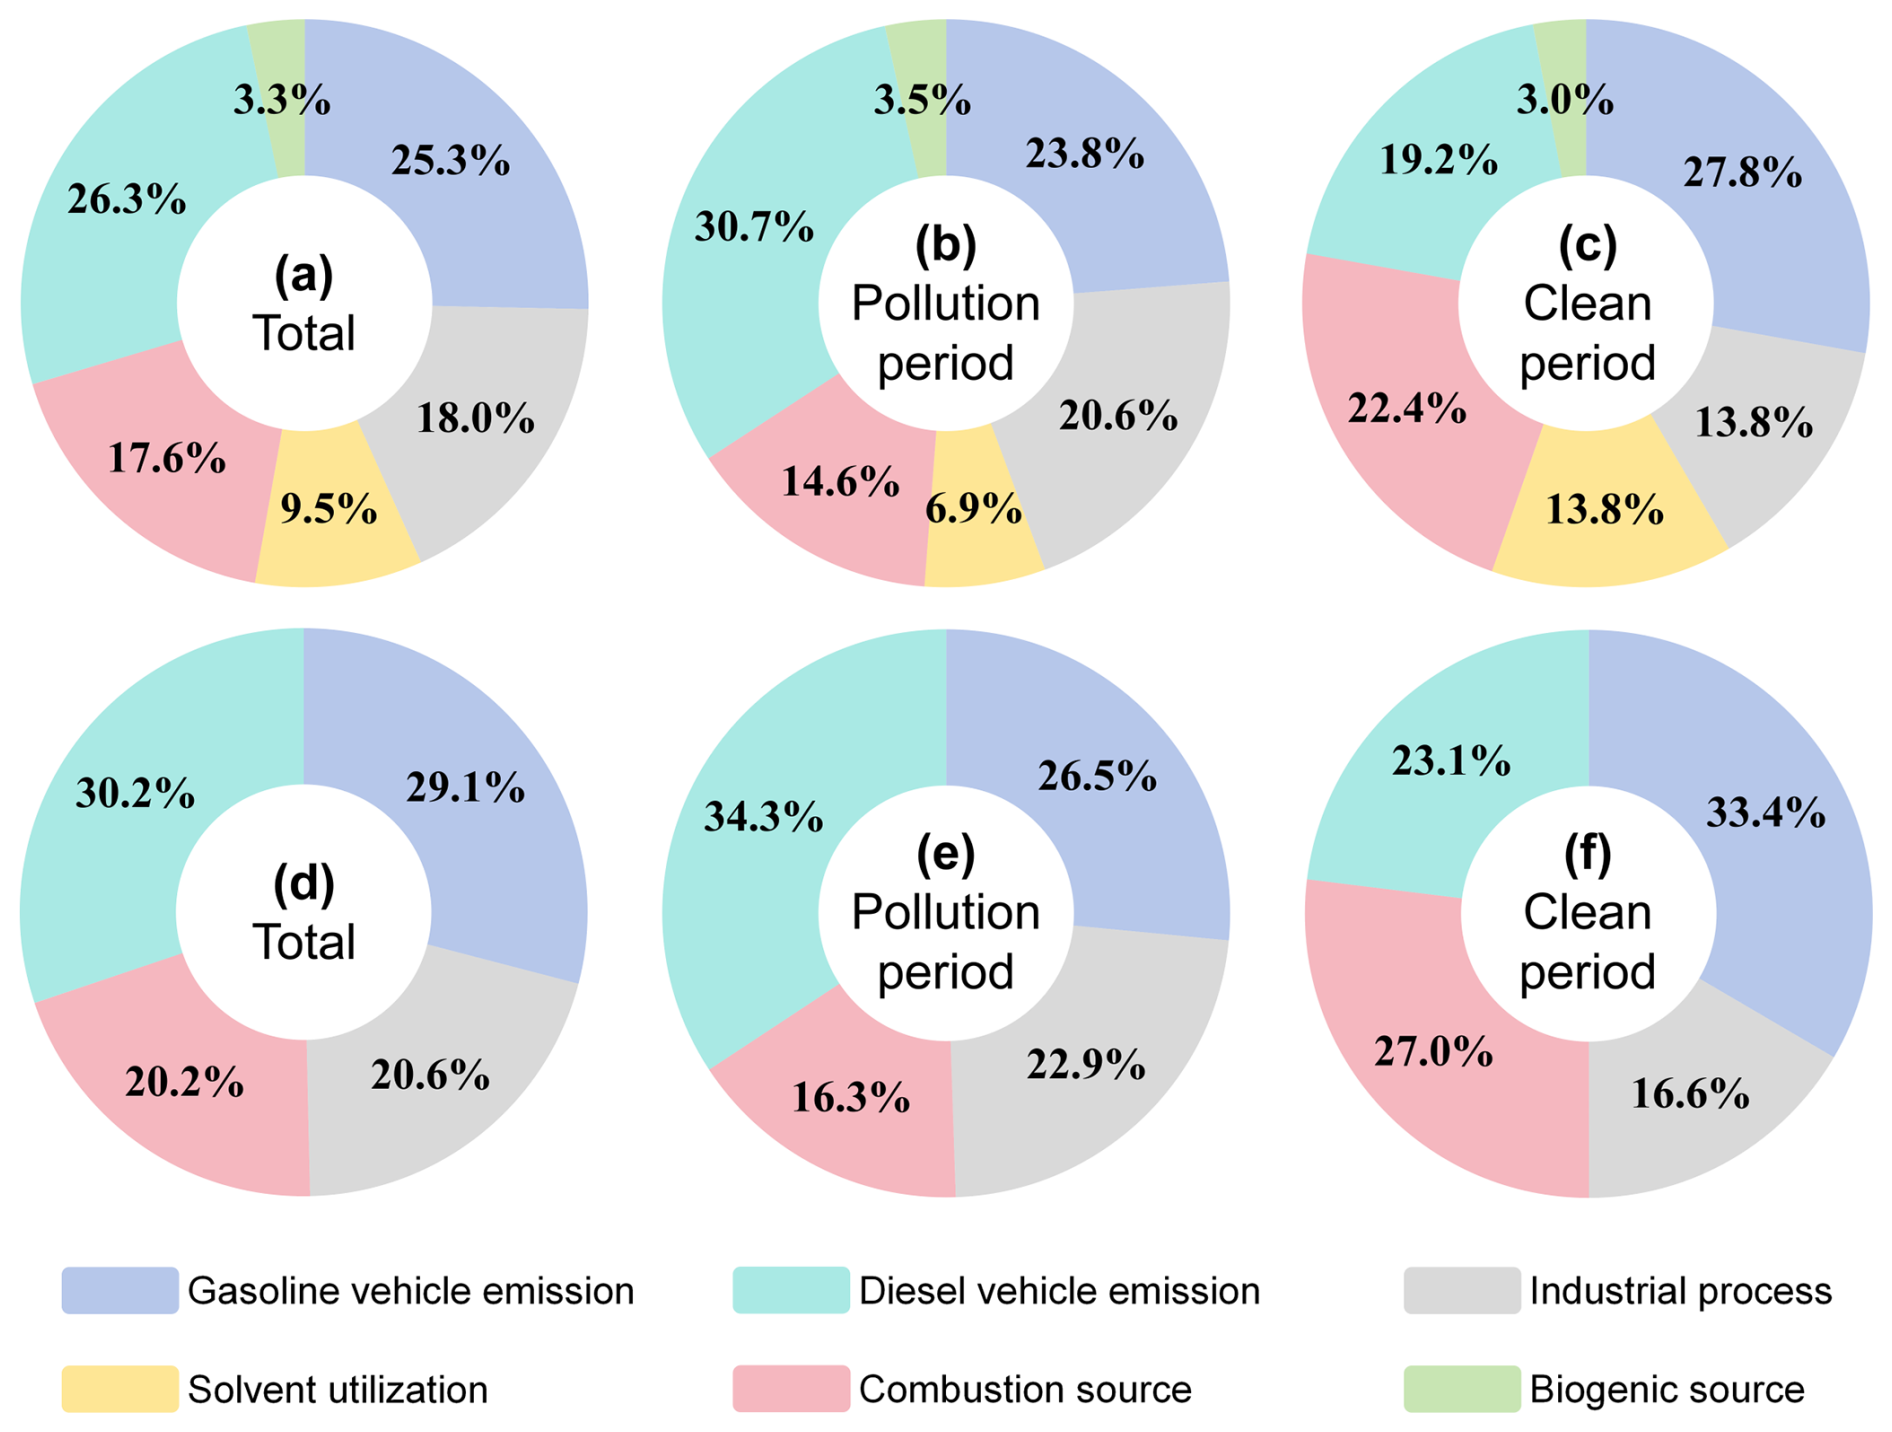
Figure 5Source contribution of secondary pollutant O3 precursor from the PMF model. (a)–(c) were InVOCs. (d)–(f) were NOx.
3.3.2 Species and source apportionment of AOC
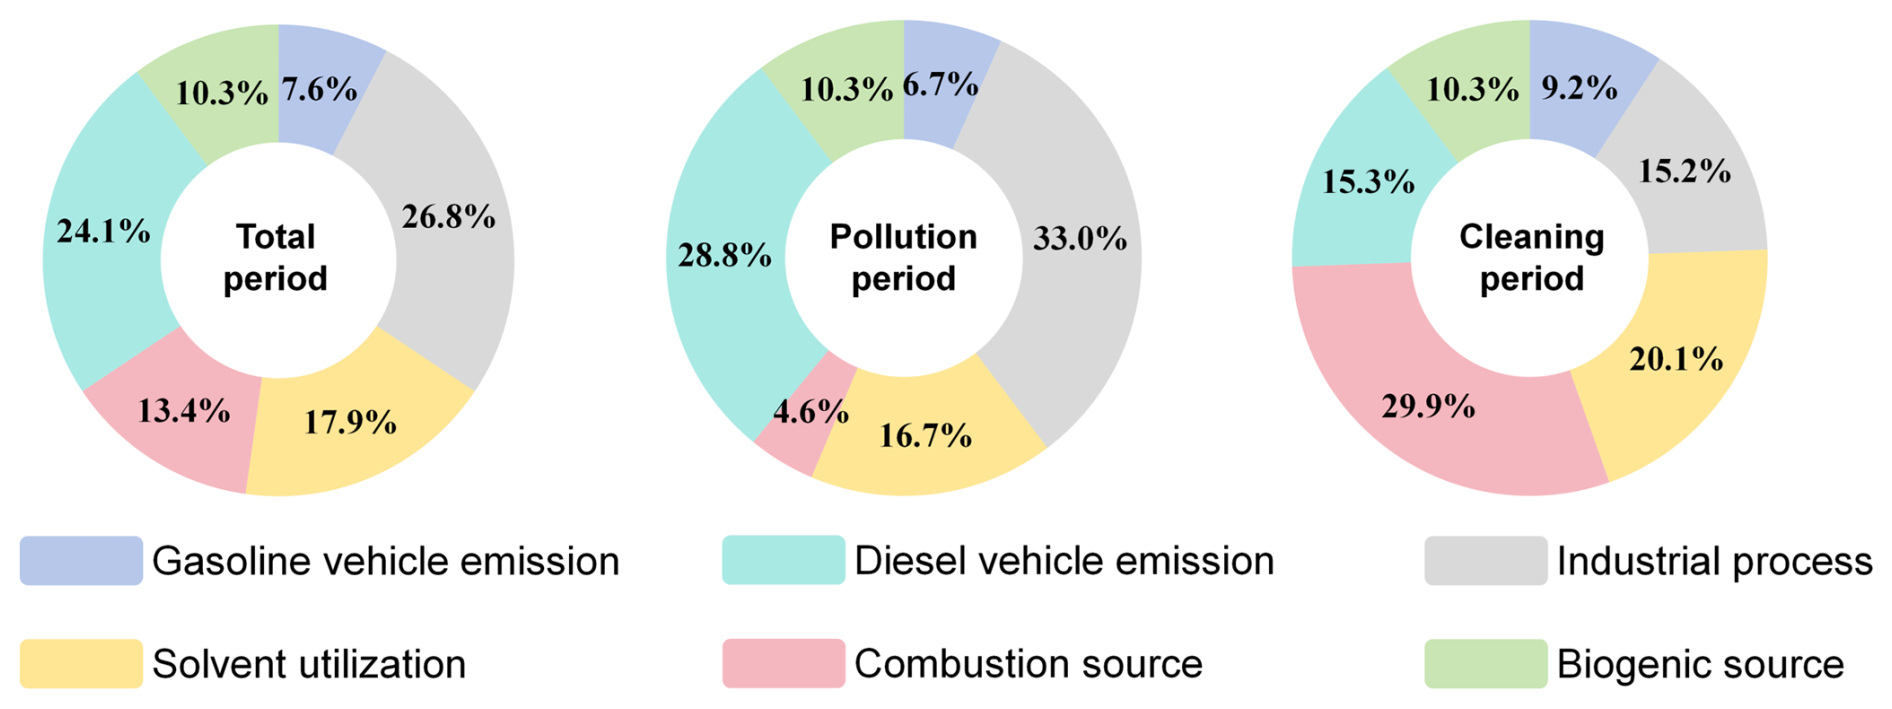
Based on the source apportionment results (Sect. 3.3.1), critical sources affecting the AOC were identified (Fig. 6), and the contributions of key InVOCs species from these sources were analyzed (Fig. 7). During the sampling period, industrial process (26.8 %) and diesel vehicle emission (24.1 %) were the dominant contributors to AOC, followed by solvent utilization (17.9 %), combustion source (13.4 %), biogenic source (10.3 %) and gasoline vehicle emission (7.6 %). Particularly, the industrial process (33.0 %) and diesel vehicle emission (28.8 %) during polluted periods demonstrate 17.8 % and 13.5 % elevation compared to cleaning period, respectively.
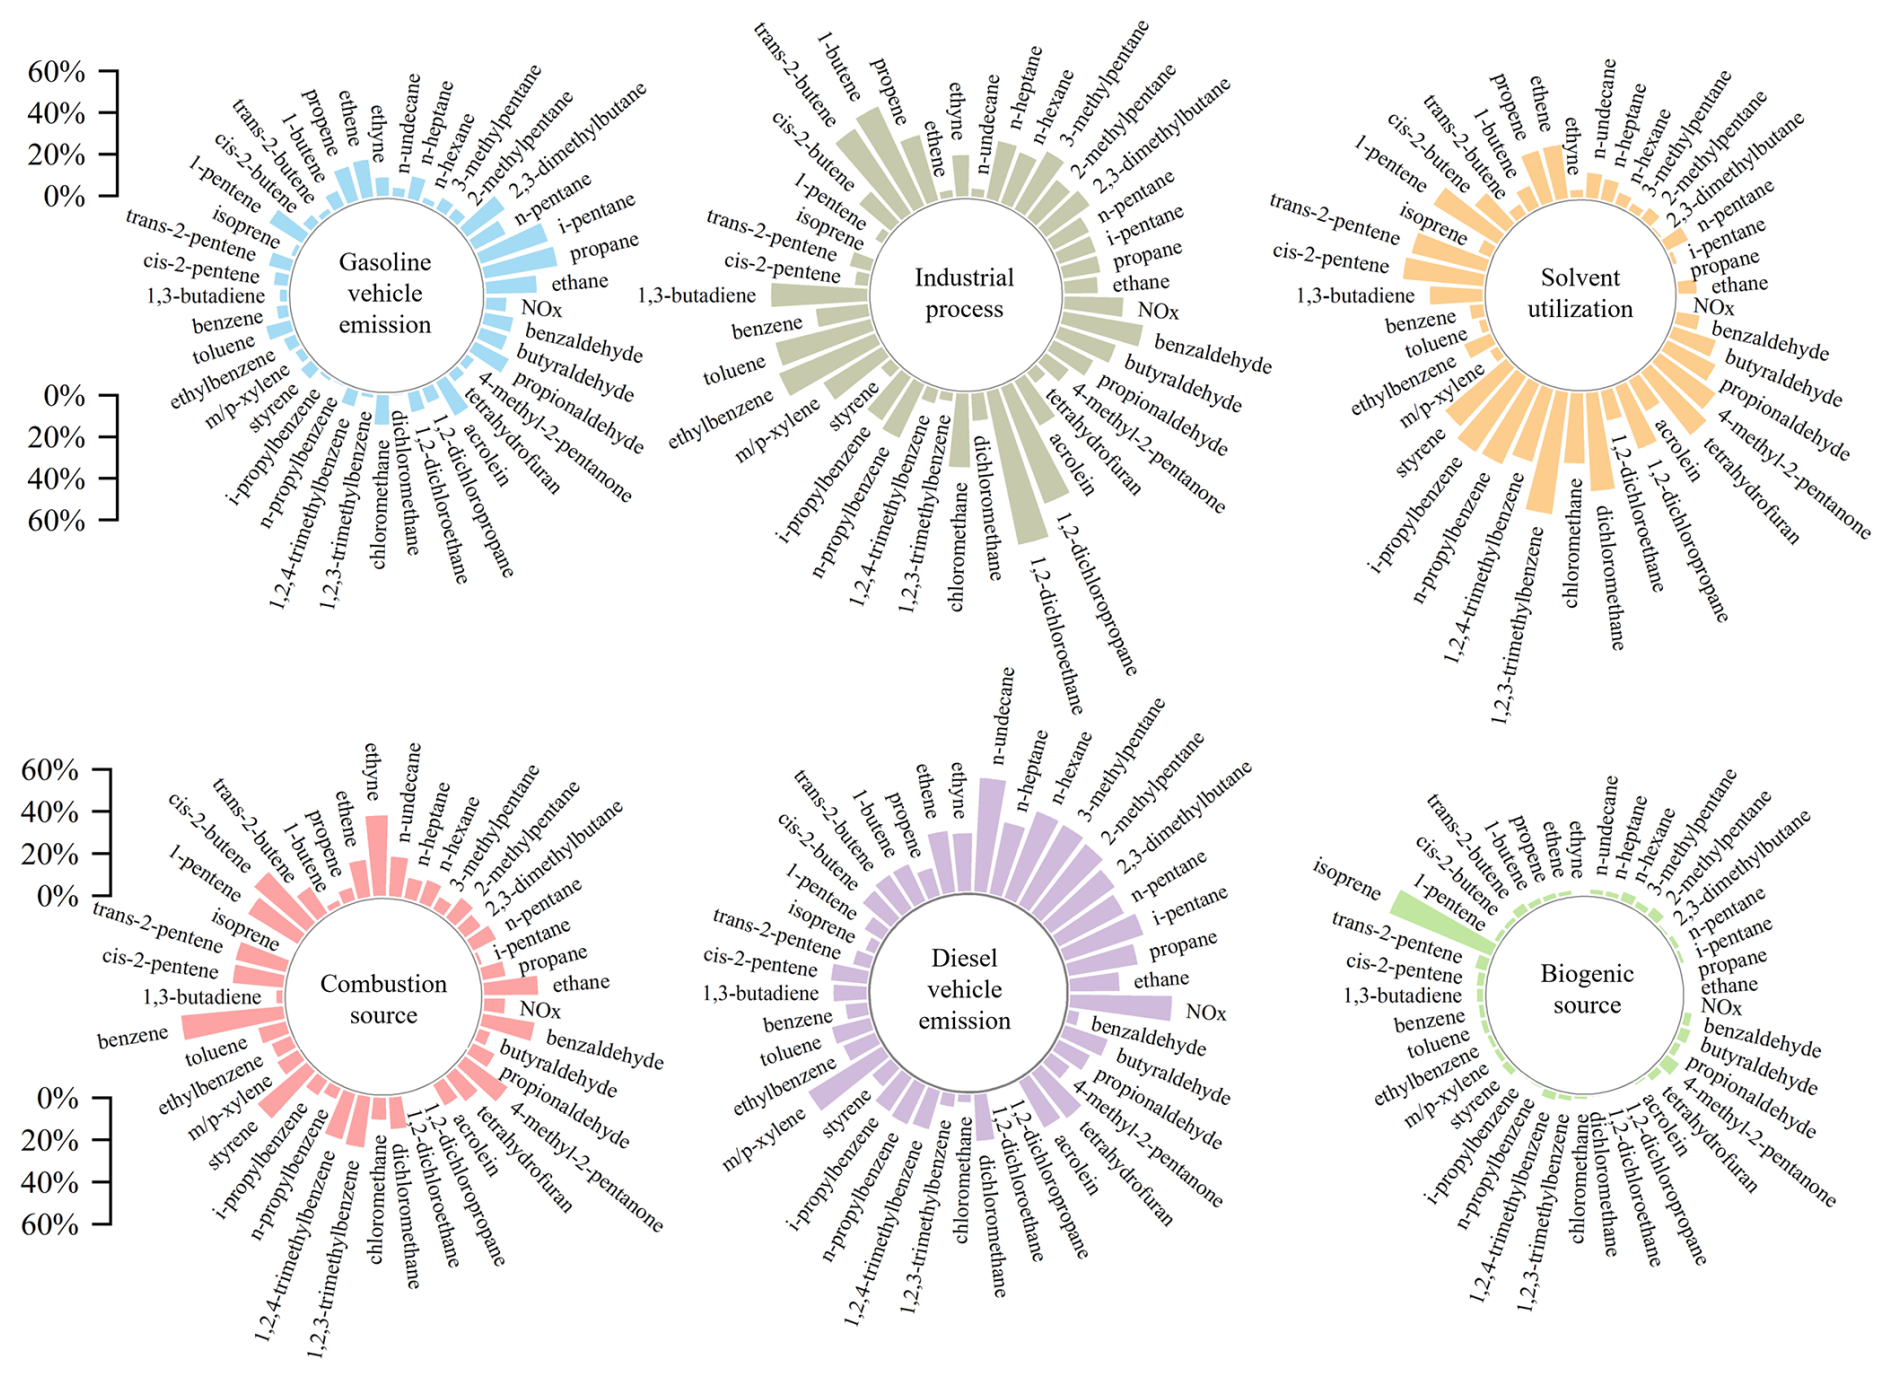
Among VOCs species contributions across emission sources, we prioritized alkenes, which demonstrating significant impacts to AOC (Sect. 3.2.3). Industrial process exhibited the highest alkene contributions (31.0 %), followed by diesel vehicles emission (20.7 %). Source-specific alkene contributions were significantly correlated (P<0.05) with their respective impacts on AOC. This finding accounts for why industrial process and diesel vehicle emission exhibited higher contributions to AOC in this study case, highlighting the critical role of alkene chemistry in oxidation processes. Particularly, with the analysis of the key alkene species trans-2-butene (Sect. 3.2.3), which disproportionately affects AOC, revealed its highest impact from industrial process (49.3 %), followed by diesel vehicle emission (20.6 %). Trans-2-butene emission magnitudes across sources exhibited significantly correlations (P<0.05, R2≈0.91) with their corresponding AOC contributions.
However, gasoline vehicle emission exhibited 41.1 % higher total VOCs emissions than industrial process, primarily attributed to elevated contributions from ethane, propane, isopentane, and ethylene. But for trans-2-butene, which has a higher impact on AOC, gasoline vehicle emission exhibited 83.5 % and 65.8 % lower emissions compared to industrial process and diesel vehicle emission, respectively. While previous studies have shown that high emission levels may offset low chemical reactivity of VOCs species (Tang et al., 2018), the case of this study demonstrates that high-reactivity species remain critical concerns, particularly regarding their impacts on AOC. This also indicated that if the current secondary pollution control strategies focusing solely on high VOCs emission sources and neglecting the impact of source emissions on AOC, particularly for sources with lower aggregate emissions but elevated reactive species emissions, it may lead to survivorship bias in the implementation effectiveness of control measures. This discrepancy may underlie persistent summertime secondary pollution episodes despite substantial precursor reductions.
For NOx, the predominantly influence AOC originate from diesel vehicle emission (52.0 %) and industrial process (28.5 %), followed by combustion source (9.8 %) and gasoline vehicle emission (9.7 %). A statistically significant correlation (P<0.05) exists between source-specific NOx contributions and their AOC impacts. This may be attributed to elevated NOx emissions enhancing O3 + NO2 reactions, particularly during morning period (Sect. 3.2.1), thereby increasing the source contributions to AOC. Therefore, necessitating integrated control strategies targeting both VOC and NOx emission sources for effective AOC mitigation.
A comparison between AOC and O3 source apportionment was conducted using summertime O3 pollution of the case study (Fig. S9). The analysis of O3 source apportionment, which identified industrial emission (22.6 %), gasoline vehicle emission (22.1 %), and combustion source (21.3 %) as primary contributors, systematically underestimated diesel vehicle emission (8.3 % underestimation) and industrial emission (4.2 % underestimation) source impacts while overestimating others. The differences in source apportionment results may directly affect the direction of pollution emission control. Thus, compared to O3 source apportionment approaches, AOC oriented source tracing may better facilitate coordinated secondary pollution control, through its comprehensive consideration of the conversion process from primary pollutants to secondary pollutants.
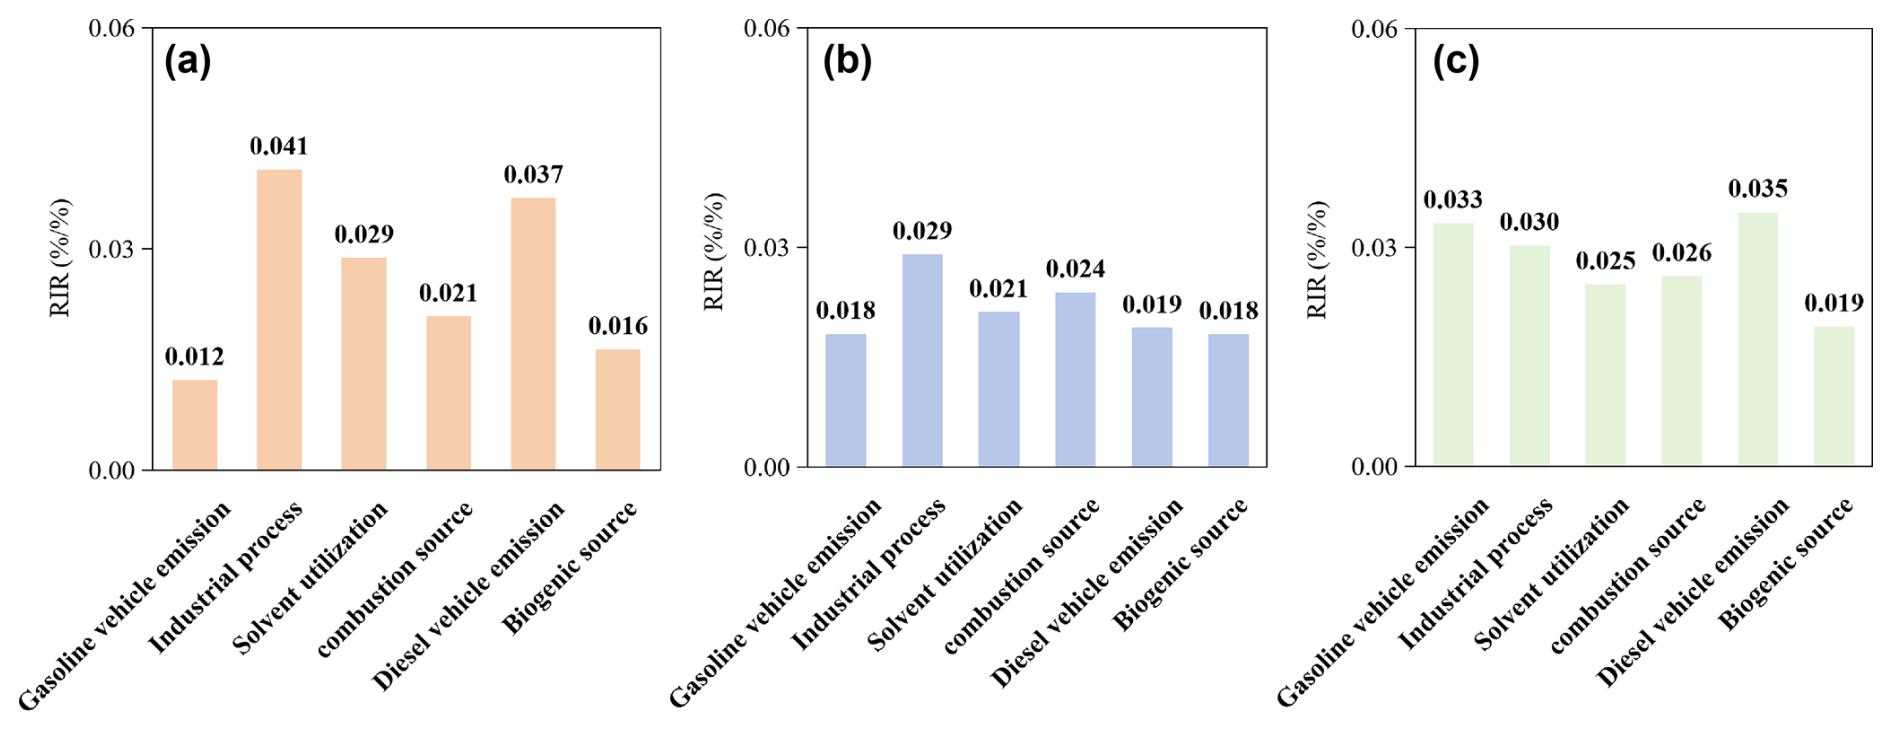
Figure 8Source sensitivity analysis. (a)–(c) represents the sensitivity of AOC, O3, and SOA to different emission sources, respectively.
3.3.3 Analysis of emission reduction sensitivity
This study further analyzes source sensitivities of AOC, O3, and secondary organic aerosols (SOA) to precursors (Fig. 8). Although the F0AM model simulates gas-phase chemistry, the formation potential of SOA can be effectively characterized by the reaction rates of peroxy radical self-reactions (self-rxns: RO2• + HO2•, RO2• + HO2• and HO2• + HO2•). These reactions typically generate low-volatility compounds (e.g., organic peroxides and accretion products) that readily partition into the particle phase to form SOA (Lyu et al., 2022). Therefore, the sensitivity of Self-Rxns to precursor emissions serves as a robust proxy for SOA source sensitivity. The detailed calculation method of self-reaction is provided in Sect. S10.
AOC demonstrates the highest source sensitivity to industrial process (0.041), followed by diesel vehicle emission (0.037) and solvent utilization (0.029). Compared to AOC source sensitivities (Fig. 8a), the O3 sensitivity analysis (Fig. 8b) shows distinct deviations. Specifically, it underestimates the contributions of industrial processes (0.029), solvent utilization (0.021), and diesel vehicle emissions (0.019) by 28.7 %, 26.5 %, and 48.5 %, respectively. In contrast, gasoline vehicle emissions (0.018) and combustion sources (0.024) were overestimated by 48.8 % and 14.4 %. Similarly, the self-reaction sensitivity analysis (Fig. 8c) deviates from the AOC baseline. It underestimates industrial processes (0.030), solvent utilization (0.025), and diesel vehicle emissions (0.035) by 25.7 %, 13.4 %, and 5.6 %, respectively. Conversely, gasoline vehicles (0.033) and combustion sources (0.026) were overestimated by 172 % and 25 %. These results confirm that industrial processes and vehicle emissions are indeed the common dominant drivers for AOC, O3, and SOA formation (as indicated by the positive sensitivity values in Fig. 8). Previous studies have identified industrial process and combustion sources have a significant impact on O3 pollution, primarily due to their elevated precursor pollutants emissions that in promoting O3 formation (Zhan et al., 2023). Additional research has also established industrial process and vehicular emissions of semivolatile and intermediate-volatility organic compounds (SVOCs and IVOCs) as dominant precursors in SOA formation (Tang et al., 2021; Miao et al., 2021). However, these studies remain confined to single secondary pollutant analyses, neglecting the control of secondary pollution from the perspective of AOC, especially the lack of analysis of alkenes like trans-2-butene etc., which crucially AOC. Thus, given that AOC quantifies secondary pollutant formation potential (Yu et al., 2022), the source sensitivity divergence with both AOC and individual secondary pollutants (e.g., O3 and SOA) indicates that it was necessitates prioritizing emission sources' oxidation capacity impacts over their singular pollutant contributions (Wang et al., 2024).
3.3.4 Impact of reduction scenarios on secondary pollutant generation
The isopleth diagram was used in this study to quantify the nonlinear relationship between AOC, O3 and SOA (Fig. 9) with the precursors (InVOCs and NOx), by using the F0AM-MCM model (Niu et al., 2024; Mozaffar et al., 2021). Initially, the average daytime concentrations of NOx and VOCs are used as baseline. Subsequently, VOCs and NOx are varied at 10 % intervals, respectively, and a total of 441 analysis scenarios were constructed. Subsequently, VOCs and NOx are varied from −60 % to 90 % at 10 % intervals, respectively, to construct the scenario matrix.
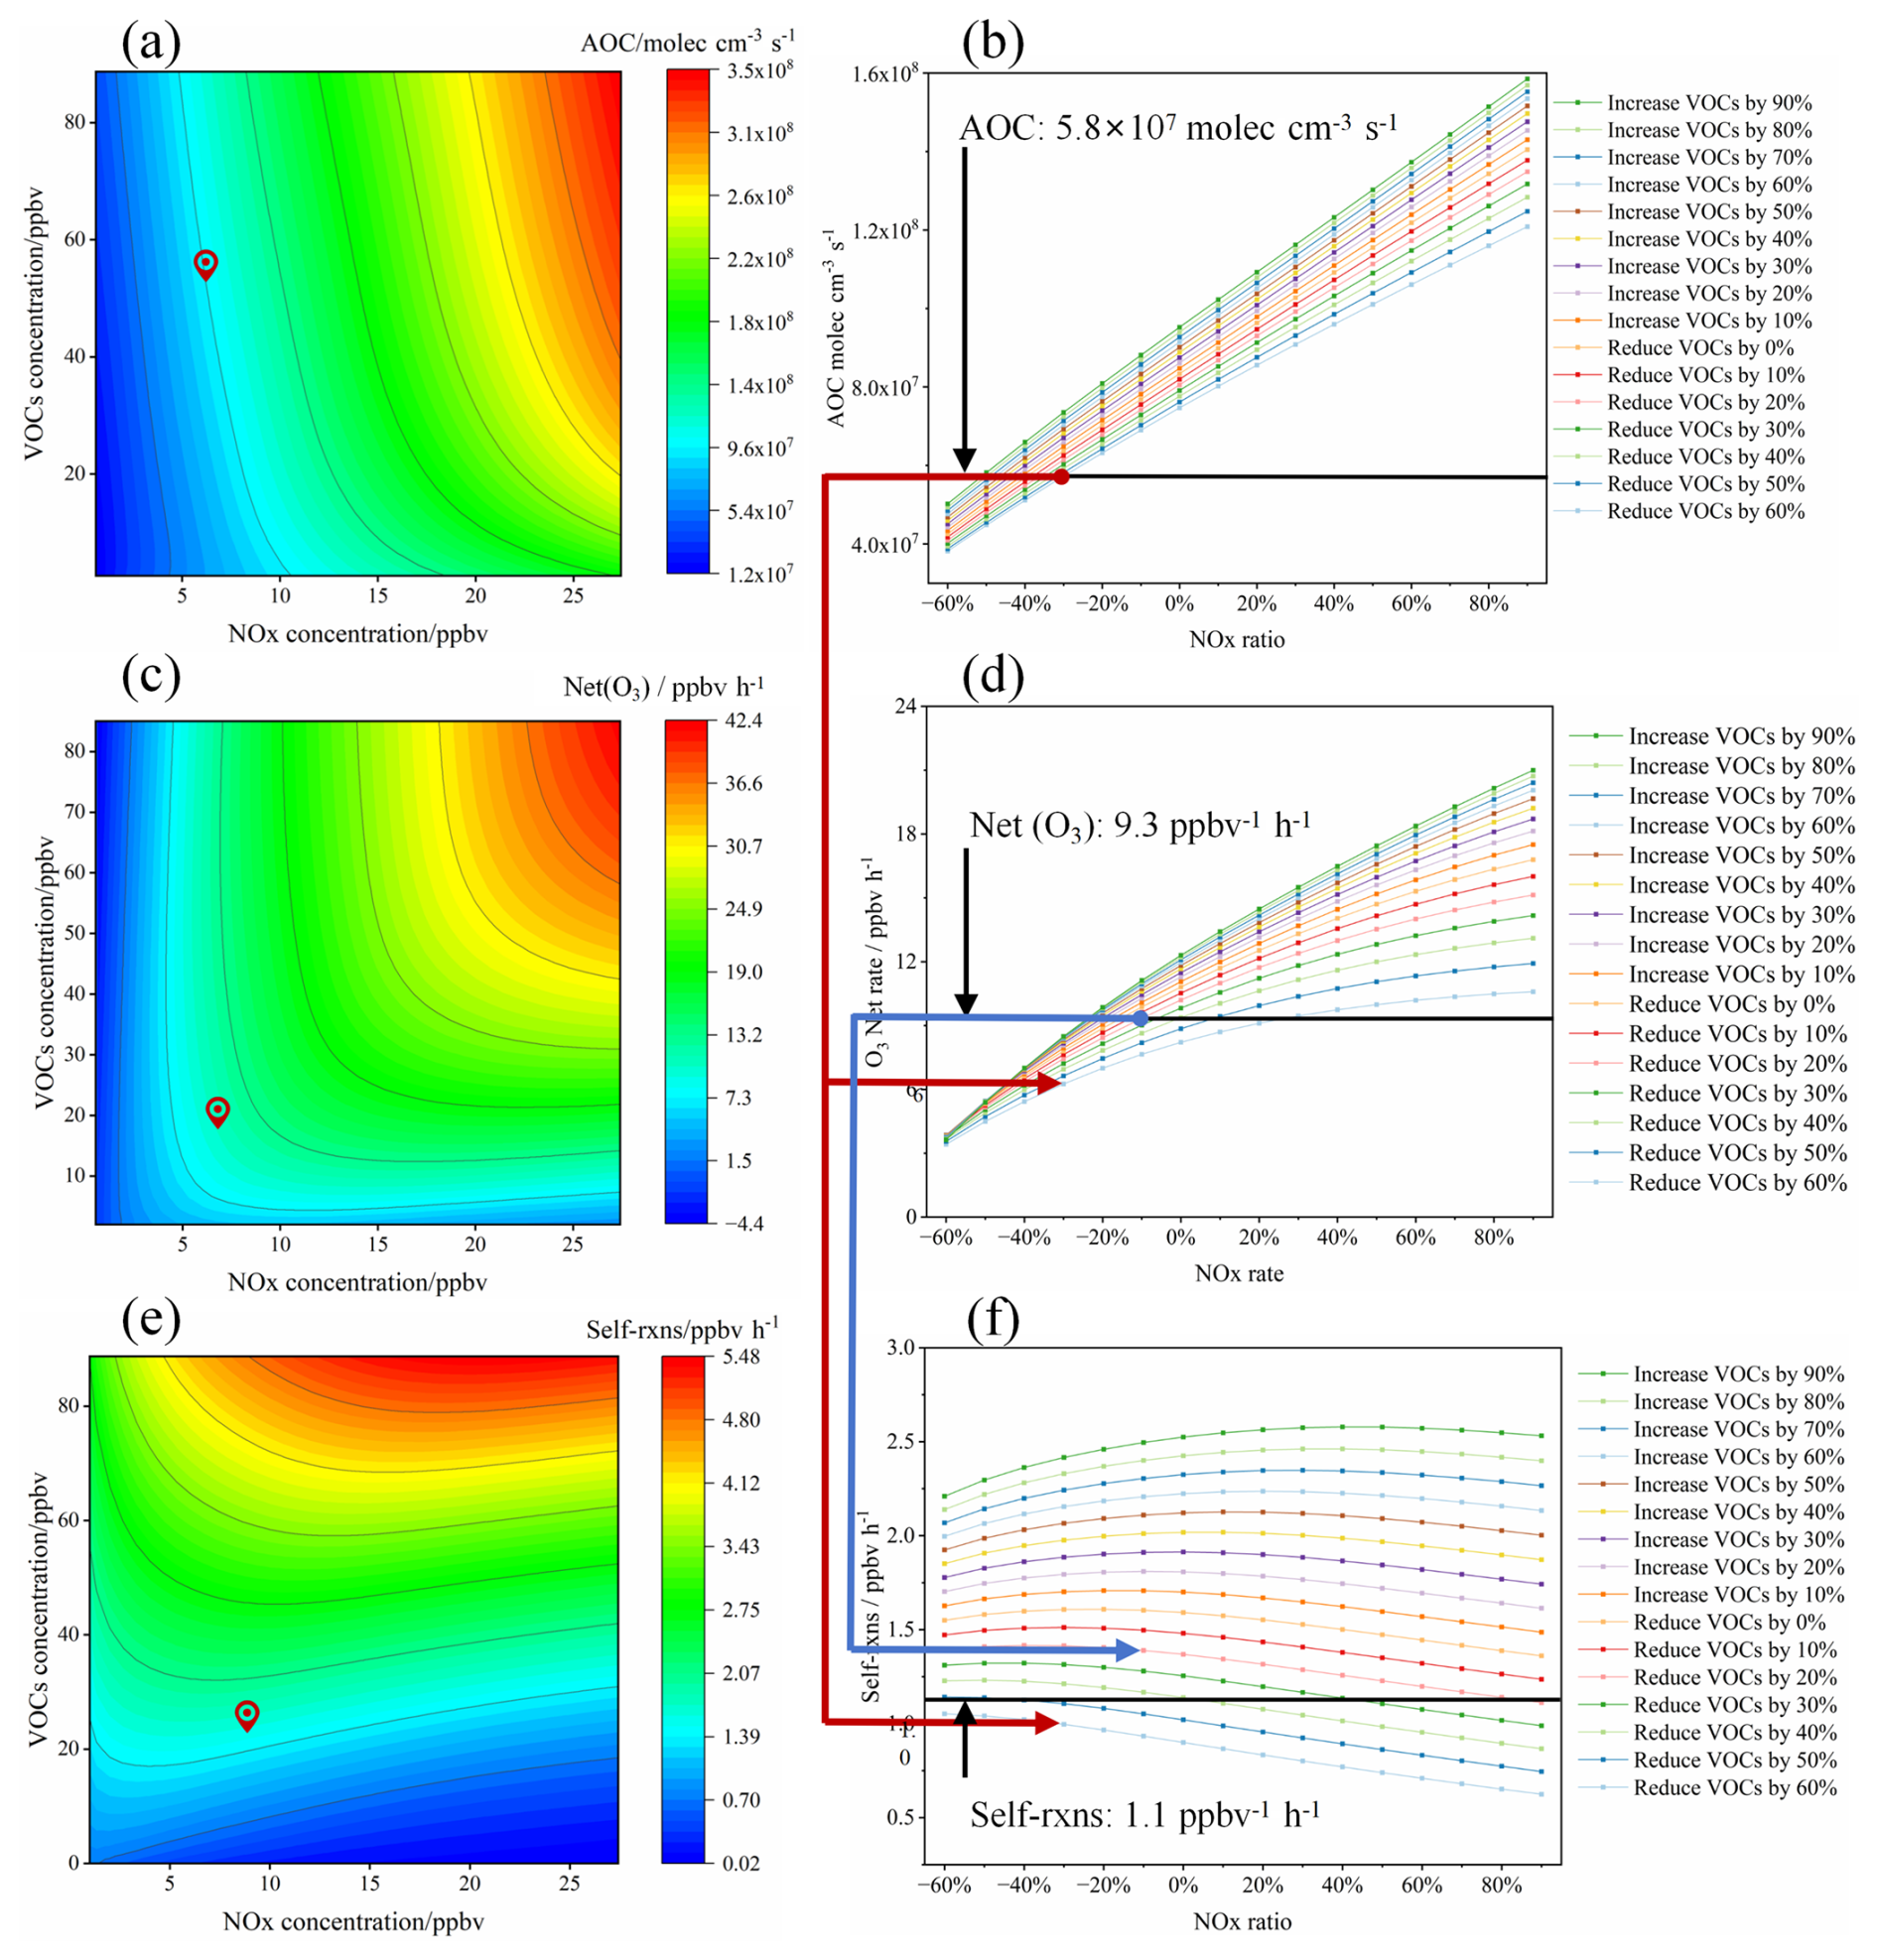
Figure 9Response of AOC, Net(O3) and self-reaction to different VOCs and NOx reduction percentages derived from the empirical kinetic modeling approach. Red dots from (a), (c), and (e) represent the baseline scenario (average levels without precursor pollutant controls during the study period). Black lines from (b), (d), and (f) indicate target levels to be achieved by precursor control schemes (average during cleaning periods). Red arrows show the effects of the AOC reduction scheme on achieving O3 and SOA targets. Blue arrows show the effects of the O3 reduction scheme on achieving the SOA target.
As shown in Fig. 9, the isopleth analysis indicates that reductions in both VOCs and NOx lead to a decrease in the AOC, net O3 production rate (Net O3), and self-reaction in the studied city. Notably, NOx reduction has a more pronounced effect on the decrease in AOC. This may be associated with the high contributions of OH• + VOCs and O3 + NO2 in the specific reaction of AOC in the case (as shown in Sect. 3.2.1). Firstly, OH• + VOCs generates substantial RO2• radicals, and NO acts as a catalyst to accelerate the regeneration of OH• radicals from RO2• in the ROx• cycle, while AOC is largely determined by OH• radicals. Secondly, NO2 directly promotes the O3 + NO2 reaction. We established the reduction targets based on the average levels during the cleaning period for AOC (5.8×10⁷ molec. cm−3 s−1), Net (O3) (9.3 ppbv h−1), and self-reaction (1.1 ppbv h−1), respectively. To achieve the AOC target, the VOCs reduction of at least 60 % was required if NOx emissions were unchanged, whereas the 40 % NOx reduction was necessary if VOCs emissions remain constant. However, achieving independent reductions is challenging due to the similarities in the sources of VOCs and NOx emission. Therefore, to meet the target for AOC, a simultaneous reduction of 60 % in VOCs and 30 % in NOx was required (Fig. 9b). Meanwhile, to meet the target for the Net (O3), a coordinated reduction of at least 20 % in VOCs and 10 % in NOx was needed (Fig. 9d). Previous research has shown that the co-reduction of VOCs and NOx is critical for controlling O3 pollution. Specifically, the reduction strategy targeting AOC results in a more pronounced decrease in the Net (O3), as indicated by the red arrow from point (b) to (d) in Fig. 9. In contrast, a reduction strategy designed solely for O3 was not sufficient to meet the reduction target for self-reaction, by the blue arrow from point (d) to (f) in Fig. 9. A notable complication is the observed negative correlation between self-reaction and NOx. This implies that a substantial reduction in NOx could counter-intuitively cause self-reaction to increase, which could be counterproductive for SOA control. Despite this, when we assess self-reaction using the AOC-based reduction scenario (at least 60 % for VOCs and 30 % for NOx), it fully satisfies the reduction target for self-reaction (as indicated by the red arrow from point (b) to (f) in Fig. 9). This result provides compelling evidence that a reduction strategy based on AOC enables the simultaneous mitigation of both O3 and SOA. Therefore, an AOC-centric approach offers a viable pathway for the synergistic control of secondary pollutants.
This study developed and applied the atmospheric oxidation capacity formation path tracing (AOCPT) approach, a framework for guiding secondary pollutant control. This method employs the developed radiation equivalent oxidation capacity (REOC) metric to systematically quantify VOCs driven OH• radical production, which indirectly enables the standardized quantification of key precursor species influencing AOC. The defined relative incremental atmospheric oxidation capacity (RIA) method directly quantifies the impact of emission sources on AOC. Furthermore, it further quantifies the contributions of different precursor species and emission sources to AOC, which using a refined AOC source analysis method. This AOCPT approach offers new insights for secondary pollution control from the perspective of AOC. It is primarily applicable to observation-based diagnoses of complex air pollution in urban environments. However, we acknowledge that the 0-D box model assumption simplifies physical transport. The assessment of SOA utilizes gas-phase self-rxns of low-volatility compounds rather than physical mass. Furthermore, uncertainties in this method mainly stem from measurement errors and variations in chemical kinetic constants.
A field application of this methodology revealed that OH related reactions were the dominant driver of AOC (56.9 %), and daytime contributions from O3 + NO2 and OH• + VOCs reactions being particularly prominent (48.5 %–56.1 %). This underscores the necessity of co-reducing both VOCs and NOx for effective AOC regulation. The REOC analysis identified trans-2-butene as a critical contributor to AOC (71.1 %). Consequently, further analysis pinpointed industrial processes (26.8 %) and diesel vehicle emissions (24.1 %) as the primary AOC sources, largely attributed to their emissions of trans-2-butene (accounting for 49.3 % and 20.6 % of total trans-2-butene, respectively). These findings provide direct, quantifiable evidence linking specific VOCs species and emission sources to the overall AOC, offering clear and actionable targets for regulatory action. Critically, conventional sensitivity analyses based on ozone (O3) and self-reaction were found to underestimate the contributions from industrial processes (by 28.7 % and 25.7 %, respectively) and diesel vehicles (by 48.5 % and 13.4 %, respectively) compared to our AOC-based assessment. This discrepancy can introduce substantial bias into policymaking. Furthermore, our scenario analysis reveals that O3-targeted abatement can inadvertently increase secondary organic aerosols (SOA) levels, leading to a skewed mitigation outcome akin to “survivor bias”. In contrast, an AOC-centric strategy achieves significant and simultaneous reductions in both O3 and SOA. This provides definitive evidence that compared to traditional treatment of single secondary pollutants, pollution abatement strategy based on AOC regulation can achieve refined co-mitigation of secondary pollutants. Therefore, the AOC-based approach for secondary pollution control serves not merely an alternative but also enhances the comprehensiveness and effectiveness of control strategies to some extent.
As China confronts a plateau in air quality improvement, where significant reductions in primary pollutants have not yielded proportional decreases in secondary pollution, a new strategy is urgently needed. This study argues that breaking the current bottleneck requires a fundamental shift in perspective. This paradigm shift, from pollutant-specific control to regulating the atmosphere's overall oxidative capacity, represents a pivotal step forward, offering a scientifically robust path to overcome the current impasse and achieve sustainable, long-term air quality goals.
The code and datasets used in this study are available from the corresponding authors upon request.
The supplement related to this article is available online at https://doi.org/10.5194/acp-26-3195-2026-supplement.
YK: Writing – original draft, Methodology, Investigation, Data curation. YY: Writing – review & editing, Validation, Supervision, Project administration, Methodology, Conceptualization. YN: Validation, Supervision, Investigation, Data curation. CY: Data curation, Project administration, Conceptualization. JD, YZ and DW: Investigation, Data curation. JL and ZL: Validation, Methodology. LP: Validation, Supervision, Project administration, Conceptualization.
The contact author has declared that none of the authors has any competing interests.
Publisher's note: Copernicus Publications remains neutral with regard to jurisdictional claims made in the text, published maps, institutional affiliations, or any other geographical representation in this paper. The authors bear the ultimate responsibility for providing appropriate place names. Views expressed in the text are those of the authors and do not necessarily reflect the views of the publisher.
This research has been supported by the National Natural Science Foundation of China (grant nos. 42330606, 42422508, 42273058, 22106044), the Fundamental Research Funds for Central Universities (grant nos. 2024XKRC058, 2024JBZY016), and the Shanxi Provincial Basic Research Program (Free Exploration Category) Youth scientific research project (grant no. 2023030212370).
This paper was edited by Frank Keutsch and reviewed by two anonymous referees.
Chapleski, R. C., Zhang, Y., Troya, D., and Morris, J. R.: Heterogeneous chemistry and reaction dynamics of the atmospheric oxidants, O3, NO3, and OH, on organic surfaces, Chem. Soc. Rev., 45, 3731–3746, https://doi.org/10.1039/C5CS00375J, 2016.
Chen, Q., Miao, R. Q., Geng, G. N., Shrivastava, M., Dao, X., Xu, B. Y., Sun, J. Q., Zhang, X., Liu, M. Y., Tang, G. G., Tang, Q., Hu, H. W., Huang, R. J., Wang, H., Zheng, Y., Qin, Y., Guo, S., Hu, M., and Zhu, T.: Widespread 2013–2020 decreases and reduction challenges of organic aerosol in China, Nat. Commun., 15, 8, https://doi.org/10.1038/s41467-024-48902-0, 2024.
Chen, T., Zhang, P., Chu, B., Ma, Q., Ge, Y., Liu, J., and He, H.: Secondary organic aerosol formation from mixed volatile organic compounds: Effect of RO2 chemistry and precursor concentration, npj Clim. Atmos. Sci., 5, 95, https://doi.org/10.1038/s41612-022-00321-y, 2022.
CZMBS – Changzhi Municipal Bureau of Statistics: Statistical Communiqué of Changzhi City on National Economic and Social Development in 2024, https://www.changzhi.gov.cn/ (last access: 5 March 2025), 2024.
Ding, D., Xing, J., Wang, S. X., Dong, Z. X., Zhang, F. F., Liu, S. C., and Hao, J. M.: Optimization of a NOx and VOC Cooperative Control Strategy Based on Clean Air Benefits, Environ. Sci. Technol., 56, 739–749, https://doi.org/10.1021/acs.est.1c04201, 2022.
Dong, Z., Li, X., Kong, Z. H., Wang, L. L., and Zhang, R. Q.: Comparison and implications of the carbonaceous fractions under different environments in polluted central plains in China: Insight from the lockdown of COVID-19 outbreak, Environ. Pollut., 330, 11, https://doi.org/10.1016/j.envpol.2023.121736, 2023.
George, M., Andrés Hernández, M. D., Nenakhov, V., Liu, Y., Burrows, J. P., Bohn, B., Förster, E., Obersteiner, F., Zahn, A., Harlaß, T., Ziereis, H., Schlager, H., Schreiner, B., Kluge, F., Bigge, K., and Pfeilsticker, K.: Airborne observations of peroxy radicals during the EMeRGe campaign in Europe, Atmos. Chem. Phys., 23, 7799–7822, https://doi.org/10.5194/acp-23-7799-2023, 2023.
Goldstein, A. H. and Galbally, I. E.: Known and Unexplored Organic Constituents in the Earth's Atmosphere, Environ. Sci. Technol., 41, 1514–1521, https://doi.org/10.1021/es072476p, 2007.
Guo, W., Yang, Y., Chen, Q., Zhu, Y., Zhang, Y., Zhang, Y., Liu, Y., Li, G., Sun, W., and She, J.: Chemical reactivity of volatile organic compounds and their effects on ozone formation in a petrochemical industrial area of Lanzhou, Western China, Sci. Total Environ., 839, 155901, https://doi.org/10.1016/j.scitotenv.2022.155901, 2022.
He, Z., Wang, X., Ling, Z., Zhao, J., Guo, H., Shao, M., and Wang, Z.: Contributions of different anthropogenic volatile organic compound sources to ozone formation at a receptor site in the Pearl River Delta region and its policy implications, Atmos. Chem. Phys., 19, 8801–8816, https://doi.org/10.5194/acp-19-8801-2019, 2019.
Hu, J., Wang, P., Ying, Q., Zhang, H., Chen, J., Ge, X., Li, X., Jiang, J., Wang, S., Zhang, J., Zhao, Y., and Zhang, Y.: Modeling biogenic and anthropogenic secondary organic aerosol in China, Atmos. Chem. Phys., 17, 77–92, https://doi.org/10.5194/acp-17-77-2017, 2017.
Huang, R.-J., Zhang, Y., Bozzetti, C., Ho, K.-F., Cao, J.-J., Han, Y., Daellenbach, K. R., Slowik, J. G., Platt, S. M., Canonaco, F., Zotter, P., Wolf, R., Pieber, S. M., Bruns, E. A., Crippa, M., Ciarelli, G., Piazzalunga, A., Schwikowski, M., Abbaszade, G., Schnelle-Kreis, J., Zimmermann, R., An, Z., Szidat, S., Baltensperger, U., Haddad, I. E., and Prévôt, A. S. H.: High secondary aerosol contribution to particulate pollution during haze events in China, Nature, 514, 218–222, https://doi.org/10.1038/nature13774, 2014.
Jenkin, M. E., Young, J. C., and Rickard, A. R.: The MCM v3.3.1 degradation scheme for isoprene, Atmos. Chem. Phys., 15, 11433–11459, https://doi.org/10.5194/acp-15-11433-2015, 2015.
Jia, C. H., Tong, S. R., Zhang, X. R., Li, F. J., Zhang, W. Q., Li, W. R., Wang, Z., Zhang, G., Tang, G. Q., Liu, Z. R., and Ge, M. F.: Atmospheric oxidizing capacity in autumn Beijing: Analysis of the O3 and PM2.5 episodes based on observation-based model, J. Environ. Sci., 124, 557–569, https://doi.org/10.1016/j.jes.2021.11.020, 2023.
Le, T., Wang, Y., Liu, L., Yang, J., Yung, Y. L., Li, G., and Seinfeld, J. H.: Unexpected air pollution with marked emission reductions during the COVID-19 outbreak in China, Science, 369, 702–706, https://doi.org/10.1126/science.abb7431, 2020.
Li, J., Lian, C., Liu, M., Zhang, H., Yan, Y., Song, Y., Chen, C., Wang, J., Zhang, H., Ren, Y., Guo, Y., Wang, W., Xu, Y., Li, H., Gao, J., and Ge, M.: Characterization of nitrous acid and its potential effects on secondary pollution in the warm season in Beijing urban areas, Atmos. Chem. Phys., 25, 2551–2568, https://doi.org/10.5194/acp-25-2551-2025, 2025.
Liang, W. Q., Yu, H. F., Xu, H., Wang, Z. Y., Li, T. T., Feng, Y. C., Russell, A., and Shi, G. L.: Probing Into Ozone Production Through Photochemistry of Organic Peroxyl Radicals: Implications for Source Control, J. Geophys. Res.-Atmos., 129, 13, https://doi.org/10.1029/2023jd040124, 2024.
Liu, T., Hong, Y., Li, M., Xu, L., Chen, J., Bian, Y., Yang, C., Dan, Y., Zhang, Y., Xue, L., Zhao, M., Huang, Z., and Wang, H.: Atmospheric oxidation capacity and ozone pollution mechanism in a coastal city of southeastern China: analysis of a typical photochemical episode by an observation-based model, Atmos. Chem. Phys., 22, 2173–2190, https://doi.org/10.5194/acp-22-2173-2022, 2022.
Liu, Y., Wang, K., Shi, X., Chen, L., and Li, H.: Analysis of microplastic sources in Wuliangsuhai Lake, China: Implications to microplastic deposition in cold, arid region lakes, J. Hazard. Mater., 492, 138135, https://doi.org/10.1016/j.jhazmat.2025.138135, 2025.
Liu, Z., Wang, Y., Hu, B., Lu, K., Tang, G., Ji, D., Yang, X., Gao, W., Xie, Y., Liu, J., Yao, D., Yang, Y., and Zhang, Y.: Elucidating the quantitative characterization of atmospheric oxidation capacity in Beijing, China, Sci. Total Environ., 771, 145306, https://doi.org/10.1016/j.scitotenv.2021.145306, 2021.
Lyu, X., Guo, H., Zou, Q. L., Li, K., Xiong, E. Y., Zhou, B. N., Guo, P. W., Jiang, F., and Tian, X. D.: Evidence for Reducing Volatile Organic Compounds to Improve Air Quality from Concurrent Observations and In Situ Simulations at 10 Stations in Eastern China, Environ. Sci. Technol., 9, https://doi.org/10.1021/acs.est.2c04340, 2022.
MEP – Ministry of Ecology and Environment of the People's Republic of China: National ambient air quality status in December and January–December 2023, https://www.mee.gov.cn/ywdt/xwfb/202401/t20240125_1064784.shtml (last access: 5 March 2025), 2024.
Miao, R., Chen, Q., Shrivastava, M., Chen, Y., Zhang, L., Hu, J., Zheng, Y., and Liao, K.: Process-based and observation-constrained SOA simulations in China: the role of semivolatile and intermediate-volatility organic compounds and OH levels, Atmos. Chem. Phys., 21, 16183–16201, https://doi.org/10.5194/acp-21-16183-2021, 2021.
Mochida, M., Matsunaga, S., and Kawamura, K.: A model evaluation of the NO titration technique to remove atmospheric oxidants for the determination of atmospheric organic compounds, Environ. Sci. Technol., 37, 1589–1597, https://doi.org/10.1021/es0258778, 2003.
Mozaffar, A., Zhang, Y. L., Lin, Y. C., Xie, F., Fan, M. Y., and Cao, F.: Measurement report: High contributions of halocarbon and aromatic compounds to atmospheric volatile organic compounds in an industrial area, Atmos. Chem. Phys., 21, 18087–18099, https://doi.org/10.5194/acp-21-18087-2021, 2021.
Nault, B. A., Travis, K. R., Crawford, J. H., Blake, D. R., Campuzano-Jost, P., Cohen, R. C., DiGangi, J. P., Diskin, G. S., Hall, S. R., Huey, L. G., Jimenez, J. L., Min, K. E., Lee, Y. R., Simpson, I. J., Ullmann, K., and Wisthaler, A.: Using observed urban NOx sinks to constrain VOC reactivity and the ozone and radical budget in the Seoul Metropolitan Area, Atmos. Chem. Phys., 24, 9573–9595, https://doi.org/10.5194/acp-24-9573-2024, 2024.
Niu, Y. Y., Yan, Y. L., Dong, J. Q., Yue, K., Duan, X. L., Hu, D. M., Li, J. J., and Peng, L.: Evidence for sustainably reducing secondary pollutants in a typical industrial city in China: Co-benefit from controlling sources with high reduction potential beyond industrial process, J. Hazard. Mater., 478, 10, https://doi.org/10.1016/j.jhazmat.2024.135556, 2024.
Slater, E. J., Whalley, L. K., Woodward-Massey, R., Ye, C., Lee, J. D., Squires, F., Hopkins, J. R., Dunmore, R. E., Shaw, M., Hamilton, J. F., Lewis, A. C., Crilley, L. R., Kramer, L., Bloss, W., Vu, T., Sun, Y., Xu, W., Yue, S., Ren, L., Acton, W. J. F., Hewitt, C. N., Wang, X., Fu, P., and Heard, D. E.: Elevated levels of OH observed in haze events during wintertime in central Beijing, Atmos. Chem. Phys., 20, 14847–14871, https://doi.org/10.5194/acp-20-14847-2020, 2020.
Tadic, I., Nussbaumer, C. M., Bohn, B., Harder, H., Marno, D., Martinez, M., Obersteiner, F., Parchatka, U., Pozzer, A., Rohloff, R., Zöger, M., Lelieveld, J., and Fischer, H.: Central role of nitric oxide in ozone production in the upper tropical troposphere over the Atlantic Ocean and western Africa, Atmos. Chem. Phys., 21, 8195–8211, https://doi.org/10.5194/acp-21-8195-2021, 2021.
Tang, J., Valolahti, H., Kivimäenpää, M., Michelsen, A., and Rinnan, R.: Acclimation of Biogenic Volatile Organic Compound Emission From Subarctic Heath Under Long-Term Moderate Warming, J. Geophys. Res.-Biogeo., 123, 95–105, https://doi.org/10.1002/2017jg004139, 2018.
Tang, R., Lu, Q., Guo, S., Wang, H., Song, K., Yu, Y., Tan, R., Liu, K., Shen, R., Chen, S., Zeng, L., Jorga, S. D., Zhang, Z., Zhang, W., Shuai, S., and Robinson, A. L.: Measurement report: Distinct emissions and volatility distribution of intermediate-volatility organic compounds from on-road Chinese gasoline vehicles: implication of high secondary organic aerosol formation potential, Atmos. Chem. Phys., 21, 2569–2583, https://doi.org/10.5194/acp-21-2569-2021, 2021.
Wang, T., Xue, L., Brimblecombe, P., Lam, Y. F., Li, L., and Zhang, L.: Ozone pollution in China: A review of concentrations, meteorological influences, chemical precursors, and effects, Sci. Total Environ., 575, 1582–1596, https://doi.org/10.1016/j.scitotenv.2016.10.081, 2017.
Wang, W., Parrish, D. D., Wang, S., Bao, F., Ni, R., Li, X., Yang, S., Wang, H., Cheng, Y., and Su, H.: Long-term trend of ozone pollution in China during 2014–2020: distinct seasonal and spatial characteristics and ozone sensitivity, Atmos. Chem. Phys., 22, 8935–8949, https://doi.org/10.5194/acp-22-8935-2022, 2022a.
Wang, W. J., Li, X., Cheng, Y. F., Parrish, D. D., Ni, R. J., Tan, Z. F., Liu, Y., Lu, S. H., Wu, Y. S., Chen, S. Y., Lu, K. D., Hu, M., Zeng, L. M., Shao, M., Huang, C., Tian, X. D., Leung, K. M., Chen, L. F., Fan, M., Zhang, Q., Rohrer, F., Wahner, A., Pöschl, U., Su, H., and Zhang, Y. H.: Ozone pollution mitigation strategy informed by long-term trends of atmospheric oxidation capacity (Nov, 10.1038/s41561-023-01334-9, 2023), Nat. Geosci., 17, 172, https://doi.org/10.1038/s41561-023-01360-7, 2024.
Wang, Z. Y., Shi, Z. B., Wang, F., Liang, W. Q., Shi, G. L., Wang, W. C., Chen, D., Liang, D. N., Feng, Y. C., and Russell, A. G.: Implications for ozone control by understanding the survivor bias in observed ozone-volatile organic compounds system, Npj Clim. Atmos. Sci., 5, 9, https://doi.org/10.1038/s41612-022-00261-7, 2022b.
Wei, N., Zhao, W., Yao, Y., Wang, H., Liu, Z., Xu, X., Rahman, M., Zhang, C., Fittschen, C., and Zhang, W.: Peroxy radical chemistry during ozone photochemical pollution season at a suburban site in the boundary of Jiangsu–Anhui–Shandong–Henan region, China, Sci. Total Environ., 904, 166355, https://doi.org/10.1016/j.scitotenv.2023.166355, 2023.
Wolfe, G. M., Marvin, M. R., Roberts, S. J., Travis, K. R., and Liao, J.: The Framework for 0-D Atmospheric Modeling (F0AM) v3.1, Geosci. Model Dev., 9, 3309–3319, https://doi.org/10.5194/gmd-9-3309-2016, 2016.
Wu, R. R. and Xie, S. D.: Spatial Distribution of Ozone Formation in China Derived from Emissions of Speciated Volatile Organic Compounds, Environ. Sci. Technol., 51, 2574–2583, https://doi.org/10.1021/acs.est.6b03634, 2017.
Xue, L., Gu, R., Wang, T., Wang, X., Saunders, S., Blake, D., Louie, P. K. K., Luk, C. W. Y., Simpson, I., Xu, Z., Wang, Z., Gao, Y., Lee, S., Mellouki, A., and Wang, W.: Oxidative capacity and radical chemistry in the polluted atmosphere of Hong Kong and Pearl River Delta region: analysis of a severe photochemical smog episode, Atmos. Chem. Phys., 16, 9891–9903, https://doi.org/10.5194/acp-16-9891-2016, 2016.
Yang, J., Zeren, Y., Guo, H., Wang, Y., Lyu, X., Zhou, B., Gao, H., Yao, D., Wang, Z., Zhao, S., Li, J., and Zhang, G.: Wintertime ozone surges: The critical role of alkene ozonolysis, Environ. Sci. Ecotechnol., 22, 100477, https://doi.org/10.1016/j.ese.2024.100477, 2024.
Yang, Y., Wang, Y., Zhou, P., Yao, D., Ji, D., Sun, J., Wang, Y., Zhao, S., Huang, W., Yang, S., Chen, D., Gao, W., Liu, Z., Hu, B., Zhang, R., Zeng, L., Ge, M., Petäjä, T., Kerminen, V. M., Kulmala, M., and Wang, Y.: Atmospheric reactivity and oxidation capacity during summer at a suburban site between Beijing and Tianjin, Atmos. Chem. Phys., 20, 8181–8200, https://doi.org/10.5194/acp-20-8181-2020, 2020.
Yu, S., Wang, S., Xu, R., Zhang, D., Zhang, M., Su, F., Lu, X., Li, X., Zhang, R., and Wang, L.: Measurement report: Intra- and interannual variability and source apportionment of volatile organic compounds during 2018–2020 in Zhengzhou, central China, Atmos. Chem. Phys., 22, 14859–14878, https://doi.org/10.5194/acp-22-14859-2022, 2022.
Zhan, J., Ma, W., Song, B., Wang, Z., Bao, X., Xie, H.-B., Chu, B., He, H., Jiang, T., and Liu, Y.: The contribution of industrial emissions to ozone pollution: identified using ozone formation path tracing approach, Npj Clim. Atmos. Sci., 6, 37, https://doi.org/10.1038/s41612-023-00366-7, 2023.
Zhang, K., Huang, L., Li, Q., Huo, J., Duan, Y., Wang, Y., Yaluk, E., Wang, Y., Fu, Q., and Li, L.: Explicit modeling of isoprene chemical processing in polluted air masses in suburban areas of the Yangtze River Delta region: radical cycling and formation of ozone and formaldehyde, Atmos. Chem. Phys., 21, 5905–5917, https://doi.org/10.5194/acp-21-5905-2021, 2021.
Zhang, X. X., Osei, F., Stein, A., Cheng, C. X., and Maji, K. J.: Temporal and spatial evolution of short-term exposure to ozone pollution: Its health impacts in China based on a meta-analysis, J. Clean. Product., 373, 10, https://doi.org/10.1016/j.jclepro.2022.133938, 2022.
Zhao, D., Liu, G., Xin, J., Quan, J., Wang, Y., Wang, X., Dai, L., Gao, W., Tang, G., Hu, B., Ma, Y., Wu, X., Wang, L., Liu, Z., and Wu, F.: Haze pollution under a high atmospheric oxidization capacity in summer in Beijing: insights into formation mechanism of atmospheric physicochemical processes, Atmos. Chem. Phys., 20, 4575–4592, https://doi.org/10.5194/acp-20-4575-2020, 2020.
Zhu, J., Wang, S., Wang, H., Jing, S., Lou, S., Saiz-Lopez, A., and Zhou, B.: Observationally constrained modeling of atmospheric oxidation capacity and photochemical reactivity in Shanghai, China, Atmos. Chem. Phys., 20, 1217–1232, https://doi.org/10.5194/acp-20-1217-2020, 2020.