the Creative Commons Attribution 4.0 License.
the Creative Commons Attribution 4.0 License.
 | 26 Feb 2026
Surveying methane point-source super-emissions across oil and gas basins with MethaneSAT
Luis Guanter
Javier Roger
Jack Warren
Maryann Sargent
Zhan Zhang
Sébastien Roche
Christopher Chan Miller
Michael Steiner
Harvey Hadfield
Mark Omara
James Williams
Katlyn MacKay
Jonathan E. Franklin
Bingkun Luo
Steven C. Wofsy
Steven P. Hamburg
Ritesh Gautam
Methane emissions from the oil and gas (O&G) industry play a major role in the global methane budget. The MethaneSAT space-based mission, which operated between March 2024 and June 2025, was designed to provide high-quality data on O&G methane emissions, from regional fluxes to high-emitting point sources. This was enabled by MethaneSAT's measurements in the 1598–1683 nm window with a high spectral resolution (0.25 nm), medium spatial sampling (100×400 m2 at nadir), and wide-area coverage (about 200 km at nadir). In this work, we showcase the potential of MethaneSAT to survey high-emitting point sources across O&G basins. We first assess MethaneSAT's performance for the detection, quantification and attribution of methane plumes through the analysis of key observation-related parameters, including wind speed, surface albedo and spatial sampling. We estimate a minimum detection limit of about 500 kg h−1 for a bright surface and low wind conditions, and an average detection limit around 1300 kg h−1 corresponding to an ensemble of sites with different observation conditions. We analyzed selected MethaneSAT datasets from the main O&G methane hotspots in the world. We observe particularly strong and persistent sources in the Turkmenistan's South Caspian basin and in the Midland sub-basin of the US Permian Basin, and reveal major super-emissions in Maturin (Venezuela) and Zagros Foldbelt and Widyan (Iran), and the Appalachian basin. We also present other examples of strong methane sources at high latitudes (West Siberia), in offshore platforms in the Gulf of Mexico, and from the waste sector. Our results illustrate the potential of MethaneSAT data to map methane emissions from hotspot regions and super-emitters around the planet.
- Article
(23152 KB) - Full-text XML
-
Supplement
(293 KB) - BibTeX
- EndNote


Methane (CH4) is a short-lived but powerful greenhouse gas, responsible for approximately a third of the global warming observed since preindustrial times (IPCC, 2021). The oil and gas (O&G) sector is a major contributor to anthropogenic methane emissions globally (Saunois et al., 2025). A substantial share of O&G methane emissions are caused by high-emitting point sources, also known as super-emitters, commonly due to leaks, venting, and incomplete combustion at flares (Zavala-Araiza et al., 2017). These emissions are very often preventable. The O&G sector represents therefore a cost-effective and immediate target for emission reduction.
Satellite remote sensing has rapidly expanded our ability to operationally detect and quantify methane super-emitters around the globe. For example, the International Methane Emissions Observatory (IMEO) is compiling a satellite-based publicly-available database of methane plumes and local enhancements, which has become an important asset in our understanding of global point-source methane emissions (UNEP-IMEO, 2023). Despite these advances, however, current methane-sensitive satellite systems trade off between detection sensitivity, spatial resolution, and regional coverage, compromising their ability to simultaneously assess both high-emitting point sources and diffuse emissions at basin scale (Jacob et al., 2022).
The Sentinel-5P/TROPOMI mission offers global daily revisit at the expense of a relatively coarse spatial resolution of 7×5.5 km2. TROPOMI is being used for the estimation of total regional fluxes through the inversion of atmospheric transport models (e.g. Zhang et al., 2020; Varon et al., 2023). TROPOMI has also potential for the systematic detection and monitoring of very large point sources (Lauvaux et al., 2022; Schuit et al., 2023) as well as to identify regions with persistently-enhanced methane concentrations (Vanselow et al., 2024). However, the detection and attribution of single plumes with TROPOMI is limited by the mission's relatively coarse spatial sampling.
An increasing number of high-resolution satellite instruments are being used for the detection and quantification of single point sources (Jacob et al., 2022). These instruments, also known as point-source imagers, include imaging spectrometers such as GHGSat, PRISMA, EnMAP, EMIT, and Carbon Mapper's Tanager-1 (Varon et al., 2020; Guanter et al., 2021; Roger et al., 2024b; Thorpe et al., 2023; Duren et al., 2025) as well as multispectral missions such as Sentinel-2 and Landsat (Varon et al., 2021; Gorroño et al., 2023; Vaughan et al., 2024). These missions have enabled large-scale surveys of methane point sources across different O&G basins, including the Permian-Delaware sub-basin (Irakulis-Loitxate et al., 2021) and Turkmenistan's West coast (Irakulis-Loitxate et al., 2022b), which are arguably two of the regions with the highest concentration of high-emitting point sources around the world. Conversely, these methane-sensitive high-resolution missions have low or no sensitivity to the diffuse component of the emissions and the overall background methane gradients. Also, they have a limited spatial coverage, either by design (the case of imaging spectrometers), or by the fact that the plume detection process can in general only be applied over pre-selected areas or sources (multispectral instruments) (Vaughan et al., 2024). This causes that multiple overpasses of these missions, sometimes over long time periods, are needed to characterize the emissions from an entire region, where only individual plumes are sampled.
MethaneSAT, a satellite mission developed by the Environmental Defense Fund and international partners, was designed to fill the gap in spatial coverage and sensitivity that we find in the current landscape of methane-sensitive missions. MethaneSAT’s ability to monitor 200 km swaths at medium spatial resolution and with a high spectral sensitivity allows to link individual sources to broader regional trends in methane concentration gradients, thereby enhancing the monitoring of sectoral emissions and informing mitigation efforts. It also enables the identification of super-emitting regions, not just isolated point sources, within entire oil & gas basins.
In this work, we first evaluate the potential and limitations of MethaneSAT for the detection and quantification of methane plumes from point sources. Second, we exploit the existing archive of MethaneSAT observations over O&G basins between May 2024 and June 2025 to investigate methane super-emissions across methane emission hotspots around the world.
2.1 The MethaneSAT mission and its data products
The MethaneSAT mission was designed to generate high-quality data on methane emissions around the world, with a focus on the O&G and agricultural sectors. It was launched on 4 March 2024, and stopped its operation on 20 June 2025 after contact with the satellite was lost. MethaneSAT consisted in a dual spectrometer system measuring in the 1249–1305 and 1598–1683 nm spectral windows with a spectral resolution of 0.25 nm and a spectral sampling of 0.08 nm. During observations from nadir, a 200 km swath was covered by 2048×560 pixels, with a rectangular pixel size of 100 m (across-track) and 400 m (along-track) (Environmental Defense Fund, 2021).
This instrument configuration enables the generation of accurate methane concentration maps (namely, dry column methane mixing ratio, XCH4) from spectral radiance data cubes, which are MethaneSAT's Level-1 (L1) data product (Conway et al., 2024). The CO2-proxy XCH4 retrieval, described in Chan Miller et al. (2024), is used to generate XCH4 maps at the native sensor coordinates (L2 product). The L2 product is converted in a L3 product (data in map coordinates) after oversampling on a regular latitude/longitude grid, following the approach by Sun et al. (2018). XCH4 maps are subsequently converted into a L4 methane emission data product, which is split into total regional emission data (spatially-distributed emission rates across the >200 km area at a 4 km sampling) and point source emissions (emission rates and coordinates of the methane plumes detected from each acquisition). The latter is referred to as L4-plume product hereinafter in this work.
Plumes are detected and masked through automatic data processing methods. The first version of these methods relied on methane concentration thresholds to detect and segment the plumes, but more sophisticated methods consisting in data denoising and different criteria for plume detection and masking (including concentration, plume shape and wind direction) were implemented later (Zhang et al., 2026). The plumes detected by this automated processing are quality-controlled by a human before becoming public. Point-source emission rates are estimated from the detected plumes using an evolution of the methods described in Chulakadabba et al. (2023) for MethaneAIR, which is MethaneSAT's airborne precursor. These methods rely on mass-balance models. In particular, the DI-growing box method used for the quantification of MethaneSAT plumes applies Gauss’ divergence theorem to estimate methane emissions by integrating methane flux divergence within expanding boxes that enclose the plume, eliminating the need to define inflow concentrations. By averaging methane gradients with wind vectors around the plume, it is well suited for larger or clustered sources but less sensitive to small point emitters. This method has been validated for MethaneAIR by controlled release experiments (El Abbadi et al., 2024).
An example of a XCH4 map from a MethaneSAT L2 XCH4 product and the corresponding L4-plume dataset are represented in Fig. 1. A subset of a TROPOMI XCH4 map from a dataset acquired within 70 min of the MethaneSAT acquisition is also represented in order to contextualize the different spatial sampling of the two missions. The details of this MethaneSAT collection will be further discussed in Sect. 3.1.1.
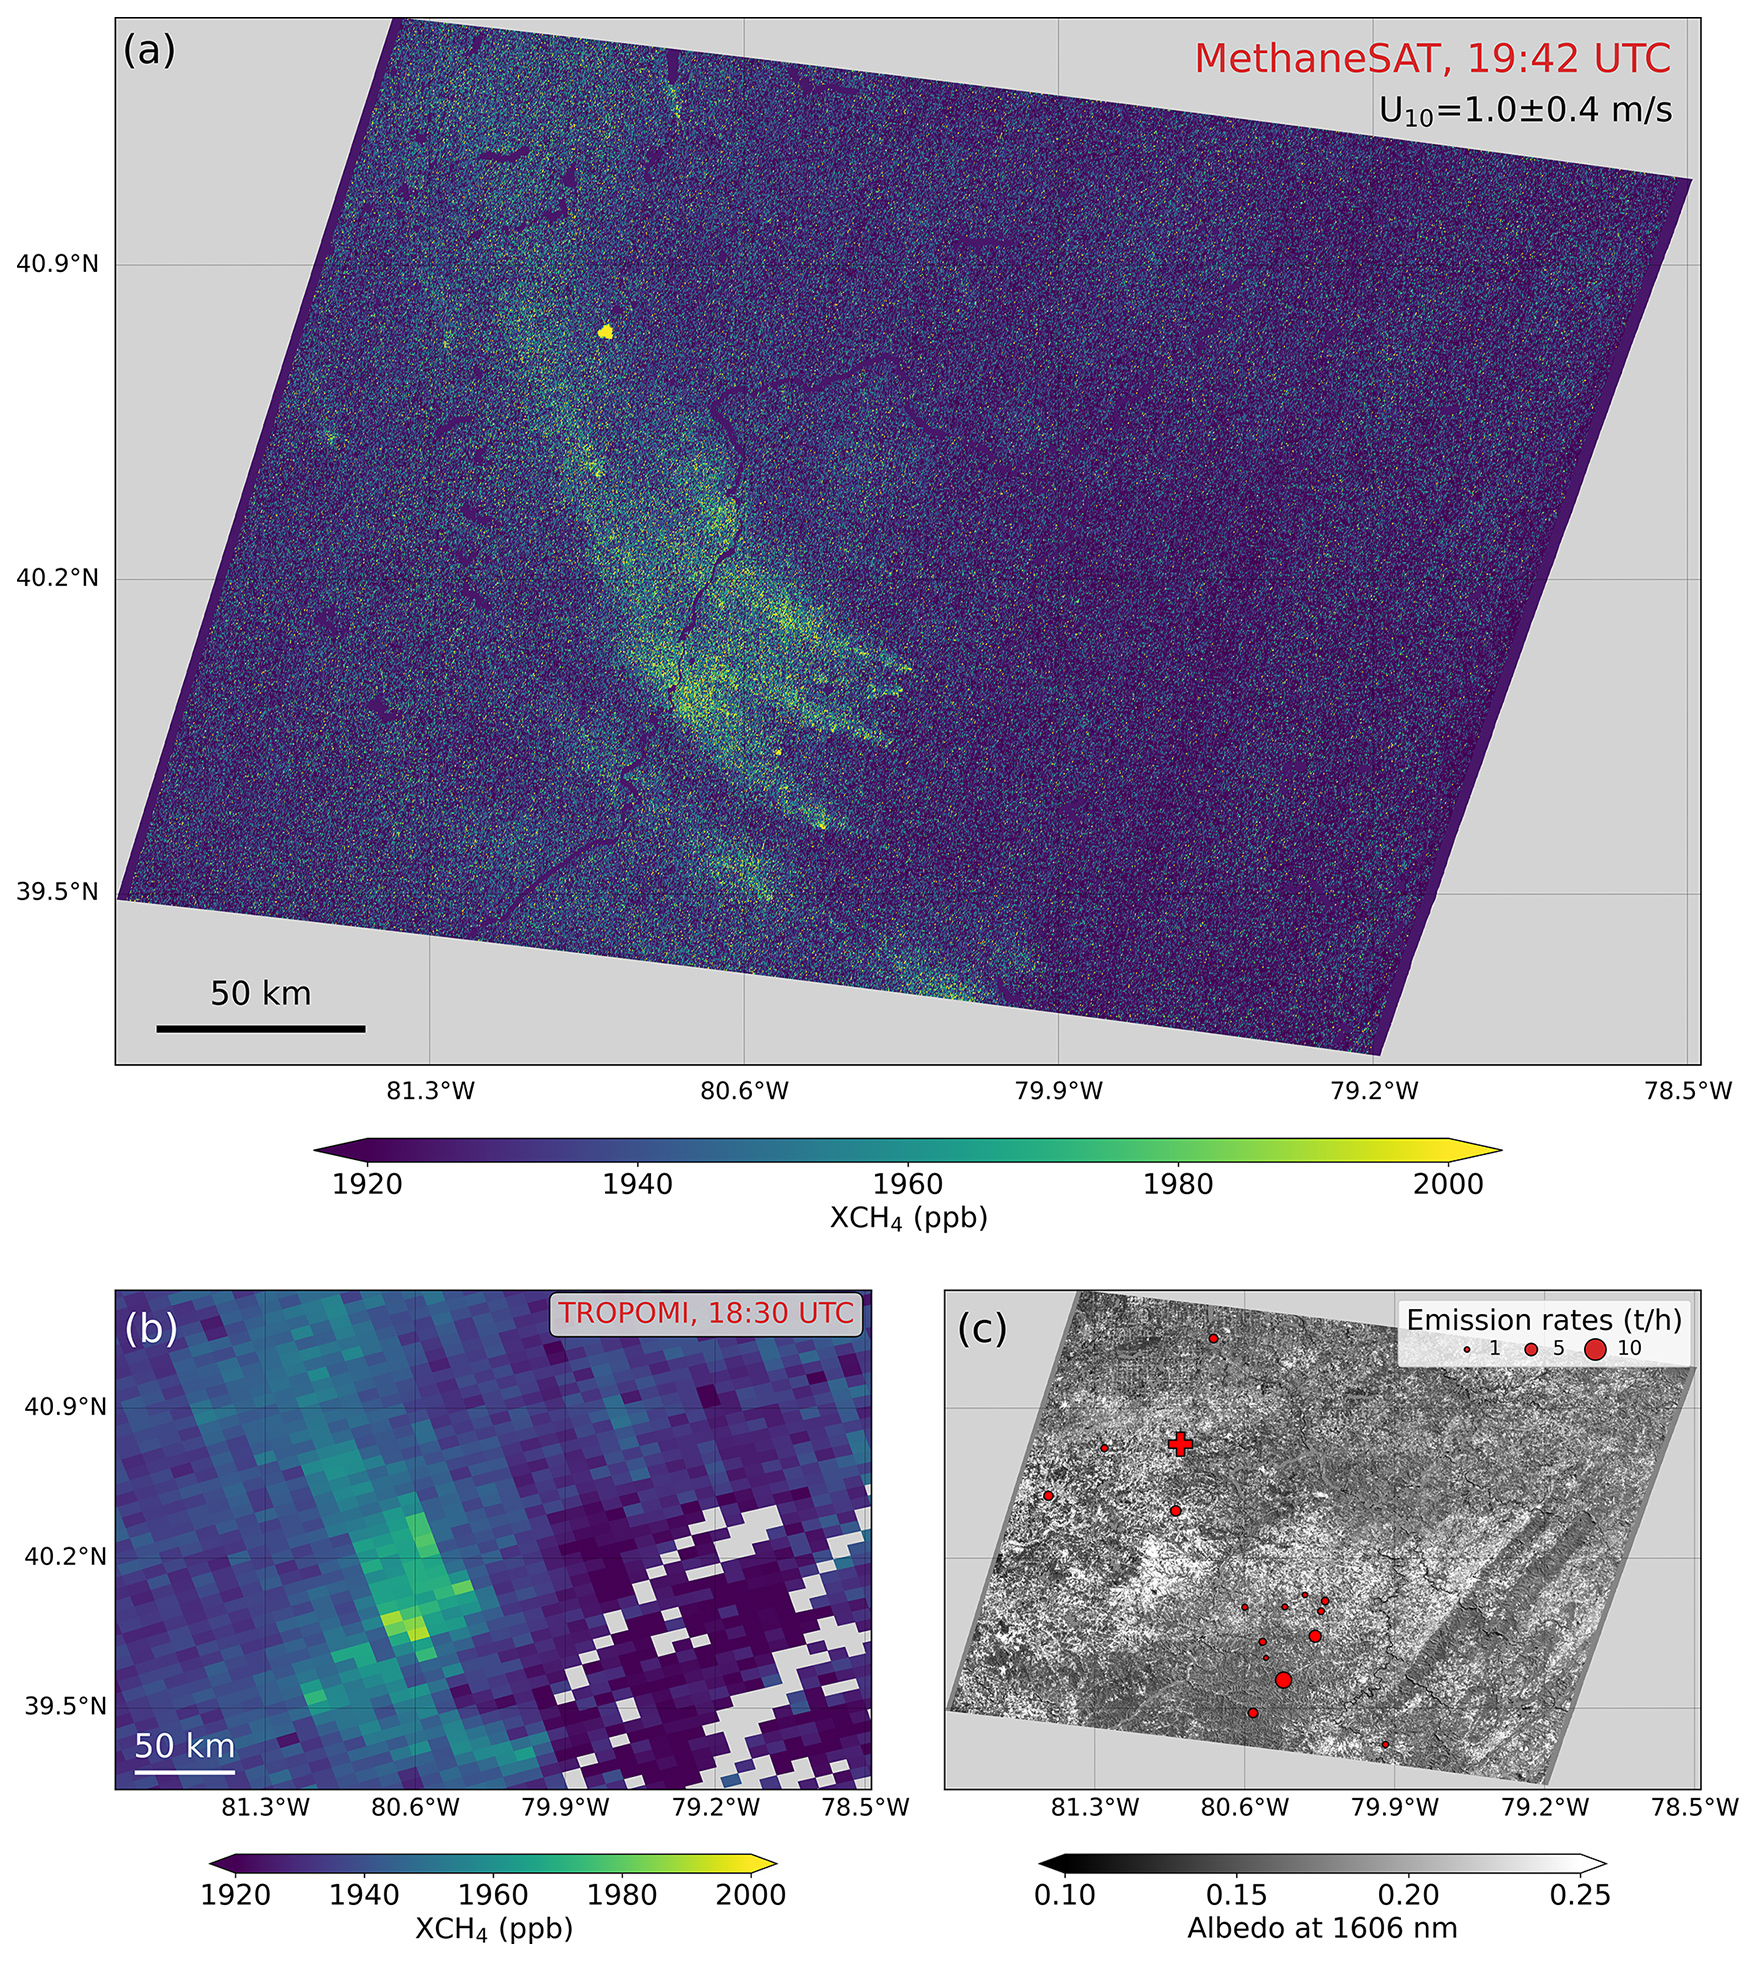
Figure 1Maps of methane concentration (namely, dry column methane mixing ratio, XCH4) obtained from (a) MethaneSAT and (b) TROPOMI overpasses over the Appalachian basin (USA) on 5 September 2024. The same color scale is used for both maps. The two acquisitions happened within a time difference of about 70 min. The 1606 nm albedo map from the MethaneSAT acquisition is displayed in (c). It also shows the location and emission rates of the plumes included in the MethaneSAT level-4 plume product for this acquisition. The red cross in (c) depicts a short-lived emission with a flux rate higher than 100 t h−1.
2.2 Evaluation of the main factors influencing the detection of methane plumes with MethaneSAT
We have evaluated the impact on plume detection of different observation-related factors, including surface albedo, XCH4 variance, pixel size, and wind speed. We combine these factors into the mass-balance model proposed by Jacob et al. (2016), which has also been used in other studies (MacLean et al., 2024; Duren et al., 2025). This model expresses the minimum detection limit (Qmin) as
where Ma=0.029 kg mol−1 and kg mol−1 are the molecular weights of dry air and methane, p is the dry atmospheric surface pressure, g is the acceleration of gravity, U is the wind speed, W is the pixel size and q is the number of standard deviations above the noise level required to reliably assign a methane enhancement to a pixel. Jacob et al. (2016) suggested to take q=2 for plume detection. We have added the np factor to the original model to represent the number of pixels q times above the noise level that would be needed for the plume to be detected. We choose np=3, i.e. we need to have three pixels with detectable enhancements for the whole plume to be detected. We acknowledge that the q and np parameters in this model are arbitrarily selected, and also that the np factor is a simplistic representation of the plume detection process (e.g. a factor modeling the connectivity of several pixels would be more realistic). For this reason, we do not interpret Qmin as an absolute measure of the minimum detectable emission rate, but only use it for comparative analysis. This comprises the investigation of the relative impact of the different variables driving the plume detection process, and the comparison of the plume detection potential of different MethaneSAT L2 datasets.
2.3 Analysis of MethaneSAT's plume detection limits
The concept of probability of detection (POD) function has been introduced to model the probability of plume detection with a given instrument as a function of observation-related variables, such as retrieval precision and wind speed (Conrad et al., 2023; Kunkel et al., 2023; Ayasse et al., 2024; Roger et al., 2025). However, for the parameterization of a POD function, one needs a reference dataset containing a dense distribution of methane plumes with known emission rates above and below the detection limits of the instrument under consideration. This distribution can be obtained from controlled release data (Conrad et al., 2023), underflights of airborne instruments with lower detection limits (Kunkel et al., 2023; Ayasse et al., 2024) or simulated plumes (Roger et al., 2025). Unfortunately, such a reference dataset is not available for MethaneSAT at the moment, although studies using simulated plumes are ongoing. Instead, one can obtain a representative estimate of detection limits from the analysis of real plume distributions. In particular, the emission rate at which the distribution peaks can be considered a good estimate of the average detection limit for the conditions under which the plumes in the distribution were acquired (Ayasse et al., 2024; Guanter et al., 2025). We have applied this approach to all the available quality-controlled plume detections in the MethaneSAT archive to estimate an average detection limit from a wide sample of MethaneSAT acquisitions (see Sect. 2.5).
In addition, we have run a first analysis of minimum plume detection limits using plumes generated by large-eddy simulations with the Weather and Research Forecasting Model (WRF-LES). WRF-LES plumes have been generated using different flux rates and wind speeds as inputs. The plumes were simulated at 30 m × 30 m sampling, and then spatially-resampled to MethaneSAT's 100×400 m2 spatial sampling. The spatially-distributed per-pixel methane concentration enhancement (ΔXCH4) maps from these WRF-LES plumes were added to a real MethaneSAT XCH4 map from Hassi Messaoud (Algeria), which resulted in a hybrid dataset (real radiance data and simulated plumes with known ΔXCH4 values), that preserve the random noise and artifacts in the original data.
Plume simulations have also been used in this study to assess the impact of MethaneSAT's spatial sampling on the detection and attribution of methane plumes. WRF-LES plumes sampled at 30 m have been convolved with MethaneSAT's 100×400 m2 for this purpose.
2.4 Matched-filter ΔXCH4 retrievals
The CO2-proxy XCH4 retrieval used to generate MethaneSAT's official L2 products has been proven to enable accurate and robust XCH4 retrievals, which are key to both the inversion of regional fluxes and the detection and quantification of point source emissions. However, the work by Guanter et al. (2025) with MethaneAIR suggested that the matched-filter data-driven retrieval can help improve the plume detection limits by increasing the retrieval precision with respect to the CO2-proxy retrieval. Although the focus of this study is the analysis of the official MethaneSAT's L2 XCH4 data product, we have also evaluated the potential of a matched-filter retrieval for an improved detection of point sources with MethaneSAT.
The matched-filter method is a data-driven retrieval that estimates ΔXCH4 from spectral radiance hypercubes. Details of the implementation of such retrieval for MethaneAIR, MethaneSAT's airborne precursor, are provided in Guanter et al. (2025). The ΔXCH4 maps derived with the matched-filter retrieval from MethaneAIR were shown to have a higher-signal-to-noise ratio than the ones produced by the official L2 CO2-proxy retrieval. However, because of the matched-filter's statistical nature, its performance is affected by the characteristics of the input scene, including the spatial variability of the spectral radiance and the number of pixels available for the calculation of the mean spectrum and the covariance matrix which are at the core of the matched-filter. It is unclear how this scene-dependence affects the performance of the matched-filter for MethaneSAT.
Our MethaneSAT implementation of the matched-filter uses the 1599–1680 nm spectral fitting window. Similar to the MethaneAIR version, the retrieval is run column-wise in order to account for potential non-uniformities in the detector response and across-track variations in the viewing angle, which can be important for MethaneSAT.
2.5 MethaneSAT data used in this study
The main sources of input data for this work have been MethaneSAT L2 and L4-plume files (i.e. XCH4 maps and the corresponding point-source product, respectively) from a number of targets, most of them sampling major O&G basins.
In particular, we have selected those sites where frequent super-emissions were detected with the TROPOMI mission according to the global database of methane plumes generated by the IMEO (United Nations Environment Programme, 2025). The spatial distribution of the selected sites is shown in Fig. 2. The regions inferred from TROPOMI plume detections include the Permian Basin and the Haynesville-Bossier basin in the USA, the South Caspian and Amu Darya basins in Turkmenistan, the Hassi-Massoud basin in Algeria, and the Zagros-Foldbelt and Widyan basins in Iran. In addition to these sites, we have added other targets, including the Appalachian region in the USA and the Maturin basin in Venezuela, to illustrate different plume detection aspects of MethaneSAT.
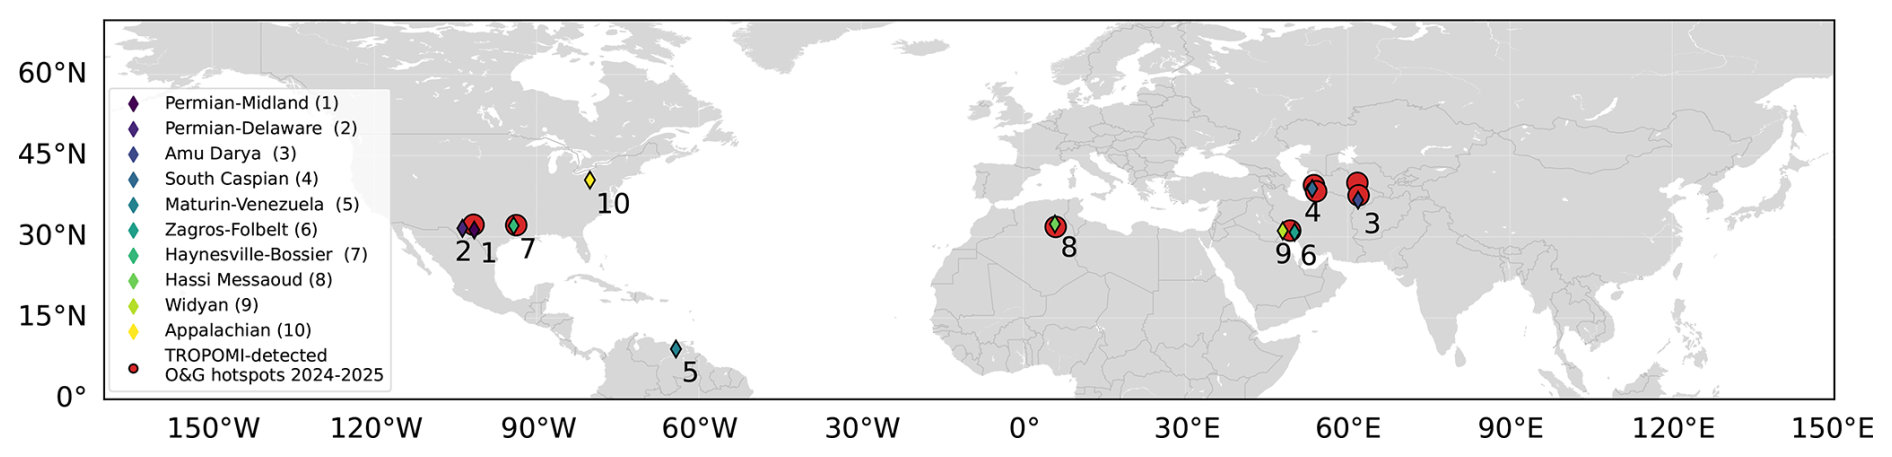
Figure 2Main MethaneSAT oil and gas targets featured in this study, compared with areas with persistently-high methane emissions according to the TROPOMI data included in the IMEO plume database. The MethaneSAT targets are marked by coloured diamonds. The regions derived from the TROPOMI plume detections, marked by red circles, correspond to the 2° gridboxes where more than 5 methane enhancements have been reported from TROPOMI observations in 2024 and 2025.
For some of the XCH4 map examples shown in this study, the XCH4 enhancement (ΔXCH4) map, rather than the absolute XCH4, is shown. ΔXCH4 is calculated from the L2 XCH4 data by subtracting the background XCH4 level, which is estimated as the median XCH4 of the scene. Non-valid pixels caused by missing data or retrieval artifacts are set to the average XCH4 or ΔXCH4 values in the scene in order to facilitate the visualization of plumes. This is justified by the expected sparsity of plume pixels with respect to the total number of pixels in the scene.
MethaneSAT's L2 datasets include rasters of zonal and meridional 10-m wind from the GEOS-FP reanalysis product (Molod et al., 2012), which has been used throughout this study for the analysis and interpretation of results.
In addition to the selected L2 products mentioned above, we have used a list of all the available quality-controlled plume datasets obtained from MethaneSAT for the assessment of plume detection limits (see Sects. 2.3 and 3.1.3). This list includes 165 plumes from about 40 datasets acquired over more than 15 sites around the world.
3.1 Evaluation of MethaneSAT's potential for the detection and attribution of methane plumes
3.1.1 Information content in MethaneSAT XCH4 maps
The information contained in MethaneSAT L2 and L4-plume files is illustrated in Fig. 1. A more in-depth analysis of this acquisition is provided here. Figure 1a shows a XCH4 map derived from MethaneSAT over an area of about 300×300 km2 at the central part of the Appalacchian basin (USA). The equivalent map derived from a TROPOMI acquisition over the same area about 70 min earlier than the MethaneSAT overpass is shown in Fig. 1b. The visual comparison of the two XCH4 maps confirms the consistency between the two datasets, and the higher level of detail enabled by MethaneSAT's higher spatial resolution (100×400 m2 for MethaneSAT, and 7×5.5 km2 for TROPOMI). In addition, a number of methane plumes and methane concentration enhancements can be seen across the scene. The plumes that were detected and quantified from this MethaneSAT dataset (i.e. the L4-plume product) are indicated in Fig. 1c on top of a map of near-infrared suface albedo extracted from the same dataset. It comprises a total of 16 plumes, with emission rates ranging between 800 and 7000 kg h−1 (see Fig. A1). These emissions from the Appalachian region are due to a combination of O&G, coal mining and waste facilities across the area, with the last two types of sources including a number of highly persistent point sources (Warren et al., 2024). A massive emission of more than 100 metric tonnes per hour (t h−1) was also detected in this dataset (marked by a red cross in Fig. 1c), but we assume it was short-lived because we were not able to detect it in a follow-up study using geostationary observations by the GOES-ABI mission, with a continuous coverage over North America every 5–10 min (Watine-Guiu et al., 2023). We ruled out the possibility of this plume being a retrieval artifact by comparing the XCH4 map with the corresponding near-infrared radiance map, where no similar pattern is found.
3.1.2 Assessment of factors driving the detection of methane plumes with MethaneSAT
The lower end of the Appalachian point source emissions (about 700 kg h−1, see Fig. A1) displayed in Fig. 1 represents a best-case detection limit for MethaneSAT, which is facilitated by the low winds across that scene. We have further explored the drivers of plume detection limits for MethaneSAT using the Qmin formalism described in Sect. 2.3. Figure 3 shows rasters (in sensor coordinates) of XCH4, near-infrared at-sensor radiance (proxied by surface albedo at 1606 nm multiplied by the cosine of the sun zenith angle), the standard deviation of XCH4 within a 3 km-side box (σ(XCH4)), and the resulting Qmin from four MethaneSAT acquisitions: the 5 September 2024 Appalachian scene presented in Fig. 1, and three other scenes over sites in the Delaware sub-basin of the Permian Basin, Algeria and West Siberia. These four acquisitions have been selected in order to sample a wide range of acquisition conditions, in particular of at-sensor radiance (from very low in the Appalachian and West Siberia scenes to very bright in the Permian and Algeria acquisitions) and of wind intensity (from very low in the Appalachian scene to very strong in the Permian scene). At-sensor radiance and wind speed are expected to be the main drivers of MethaneSAT's plume detection ability: at-sensor radiance drives the retrieval noise level, whereas wind speed determines the number of pixels showing methane concentration enhancements above that noise level.
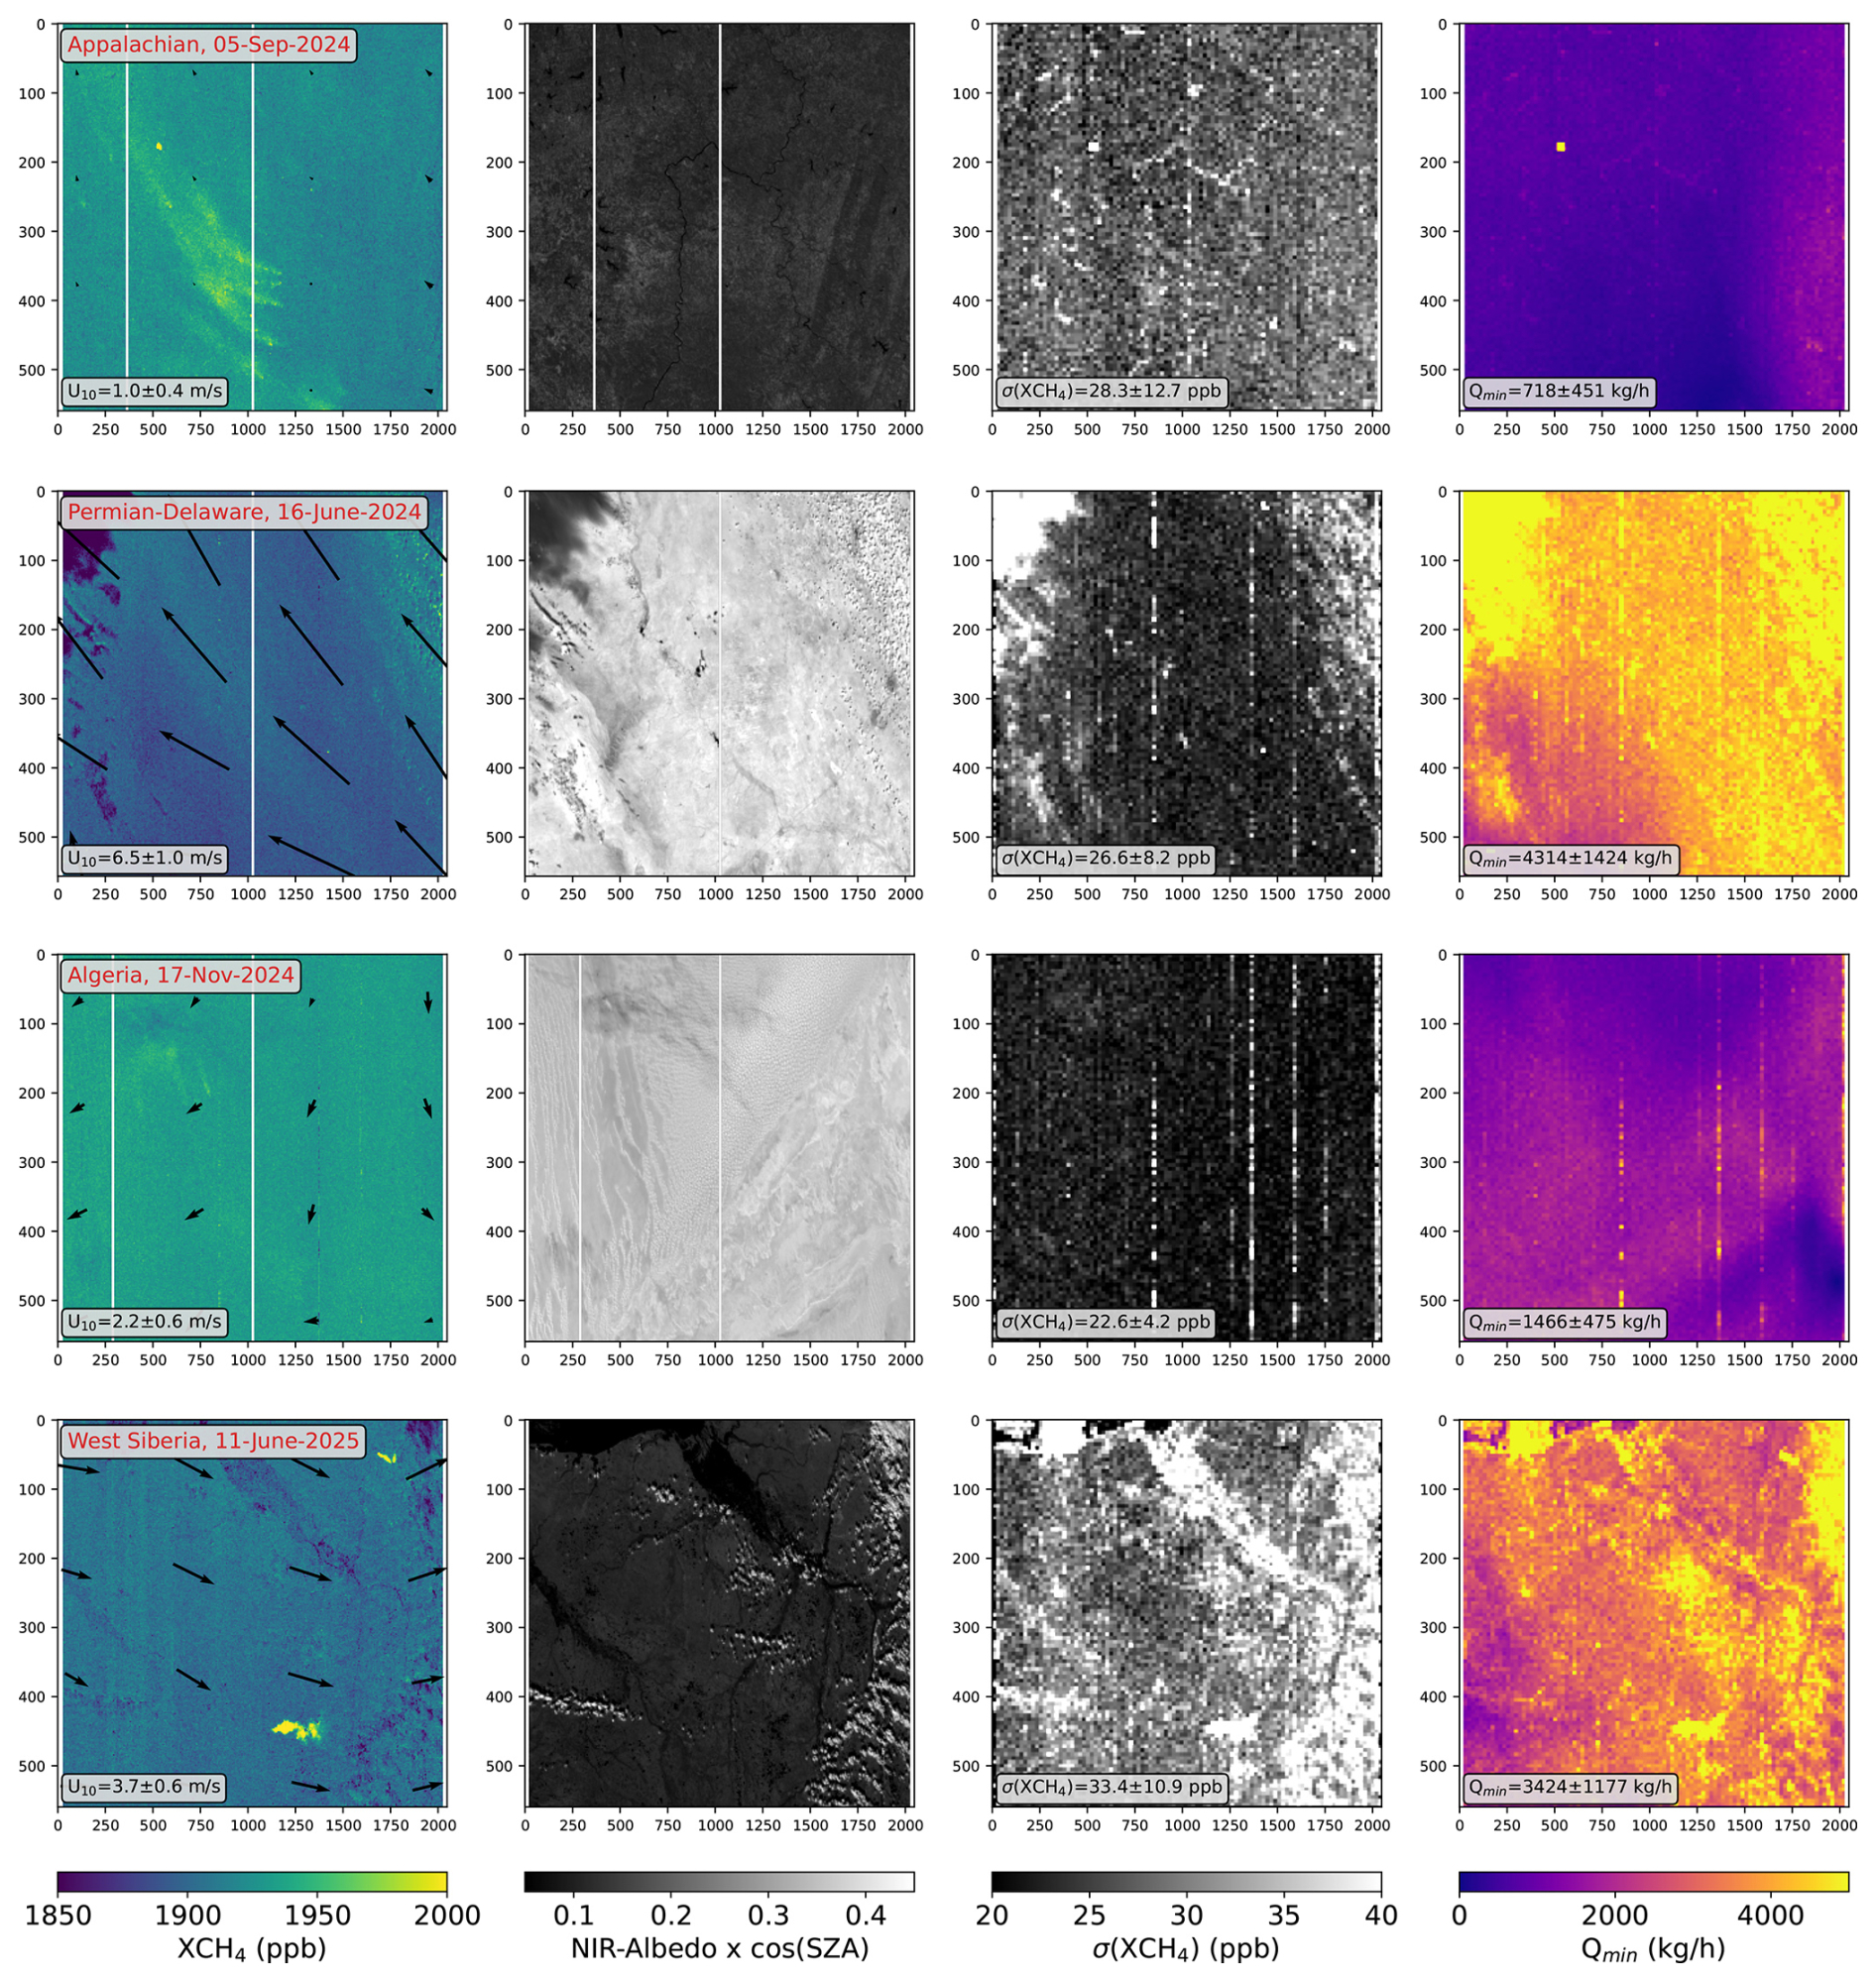
Figure 3Qmin from MethaneSAT L2 datasets over a range of sites covering different acquisition conditions with respect to at-sensor radiance and wind speed. Methane concentration (XCH4), near-infrared (NIR) albedo (1606 nm) multiplied by the cosine of the sun zenith angle (SZA), and the standard deviation of XCH4 (σ(XCH4)) are represented in the first three columns, and the resulting Qmin rasters are shown in the last column. Wind speed and direction (U10) are represented by the black arrows in the XCH4 panels.
As shown by the panels on the third column of Fig. 3, σ(XCH4) typically ranges between 20 and 40 ppb (parts-per-billion). This combines contributions from the per-pixel retrieval precision error, the effect of surface clutter on the retrieval, and the natural variability of XCH4 across the scene. The smaller σ(XCH4) is found for bright and spatially homogeneous surfaces, which enable the maximum measurement signal-to-noise ratio and the minimum surface clutter. This is the case of the Algeria site, where σ(XCH4) is around 22.6 ppb, and the Permian scence, with an average σ(XCH4) of 26.6 ppb. The at-sensor radiance of the Permian scene is actually a bit larger than the one in the Algeria scene because of the smaller zun zenith angle during the Permian acquisition, which took place in mid June. However, σ(XCH4) in the Permian acquisition is greater than that in the Algeria one because the surface is less homogeneous, and also because there is a higher horizontal variability in the XCH4 field from the multiple sources present in the Permian. On the other hand, the σ(XCH4) is largest for the Appalachian and West Siberia sites (28.3 and 33.4 ppb on average, respectively), which are covered by vegetated surfaces with a low near-infrared albedo. On the other hand, we observe a low occurrence of false XCH4 enhancements caused by surface structures, as opposed to the case of high spatial resolution missions with a coarser spectral resolution, for which it is often challenging to disentangle the methane signal from that of surface features (Roger et al., 2024a).
For context, high resolution imaging spectrometers being used for plume detection, such as EnMAP or PRISMA, can have similar retrieval precision errors over ideal observation conditions (namely, homogeneous surfaces and high solar irradiance) (Roger et al., 2024b), but the precision errors and the occurrence of false positives depend strongly on the heterogeneity of the surface due to the coarse spectral sampling of those instruments (Guanter et al., 2021).
On the other hand, we find a substantial impact of the wind speed on our ability to detect methane plumes with MethaneSAT. For stronger winds, plumes and local methane enhancements are more effectively dispersed by the atmosphere, and the number of pixels with XCH4 enhancements above the noise level becomes smaller. Thus, the Qmin calculated with Eq. (1) is smallest for the Appalachian acquisition (wind speed is 1.0±0.4 m s−1 across the scene), and greatest for the Permian Basin one (6.5±1.0 m s−1), despite the higher retrieval precision found for the Permian Basin scene. The Algeria and West Siberia cases show intermediate values of Qmin, with smaller Qmin, wind speeds and σ(XCH4) in the Algeria case. The extreme values of Qmin shown in Fig. 3 for the Appalachian and Permian scenes in Fig. 3 (very low and very high Qmin, respectively) actually match what we find when analyzing these two datasets for plume detection: we find a total of 16 plumes in the Appalachian (see Sect. 3.1.1), whereas only two plumes are detected in the Permian scene, which can be attributed to the strong winds on that day.
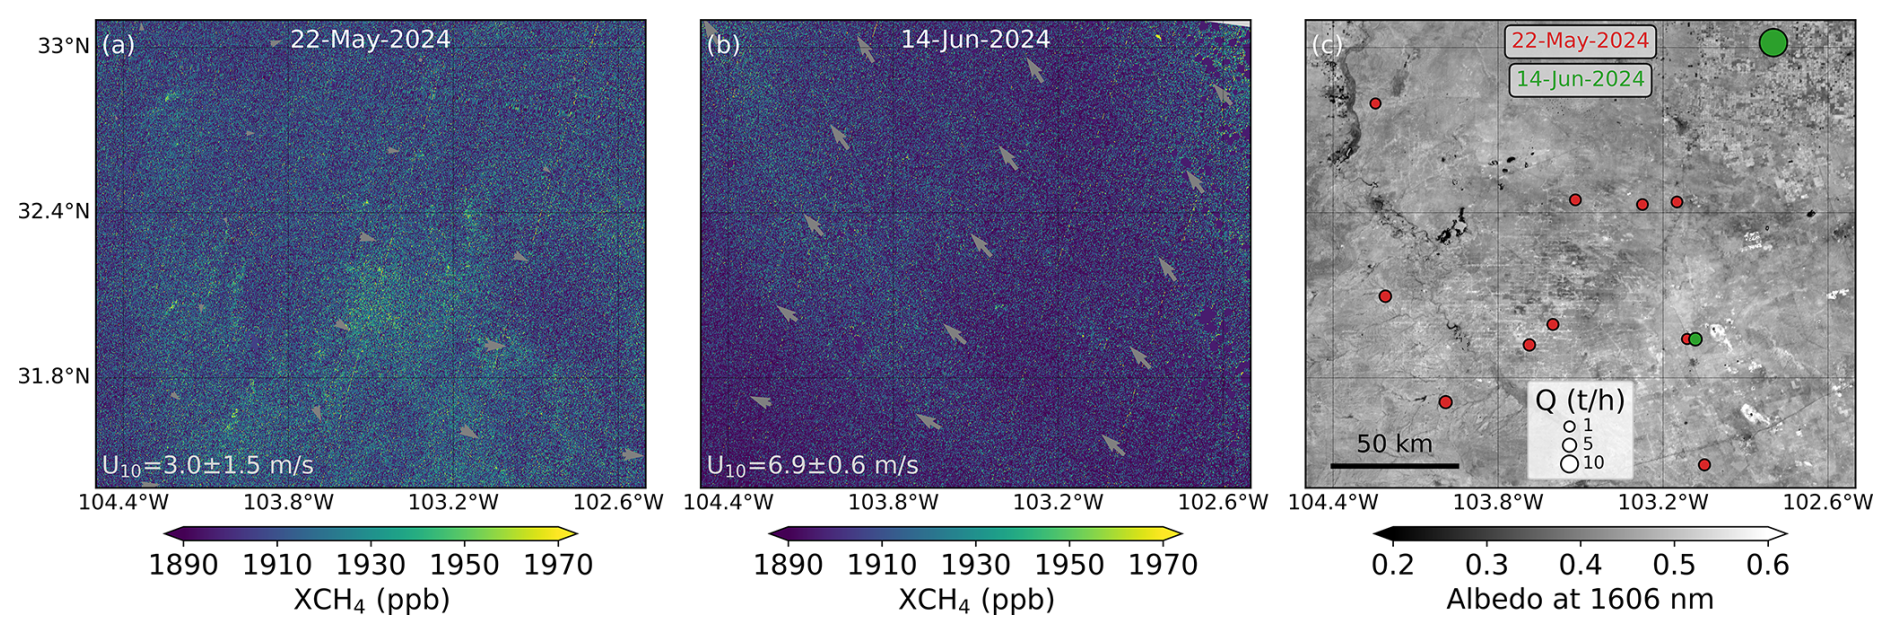
Figure 4Comparison of MethaneSAT XCH4 maps over the Permian-Delaware sub-basin on (a) 22 May and (b) 16 June 2024. The methane plumes detected from each of the datasets are represented by circles on the 22 May albedo map, which is shown in (c). The grey arrows depict the wind speed and direction. The mean wind speed for each subset is provided on the lower-left corner of the (a) and (b) panels.
This is further illustrated in Fig. 4. It displays the same Permian Delaware scene included in Fig. 3, and a second one acquired over the same area about 3-weeks earlier. Large concentrations of high-emitting point sources are usually found in this region (Irakulis-Loitxate et al., 2021; Cusworth et al., 2022; Guanter et al., 2025). The visual comparison of the two maps reveals the impact of wind on the spatial distribution of methane enhancements: a number of methane plumes and local enhancements are found on 22 May 2024, where low-to-medium wind speeds were present (wind speed of 3.0±1.5 m s−1), whereas a much more uniform methane concentration field with lower XCH4 values is found in the 14 July 2024 acquisition, with much stronger winds (6.9±0.6 m s−1). This led to a total of 10 plumes being detected across the area on 22 May, with emission rates between 0.7 and 3.5 t h−1, whereas only two large plumes of 4 and 24 t h−1 were found on 14 July, as shown in Fig. 4c. These results are consistent with the analysis in Guanter et al. (2025), which found hundreds of plumes over this area from two flight campaigns with MethaneAIR (MethaneSAT's airborne version), but only one source was estimated to be above 2 t h−1.
This dependece of detection limits on wind speed actually happens to all instruments capable of plume detection (e.g. GHGSat or EnMAP) (Conrad et al., 2023; Ayasse et al., 2024; Roger et al., 2025), but it may be stronger for MethaneSAT because of its coarser spatial resolution, which reduces the number of plume pixels with XCH4 values above the noise level. The fact that MethaneSAT's plume detection ability is greater for a vegetated site (Appalachian) than for a semi-arid surface (Permian) in this comparison is mediated by the lower wind speed in the Appalachian acquisition. This role of wind speed as a limiting factor for plume detection is a characteristic of MethaneSAT observations. In contrast, the surface type is usually the main driver of plume detection for high-resolution instruments.
3.1.3 Estimation of MethaneSAT's plume detection limits
The point at which a distribution of emission rates rolls off toward smaller values can be taken as an indicator of the system detection limits. We have used the full list of plume detections from MethaneSAT to estimate an average plume detection limit representing a range of sites and acquisitions sites. This plume lists contains 165 quality-controlled plumes, extracted from 40 MethaneSAT acquisitions over 15 different sites. The histogram and lognormal fit for this plume distribution is shown in Fig. 5. A peak value of 1300 kg h−1 is found, which can be considered a conservative estimate of plume detection for most of the acquisitions included in this dataset. For example, Ayasse et al. (2024) assumed this histogram peak value to represent a 90 % POD. We note that the histogram deviates substantially from a lognormal distribution due to the reduced number of detections in the 10 000 kg h−1 range, which may be due to a statistical artifact caused by the relatively small plume sample. We assume that this has not a strong impact on the 1300 kg h−1 estimate.
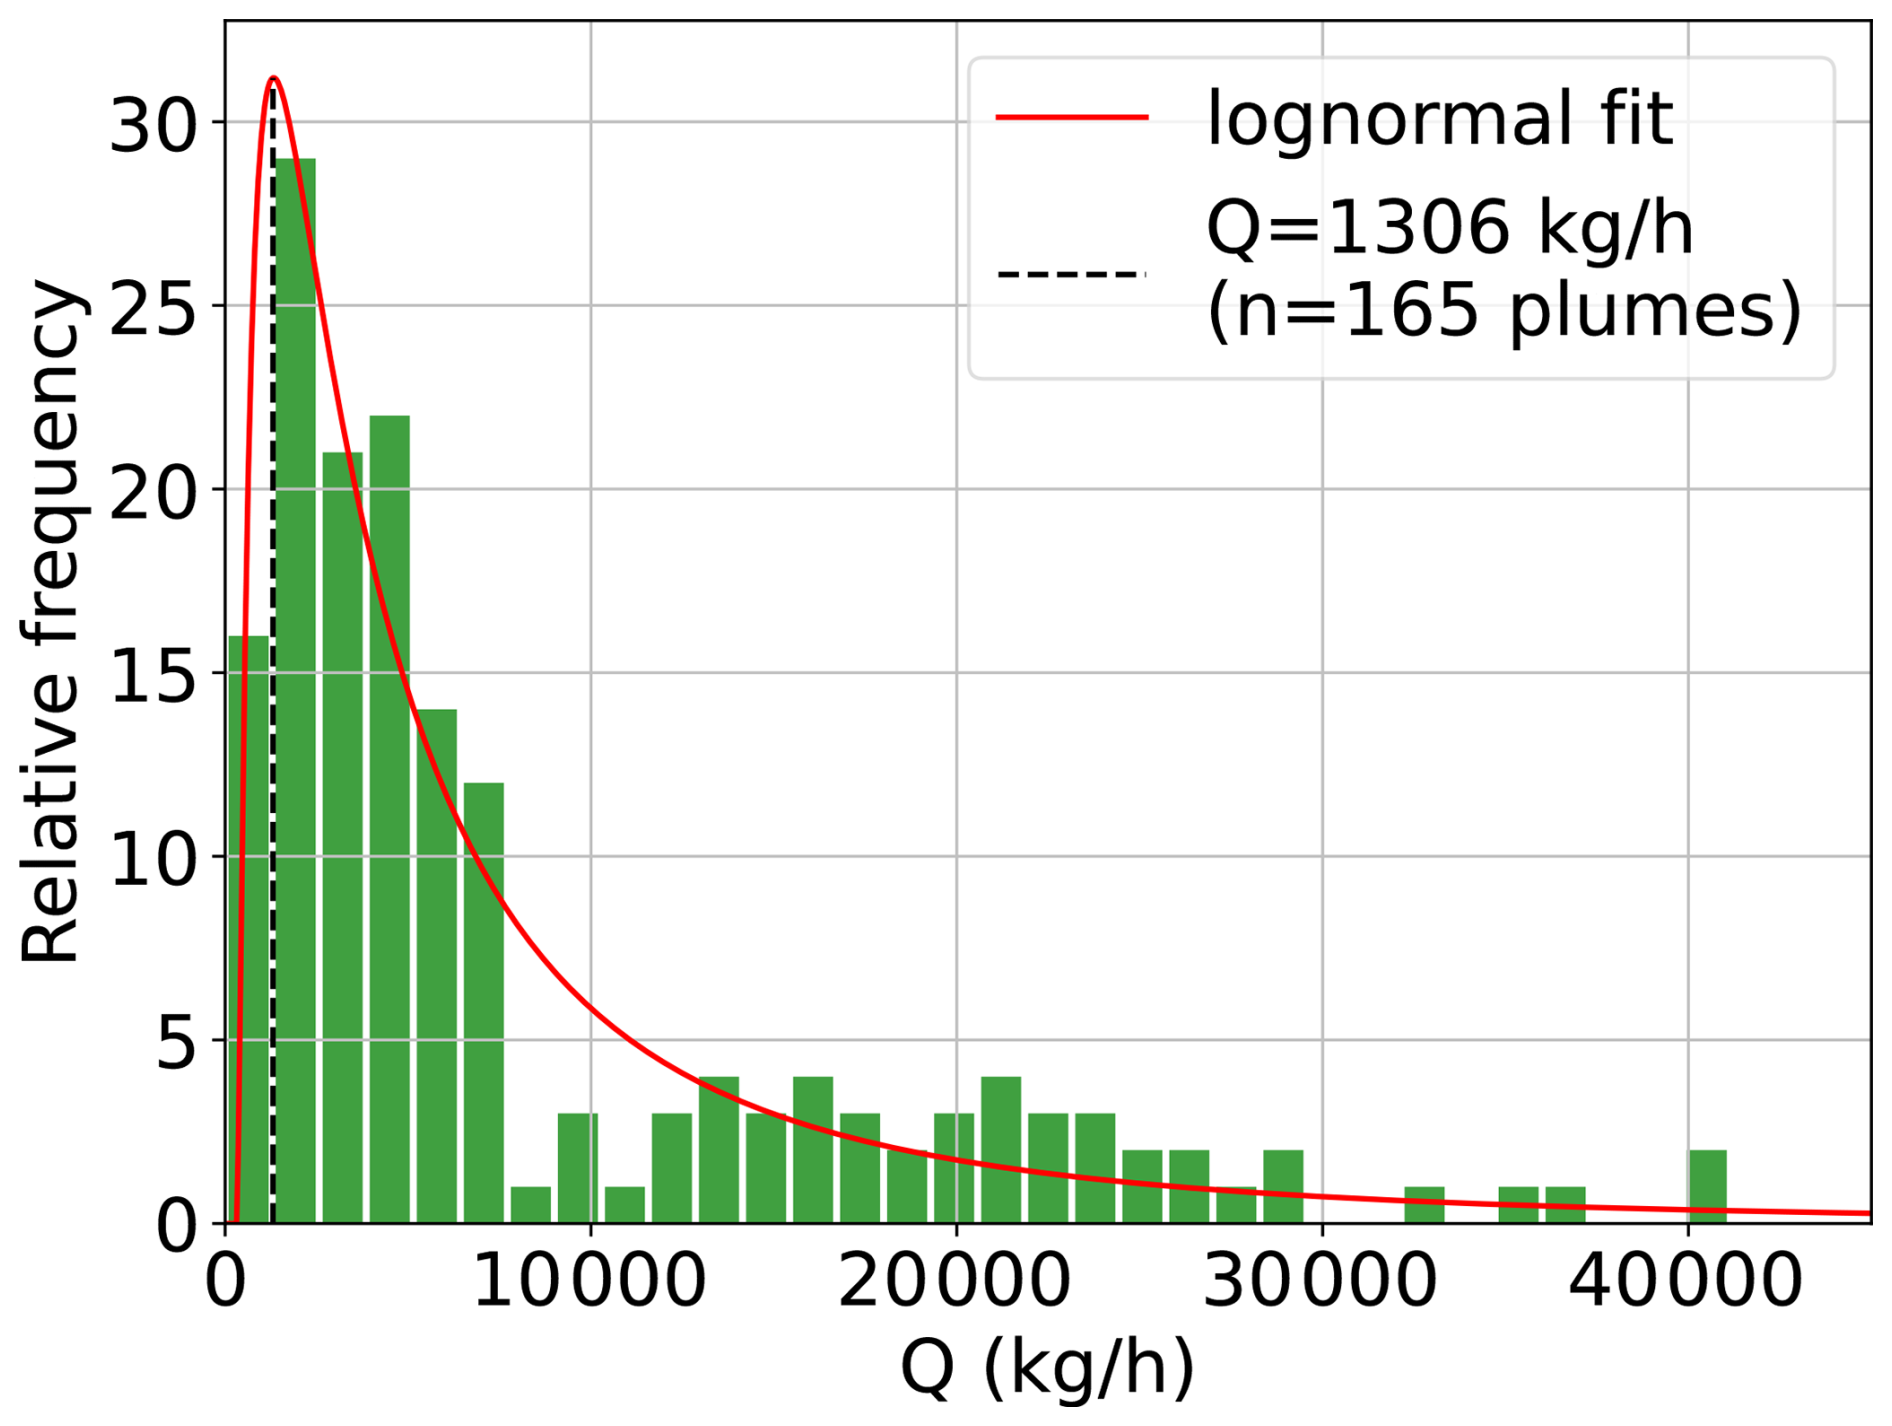
Figure 5Histogram of emission rates (Q) from all quality-controlled plumes in the MethaneSAT archive. The red line represents a lognormal fit to the distribution. The dash line marks the Q value for which the distribution of estimated Q values deviates from a power law.
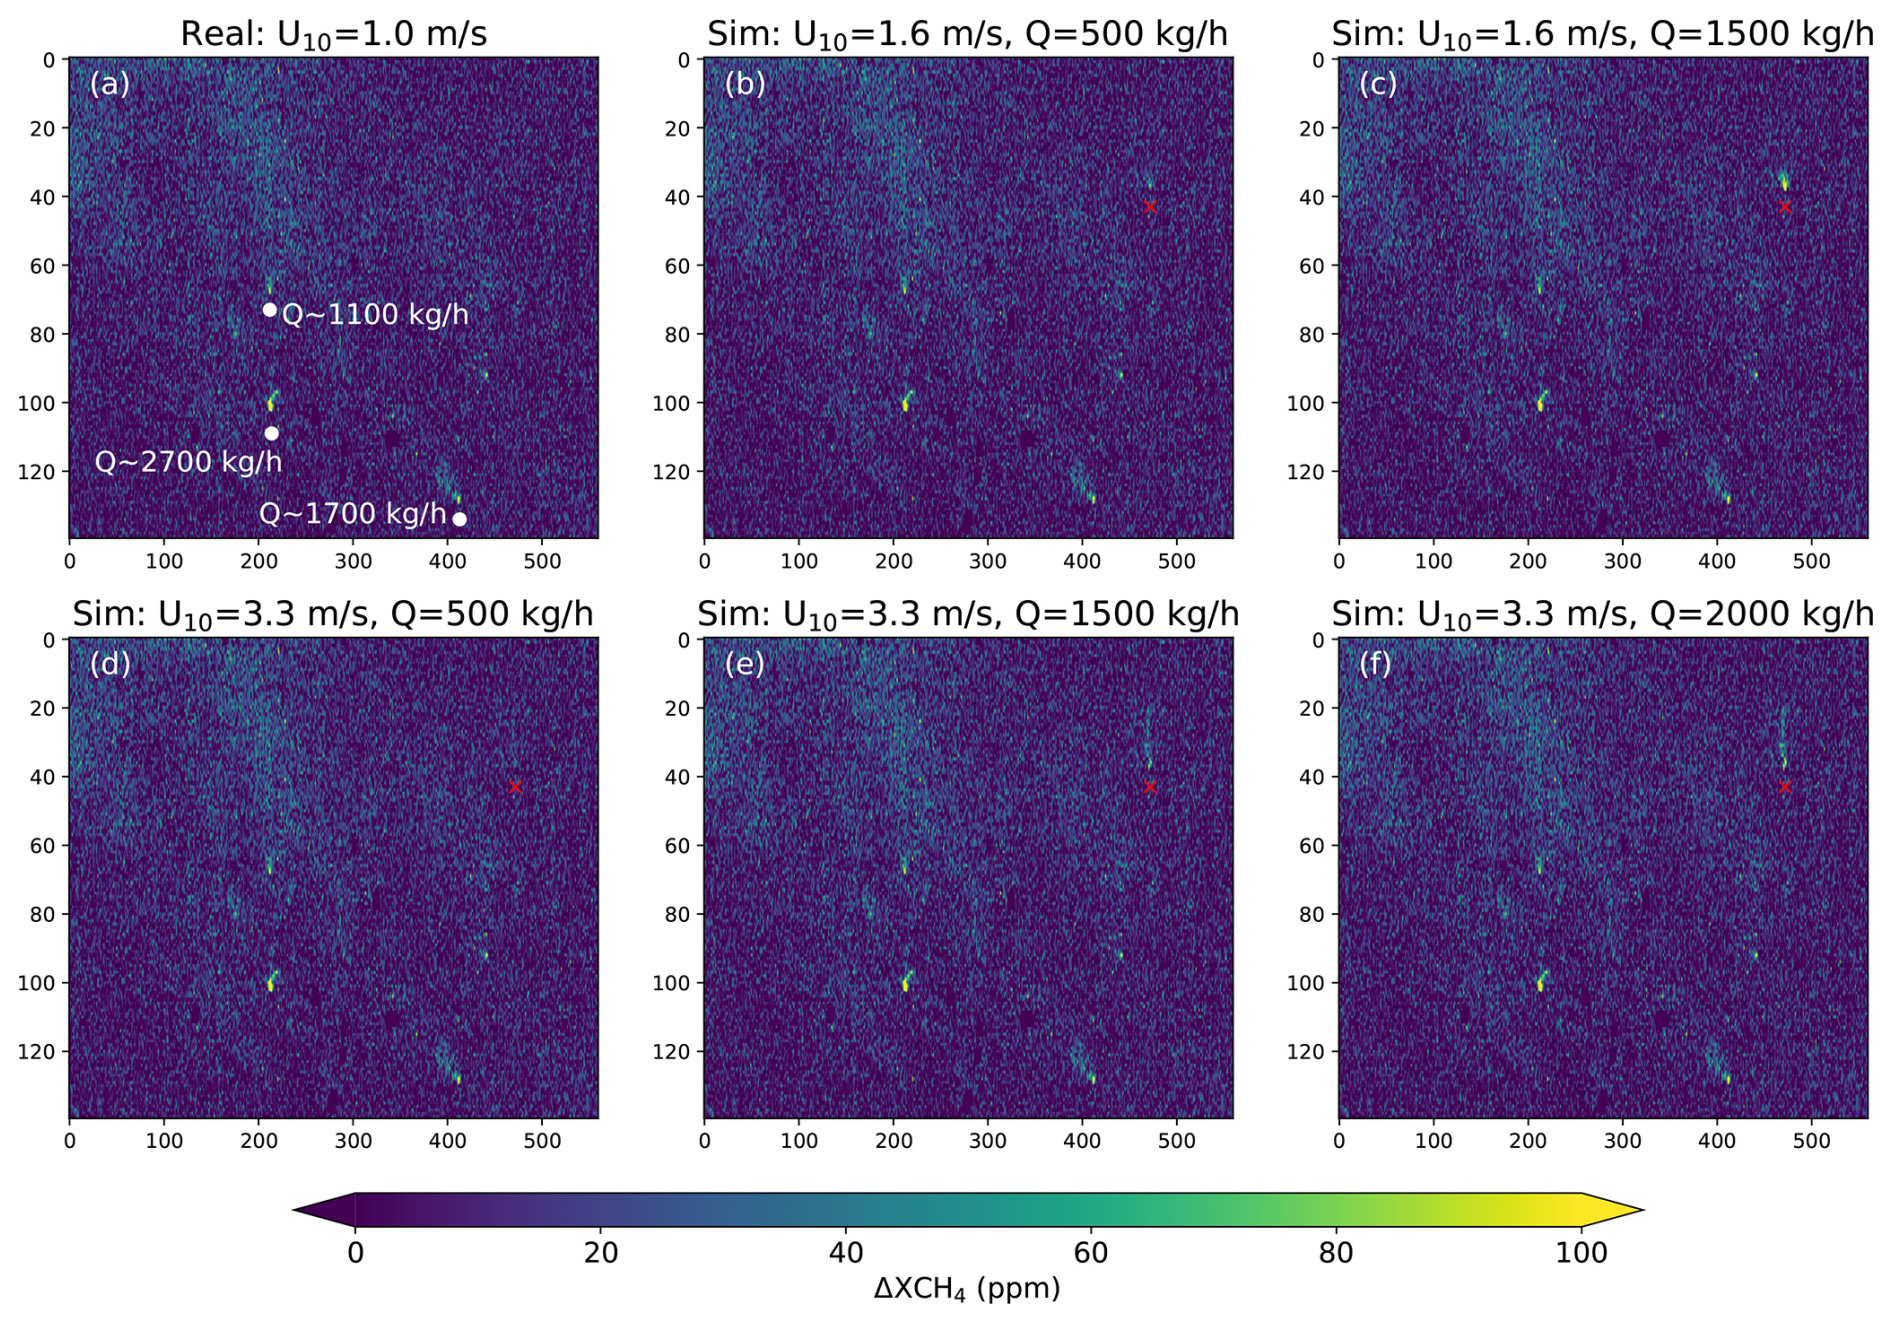
Figure 6Impact of source intensity and wind speed on plume detection with MethaneSAT. Simulated methane plumes are embedded into a real MethaneSAT L2 dataset from Hassi Messaoud (Algeria) acquired on 17 November 2024. The original subset contains three real methane plumes, which are marked by white annotations in panel (a), whereas the simulated plumes are marked by a red cross in panels (b)–(f).
To complement this estimate of the average plume detection limit, a preliminary assessment of MethaneSAT's minimum detection limit has also been carried out. For this, WRF-LES plumes have been embedded into real XCH4 maps. Figure 6 shows the result of adding simulated plumes into a subset XCH4 map from a MethaneSAT acquisition over Hassi Messaoud (Algeria) on 17 November 2024. The subset covers an area of about 50 km × 50 km, with wind speed of 1.0±0.2 m s−1 and σ(XCH4) of 25 ppb (estimated as the local standard deviation from the XCH4 map). This subset included 3 real plumes according to the corresponding MethaneSAT L4-plume product, with emission rates between 1.1 and 2.7 t h−1 (Fig. 6a), whereas one likely plume may have been missed around pixel (450, 90). The simulated plumes are marked by a red cross in Fig. 6b–f. The simulations were performed for different wind speeds (either 1.6 or 3.3 m s−1) and flux rates (500, 1500 or 2000 kg h−1). From visual inspection of the simulated plumes (Fig. 6b–f), it is evident that a plume with flux rate around 500 kg h−1 would likely be detected for this particular scene if the wind speed remained below 1.6 m s−1 (Fig. 6b), but this may not be the case for the same flux rate range if the wind speed were greater than 3 m s−1 (Fig. 6d–f), as less plume pixels show XCH4 values above the noise level in this case.
We would like to note that these results only provide a rough estimate of the minimum detection limit of MethaneSAT, applies to very bright and homogeneous areas such as the one in Algeria used for this test, and to low winds as described in Sect. 3.1.3. A more rigorous analysis of minimum and average detection limits would require a probability-of-detection framework (Conrad et al., 2023) and a greater number and range of simulated source rates, wind speeds, plume morphologies and site characteristics.
3.1.4 Impact of spatial sampling on plume detection and attribution
MethaneSAT has a 100 m × 400 m spatial sampling at nadir. This spatial sampling is substantially coarser than that of the high-spatial resolution missions typically used for point source detection, which have squared pixels with a spatial sampling between 20 and 60 m. This may challenge MethaneSAT's ability to pinpoint single sources with respect to those higher resolution missions.
We have explored this issue using again WRF-LES plumes. A simulated plume from a 2000 kg h−1 source and a 30 m spatial sampling has been convolved with MethaneSAT's 100 m × 400 m sampling assuming a boxcar point spread function. This spatial convolution was made so that the plume was aligned with either the across-track or the along-track direction of the observation. The results are represented in Fig. 7. Pixels with ΔXCH4 values below 25 ppb have been filtered out. The simulated plume and a zoom on the source location, both at a 30 m sampling, are shown in Fig. 7a and b, and the spatially-resampled plume is displayed in Fig. 7c and d for the plume aligned with the across- and along-track direction, respectively. From these simulations, it can be observed that the direction of the plume with respect to the observation is important for the potential detection and attribution of the plume, because of MethaneSAT's rectangular pixels: if the plume is aligned with the along-track direction (Fig. 7c), the pixels contain a smaller fraction of the methane enhancement, which decreases the chances of those pixels to stand out above the noise level to enable detection. In the case of plumes aligned with the across-track direction (Fig. 7d), peak XCH4 values are greater than in the previous case because a larger fraction of the enhancement is sampled by each pixel, which increases the probability of plume detection with respect to the along-track alignment case.
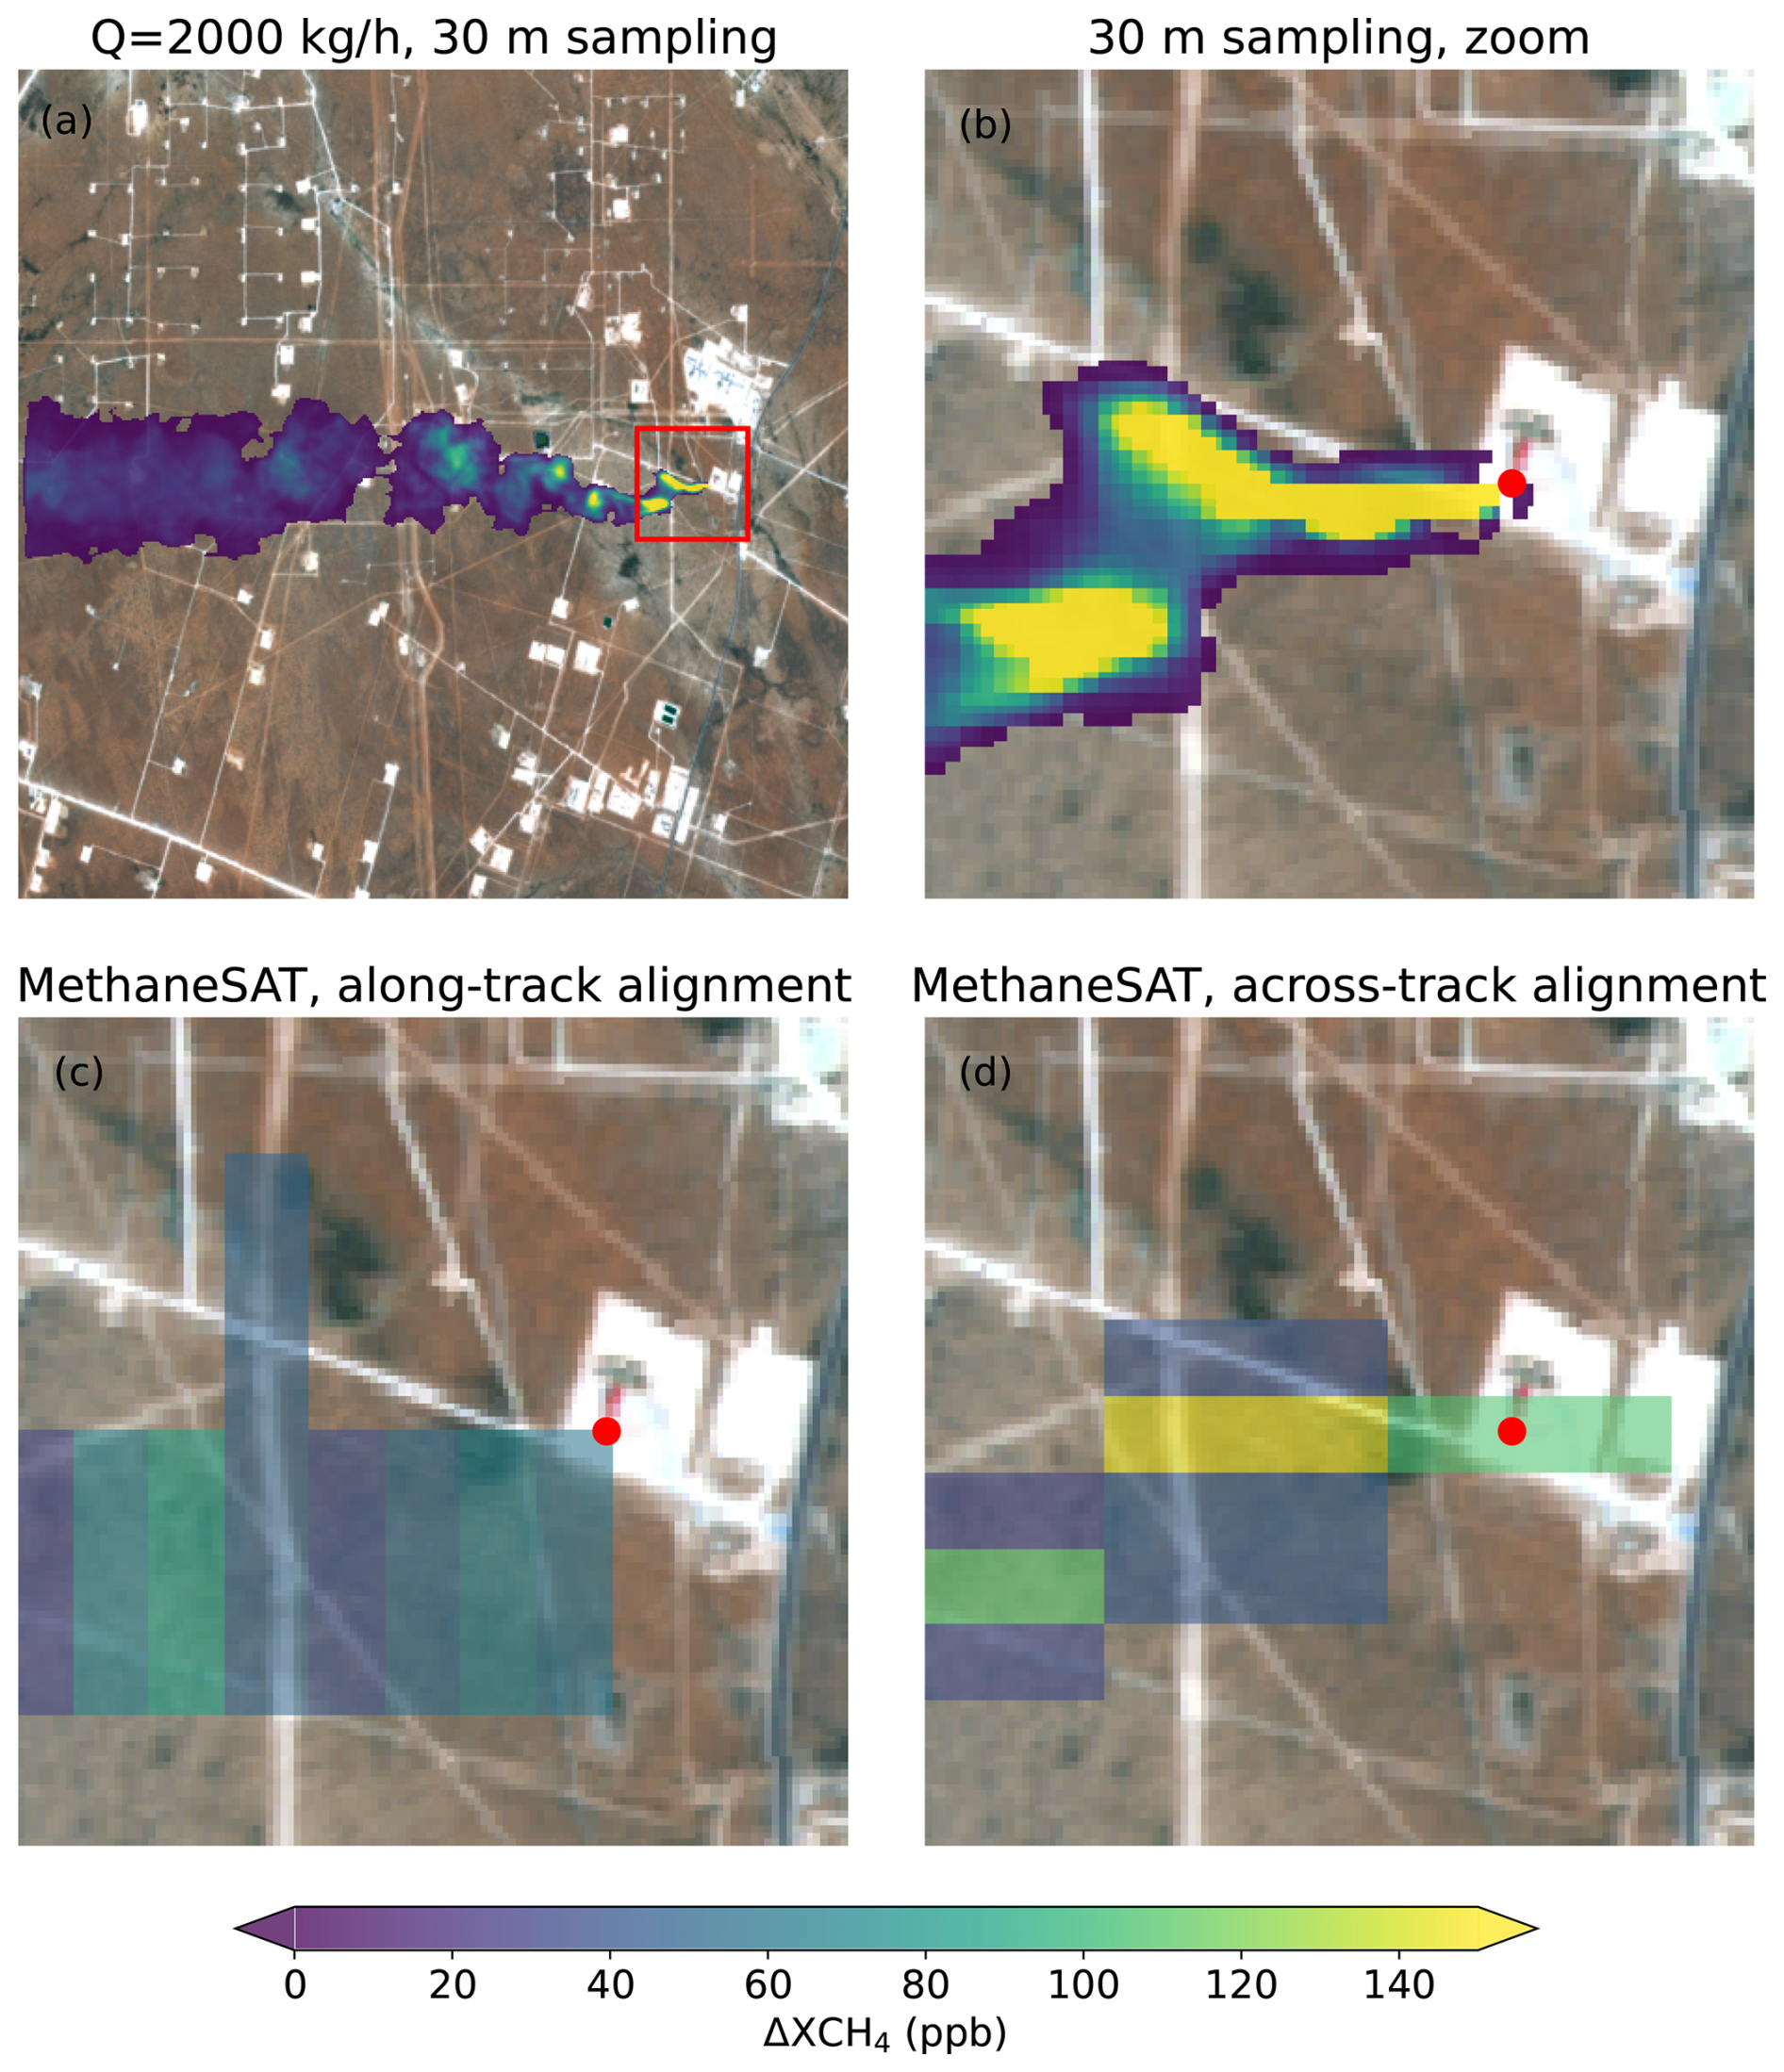
Figure 7Impact of observation geometry on plume attribution over the Permian Basin. A simulated plume with a 30 m spatial sampling (a, b) is downscaled to MethaneSAT's 100 m × 400 m sampling assuming that the plume is aligned with either the along- or the across-track direction of the observation (c and d panels, respectively). Pixels with ΔXCH4 values below 25 ppb have been filtered out. The red dot in panels (b)–(d) represents the source of the simulated plume.
Regarding the attribution of the plume to a source, the limitations imposed by MethaneSAT's relatively coarse spatial resolution are also illustrated by the simulations in Fig. 7. Whereas the attribution to the source is straightforward for the 30-m sampling case, this becomes challenging at MethaneSAT's spatial sampling, especially in the case of the along-track alignment, in which the first upwind pixel above the noise level is shifted with respect to the source location. This effect is smaller in the case of across-track plume alignment, but even in this case the pixel with the largest concentration enhancement is not the one containing the source, which could lead to ambiguities in the plume attribution process. Again, this example is provided here only to illustrate the problem. More simulations and a robust statistical analysis would be needed for a proper assessment of the limitations of MethaneSAT observations for plume attribution.
3.1.5 Comparison with plume data from high-resolution missions
In order to further investigate the limitations interposed by MethaneSAT's relatively coarse spatial sampling, we have compared a MethaneSAT plume map with the equivalent data as provided by high-resolution imagers. We have chosen a MethaneSAT acquisition over Turkmenistan's South Caspian basin on 23 September 2024, which was also sampled by the Landsat-8 mission (30 m spatial sampling) on the same day. MethaneSAT overpass was at 10:42 UTC and Landsat's at 07:01 UTC, so there was a time difference of about 3.6 h between the two acquisitions. Wind speed for this subset region during the MethaneSAT overpass was 1.3±0.7 m s−1. The coordinates and flux rate of the Landsat plumes were taken from the IMEO plume dataset (United Nations Environment Programme, 2025). The results from this comparison are shown in Figs. 8 and 9. We have chosen this Landsat acquisition for comparison with MethaneSAT because it spans a number of plumes within a relatively broad range of emission rates. No match-ups with imaging spectroscopy missions, such as EnMAP or EMIT (more sensitive to methane than Landsat, but with a sparse spatio-temporal sampling), have been found for this comparison with MethaneSAT.
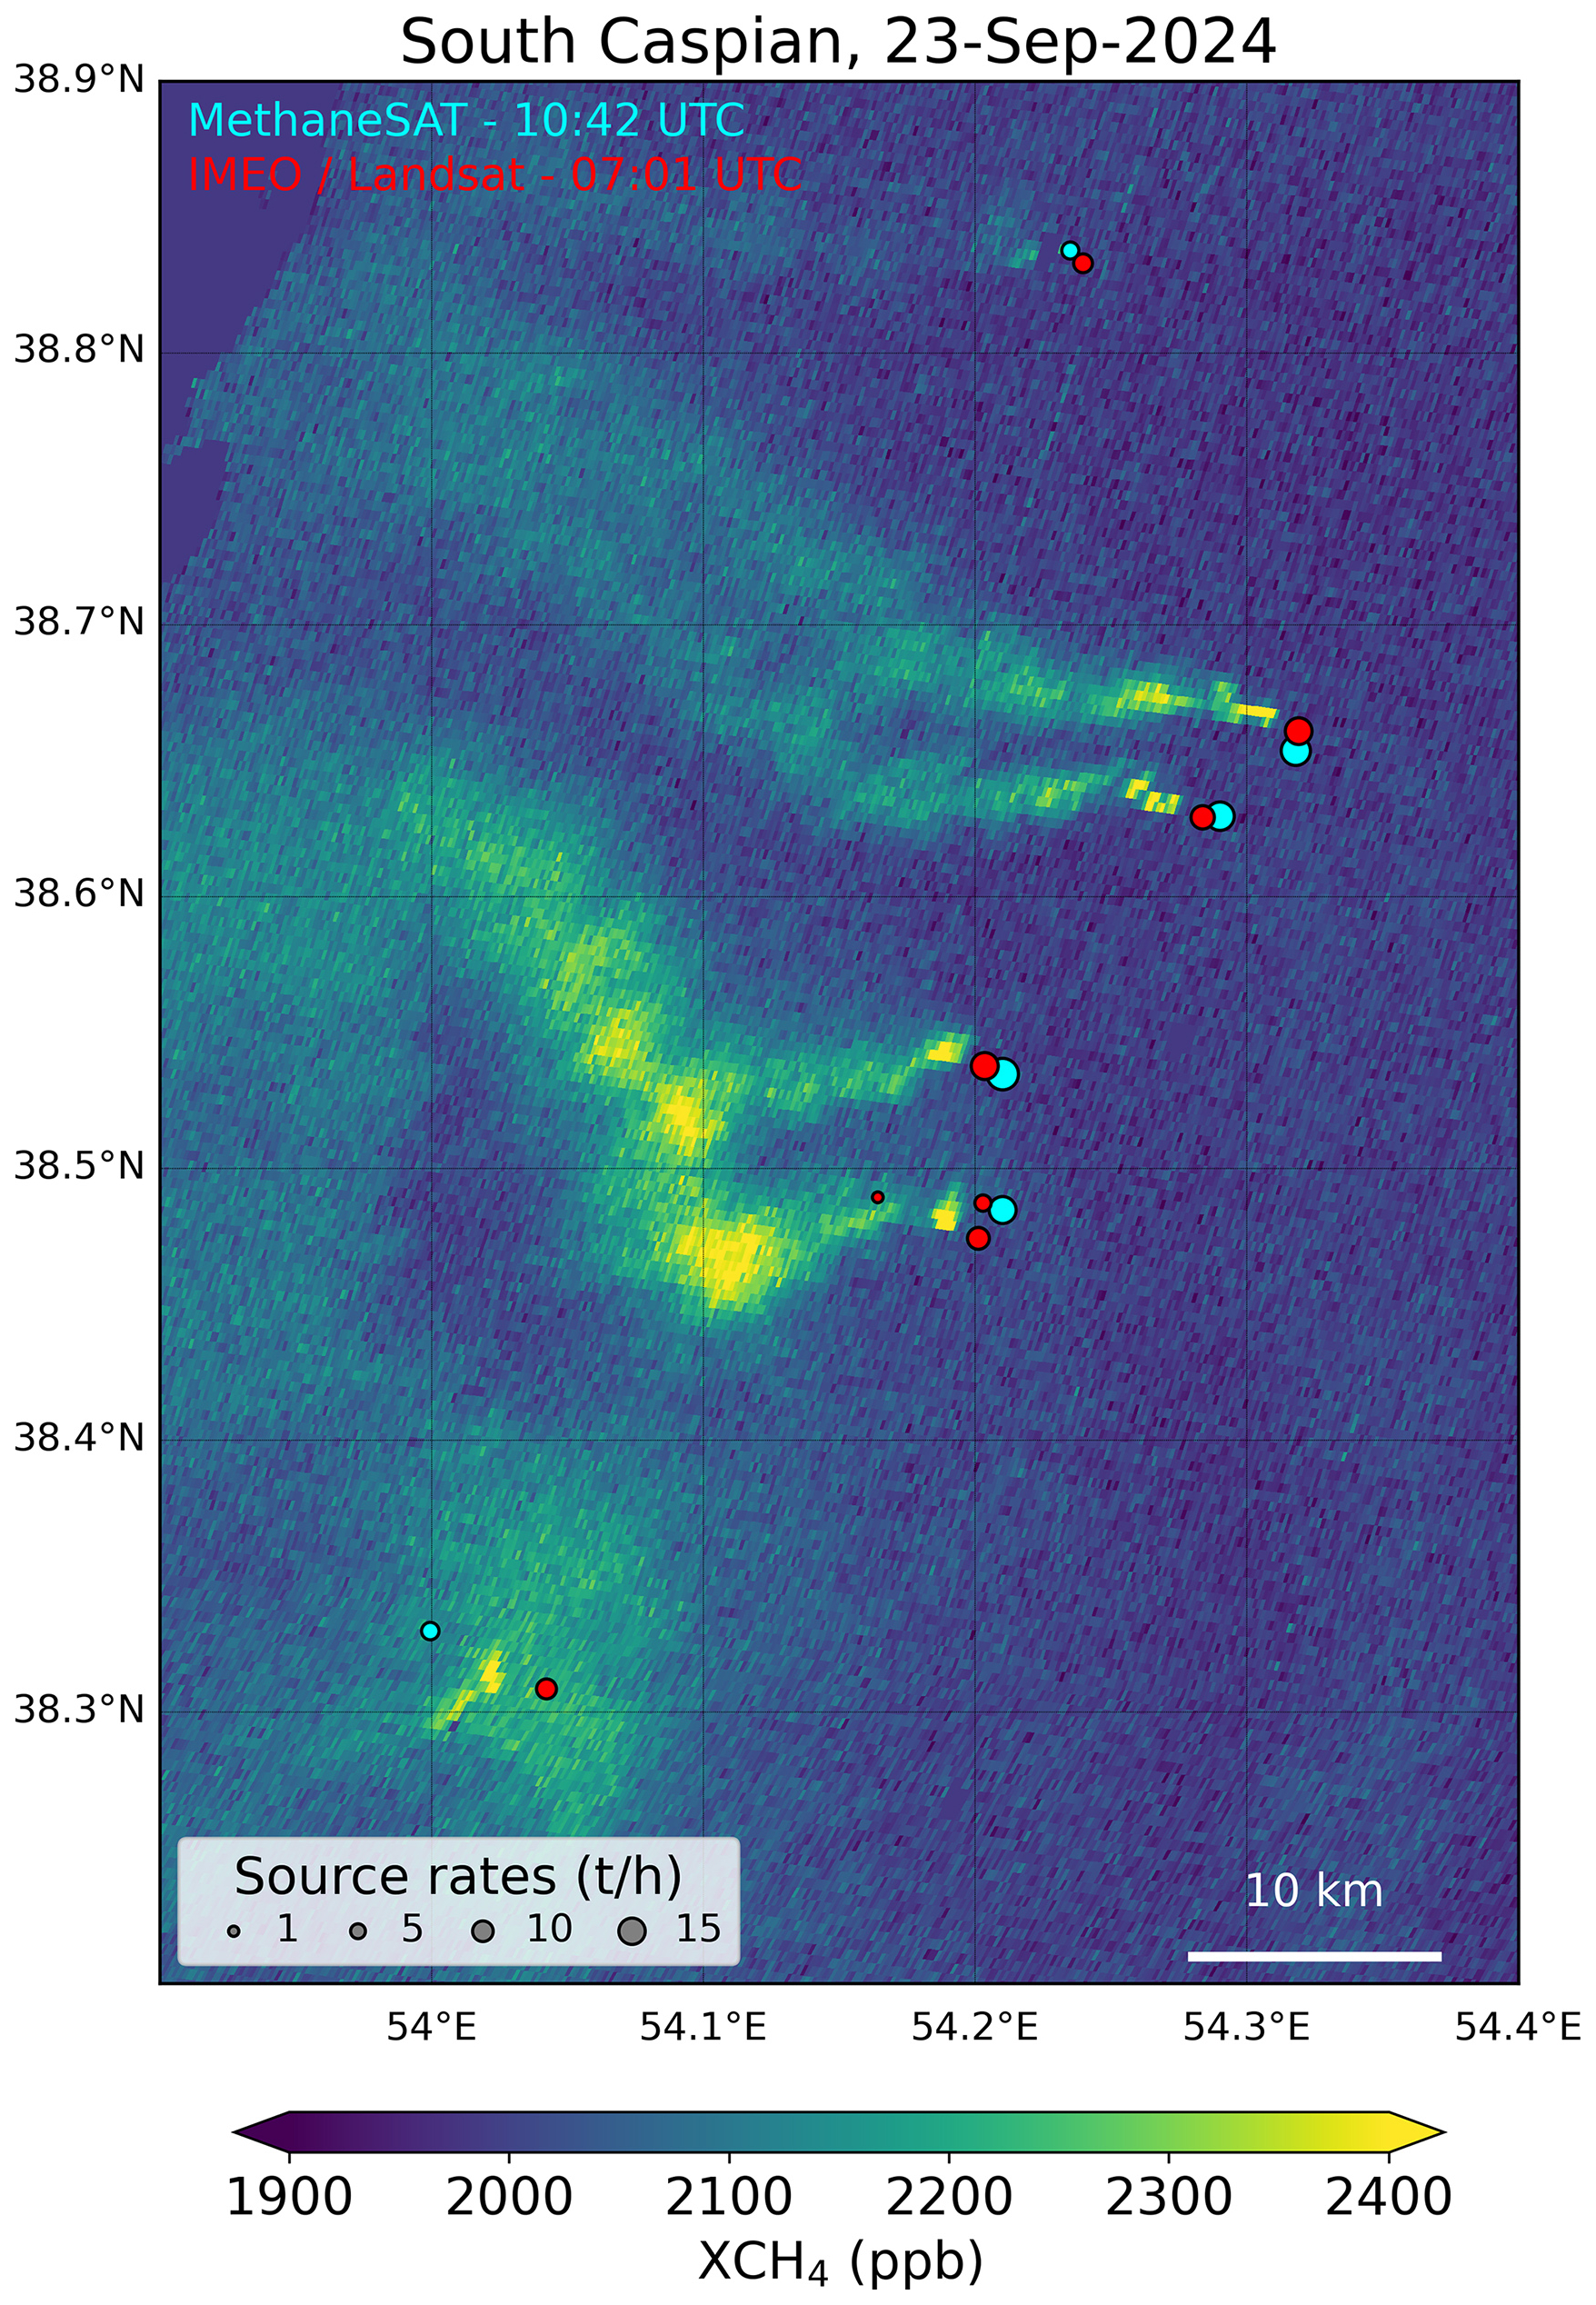
Figure 8Comparison between MethaneSAT and Landsat plume detections over the southern part of Turkmenistan's South Caspian basin on 23 September 2024. The background XCH4 map is a MethaneSAT L2 XCH4 product. The circles depict the plumes included in the corresponding MethaneSAT L4 plume product (cyan) and the IMEO plume database (red).
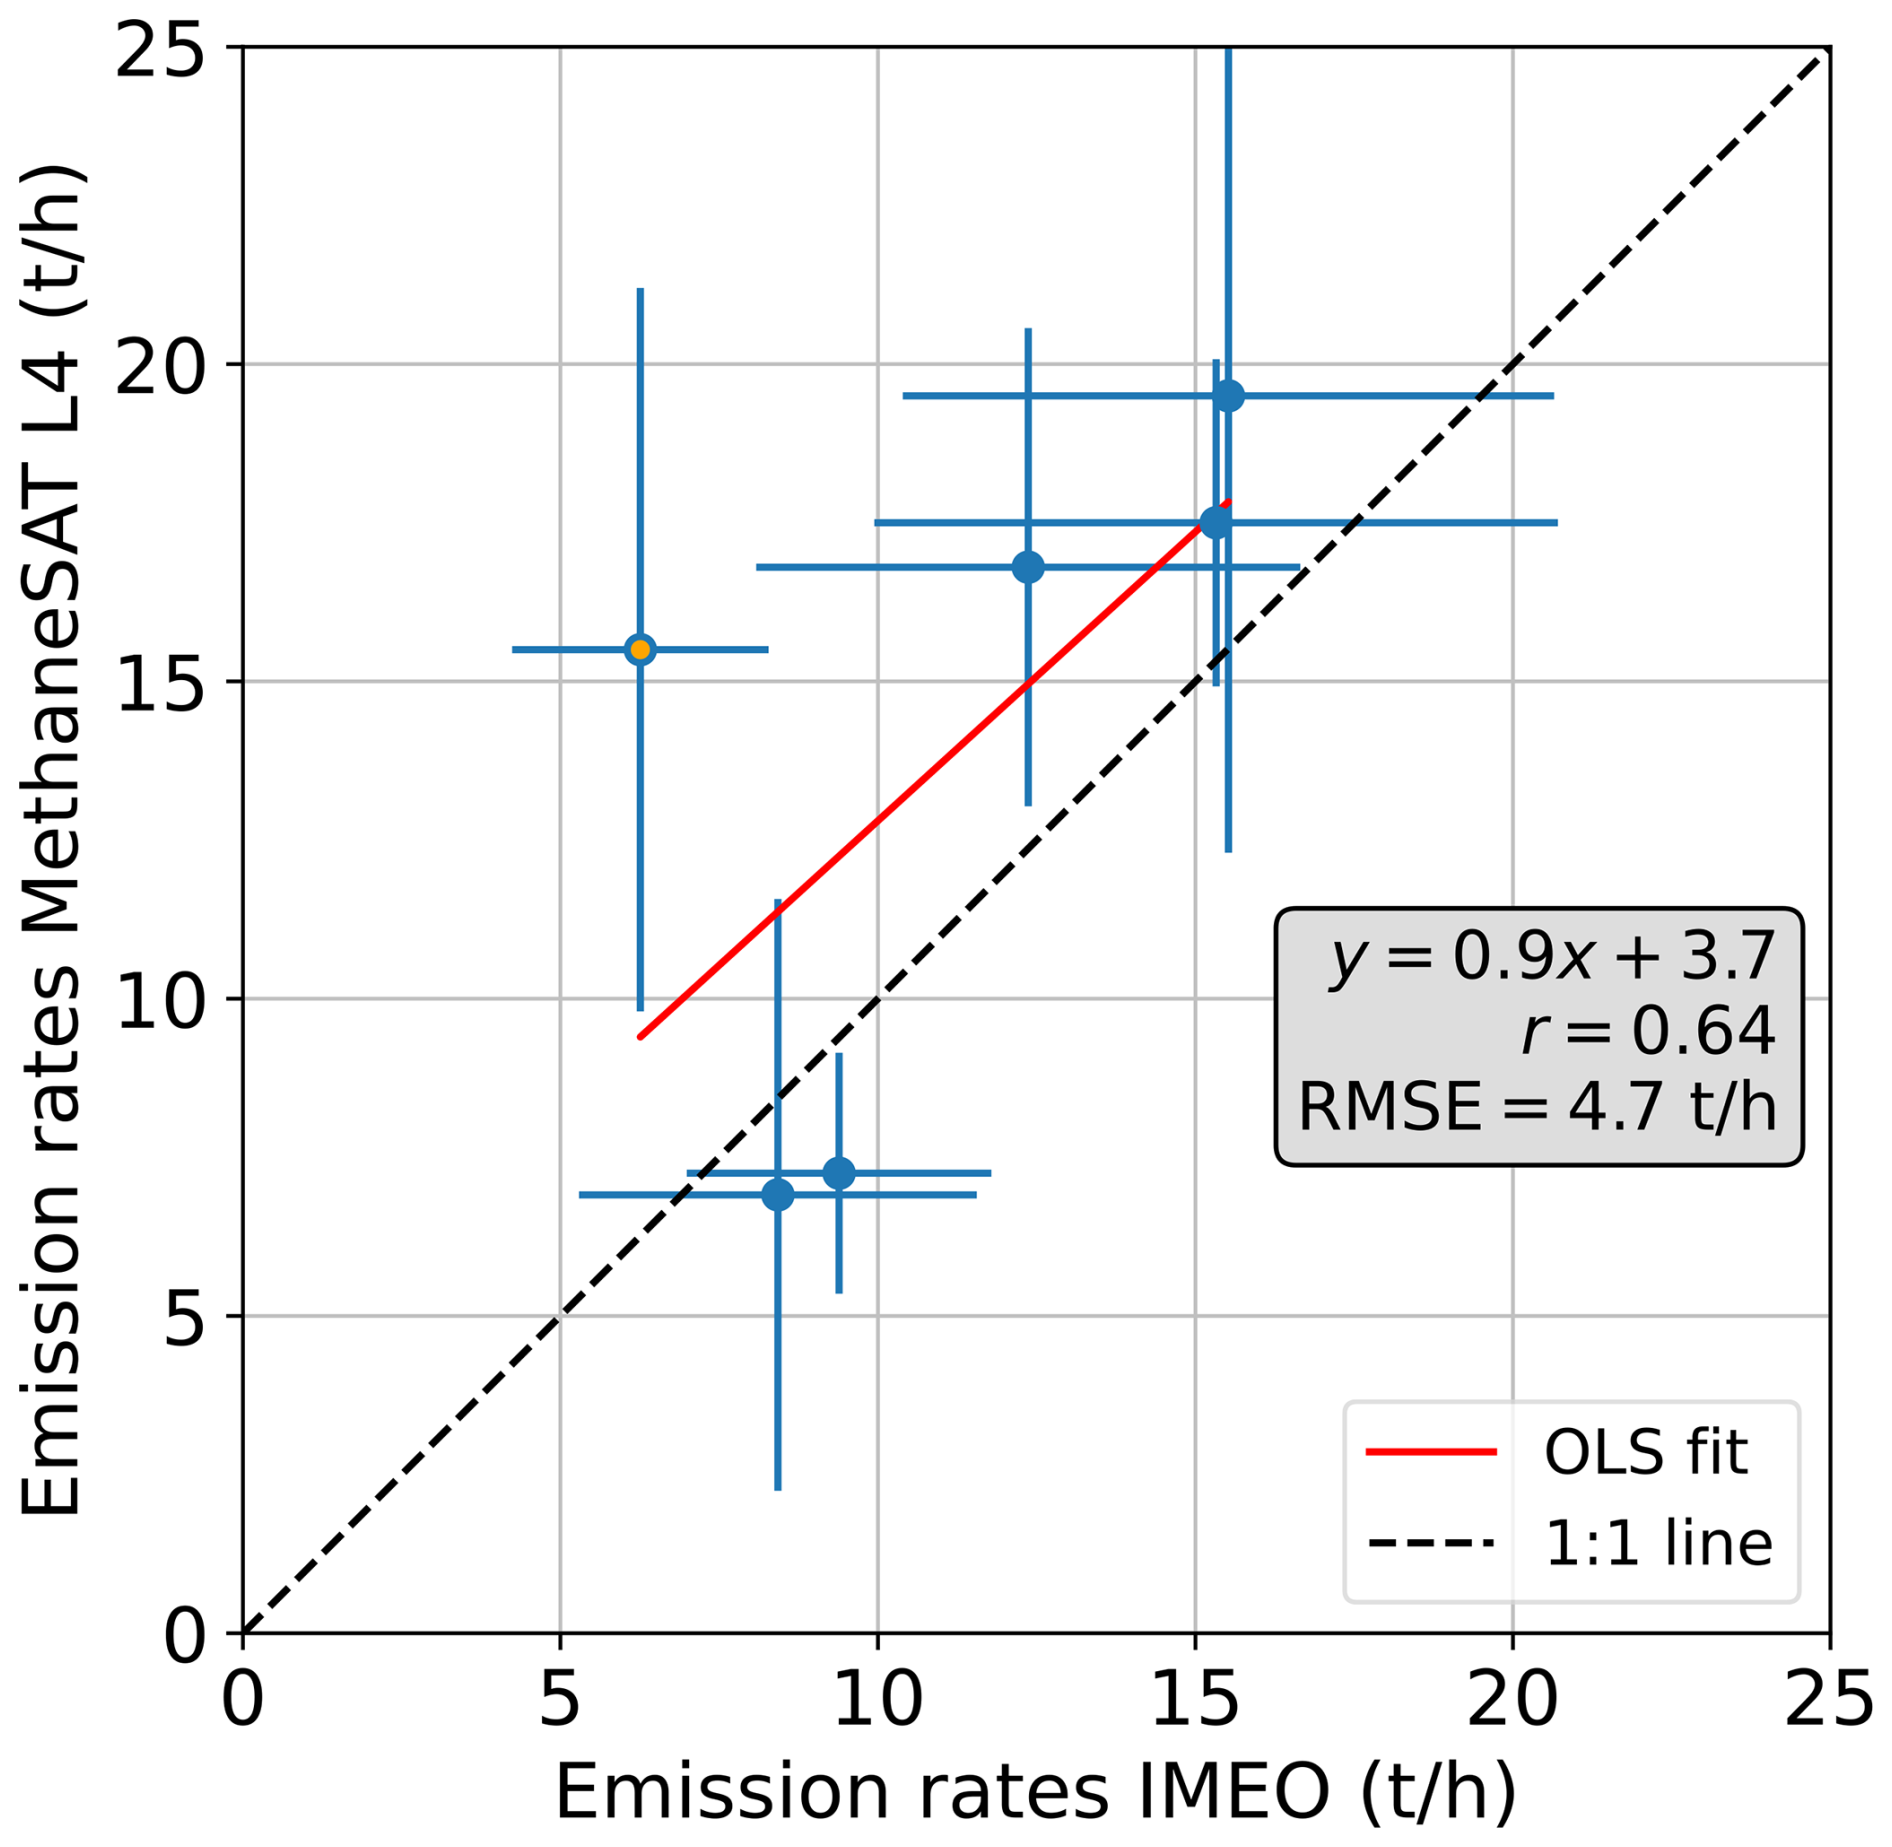
Figure 9Comparison between the source rate estimates in MethaneSAT's L4 plume product and those in the IMEO database for the South Caspian acquisition subset shown in Fig. 8. The point with a yellow filling results from merging several sources in the IMEO dataset into one.
Figure 8 shows a spatial subset of a MethaneSAT XCH4 map over the South Caspian basin, and the locations of the plumes obtained from both MethaneSAT's L4-plume product and the IMEO plume dataset. We find an overall good agreement in the source locations by the two datasets, although we also observe that one of the plumes detected by MethaneSAT corresponds to groups of several plumes in the finer-resolution IMEO dataset (i.e. the cluster of Landsat plume detections around 38.5° N, 54.2° E, see Fig. 8). This indicates that the MethaneSAT L4-plume product is merging several sources into one single plume in this dataset because of the relatively coarse spatial sampling. The low wind conditions in this dataset may exacerbate this issue, as they cause the emitted gas to accumulate and linger near the source rather than dispersing downwind, complicating the separation of single sources.
A comparison between the emission rates provided by each dataset is shown in Fig. 9. The point with a yellow filling depicts the MethaneSAT plume for which several sources in the IMEO dataset have been merged into one, as discussed before. We find a relatively high linear correlation between the two datasets despite the difference in the observation time. The point with the largest deviation between the two datasets is the one from the merged Landsat plumes, for which we can expect the largest uncertainty. The consistency of emission rate estimates from Landsat was assessed by Sherwin et al. (2023) using controlled releases. Considering this, the good correspondence between the MethaneSAT and Landsat plume datasets shown in Fig. 9 represents a first proof of the reliability of MethaneSAT's L4 plume quantifications. However, it must be stated that this comparison does not represent a validation of the MethaneSAT emission rates: first, the Landsat emission rates may have substantial errors (Sherwin et al., 2023); second, the emission rates from these super-emissions can vary strongly within the 3.6 h time difference between the MethaneSAT and Landsat acquisition.
3.1.6 Potential of ΔXCH4 maps from the matched-filter retrieval for improved plume detection
Comparisons between the matched-filter and the CO2-proxy retrievals are shown in Fig. 10 for two selected cases: a desert area in Hassi Messaoud (Algeria) with a number of relatively weak sources (see also Fig. 6), and a Permian Basin acquisition affected by scattered clouds and strong winds (see also Fig. 4). The XCH4 raster maps from the CO2-proxy retrieval are presented in raw and quality-masked formats (left and center column, respectively). In the second case, the quality mask included in MethaneSAT's L2 products has been applied to screen out low-quality pixels (including cloud-contaminated pixels) from the raw XCH4 maps. Relative ΔXCH4 maps from the raw matched-filter output (no quality mask applied) are shown on the right column for the two areas.
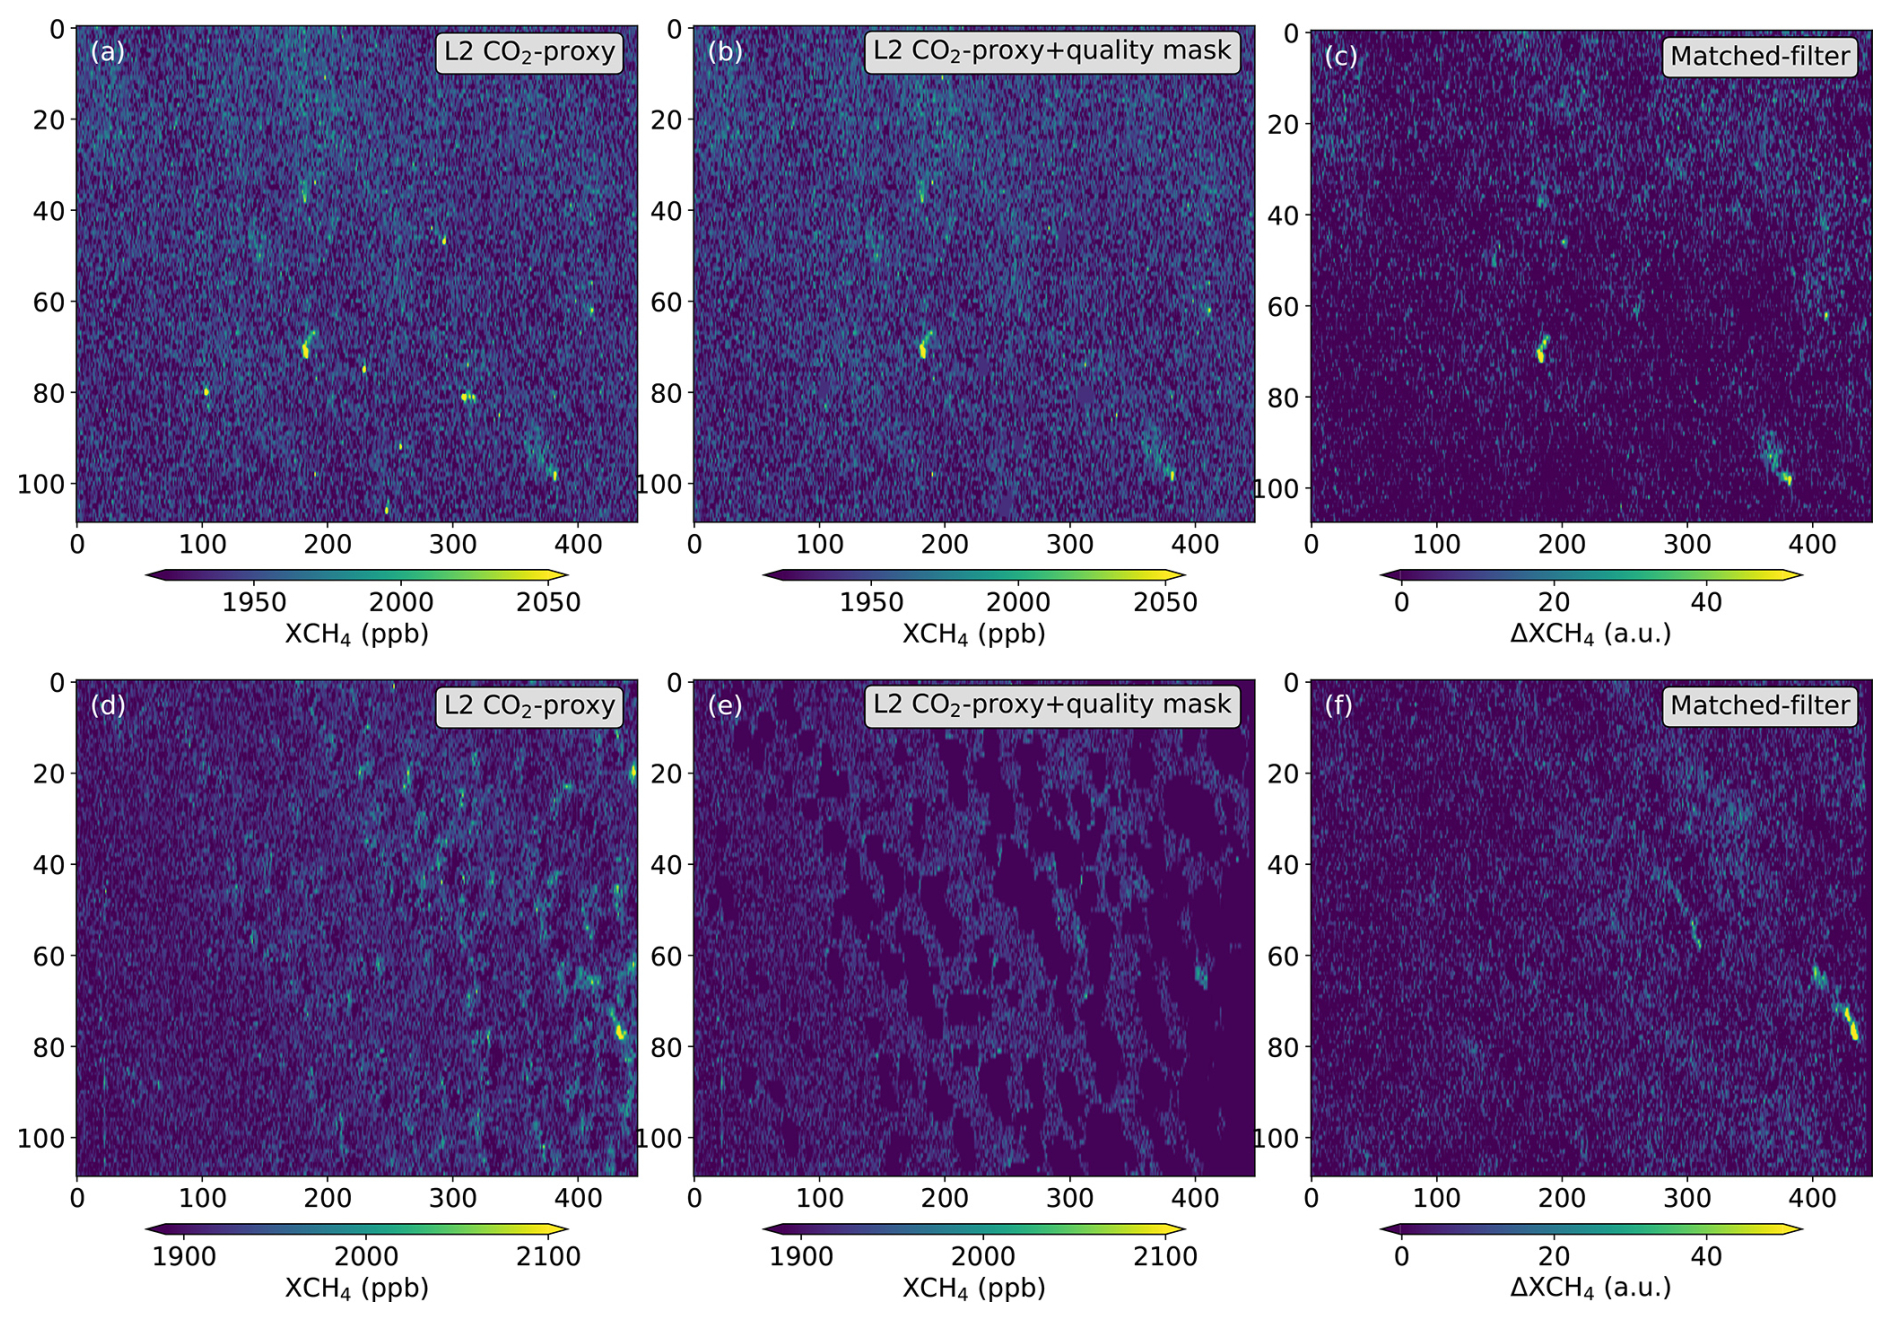
Figure 10Comparison of XCH4 subset maps derived with the MethaneSAT L2 CO2-proxy retrieval with XCH4 enhancement maps from the matched-filter retrieval. The raw and quality-masked versions of the L2 product are displayed on the first two columns, whereas the raw matched-filter output (in arbitrary units) is shown on the third column. The maps in the top row correspond to an acquisition over the Hassi Messaoud basin (Algeria) on 17 November 2024, and the ones in the bottom row are from a 14 June 2024 acquisition over the Permian-Delaware sub-basin (also shown in Figs. 3 and 4).
The visual comparison of the results from the two retrievals confirms that the matched-filter retrieval does offer an added-value for the detection of methane plumes, because of its enhanced signal-to-noise ratio and its lower sensitivity to clouds and artifacts. The lower noise in the ΔXCH4 maps from the matched-filter is visible in the Hassi Messaoud maps. The Hassi Messaoud case also shows that the raw XCH4 map from the CO2-proxy retrieval presents some artifacts resembling methane plumes (Fig. 10a) that are removed by the quality mask (Fig. 10b), whereas these do not appear in the raw ΔXCH4 map from the matched-filter (Fig. 10c). With respect to clouds and cloud shadows, we observe that the matched-filter retrieval is more robust against cloud contamination, leading to the detection of two plumes in the bottom-right quarter of panel Fig. 10f which would not be detectable in the L2 product, with or without the quality mask (Fig. 10d and e).
On the other hand, we have found the matched-filter retrieval to have strong variations in the absolute ΔXCH4 values with respect to the proxy retrieval, ranging from a 15 % underestimation with respect to the CO2-proxy retrieval for some pristine acquisitions (like the Hassi Messaoud dataset used in this test) up to a 2× difference in others with less favourable acquisition conditions (e.g. regions with vegetated surfaces and high cloud contamination). For this reason, we opt for using arbitrary units with the matched-filter ΔXCH4 maps in Fig. 10. The matched-filter ΔXCH4 maps are in general very useful for plume detection, but we do not use them to produce quantitative estimates of emission rates. Further work is required to understand this low-bias behavior of the matched-filter with MethaneSAT, which was not observed for MethaneAIR as reported by Guanter et al. (2025). The relatively low number of along-track samples available in MethaneSAT (about 500 pixels) could partly explain this low bias (Ayasse et al., 2023). A similar ΔXCH4 underestimation of MethaneSAT matched-filter retrievals and potential approaches to solve it are discussed in Yan et al. (2025).
3.2 Assessment of super-emissions across major methane hotspot regions around the world
In this section, we demonstrate the potential of MethaneSAT to map emissions from super-emitting point sources at the regional scale. To this end, we surveyed the full MethaneSAT data archive and selected representative XCH4 maps that illustrate (i) MethaneSAT’s ability to provide wide-area characterization of methane plumes over oil- and gas-producing basins with a high density of super-emitters (e.g., the South Caspian Basin in Turkmenistan and the Permian Basin in the United States), and (ii) super-emission events in regions that are comparatively under-represented in the existing literature (e.g., Maturin in Venezuela and Zagros-Foldbelt in Iran).
3.2.1 Super-emissions from Turkmenistan's South Caspian basin
Turkmenistan's South Caspian basin is considered the largest hotspot of O&G emissions in the world (Lauvaux et al., 2022). MethaneSAT's XCH4 maps provide a particular view of methane super-emissions in this basin thanks to MethaneSAT's wide coverage and relatively fine spatial resolution.
Figure 11 shows a time series of XCH4 maps over the region between September 2024 and May 2025. Red crosses mark the sources that were detected in the 23 September 2024 acquisition, but are plotted in all 6 panels to illustrate the persistency of the sources in the region within this time period, for which the 23 September acquisition is taken as a reference. A greater number of sources are found in the southern part of the South Caspian basin, although these sources are in general weaker (typically ranging between 5 and 25 t h−1) than the two detected in the north, which are estimated to be between 25 and 30 t h−1 on 23 September, and between 35 and 40 t h−1 on 18 November (see Fig. A1). In general, we observe a large degree of consistency in the sources that are active between September and November 2024 despite the variability introduced by changes in wind speed and direction. This confirms that the emissions in the South Caspian basin are not only very strong, but in general also very stable over long periods of time. However, we do observe some changes in the location of the sources located in the northernmost side of the region in the May 2025 acquisition, with the stronger sources being shifted westwards with respect to the September acquisition, which would indicate an evolution in the O&G extraction activity in the region between November 2024 and May 2025.
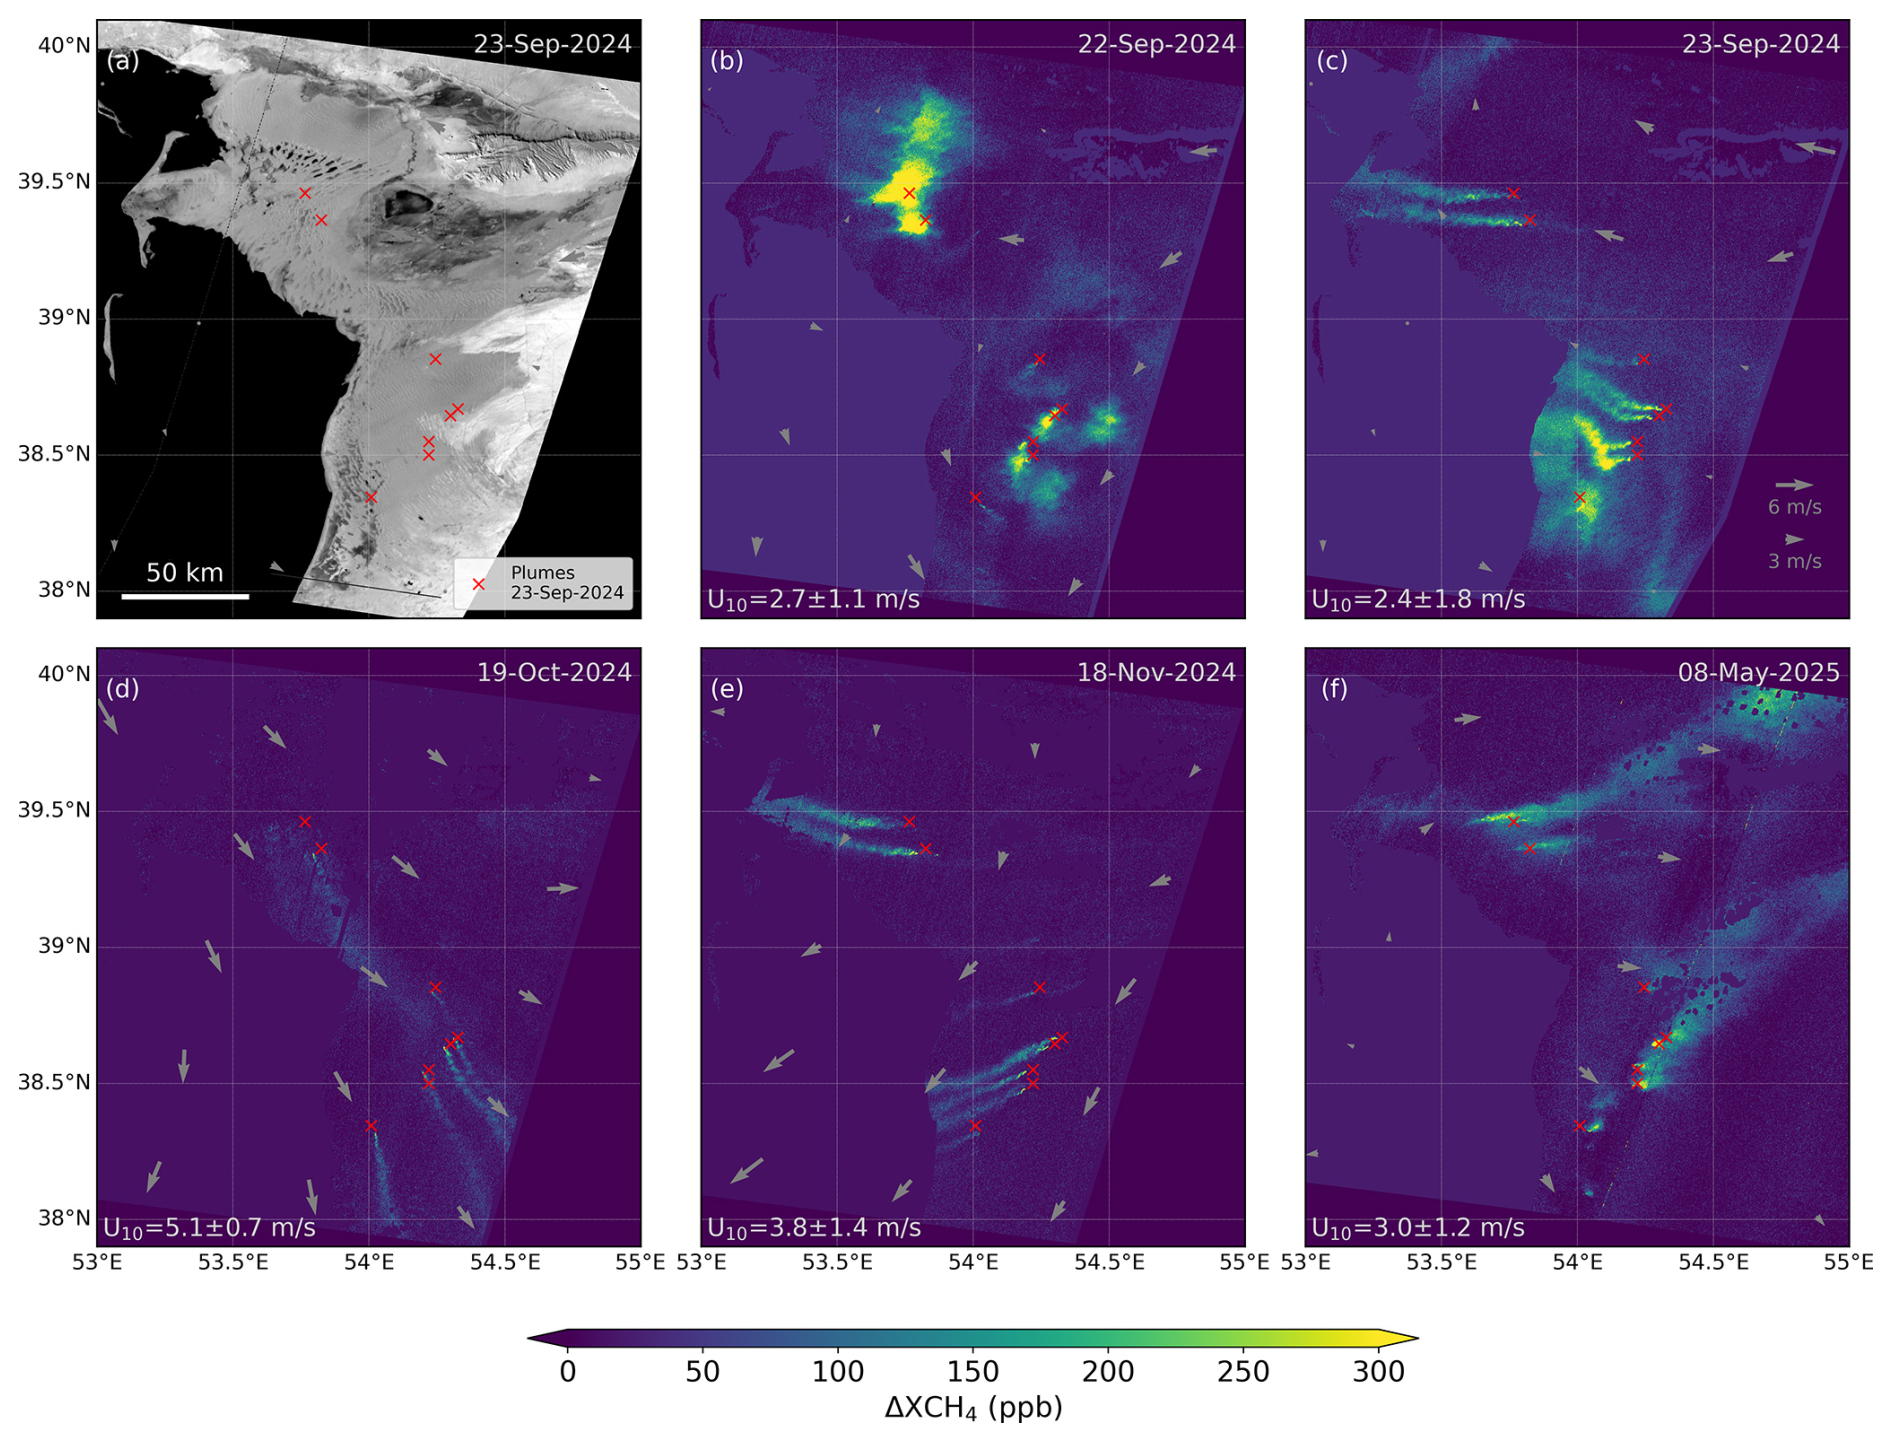
Figure 11Albedo and XCH4 enhancement maps (ΔXCH4) from MethaneSAT L2 products over the South Caspian basin for five different dates between September 2024 and May 2025. The 1606-nm albedo map for the 23 September acquisition is displayed in panel (a) and the ΔXCH4 maps are represented in panels (b)–(f). The mean and standard deviation of the wind speed (U10) from each scene is provided at the bottom-left part of each panel. The gray arrows indicate the wind speed and direction. A key for the estimation of wind speed from the arrow size is provided in panel (c). The red crosses mark the origin of the plumes detected from the 23-September-2024 dataset, and are represented in all panels as a reference for active sources within this region and time period.
We acknowledge that some of these plumes may combine emissions from several sources, as also discussed for the same 23 September acquisition in Sect. 3.1.5, so it is not clear whether it is always the exact same sources that are active, or neighboring sources within the same area. Adding plume detections from higher-resolution satellite instruments, such as those included in the IMEO plume database (United Nations Environment Programme, 2025), would help to better understand these patterns.
3.2.2 Super-emissions from the US' Permian Midland sub-basin
The Permian Basin, located between New Mexico and Texas, in the USA, is another major O&G methane super-emission hotspot. Even though O&G operations in the Permian Basin are much more regulated than in Turkmenistan, methane super-emissions in the Permian Basin are also widespread because of the high production activity in the region.
The Permian Basin is comprised of two main sub-basins, namely the Delaware, in the western portion, and the Midland, in the eastern portion. High-resolution airborne surveys and inversion data from TROPOMI show spatial emission hotspots in both sub-basins, although the Delaware sub-basin is the one for which higher levels of methane emissions are expected according to previous reports based on airborne and satellite data (Zhang et al., 2020; Cusworth et al., 2021b; Varon et al., 2023; Guanter et al., 2025). MethaneSAT XCH4 maps for the Delaware sub-basin have been discussed earlier in this study, including a medium-wind acquisition over this sub-basin from which up to 10 plumes with emission rates between 700 and 3500 kg h−1 where detected (see Figs. 4a and A2).
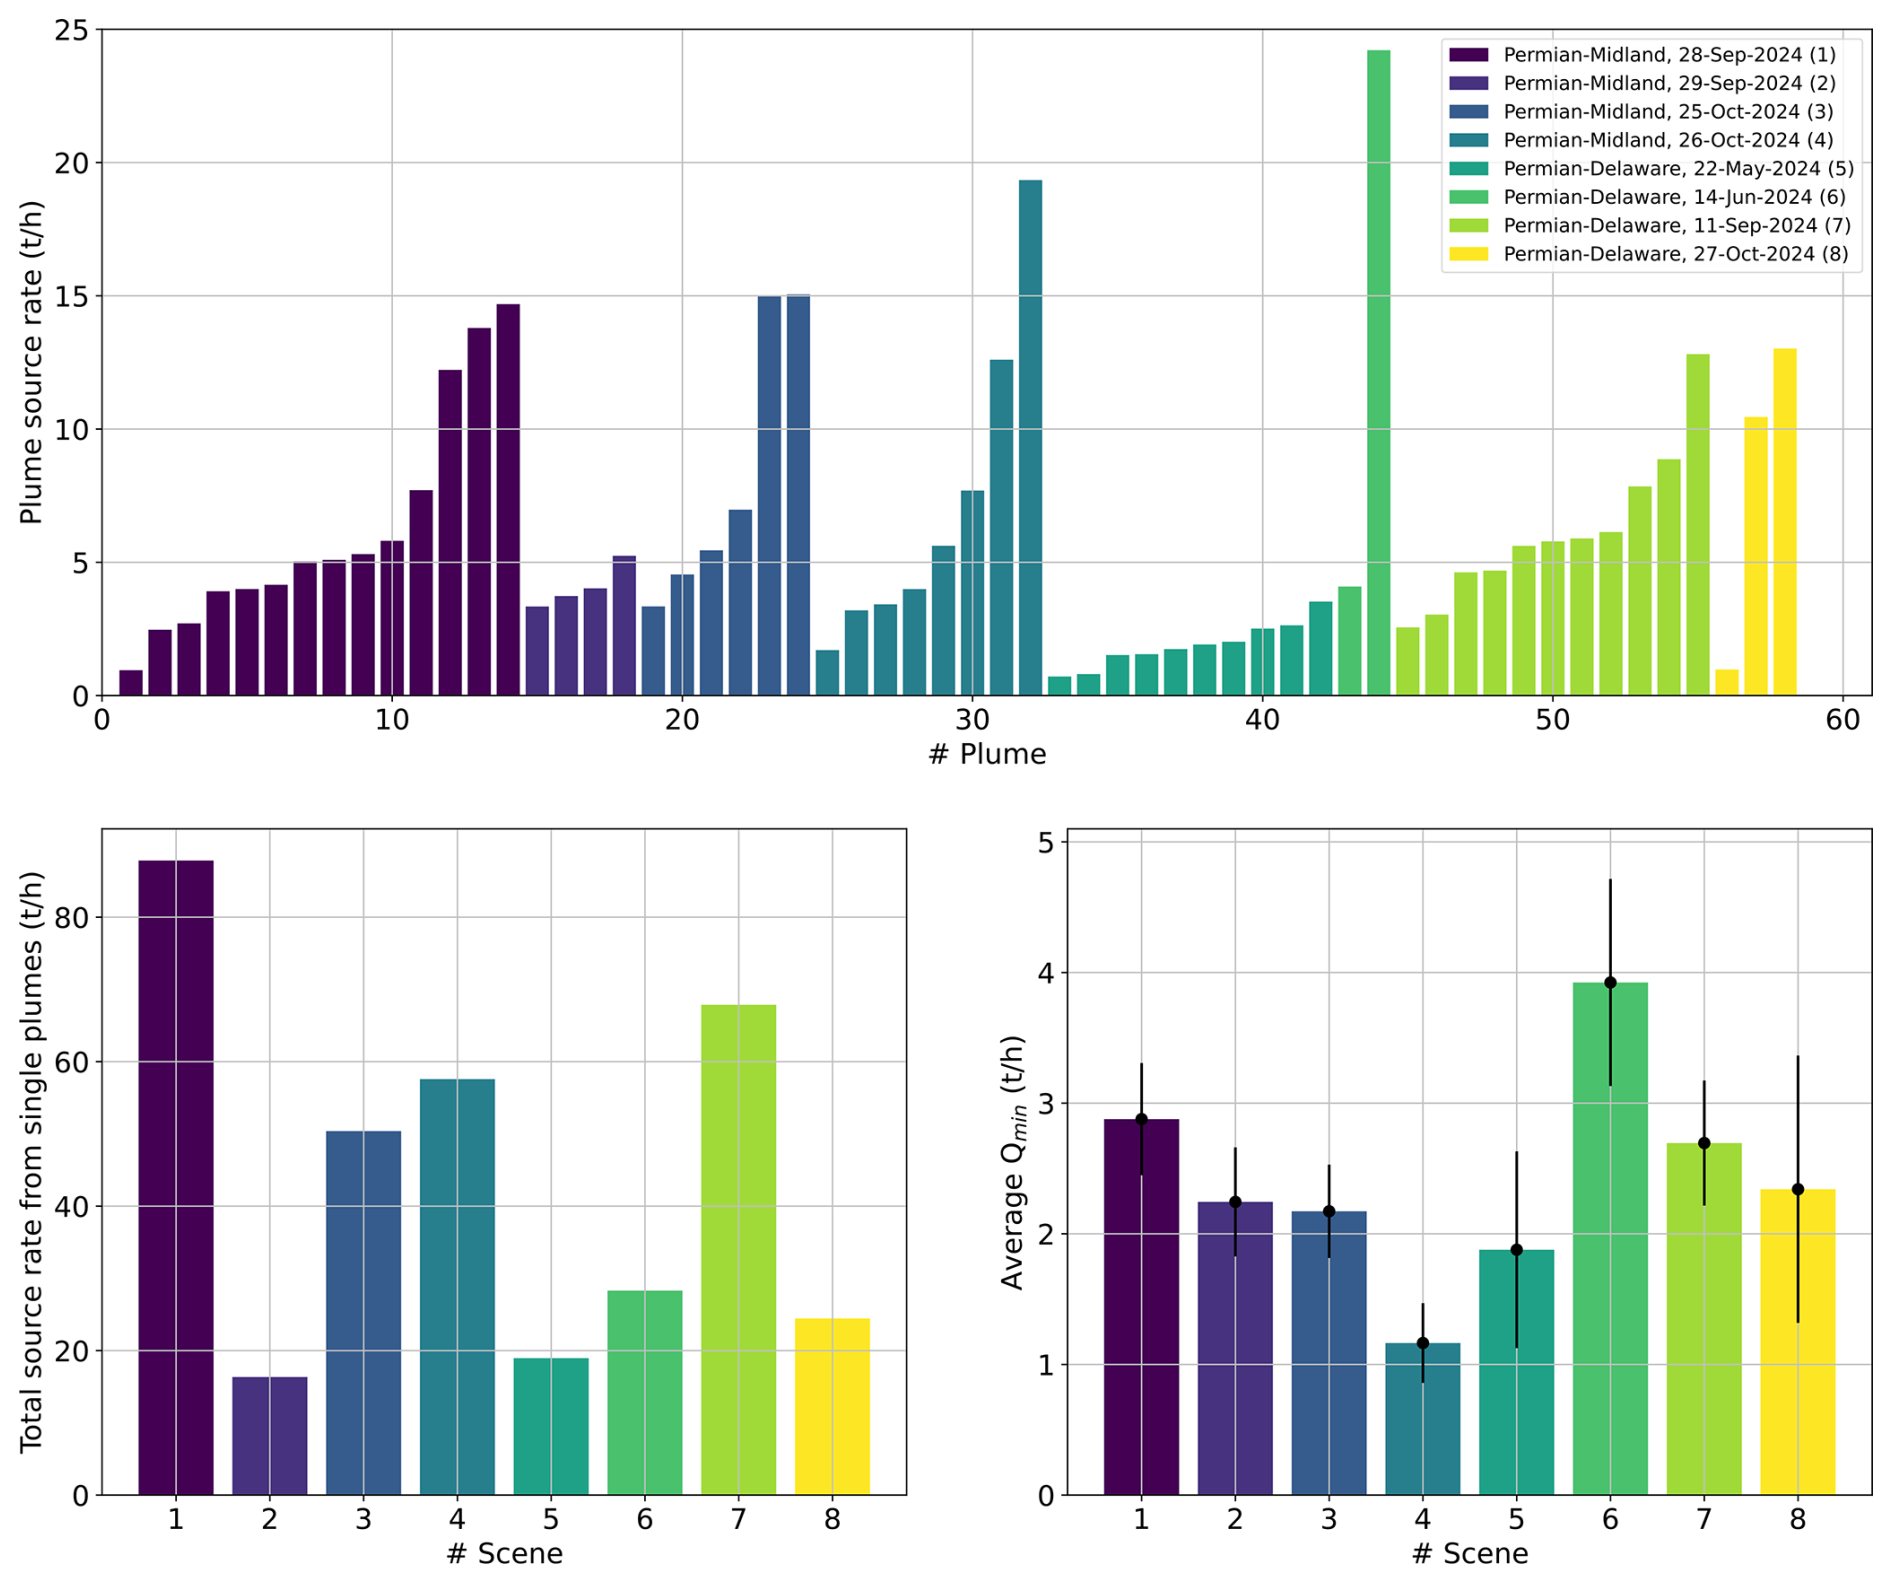
However, our analysis of MethaneSAT data over both sub-basins shows that the Midland sub-basin presents an outstanding concentration of high-emitting point sources in September and October 2024. This is illustrated in Fig. 12, which presents XCH4 maps over an area of about 100×100 km2 sampling the Midland sub-basin on four different days (two pairs of consecutive days). A high number of strong point sources is found in three of the four acquisitions (see Fig. A2). For example, 14 plumes with emission rates between 0.5 and 15 t h−1 (5 of which have an emission rate greater than 5 t h−1) can be found in the 28 September 2024 map (Fig. 12a). These numbers are substantially greater than what has been found for the Delaware sub-basin using MethaneSAT data, and they also exceed those in other studies of super-emitters in the Delaware sub-basin. For example, Guanter et al. (2025) detected hundreds of plumes in the Delaware sub-basin with MethaneAIR in 2021 and 2023, but only one exceeded 2 t h−1; Irakulis-Loitxate et al. (2021) used space-based imaging spectrometers detected 37 plumes across the Delaware sub-basin combining several dates in 2020, but only 3 of them had emission rates greater than 5 t h−1. A very small fraction of plumes above 5 t h−1 are also reported in the airborne survey by Cusworth et al. (2021a) covering both the Delaware and Midland sub-basins.
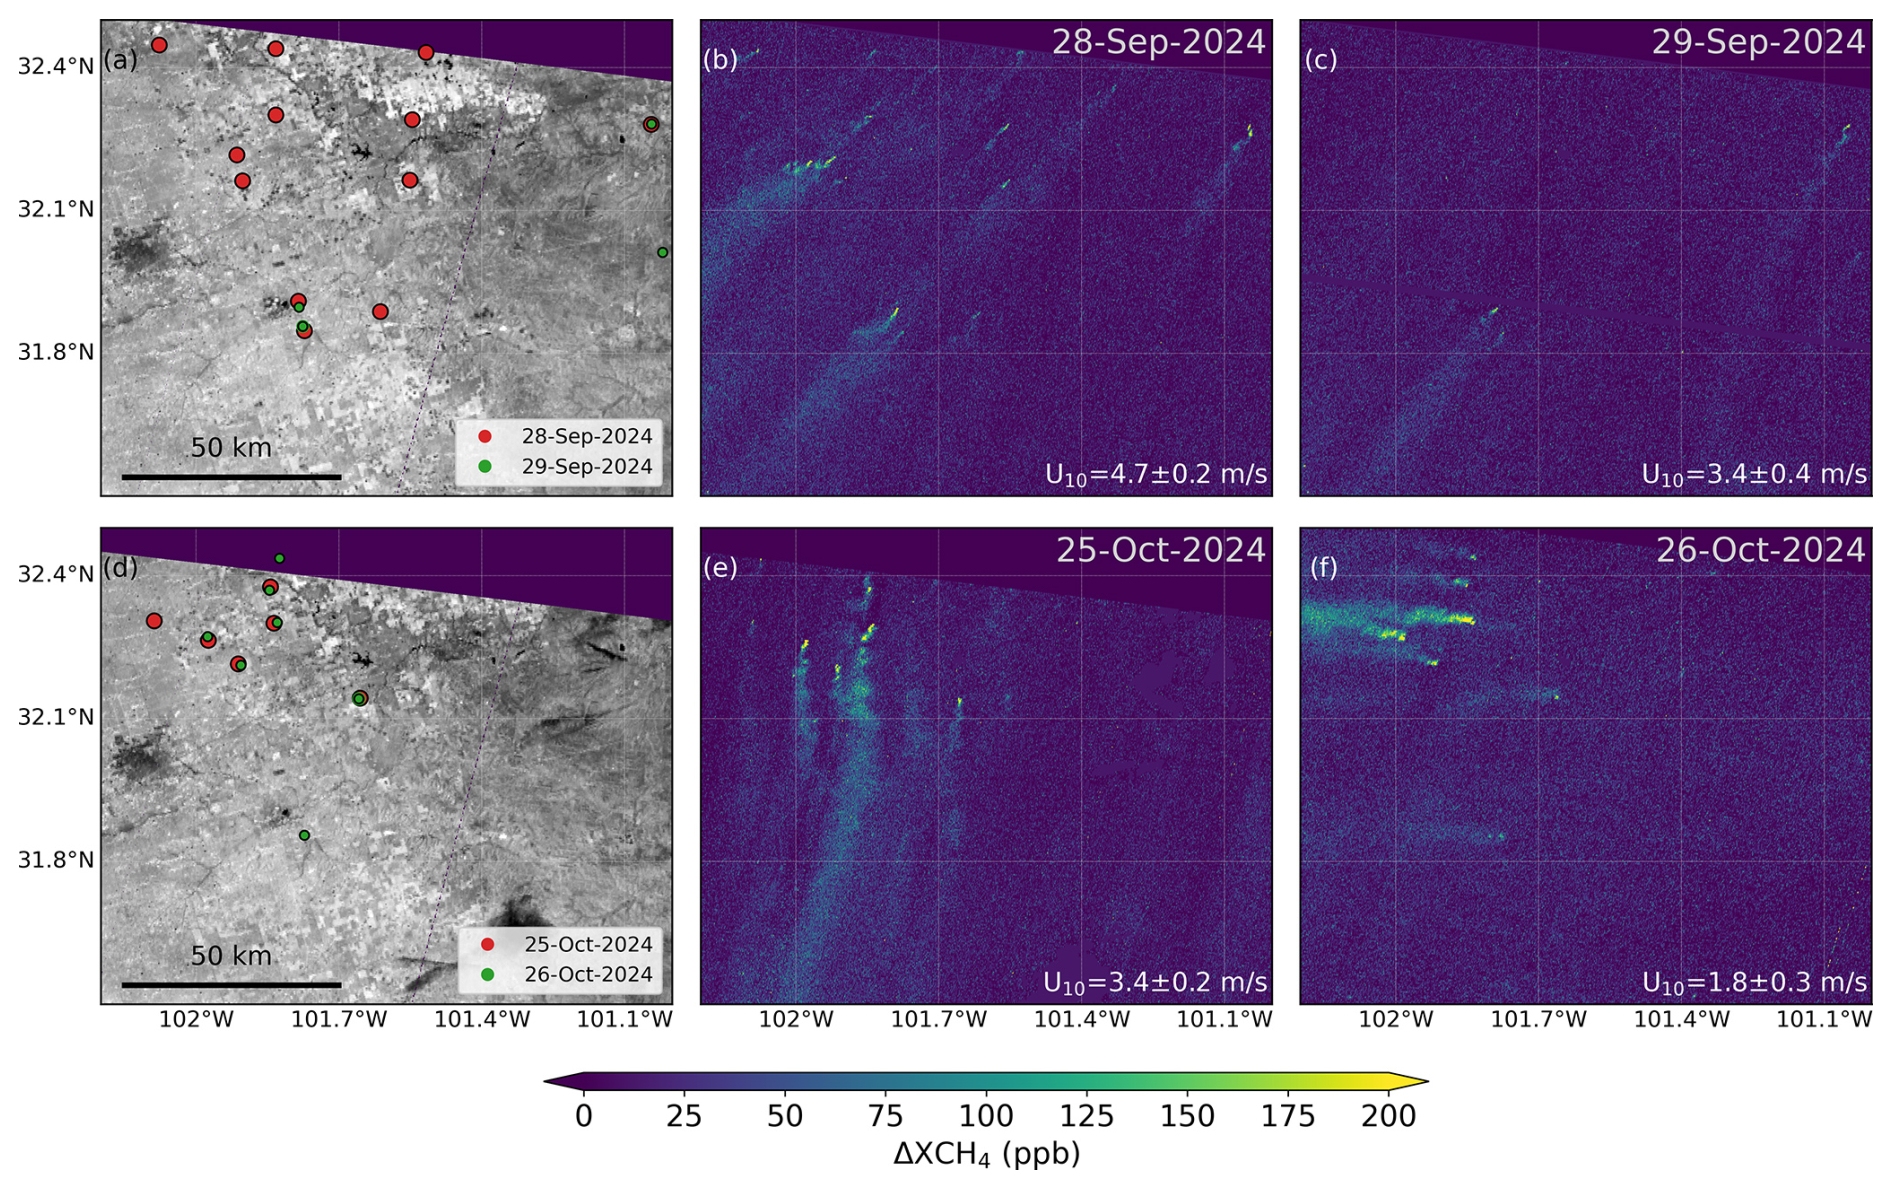
Figure 12XCH4 enhancement maps (ΔXCH4) from MethaneSAT L2 products over the Permian-Midland sub-basin for two pairs of consecutive days. The mean and standard deviation of the wind speed (U10) from each scene is provided at the bottom-right part of each panel. The plumes detected from each pair of acquisitions are depicted over the albedo maps represented on the left column.
Considering how clear those plumes appear in the MethaneSAT maps, we have confidence that the high rates that we have estimated are real. Also, zooming in over single plumes, we do not find evidence of the merging of several sources. The fact that many of the plumes are from the same sources on subsequent days with different patterns in the winds gives us some confidence that the reported plumes are from single sources are not coincidental aggregation of flux from multiple sources.
The dynamics of these super-emissions in the Midland sub-basin between September and October 2024 are also intriguing: whereas the sources appear to be very stable between the two consecutive acquisitions on 25 and 26 October, the opposite happens for those in September, when the 14 sources detected on 28 September are reduced to only four in the next day. This variability can also be seen in the total point source emissions reported in Fig. A2: the maximum total point source emission is found on 28 September (87.8 t h−1), which is reduced by a factor ∼5x on the next day (16.3 t h−1). Intermediate and more similar values are found on 25 and 25 October (50.4 and 57.6 t h−1). The strong reduction in emissions from 28 to 29 September are also found in the corresponding total regional fluxes, which are included in the L4 products available in MethaneSAT's Data Portal (MethaneSAT, 2026): the total emissions are 180 t h−1 for 28 September, and 140 t h−1 for 29 September. It must be remarked that this total emission estimate combines the detected point source emissions with the total area emissions estimated through a full atmospheric model inversion. Interestingly, the total emission rate estimated from the 26 October scene, 192 t h−1, is slightly higher than the one obtained for 28 September, unlike what happens when only point sources are computed. There is no total emission estimate from the 25 October scene, as the L4-total flux product from this date did not pass the quality control.
The strong variability found between the two September scenes can not be related to an increase in the plume detection limits associated to wind speed, as this is actually lower on 29 September than in the day before (see the mean Q values in Fig. A2), so the abrupt change in emissions may be explained by the particular operations taking place in the area between those two days. Prior research has shown variation in Permian emissions connected with takeaway capacity and concurrent variation in oil prices (Lyon et al., 2021). Before additional pipeline capacity came online in November 2024, west Texas natural gas spot prices were frequently negative throughout the summer and early fall of 2024, creating an environment where Permian operators lost money to transport natural gas (US Energy Information Administration, 2025). We note that 76 % (23/30) of the marked plumes (Fig. 12) originated from midstream facilities, including compressor stations, processing plants, and gathering pipelines. The heighted rate of plumes from midstream facilities may be indicative of the beforementioned limitations in takeaway capacity for the broader Permian at that time of the year.
3.2.3 Global view of O&G methane super-emitters based on MethaneSAT
We combined the information on methane enhancements included in the IMEO plume database with our own analysis of the MethaneSAT data archive in order to select the O&G regions in the world with a persistent presence of super-emissions (Fig. 2). Sample XCH4 enhancement maps from the 6 regions where we found the strongest presence of high-emitting point sources in the world are shown in Fig. 13. The 9 panels show XCH4 enhancements represented with the same colorbar and cover the same area (1.5°×1.5°), which enables the visual comparison of the different maps.
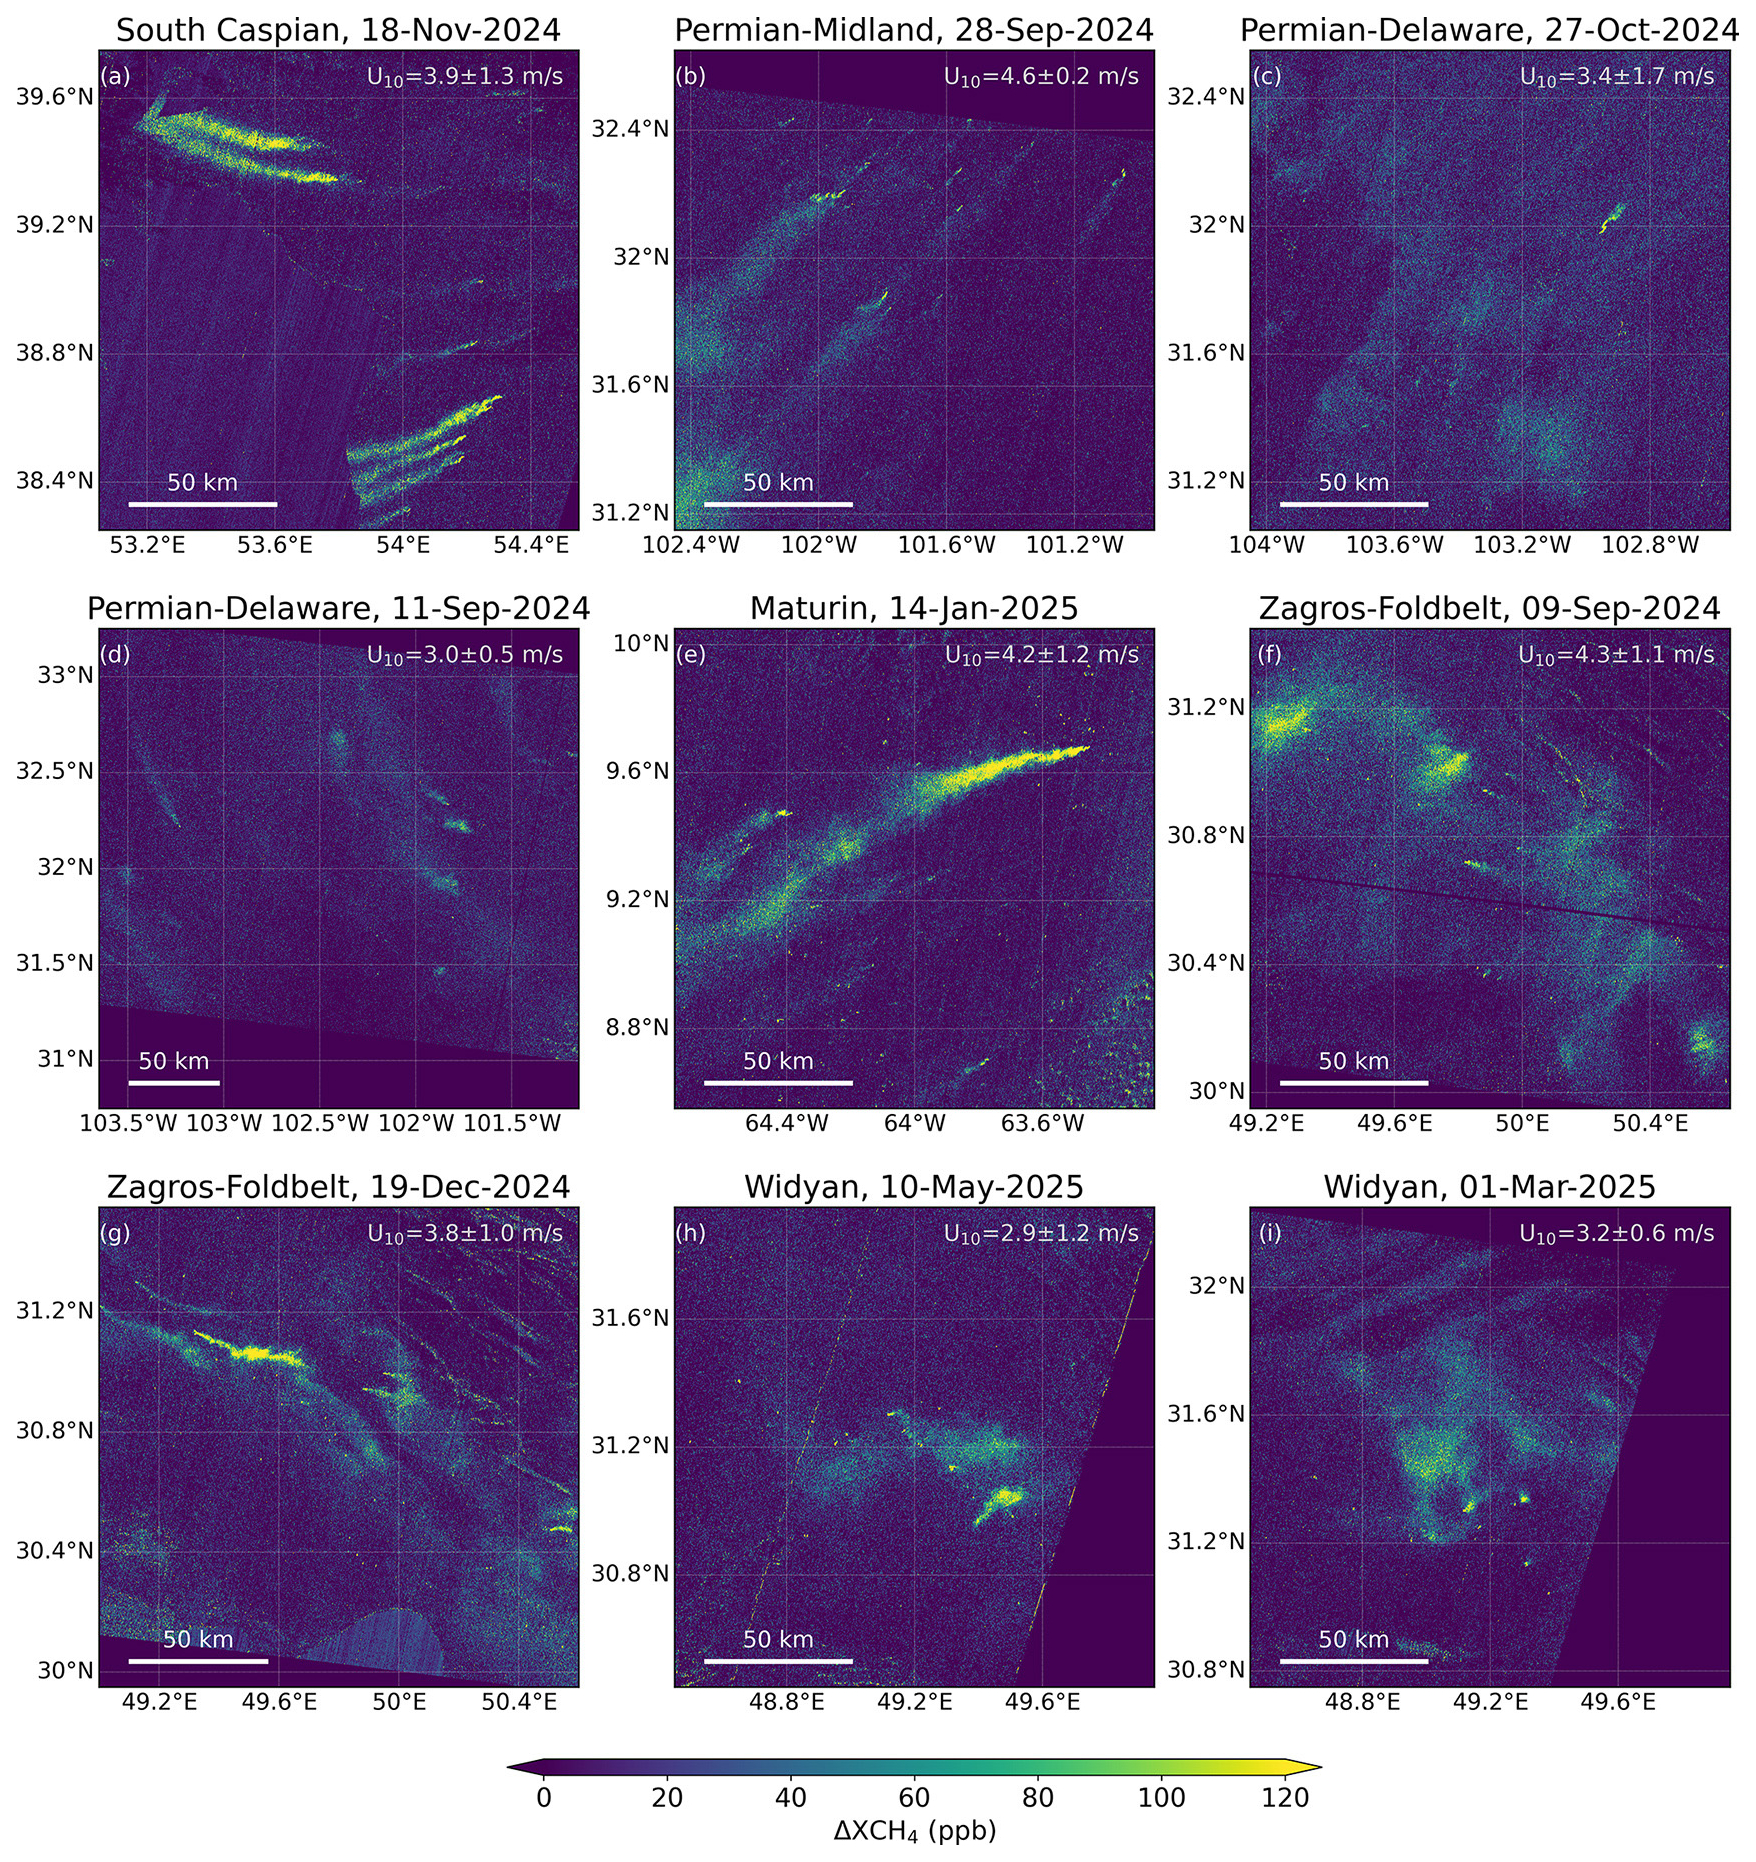
Figure 13XCH4 enhancement maps (ΔXCH4) from MethaneSAT L2 products over regions where a high concentration of super-emitters are persistently active. The mean and standard deviation of the wind speed (U10) from each scene is provided at the top-right part of each panel. All maps are represented with the same color scale and span approximately 150×150 km2 to enable direct visual comparison.
The South Caspian and Permian Midland maps were already presented in Figs. 11 and 12, and are reproduced in Fig. 13a and b as a reference for comparison with the other basins. Maps over the Permian Delaware sub-basin showing a number of plumes are represented to cover the three areas in the world where the highest concentration of super-emissions can be expected (Fig. 13c and d). In addition, maps over three other regions are included in the center and bottom row of Fig. 13: the Maturin basin in Venezuela and the Zagros-Foldbelt and the Widyan basins in Iran. Although these three basins are also depicted by the IMEO database as regions with strong methane emission activity (Fig. 2), the regional-level snapshot of XCH4 enhancements provided by MethaneSAT suggests that the super-emissions from those regions are outstanding. For example, five sources with emission rates higher than 5 t h−1 are found to be simultaneously active across the Maturin basin (see Fig. A1 and Warren et al., 2026), whereas three sources with emission rates greater than 20 t h−1 are found in the Zagros-Foldbelt basin on 19 December 2024 (Fig. A1). Several very strong point sources are also identified in the Widyan scenes. The constant presence of strong super-emissions in these six regions is confirmed by several other MethaneSAT acquisitions over each of the basins. The very large emissions from Maturin, Zagros-Foldbelt and Widyan have received limited attention in previous studies, but the MethaneSAT XCH4 data indicate that these areas warrant further targeted investigation.
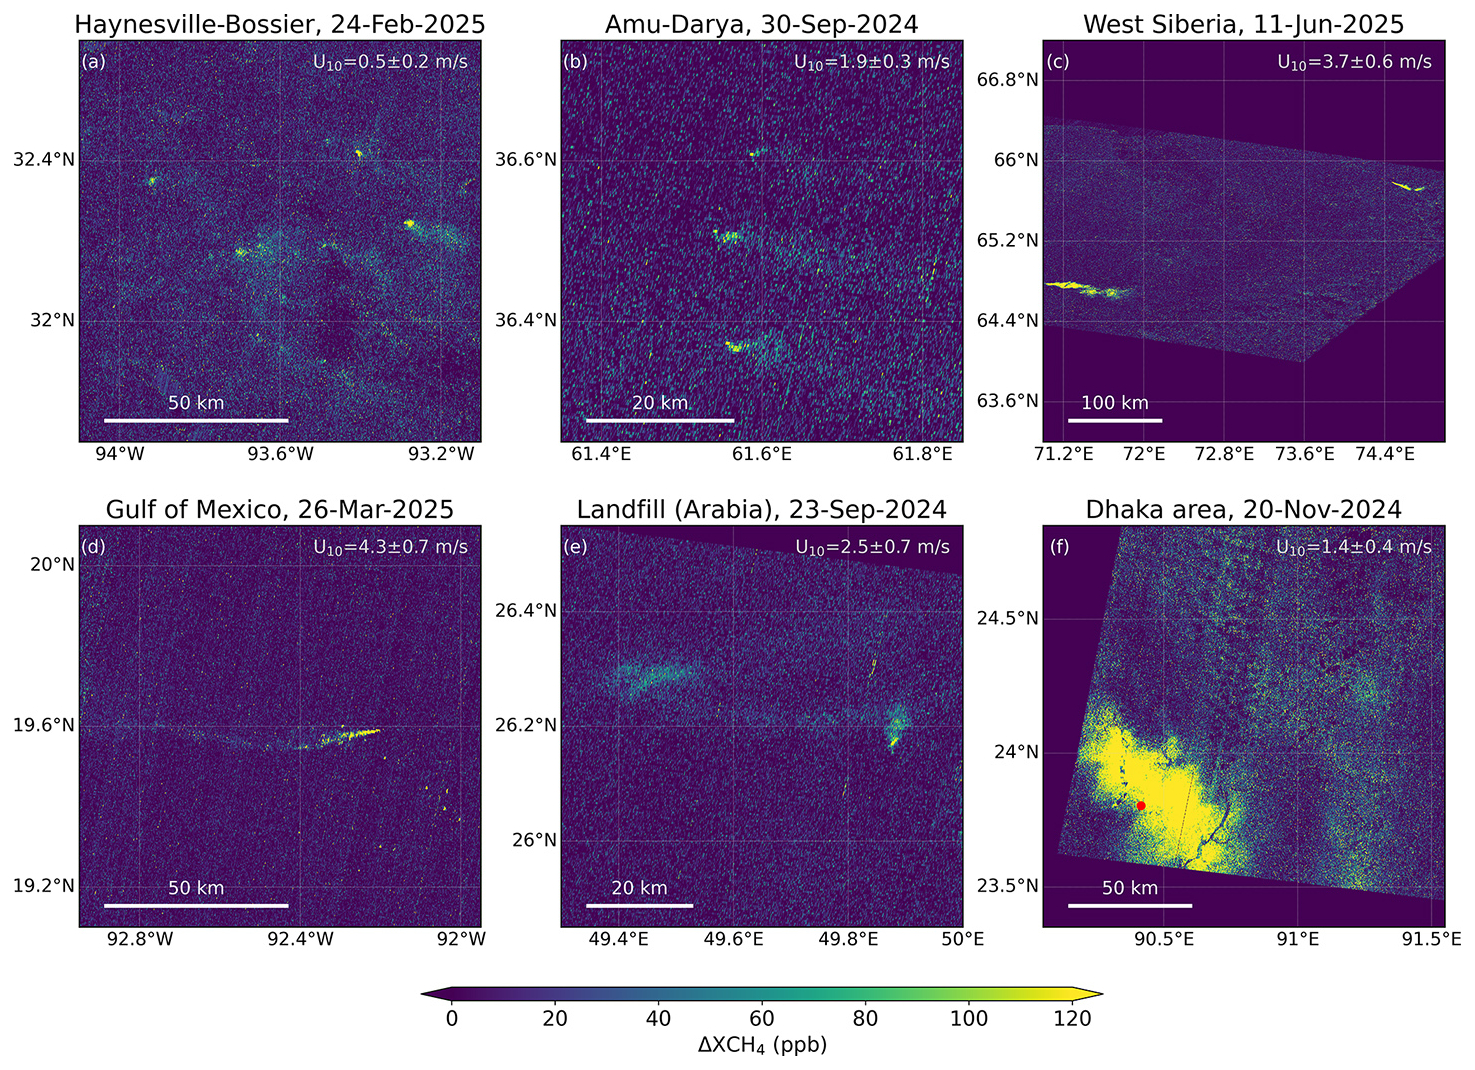
Figure 14ΔXCH4 maps from MethaneSAT showing plumes from a range of regions, sources and acquisition conditions.
Finally, methane concentration maps derived from MethaneSAT observations over other sites for which interesting methane emission events have been found, are presented in Fig. 14.Figure 14a shows a number of relatively small plumes (range between 500 and 2500 kg h−1, see Fig. A1) across the Haynesville-Bossier basin. This range of emissions fits the emission rates typically detectable with public point-source imagers (e.g. EnMAP, EMIT, and Sentinel-2) over semi-arid areas, but they would have much higher detection limits over vegetated surfaces like the ones in this Haynesville-Bossier site. The low-wind conditions for this Haynesville-Bossier observation (0.5±0.2 m s−1) are similar to the ones over the Appalachian region shown in Fig. 1, leading to low detection limits despite the fact that the high fraction of vegetated cover makes this region to be less optimal for plume detection than arid and desert sites. Regarding other acquisition conditions, Fig. 14b shows plumes from three active sources between 1300 and 4000 kg h−1 (see Fig. A1) within about 30 km in the Amu Darya basin (Eastern Turkmenistan), which was also identified as a global hotspot with TROPOMI (see Fig. 2). Figure 14c shows two plumes separate sources, in this case with very high emission rates (greater than 100 t h−1) found at high latitudes, in West Siberia. No plumes from these sources were found from an overpass of the VIIRS instrument earlier on that day using the methods by de Jong et al. (2025), which suggests that this could have been a short-lived event. We speculate that those two concurrent, large and possibly transient plumes may be caused by pipeline maintenance works in the area. Another very strong emission from an O&G facility is shown in Fig. 14d. It corresponds to an O&G extraction platform near the coast of Campeche, in the Mexican side of the Gulf of Mexico. Interestingly, this plume is not from the nearby Zaap-C platform, from which persistent and very large emissions (sometimes greater than 100 t h−1) have been detected in the past (Irakulis-Loitxate et al., 2022a). A different MethaneSAT acquisition does show a plume from the Zaap-C platform (data not shown). The last two panels in Fig. 14 show examples of emissions from the waste sector: a large plume from a landfill in Saudi Arabia, close to Bahrain, is represented in Fig. 14e. An emission rate of 15.2 t h−1 was estimated for this source, which is consistent with emission estimates for this landfill from high-resolution missions. Lastly, Fig. 14f shows a massive methane enhancement around Dhaka city, in Bangladesh, that we attribute to a combination of several landfills and dump sites across the city. Similar very large methane enhancements have been found over this site in other MethaneSAT observations. These are probably among the largest methane enhancements found in the entire MethaneSAT archive, and the site was also listed as one of the largest and most persistent methane emitting regions in the world by Vanselow et al. (2024).
The XCH4 maps from MethaneSAT shown in the previous figures offer a unique combination of wide spatial coverage, medium resolution and low sensitivity to surface-related artifacts. This complements the data from available point source imagers, which generally have a finer spatial sampling at the expense of a narrower coverage and a higher occurrence of false positive caused by surface structures.
In this study we have provided a first assessment of MethaneSAT's capacity to monitor methane super-emitters from O&G basins around the world. We have first characterized the potential and limitations of MethaneSAT for the detection and quantification of methane plumes, and have then exploited the existing MethaneSAT data archive to analyze the super-emissions (intensity and persistency of high-emitting point sources) from key O&G emission areas around the world.
Our results illustrate that MethaneSAT's observations are complementary to those from TROPOMI and the group of high-spatial resolution missions which are being widely used for the detection and quantification of single plumes from point sources. This is facilitated by MethaneSAT's wide area coverage, medium spatial resolution and high sensitivity to methane, which result into accurate and precise XCH4 retrievals and a low sensitivity to the surface background, enabling robust plume detection over vegetated and urban surfaces. Thanks to these characteristics, MethaneSAT can provide a new view on regional emissions, better accounting for diffuse emissions from distributed infrastructure like pipelines, compressor stations, or wetlands, bridging the gap between fine-scale detection (like GHGSat), and global-scale monitoring (like TROPOMI).
We also observe some limitations of MethaneSAT for point-source analysis. These are mostly interposed by MethaneSAT's coarser spatial sampling as compared with point source imagers, which may challenge the separation of individual plumes inside larger methane enhancements and the attribution of plumes to single sources. We have also found that wind speed plays a more important role in the detection and interpretation of methane plumes with MethaneSAT than in the case of higher resolution missions. These findings suggest that a synergistic use of MethaneSAT with available point-source datasets (e.g. the IMEO plume dataset being developed by the IMEO-MARS program of the UNEP) is needed for a full characterization of the point sources across a given O&G basin.
In addition to evaluating MethaneSAT's performance for point source work, we have used the available data archive to further investigate emissions across global O&G methane emission hotspots. We have evidenced the high number and persistency of very strong sources in Turkmenistan's South Caspian Basin, and have revealed the high concentration of super-emitters within the Permian Basin's Midland sub-basin, which appears to be a new development in the region, as emissions in the Permian Basin were traditionally dominated by those from the Delaware sub-basin. Also, we have identified three other basins, namely Maturin in Venezuela and Zagros-Foldbelt and Widyan in Iran, where very strong point sources have been detected along a series of MethaneSAT observations. These results provide the basis for a number of potential follow-up studies focused on those regions.
Despite the important information on high-emitting point sources that MethaneSAT is able to convey, we acknoweldge that super-emissions only represent a fraction of the total emissions from O&G basins (Omara et al., 2022; Williams et al., 2025). MethaneSAT's high-accuracy XCH4 retrievals also enable the inversion of regional methane fluxes, which is part of the MethaneSAT L4 product. The combination of those basin-level fluxes with the super-emissions discussed in this study is needed for a full picture of O&G emissions around the planet.
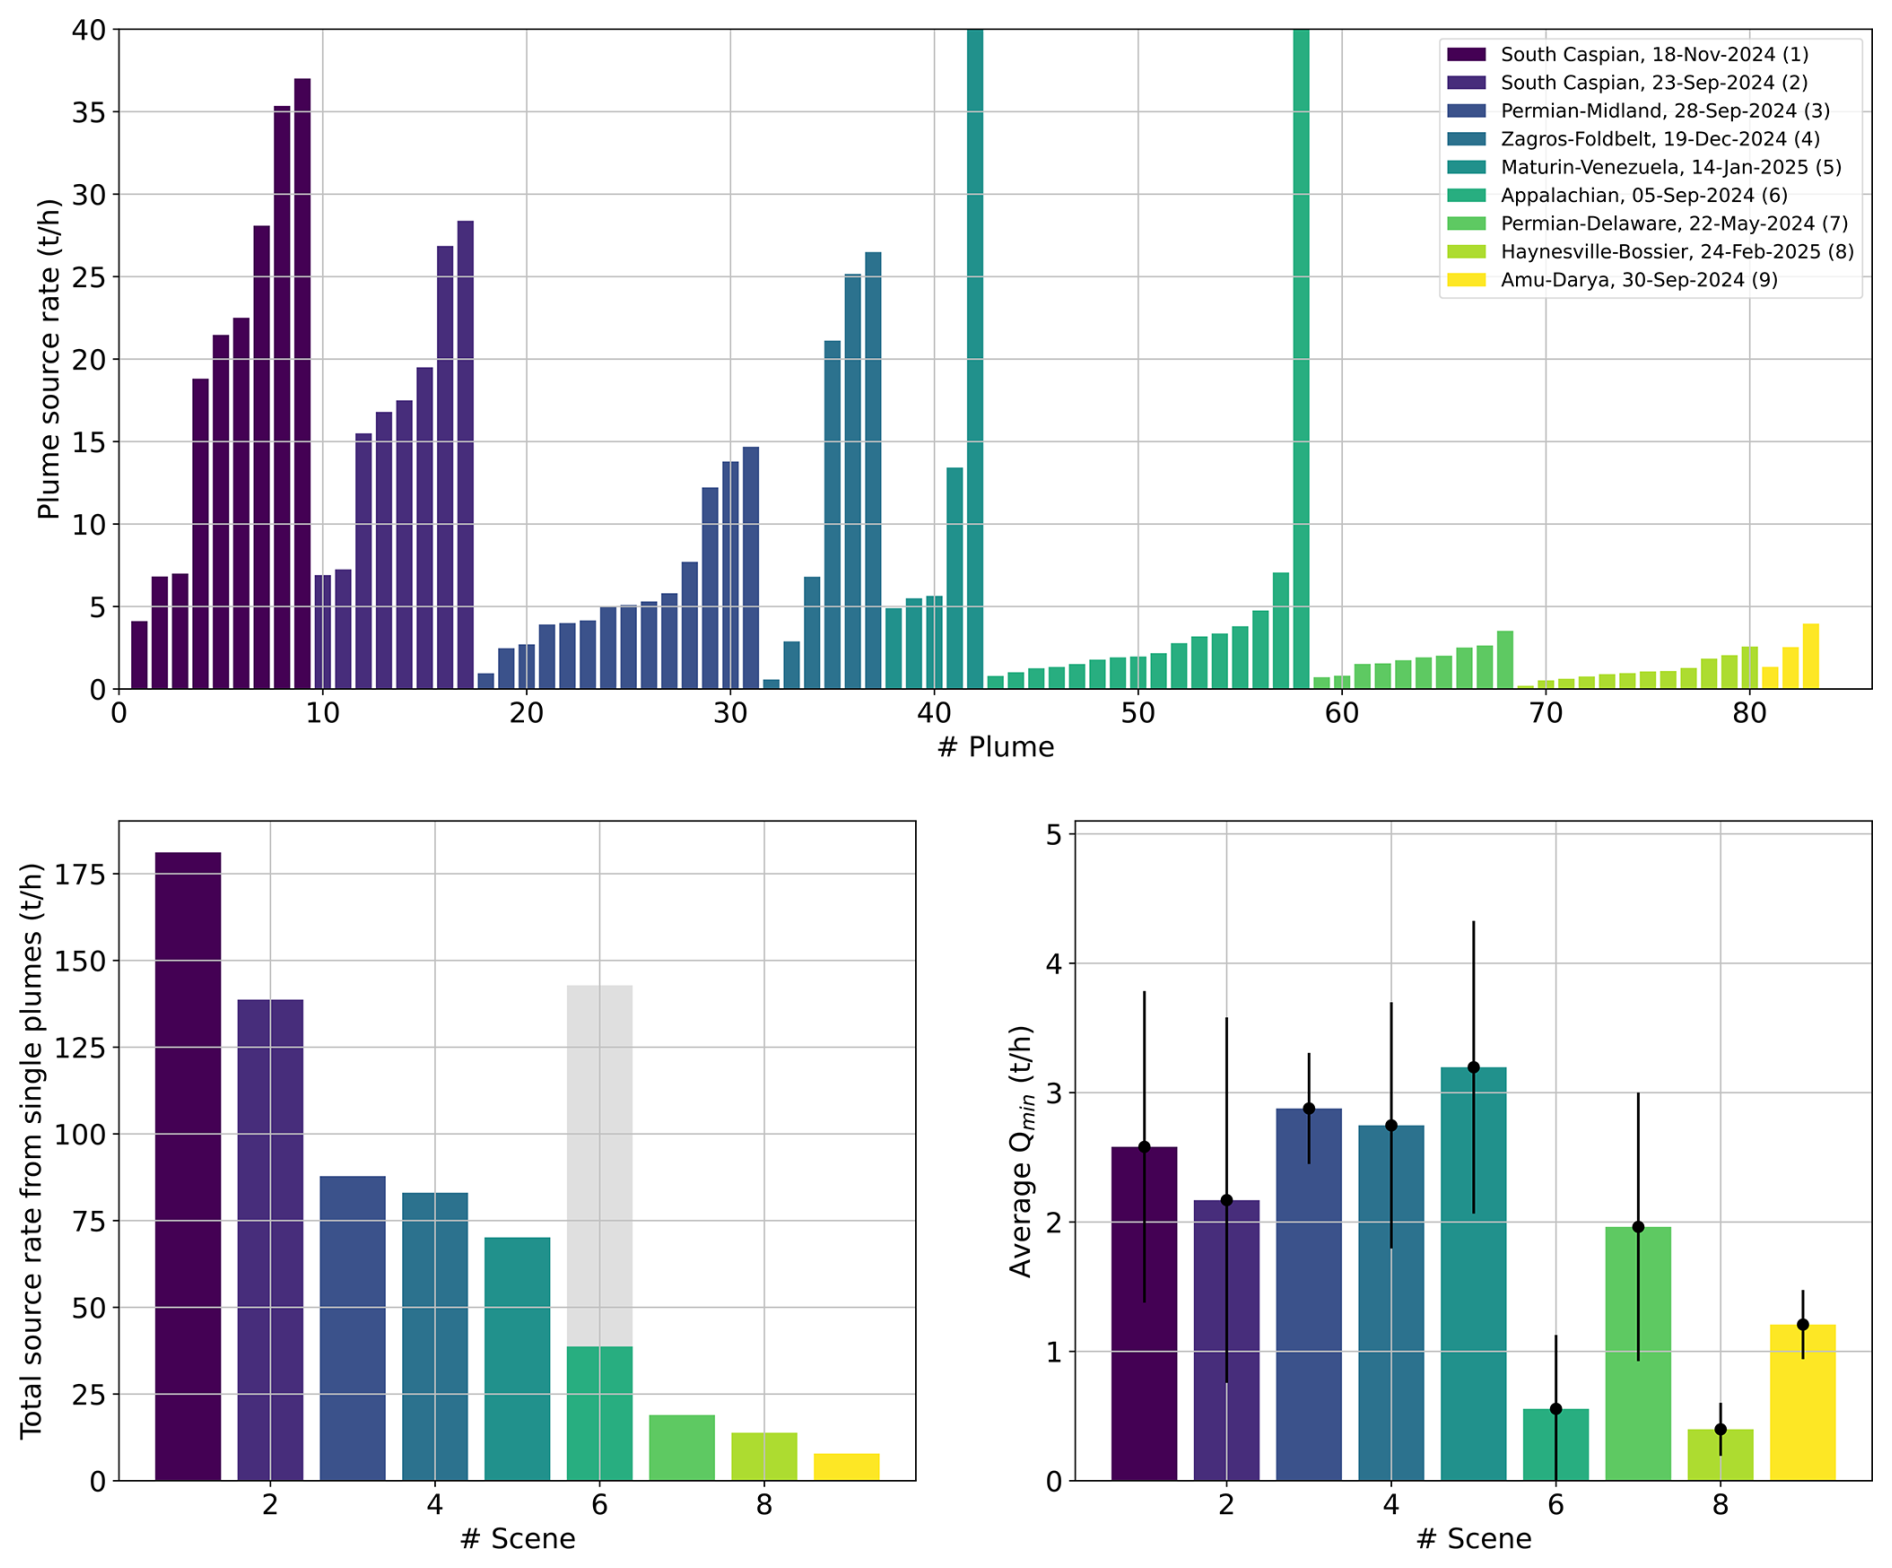
Figure A1Source rates and Qmin for some of the acquisitions shown in this work. The top panel shows the source rates for individual plumes, and the bottom panels show the total source rate obtained from combining all the single plumes (bottom-left panel) and the average Qmin from the areas shown in the XCH4 maps presented in previous figures (bottom-right panel). The gray bar in the bottom left panel marks the total emission for the Appalachian scene if the massive, short-lived emission is counted (see Fig. 1) The plume source rate values in the top panel are provided in a Supplement.
The code used in this work for the visualization and analysis of MethaneSAT data can be obtained from the authors upon request.
MethaneSAT L4 data (emissions) can be accessed through the MethaneSAT data portal https://portal.methanesat.org/en/emissions-map?view-latitude=25.00000&view-longitude=0.00000&view-zoom=1.80&date=2025-06-30&platform=MethaneSAT&product=l4&color-scale=msat_warm_default (last access: 25 February 2026). MethaneSAT L3 data (gridded methane concentrations) can be accessed through Google Earth Engine at https://developers.google.com/earth-engine/datasets/publisher/edf-methanesat-ee?hl=es-419 (last access: 25 February 2026). MethaneSAT L1–L2 data (at-sensor radiance and methane concentrations in sensor coordinates) can be requested through this form https://docs.google.com/forms/d/e/1FAIpQLSeqmNWhXHCysBvj (last access: 25 February 2026). The plume data (source coordinates and emission rates) for the point source emissions reported in Figs. A1 and A2 are included in the Supplement of this work.
The supplement related to this article is available online at https://doi.org/10.5194/acp-26-2941-2026-supplement.
LG, RG, and MO designed the study. LG led the analysis and produced the figures. JG and MS contributed to the implementation of the matched filter for MethaneSAT. JW and HH contributed to the analysis of point sources in the Permian Basin and Turkmenistan, respectively. MS and ZZ generated emission rate data from the detected plumes, and SR, CCM, BL and SW led the development of the MethaneSAT L2 products. LG wrote the paper, incorporating comments and revisions from authors.
The contact author has declared that none of the authors has any competing interests.
Publisher's note: Copernicus Publications remains neutral with regard to jurisdictional claims made in the text, published maps, institutional affiliations, or any other geographical representation in this paper. The authors bear the ultimate responsibility for providing appropriate place names. Views expressed in the text are those of the authors and do not necessarily reflect the views of the publisher.
The authors would like to thank Manvendra Krishna Dubey and two anonymous referees for their constructive reviews.
Funding for MethaneSAT and MethaneAIR activities was provided in part by Anonymous, Arnold Ventures, The Audacious Project, Ballmer Group, Bezos Earth Fund, The Children's Investment Fund Foundation, Heising-Simons Family Fund, King Philanthropies, Robertson Foundation, Skyline Foundation and Valhalla Foundation. For a more complete list of funders, please visit https://www.methanesat.org/ (last access: 25 February 2026).
This paper was edited by Steven Brown and reviewed by Manvendra Krishna Dubey and two anonymous referees.
Ayasse, A. K., Cusworth, D., O'Neill, K., Fisk, J., Thorpe, A. K., and Duren, R.: Performance and sensitivity of column-wise and pixel-wise methane retrievals for imaging spectrometers, Atmos. Meas. Tech., 16, 6065–6074, https://doi.org/10.5194/amt-16-6065-2023, 2023. a
Ayasse, A. K., Cusworth, D. H., Howell, K., O'Neill, K., Conrad, B. M., Johnson, M. R., Heckler, J., Asner, G. P., and Duren, R.: Probability of Detection and Multi-Sensor Persistence of Methane Emissions from Coincident Airborne and Satellite Observations, Environ. Sci. Technol., 58, 21536–21544, https://doi.org/10.1021/acs.est.4c06702, 2024. a, b, c, d, e
Chan Miller, C., Roche, S., Wilzewski, J. S., Liu, X., Chance, K., Souri, A. H., Conway, E., Luo, B., Samra, J., Hawthorne, J., Sun, K., Staebell, C., Chulakadabba, A., Sargent, M., Benmergui, J. S., Franklin, J. E., Daube, B. C., Li, Y., Laughner, J. L., Baier, B. C., Gautam, R., Omara, M., and Wofsy, S. C.: Methane retrieval from MethaneAIR using the CO2 proxy approach: a demonstration for the upcoming MethaneSAT mission, Atmos. Meas. Tech., 17, 5429–5454, https://doi.org/10.5194/amt-17-5429-2024, 2024. a
Chulakadabba, A., Sargent, M., Lauvaux, T., Benmergui, J. S., Franklin, J. E., Chan Miller, C., Wilzewski, J. S., Roche, S., Conway, E., Souri, A. H., Sun, K., Luo, B., Hawthrone, J., Samra, J., Daube, B. C., Liu, X., Chance, K., Li, Y., Gautam, R., Omara, M., Rutherford, J. S., Sherwin, E. D., Brandt, A., and Wofsy, S. C.: Methane point source quantification using MethaneAIR: a new airborne imaging spectrometer, Atmos. Meas. Tech., 16, 5771–5785, https://doi.org/10.5194/amt-16-5771-2023, 2023. a
Conrad, B. M., Tyner, D. R., and Johnson, M. R.: Robust probabilities of detection and quantification uncertainty for aerial methane detection: Examples for three airborne technologies, Remote Sens. Environ., 288, 113499, https://doi.org/10.1016/j.rse.2023.113499, 2023. a, b, c, d
Conway, E. K., Souri, A. H., Benmergui, J., Sun, K., Liu, X., Staebell, C., Chan Miller, C., Franklin, J., Samra, J., Wilzewski, J., Roche, S., Luo, B., Chulakadabba, A., Sargent, M., Hohl, J., Daube, B., Gordon, I., Chance, K., and Wofsy, S.: Level0 to Level1B processor for MethaneAIR, Atmos. Meas. Tech., 17, 1347–1362, https://doi.org/10.5194/amt-17-1347-2024, 2024. a
Cusworth, D. H., Duren, R. M., Thorpe, A. K., Olson-Duvall, W., Heckler, J., Chapman, J. W., Eastwood, M. L., Helmlinger, M. C., Green, R. O., Asner, G. P., Dennison, P. E., and Miller, C. E.: Intermittency of Large Methane Emitters in the Permian Basin, Environ. Sci. Technol. Lett., 8, 567–573, https://doi.org/10.1021/acs.estlett.1c00173, 2021a. a
Cusworth, D. H., Duren, R. M., Thorpe, A. K., Pandey, S., Maasakkers, J. D., Aben, I., Jervis, D., Varon, D. J., Jacob, D. J., Randles, C. A., Gautam, R., Omara, M., Schade, G. W., Dennison, P. E., Frankenberg, C., Gordon, D., Lopinto, E., and Miller, C. E.: Multisatellite Imaging of a Gas Well Blowout Enables Quantification of Total Methane Emissions, Geophys. Res. Lett., 48, e2020GL090864, https://doi.org/10.1029/2020GL090864, 2021b. a
Cusworth, D. H., Thorpe, A. K., Ayasse, A. K., Stepp, D., Heckler, J., Asner, G. P., Miller, C. E., Yadav, V., Chapman, J. W., Eastwood, M. L., Green, R. O., Hmiel, B., Lyon, D. R., and Duren, R. M.: Strong methane point sources contribute a disproportionate fraction of total emissions across multiple basins in the United States, P. Natl. Acad. Sci. USA, 119, e2202338119, https://doi.org/10.1073/pnas.2202338119, 2022. a
de Jong, T. A., Maasakkers, J. D., Irakulis-Loitxate, I., Randles, C. A., Tol, P., and Aben, I.: Daily Global Methane Super-Emitter Detection and Source Identification With Sub-Daily Tracking, Geophys. Res. Lett., 52, e2024GL111824, https://doi.org/10.1029/2024GL111824, 2025. a
Duren, R., Cusworth, D., Ayasse, A., Howell, K., Diamond, A., Scarpelli, T., Kim, J., O'Neill, K., Lai-Norling, J., Thorpe, A., Zandbergen, S. R., Shaw, L., Keremedjiev, M., Guido, J., Giuliano, P., Goldstein, M., Nallapu, R., Barentsen, G., Thompson, D. R., Roth, K., Jensen, D., Eastwood, M., Reuland, F., Adams, T., Brandt, A., Kort, E. A., Mason, J., and Green, R. O.: The Carbon Mapper emissions monitoring system, Atmos. Meas. Tech., 18, 6933–6958, https://doi.org/10.5194/amt-18-6933-2025, 2025. a, b
El Abbadi, S. H., Chen, Z., Burdeau, P. M., Rutherford, J. S., Chen, Y., Zhang, Z., Sherwin, E. D., and Brandt, A. R.: Technological Maturity of Aircraft-Based Methane Sensing for Greenhouse Gas Mitigation, Environ. Sci. Technol., 58, 9591–9600, https://doi.org/10.1021/acs.est.4c02439, 2024. a
Environmental Defense Fund: MethaneSAT, https://www.methanesat.org/ (last access: 25 February 2026), 2021. a
Gorroño, J., Varon, D. J., Irakulis-Loitxate, I., and Guanter, L.: Understanding the potential of Sentinel-2 for monitoring methane point emissions, Atmos. Meas. Tech., 16, 89–107, https://doi.org/10.5194/amt-16-89-2023, 2023. a
Guanter, L., Irakulis-Loitxate, I., Gorroño, J., Sánchez-García, E., Cusworth, D. H., Varon, D. J., Cogliati, S., and Colombo, R.: Mapping methane point emissions with the PRISMA spaceborne imaging spectrometer, Remote Sens. Environ., 265, 112671, https://doi.org/10.1016/j.rse.2021.112671, 2021. a, b
Guanter, L., Warren, J., Omara, M., Chulakadabba, A., Roger, J., Sargent, M., Franklin, J. E., Wofsy, S. C., and Gautam, R.: Detection and quantification of methane plumes with the MethaneAIR airborne spectrometer, Atmos. Meas. Tech., 18, 3857–3872, https://doi.org/10.5194/amt-18-3857-2025, 2025. a, b, c, d, e, f, g, h
IPCC: Climate Change 2021: The Physical Science Basis, in: Contribution of Working Group I to the Sixth Assessment Report of the Intergovernmental Panel on Climate Change, Cambridge University Press, Cambridge, UK and New York, NY, USA, ISBN 978-1-009-05701-0, https://doi.org/10.1017/9781009157896, 2021. a
Irakulis-Loitxate, I., Guanter, L., Liu, Y.-N., Varon, D. J., Maasakkers, J. D., Zhang, Y., Chulakadabba, A., Wofsy, S. C., Thorpe, A. K., Duren, R. M., Frankenberg, C., Lyon, D. R., Hmiel, B., Cusworth, D. H., Zhang, Y., Segl, K., Gorroño, J., Sánchez-García, E., Sulprizio, M. P., Cao, K., Zhu, H., Liang, J., Li, X., Aben, I., and Jacob, D. J.: Satellite-based survey of extreme methane emissions in the Permian basin, Sci. Adv., 7, https://doi.org/10.1126/sciadv.abf4507, 2021. a, b, c
Irakulis-Loitxate, I., Gorroño, J., Zavala-Araiza, D., and Guanter, L.: Satellites Detect a Methane Ultra-emission Event from an Offshore Platform in the Gulf of Mexico, Environ. Sci. Technol. Lett., 9, 520–525, https://doi.org/10.1021/acs.estlett.2c00225, 2022a. a
Irakulis-Loitxate, I., Guanter, L., Maasakkers, J. D., Zavala-Araiza, D., and Aben, I.: Satellites Detect Abatable Super-Emissions in One of the World's Largest Methane Hotspot Regions, Environ. Sci. Technol., 56, 2143–2152, https://doi.org/10.1021/acs.est.1c04873, 2022b. a
Jacob, D. J., Turner, A. J., Maasakkers, J. D., Sheng, J., Sun, K., Liu, X., Chance, K., Aben, I., McKeever, J., and Frankenberg, C.: Satellite observations of atmospheric methane and their value for quantifying methane emissions, Atmos. Chem. Phys., 16, 14371–14396, https://doi.org/10.5194/acp-16-14371-2016, 2016. a, b
Jacob, D. J., Varon, D. J., Cusworth, D. H., Dennison, P. E., Frankenberg, C., Gautam, R., Guanter, L., Kelley, J., McKeever, J., Ott, L. E., Poulter, B., Qu, Z., Thorpe, A. K., Worden, J. R., and Duren, R. M.: Quantifying methane emissions from the global scale down to point sources using satellite observations of atmospheric methane, Atmos. Chem. Phys., 22, 9617–9646, https://doi.org/10.5194/acp-22-9617-2022, 2022. a, b
Kunkel, W. M., Carre-Burritt, A. E., Aivazian, G. S., Snow, N. C., Harris, J. T., Mueller, T. S., Roos, P. A., and Thorpe, M. J.: Extension of Methane Emission Rate Distribution for Permian Basin Oil and Gas Production Infrastructure by Aerial LiDAR, Environ. Sci. Technol., 57, 12234–12241, https://doi.org/10.1021/acs.est.3c00229, 2023. a, b
Lauvaux, T., Giron, C., Mazzolini, M., d'Aspremont, A., Duren, R., Cusworth, D., Shindell, D., and Ciais, P.: Global assessment of oil and gas methane ultra-emitters, Science, 375, 557–561, https://doi.org/10.1126/science.abj4351, 2022. a, b
Lyon, D. R., Hmiel, B., Gautam, R., Omara, M., Roberts, K. A., Barkley, Z. R., Davis, K. J., Miles, N. L., Monteiro, V. C., Richardson, S. J., Conley, S., Smith, M. L., Jacob, D. J., Shen, L., Varon, D. J., Deng, A., Rudelis, X., Sharma, N., Story, K. T., Brandt, A. R., Kang, M., Kort, E. A., Marchese, A. J., and Hamburg, S. P.: Concurrent variation in oil and gas methane emissions and oil price during the COVID-19 pandemic, Atmos. Chem. Phys., 21, 6605–6626, https://doi.org/10.5194/acp-21-6605-2021, 2021. a
MacLean, J.-P. W., Girard, M., Jervis, D., Marshall, D., McKeever, J., Ramier, A., Strupler, M., Tarrant, E., and Young, D.: Offshore methane detection and quantification from space using sun glint measurements with the GHGSat constellation, Atmos. Meas. Tech., 17, 863–874, https://doi.org/10.5194/amt-17-863-2024, 2024. a
MethaneSAT: MethaneSAT Data Platform, https://portal.methanesat.org/en/emissions-map (last access: 16 January 2026), 2026. a
Molod, A., Takacs, L., Suarez, M., Bacmeister, J., Song, I.-S., and Eichmann, A.: The GEOS-5 Atmospheric General Circulation Model: Mean Climate and Development from MERRA to Fortuna, nASA TM-2012-104606, NASA, https://portal.nccs.nasa.gov/datashare/gmao/geos-fp/das/ (last access: 25 February 2026), 2012. a
Omara, M., Zavala-Araiza, D., Lyon, D. R., Hmiel, B., Roberts, K. A., and Hamburg, S. P.: Methane emissions from US low production oil and natural gas well sites, Nat. Commun., 13, 2085, https://doi.org/10.1038/s41467-022-29709-3, 2022. a
Roger, J., Guanter, L., Gorroño, J., and Irakulis-Loitxate, I.: Exploiting the entire near-infrared spectral range to improve the detection of methane plumes with high-resolution imaging spectrometers, Atmos. Meas. Tech., 17, 1333–1346, https://doi.org/10.5194/amt-17-1333-2024, 2024a. a
Roger, J., Irakulis-Loitxate, I., Valverde, A., Gorroño, J., Chabrillat, S., Brell, M., and Guanter, L.: High-Resolution Methane Mapping With the EnMAP Satellite Imaging Spectroscopy Mission, IEEE T. Geosci. Remote, 62, 1–12, https://doi.org/10.1109/TGRS.2024.3352403, 2024b. a, b
Roger, J., Guanter, L., and Gorroño, J.: Assessing the Detection of Methane Plumes in Offshore Areas Using High-Resolution Imaging Spectrometers, Atmos. Meas. Tech., 18, 5545–5567, https://doi.org/10.5194/amt-18-5545-2025, 2025. a, b, c
Saunois, M., Martinez, A., Poulter, B., Zhang, Z., Raymond, P. A., Regnier, P., Canadell, J. G., Jackson, R. B., Patra, P. K., Bousquet, P., Ciais, P., Dlugokencky, E. J., Lan, X., Allen, G. H., Bastviken, D., Beerling, D. J., Belikov, D. A., Blake, D. R., Castaldi, S., Crippa, M., Deemer, B. R., Dennison, F., Etiope, G., Gedney, N., Höglund-Isaksson, L., Holgerson, M. A., Hopcroft, P. O., Hugelius, G., Ito, A., Jain, A. K., Janardanan, R., Johnson, M. S., Kleinen, T., Krummel, P. B., Lauerwald, R., Li, T., Liu, X., McDonald, K. C., Melton, J. R., Mühle, J., Müller, J., Murguia-Flores, F., Niwa, Y., Noce, S., Pan, S., Parker, R. J., Peng, C., Ramonet, M., Riley, W. J., Rocher-Ros, G., Rosentreter, J. A., Sasakawa, M., Segers, A., Smith, S. J., Stanley, E. H., Thanwerdas, J., Tian, H., Tsuruta, A., Tubiello, F. N., Weber, T. S., van der Werf, G. R., Worthy, D. E. J., Xi, Y., Yoshida, Y., Zhang, W., Zheng, B., Zhu, Q., Zhu, Q., and Zhuang, Q.: Global Methane Budget 2000–2020, Earth Syst. Sci. Data, 17, 1873–1958, https://doi.org/10.5194/essd-17-1873-2025, 2025. a
Schuit, B. J., Maasakkers, J. D., Bijl, P., Mahapatra, G., van den Berg, A.-W., Pandey, S., Lorente, A., Borsdorff, T., Houweling, S., Varon, D. J., McKeever, J., Jervis, D., Girard, M., Irakulis-Loitxate, I., Gorroño, J., Guanter, L., Cusworth, D. H., and Aben, I.: Automated detection and monitoring of methane super-emitters using satellite data, Atmos. Chem. Phys., 23, 9071–9098, https://doi.org/10.5194/acp-23-9071-2023, 2023. a
Sherwin, E. D., Rutherford, J. S., Chen, Y., Aminfard, S., Kort, E. A., Jackson, R. B., and Brandt, A. R.: Single‐blind validation of space‐based point‐source detection and quantification of onshore methane emissions, Sci. Rep., 13, 3836, https://doi.org/10.1038/s41598-023-30761-2, 2023. a, b
Sun, K., Zhu, L., Cady-Pereira, K., Chan Miller, C., Chance, K., Clarisse, L., Coheur, P.-F., González Abad, G., Huang, G., Liu, X., Van Damme, M., Yang, K., and Zondlo, M.: A physics-based approach to oversample multi-satellite, multispecies observations to a common grid, Atmos. Meas. Tech., 11, 6679–6701, https://doi.org/10.5194/amt-11-6679-2018, 2018. a
Thorpe, A. K., Green, R. O., Thompson, D. R., Brodrick, P. G., Chapman, J. W., Elder, C. D., Irakulis-Loitxate, I., Cusworth, D. H., Ayasse, A. K., Duren, R. M., Frankenberg, C., Guanter, L., Worden, J. R., Dennison, P. E., Roberts, D. A., Chadwick, K. D., Eastwood, M. L., Fahlen, J. E., and Miller, C. E.: Attribution of individual methane and carbon dioxide emission sources using EMIT observations from space, Sci. Adv., 9, eadh2391, https://doi.org/10.1126/sciadv.adh2391, 2023. a
UNEP-IMEO: Methane Alert and Response System (MARS), https://www.unep.org/explore-topics/energy/what-we-do/methane/imeo-action/methane-alert-and-response-system-mars (last access: 4-July-2025), 2023. a
United Nations Environment Programme: Eye On Methane data platform, https://methanedata.unep.org/ (last access: 25 February 2026), 2025. a, b, c
US Energy Information Administration: Natural gas spot prices fell across key regional trading hubs in 2024, https://www.eia.gov/todayinenergy/detail.php?id=64445#:~:text=In West Texas. prices at,inflation-adjusted dollars ever reported (last access: 25 February 2026), 2025. a
Vanselow, S., Schneising, O., Buchwitz, M., Reuter, M., Bovensmann, H., Boesch, H., and Burrows, J. P.: Automated detection of regions with persistently enhanced methane concentrations using Sentinel-5 Precursor satellite data, Atmos. Chem. Phys., 24, 10441–10473, https://doi.org/10.5194/acp-24-10441-2024, 2024. a, b
Varon, D. J., Jacob, D. J., Jervis, D., and McKeever, J.: Quantifying Time-Averaged Methane Emissions from Individual Coal Mine Vents with GHGSat-D Satellite Observations, Environ. Sci. Technol., 54, 10246–10253, https://doi.org/10.1021/acs.est.0c01213, 2020. a
Varon, D. J., Jervis, D., McKeever, J., Spence, I., Gains, D., and Jacob, D. J.: High-frequency monitoring of anomalous methane point sources with multispectral Sentinel-2 satellite observations, Atmos. Meas. Tech., 14, 2771–2785, https://doi.org/10.5194/amt-14-2771-2021, 2021. a
Varon, D. J., Jacob, D. J., Hmiel, B., Gautam, R., Lyon, D. R., Omara, M., Sulprizio, M., Shen, L., Pendergrass, D., Nesser, H., Qu, Z., Barkley, Z. R., Miles, N. L., Richardson, S. J., Davis, K. J., Pandey, S., Lu, X., Lorente, A., Borsdorff, T., Maasakkers, J. D., and Aben, I.: Continuous weekly monitoring of methane emissions from the Permian Basin by inversion of TROPOMI satellite observations, Atmos. Chem. Phys., 23, 7503–7520, https://doi.org/10.5194/acp-23-7503-2023, 2023. a, b
Vaughan, A., Mateo-García, G., Gómez-Chova, L., Růžička, V., Guanter, L., and Irakulis-Loitxate, I.: CH4Net: a deep learning model for monitoring methane super-emitters with Sentinel-2 imagery, Atmos. Meas. Tech., 17, 2583–2593, https://doi.org/10.5194/amt-17-2583-2024, 2024. a, b
Warren, J. D., Guanter, L., Sargent, M., Zhang, Z., Omara, M., Williams, J. P., Valverde, A., Miller, C. C., Roche, S., Franklin, J., Kyzivat, E., Luo, B., Hairfield, C. A., Weatherby, K., Himmelberger, A., MacKay, K., Wofsy, S., and Gautam, R.: Recent satellite observations of persistent and large oil and gas methane emission activity from Venezuela, submitted, 2026. a
Warren, J. D., Sargent, M., Williams, J. P., Omara, M., Miller, C. C., Roche, S., MacKay, K., Manninen, E., Chulakadabba, A., Himmelberger, A., Benmergui, J., Zhang, Z., Guanter, L., Wofsy, S., and Gautam, R.: Sectoral contributions of high-emitting methane point sources from major US onshore oil and gas producing basins using airborne measurements from MethaneAIR, Atmos. Chem. Phys., 25, 10661–10675, https://doi.org/10.5194/acp-25-10661-2025, 2025. a
Watine-Guiu, M., Varon, D. J., Irakulis-Loitxate, I., Balasus, N., and Jacob, D. J.: Geostationary satellite observations of extreme and transient methane emissions from oil and gas infrastructure, P. Natl. Acad. Sci. USA 120, e2310797120, https://doi.org/10.1073/pnas.2310797120, 2023. a
Williams, J. P., Omara, M., Himmelberger, A., Zavala-Araiza, D., MacKay, K., Benmergui, J., Sargent, M., Wofsy, S. C., Hamburg, S. P., and Gautam, R.: Small emission sources in aggregate disproportionately account for a large majority of total methane emissions from the US oil and gas sector, Atmos. Chem. Phys., 25, 1513–1532, https://doi.org/10.5194/acp-25-1513-2025, 2025. a
Yan, Y., Li, F., Sun, S., Bai, S., Huang, Q., Liu, J., and Zhang, Y.: Detection of Point-Source Methane Enhancements from MethaneSAT Observations with Target-Driven Spectral Matching Algorithm, EarthArxiv [preprint], https://doi.org/10.31223/X5415W, 2025. a
Zavala-Araiza, D., Alvarez, R., Lyon, D., Allen, D., Marchese, A., Zimmerle, D., and Hamburg, S.: Super-emitters in natural gas infrastructure are caused by abnormal process conditions, Nat. Commun., 8, 14012, https://doi.org/10.1038/ncomms14012, 2017. a
Zhang, Y., Gautam, R., Pandey, S., Omara, M., Maasakkers, J. D., Sadavarte, P., Lyon, D., Nesser, H., Sulprizio, M. P., Varon, D. J., Zhang, R., Houweling, S., Zavala-Araiza, D., Alvarez, R. A., Lorente, A., Hamburg, S. P., Aben, I., and Jacob, D. J.: Quantifying methane emissions from the largest oil-producing basin in the United States from space, Sci. Adv., 6, https://doi.org/10.1126/sciadv.aaz5120, 2020. a, b
Zhang, Z., Sargent, M., Warren, J. D., Chulakadabba, A., Russi, M., Ayvazov, S., Benmergui, J., Knapp, M., Kyzivat, E., Miller, C. C., Roche, S., Luo, B., Miller, D. J., Nasr, M., Sun, K., Williams, J. P., MacKay, K., Omara, M., Guanter, L., Gautam, R., Franklin, J., Liu, X., and Wofsy, S. C.: Automatic Methane Plume Masking Based on Wavelet Transform Image Processing: Application to MethaneAIR and MethaneSAT data, EGUsphere [preprint], https://doi.org/10.5194/egusphere-2026-141, 2026. a