the Creative Commons Attribution 4.0 License.
the Creative Commons Attribution 4.0 License.
High-resolution emission inventory development and co-emission hotspot identification of air pollutants and greenhouse gases in central plains region, China
Jie Li
Shasha Yin
Conghui Su
Jiaxin Wei
Mingyue Guan
Chong Yu
A high-resolution inventory provides scientific basis for numerical simulations and control strategies. Under the background of synergistic carbon reduction and pollution control, constructing a carbon-pollutant co-emission inventory is of great significance for regional air quality improvement. Taken Henan Province in the Central Plains region as an example, the most polluted regions in China, an update emission inventory was developed. The study presents results showing that in 2022, the total emissions of SO2, NOx, CO, PM10, PM2.5, VOCs, NH3, BC, OC, CO2, CH4, and N2O in Central China, particularly Henan Province, were 408.7, 1336.2, 4647.3, 901.1, 440.0, 759.3, 672.7, 47.4, 90.3, 540462.0, 12462.0 and 42.9 kt respectively. The emissions were predominantly attributed to industrial combustion, electricity generation, motor vehicles, and agricultural activities. Significant spatial heterogeneity was observed. Northern heavy industrial cities exhibited high carbon and pollution intensities with carbon emission 1.75–3.7 times higher than the provincial average. In contrast, central transportation hubs were primarily characterized by elevated emissions of NOx and VOCs. Southern agricultural areas showed low carbon but high NH3 emissions. Temporally, emissions of SO2, CO, PM10 and PM2.5 peaked during winter, whereas NH3, CH4 and N2O increased during the summer agricultural season. High-emission grids were predominantly concentrated in urban agglomerations of the north-central region, especially around Zhengzhou, Jiaozuo, and Anyang. Co-hotspot analysis identified the central-northern industrial zone, especially around Zhengzhou, as the key region for coordinated control, with winter offering the most significant synergistic potential. This inventory provides a critical scientific basis for targeted, region-specific mitigation strategies.
- Article
(12603 KB) - Full-text XML
-
Supplement
(8612 KB) - BibTeX
- EndNote
Atmospheric pollutants are primarily emitted due to fundamental human activities, including energy consumption and economic operations (Kanakidou, 2024; Huang et al., 2024). Notably, pollutants such as SO2, NOx, VOCs, PM2.5 and NH3, play a key role in regional atmospheric pollution formation (Kanakidou, 2024), which can significantly impair visibility, ecology and public health (Manisalidis et al., 2020). Meanwhile, the global warming effects of greenhouse gases (GHGs), as the main emission drivers of climate change, have been widely noticed and recognized (IPCC, 2021). Although air pollutants and GHGs differ in their environmental impacts with air pollutants primarily posing a local, short-term health and ecological risk, while GHGs contribute to global-scale, long-term warming effect, they are fundamentally both emitted in gaseous form highly overlapping emission sources, including fossil energy combustion, industrial process, transportation, and residential activities (Xu et al., 2025; Liu et al., 2023, 2021; MEEPRC, 2021).
Globally, the air pollution situation in China remains concerning and the PM2.5 and ozone pollution have persisted at high concentrations for a long time (IQAIR, 2024; Jin et al., 2021). According to the Bulletin of China's Ecological and Environmental Conditions 2023, 136 out of 339 cities at prefecture level and above in the country have exceeded national Grade II air quality standards (MEEPRC, 2024a; Wang et al., 2025). Meanwhile, China is a major contributor to global GHG emissions. According to the Carbon Emissions Report 2023 released by International Energy Agency, the total carbon emissions in China reach 12.6 billion t in 2023 with a growth rate of 4.7 % (IEA, 2024). Therefore, more and more scholars at home and abroad are highly concerned about the quantification of their emissions including Chinese scholars as well.
Domestic and international researches have made significant progress, and a series of national and global scale emission inventories have been constructed, including MEIC (Li et al., 2018), EDGAR (Muntean et al., 2018), REAS (Kurokawa et al., 2013), and CHRED (Cai et al., 2018). Furthermore, a series of emission inventories in China have been constructed at the regional (Xu et al., 2020; Zhao et al., 2024; Wu et al., 2022), provincial (Zhou et al., 2020; Jiang et al., 2020a), and urban (Liu et al., 2018) levels. Meanwhile, significant progress has also been made in building inventories for key industries (Gao et al., 2019; Hua et al., 2016; Jiang et al., 2020b). In particular, the development of air pollutant emission inventories has been rapid advancements in spatial resolution and temporal distribution (Chen et al., 2024, 2022; Liu et al., 2025), and some studies have successfully constructed gridded data with a precision of 0.1° × 0.1° or even higher (Zheng et al., 2021). However, GHGs emission inventories typically emphasize aggregate total emission of the five major sectors, including energy, industrial process, agriculture, forestry, and waste at national or provincial levels, rather than high-resolution emission inventories (Geng et al., 2011; Yu and Tan, 2023; Xue et al., 2021; He et al., 2024). At present, China has attached great importance to the work of reducing pollution and carbon emissions in a coordinated manner as a national strategy (CPGPRC, 2022; Yu et al., 2020). A series of policy documents have been issued successively which cover the national or provincial strategy (CPGPRC, 2024a) and key industries (CPGPRC, 2024b; MTPRC, 2024). As the emission reduction potential of traditional end-of-pipe measures gradually narrowing (Kong et al., 2024; Cao et al., 2025), it is necessary to develop integrated emission inventory of carbon and pollutants at city level or even enterprise level (Wu et al., 2024). It not only aids to explore the emission reduction potential from the front-end and also enhances the identification of GHG spatial grid synergies.
In the dual context of high-value for air pollutant and GHG emissions pressure in China, Central China, especially represented by Henan Province is typical and representative of high pollutant concentrations and high carbon emission. Henan Province is a key polluted region with high concentrations of both PM2.5 and O3. In 2023, for instance, the annual PM2.5 concentration exceeded the national standard II by 28 %, and the O3 concentration exceeded the standard II by 12 %. Furthermore, the share of days with good air quality was lower than the national average of 85.5 % (MEEPRC, 2024a). Also, Henan Province has a share of coal in energy consumption close to 55.3 % in 2023, and the energy-related CO2 emission in this region was accounted for approximately 5 % of the total emission in China (HBS, 2024). Therefore, we selected Henan Province as the study area to develop an integrated emission inventory of carbon and pollutants based on a unified source classification system with enterprise-level point source support as possible.
This study compiles an integrated emission inventory of air pollutants and greenhouse gases for Henan Province, providing a data foundation for coordinated atmospheric and climate governance. Emissions of nine air pollutants (SO2, NOx, CO, PM10, PM2.5, VOCs, NH3, BC, OC) and three greenhouse gases (CO2, CH4, N2O) were calculated under a unified source framework, followed by analysis of emission characteristics of different pollutants and cities. The reliability was evaluated through inter-study comparison and uncertainty analysis. We then allocated emissions to a monthly scale and a 3 km × 3 km grid to enable high spatiotemporal resolution analysis. To identify priority areas for emission control, a hotspot analysis was conducted: grids were ranked by emission level (top 20 % assigned to four hotspot categories), and a bidirectional matching rule was applied to locate grids with concurrently high emissions of CO2 and key air pollutants (such as SO2, NOx, PM2.5, VOCs, BC and OC), thereby pinpointing key regions for coordinated mitigation.
2.1 Study domain
This study centered on Henan Province as its primary research region, with 2022 serving as the reference period. Situated at the crossroads of central and eastern China, the region stretches along the middle and lower reaches of the legendary Yellow River, occupying a strategically important position in the country's geographical landscape. It governs 18 administrative divisions, including Zhengzhou, Kaifeng, Luoyang, Pingdingshan, Anyang, Hebi, Xinxiang, Jiaozuo, Puyang, Xuchang, Luohe, Sanmenxia, Nanyang, Shangqiu, Xinyang, Zhoukou, Zhumadian, and the Jiyuan Demonstration Area (see Fig. 1).
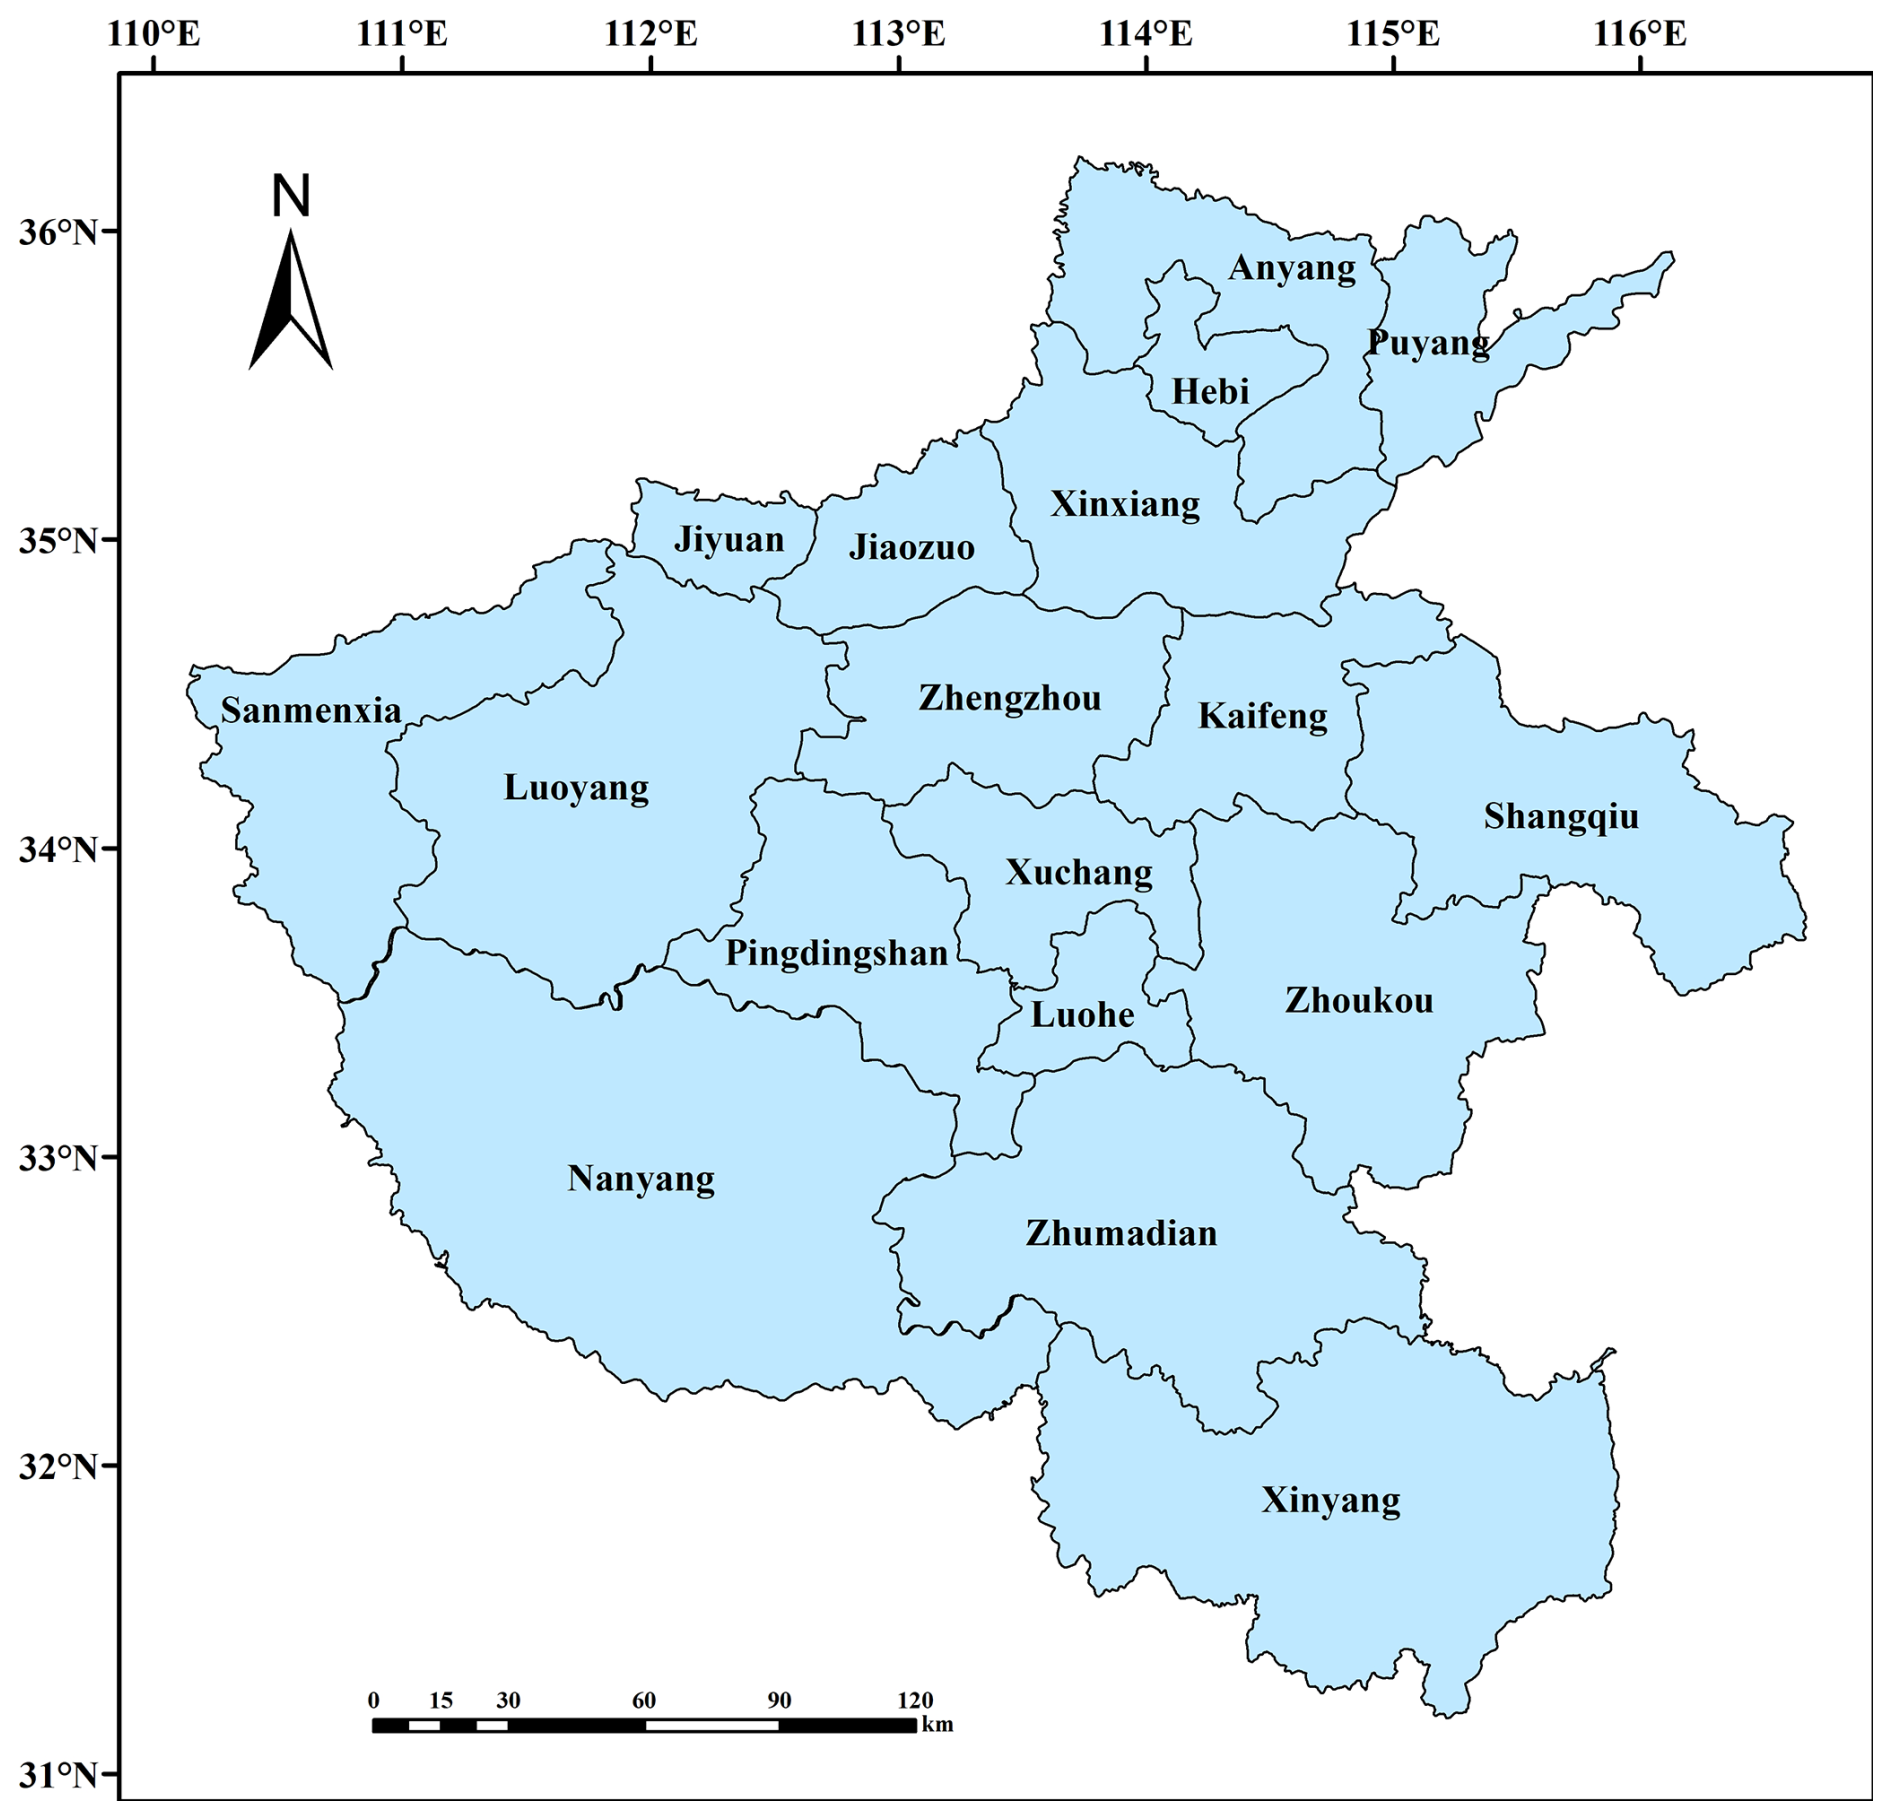
Figure 1Study domain.
Henan Province, a central Chinese region, exemplifies high population density, industrial and agricultural prominence, and key transportation networks. With a landmass of roughly 167 000 km2, Henan Province makes up about 1.7 % of China's total territory (HPPG, 2023). In 2022, its GDP reached CNY 6.13 trillion, ranking fifth nationally (HBS, 2023; SCPRC, 2023). With a permanent population of 98.7 million in 2022, it ranks third in China (NBS, 2023). The economic landscape is characterized by 8.6 % in the primary sector, 38.3 % in the secondary, and 53.1 % in the tertiary sector (HBS, 2023). The region's energy structure has long been dominated by coal, with standard coal consumption reaching 214 Mt in 2022, accounting for 62.7 % of the province's total energy consumption (HBS, 2023). The total proportion of non-coal energy consumption is 37.3 %, which includes a share of 15.7 % for oil, 15.1 % for primary electricity and other energy sources, and 6.5 % for natural gas (HBS, 2023). The five major high-energy-consuming industries of petrochemicals, chemicals, building materials, iron and steel, and non-ferrous metals account for 53.8 % of the total output value of large-scale industrial products in Henan Province (HBS, 2023). In terms of agriculture, in 2022, the total grain output of the province reached 67.9 Mt, with wheat and corn being the dominant crops, accounting for 56.1 % and 33.5 % (HBS, 2023). These crops are primarily distributed in regions such as Zhumadian, Nanyang, and Xinyang. Regarding animal husbandry, pig farming has shown remarkable scale, with an end-of-year stock of 42.6 million heads, ranking second nationwide (HBS, 2023). Notably, Nanyang and Zhumadian have some of the highest livestock numbers in the province (HBS, 2023). Meanwhile, Zhengzhou, the provincial capital, had 4.6 million registered motor vehicles, ranking sixth among Chinese cities (HBS, 2023; HPDEE, 2022).
2.2 Source categorization
To develop a trustworthy emissions inventory, as a fundamental requirement, it's vital to have a sound and thorough system for classifying the emission sources (Zhang et al., 2023). Distinct emission inventories traditionally cataloged GHGs and air pollutants separately. To facilitate the integration of the compilation processes for both types of emission inventory, this study focuses on the unified source classification framework. By referring to the “Technical Guidelines for the Compilation of Comprehensive Emission Inventories of Air Pollutants and GHGs (for Trial Implementation)” (hereinafter referred to as the “Technical Guidelines”) (MEEPRC, 2024b), the unified classification framework of seven emission sources of electricity and thermal power, industry, mobile source and oil storage and transportation, fugitive dust, resident, agriculture, and waste treatment was adopted. The source of electricity and thermal power, combined thermal power generation, combined heat and power, heat production and supply, as well as biomass power generation, among others. The industrial source is further categorized into industrial combustion, non-ferrous metal, industrial solvent, cement, among others. Mobile source and oil storage and transportation include on-road mobile, railway, river transport, gas station, gasoline and diesel transport, among others. Dust emission sources consist of road dust and construction dust. The residential source cover corporate catering, residential combustion, straw household, civil solvent use, among others. Agricultural source pertains to livestock breeding, fertilizer use, among others. Waste treatment sources include wastewater treatment sewage treatment and garbage disposal. A detailed list of these specific source types and associated activity data can be found in Table S1 in the Supplement.
2.3 Methodology and data collection
The research utilized two main techniques for gauging emissions: the emission factor and the mass balance methodologies. Data on activities were gathered from a blend of documented information from ecological and environmental authorities, and significant statistical compilations, including the Henan Provincial Statistical Yearbook, the China Statistical Yearbook, and the China Agricultural Yearbook. The compiled datasets included pivotal elements such as energy usage, industrial output, pollution abatement facilities, regional dispersion, and vehicle numbers, with comprehensive data outlined in Table S1. Emission factors were chosen using pertinent literature and local assessments, emphasizing applicability to Henan Province and adjacent regions. The corresponding factor data can be found in Tables S2 through S10.
2.3.1 Air pollutant emission calculation
The emissions of conventional air pollutants (SO2, NOx, CO, VOCs, PM10, PM2.5, NH3) are calculated using the emission factor method with the following formula:
Here, E denotes the total emissions from each source within Henan Province, A represents the activity level data, EF stands for the emission factor value.
For electricity and thermal power source as well as industrial combustion, a more detailed mass balance method can be used for SO2 emission, with the following formula:
where, E is the emission of SO2, 2 is the molecular weight ratio of sulfur dioxide (SO2 molecular weight 64) to sulfur (S molecular weight 32), S is the sulfur content in the fuel, F is the fuel consumption, C is the sulfur conversion rate, and is the sulfur removal rate.
BC and OC emissions are derived from PM2.5 levels and their respective fractions, calculated as follows:
Where Ei is the emission of BC or OC; i represents BC or OC; is the PM2.5 emission; and fi denotes the BC or OC fraction within PM2.5.
2.3.2 GHG emission calculation
(1) CO2 emission calculation method
CO2 emissions from electricity and thermal power source are calculated using the following formula:
where, is the CO2 emission; i is the fuel type; AC is the fuel consumption; NCV is the net calorific value of the fuel; CC is the carbon content per unit calorific value of the fuel; COF is the carbon oxidation factor of the fuel; and 44/12 is the molecular weight ratio of CO2 to C.
The CO2 emission calculation methods for industrial source, mobile source and oil storage and transportation, residential source, and agricultural source are similar to those for electricity and thermal power source, all based on fuel consumption and emission factors.
(2) CH4 emission calculation method
The CH4 emission calculation formula for agricultural livestock and poultry manure management systems is:
where, is the CH4 emission factor per unit livestock, and AP is the annual livestock population.
For waste treatment source, the CH4 emission formula for domestic wastewater treatment is:
where, TOW is the total organic loading in domestic wastewater, EF is the emission factor, and R is the CH4 recovery rate.
The CH4 emission formula for municipal solid waste landfill is:
where, MSWT is the total municipal solid waste generation, MSWF is the fraction sent to landfills, L0 is the methane generation potential, R is the recovered methane, and OX is the oxidation factor.
CH4 emissions from mobile source and oil storage and transportation and residential source are calculated using Eq. (1)
(3) N2O Emission Calculation Method
N2O emissions from agricultural livestock and poultry farms are divided into direct and indirect emissions. The direct emission formula is:
where, Nex is the annual nitrogen excretion per animal unit, MSi is the fraction of manure managed using system i, EFi is the direct N2O emission factor for management system i, and AP represents livestock population (using annual throughput for pigs, broilers, and beef cattle, and average inventory for dairy cattle and laying hens).
The indirect emission formula is:
where Fracgas is the fraction of nitrogen volatilized as NH3 and NOx, and EF1 is the emission factor for N2O formation from volatilized nitrogen.
The N2O emission calculation formula for domestic wastewater treatment in waste treatment source is:
where NE is the nitrogen content in wastewater, EFE is the N2O emission factor for wastewater treatment, and 44/28 is the molecular weight conversion factor.
N2O emissions from electricity and thermal power and mobile source and oil storage and transportation are calculated using Eq. (1)
2.4 Temporal and spatial allocation
This research aimed to bolster the precision of air quality modeling at a high resolution, and to gain a deeper understanding of how air pollutants and greenhouse gases are released together. To achieve this, we crafted a detailed gridded emission inventory that captured both time-based and spatial-based nuances. Based on annual emissions, the results were further allocated by month and mapped to a 3 km × 3 km spatial grid.
For temporal distribution, monthly variation was determined based on activity profiles of different emission source. Key monthly activity parameters were collected through sector-specific surveys and field investigations. These parameters included electricity generation, traffic volume, satellite fire counts, residential activity patterns, construction schedules, and precipitation. Using these data, weighted monthly coefficients were developed to reflect the temporal variation of different source. These coefficients were then applied to allocate annual emissions across individual month, resulting in a time-resolved emission profile.
Although high-resolution spatial allocation methods for air pollutants are relatively well established, grid-based mapping of GHG emissions remains limited. In particular, refined spatial distribution of GHGs has lacked systematic methodological approaches. In this study, spatial allocation was conducted using ArcGIS software, with emissions mapped to a 3 km × 3 km grid. The allocation process emphasized enhancing the representation of point-source. For major sectors such as power, steel, cement, and chemicals, geographic coordinates of 7390 enterprises were collected. These covered 23 key industries, including cement, glass, and iron and steel. Line sources were allocated based on road networks and traffic volume, while area sources were distributed using land use and population density data. The final gridded inventory demonstrates high spatial resolution and a high coverage rate of point source. The uncertainty of the grid spatial distribution is mainly due to the deviation of proxy data such as population density and cultivated land area in spatial distribution, as well as the inaccuracy of the geographical coordinates of pollution sources. Detailed temporal and spatial allocation parameters are provided in Tables S8–S9.
2.5 Identification method of hotspot regions for co-control
To pinpoint areas where CO2 and key air pollutants overlap, this research leveraged a hotspot analysis. We employed ArcGIS to conduct and visualize this analysis. Initially, using our pre-existing 3 km × 3 km gridded emission inventory, we mapped out the spatial distribution of CO2 alongside four pollutants of target, namely SO2, NOx, PM2.5, and VOCs, across the entire grid network of Henan Province. Each pollutant, including CO2, was ranked independently according to grid-level emission intensity. Grids within the top 20 % were classified into four hotspot categories: the top 5 % as Category 1, 6 %–10 % as Category 2, 11 %–15 % as Category 3, and 16 %–20 % as Category 4. A bi-directional matching rule was then applied to identify co-hotspots. For example, if a grid ranked within the top 20 % for both CO2 and SO2 emissions, it was identified as a CO2–SO2 co-hotspot. The same method was used to identify co-hotspot zones for CO2 with NOx, PM2.5, and VOCs. These results provide spatial insights into areas with high levels of both carbon and pollutant emissions.
3.1 Emissions and source contribution
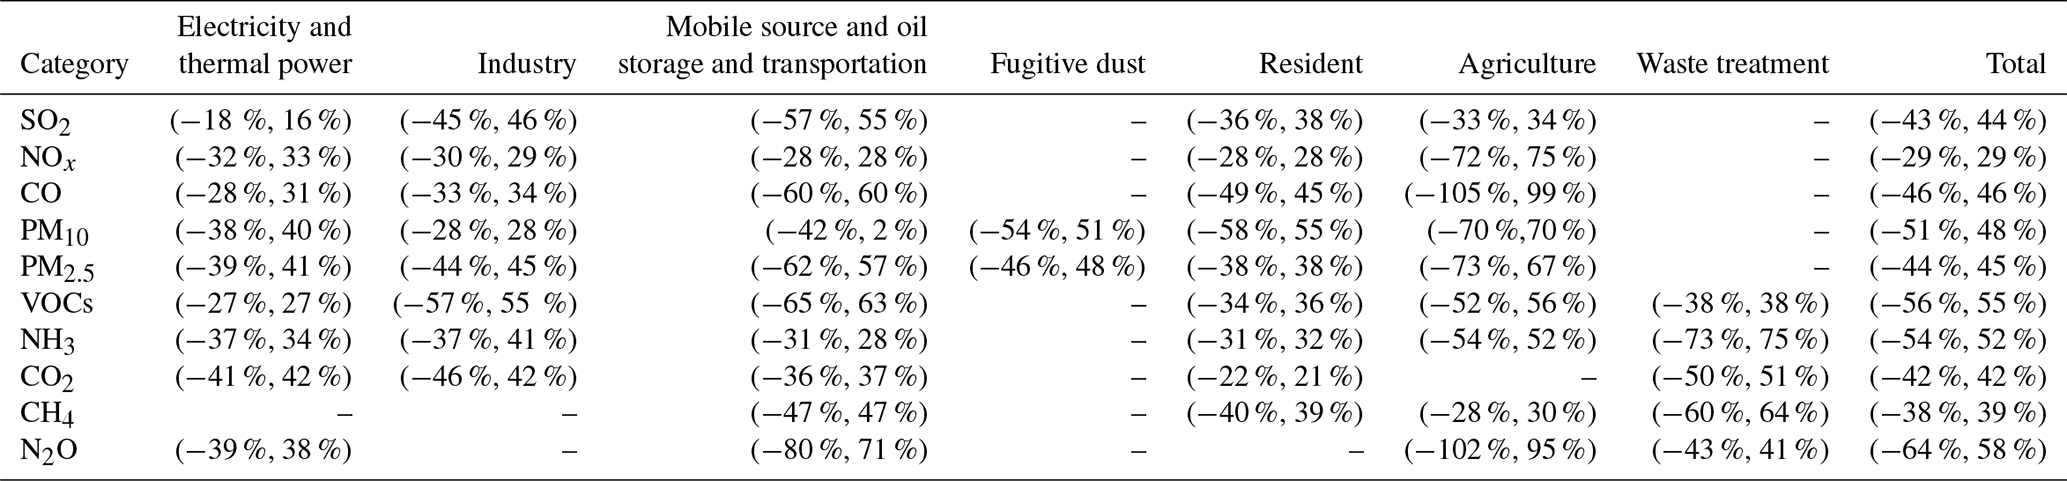
As shown in Table 1 and Fig. 2, the data illustrated the composition of atmospheric pollutants and GHGs emitted from the seven primary source categories in Henan Province. In 2022, the cumulative emissions were staggering, with SO2 contributing 408.7 kt, NOx at 1336.2 kt, CO at 4647.3 kt, PM10 at 901.1 kt, PM2.5 at 440.0 kt, VOCs at 759.3 kt, NH3 at 672.7 kt, BC at 47.4 kt, OC at 90.3 kt, CO2 at 540462.0 kt, CH4 at 12462.0 kt, and N2O at 42.9 kt. (All emission contribution percentages reported in this section, unless otherwise specified, refer to the contribution of the emission source to the total emissions of the species).
Table 1Emissions of air pollutants and GHGs in Henan Province by source category, 2022 (Unit: kt).

Annotation: The original data for the OC emissions from electricity and thermal power is 0.02 kt, which has been rounded to 0.0 kt.

Figure 2Source contributions of air pollutants and GHG emissions. (a) Overall source distribution across pollutants; (b-i) Sub-category source distribution across pollutants: (b) SO2, (c) NOx (d) CO, (e) PM10, (f) PM2.5, (g) VOCs, (h) NH3, (i) CO2.
SO2 emissions are mainly from industrial source, accounting for 83.5 % of the total emission. Among the industrial source, industrial combustion was the most dominant sub-category, accounting for 47.2 %, followed by cement manufacturing (12.1 %) and chemical raw material manufacturing (11.6 %). The high emission levels in the industrial sector are primarily attributed to its substantial coal consumption, which constitutes 38.3 % of the province's total, coupled with relatively lagging desulfurization control technologies in certain kilns. Among non-industrial sources, residential activity contributes 6.45 % of emissions, slightly exceeding that of the electricity and thermal power sector at 5.0 %. This discrepancy mainly stems from the significant progress in ultra-low emission retrofits within the power industry since the 13th Five-Year Plan period, whereas pollution control measures for residential solid fuel use, particularly the co-combustion of coal and biomass in households, remain comparatively underdeveloped.
NOx emissions are primarily attributed to mobile source and oil storage and transportation, industrial source, and electricity and thermal power, accounting for 39.8 %, 36.2 %, and 21.9 % of the total emission, respectively. Within the mobile source and oil storage and transportation, On-road mobile dominates significantly, contributing to 31.1 % of the total emissions. As a national transportation hub, Henan has experienced increasing road traffic pressure. By 2022, the total length of urban roads reached 19 532 km, 1.8 times that of 2012 (HBS, 2013, 2023). During the same period, the number of heavy-duty trucks increased by approximately 1.5 times (HBS, 2013, 2023). The intensive operation of diesel trucks, especially in logistics centers such as Zhengzhou and Luoyang, has significantly increased NOx emissions. Within industrial sources, industrial combustion (64.2 %) dominated the cement industry. Similar to SO2, within electric thermal sources, coal combustion contributed up to 99.2 % of NOx emissions (Sun et al., 2023). CO emissions are dominated by industrial sources (57.1 %), followed by mobile source and oil storage and transportation (16.9 %) and residential sources (16.7 %). Among the subcategories of industrial source, industrial combustion accounts for 19.1 %, ferrous metal production for 17.3 %, and cement manufacturing for 9.5 %. On-road mobile sources were identified as the primary contributor within the mobile source and oil storage and transportation category, accounting for 93.1 % of the sector's total emissions. This finding aligns with the literature highlighting the dominance of road transport in this sector (e.g., He et al., 2024). The significant contribution to CO emissions can be attributed to intensified transportation activity, driven in part by the increasing number of heavy-duty diesel trucks, a trend also observed in other regions (Keramydas et al., 2019). Residential CO emissions mainly originate from firewood use (7.6 %) and household coal combustion (6.5 %), indicating that traditional energy use in rural and peri-urban areas remains a key emission source. The transition to clean energy alternatives in these regions remains insufficient and requires further promotion.
PM10 and PM2.5 were mainly from fugitive dust, industrial, and residential sources. Fugitive dust source contributed 49.0 % of PM10, while industrial source accounted for 21.2 %. Within sub-sources of emissions from dust source, road dust (23.0 %) and construction dust (25.9 %) were predominant, indicating significant contributions of transportation and urban construction to particulate emissions. From 2012 to 2022, the length of urban roads in Henan Province increased by 8734 km (an 81.0 % rise), and the total area under building construction grew by 64.4 % (HBS, 2013, 2023). Urban expansion and infrastructure development have significantly increased dust emissions from roads and construction sites (Zhou et al., 2023). On the other hand, PM2.5 was mainly derived from industrial source, dust source and residential, accounting for 43.7 %, 24.4 % and 18.0 %, respectively. In the residential sector, biomass combustion contributes to 6.8 % of PM2.5 emissions, primarily resulting from the use of firewood and crop residues in rural areas. This indicates that the adoption of clean energy alternatives remains insufficient, positioning biomass combustion as a significant contributor.
The primary sources of VOCs emissions are predominantly industrial, residential, and mobile source and oil storage and transportation source, accounting for 38.3 %, 32.3 %, and 24.1 % of the total emissions, respectively. Within sub-sources of emissions from industrial source, chemical manufacturing, non-ferrous metals, and industrial combustion together account for 14.0 % of VOCs emissions. This reflects the dominance of traditional heavy industries in Henan, a pattern consistent with findings in other industrial regions (e.g., Zhou et al., 2021). This reflects the dominance of traditional heavy industries in Henan. The relatively high proportion of residential source emissions is attributed to the source classification methodology, which incorporates civil solvent use, architectural surface coating, asphalt paving, and pesticide use within the residential category. On the residential side, asphalt paving (9.6 %) and building surface coating (6.9 %) are the primary subcategories. These emissions are closely linked to large-scale urban construction, where coatings, adhesives, and asphalt materials are widely used (Liang et al., 2021). Mobile source and oil storage and transportation emerge as the predominant contributor. This substantial contribution can be attributed to Henan Province's extensive vehicle fleet, with Zhengzhou alone having 4.6 million vehicles in stock in 2022, ranking sixth nationally (HBS, 2023; HPDEE, 2022). As a province with 98.7 million permanent residents and serving as a crucial transportation hub connecting northern and southern China (HBS, 2023), Henan experiences substantial traffic volumes from both local commuting and long-distance freight transport. The province's well-developed highway network and rapid economic growth have driven increased vehicle ownership and usage, consequently elevating VOCs emissions from mobile source and oil storage and transportation.
NH3, CH4, and N2O emissions are mainly from agricultural source, accounting for 94.3 %, 90.0 %, and 55.8 % of total emissions, respectively. Livestock farming is the main contributor to all three. Henan is a major livestock province, with 42.6 million live pigs in stock in 2022, ranking second nationally (HBS, 2023). Large amounts of manure release NH3, CH4, and N2O through volatilization, anaerobic decomposition, and denitrification, forming the key agricultural emission pathways. The province also has abundant agricultural land, with a stable arable area of 14.7 million ha. As a major grain and agricultural production base, Henan applies fertilizers intensively, particularly nitrogen fertilizers, which significantly contribute to increased NH3 and N2O emissions. In terms of N2O, 34.3 % of emission is attributed to electricity and thermal power source, with nearly all (99.9 %) originating from coal combustion. This highlights once again the province's dependence on coal within its energy structure.
CO2 emissions are primarily from electricity and thermal power (45.9 %) and industrial source (37.2 %), together contributing 83.1 % of total emissions. This highlights Henan's heavy dependence on coal-based energy and energy-intensive industries. Almost all emissions from the power sector (99.5 %) originate from coal combustion, supported by six major coalfields and annual coal consumption exceeding 200 Mt. This coal-dominated energy structure is the primary driver of CO2 emissions in the power sector (Wang et al., 2024). Industrial CO2 emissions are mainly predominantly generated by high-emission sectors such as steel, chemicals, and building materials. Specifically, coal-fired industrial boilers account for 84.5 % of industrial emissions, while cement production contributes 14.9 %. As a key transportation hub, Henan experiences intensive freight activity, particularly from heavy-duty diesel trucks, which constitute the main source of CO2 emission from mobile source and oil storage and transportation (Zhang et al., 2025).
3.2 Emission characteristics at the city level
Influenced by its industrial structure and functional positioning, the emission patterns of pollutant and GHGs emission across the study region exhibit clear geographical characteristics and synergistic variation trends (Figs. 3 and 4). The northern region, encompassing Anyang, Hebi, and Jiaozuo, is dominated by energy-intensive heavy industries such as steel production, non-ferrous metals processing, and building materials manufacturing. The extensive use of coal in these activities leads to high emission of SO2, NOx, and PM2.5, as well as significantly elevated levels of CO2 emission intensity.
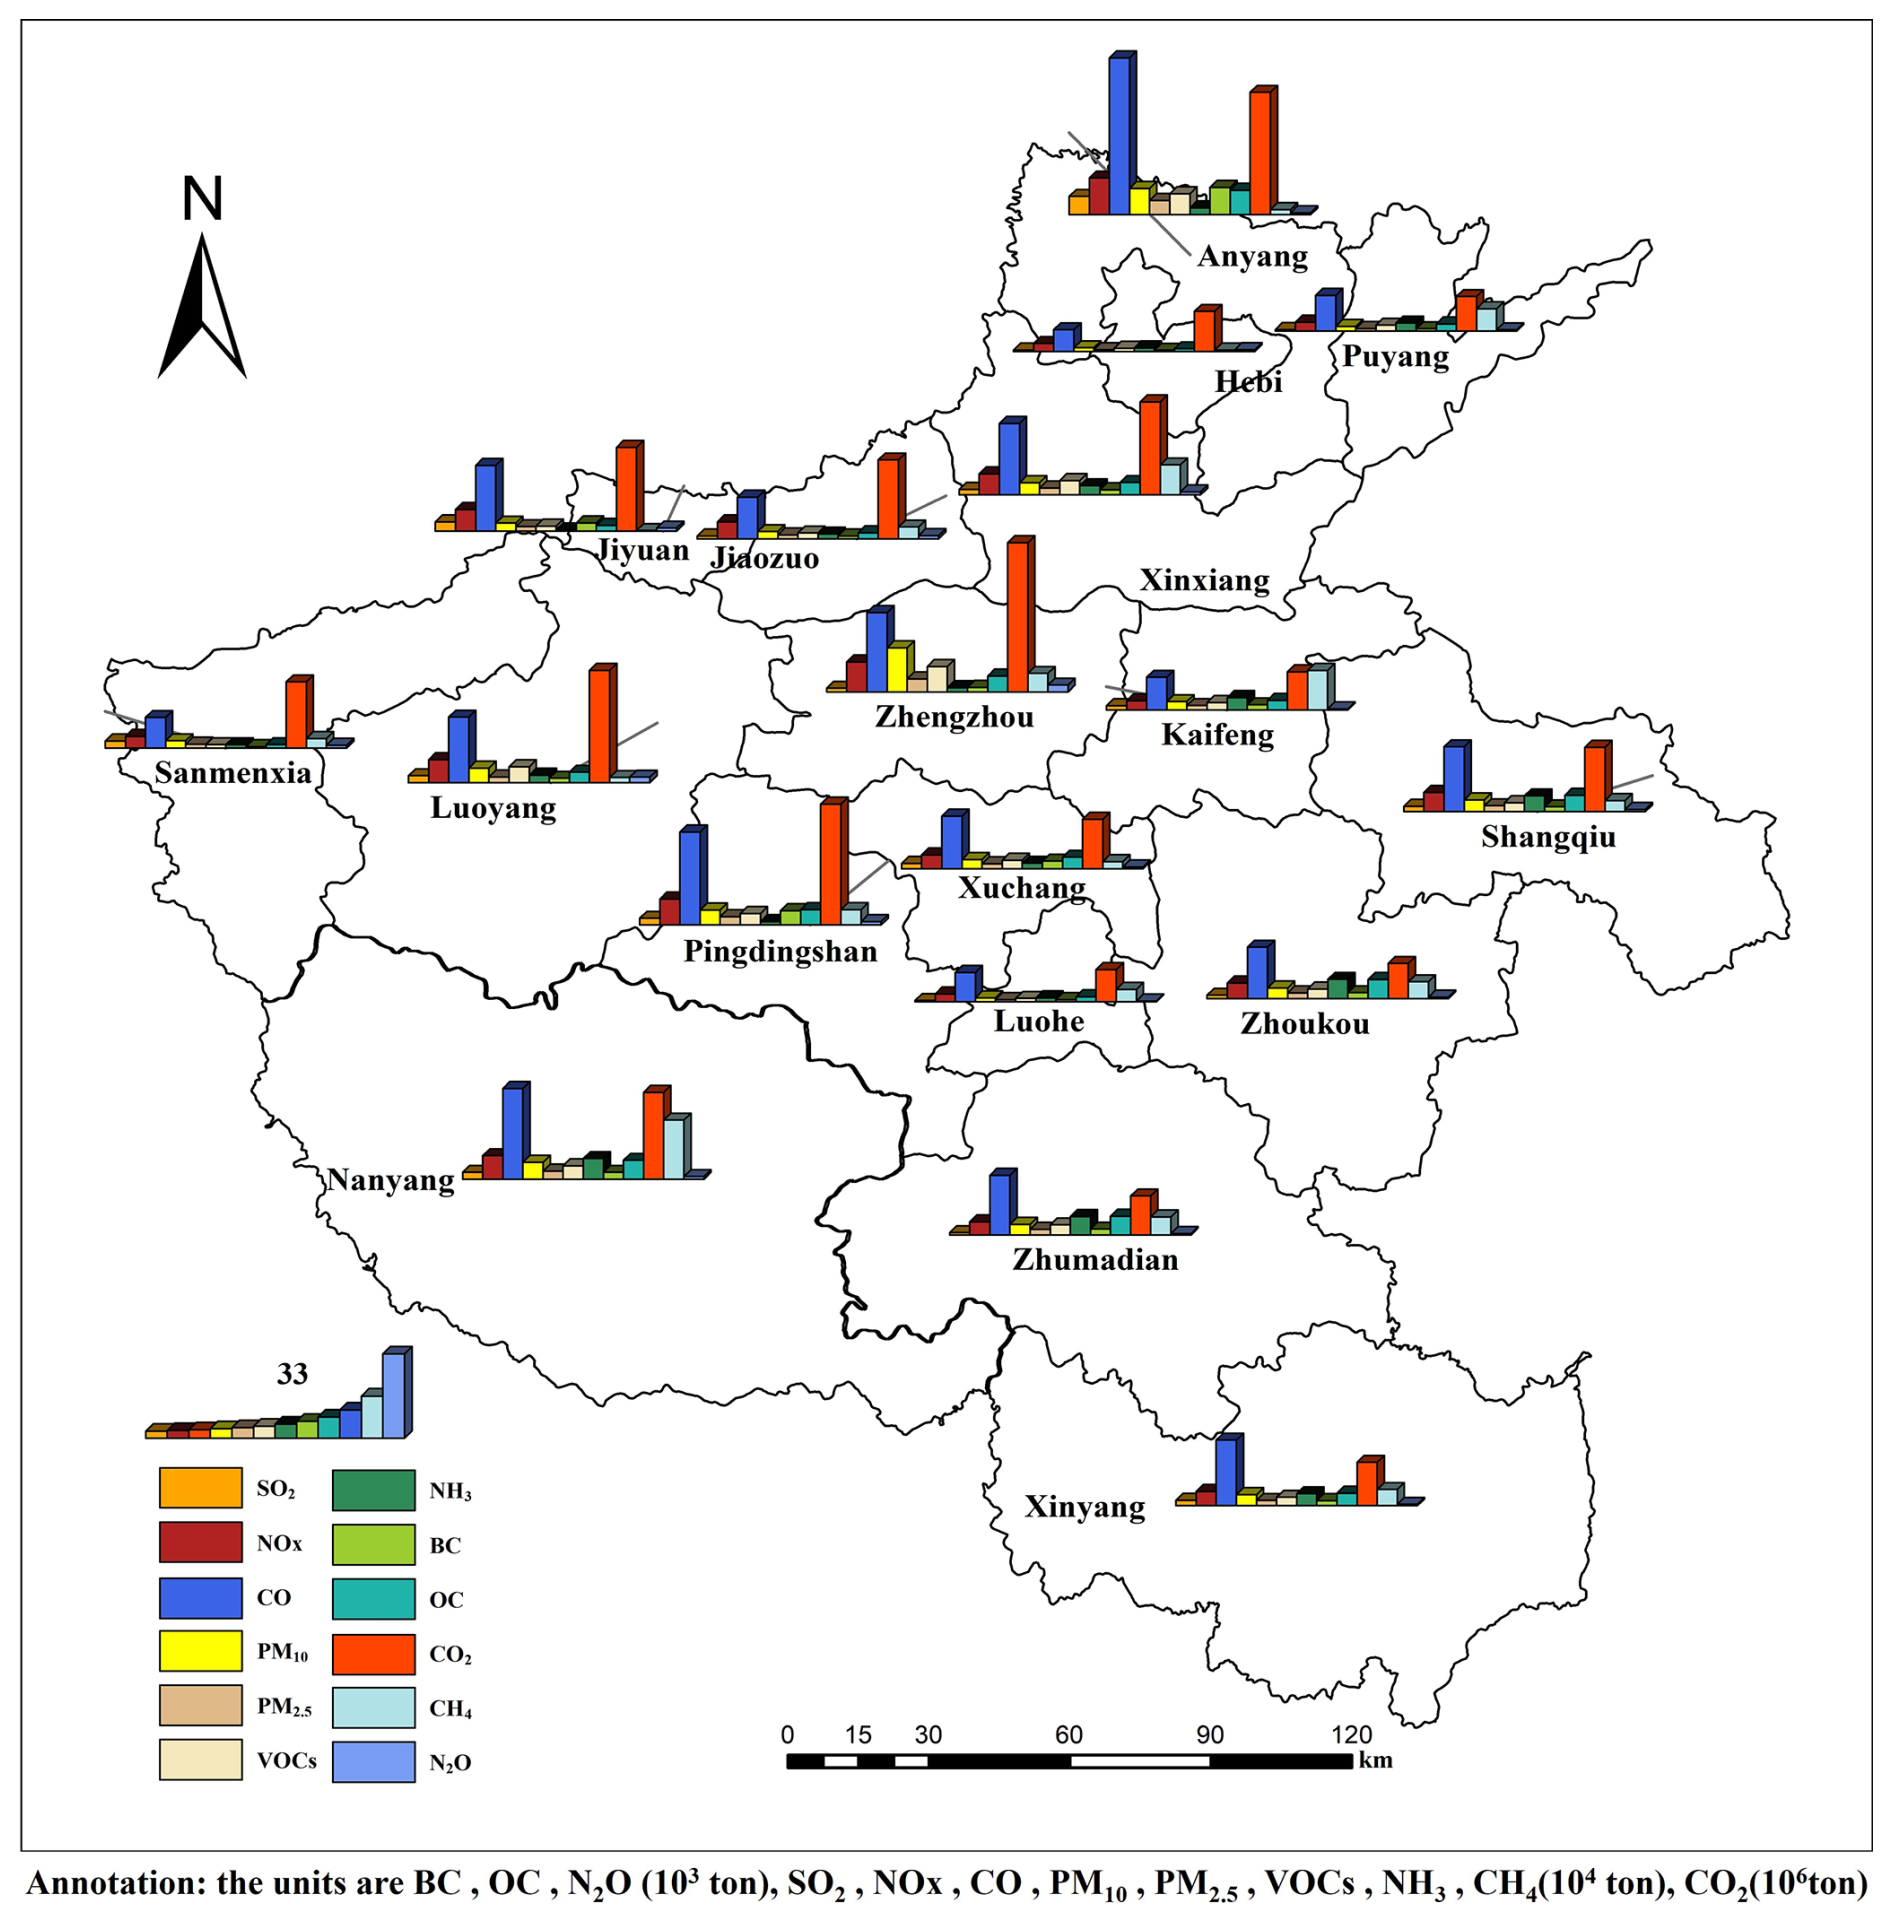
Figure 3Map of air pollutants and GHG emissions in each city.
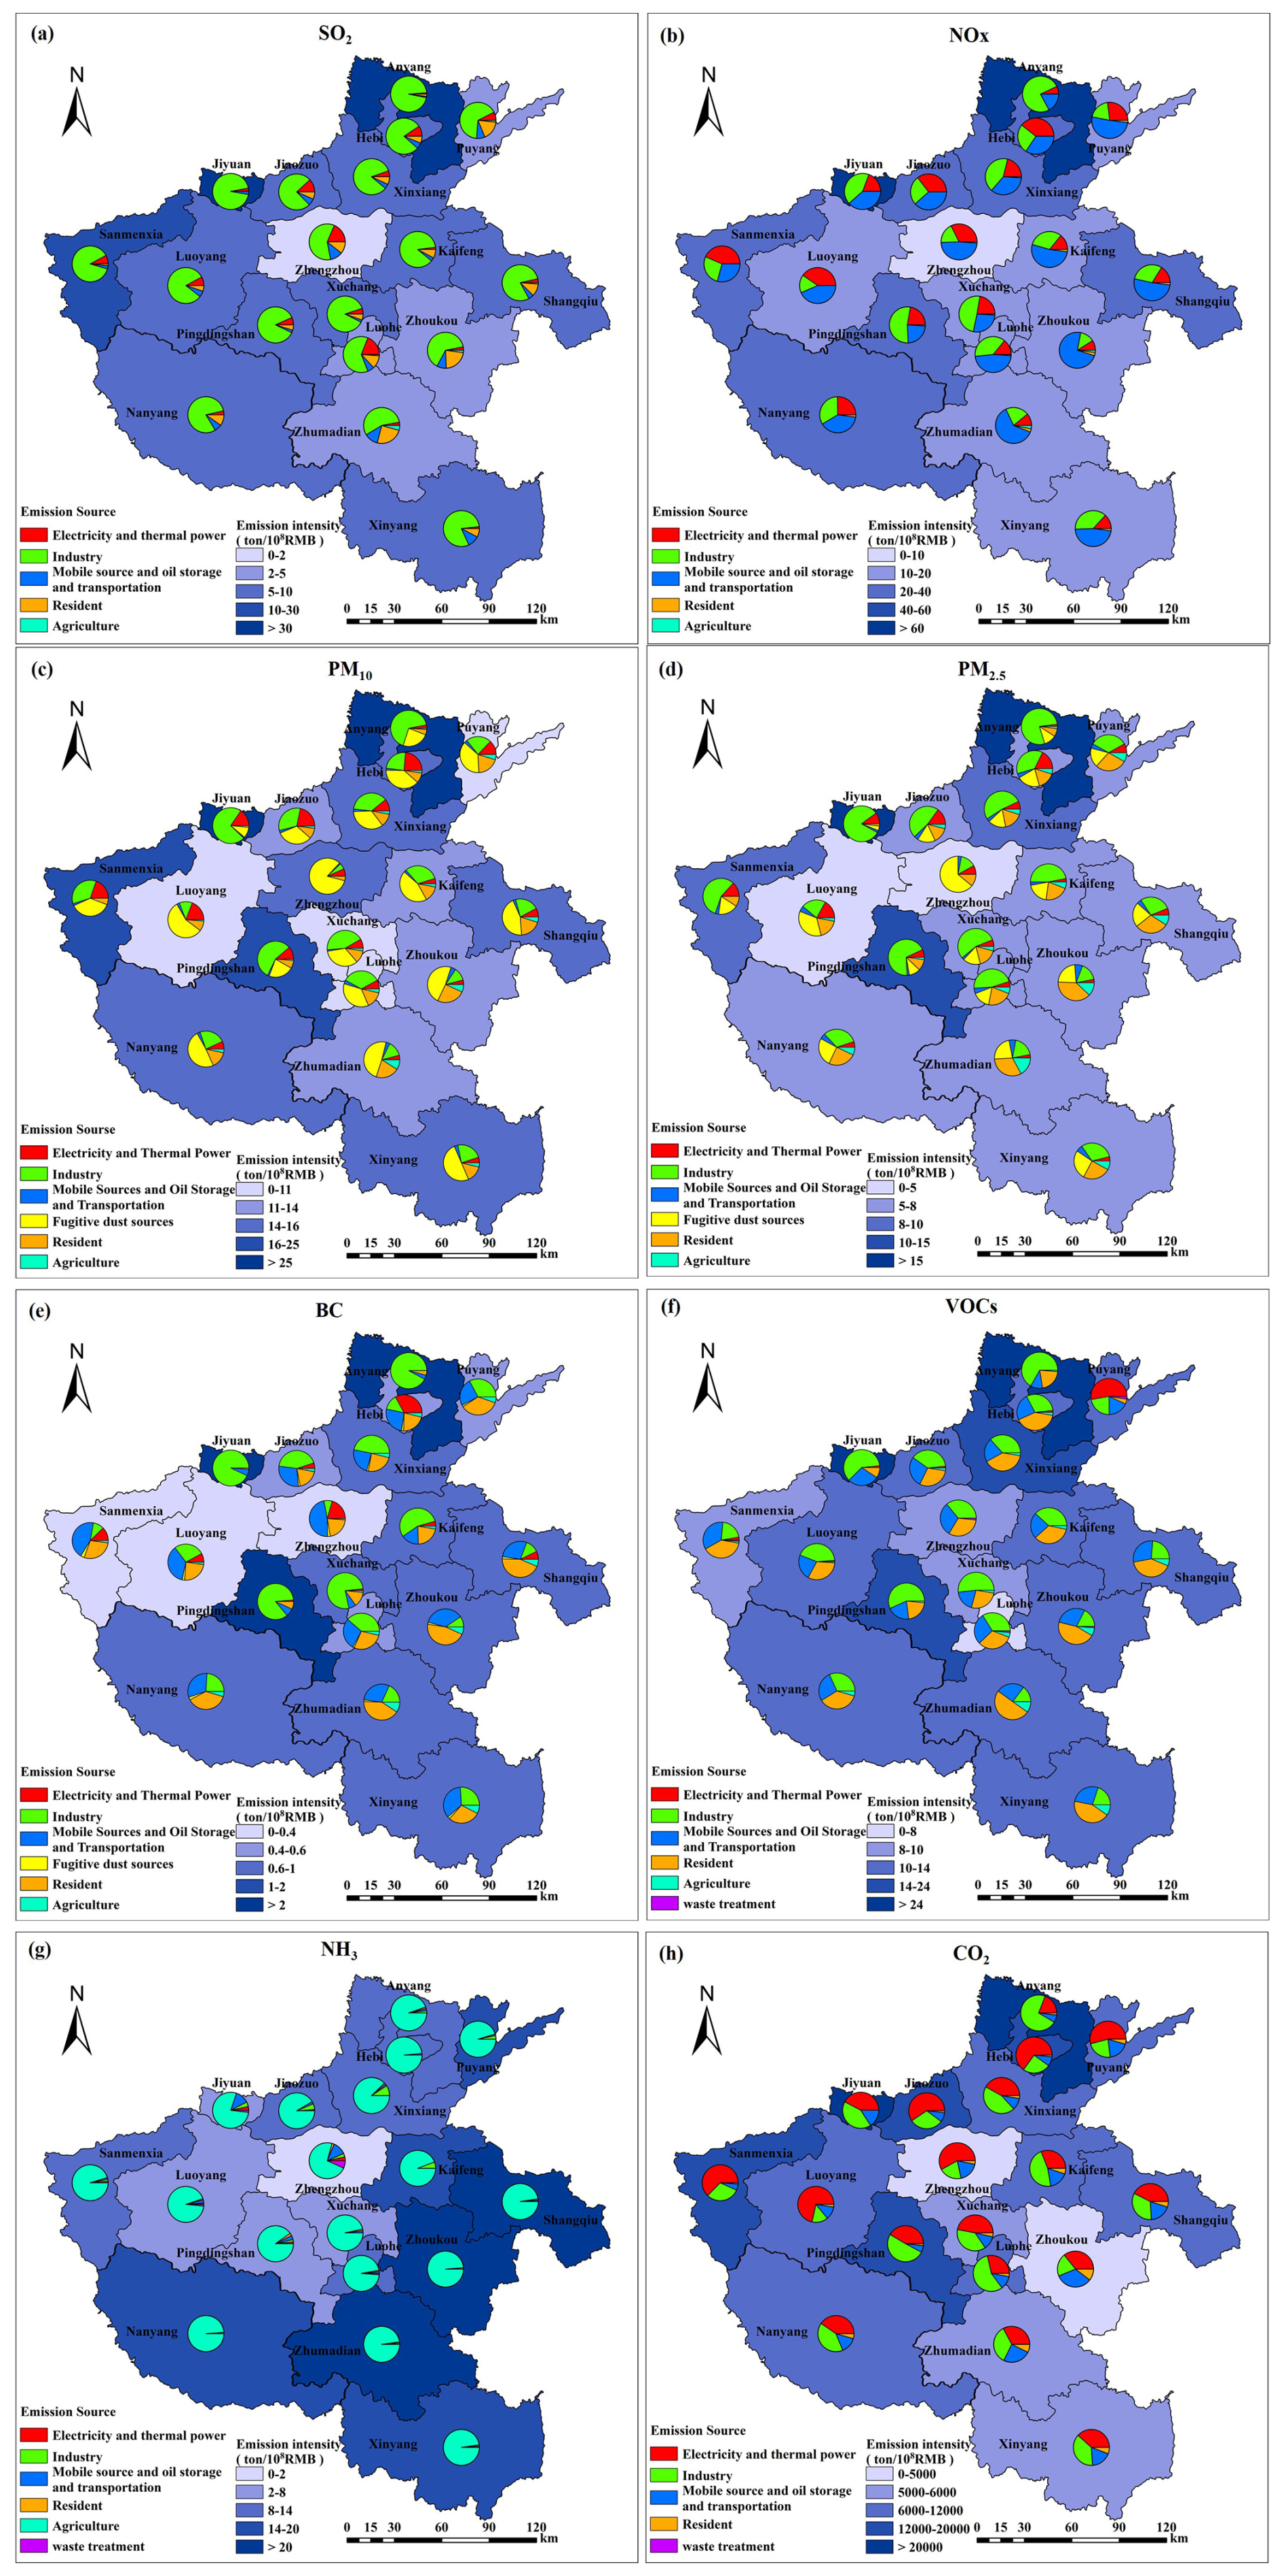
Figure 4Maps of emission intensity per unit of GDP (t per 108 RMB) for (a) SO2, (b) NOx, (c) PM10, (d) PM2.5, (e) BC, (f) VOCs, (g) NH3, and (h) CO2 across cities. Pie charts in maps indicate the emission source contributions of each city.
Anyang exemplifies this pattern with 2022 emissions of 77.3 kt SO2, 15.4 kt NOx, and 59.7 kt PM2.5. Its CO2 emissions totaled 513.6 Mt, yielding a carbon intensity of 20 444 t per CNY 108 GDP-1.6 times the provincial average of 11.7 kt per CNY 108 GDP. Source contribution analysis indicates that industrial source contributes 95.5 % of SO2 and 74.6 % of NOx emissions. Combined industrial source and electricity and thermal power account for over 91.0 % of regional CO2 emissions. Similar emission profiles observed in Jiaozuo and Hebi indicate that this region as a concentrated hotspot for both air pollutants and carbon emissions.
As for the central region, with Zhengzhou at its core, it is the main political, economic and transportation hub of the province. As for the central region, with Zhengzhou as its core, serves as the province's primary hub for political, economic, and transportation. This area exhibits high NOx and VOCs emissions along with the highest CO2 emission levels in the province. Zhengzhou recorded 125.6 kt of NOx emissions in 2022, ranking second in the province, with mobile source and oil storage and transportation contributing 61.0 %. The city's VOCs emissions reached 106.3 kt, ranking first provincially, with mobile source and oil storage and transportation accounting for over 30.0 % of the total. Despite generating the province's largest CO2 emissions (625.7 Mt), the carbon intensity remains relatively low at 4.8 kt per CNY 108 GDP, attributed to substantial economic output representing 21.1 % of provincial (HBS, 2023). The city's vehicle fleet consists of 4.6 million units, accounting 23 % of the provincial total, and ranks first in the province in terms of passenger vehicles, heavy-duty trucks, and new registrations (ZBS, 2023). This extensive transportation infrastructure and logistics operations make road transport the primary contributor to air pollution and carbon emissions both.
In addition, the western region, including Luoyang, Pingdingshan, and Jiyuan, utilizes its abundant coal resources to support the development of energy and chemical industries, leading to increased SO2 emissions and a high carbon dioxide intensity. Jiyuan exemplifies this high-carbon emission model, with 378.8 kt of SO2 emission and 349.7 Mt of CO2 emission in 2022. Its carbon intensity of 438.4 kt per CNY 108 GDP is 3.7 times higher than that the provincial average. Emission sources analysis reveal that industrial source contributes 94.0 % of SO2 emission, while industrial source (41.7 %) and electricity and thermal power source (42.2 %) together account for 83.9 % of CO2 emission.
In the southern (Zhumadian, Xinyang, Zhoukou) and eastern (Kaifeng, Shangqiu) regions of Henan Province, the most notable feature is that the NH3 emissions from agricultural activities are relatively large, but the total amount and intensity of carbon emissions are relatively low. For instance, the proportion of the primary industry in the GDP of Zhumadian in the southern region is 17.6 %, which is the highest in the province. A large livestock population, including 6.7 million pigs and 53.6 million poultry, generates 76.8 kt of NH3 emissions (ZBS, 2024), of which agricultural sources account for 96.5 %. On the contrary, the total regional CO2 emissions were only 163.3 Mt, with an emission intensity of 50 000 kt per CNY 108 GDP, which was significantly lower than that of northern industrial cities. The NH3 emissions of Shangqiu in the eastern region were 666 kt, ranking fourth in the province and far exceeding the provincial average. In contrast, the regional CO2 emissions were lower than the provincial average. Together, they form an “agricultural-dominated” emission model that is completely different from that of the industrial cities in the north.
3.3 Comparison and evaluation of emission inventory
3.3.1 Comparison with other emission inventories
To evaluate the reliability of the emission inventory developed in this study, we conducted a comparative analysis with several existing studies and databases, as summarized in Table 2.
Table 2Comparisons with other study.

Annotation: MEIC1.4 V2.0, Spatial Coverage: China (Multi-resolution Emission Inventory for China, developed by Tsinghua University, http://meicmodel.org.cn/?page_id=560, last access: 5 January 2026); CHRED, Spatial Coverage: China (China High-Resolution Emission Database, Developed by the Department of Earth System Science, Tsinghua University, College of Environmental Sciences and Engineering, Peking University; Institute of Atmospheric Environment, Chinese Research Academy of Environmental Sciences; https://www.ieimodel.org, last access: 5 January 2026); CEADs, Spatial Coverage: China (China Emission Accounts and Datasets, Developed by Institute of Climate Change and Sustainable Development, Tsinghua University, https://www.ceads.net/data/province/, last access: 5 January 2026).
It should be noted that differences in the reference years between this study and other inventories may also contribute to the discrepancies in emission estimates discussed below. First, regarding GHGs, the estimated CO2 emissions in this study are notably higher than those reported by MEIC and CEADs. This difference primarily stems from variations in activity data source and spatial resolution. While all studies employ the emission factor approach, our estimates are derived from individual enterprise-level accounting of 7390 designated size industrial enterprises, incorporating detailed terminal energy consumption data from power and heating sectors, using one-to-one enterprise-level accounting rather than aggregated statistical data. In contrast, MEIC and CEAD rely on provincial energy balance sheets. That being said, CHRED's CO2 emissions figures for Henan Province are a tad higher than what we've come up with. We reckon this discrepancy boils down to differences in what each of us is counting as part of the whole. The CHRED database accounted for direct emissions (such as the combustion of fossil fuels and industrial processes within the province) and indirect emissions (such as the consumption of purchased electricity), while this study focuses on the direct contributions at the production end and only accounted for direct emissions.
In terms of air contaminants, our findings show that the projected discharges of SO2, NOx, PM10 and PM2.5 are actually more substantial than the figures provided by the MEIC. This can be attributed to the treatment of key emission source categories through enterprise-specific activity data. For industrial source, emissions were calculated through one-to-one enterprise-level accounting, particularly for high-emission industries such as cement, steel, and chemicals.
In contrast, the estimated emissions of NH3, CO and VOCs are slightly lower than those reported in MEIC. the open burning of crop residues was estimated using satellite-based fire hotspot data. The number of fire points was used to adjust burning ratios across different regions, thereby generating less region-specific emission factors. The differences in CO emissions are primarily attributed to the localized emission factors applied to mobile sources and the oil storage and transportation sector. These factors have been calibrated based on local meteorological data, vehicle age distribution, and fuel standards. The lower VOC emissions are attributed to multiple factors beyond just the mobile and oil storage and transportation sector. First, activity levels decreased in key industrial sources, such as industrial painting and surface spraying. Second, residential activities like dining and household solvent use also declined. This reduction in residential activities was partly due to a decrease in building area in 2022, and partly due to intermittent interruptions in services like dining and dry cleaning during the epidemic lockdowns in the second half of the year. Combined, these factors led to the overall reduction in VOC emissions.
Additionally, to compare regional emission levels, we analyzed emission inventory data from other provinces, such as Guangdong and Shaanxi (Li et al., 2023; Bo et al., 2023). The results indicate that Henan Province generally exhibits higher emissions of most pollutants. It can be explained by differences in industrial and energy structures. As a major agricultural and industrial province in Central China, our study region relies heavily on coal and maintains intensive agricultural activities, which contribute to elevated emissions of SO2, NOx, NH3, and CH4. In contrast, Guangdong benefits from a cleaner energy structure and an economy dominated by the service sector, thereby reducing emissions. Although Shaanxi possesses a substantial industrial base, with the primary sector accounting for 7.8 %, the secondary sector for 47.6 %, and the tertiary sector for 44.6 % (SPBS, 2023), its industrial structure differs significantly from that of Henan. Coal mining constitutes a large proportion of Shaanxi's industrial structure, with annual raw coal production consistently ranking third nationally. Additionally, Shaanxi has a lower vehicle ownership compared to Henan, resulting in emission differences between the two provinces.
3.3.2 Uncertainty analysis
Uncertainties in emission inventories arise mainly from the volatility and incompleteness of data on emission factor and activity date of emission source, as well as errors and under-representation of monitoring instruments. These issues are inherent challenges in constructing emission inventory (Super et al., 2020). This study employs the Monte Carlo simulation method to assess the uncertainty of the emission inventory. With respect to the probability distribution characteristics of emission factors, a 10 000-iteration random sampling simulation is conducted to calculate the 95 % confidence intervals for pollutant emissions from each source category (Table 3). Among all pollutants, the emissions of NH3, VOCs, and N2O show relatively high uncertainty. This is mainly due to the limited representativeness of emission factors and difficulties in collecting reliable activity data. For NH3, the main source of uncertainty lies in activity data, with waste treatment showing the highest uncertainty (−73 %, 75 %), followed by agriculture (−54 %, 52 %). The primary reason is the complexity of emission processes and challenges in accurate monitoring. In waste treatment, different treatment technologies and variable waste composition contribute to emission uncertainties (Zheng et al., 2012). In agricultural activities, varying fertilization practices and changing climatic conditions significantly influence NH3 volatilization, while farmers often lack detailed fertilization records (Lessmann et al., 2025). These factors collectively contribute to the substantial uncertainty in emission data. For VOCs, uncertainty mainly arises from the applicability of emission factors. In sectors such as mobile source and oil storage and transportation, emission levels vary widely due to vehicle conditions, fuel quality, and equipment aging, resulting in an uncertainty of up to −65 % and 63 %. For N2O, uncertainty is primarily concentrated in agricultural source. Data Gaps in data regarding livestock manure management – including treatment methods, storage duration, and application practices – make it challenging to accurately quantify emissions, particularly for small-scale farms (Hu et al., 2024).
3.4 Characteristic of monthly variation and gridded spatial emission
3.4.1 Temporal variation
SO2, CO, PM10 and PM2.5 emissions are high in winter (January and December) (Fig. 5). This is mainly due to the increase in pollutant emissions resulting from the large amount of coal and biomass combustion during the heating period in winter. NH3, CH4 and N2O, which have higher emissions in the summer months, especially June and July, and lowest emissions in the winter months (January and December). Primarily caused by elevated NH3, CH4 and N2O releases during summer months due to intensive agricultural practices, such as the application of nitrogen fertilizers and animal excreta management. In winter, when agricultural activities are reduced, emissions of NH3 and N2O are significantly lower. Emissions of VOCs are relatively stable throughout the year, with small fluctuations reflecting their stable sources of emissions. The highest Emissions of NOx are found in August, and the lowest emissions are found in April and May. This is because during the summer vacation, there is an increase in vehicle travel, resulting in higher NOx emissions. Winter CO2 emissions predominantly stem from fossil fuel burning. The substantial demand for heating during winter leads to an increase in fossil fuel consumption, causing emissions to reach their peak. In contrast, the climate in April is mild; heating requirements have ceased while cooling demands have not yet commenced, resulting in energy consumption returning to baseline levels.
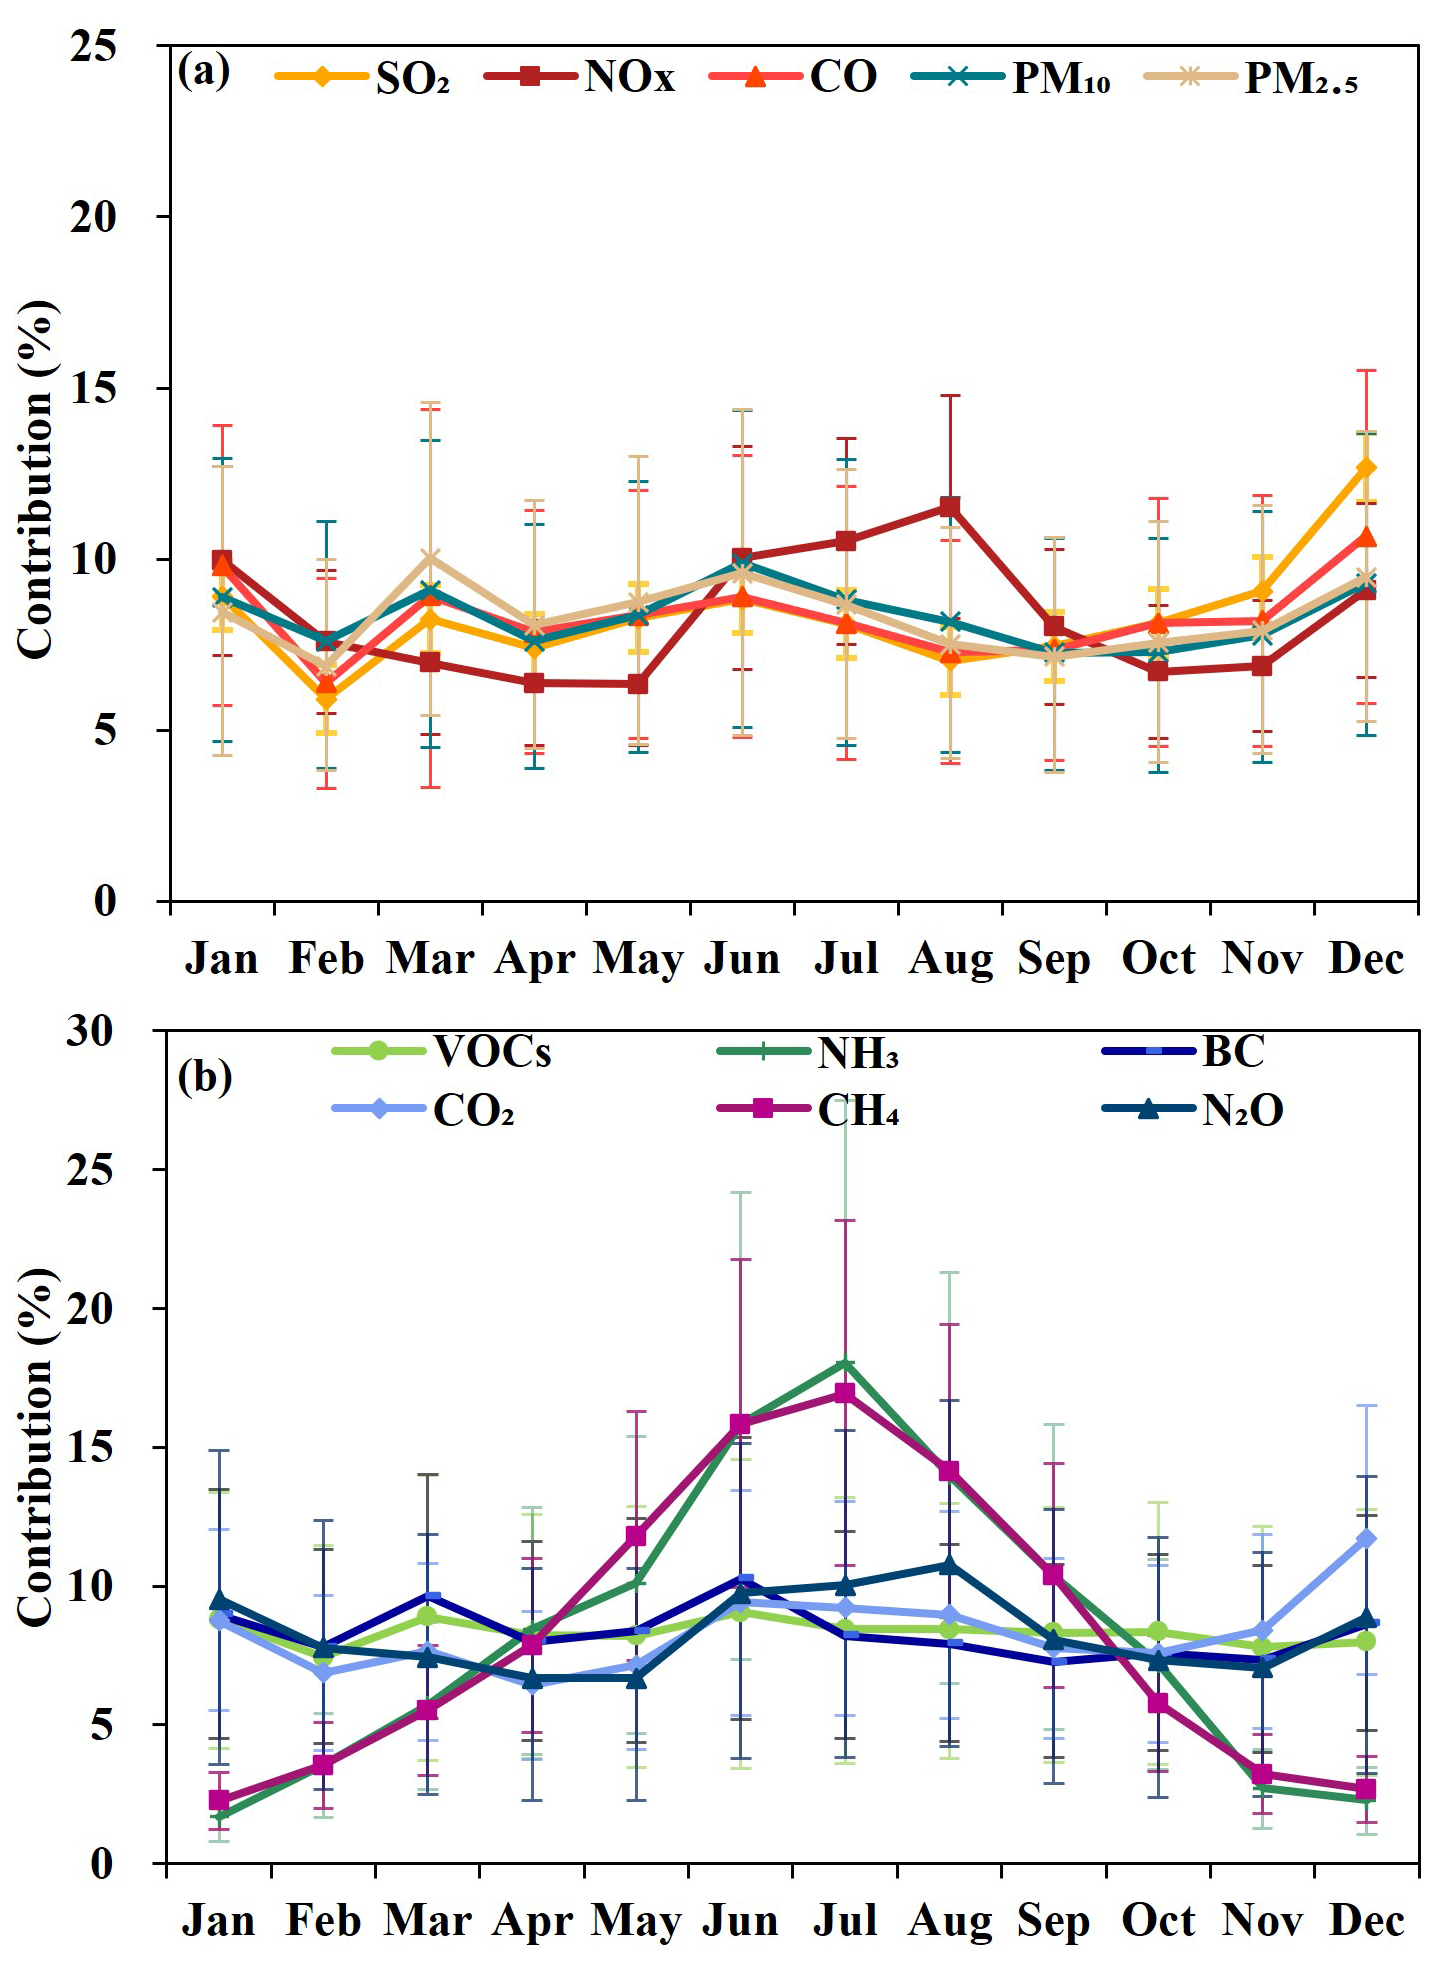
Figure 5Monthly variation of air pollutants and GHG emissions in 2022 with uncertainty boundary.
3.4.2 Spatial distribution
High-emission areas of SO2, NOx, CO, PM10, PM2.5, VOCs, and CO2 are mainly concentrated in cities such as Zhengzhou, Luoyang, Jiaozuo, Xinxiang, Anyang, and Hebi, along with their surrounding regions (Fig. 6). These regions are the province's primary industrial hubs and population hotspots, boasting notably higher emission levels than the rest of the areas. The layout of SO2 and NOx hotspots is tightly tied to the positions of coal-burning power stations, steelworks, and cement plants. These industrial facilities are predominantly situated in heavy industrial cities like Anyang, Jiaozuo, Hebi, and Luoyang. PM10 and PM2.5 emissions are primarily concentrated in Zhengzhou, Luoyang, Jiaozuo, Xinxiang, and Xuchang. In the Zhengzhou metropolitan area, particulate emission exhibits a clear spatial distribution pattern, which is influenced not only by industrial and fugitive dust source but also closely related to heavy urban traffic and high vehicle density. High-emission zones of CO and VOCs are observed in Zhengzhou and its surrounding cities, including Kaifeng, Xinxiang, and Xuchang.
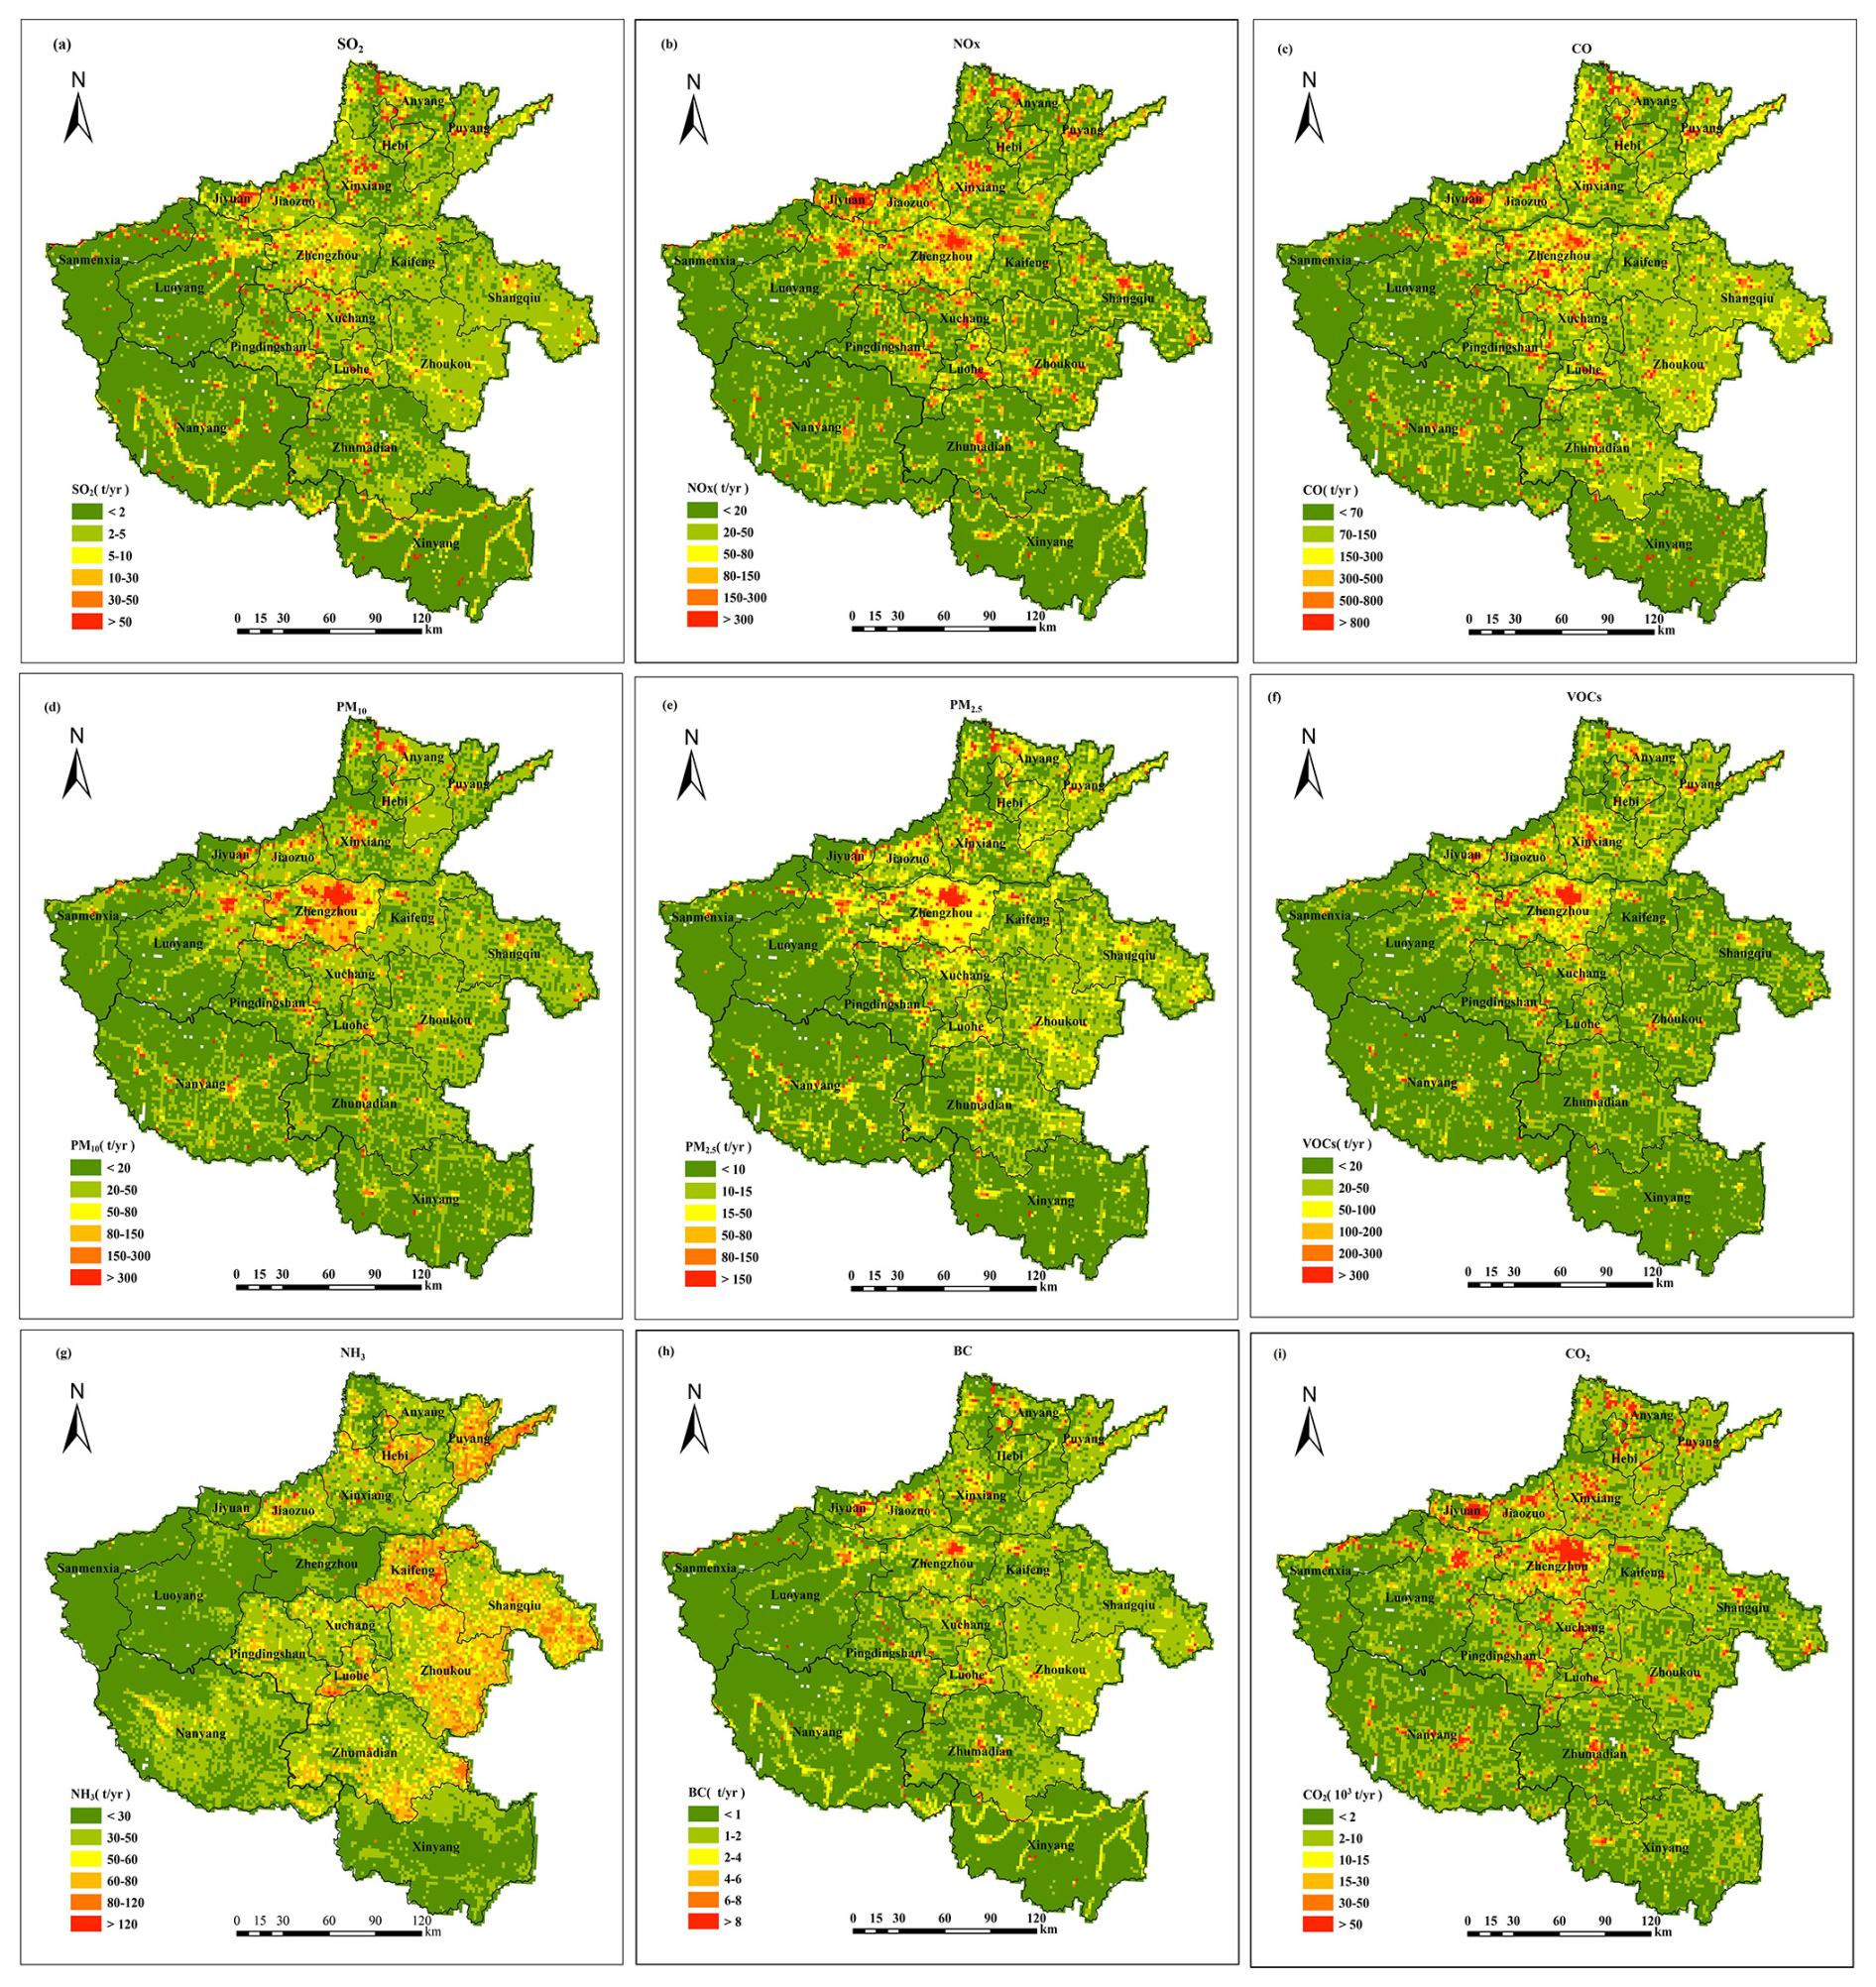
Figure 63 km × 3 km gridded spatial distribution of air pollutants and GHG emissions.
These cities have high road traffic density and account for more than half of the province's total vehicle ownership. In addition, the presence of petrochemical facilities, logistics centers, and fuel stations further contributes to elevated CO and VOCs emissions.
The spatial distribution of CO2 is strongly correlated with energy consumption. Industrial and densely populated cities, such as Zhengzhou, Luoyang, Jiaozuo, Xinxiang, Anyang, and Hebi, exhibit relatively high levels of gridded CO2 emission density. Collectively, these six cities contribute to over 51 % of the province's total industrial energy consumption, amounting to more than 72 Mt of standard coal equivalent. Coal and electricity remain the dominant energy sources, leading to substantial carbon emissions.
In contrast, NH3 exhibits a spatial pattern dominated by agricultural activities. Pronounced emissions concentrate across central, eastern plains with intense farming. Large-scale application of nitrogen fertilizer and livestock farming are the major emission sources of NH3. Elevated NH3 levels are also observed around Zhengzhou, primarily attributed to vehicle emissions from urban traffic.
3.5 Identification and spatial characterization of synergistic emission hotspots
To identify priority areas for the coordinated control of CO2 and air pollutants, grid cells with high co-emissions of both pollutants were identified at a spatial resolution of 3 km × 3 km and defined as “co-hotspots” (Figs. 7 and 8). To analyze temporal variations in emissions, representative months – April (spring), July (summer), November (autumn), and January (winter) – were selected to identify seasonal co-hotspots, with the results shown in Fig. S2.
The results indicate that SO2 emissions show the highest spatial clustering, with Category 1 co-hotspots accounting for 72.2 % of SO2 and 57.1 % of CO2 emissions, yet comprising only 467 locations. These are mainly concentrated in the central-northern industrial zone of Henan, centered on Zhengzhou, Luoyang, and Pingdingshan. Their contribution to CO2 emissions peaks in winter (10 %), reflecting increased industrial heating demand. NOx emissions are also highly concentrated, with Category 1 co-hotspots covering 57.8 % of NOx and 78.8 % of CO2 emissions across 843 locations. They cluster in industrial zones and extend linearly along transport corridors, indicating both industrial and mobile sources. Seasonal contributions to CO2 are elevated in summer (6 %) and winter (10 %). For PM2.5, Category 1 co-hotspots contribute 42.2 % of emissions and 77.6 % of CO2, with 721 locations largely overlapping SO2 hotspots, highlighting industrial dominance. Seasonal counts rise from 146 in spring to about 300 in autumn and winter, with winter contributing 10 % of emissions, linked to intensified industrial and area-source activities. VOCs emissions are more dispersed, with Category 1 co-hotspots contributing only 27.1 %, while non-hotspot areas account for 67.1 %. Spatially, they occur in industrial parks and urban areas, and show stronger coupling with CO2 in winter within key industrial zones. BC emissions from Category 1 co-hotspots make up 34.2 % of BC and 58.2 % of associated CO2, totaling 426 locations aligned with industrial and transport zones. Co-hotspots peak in number during spring (891) but contribute little to CO2 (4 %), indicating widespread low-intensity burning. In winter, they are more concentrated and contribute 8 % of CO2, reflecting centralized heating and industrial coal use. OC emissions are the most dispersed, with Category 1 co-hotspots contributing only 17.1 % – the lowest among pollutants – and non-hotspot areas 81.2 %, suggesting predominance of distributed area sources with limited link to concentrated energy use.
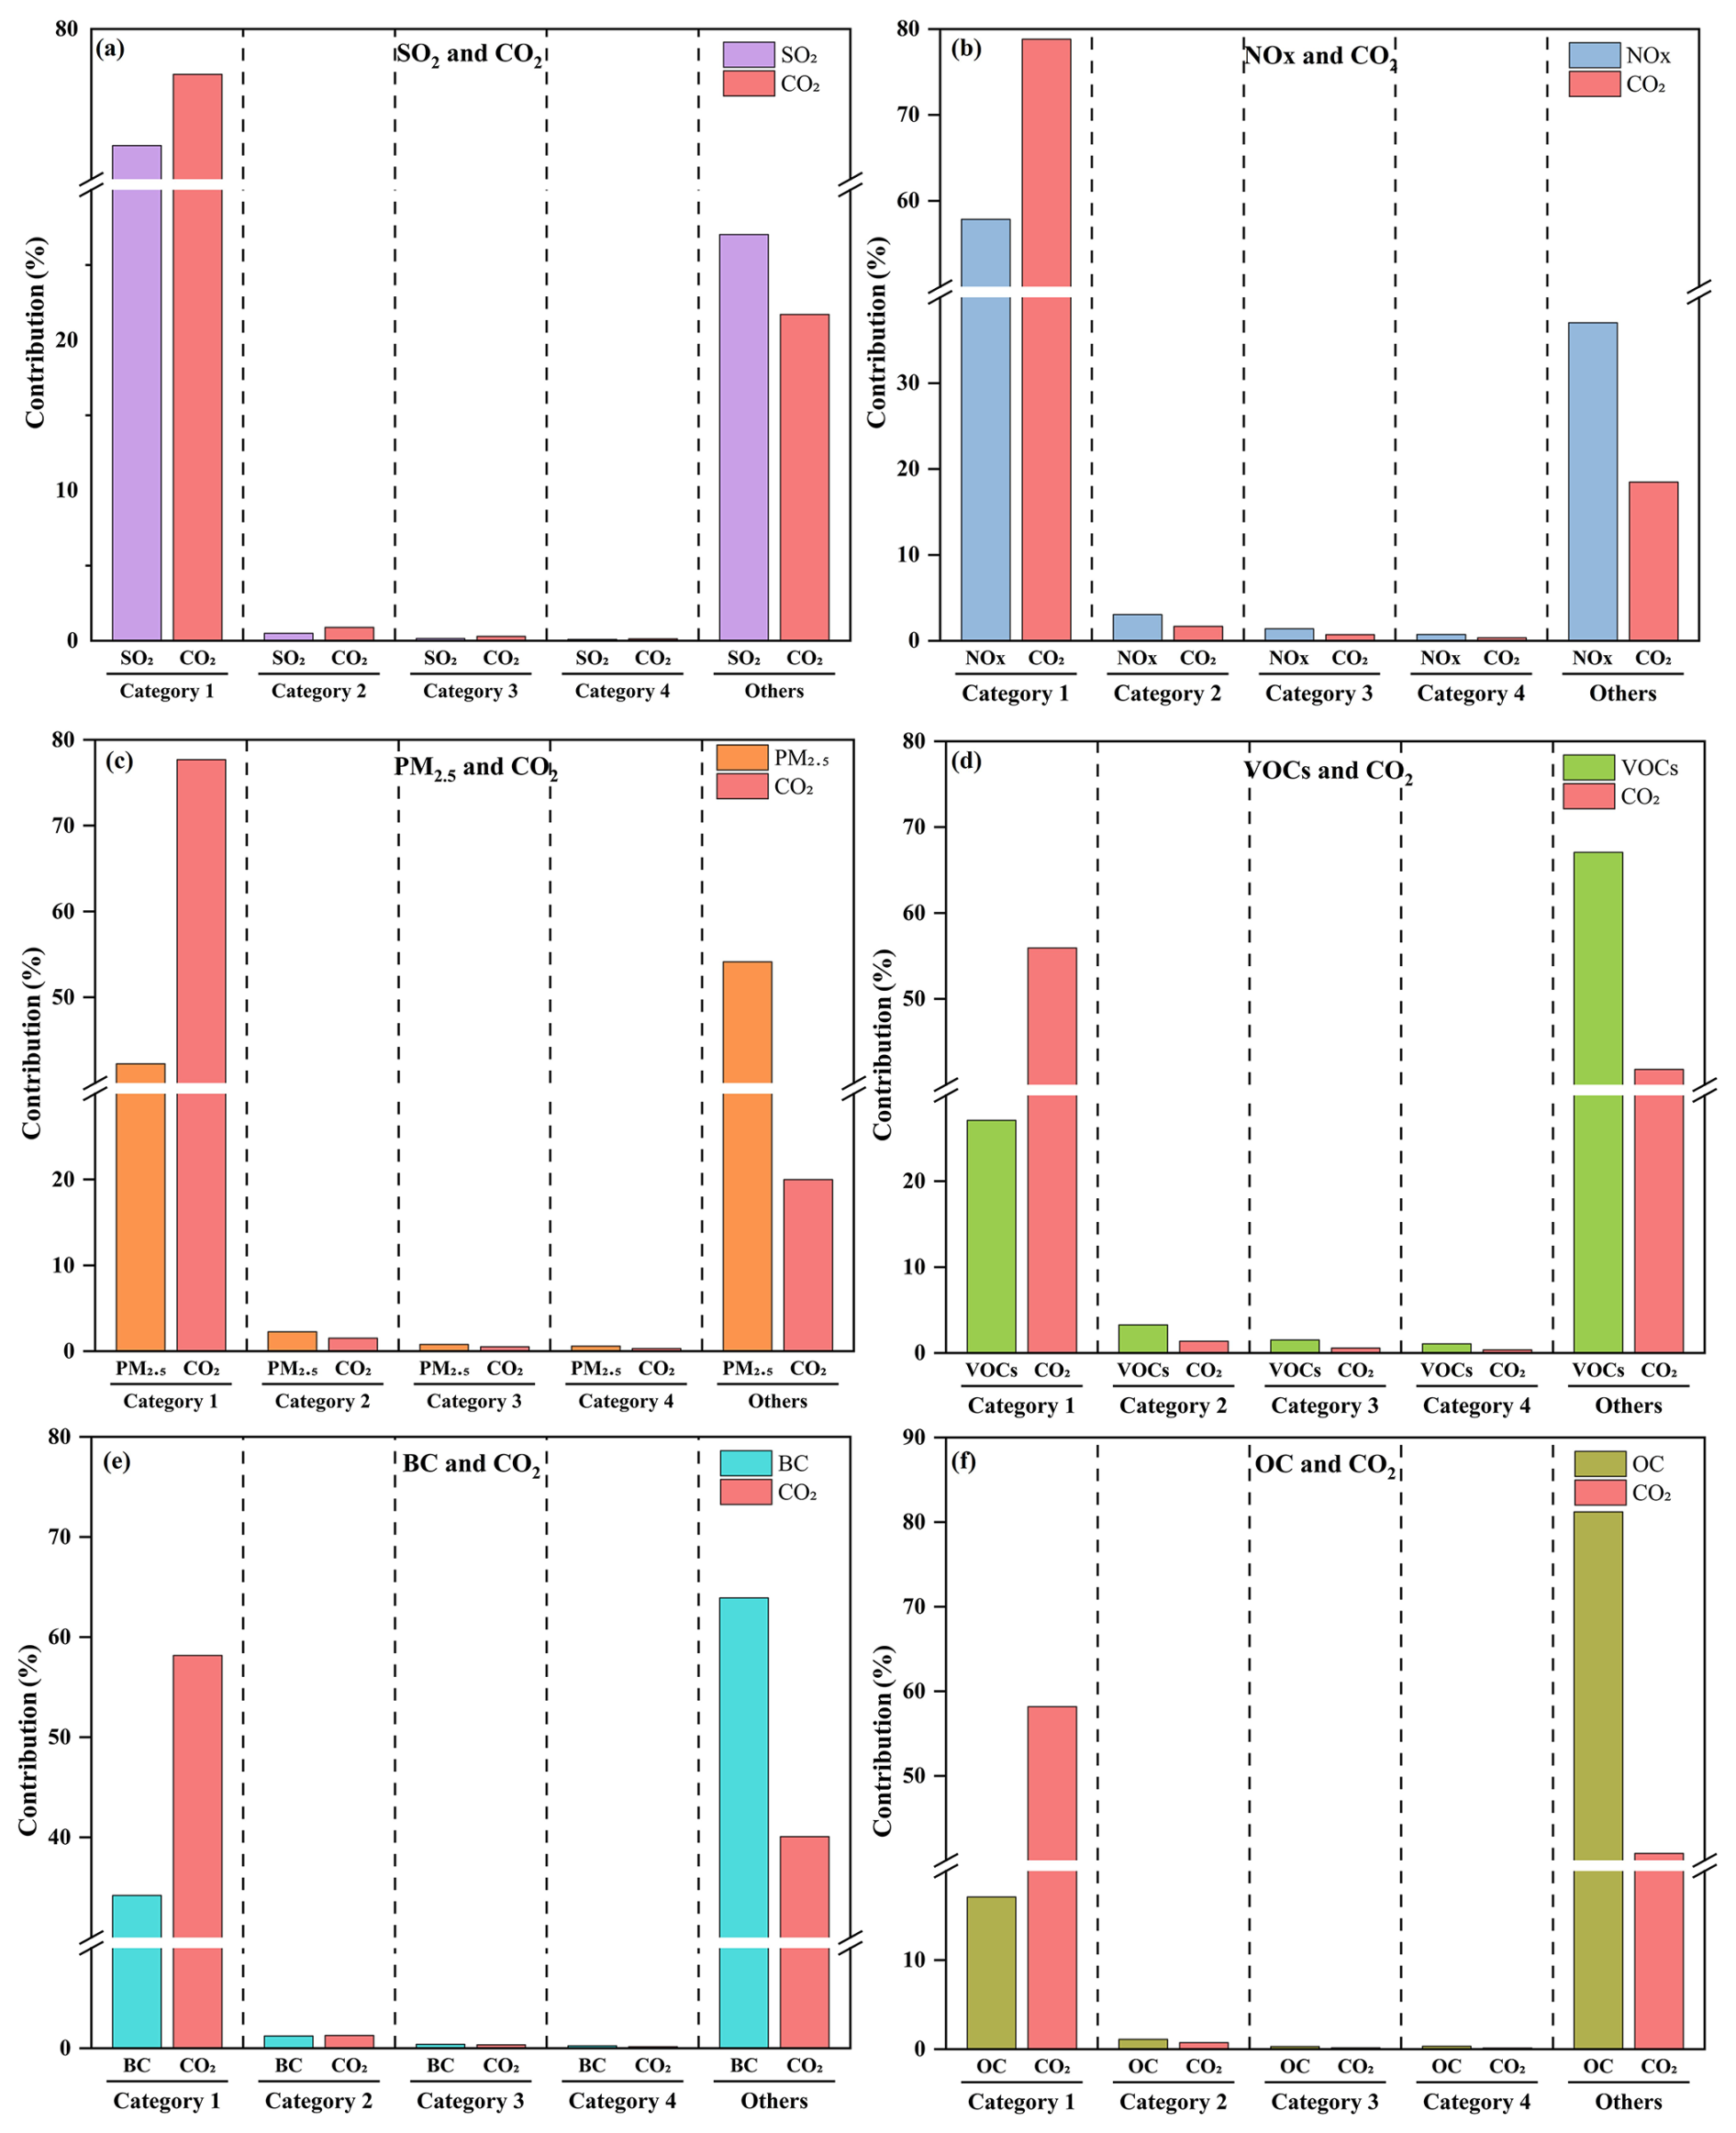
Figure 7Emission contributions of five categories to different emission co-hotspot. (a) SO2 and CO2, (b) NOx and CO2, (c) PM2.5 and CO2, (d) VOCs and CO2, (e) BC and CO2, (f) OC and CO2. Categories represent the grad of grid based on descending order of emissions: Category 1 (top 5 % grids), Category 2 (6 %–10 %), Category 3 (11 %–15 %), Category 4 (16 %–20 %), and Others (bottom 80 %).

Figure 8Spatial maps of the co-hotspots of (a) SO2 and CO2, (b) NOx and CO2, (c) PM2.5 and CO2, (d) VOCs and CO2, (e) BC and CO2, and (f) OC and CO2.
In 2022, the emissions of major species in Henan Province were: SO2 408.7 kt (−43 %, 44 %), NOx at 1336.2 kt (−29 %, 29 %), CO at 4647.3 kt (−46 %, 46 %), PM10 at 901.1 kt (−51 %, 48 %), PM2.5 at 440.0 kt (−44 %, 45 %), VOCs at 759.3 kt (−56 %, 55 %), NH3 at 672.7 kt (−54 %, 52 %), CO2 at 540 462.0 kt (−42 %, 42 %), CH4 at 12 462.0 kt (−38 %, 39 %), and N2O at 42.9 kt (−64 %, 58 %). With industry, electricity and thermal power, mobile source and oil storage and transportation, and agriculture as the primary emission source. Pollutants and GHGs exhibited distinct spatial distribution patterns: the northern heavy industrial region was characterized by both high carbon intensity and elevated pollution levels, with carbon intensity ranging from 1.75 to 3.7 times the provincial average; the central transportation hub was dominated by NOx and VOCs emissions; the western energy-chemical region showed prominent SO2 emission; the southern agricultural region was primarily influenced by NH3 emission and exhibited low carbon emission; and the eastern multifunctional region displayed a multi-source coexistence pattern.
Temporally, SO2, CO, PM10 and PM2.5 peak during winter due to increased heating demand, whereas NH3, CH4 and N2O emissions are higher during summer agricultural season. Spatially, high-emission areas are predominantly located in the urban agglomerations of central and northern regions, particularly in Zhengzhou, Jiaozuo, and Anyang. Analysis of co-hotspots identifies the industrial zone in central-northern Henan as the key region for coordinated pollution and CO2 control. SO2 shows the highest synergistic reduction potential, with 72.2 % of its emissions concentrated in only 467 grids, highlighting industrial point sources as the priority. In contrast, NOx and PM2.5 are influenced by both industrial and transport sources, while VOCs and OC exhibit dispersed emissions weakly linked to energy use. Co-hotspots also vary seasonally, with winter heating and industrial activity driving peak contributions of pollutants to CO2. This study, in comparison with the emission data from inventories such as MEIC and CEADs, as well as those from provinces like Guangdong and Shaanxi, reveals that the use of localized activity data and emission factors – alongside distinct energy structures and intensive agricultural and industrial activities – results in reasonable discrepancies in the estimation of CO2 and various pollutants.
This study reveals pronounced spatial heterogeneity in emissions across different cities and an extremely uneven spatial distribution pattern in the study region. This pattern is consistent with observations from other provinces in the North China Plain, suggesting that regional clustering of emission hotspot is a widespread phenomenon (Wu et al., 2024; Cai et al., 2018). Furthermore, distinct emission profile variations exist among cities due to differences in economic structures: northern heavy industrial cities exhibit both high carbon intensity and elevated pollution levels, presenting substantial potential for coordinated pollution and carbon reduction; central transportation hubs are dominated by NOx and VOCs emissions, making them suitable for coordinated control strategy of mobile source; and southern agricultural regions show relatively low carbon emissions but higher NH3 emission, necessitating comprehensive agricultural emission management approaches. These findings emphasize the need for region-specific, synergistic emission control strategies.
Consequently, future research and policy implementation should prioritize several key areas to promote synergistic emission reduction. First, systematically identifying high-emission hotspots can provide a solid scientific foundation for integrated air quality and climate governance. This underscores the need for enhanced collaborative emission reduction efforts that simultaneously address multiple pollutants and GHGs in these priority areas. Second, given the distinct emission patterns across regions, it is essential to develop region-specific control strategies achieve coordinated reductions of both air pollutants and GHGs. Third, high-resolution emission inventories should be leveraged to formulate more precise and coordinated management policies, thereby enhancing the overall effectiveness of synergistic emission reduction initiatives. Furthermore, in order to achieve precise quantification of the synergy effect, future research needs to promote the combination of “bottom-up” inventories with “top-down” models and observation methods (such as Chen et al., 2022; Liu et al., 2025), in order to go beyond the limitations of traditional emission accounting.
The authors do not have permission to share data.
The supplement related to this article is available online at https://doi.org/10.5194/acp-26-2921-2026-supplement.
S. Yin conceived, coordinated the study and revised the manuscript. J. Li performed emission inventories, analyzed characteristics, and drafted the manuscript. C. Su provided research concepts and calculation assistance. J. Wei and M. Guan contributed to inventory development, and C. Yu provided manuscript feedback.
The contact author has declared that none of the authors has any competing interests.
Publisher's note: Copernicus Publications remains neutral with regard to jurisdictional claims made in the text, published maps, institutional affiliations, or any other geographical representation in this paper. The authors bear the ultimate responsibility for providing appropriate place names. Views expressed in the text are those of the authors and do not necessarily reflect the views of the publisher.
We are grateful to Wenju Wang in HuBei Provincial Academy of Eco-Environmental Sciences for his guidance in the field of remote sensing, and to Yang Liu in Zhengzhou University for providing crucial data support.
This research has been supported by the National Key Research and Development Program of China (grant no. 2024YFC3713702).
This paper was edited by John Liggio and reviewed by two anonymous referees.
Bo, X., You, Q., Sang, M., Wang, P., Chen, S., Xu, X., Shan, W., Yang, Y., Bessagnet, B., and Li, H.: The impacts of clean energy policies on air pollutants and CO2 emission reduction in Shaanxi, China, Atmos. Pollut. Res., 14, 101937, https://doi.org/10.1016/j.apr.2023.101937, 2023.
Cai, B. F., Liang, S., Zhou, J., Wang, J. N., Cao, L. B., Qu, S., Xu, M., and Yang, Z. F.: China high resolution emission database (CHRED) with point emission sources, gridded emission data, and supplementary socioeconomic data, Resour. Conserv. Recy., 129, 232–239, https://doi.org/10.1016/j.resconrec.2017.10.036, 2018.
Cao, W. X., Zheng, Y. X., Zhang, S. H., Klimont, Z., Wang, X. E., Jiang, F. M., Qi, Z. L., Chen, C. C., Feng, Y. Y., Zhang, Z. C., Zang, H. K., Lei, Y., and Yan, G.: Co-drivers of air pollutant and CO2 emissions in China from 2000 to 2020, Npj Clim. Atmos. Sci., 8, https://doi.org/10.1038/s41612-025-01124-7, 2025.
Central People's Government of the People's Republic of China (CPGPRC): Notice on issuing the implementation plan for synergizing pollution and carbon reduction measures, https://www.gov.cn/zhengce/zhengceku/2022-06/17/content_5696364.htm (last access: 15 March 2025), 2022.
Central People's Government of the People's Republic of China (CPGPRC): Guiding opinions of the ministry of industry and information technology and six other authorities on accelerating the green development of the manufacturing industry, https://www.gov.cn/zhengce/zhengceku/202403/content_6935684.htm (last access: 15 March 2025), 2024a.
Central People's Government of the People's Republic of China (CPGPRC): Opinions of the CPC central committee and the state council on accelerating the comprehensive green transition of economic and social development, https://www.gov.cn/zhengce/202408/content_6967663.htm (last access: 15 March 2025), 2024b.
Chen, C., Dubovik, O., Schuster, G. L., Chin, M., Henze, D. K., Lapyonok, T., Li, Z. Q., Derimian, Y., and Zhang, Y.: Multi-angular polarimetric remote sensing to pinpoint global aerosol absorption and direct radiative forcing, Nat. Commun., 13, https://doi.org/10.1038/s41467-022-35147-y, 2022.
Chen, T., Xiong, Y. X., Zhao, W. D., Lin, B., He, Z. H., Tao, F. Y., and Hu, X.: Construction of Heavy-Duty Diesel Vehicle Atmospheric Pollutant Emission Inventory Based on Onboard Diagnosis Data, Atmosphere-basel, 15, https://doi.org/10.3390/atmos15121473, 2024.
Gao, C., Gao, W., Song, K., Na, H., Tian, F., and Zhang, S.: Spatial and temporal dynamics of air-pollutant emission inventory of steel industry in China: A bottom-up approach, Resources Conservation and Recycling, 143, 184–200, https://doi.org/10.1016/j.resconrec.2018.12.032, 2019.
Geng, Y., Tian, M., Zhu, Q., Zhang, J., and Peng, C.: Quantification of provincial-level carbon emissions from energy consumption in China, Renew. Sust. Energ. Rev., 15, 3658–3668, https://doi.org/10.1016/j.rser.2011.07.005, 2011.
He, G. Y., Jiang, W., Gao, W., and Lu, C.: Unveiling the spatial-temporal characteristics and driving factors of greenhouse gases and atmospheric pollutants emissions of energy consumption in shandong province, China, Sustainability-basel, 16, 1304, https://doi.org/10.3390/su16031304, 2024.
Henan Bureau of Statistics (HBS): Henan Statistical Yearbook, https://oss.henan.gov.cn/sbgt-wztipt/attachment/hntjj/hntj/lib/tjnj/2013/indexch.htm (last access: 10 April 2025), 2013.
Henan Bureau of Statistics (HBS): Henan Statistical Yearbook, https://oss.henan.gov.cn/sbgt-wztipt/attachment/hntjj/hntj/lib/tjnj/2023nj/zk/indexch.htm (last access: 10 April 2025), 2023.
Henan Bureau of Statistics (HBS): Henan Statistical Yearbook, https://oss.henan.gov.cn/sbgt-wztipt/attachment/hntjj/hntj/lib/tjnj/2024nj/zk/indexch.htm (last access: 10 April 2025), 2024.
Henan Provincial Department of Ecology and Environment (HPDEE): Zhengzhou vehicle ownership and drivers both exceed 5 million, https://www.henan.gov.cn/2022/04-12/2430157.html (last access: 15 March 2025), 2022.
Henan Provincial People's Government (HPPG): Geographical Profile: Physical Geography, https://www.henan.gov.cn/2023/06-13/2760283.html (last access: 15 March 2025), 2023.
Hu, B., Zhang, L. J., Liang, C., Yang, X., Shi, Z. X., and Wang, C. Y.: Characterizing Spatial and Temporal Variations in N2O Emissions from Dairy Manure Management in China Based on IPCC Methodology, Agriculture-Basel, 14, https://doi.org/10.3390/agriculture14050753, 2024.
Hua, S., Tian, H., Wang, K., Zhu, C., Gao, J., Ma, Y., Xue, Y., Wang, Y., Duan, S., and Zhou, J.: Atmospheric emission inventory of hazardous air pollutants from China's cement plants: Temporal trends, spatial variation characteristics and scenario projections, Atmos. Environ., 128, 1–9, https://doi.org/10.1016/j.atmosenv.2015.12.056, 2016.
Huang, P.-C., Hung, H.-M., Lai, H.-C., and Chou, C. C.-K.: Assessing the effectiveness of SO2, NOx, and NH3 emission reductions in mitigating winter PM2.5 in Taiwan using CMAQ, Atmos. Chem. Phys., 24, 10759–10772, https://doi.org/10.5194/acp-24-10759-2024, 2024.
Intergovernmental Panel on Climate Change (IPCC): Climate Change 2021: The Physical Science Basis, https://www.ipcc.ch/report/ar6/wg1/downloads/report/IPCC_AR6_WGI_FullReport.pdf (last access: 15 March 2025), 2021.
International Energy Agency (IEA): CO2 Emissions in 2023, https://iea.blob.core.windows.net/assets/33e2badc-b839-4c18-84ce-f6387b3c008f/CO_2Emissionsin2023.pdf (last access: 10 March 2025), 2024.
IQAir: 2024 World Air Quality Report, https://www.iqair.cn/cn/newsroom/waqr-2024-pr (last access: 15 March 2025), 2024.
Jiang, P., Chen, X., Li, Q., Mo, H., and Li, L.: High-resolution emission inventory of gaseous and particulate pollutants in Shandong Province, eastern China, J. Clean Prod., 259, 120806, https://doi.org/10.1016/j.jclepro.2020.120806, 2020a.
Jiang, P. Y., Zhong, X., and Li, L. Y.: On-road vehicle emission inventory and its spatio-temporal variations in North China Plain, Environ. Pollut., 267, https://doi.org/10.1016/j.envpol.2020.115639, 2020b.
Jin, X. P., Cai, X. H., Huang, Q. Q., Wang, X. S., Song, Y., and Zhu, T.: Atmospheric Boundary Layer-Free Troposphere Air Exchange in the North China Plain and its Impact on PM2.5 Pollution, J. Geophys. Res.-Atmos., 126, https://doi.org/10.1029/2021JD034641, 2021.
Kanakidou, M.: Human impact on atmospheric composition, Epj Web. Conf., 310, 00003, https://doi.org/10.1051/epjconf/202431000003, 2024.
Keramydas, C., Ntziachristos, L., Tziourtzioumis, C., Papadopoulos, G., Lo, T. S., Ng, K. L., Wong, H. L. A., and Wong, C. K. L.: Characterization of Real-World Pollutant Emissions and Fuel Consumption of Heavy-Duty Diesel Trucks with Latest Emissions Control, Atmosphere-basel, 10, https://doi.org/10.3390/atmos10090535, 2019.
Kong, L., Tang, X., Wang, Z., Zhu, J., Li, J., Wu, H., Wu, Q., Chen, H., Zhu, L., Wang, W., Liu, B., Wang, Q., Chen, D., Pan, Y., Li, J., Wu, L., and Carmichael, G. R.: Changes in air pollutant emissions in China during two clean-air action periods derived from the newly developed Inversed Emission Inventory for Chinese Air Quality (CAQIEI), Earth Syst. Sci. Data, 16, 4351–4387, https://doi.org/10.5194/essd-16-4351-2024, 2024.
Kurokawa, J., Ohara, T., Morikawa, T., Hanayama, S., Janssens-Maenhout, G., Fukui, T., Kawashima, K., and Akimoto, H.: Emissions of air pollutants and greenhouse gases over Asian regions during 2000–2008: Regional Emission inventory in ASia (REAS) version 2, Atmos. Chem. Phys., 13, 11019–11058, https://doi.org/10.5194/acp-13-11019-2013, 2013.
Lessmann, M., Kros, H., Walvoort, D., Voogd, J. C., Renaud, L., and Cals, T.: Uncertainties in nitrogen application from manure and synthetic fertilizers and ammonia emissions from agriculture in the Netherlands across different spatial scales, Nutr. Cycl. Agroecosys., https://doi.org/10.1007/s10705-025-10410-y, 2025.
Li, M., Liu, H., Geng, G. N., Hong, C. P., Liu, F., Song, Y., Tong, D., Zheng, B., Cui, H. Y., Man, H. Y., Zhang, Q., and He, K. B.: Anthropogenic emission inventories in China: a review (vol 4, pg 834, 2017), Nat. Sci. Rev., 5, 603–603, https://doi.org/10.1093/nsr/nwy044, 2018.
Li, M., Zeng, W., Yang, Z., Luo, Y., Zhu, Q., Wang, L., Yang, L., and Liao, C.: Multiple sources emission inventory closely integrated with atmospheric environment management: A case study of Guangdong, China, Atmos. Pollut. Res., 14, 101825, https://doi.org/10.1016/j.apr.2023.101825, 2023.
Liang, X. M., Sun, X. B., Lu, Q., Ren, L., Liu, M., Su, Y. H., Wang, S., Lu, H. T., Gao, B., Zhao, W., Sun, J. R., Gao, Z. Q., and Chen, L. G.: VOC emission inventory of architectural coatings and adhesives for new buildings in China based on investigated and measured data, Atmos. Environ., 245, https://doi.org/10.1016/j.atmosenv.2020.118014, 2021.
Liu, J., Cohen, J. B., Feng, Y., Wang, S., and Qin, K.: OMI-Derived Mass- and Number-Conserved Estimation of Black Carbon Emissions, Environ. Sci. Technol. Lett., 12, 731–738, https://doi.org/10.1021/acs.estlett.5c00340, 2025.
Liu, L.-J., Liu, L.-C., and Liang, Q.-M.: Common footprints of the greenhouse gases and air pollutants in China, J. Clean. Prod., 293, 125991, https://doi.org/10.1016/j.jclepro.2021.125991, 2021.
Liu, X., Peng, R., Bai, C., Chi, Y., and Liu, Y.: Economic cost, energy transition, and pollutant mitigation: The effect of China's different mitigation pathways toward carbon neutrality, Energy, 275, 127529, https://doi.org/10.1016/j.energy.2023.127529, 2023.
Liu, Y.-H., Ma, J.-L., Li, L., Lin, X.-F., Xu, W.-J., and Ding, H.: A high temporal-spatial vehicle emission inventory based on detailed hourly traffic data in a medium-sized city of China, Environ. Pollut., 236, 324–333, https://doi.org/10.1016/j.envpol.2018.01.068, 2018.
Manisalidis, I., Stavropoulou, E., Stavropoulos, A., and Bezirtzoglou, E.: Environmental and health impacts of air pollution: a review, Front Public Health, 8, 14, https://doi.org/10.3389/fpubh.2020.00014, 2020.
Ministry of Ecology and Environment of the People's Republic of China (MEEPRC): Guiding opinions on coordinating and strengthening work related to climate change mitigation and ecological and environmental protection, https://www.mee.gov.cn/xxgk2018/xxgk/xxgk03/202101/t20210113_817221.html (last access: 10 March 2025), 2021.
Ministry of Ecology and Environment of the People's Republic of China (MEEPRC): China Ecological Environment Bulletin 2023, https://www.mee.gov.cn/hjzl/sthjzk/zghjzkgb/202406/P020240604551536165161.pdf (last access: 10 March 2025), 2024a.
Ministry of Ecology and Environment of the People's Republic of China (MEEPRC): Technical guidelines for developing integrated emissions inventory of air pollutants and greenhouse gases (Interim), https://www.mee.gov.cn/xxgk2018/xxgk/xxgk06/202401/W020240130539574113045.pdf, (last access: 10 March 2025), 2024b.
Ministry of Transport of the People's Republic of China (MTPRC): Notice of the ministry of transport and twelve other authorities on issuing the action plan for large-scale equipment renewal in transportation, https://xxgk.mot.gov.cn/2020/jigou/zhghs/202406/t20240607_4142138.html, (last access: 10 March 2025), 2024.
Muntean, M., Janssens-Maenhout, G., Song, S. J., Giang, A., Selin, N. E., Zhong, H., Zhao, Y., Olivier, J. G. J., Guizzardi, D., Crippa, M., Schaaf, E., and Dentener, F.: Evaluating EDGARv4.tox2 speciated mercury emissions ex-post scenarios and their impacts on modelled global and regional wet deposition patterns, Atmos. Environ., 184, 56–68, https://doi.org/10.1016/j.atmosenv.2018.04.017, 2018.
National Bureau of Statistics of China (NBS): China Statistical Yearbook 2023, https://www.stats.gov.cn/sj/ndsj/2023/indexch.htm (last access: 15 March 2025), 2023.
State Council of the People's Republic of China (SCPRC): Regional GDP of 31 provinces in 2022 released: what signals do they convey, https://www.gov.cn/xinwen/2023-02/06/content_5740185.htm, (last access: 15 March 2025), 2023.
Shanxi Provincial Bureau of Statistics (SPBS): Shaanxi Statistical Yearbook 2023, https://tjj.shaanxi.gov.cn/tjsj/ndsj/tjnj/sxtjnj/index.html?2023, (last access: 15 March 2025), 2023.
Sun, C., Li, B., Chen, L., Gao, Y., Jin, J., Gu, X., Yang, Y., Lou, Y., Zhao, Y., and Liao, H.: An improved hourly-resolved atmospheric NOx emission inventory of industrial sources based on Continuous Emission Monitoring System data: Case of Jiangsu Province, China, J. Clean. Prod., 419, 138192, https://doi.org/10.1016/j.jclepro.2023.138192, 2023.
Super, I., Dellaert, S. N. C., Visschedijk, A. J. H., and Denier van der Gon, H. A. C.: Uncertainty analysis of a European high-resolution emission inventory of CO2 and CO to support inverse modelling and network design, Atmos. Chem. Phys., 20, 1795–1816, https://doi.org/10.5194/acp-20-1795-2020, 2020.
Wang, Y. X., Li, Y. P., Li, Z. J., and Cheng, K.: Spatiotemporal evolution of green development efficiency based on nighttime light data, Ecol. Indicators, 175, https://doi.org/10.1016/j.ecolind.2025.113541, 2025.
Wang, Y. Y., Ji, H. Y., Wang, S. Q., Wang, H., and Shi, J. Y.: Research on Carbon Emissions Estimation in Key Industries Based on the Electricity-Energy-Carbon Model: A Case Study of Henan Province, Energies, 17, https://doi.org/10.3390/en17122933, 2024.
Wu, N., Geng, G., Xu, R., Liu, S., Liu, X., Shi, Q., Zhou, Y., Zhao, Y., Liu, H., Song, Y., Zheng, J., Zhang, Q., and He, K.: Development of a high-resolution integrated emission inventory of air pollutants for China, Earth Syst. Sci. Data, 16, 2893–2915, https://doi.org/10.5194/essd-16-2893-2024, 2024.
Wu, R. R., Zhao, Y., Xia, S. J., Hu, W., Xie, F. J., Zhang, Y., Sun, J. J., Yu, H., An, J. L., and Wang, Y. T.: Reconciling the bottom-up methodology and ground measurement constraints to improve the city-scale NMVOCs emission inventory: A case study of Nanjing, China, Sci. Total Environ., 812, https://doi.org/10.1016/j.scitotenv.2021.152447, 2022.
Xu, B., You, X., Zhou, Y., Dai, C., Liu, Z., Huang, S., Luo, D., and Peng, H.: The study of emission inventory on anthropogenic air pollutants and source apportionment of PM2.5 in the Changzhutan Urban Agglomeration, China, Atmosphere-basel, 11, 739, https://doi.org/10.3390/atmos11070739, 2020.
Xu, L., Peng, S., and Wang, L.: The synergy of pollution and carbon reduction by green fiscal policy: a quasi-natural experiment utilizing a pilot program from china's comprehensive demonstration cities of energy conservation and emission reduction fiscal policy, Sustainability-basel, 17, 667, https://doi.org/10.3390/su17020667, 2025.
Xue, R., Wang, S., Long, W., Gao, G., Liu, D., and Zhang, R.: Uncovering GHG emission characteristics of industrial parks in Central China via emission inventory and cluster analysis, Energ Policy, 151, 112191, https://doi.org/10.1016/j.enpol.2021.112191, 2021.
Yu, X. and Tan, C.: China's process-related greenhouse gas emission dataset 1990–2020, Sci. Date, 10, 55, https://doi.org/10.1038/s41597-023-01957-y, 2023.
Yu, X. N., Shen, L., Hou, X. H., Yuan, L., Pan, Y. P., An, J. L., and Yan, S. Q.: High-resolution anthropogenic ammonia emission inventory for the Yangtze River Delta, China, Chemosphere, 251, https://doi.org/10.1016/j.chemosphere.2020.126342, 2020.
Zhang, B., Yin, S., Lu, X., Wang, S., and Xu, Y.: Development of city-scale air pollutants and greenhouse gases emission inventory and mitigation strategies assessment: A case in Zhengzhou, Central China, Urban Clim, 48, 101419, https://doi.org/10.1016/j.uclim.2023.101419, 2023.
Zhang, X. R., Yin, S. S., Lu, X., Liu, Y. L., Wang, T. T., Zhang, B. L., Li, Z., Wang, W. J., Kong, M. D., and Chen, K. Y.: Establish of air pollutants and greenhouse gases emission inventory and co-benefits of their reduction of transportation sector in Central China, J. Environ. Sci., 150, 604–621, https://doi.org/10.1016/j.jes.2023.12.025, 2025.
Zhao, H., He, W., Cheng, J., Liu, Y., Zheng, Y., Tian, H., He, K., Lei, Y., and Zhang, Q.: Heterogeneities in regional air pollutant emission mitigation across China during 2012–2020, Earths Future, 12, e2023EF004139, https://doi.org/10.1029/2023EF004139, 2024.
Zheng, B., Cheng, J., Geng, G., Wang, X., Li, M., Shi, Q., Qi, J., Lei, Y., Zhang, Q., and He, K.: Mapping anthropogenic emissions in China at 1 km spatial resolution and its application in air quality modeling, Sci. Bull., 66, 612–620, https://doi.org/10.1016/j.scib.2020.12.008, 2021.
Zheng, J. Y., Yin, S. S., Kang, D. W., Che, W. W., and Zhong, L. J.: Development and uncertainty analysis of a high-resolution NH3 emissions inventory and its implications with precipitation over the Pearl River Delta region, China, Atmos. Chem. Phys., 12, 7041–7058, https://doi.org/10.5194/acp-12-7041-2012, 2012.
Zhengzhou Bureau of Statistics (ZBS): Zhengzhou Statistical Yearbook, https://tjj.zhengzhou.gov.cn/u/cms/tjj/statistical_2023/index.htm (last access: 10 March 2025), 2024.
Zhou, H., Gao, B. W., and Deng, F. D.: Dust diffusion in large-scale urban construction combining WRF and CALPUFF model-take xiamen as an example, J. Environ. Eng. Landsc., 31, 288–306, https://doi.org/10.3846/jeelm.2023.20044, 2023.
Zhou, M. M., Jiang, W., Gao, W. D., Gao, X. M., Ma, M. C., and Ma, X.: Anthropogenic emission inventory of multiple air pollutants and their spatiotemporal variations in 2017 for the Shandong Province, China*, Environ. Pollut., 288, https://doi.org/10.1016/j.envpol.2021.117666, 2021.
Zhou, Z., Tan, Q., Deng, Y., Song, D., Wu, K., Zhou, X., Huang, F., Zeng, W., and Lu, C.: Compilation of emission inventory and source profile database for volatile organic compounds: A case study for Sichuan, China, Atmos. Pollut. Res., 11, 105–116, https://doi.org/10.1016/j.apr.2019.09.020, 2020.