the Creative Commons Attribution 4.0 License.
the Creative Commons Attribution 4.0 License.
 | 19 Feb 2026
Uncertainties of SAI efficiency and impacts depending on the complexity of the aerosol microphysical model
Daniele Visioni
Ilaria Quaglia
Yunqian Zhu
Charles G. Bardeen
Francis Vitt
Pengfei Yu
Significant differences exist between Earth System Models in simulating the efficiency of stratospheric aerosol injection (SAI) experiments, particularly in terms of aerosol burden, radiative forcing, and impacts, such as tropical lower stratospheric heating and changes in ozone. However, the primary reasons for these differences have not been identified. Previous studies have proposed that these differences can be attributed to the use of different aerosol microphysical schemes, model resolution, or other physical parameterizations. Here, we compare two sets of SAI experiments using the same modeling framework of the Community Earth System Model, differing only in their aerosol microphysical schemes: the modal aerosol model (MAM4) and the sectional aerosol model (CARMA). We analyze scenarios varying in injection location (point vs. regional), amount (5 vs. 25 Tg S yr−1), and material (sulfur dioxide (SO2) gas vs. accumulation-mode sulfuric acid (AM-H2SO4) aerosol). Our results suggest that the SAI radiative efficiency may be substantially overestimated when using the modal aerosol model, particularly at higher injection rates, with implications for other impacts, including stratospheric ozone. While both sets of models confirm that AM-H2SO4 injections are more effective than SO2 injections in reducing net top-of-the-atmosphere radiative forcing, MAM4 yields significantly larger aerosol burdens and weaker size-dependent sedimentation, particularly at 25 Tg S yr−1. In contrast, CARMA produces a smaller aerosol burden, with more mass shifted into larger particles and a declining radiative efficiency at increased injection rates. These findings suggest that more sophisticated sectional models may be necessary to accurately assess the efficacy, side effects, and climate impacts of SAI.
- Article
(8520 KB) - Full-text XML
- BibTeX
- EndNote


Stratospheric Aerosol Intervention (SAI) has been proposed as a potential method to artificially increase the stratospheric aerosol burden and enhance the reflectivity of incoming solar radiation to space, thereby counteracting some of the impacts of global warming (Crutzen, 2006). Model simulations in recent years using comprehensive Earth System Models (ESMs) confirm that continuous injections of sulfur dioxide into the stratosphere effectively cool the global surface temperature. However, details on the cooling efficiency per injection amount remain uncertain (Haywood and Tilmes, 2022). Multi-model comparisons reveal differences in cooling efficiency, ranging from 0.4 to 1.3 °C for 10 Tg SO2 yr−1 injection (Haywood and Tilmes, 2022), or likewise, the required injections to reduce global surface temperature by 1 °C, range between 8 and 16 Tg SO2 yr−1, with reasons for these differences still to be understood. required injections range between 4 (8) and 8 (16) Tg S yr−1 (Tg SO2 yr−1) for different models to cool 1 °C, with reasons for these differences still to be understood. A multi-model comparison study based on three ESMs with interactive aerosol microphysics further explored the differences between the injection of sulfuric acid (SO2) gas and the accumulation model sulfuric acid aerosols (AM-H2SO4) (Weisenstein et al., 2022). The motivation for this is that SO2 injections are expected to result in larger particles due to their slow condensation to AM-H2SO4, resulting in a radiatively less efficient aerosol size and faster removal (Pierce et al., 2010). Weisenstein et al. (2022) showed that potential injections of AM-H2SO4 increase the radiative efficacy (radiative forcing per unit sulfur injected), compared to SO2 injections, considering injections between 5 and 25 Tg S yr−1. For reference, 5 Tg S yr−1 represents annual injections of a larger volcanic eruption (e.g., Mt Pinatubo in 1991) and 25 Tg S yr−1 represents large SAI injections that may counter the warming of a business-as-usual greenhouse gas forcing scenario by the end of the 21st century (Tilmes et al., 2018). They also suggested that AM-H2SO4 injections, rather than SO2 injections, would reduce other potential side effects, including impacts on stratospheric heating, ozone, and climate.
However, considerable differences in radiative forcing between the three ESMs, which are of similar magnitude to the differences in the injection strategies, require a more in-depth understanding of the reasons for these differences. Different models revealed significant differences in the stratospheric aerosol burden for identical injection amounts, depending on the injection material. For example, the global aerosol burden for the considered models ranges from 2.5 to 6.5 Tg using SO2 injections and from 4.5 to above 8 Tg for AM-H2SO4 injections, corresponding to 5 Tg S yr−1 injections (Weisenstein et al., 2022). Additionally, the efficacy (radiative forcing per Tg S yr−1 injection) of SAI varies depending on the details of the injection location, including point injections versus regional injections, as well as the material, considering SO2 gas versus AM-H2SO4 solid particle injections. Weisenstein et al. (2022) suggested possible reasons for the differences in SAI-induced radiative forcing responses among the three models, including model-specific differences in resolution, physics, chemistry, and QBO, as well as differences in aerosol microphysical descriptions. Concluding from their study, there are systematic agreements regarding the responses to differences in the location of the injection and material. Larger differences among the models were found for SO2 injections rather than AM-H2SO4, indicating that aerosol processes between the models, particularly nucleation and condensation, may differ, which affects the size distribution and therefore the effective radius. Differences also occur in the response to increasing injection rates using AM-H2SO4, with two models employing a modal scheme showing an increase in the aerosol burden. In contrast, the use of a sectional model shows the opposite. The resulting radiative response is dependent on the effective radius, with one modal model showing a larger effect and the other a smaller effect than the sectional aerosol model, especially for smaller injection amounts.
Similarly, Laakso et al. (2022) compared two different microphysical models (a modal and sectional aerosol model) in the same model framework. Their paper also concludes that significant differences in SAI radiative forcing can result from the use of two microphysical models. Their paper shows that the sectional aerosol model produces substantially more radiative forcing than the modal model, due to the modal aerosol model's shortcomings in covering the entire size distribution, which creates a gap between the two largest modes right where the scattering efficiency is maximized at 0.3 µm in radius (Li et al., 2024; Murphy et al., 2021). Since their study discussed several different injection scenarios and amounts of injection that differ substantially from those in Weisenstein et al. (2022) and our study, we cannot directly compare the results, but discuss similarities and general conclusions.
Here, we revisit the same experiments performed in Weisenstein et al. (2022) and solely focus on aerosol microphysical differences within the same modeling framework. Experiments are performed with the same model physics, chemistry, vertical and horizontal resolution, interactive chemistry, and a fixed QBO. One model version utilizes the Modal Aerosol Model (MAM4), and the other uses the Community Aerosol and Radiation Model for Atmospheres' sectional aerosol model (CARMA) for mixed and pure sulfate aerosol in the troposphere and stratosphere (Yu et al., 2015; Tilmes et al., 2023). In the following, we address the questions: Can the differences in the aerosol scheme alone explain most of the differences between models shown in Weisenstein et al. (2022)? What are the main reasons for these differences? What can we learn about the impacts beyond changes in radiative forcing of SAI? To answer these questions, we examine the reasons for the differences in the two model configurations regarding the efficacy of SAI, which depends on injection strategies, including regional versus point injections, as well as the material used. With a more in-depth understanding of the behavior of the two aerosol microphysical models, we discuss the impact of relevant quantities, including the magnitude of the required aerosol injection amount, stratospheric heating, and effects on ozone. The updated information will help estimate and narrow down the reasons for differences in microphysical models, as well as the consequences of a potential application based on the range of possible outcomes for cooling efficiency, climatic impacts, and potential implications for effects on acid rain and UV radiation.
We use version 2.2 of the Community Earth System Model (CESM2.2), which includes configurations of the Whole Atmosphere Community Climate Model Version 6 (WACCM6) with the option of using two separate aerosol microphysical models (Tilmes et al., 2023), a modal and sectional aerosol model. The modal aerosol model (MAM4) consists of four separate internally mixed modes, with sulfate aerosol being included in three modes: Aitken, accumulation, and coarse modes (Liu et al., 2016). The Community Aerosol and Radiation Model for Atmospheres (CARMA) is used to run as a sectional aerosol model. CARMA simulates two separate groups: the pure sulfate group, which includes nucleation and condensation of sulfuric acid, and an internally mixed aerosol group that includes sulfate, black carbon, primary and secondary organic aerosol, sea salt, and dust. The model configuration was first introduced by Yu et al. (2015), coupled to CESM version 1, and then expanded to CESM Version 2 by Tilmes et al. (2023). Pure and mixed aerosol groups include self-coagulation and coagulation with the other group. The CARMA model code has been slightly updated compared to the version used in Tilmes et al. (2023), with improvements in the optical calculations when using CARMA (Quaglia et al., 2025).
The experimental setup for all model simulations utilizes the WACCM6 middle atmosphere chemistry, which features a 2° horizontal resolution and 70 vertical levels, with a model top at approximately 150 km (Davis et al., 2022). Quaglia et al. (2025) demonstrated that both MAM4 and CARMA accurately reproduce the observed radiative forcing and stratospheric heating from the Mt. Pinatubo eruption in 1991. Minor differences between the models reveal, in general, a better performance in using CARMA than MAM4 for larger volcanic eruptions. The model further reproduces tropospheric and stratospheric background aerosol conditions, including aerosol optical depth, radiative forcing, heating, and their effects on ozone. This model has been further evaluated in detail in comparison to observations and both MAM4 and CARMA for background conditions (Brodowsky et al., 2024).
The experimental setup follows that described in Weisenstein et al. (2022). In particular, all experiments utilize the climatological sea surface temperature data from 1988 to 2007 of the CMIP5 PCMDI-AMIP-1.1.0 SST/Sea Ice dataset (Taylor et al., 2000). We further prescribed greenhouse gas concentrations, as well as aerosol and chemical emissions, for the year 2040, based on the SSP5-8.5 future scenario (O'Neill et al., 2016). A background experiment without any injections has been performed for 30 years. The injection experiments spanned 20 years, starting from the spin-up experiment after 10 years. For the analysis, we only used years 20–30, excluding the first 10 years. We performed eight injection experiments for each CARMA and MAM4, using two different materials (SO2 and AM-H2SO4 particulate), two different geographical distributions of injection, and two different injection amounts. For AM-H2SO4 injections, we assumed injections into the accumulation mode for MAM4. For CARMA, we distribute the injections over corresponding bins, assuming a lognormal distribution with a dry radius of 0.1 µm and a standard deviation of 1.5, analogous to what has been done in Weisenstein et al. (2022) for the sectional aerosol model. The different geographical distributions included: (a) point injections at 30° N and 30° S, around 21 km and at 180° E with an equal amount of injection at each of the two points, and (b) regionally distributed injections (or regional injections) with equal injections throughout the region between 30° N and 30° S, 19–21 km and all longitudes. Two different injection amounts are 5 and 25 Tg S yr−1, distributed over each time step of the simulation. For more details, see Table 2 in Weisenstein et al. (2022).
The model experiments investigated here are expected to yield different outcomes in aerosol burden, size distribution, and effective radius, depending on the injection strategy, namely regional versus point injections and the material used (here SO2 versus AM-H2SO4), as well as the amount 5 vs. 25 Tg S yr−1 (Weisenstein et al., 2022). We first discuss SO2 injections and contrast the differences between point vs. regional injections. In the second part, we discuss AM-H2SO4 injections.
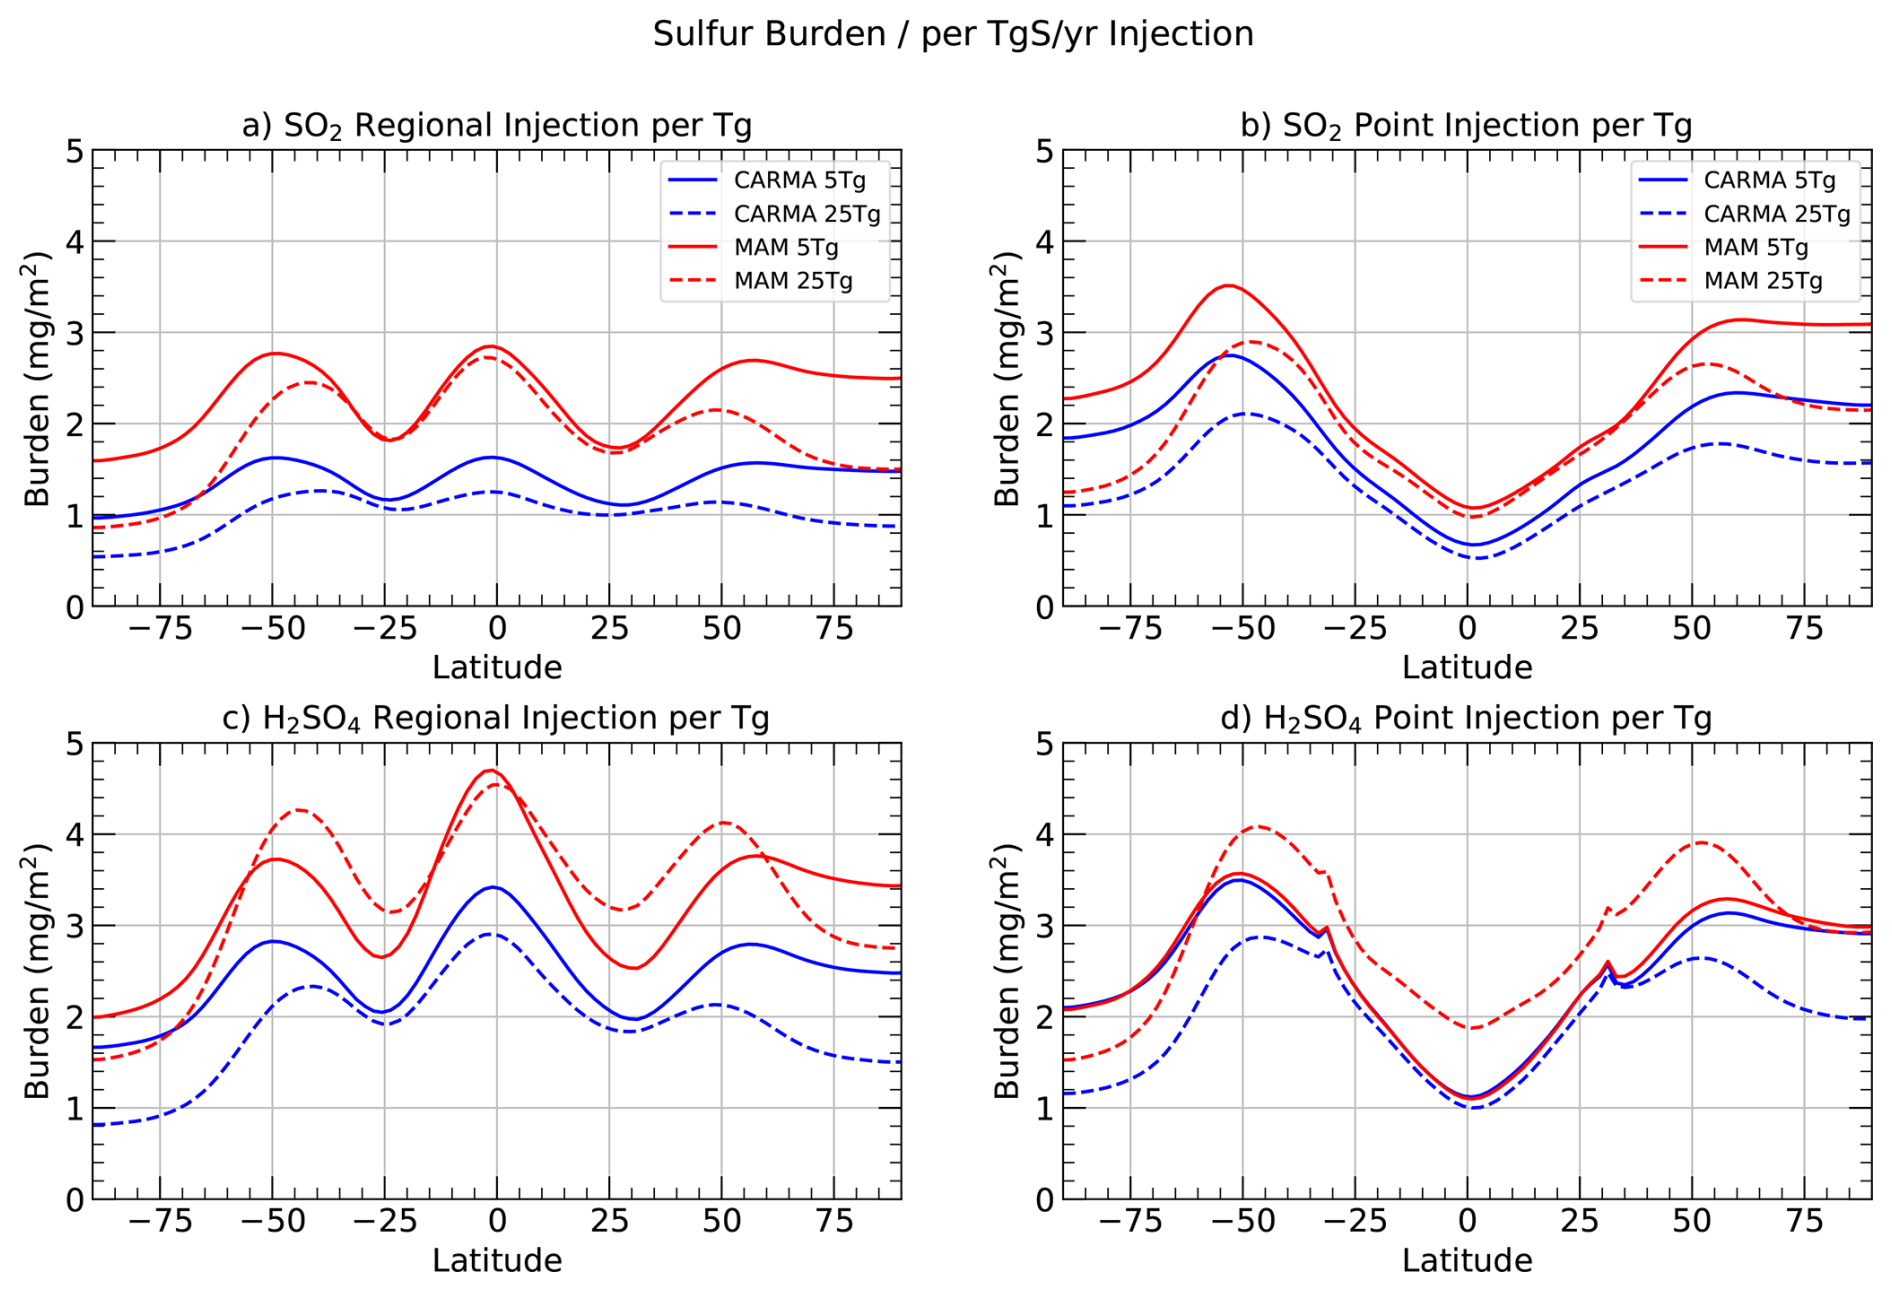
Figure 1Zonal mean changes in aerosol column burden (perturbed minus background) (mg m−2), scaled by the injection amount in Tg S yr−1, for CARMA (blue) and MAM4 (red), for different injection locations (regional injections: panels a, c, point injections: panels b, c), different injection material (SO2: panels a, b, AM-H2SO4: panels c, d), and for different injection amounts (5 Tg S yr−1: solid, 25 Tg S yr−1: dashed).
3.1 SO2 injections
SO2 injected into the stratosphere by volcanoes oxidizes and forms sulfur trioxide (SO3) within days to weeks. Once SO3 is formed, it is quickly transformed into H2SO4 gas. H2SO4 gas then nucleates over time or condenses onto existing aerosols. For large amounts of SO2 injections, e.g., after a volcanic eruption, the formation of SO3 can be limited by the availability of OH, which delays the formation of sulfate (e.g., Mills et al., 2017). Since SO2 point injections of a fixed amount require a larger number density of SO2 to be released in one grid box than regional injections, the oxidation of SO2 is expected to be more limited by OH for point injections than for regional injections. Consequently, the formation of H2SO4 gas is slowed for point injections, and as a result, nucleation into sulfate aerosol is slower compared to regional injections. In addition, SO2 and sulfate aerosol are transported by the movement of the Brewer-Dobson Circulation (BDC) stratospheric circulation upwards and towards mid- and high latitudes. For point injections in 30° N and 30° S, the continuous transport direction away from the injection source enables continued nucleation and reduces the condensation or coagulation of previously formed particles. This results in a minimum sulfate burden in the tropics and a maximum in mid-to-high latitudes (Figs. 1b, A1).
Regional injections between 30° N and 30° S and across all longitudes are expected to result in faster nucleation at the injection region, with reduced OH limitation. In addition, the continued supply of sulfur between 30° N and 30° S results in the accumulation of sulfate mass in the tropics, where the mass is somewhat constrained within the tropical pipe (Niemeier and Schmidt, 2017; Richter et al., 2017; Weisenstein et al., 2022). This leads to more substantial condensation and growth of existing particles. As for the point injections, gases and aerosols are transported toward the high latitudes through the BDC, resulting in a secondary maximum at latitudes of 40–60° (Fig. 1a).
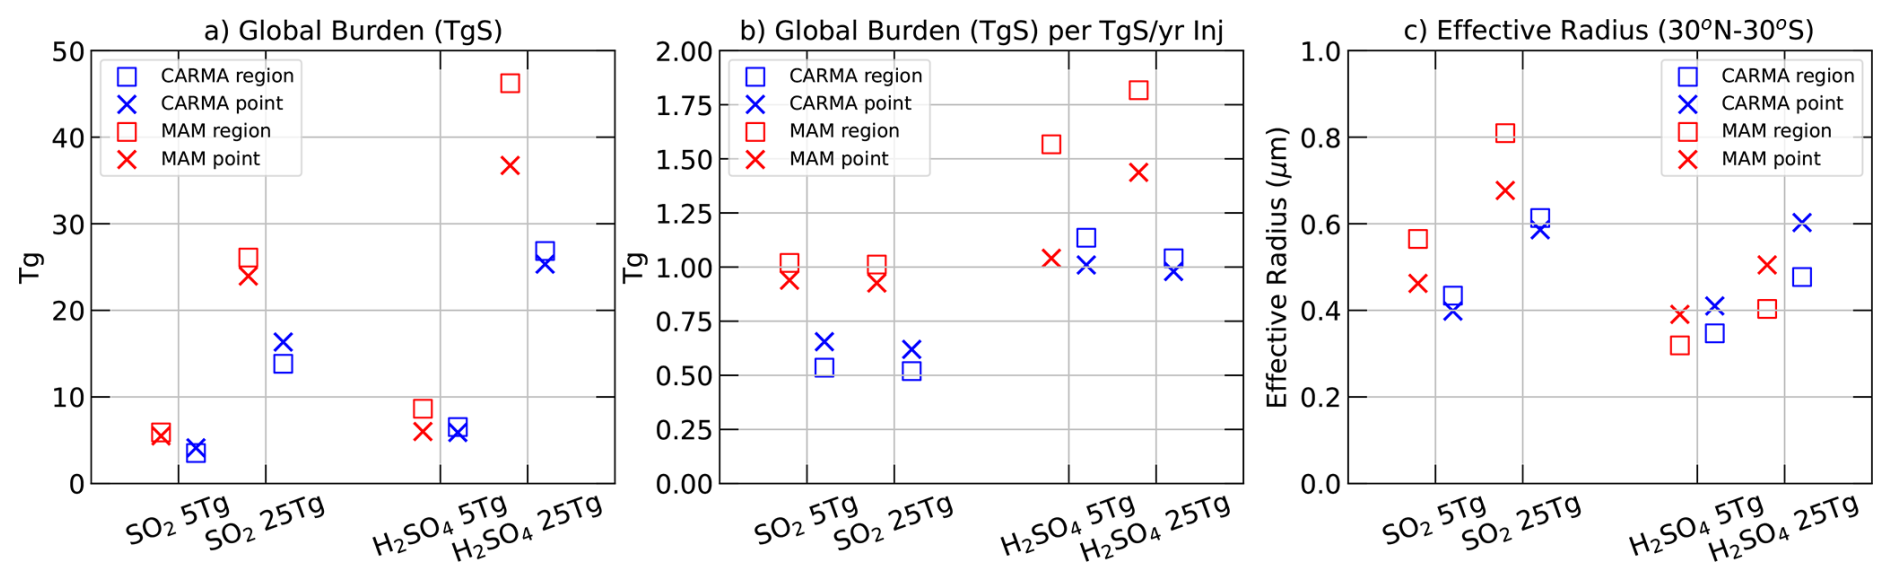
Figure 2(a) Global aerosol burden increase in Tg S, for CARMA (blue) and MAM4 (red), for different injection locations (regional injections: squares, point injections: crosses), different injection material, and for different injection amounts as indicated on the x axis. (b) As (a), but the global aerosol burden in Tg S is scaled by the injection amount per Tg S yr−1. (c) As (a), but for the stratospheric effective radius (averaged between 30° N and 30° S). The effective radius is scaled with the Surface Area Density to only include regions in the stratosphere with elevated aerosol burden.
While the shape of the zonal mean stratospheric aerosol burden is similar between CARMA and MAM4 (Fig. 1a, b red vs. blue lines), MAM4 results in almost double the total aerosol burden per Tg S yr−1 injection than CARMA (Fig. 2a). In addition, CARMA results in a larger sulfate aerosol burden per Tg S yr−1 injection for point injections than for regional injections, whereas the opposite is true for MAM4.
The CARMA sectional aerosol model divides the aerosol distribution into 20 bins, with the smallest bin of the pure sulfate group starting at 0.2 nm and the largest bin at 1.3 µm. In contrast, MAM4 describes the aerosol distribution using three modes: the Aitken, accumulation, and coarse modes (Fig. 3, blue bars for CARMA vs. red line for MAM4). The Aitken mode in MAM4, with a range between 15 and 53 nm, is significantly larger than the smallest CARMA bin, where the initially formed small sulfuric acid particles (sulfates) build up in the smallest bin/mode. Since the smallest nucleation size in MAM4 is significantly larger than in CARMA, sulfate molecules nucleate more rapidly, facilitating greater coagulation (see also Tilmes et al., 2023). The longer nucleation time in CARMA can further cause the recycling of H2SO4 back to SO2 (through photolysis). This difference between the two aerosol models results in a slightly larger effective radius for MAM4 compared to CARMA for both point and regional injections (Figs. 2c, A3). A similar difference between CARMA and MAM4 has been found after the Mt. Pinatubo eruption (Tilmes et al., 2023). However, a few weeks after the eruption, the CARMA effective aerosol grew larger than in MAM4. On the other hand, both aerosol models show consistent differences between regional and point injections in the effective radius. The faster condensation and coagulation for regional injections are expected to result in larger particles in the injection regions between 30° N and 30° S, as can be seen in Figs. 2c and A3).
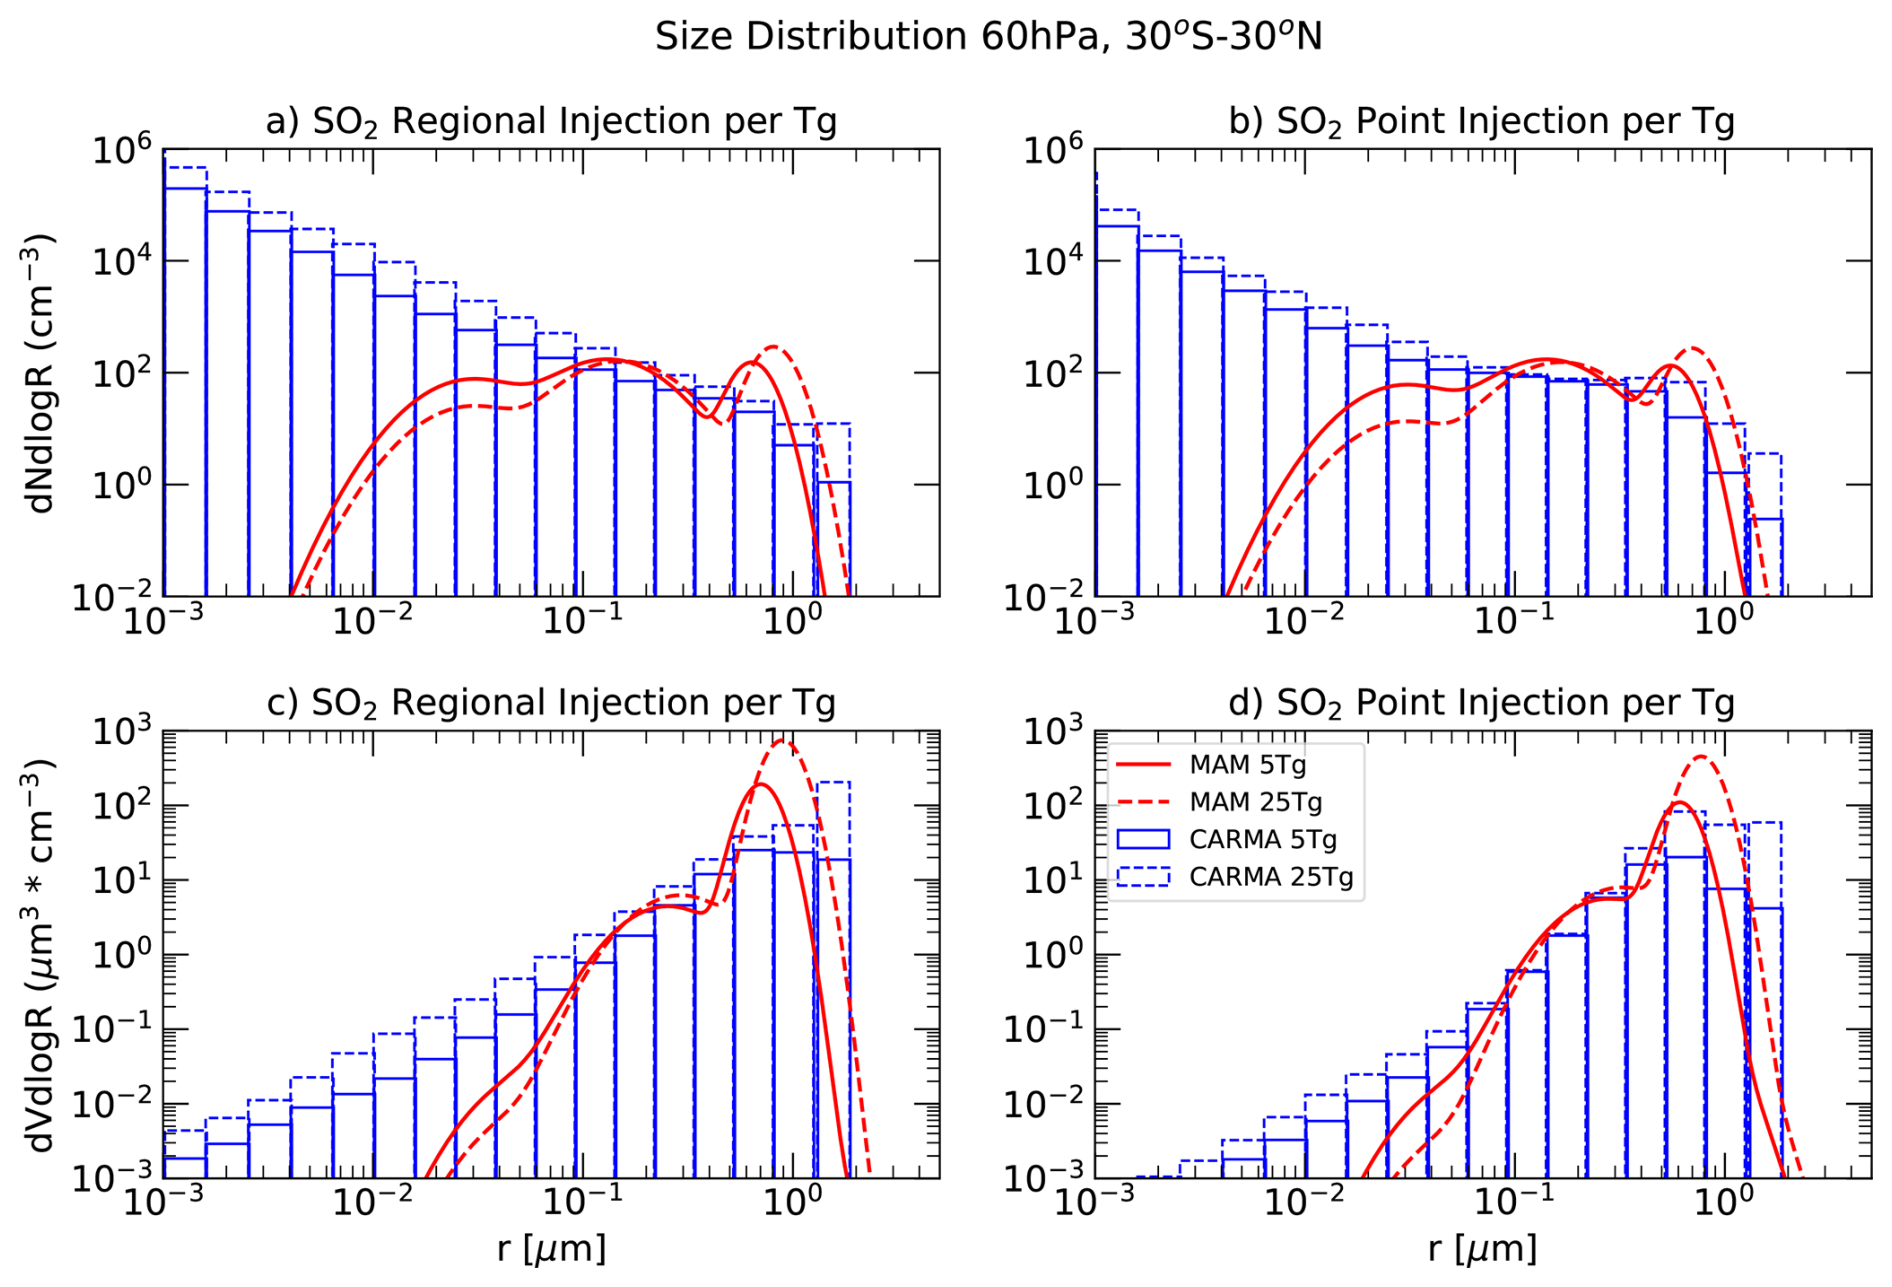
Figure 3Size distribution for SO2 injection experiments shown as (particles cm−3, panels a, b) and (cm−3 µm−1, panels c, d), at 60 hPa, averaged between 30° N and 30° S. Results are shown for CARMA (blue) and MAM4 (red), comparing different injection locations (regional injections on the left, point injections on the right), and for varying injection amounts (5 Tg S yr−1, solid lines; 25 Tg S yr−1, dashed lines).
For continuous SO2 injections, the number of nucleation mode particles is larger in CARMA. In comparison, the number of accumulation mode particles is larger in MAM4 due to the faster nucleation and condensation processes that occur with MAM4 (Fig. 2a, b). In addition, the volume size distribution (Fig. 2c, d) shows that CARMA shifts more mass into the largest bins for both point and regional injections, resulting in stronger sedimentation. In contrast, the size range for MAM4 is restricted to smaller mass bins due to the limited sigma range of the MAM4 coarse mode, resulting in less sedimentation and a larger total aerosol burden. Consequently, for the same SO2 injections, MAM4 exhibits a significantly larger burden than CARMA. The shift of number and mass towards the largest bin in CARMA also aligns with relatively larger sedimentation in CARMA for regional injections compared to point injections, resulting in a reduced burden for regional injections. In contrast, the larger sizes in MAM4 align with the larger burden for regional injections compared to point injections, suggesting a relatively smaller increase in the largest mode and, consequently, reduced sedimentation for the regional compared to the point injections. These findings show that the specifics of aerosol microphysical schemes can lead to opposing conclusions about whether point or regional injections result in larger sulfate aerosol burdens, which could influence decision-making about which injection scenario is preferred.
For larger SO2 injection rates (25 Tg S yr−1), continuous injections lead to a decrease in Aitken mode aerosol number density and an increase in coarse mode number density in MAM4, for both regional and point injections. In contrast, CARMA shows an increase in aerosol number density in both nucleation and Aitken modes with the larger injection rate for point injections, and an increase across all size bins for regional injections. This is due to the continuous nucleation of particles in CARMA, whereas for MAM4, most additional sulfur condensation occurs on existing particles. This difference in behavior between the two models results in a somewhat larger increase in effective radius in MAM4, from 5 to 25 Tg S injections for both point and regional injections. However, both models show little reduction in burden per Tg S in the Tropics, but a significant reduction in aerosol burden in mid-to-high latitudes, likely due to the faster removal of larger aerosol particles, which is more pronounced in MAM4.
In summary, differences in both nucleation processes (resulting in smaller particles in CARMA) and the limited coarse mode range in MAM4 are likely responsible for the differences in burden between CARMA and MAM4. For the accumulation mode, the high cutoff value in MAM4 is 0.48 µm with a sigma value of 1.6 µm. For the coarse model particles, the low cutoff value is 0.4 µm and the high value is 40 µm with a sigma value of 1.2 (Mills et al., 2016). The coarse mode’s sigma value of 1.2 seems to limit the peak of the coarse model size towards 0.5–0.6 µm for 5 Tg S yr−1 and 0.7–0.8 for the 25 Tg S yr−1 injections. In CARMA, sulfur injections do not result in a peak for the coarse mode number; instead, a steady decline towards larger bins is observed for most cases. Besides shortcomings in MAM4, CARMA also has shortcomings in fully resolving the sizes of the large injections. Especially for 25 Tg S yr−1 regional injections, mass is accumulating in the largest bins, which restricts particles from growing larger and potentially alters sedimentation rates in the model.
These findings are similar to those of Laakso et al. (2022) and Weisenstein et al. (2022), who found that the sectional aerosol model favors new particle formation over condensation on existing particles. In contrast to Laakso et al. (2022), MAM4 does not create a large gap between the accumulation and coarse modes despite having a similar setup as the modal model used in their study.
3.2 H2SO4 injections
The purpose of using AM-H2SO4 for SAI is to keep aerosol particles to a more optimal size, which would result in more effective scattering and radiative forcing for the same mass injected (Pierce et al., 2010; Benduhn et al., 2016; Weisenstein et al., 2022). Using SO3 or H2SO4 injections, therefore, will not require the initial nucleation of sulfate and also prevent condensational growth of injected particles. As for SO2 injection, the resulting size of sulfate particles will depend on the number concentration of SO2 injected per grid box. In contrast to SO2 injections, point injections at 30° N and 30° S inject a higher number density of particles at the injection location, leading to more initial coagulation than regional injections (Benduhn et al., 2016). This results in a somewhat smaller effective radius for regional than for point injections for both MAM4 and CARMA (Fig. 2c). Interestingly, point injections of SO2 and AM-H2SO4 result in a similar effective radius for 5 Tg S yr−1 injections. In contrast, regional injections result in a smaller effective radius for AM-H2SO4 than SO2 injections for both MAM4 and CARMA, which aligns with the more optimal radiative range between 0.3–0.4 µm (e.g., Weisenstein et al., 2022).
As for SO2 injections, regional injections initially constrain more mass in the tropics, resulting in a maximum aerosol burden (Figs. 1c, d, A1). In contrast, point injections result in more mass in mid-to-high latitudes. In comparison to SO2 injections, AM-H2SO4 injections show more than a doubling of the sulfur burden for regional injections in MAM4, which aligns with the reduced effective radius resolution and less sedimentation. In contrast, the burden of point injections is similar to that of SO2 injections, with a similar effective radius.
However, larger differences between CARMA and MAM4 in aerosol burden occur for AM-H2SO4 injections than for SO2 injections (Fig. 2a, b). The global burden per Tg S injection is significantly larger for regional injections in MAM4 than in CARMA. Increased regional injections increase the efficacy (in burden per Tg S yr−1 injection) in MAM4 for both regional and point injections. In contrast, in CARMA, the burden per Tg S yr−1 injection is slightly reduced. This behavior is substantially different between the two microphysical models, and can also be explained by the specifics of the bin vs. mode structure.
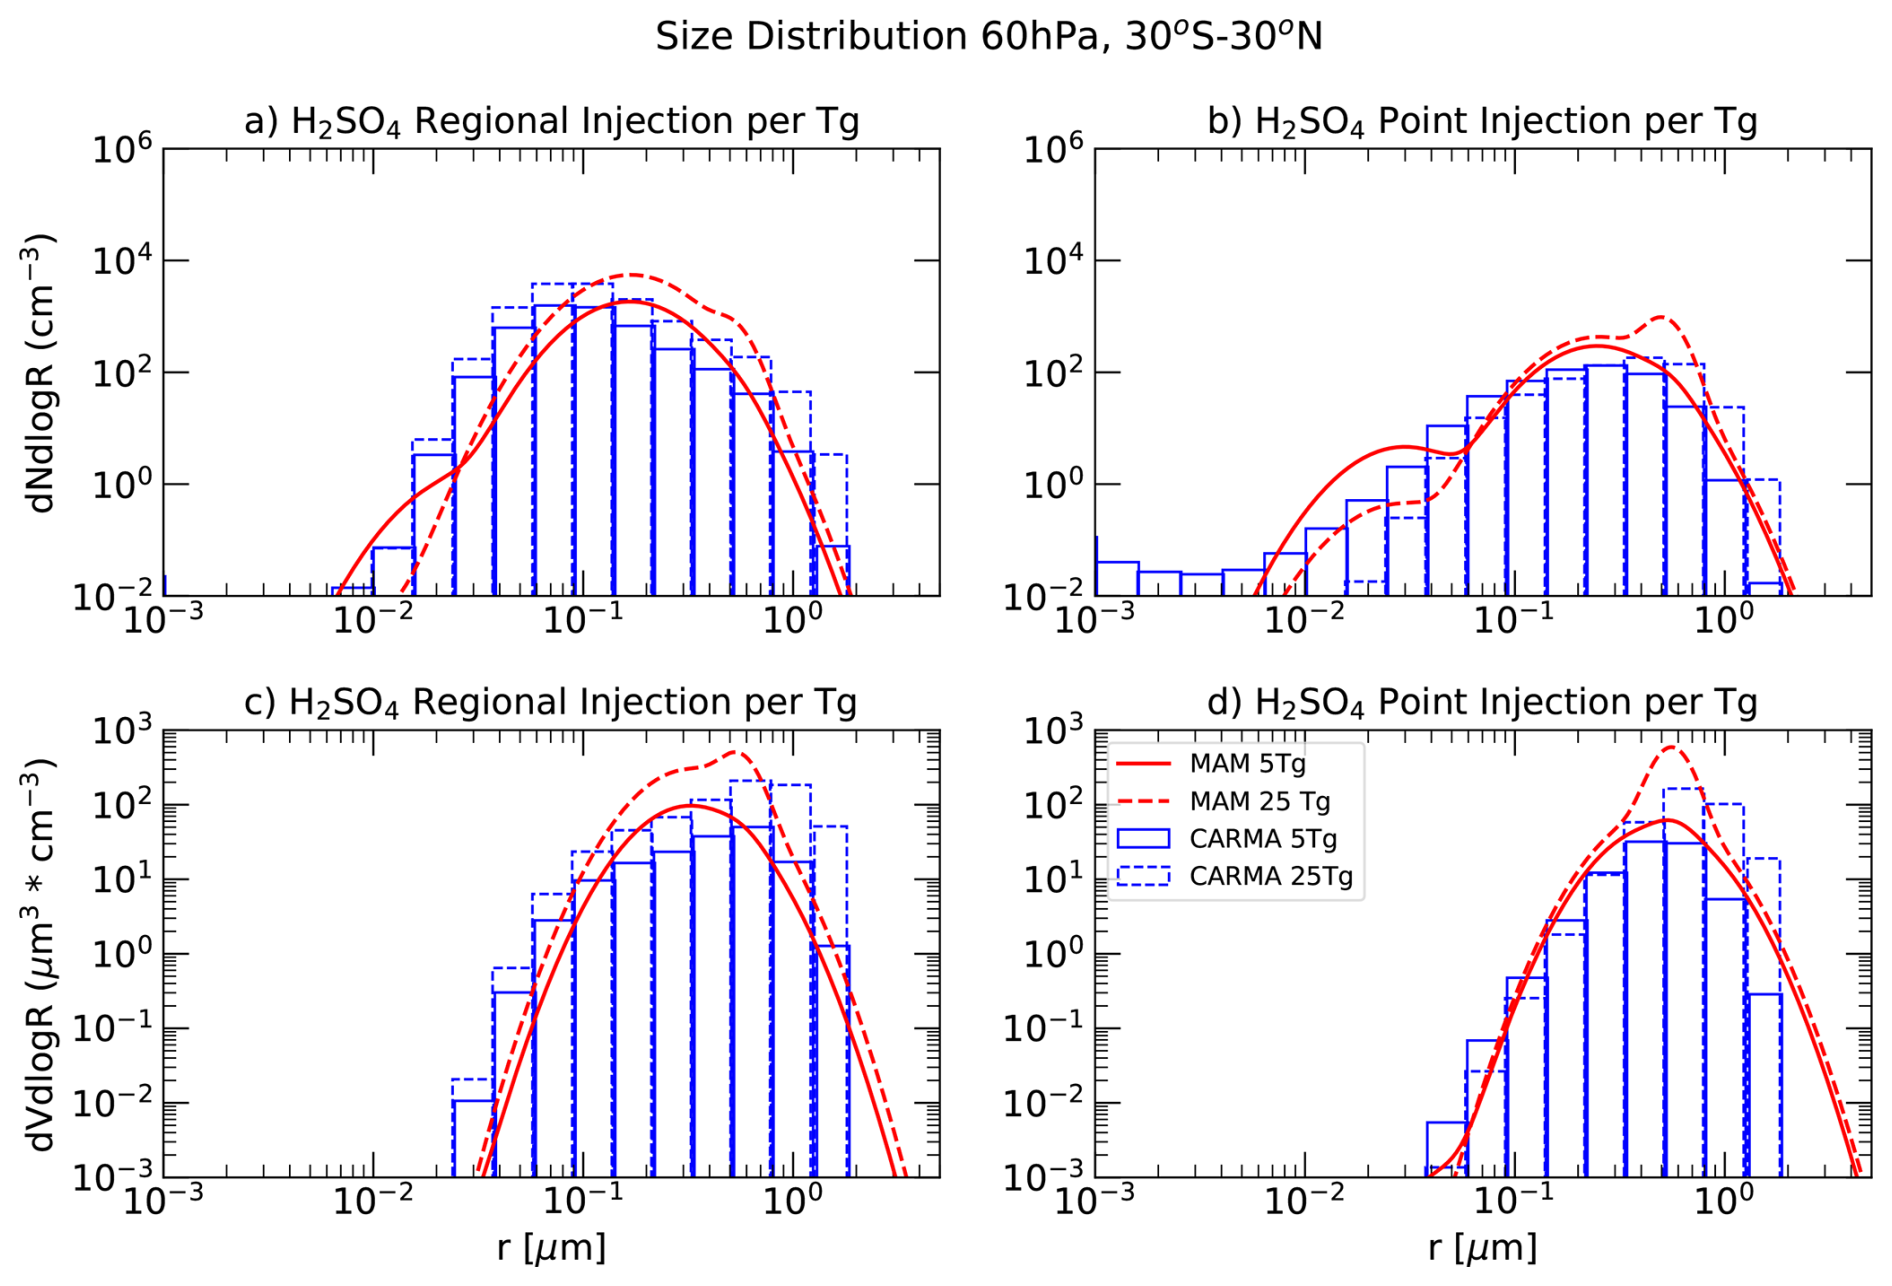
Figure 4Size distribution for AM-H2SO4 injection experiments shown as (particles cm−3; panels a, b) and (cm−3 µm−1; panels c, d), at 60 hPa, averaged between 30° N and 30° S. Results are shown for CARMA (blue) and MAM4 (red), comparing different injection locations (regional injections: panels a, c, point injections: panels b, d), and for different injection amounts (5 Tg S yr−1: solid lines, 25 Tg S yr−1: dashed lines).
As for SO2, the increase of sulfur injection from 5 to 25 Tg S yr−1 in CARMA leads to an increase in the number and mass of the largest aerosol bins, and with this, an increased sedimentation of mass (Fig. 4a, b). Therefore, both regional and point injections show a substantial reduction in burden per Tg S yr−1 injection (Fig. 2a, b). For MAM4, the additional mass accumulates in the accumulation model (especially for regional injections) and in the coarse mode. However, the peak of the coarse model in MAM4 does not expand significantly towards larger sizes, unlike for SO2 injections. In addition, the larger heating of the lower tropical stratosphere in this case (discussed below) is aligned with a larger spread of sulfur towards higher altitudes. It therefore increases rather than decreases the relative burden per injection amount (Fig. A2). It is further interesting that, while the sulfur burden for CARMA and MAM4 is very similar for AM-H2SO4 point injections of 5 Tg S yr−1, the number and volume size distribution exhibits a very different picture. For point injections, both MAM4 and CARMA populate some Aitken model particle sizes, likely due to the evaporation of sulfate particles, which results in the additional nucleation of smaller particles. On the other hand, the fixed sigma value MAM4 is expected to numerically push some mass towards smaller sizes with increasing injections. This behavior is much more pronounced in MAM4, artificially reducing the effective radius.
In summary, while the importance of nucleation and condensational growth is minimized in the AM-H2SO4 experiments, the differences between the sectional and modal models result in substantially different behavior regarding changes in efficacy with increasing injection amounts. The increase in the effective radius in both CARMA and MAM4 with increasing injection rates is similar for regional injections. However, the size distribution reveals that while both models add more mass to the coarse mode sizes, in MAM4 the peak of the coarse mode is centred around smaller sizes than in CARMA. Therefore, CARMA adds most of its mass to the largest mass bin of 1.3 µm, while MAM4 adds the mass at the peak of the coarse mode, which is around 0.4 µm. These differences are causing increasing sedimentation in CARMA but not in MAM4. Similar results were also found in Weisenstein et al. (2022), where the sectional aerosol model resulted in a larger number density for larger sizes than the modal models for regional injections and a substantially larger global sulfur burden for AM-H2SO4 injections in MAM4 compared to the other models. Interestingly, in Weisenstein et al. (2022), the other modal model (with a different complexity than MAM4) resulted in a more similar or smaller aerosol burden than the sectional aerosol model. This indicates that differences in how the sigma range and size constraint of the modes in modal models are defined can lead to a significantly different aerosol burden for continuous sulfur injections.
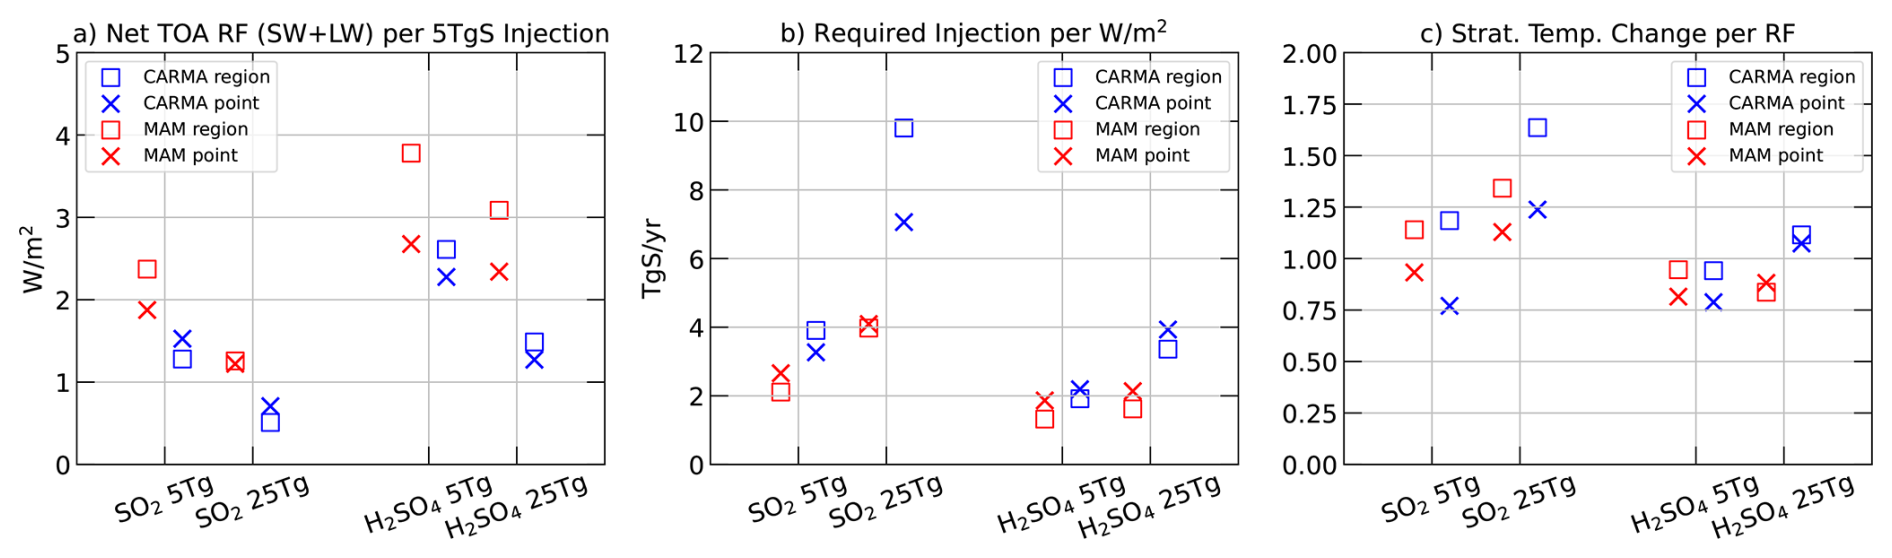
Figure 5(a) Globally averaged net top-of-atmosphere shortwave and longwave radiative forcing (W m−2) per 5 Tg S yr−1 injections minus the control experiments. Results are shown for CARMA (blue) and MAM4 (red), comparing different injection locations (regional injections: squares, point injections: crosses), different injection material, and different injection amounts (as indicated on the x axis). (b) As (a), but for the required injection per the net top-of-atmosphere radiative forcing (W m−2). (c) As (a), but for temperature changes compared to the baseline simulation (averaged between 30° N and 30° S).
The effect of sulfur injections on radiative forcing, e.g., the reduction in the top-of-the-atmosphere (TOA) net radiative balance, defined as the sum of short-wave and long-wave flux changes, depends on the stratospheric burden and the size of the particles (e.g., effective radius). Here, we illustrate the TOA radiative forcing per 5 Tg S yr−1 injection (instead of per 1 Tg S yr−1 injection, as done for the burden), for better readability of the results (Fig. 5a), and refer to this as “radiative forcing (RF) efficiency” in the following.
In general, the injections of AM-H2SO4 result in a larger RF efficiency per 5 Tg S yr−1 injections than the corresponding SO2 injections (Fig. 5a), in agreement with the finding from Weisenstein et al. (2022). The reason for this is that AM-H2SO4 injections result in a larger aerosol burden and a smaller (more optimal) effective radius than corresponding SO2 injections. In agreement with earlier studies, increasing injections of either material (from 5 to 25 Tg S yr−1) leads to a substantial decline in the RF efficiency. We find a reduction of around 50 % for CARMA and around 20 % for MAM4 in AM-H2SO4 injections with increasing injection rates. While the global burden per Tg S injection is very similar for the 5 and 25 Tg S injection cases for both CARMA and MAM4 (especially for SO2 injections), the larger injection results in a significantly larger effective radius, leading to a decline in RF efficiency. Furthermore, the reduction in efficacy in CARMA for AM-H2SO4 is significantly more pronounced because of the more substantial reduction in burden with increasing injections in CARMA compared to MAM4, as discussed above. In addition, CARMA suggests that point injections result in larger RF efficiency for SO2 injections than regional injections, whereas the opposite is true for MAM4.
The difference in RF efficiency translates to the required injections needed to achieve a reduction of 1 W m−2 (Fig. 5b). We acknowledge that these values are based only on the 5 and 25 Tg S yr−1 injection cases, which require an approximation between small and large injections. The resulting numbers differ between CARMA and MAM4 by a factor of 2.5 for large SO2 injections and a factor of 2 for large AM-H2SO4 injections.
In conclusion, similar to Laakso et al. (2022) and Weisenstein et al. (2022), the details of different aerosol microphysical models can result in substantially different injection amounts to achieve the same RF, which is also the case for relatively small injections of 5 Tg S yr−1. For small injections, the larger RF efficiency is achieved for AM-H2SO4 injections, both point injections and regional injections, consistent with Weisenstein et al. (2022). For larger injections around 25 Tg S yr−1, the RF efficacy is strongly reduced for both AM-H2SO4 and SO2 injections. Furthermore, the possible range of uncertainty due to the different aerosol models, which is a factor of 5 for SO2 injections (consistent with the results from Laakso et al., 2022) and a factor of 2 for AM-H2SO4 injections, should be considered when making cost estimates of SAI injections.
The injection of sulfate aerosol into the stratosphere has been shown to result in a heating of the tropical lower stratosphere as well as changes in the aerosol surface area density (e.g., Haywood and Tilmes, 2022). These changes result in impacts on stratospheric transport, chemistry, and ozone. In addition, stratospheric heating is an important driver of changes in the surface climate (e.g., Tilmes et al., 2025, and references therein). Temperature changes in the lower tropical stratosphere are dependent on the sulfate mass injected around the tropics (e.g., Richter et al., 2017). The larger the aerosol mass, the larger is the absorption of solar radiation and therefore the heating of the adjacent atmosphere. Here, we discuss tropical lower stratospheric temperature changes resulting from a reduction in radiative forcing for both 5 and 25 Tg S yr−1 injection cases (Figs. 5c and A5, for 5 Tg S yr−1 injections only).
We illustrate the tropical lower stratospheric heating changes scaled to the net top-of-the-atmosphere radiative forcing resulting from the sulfur injections (as shown in Fig. 5a). We expect that the experiments with the lowest stratospheric temperature change per RF will result in the least amount of changes to the surface climate. The lowest heating per reduced RF of below 1 °C is found for SO2 point injections and AM-H2SO4 point and regional injections for both CARMA and MAM4, with slightly smaller heating in CARMA. Regional injections generally show more heating per RF, due to the injections within the entire tropical region and a corresponding larger aerosol burden. For large SO2 injections of 25 Tg S yr−1, experiments show an increase in heating per RF of up to 75 % for CARMA and only around 20 % for MAM4, resulting in more heating per RF in CARMA than in MAM4. For AM-H2SO4 injections, the heating per RF is similar for most cases, besides somewhat larger heating in CARMA for 25 Tg S yr−1 injections.
Differences in lower-stratospheric heating across the experiments also affect stratospheric water vapor, leading to a more substantial increase in water vapor with more heating for both CARMA and MAM4 (Fig. A8). The increases in water vapor can partially offset the radiative forcing induced by the sulfur injections.
The effect of SAI on total column ozone (TCO) has been discussed in detail in various studies, which point out that changes in TCO depend on injection strategies and model internal differences (Haywood and Tilmes, 2022). Most recent studies (Bednarz et al., 2023) have assessed the effects of SAI on ozone using only modal aerosol models, including MAM4. Comparisons of the effects of SAI between two microphysical models within the same modeling framework, namely CESM2, have not been performed previously. As previously discussed (Haywood and Tilmes, 2022), the effects of SAI on ozone depend not only on chemical changes, including heterogeneous chemistry (which is proportional to changes in Surface Area Density (SAD) and also depends on temperature changes), but also on dynamical responses and transport, resulting in regions with both increasing and decreasing ozone concentrations (Fig. A6).
As discussed above, point injections in 30° N and 30° S are expected to lead to stronger movement of aerosol mass towards high latitudes and therefore result in a higher increase in SAD. In contrast, regional injections result in more mass refinement in the tropics, leading to a relatively smaller SAD in high latitudes, as shown in Fig. A7. On the other hand, regional injections produce stronger heating in the lower tropical stratosphere, which, in turn, affects the upwelling and transport of aerosols. They also strengthen the polar vortex, resulting in cooler temperatures in the polar vortex, due to the stronger horizontal temperature gradient in the lower stratosphere compared to point injections (e.g., Tilmes et al., 2017). The combined changes result in a relative reduction in annual TCO in mid- and high-latitude regions, and some minor changes in the tropics (Fig. 6). Interestingly, the combined changes in SAD, temperature, and transport result in very similar changes between regional and point injections, with around 10 % reductions in the SH polar region and 0 %–5 % reductions in annual TCO in the NH polar region for SO2 injections for 5 Tg S yr−1 for both CARMA and MAM4. Stronger SO2 injections of 25 Tg S yr−1 result in larger changes, with around 16 % and 18 % reductions for CARMA compared to regional and point injections, respectively, and 22 % and 25 % reductions in MAM4, due to the larger aerosol burden in MAM4 compared to CARMA. Strong injections can also lead to up to 10 % reductions in TCO, with the most considerable changes for regional injections using AM-H2SO4.
For AM-H2SO4 5 Tg S yr−1 injections, MAM4 is showing very similar results between regional and point injections in high latitudes, around 15 % for SH and 3 %–6 % for NH high latitudes of annual reductions. While much more mass and SAD are located in the tropics for regional injections, SAD is more similar in the high latitudes (Fig. A7). Larger differences are simulated using CARMA, with 7 % and 12 % changes for regional injections compared to point injections, respectively, in the SH polar region, and around 3 %–5 % in the NH polar region. Differences between MAM4 and CARMA in TCO for regional injections of AM-H2SO4 are aligned with the much smaller aerosol burden for regional injections in CARMA than in MAM4, discussed above. For AM-H2SO4 25 Tg S yr−1, the differences between CARMA and MAM4 are becoming more pronounced, with over 30 % reductions in the SH polar region for MAM4 and over 20 % for CARMA, and over 20 % reduction in the NH polar region for MAM4 and around 10 % reduction for CARMA. Differences are again the result of a substantially larger aerosol burden resulting from the same injection amount in MAM4 vs. CARMA.
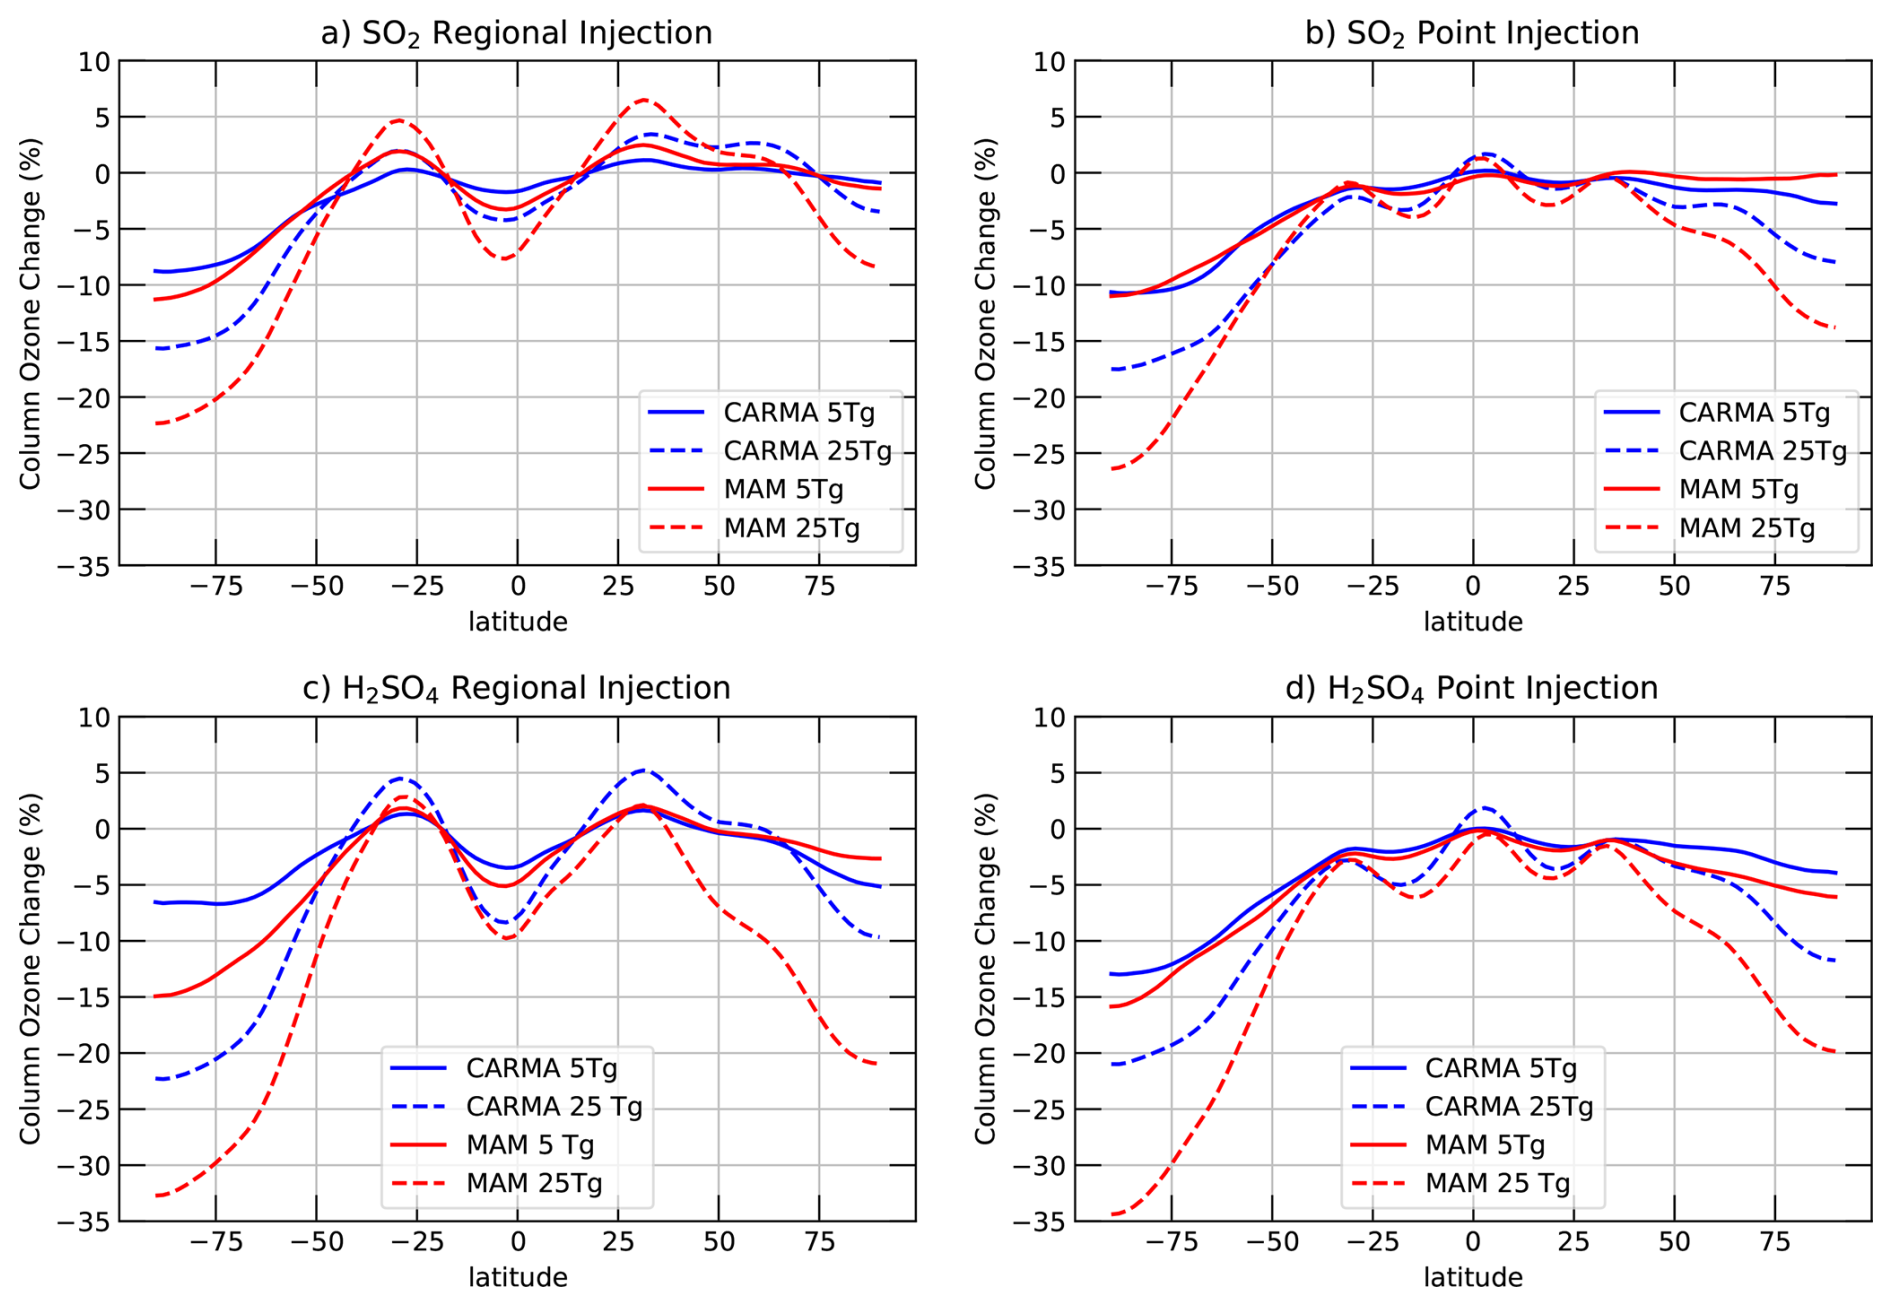
Figure 6Annual relative changes in total column ozone (TCO) compared to the control for CARMA (blue) and MAM4 (red), and for different injection locations (regional injections: panels a, c, point injections: panels b, c), different injection material (SO2: panels a, b, AM-H2SO4: panels c, d), and for different injection amounts (5 Tg S yr−1: solid, 25 Tg S yr−1: dashed), assuming 2040 halogen and greenhouse gas emissions.
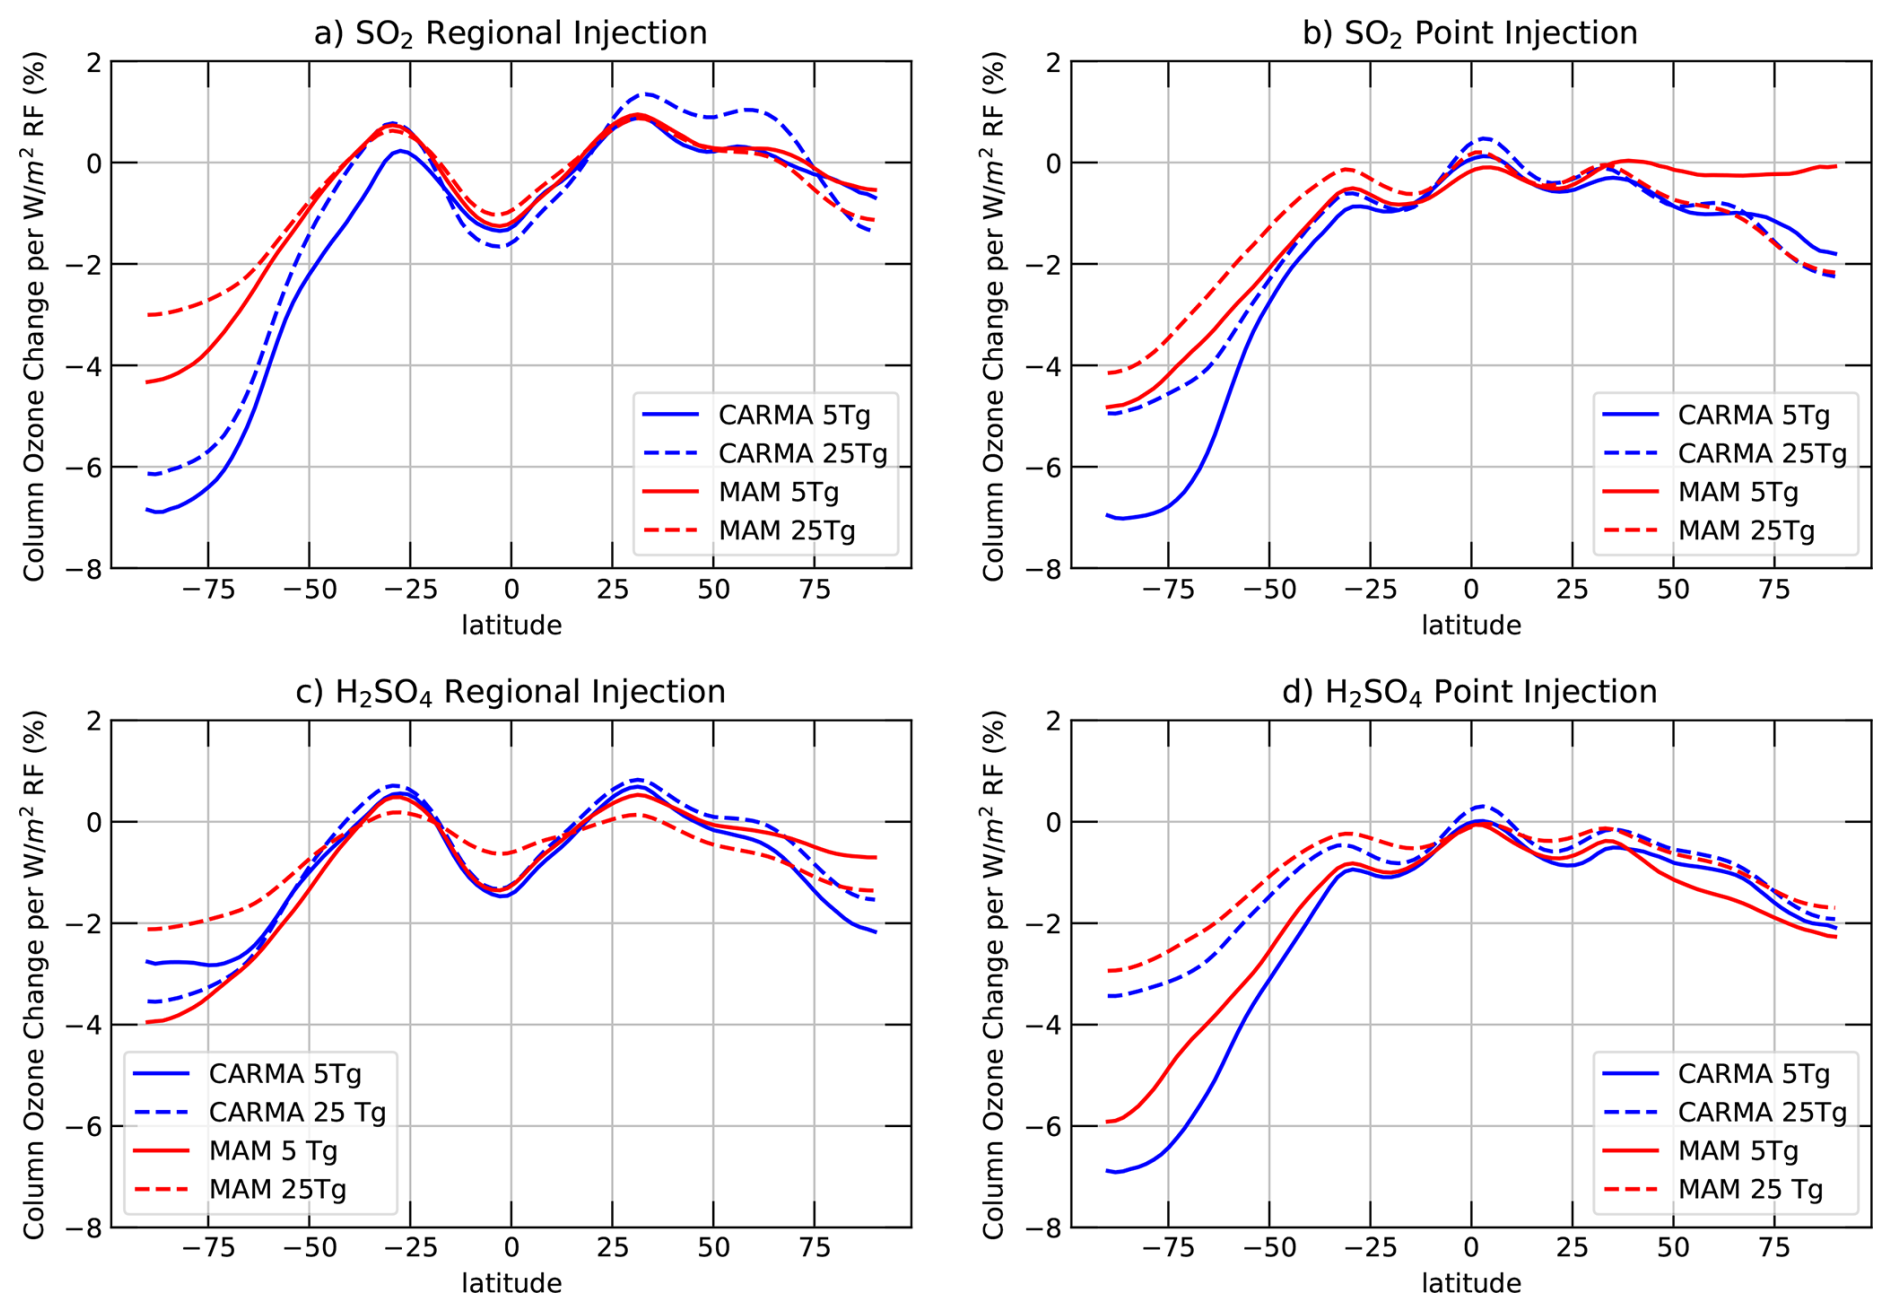
Figure 7Annual relative changes in total column ozone (TCO) compared to the control divided by the net top-of-the-atmosphere radiative forcing resulting from the sulfur injections for CARMA (blue) and MAM4 (red), and for different injection locations (regional injections: panels a, c, point injections: panels b, c), different injection material (SO2: panels a, b, AM-H2SO4: panels c, d), and for different injection amounts (5 Tg S yr−1: solid, 25 Tg S yr−1: dashed), assuming 2040 halogen and greenhouse gas emissions.
In addition to comparing TCO changes directly, we also compare TCO changes scaled by the net top-of-the-atmosphere radiative forcing resulting from the sulfur injections (as also shown for temperature changes above). Since the RF efficiency is smaller in CARMA than in MAM4, the relative changes in TCO per RF result in about 2 % stronger ozone reduction of TCO per W m−2 RF in CARMA than in MAM4, especially for NH high polar latitudes and for SO2 injections (Fig. 7). In contrast, AM-H2SO4 injections show fewer differences between CARMA and MAM4. In general, larger injections of 25 Tg S yr−1 compared to 5 Tg S yr−1 result in relatively smaller ozone loss per RF. This is because a larger mass and effective radius result in a smaller SAD. More substantial TCO reduction per net TOA RF for the sectional aerosol model compared to the modal aerosol model was also reported in Weisenstein et al. (2022), which is also aligned with a more substantial Net TOA RF reduction in CESM compared to the sectional aerosol model in their study.
The comparison of experiments using two different aerosol microphysical models within the same CESM2 modeling framework reveals that differences in the aerosol scheme alone can lead to significant variations in the effects of SAI. Therefore, other inter-model differences, as discussed in Weisenstein et al. (2022), are of reduced importance in our study. Here, we demonstrate that differences in the nucleation process can lead to significant differences in the aerosol size distribution between the sectional and modal aerosol models. Continuous SO2 injections result in more nucleation in CARMA than MAM4, resulting in a smaller effective radius in CARMA compared to MAM4, similar to what has also been found in Laakso et al. (2022). An improved nucleation scheme in MAM4 may therefore improve some of the differences between the two aerosol models.
Furthermore, the details of the mode structure in MAM4 do not reproduce the same size distribution of continuous aerosol injections as shown in CARMA. The coarse model features a relatively small sigma of 1.2 µm, which limits the growth of coarse-mode particles in MAM4 compared to CARMA. In contrast, CARMA suggests an accumulation of mass in the larger bins with increasing injection amount. The difference in coarse-mode number between CARMA and MAM4 results in a stronger removal of mass in CARMA, and therefore, an aerosol burden that is, in part, almost half the amount of that for MAM4, especially for point injections. Therefore, changes in the coarse mode quantities in MAM4 need to be further explored to achieve a more comparable representation to CARMA and other aerosol models. For AM-H2SO4 injection experiments, nucleation and condensation are less important. Nevertheless, differences as a result of the bin structure are becoming more apparent for larger injections. MAM4 results in an increase in efficacy with increasing injections, while CARMA shows a reduction.
It has been shown that CARMA is more effective in reproducing size distributions compared to observations after the large volcanic eruption of Mt. Pinatubo in 1991. While a large, impulsive volcanic eruption might not be a suitable analogue for the continuous sulfur injections required for SAI applications, the comparisons provide us with more confidence in CARMA results than in MAM4 results. However, even CARMA may not have large enough size bins, especially to simulate the large sulfur particles resulting from SAI for very large injection cases of 25 Tg S yr−1, which are sufficient to counter a business-as-usual warming scenario by the end of the 21st century (Tilmes et al., 2018). This shortcoming is likely also a potential issue in other existing aerosol models, requiring more work.
We further investigate trade-offs between different injection scenarios in terms of radiative efficiency, the required injection amounts needed to reduce the net TOA imbalance to 1 W m−2, as well as the tropical lower stratosphere heating and total column ozone loss per RF. Both MAM4 and CARMA show improved RF efficiency for AM-H2SO4 injections compared to SO2 injections, in agreement with Weisenstein et al. (2022). However, CARMA RF efficiency is substantially lower by up to half the amount, and even more for 25 Tg S yr−1 injections of SO2. This difference translates into a difference in the required injections for achieving a negative RF of 1 W m−2, a factor of 5 for SO2 injections, and a factor of 2 for AM-H2SO4 injections for large injection amounts. The differences in RF efficiency are a result of differences in the aerosol size distribution (effective radius), as well as the aerosol burden per injection amount. This leads to similar RF efficiency only for point injections of AM-H2SO4 between CARMA and MAM4, and larger RF efficiency in MAM4, primarily due to the significantly larger burden in MAM4 and also due to a somewhat smaller effective radius for AM-H2SO4 injections. Similar values were reported in Laakso et al. (2022), comparing a sectional and modal aerosol model. In Weisenstein et al. (2022), CESM2 MAM4 is showing the strongest RF efficiency, while the other models are more similar to the CARMA RF efficiency.
Estimations of costs need to carefully consider the range of uncertainties regarding the injection amount and the substantial decline in efficacy with increasing injections, which is only partially taken into account (Smith, 2020). These studies also don't consider possible differences in the injection strategy (location and material), which also have consequences for the injection amount and, therefore, the resulting costs.
Differences in the aerosol burden per Tg S yr−1 injections and the RF efficiency between CARMA and MAM4 also translate to differences in the tropical lower stratospheric heating per unit of RF. While CARMA shows somewhat smaller or similar heating per unit of RF for point injections for 5 Tg S yr−1 injections of both SO2 and AM-H2SO4, substantially larger heating per unit of RF is simulated for CARMA than MAM4 for larger injections of 25 Tg S yr−1. Also, regional injection around the tropics results in stronger heating per unit of RF, due to the accumulation of more mass in that region. The smallest heating per unit of RF is simulated with large regional AM-H2SO4 injections using MAM4, which is a result of the increasing efficacy of MAM4 with increasing injections. Differences in CARMA compared to MAM4 demonstrate that many recent SAI model simulations performed with MAM4 point injections (e.g., Tilmes et al., 2018, 2020; Richter et al., 2022) may overestimate the tropical stratospheric aerosol heating response per unit of RF for smaller injections and underestimate it for large injections. The difference in the results highlights a significant uncertainty in the SAI response to surface climate, not only across different injection strategies but also across different aerosol models. To investigate the full effects of these differences on climate, future studies using an Earth System model with a fully coupled ocean are required.
Finally, the effects of SAI on TCO differ depending on the injection region, location, and amount of injection. However, comparing the TCO change with regard to the net top-of-the-atmosphere radiative forcing reduction per experiment reveals smaller differences between the various injection strategies, with point injections at 30° N and 30° S showing slightly larger TCO reductions in high latitudes for 5 Tg S yr−1 injections. Differences between CARMA and MAM4 are considerable, with CARMA generally showing larger TCO in high latitudes. Significantly more ozone loss occurs in the tropics due to regional injections, resulting in larger changes in heating and transport.
In summary, we have demonstrated that considering different aerosol microphysical models can lead to significantly different impacts of SAI, including injection requirements for achieving a specific negative RF, with consequences for costs, heating of the lower tropical stratosphere, and effects on ozone. Furthermore, while AM-H2SO4 has a stronger efficacy and RF efficiency resulting in reductions in implementation costs (with the caveat that a uniformly distributed injection of AM-H2SO4 in the size of a CESM gridbox may not be technically feasible; e.g., Pierce et al., 2010), the benefits of climate impacts or the impacts on ozone with regard to the RF efficiency are often smaller compared to differences between aerosol microphysical models. The differences between CARMA and MAM4 further increase with increasing injection amounts. More work is therefore required to evaluate and improve aerosol microphysical models, and the need for using more sophisticated sectional aerosol models for simulating SAI injections is evident.
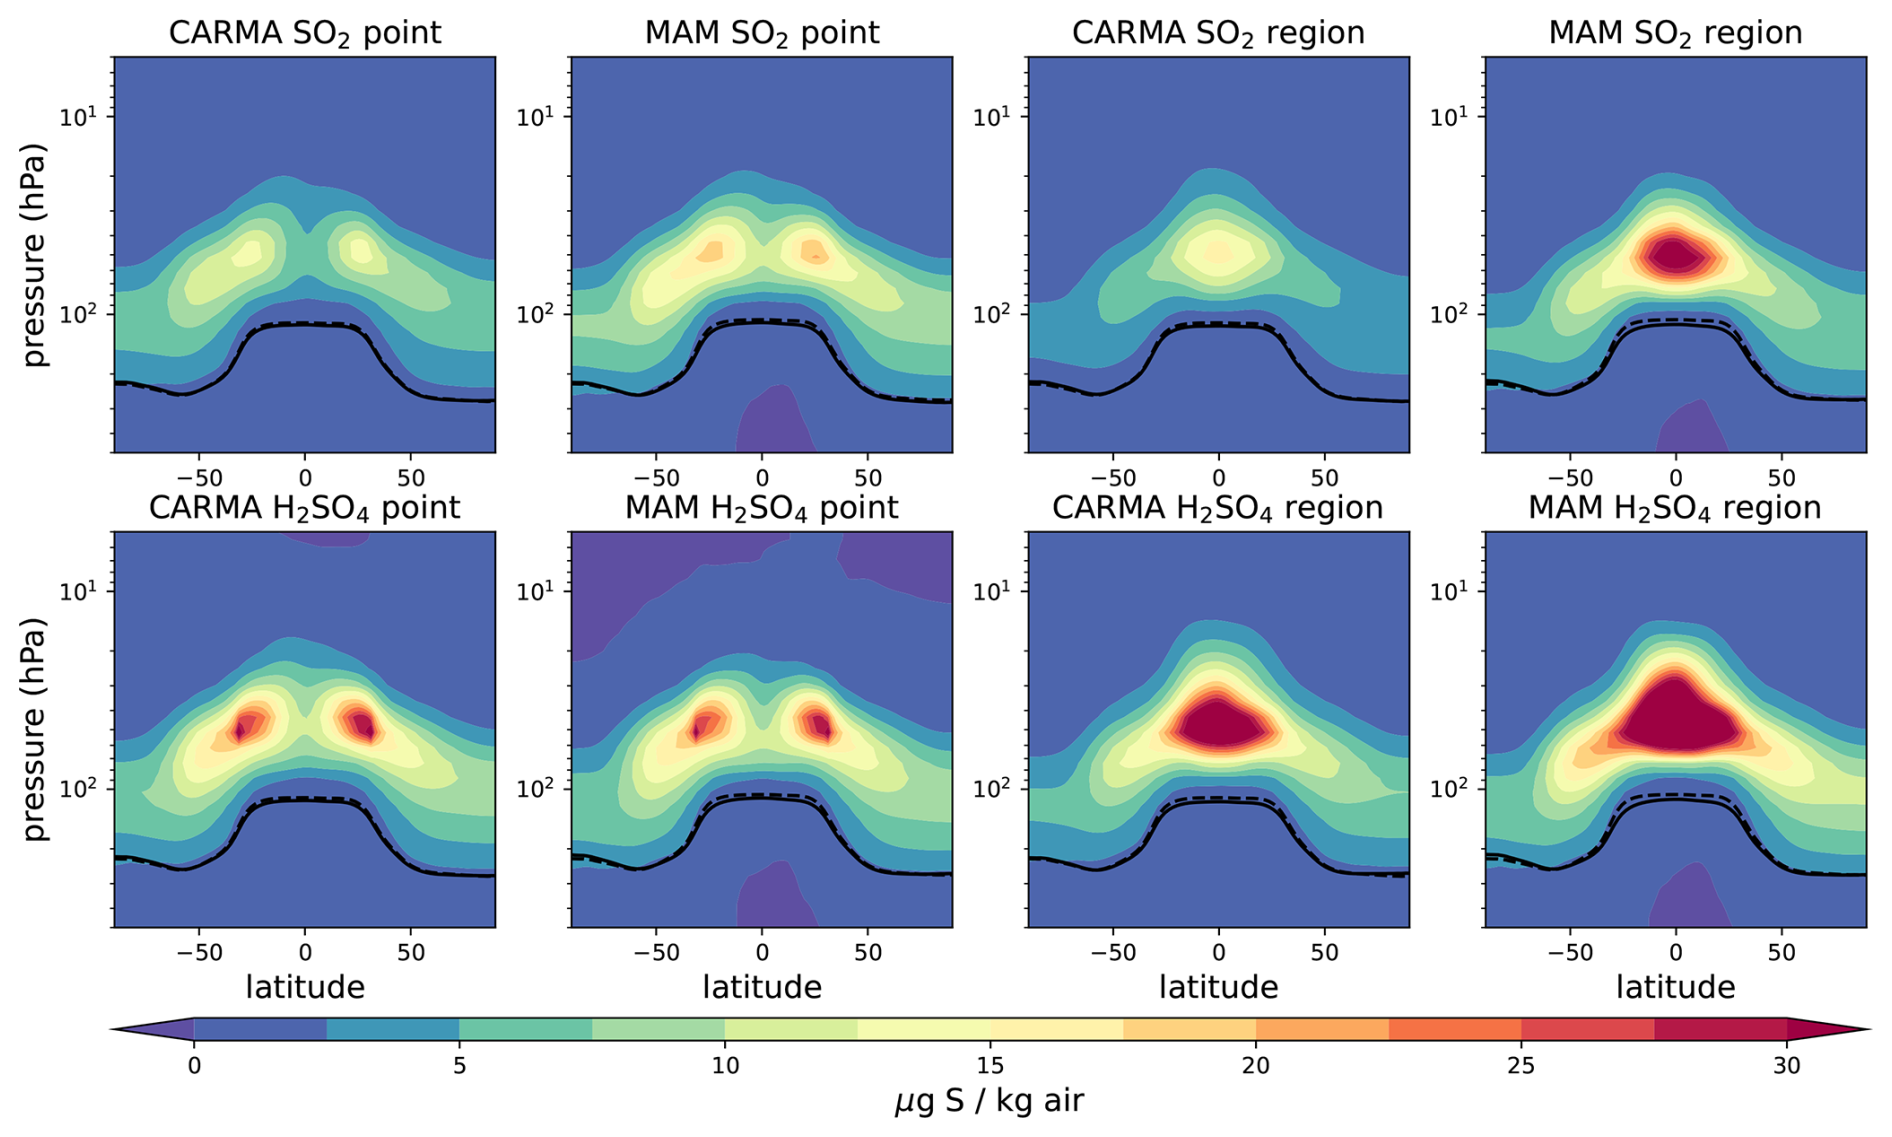
Figure A1Zonal mean sulfate aerosol mixing ratios for different 5 Tg S injection experiments minus the control in µg S kg−1 air. The tropopause of the control experiment and the injection experiments are illustrated as black solid and dashed lines, respectively.
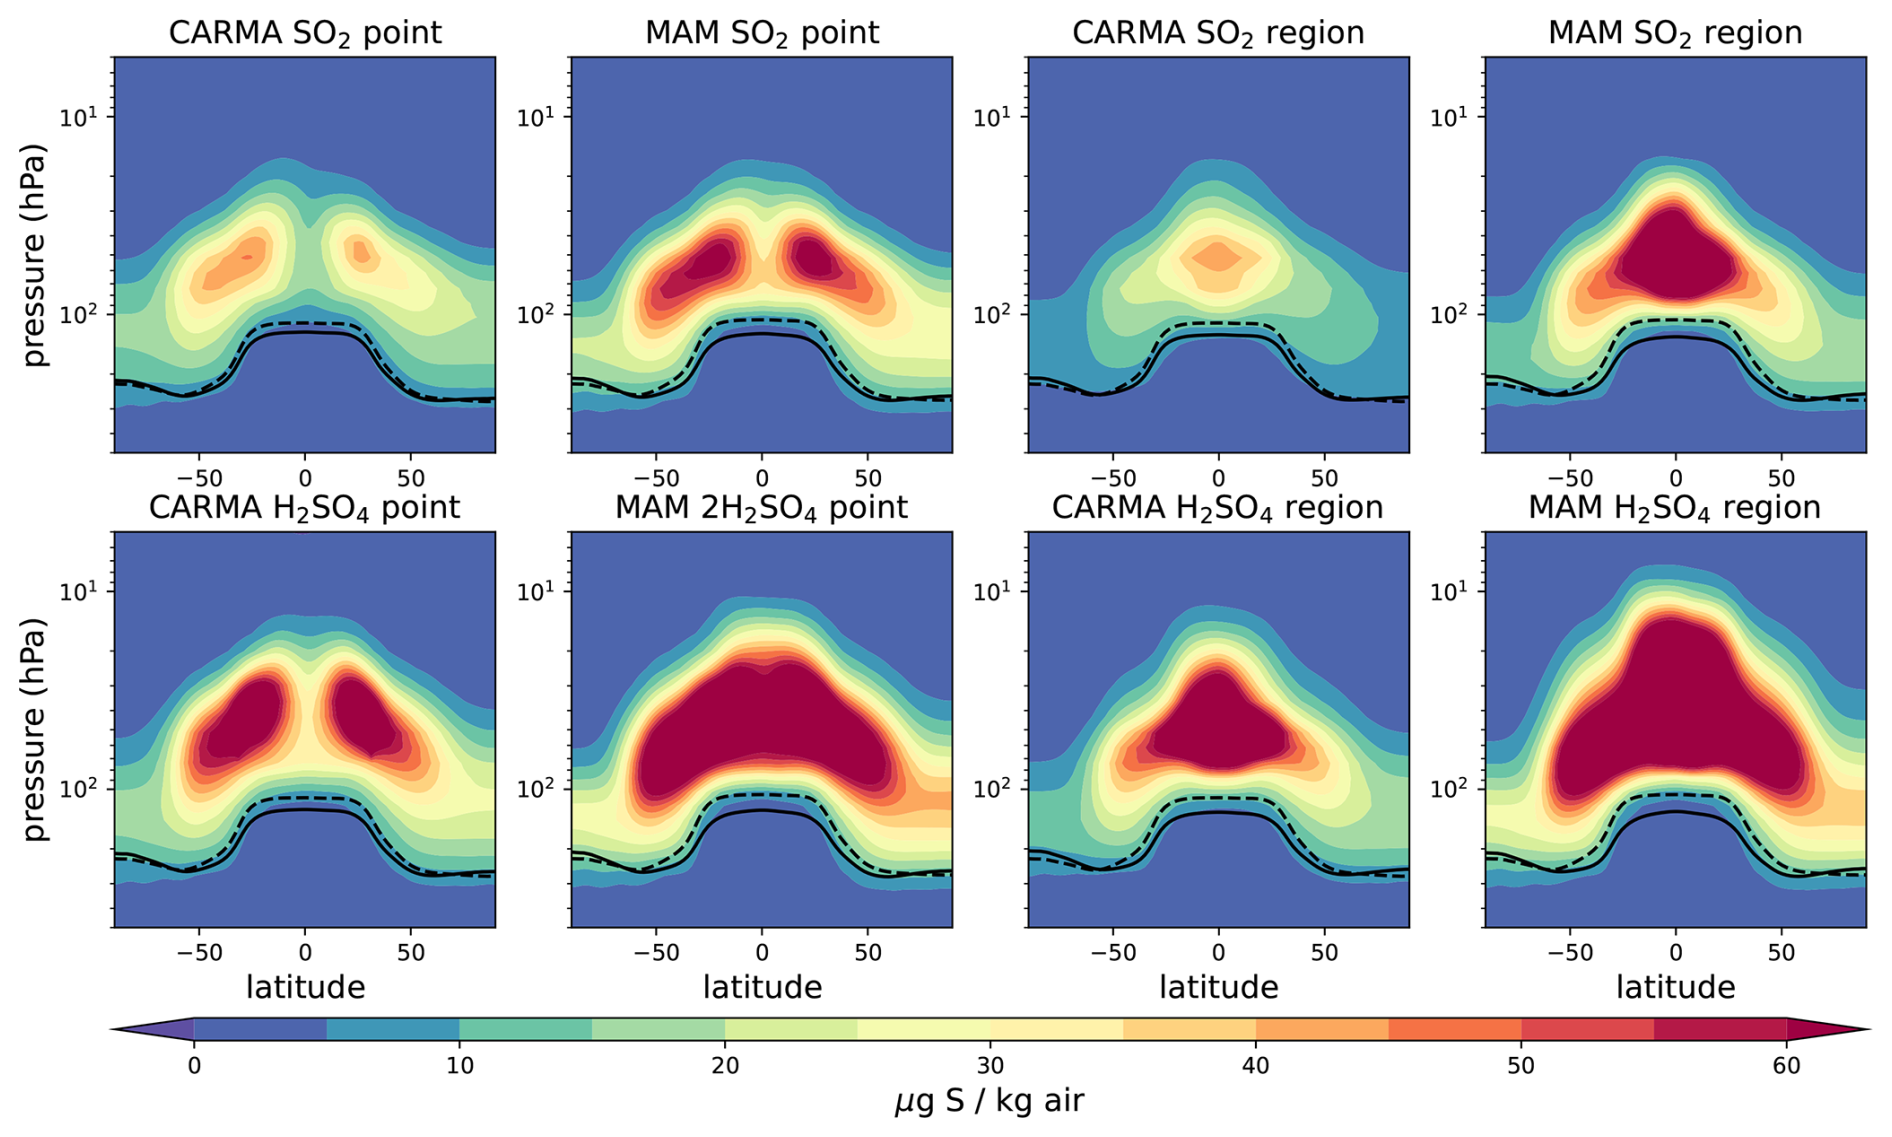
Figure A2Zonal mean sulfate aerosol mixing ratios for different 25 Tg S injection experiments minus the control in µg S kg−1 air. The tropopause of the control experiment and the injection experiments are illustrated as black solid and dashed lines, respectively.
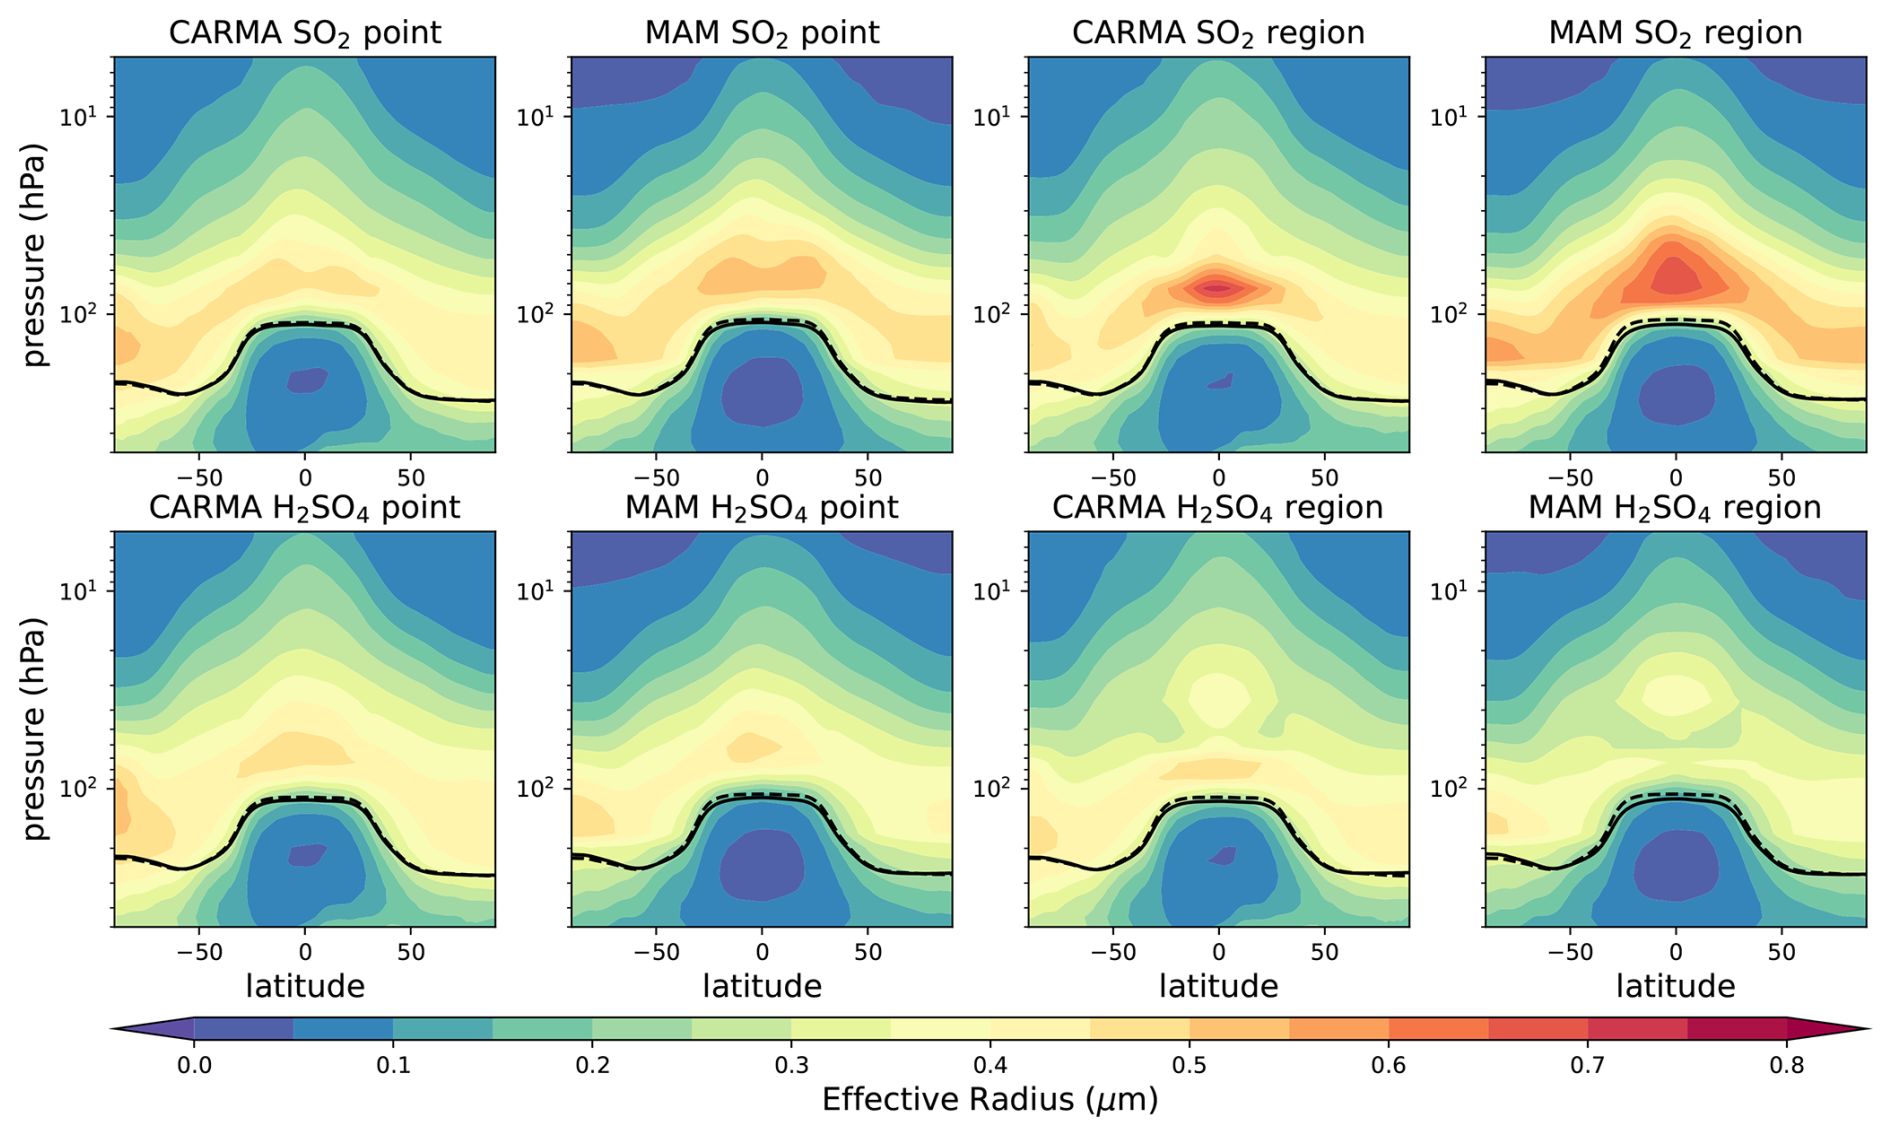
Figure A3Zonal mean effective radius distribution in µm for different 5 Tg S injection experiments. The tropopause of the control experiment and the injection experiments are illustrated as black solid and dashed lines, respectively.
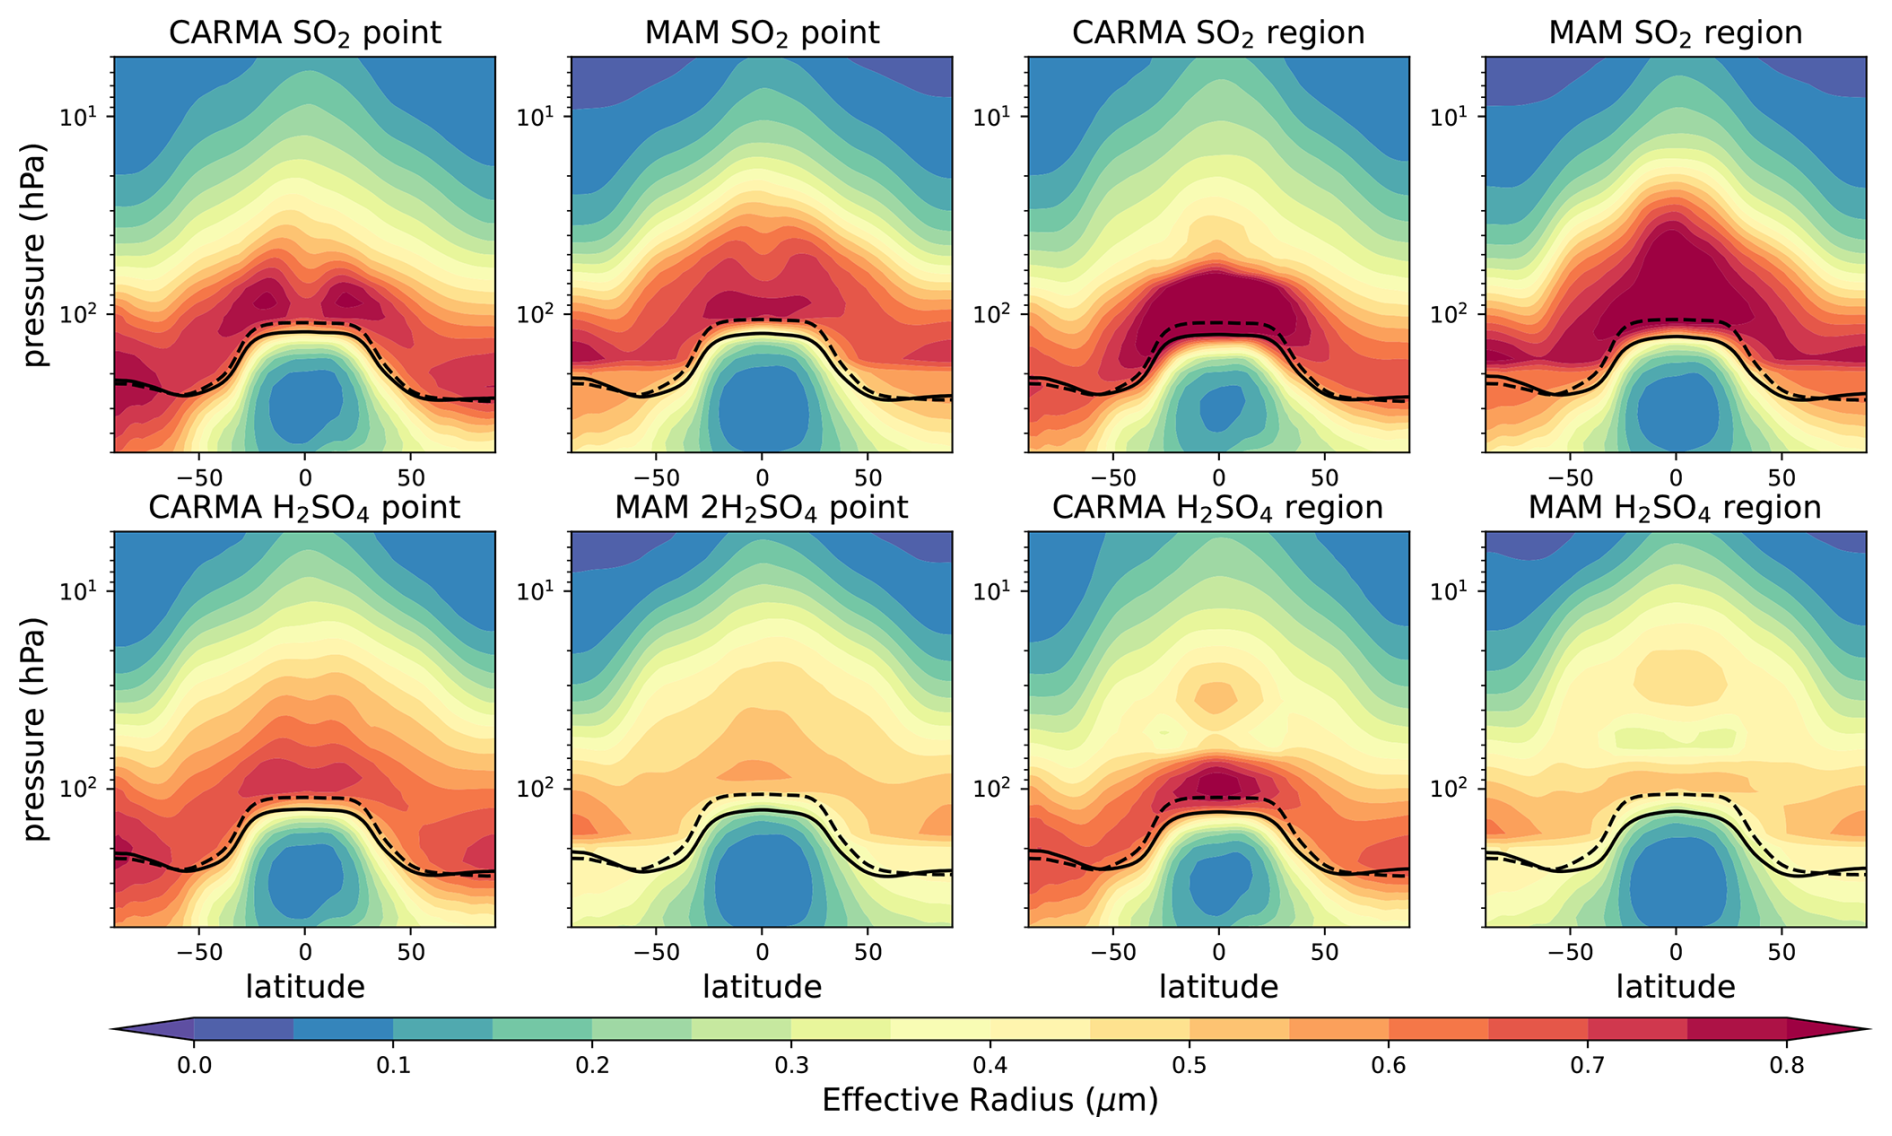
Figure A4Zonal mean effective radius distribution in µm for different 25 Tg S injection experiments. The tropopause of the control experiment and the injection experiments are illustrated as black solid and dashed lines, respectively.
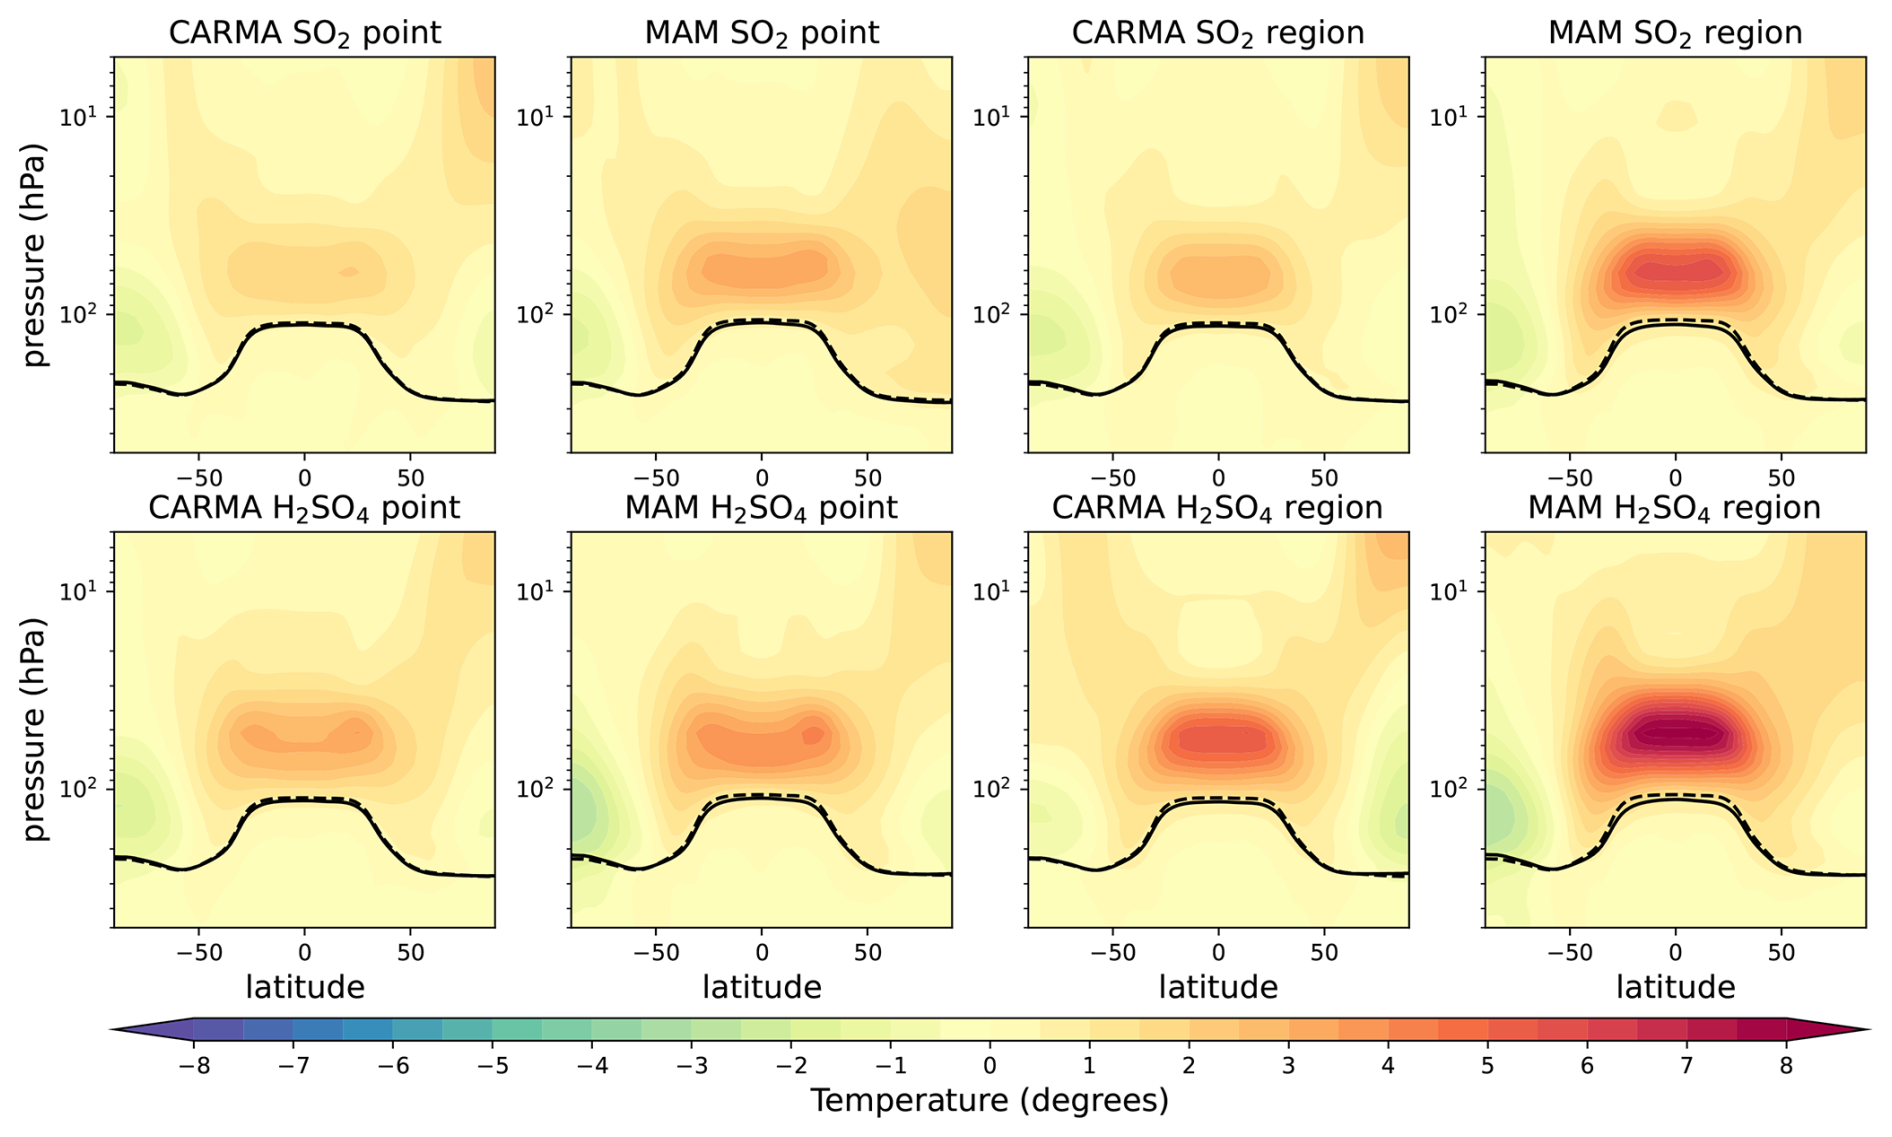
Figure A5Zonal mean temperature differences for different 5 Tg S injection experiments minus the control in degrees Celsius. The tropopause of the control experiment and the injection experiments are illustrated as black solid and dashed lines, respectively.
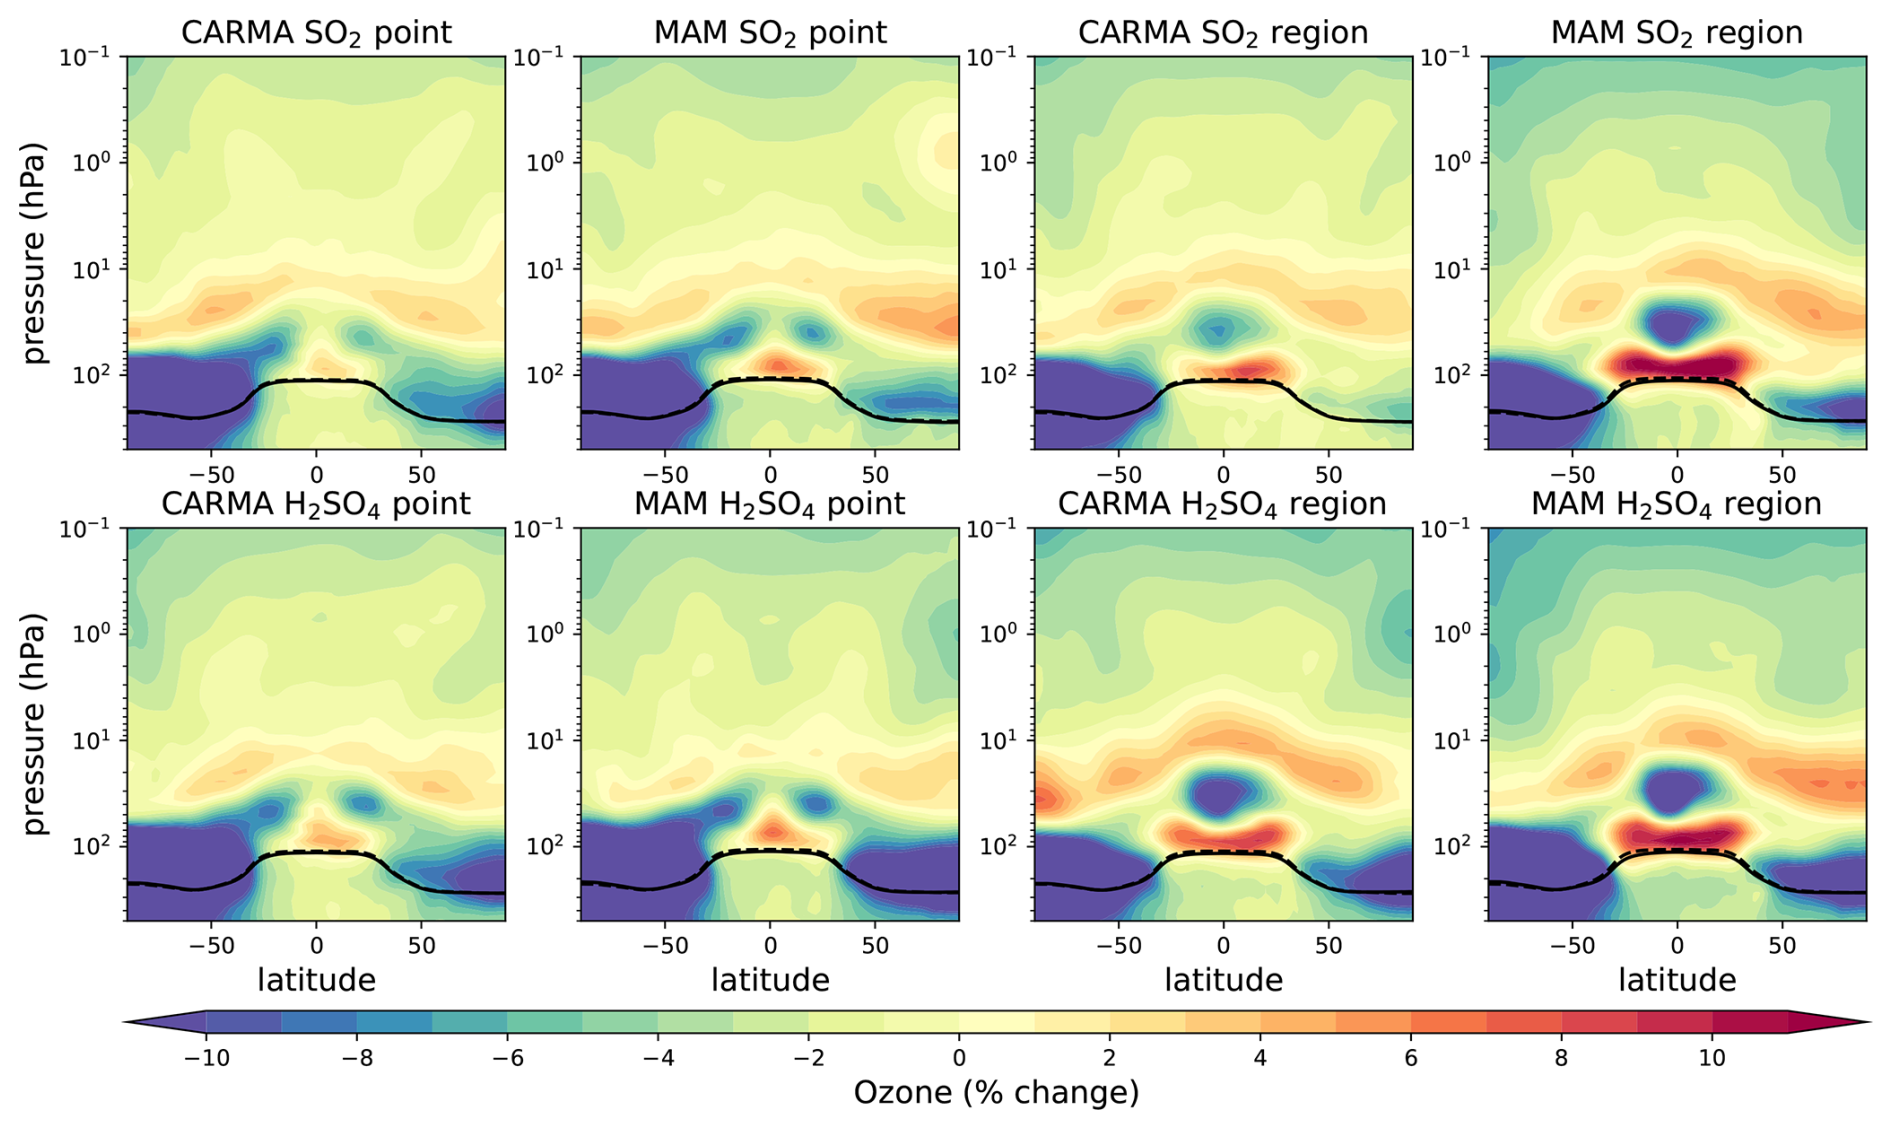
Figure A6Zonal mean ozone mixing ratio relative differences for different 5 Tg S injection experiments minus the control in percent. The tropopause of the control experiment and the injection experiments are illustrated as black solid and dashed lines, respectively.
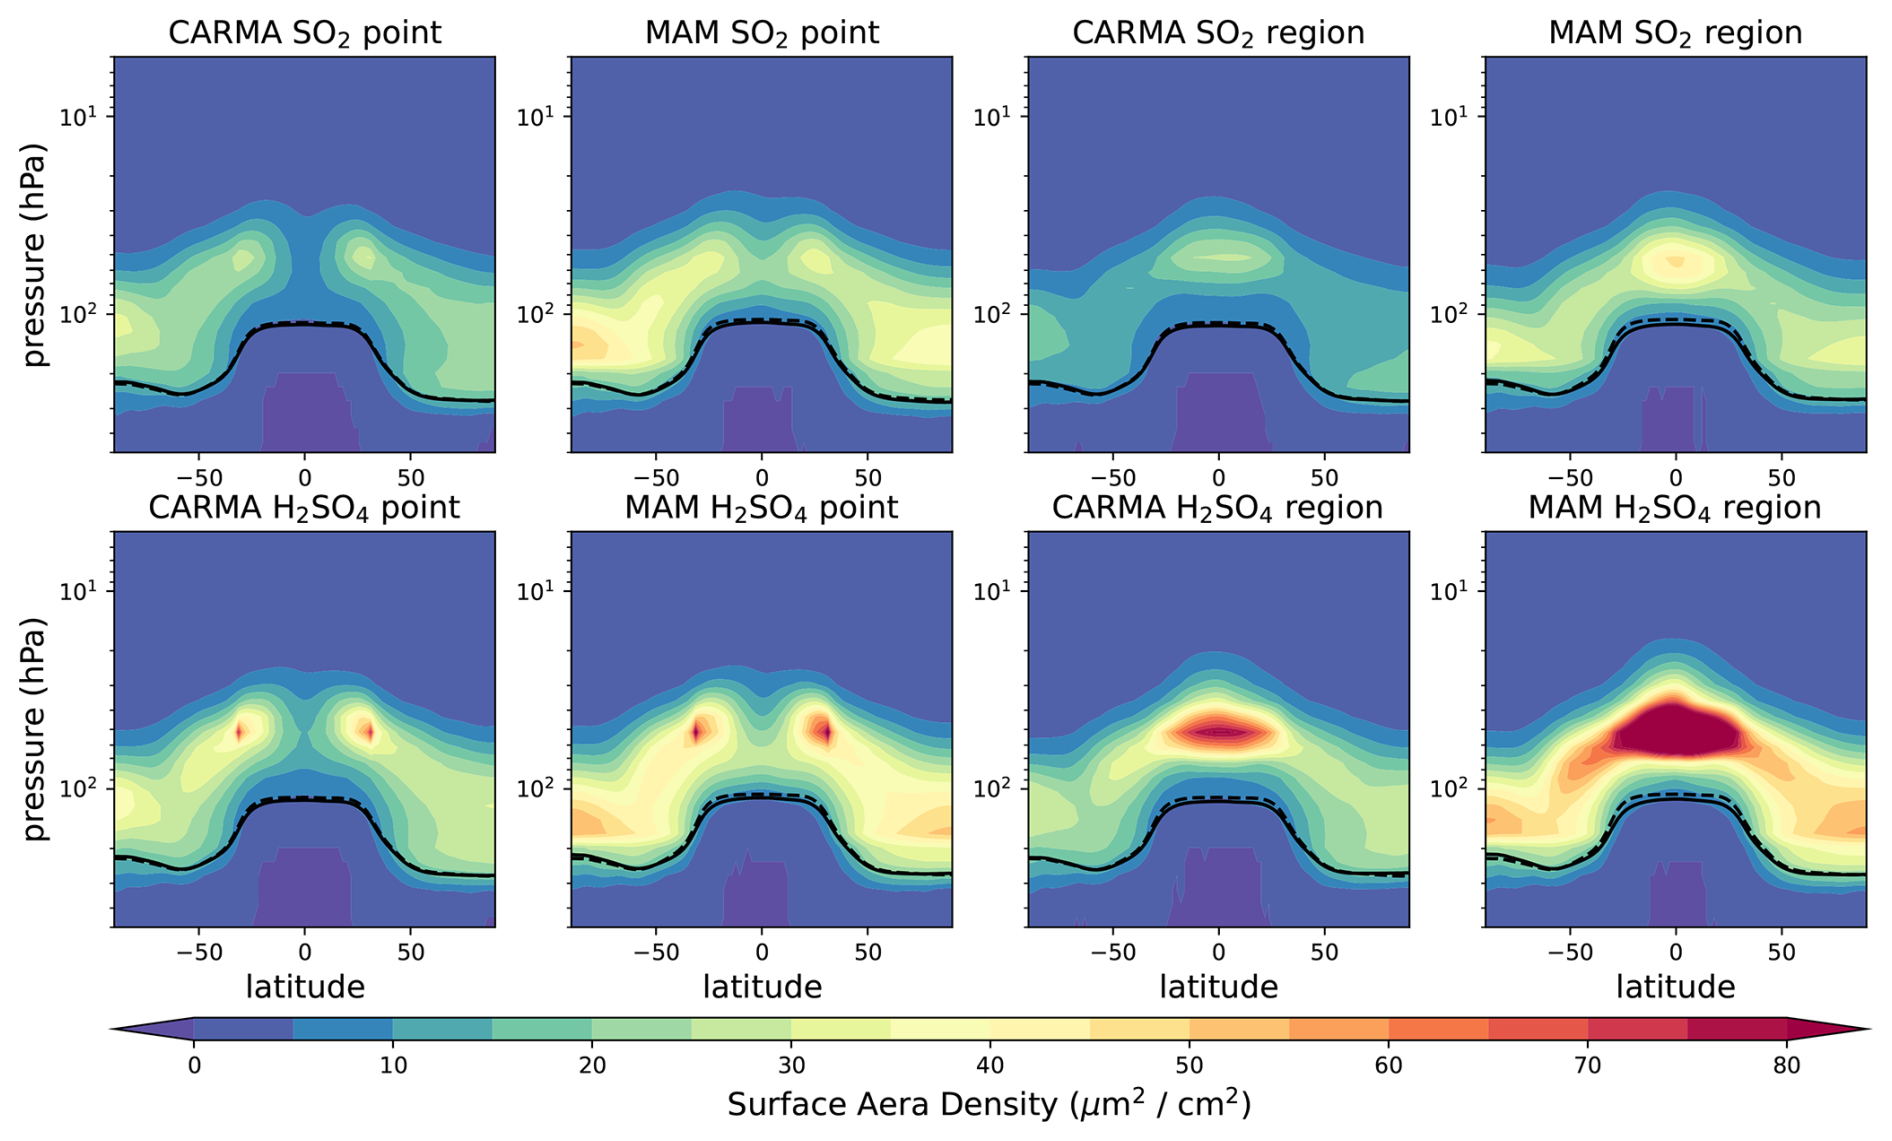
Figure A7Zonal mean surface area density differences for different 5 Tg S injection experiments minus the control in µm2 cm−2. The tropopause of the control experiment and the injection experiments are illustrated as black solid and dashed lines, respectively.
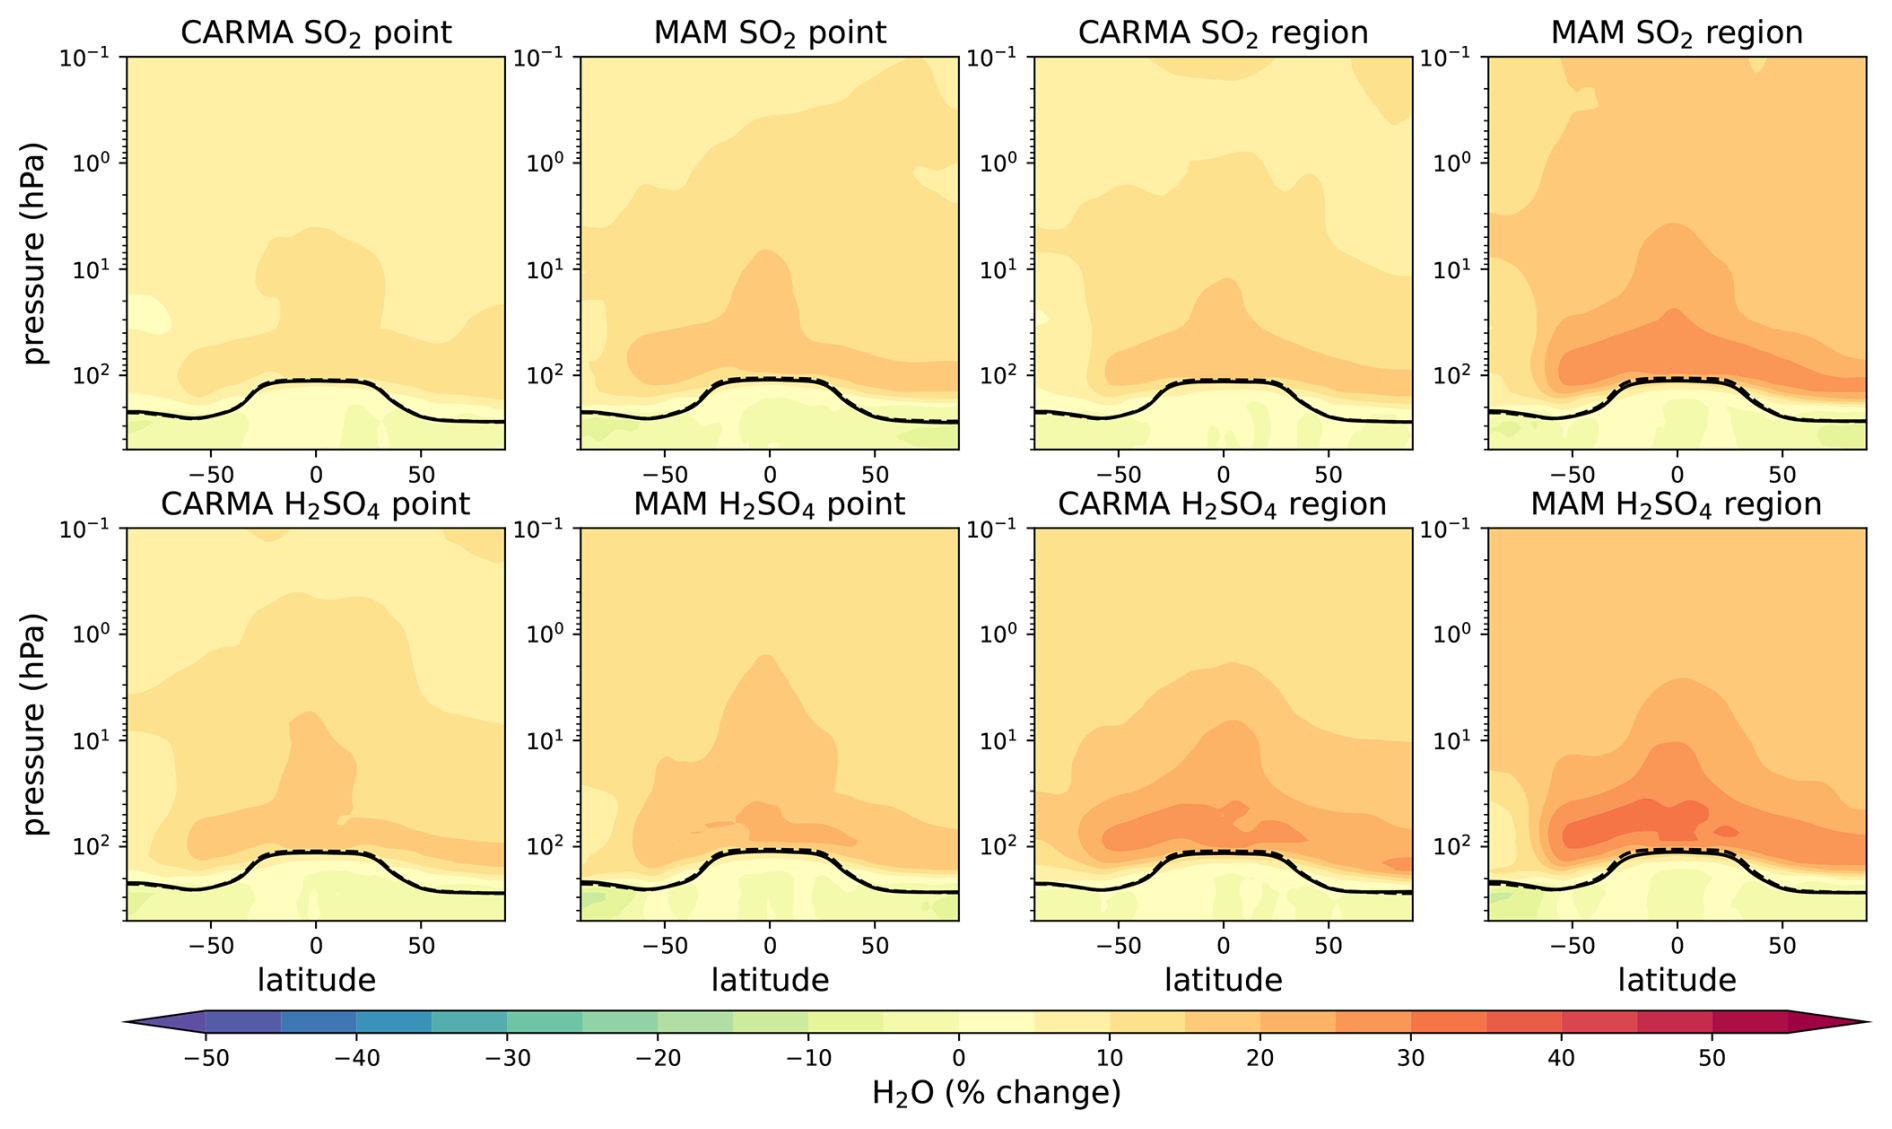
Figure A8Zonal mean water vapor mixing ratio relative differences for different 5 Tg S injection experiments minus the control. The tropopause of the control experiment and the injection experiments are illustrated as black solid and dashed lines, respectively.
The code of the model used in this work is available through Zendo (https://doi.org/10.5281/zenodo.16948605, Vitt and the CESM CARMA Development Team, 2025), and GitHub (git clone -b carma-trop-strat16, http://github.com/fvitt/CAM.git, last access: 25 August 2025).
ST outlined and wrote the manuscript. ST and DV performed model simulations. ST and IQ analyzed the results. YZ, CB, and PY contributed to the model development, and all authors participated in the discussion of results and reviewed the manuscript text.
At least one of the (co-)authors is a member of the editorial board of Atmospheric Chemistry and Physics. The peer-review process was guided by an independent editor, and the authors also have no other competing interests to declare.
Publisher's note: Copernicus Publications remains neutral with regard to jurisdictional claims made in the text, published maps, institutional affiliations, or any other geographical representation in this paper. The authors bear the ultimate responsibility for providing appropriate place names. Views expressed in the text are those of the authors and do not necessarily reflect the views of the publisher.
We acknowledge Mike J. Mills and Margot Clyne for helpful comments and discussions. The CESM project is supported primarily by the National Science Foundation. This material is based upon work supported by the National Center for Atmospheric Research, which is a major facility sponsored by the NSF under Cooperative Agreement No. 1852977. Computing and data storage resources, including the Cheyenne supercomputer (https://doi.org/10.5065/D6RX99HX; CISL, 2021), were provided by the Computational and Information Systems Laboratory (CISL) at NCAR. Simone Tilmes acknowledges support from the NOAA Climate Program Office Earth's Radiation Budget Awards Number 03-01-07-001 and NA22OAR4310477. Ilaria Quaglia acknowledges support from the US Simons Foundation (grant ref. MPS-SRM-00005203). Yunqian Zhu acknowledges the support by the National Oceanic and Atmospheric Administration (grant nos. 03- 01-07-001, NA17OAR4320101, and NA22OAR4320151).
This research has been supported by the National Science Foundation (grant no. 1852977), the Simons Foundation (grant no. MPS-SRM-00005203), and the National Oceanic and Atmospheric Administration (grant nos. 03-01-07-001, NA22OAR4310477, NA17OAR4320101, and NA22OAR4320151).
This paper was edited by Yuan Wang and reviewed by three anonymous referees.
Bednarz, E. M., Butler, A. H., Visioni, D., Zhang, Y., Kravitz, B., and MacMartin, D. G.: Injection strategy – a driver of atmospheric circulation and ozone response to stratospheric aerosol geoengineering, Atmos. Chem. Phys., 23, 13665–13684, https://doi.org/10.5194/acp-23-13665-2023, 2023. a
Benduhn, F., Schallock, J., and Lawrence, M. G.: Early growth dynamical implications for the steerability of stratospheric solar radiation management via sulfur aerosol particles, Geophys. Res. Lett., 43, 9956–9963, https://doi.org/10.1002/2016GL070701, 2016. a, b
Brodowsky, C. V., Sukhodolov, T., Chiodo, G., Aquila, V., Bekki, S., Dhomse, S. S., Höpfner, M., Laakso, A., Mann, G. W., Niemeier, U., Pitari, G., Quaglia, I., Rozanov, E., Schmidt, A., Sekiya, T., Tilmes, S., Timmreck, C., Vattioni, S., Visioni, D., Yu, P., Zhu, Y., and Peter, T.: Analysis of the global atmospheric background sulfur budget in a multi-model framework, Atmos. Chem. Phys., 24, 5513–5548, https://doi.org/10.5194/acp-24-5513-2024, 2024. a
Computational and Information Systems Laboratory (CISL): Cheyenne Supercomputer), National Center for Atmospheric Research (NCAR), https://doi.org/10.5065/D6RX99HX, 2021. a
Crutzen, P.: Albedo Enhancement by Stratospheric Sulfur Injections: A Contribution to Resolve a Policy Dilemma?, Clim. Change, 77, 211–220, https://doi.org/10.1007/s10584-006-9101-y, 2006. a
Davis, N. A., Visioni, D., Garcia, R. R., Kinnison, D. E., Marsh, D. R., Mills, M. J., Richter, J. H., Tilmes, S., Bardeen, C., Gettelman, A., and Glanville, A. A.: Climate, variability, and climate sensitivity of “Middle Atmosphere” chemistry configurations of the Community Earth System Model Version 2, Whole Atmosphere Community Climate Model Version 6 (CESM2(WACCM6)), Authorea, https://doi.org/10.22541/essoar.167117634.40175082/v1, 2022. a
Haywood, J. and Tilmes, S.: Chapter 6, WMO: Scientific assessment of ozone depletion: Global Ozone Research and Monitoring Project – GAW Report no. 278, World Meteorological Organization, Geneva, Switzerland, ISBN 978-9914-733-97-6, 2022. a, b, c, d, e
Laakso, A., Niemeier, U., Visioni, D., Tilmes, S., and Kokkola, H.: Dependency of the impacts of geoengineering on the stratospheric sulfur injection strategy – Part 1: Intercomparison of modal and sectional aerosol modules, Atmos. Chem. Phys., 22, 93–118, https://doi.org/10.5194/acp-22-93-2022, 2022. a, b, c, d, e, f, g
Li, Q., Xu, J., Gusman, A. R., Liu, H., Yuan, W., Liu, W., Zhu, Y., and Liu, X.: Upper-atmosphere responses to the 2022 Hunga Tonga–Hunga Ha′apai volcanic eruption via acoustic gravity waves and air–sea interaction, Atmos. Chem. Phys., 24, 8343–8361, https://doi.org/10.5194/acp-24-8343-2024, 2024. a
Liu, X., Ma, P.-L., Wang, H., Tilmes, S., Singh, B., Easter, R. C., Ghan, S. J., and Rasch, P. J.: Description and evaluation of a new four-mode version of the Modal Aerosol Module (MAM4) within version 5.3 of the Community Atmosphere Model, Geosci. Model Dev., 9, 505–522, https://doi.org/10.5194/gmd-9-505-2016, 2016. a
Mills, M. J., Schmidt, A., Easter, R., Solomon, S., Kinnison, D. E., Ghan, S. J., Neely, R. R., Marsh, D. R., Conley, A., Bardeen, C. G., and Gettelman, A.: Global volcanic aerosol properties derived from emissions, 1990–2014, using CESM1(WACCM), J. Geophys. Res.-Atmos., 121, 2332–2348, https://doi.org/10.1002/2015JD024290, 2016. a
Mills, M. J., Richter, J. H., Tilmes, S., Kravitz, B., MacMartin, D. G., Glanville, A. A., Tribbia, J. J., Lamarque, J., Vitt, F., Schmidt, A., Gettelman, A., Hannay, C., Bacmeister, J. T., and Kinnison, D. E.: Radiative and Chemical Response to Interactive Stratospheric Sulfate Aerosols in Fully Coupled CESM1(WACCM), J. Geophys. Res.-Atmos., 122, 13061–13078, https://doi.org/10.1002/2017JD027006, 2017. a
Murphy, D. M., Froyd, K. D., Bourgeois, I., Brock, C. A., Kupc, A., Peischl, J., Schill, G. P., Thompson, C. R., Williamson, C. J., and Yu, P.: Radiative and chemical implications of the size and composition of aerosol particles in the existing or modified global stratosphere, Atmos. Chem. Phys., 21, 8915–8932, https://doi.org/10.5194/acp-21-8915-2021, 2021. a
Niemeier, U. and Schmidt, H.: Changing transport processes in the stratosphere by radiative heating of sulfate aerosols, Atmos. Chem. Phys., 17, 14871–14886, https://doi.org/10.5194/acp-17-14871-2017, 2017. a
O'Neill, B. C., Tebaldi, C., van Vuuren, D. P., Eyring, V., Friedlingstein, P., Hurtt, G., Knutti, R., Kriegler, E., Lamarque, J.-F., Lowe, J., Meehl, G. A., Moss, R., Riahi, K., and Sanderson, B. M.: The Scenario Model Intercomparison Project (ScenarioMIP) for CMIP6, Geosci. Model Dev., 9, 3461–3482, https://doi.org/10.5194/gmd-9-3461-2016, 2016. a
Pierce, J. R., Weisenstein, D. K., Heckendorn, P., Peter, T., and Keith, D. W.: Efficient formation of stratospheric aerosol for climate engineering by emission of condensible vapor from aircraft, Geophys. Res. Lett., 37, https://doi.org/10.1029/2010GL043975, 2010. a, b, c
Quaglia, I., Tilmes, S., and Visioni, D.: Comparison of sectional and modal schemes in CESM2(WACCM-MA), Global Modeling Dynamics, in preparation, 2025. a, b
Richter, J. H., Tilmes, S., Mills, M. J., Tribbia, J. J., Kravitz, B., MacMartin, D. G., Vitt, F., and Lamarque, J.: Stratospheric Dynamical Response and Ozone Feedbacks in the Presence of SO2 Injections, J. Geophys. Res.-Atmos., 122, 12557–12573, https://doi.org/10.1002/2017JD026912, 2017. a, b
Richter, J. H., Visioni, D., MacMartin, D. G., Bailey, D. A., Rosenbloom, N., Dobbins, B., Lee, W. R., Tye, M., and Lamarque, J.-F.: Assessing Responses and Impacts of Solar climate intervention on the Earth system with stratospheric aerosol injection (ARISE-SAI): protocol and initial results from the first simulations, Geosci. Model Dev., 15, 8221–8243, https://doi.org/10.5194/gmd-15-8221-2022, 2022. a
Smith, W.: The cost of stratospheric aerosol injection through 2100, Environ. Res. Lett., 15, 114004, https://doi.org/10.1088/1748-9326/aba7e7, 2020. a
Taylor, K. E., Williamson, D., and Zwiers, F.: The sea surface temperature and sea ice concentration boundary conditions for AMIP II simulations, PCMDI Report 60, Program for Climate Model Diagnosis and Intercomparison, Lawrence Livermore National Laboratory, https://cir.nii.ac.jp/crid/1370025429425950241 (last access: February 2026), 2000. a
Tilmes, S., Richter, J. H., Mills, M. J., Kravitz, B., MacMartin, D. G., Vitt, F., Tribbia, J. J., and Lamarque, J.: Sensitivity of Aerosol Distribution and Climate Response to Stratospheric SO2 Injection Locations, J. Geophys. Res.-Atmos., 122, https://doi.org/10.1002/2017JD026888, 2017. a
Tilmes, S., Richter, J. H., Kravitz, B., MacMartin, D. G., Mills, M. J., Simpson, I. R., Glanville, A. S., Fasullo, J. T., Phillips, A. S., Lamarque, J.-F., Tribbia, J., Edwards, J., Mickelson, S., and Ghosh, S.: CESM1(WACCM) Stratospheric Aerosol Geoengineering Large Ensemble Project, B. Am. Meteorol. Soc., 99, 2361–2371, https://doi.org/10.1175/BAMS-D-17-0267.1, 2018. a, b, c
Tilmes, S., MacMartin, D. G., Lenaerts, J. T. M., van Kampenhout, L., Muntjewerf, L., Xia, L., Harrison, C. S., Krumhardt, K. M., Mills, M. J., Kravitz, B., and Robock, A.: Reaching 1.5 and 2.0 °C global surface temperature targets using stratospheric aerosol geoengineering, Earth Syst. Dynam., 11, 579–601, https://doi.org/10.5194/esd-11-579-2020, 2020. a
Tilmes, S., Mills, M. J., Zhu, Y., Bardeen, C. G., Vitt, F., Yu, P., Fillmore, D., Liu, X., Toon, B., and Deshler, T.: Description and performance of a sectional aerosol microphysical model in the Community Earth System Model (CESM2), Geosci. Model Dev., 16, 6087–6125, https://doi.org/10.5194/gmd-16-6087-2023, 2023. a, b, c, d, e, f
Tilmes, S., Bednarz, E. M., Jörimann, A., Visioni, D., Kinnison, D. E., Chiodo, G., and Plummer, D.: Stratospheric Aerosol Intervention experiment for the Chemistry–Climate Model Initiative, Atmos. Chem. Phys., 25, 6001–6023, https://doi.org/10.5194/acp-25-6001-2025, 2025. a
Vitt, F. and the CESM CARMA Development Team: fvitt/CAM: CARMA sectional aerosol microphysical model in CESM2 – tag 16 (carma_trop_strat16), Zenodo [software], https://doi.org/10.5281/zenodo.16948605, 2025. a
Weisenstein, D. K., Visioni, D., Franke, H., Niemeier, U., Vattioni, S., Chiodo, G., Peter, T., and Keith, D. W.: An interactive stratospheric aerosol model intercomparison of solar geoengineering by stratospheric injection of SO2 or accumulation-mode sulfuric acid aerosols, Atmos. Chem. Phys., 22, 2955–2973, https://doi.org/10.5194/acp-22-2955-2022, 2022. a, b, c, d, e, f, g, h, i, j, k, l, m, n, o, p, q, r, s, t, u, v, w, x
Yu, P., Toon, O. B., Bardeen, C. G., Mills, M. J., Fan, T., English, J. M., and Neely, R. R.: Evaluations of tropospheric aerosol properties simulated by the community earth system model with a sectional aerosol microphysics scheme, J. Adv. Model. Earth Sy., 7, 865–914, 2015. a, b
- Abstract
- Introduction
- Model Setup and Experiments
- The effects on aerosol burden and efficacy
- Effects on Radiative Forcing
- Impacts on the lower tropical stratospheric temperature
- Impact on total column ozone
- Discussion and conclusions
- Appendix A
- Code availability
- Author contributions
- Competing interests
- Disclaimer
- Acknowledgements
- Financial support
- Review statement
- References