the Creative Commons Attribution 4.0 License.
the Creative Commons Attribution 4.0 License.
 | 18 Feb 2026
Heat and continental transport shape the variability of volatile organic compounds in the Eastern Mediterranean: insights from multi-year observations and regional modeling
Maximilien Desservettaz
Aliki Christodoulou
Theodoros Christoudias
Vijay Punjaji Kanawade
Chrysanthos Savvides
Mihalis Vrekoussis
Shahid Naqui
Tuija Jokinen
Joseph Byron
Jonathan Williams
Nikos Mihalopoulos
Eleni Liakakou
Jean Sciare
Efstratios Bourtsoukidis
Volatile organic compounds (VOCs) are key precursors of tropospheric ozone and secondary organic aerosol formation, yet multi-year observations in the Eastern Mediterranean and Middle East (EMME) remain limited. This study presents multi-year (April 2022–June 2024) high-resolution measurements of 76 VOCs using PTR-ToF-MS at a rural background site in Cyprus, combined with HYSPLIT air-mass analysis to examine the effects of regional transport on VOCs variability. Oxygenated VOCs (OVOCs) dominated the VOCs burden (∼ 79 %), followed by aliphatic hydrocarbons, aromatic hydrocarbons, and terpenes. Most VOCs exhibited clear diurnal patterns, observed highest during 08:00–14:00 UTC, varying by species, due to enhanced photochemical activity and temperature-driven emissions. Terpenes, particularly isoprene, increased exponentially with temperature upto 35–38 °C but decreased beyond this threshold, indicating heat-stress inhibition. Monoterpenes showed elevated levels both day and night, reflecting contributions from both biogenic and anthropogenic sources. OVOCs, including acetone, acetaldehyde, methanol, and acetic acid, showed sharp enhancement above 35 °C, consistent with intensified primary emissions and secondary formation under extreme heat. Aromatic hydrocarbons were mainly higher during winter, linked to combustion processes, but benzene levels were highest during summer particularly when temperature rose above 35 °C from evaporative and potential stress-related biogenic sources. HYSPLIT air-mass trajectory analysis revealed dominant contributions from Europe and Northwest Asia (∼ 68 %), transporting aged OVOCs, while Middle East winter inflows enhanced aromatic hydrocarbons. While WRF-Chem captured seasonal trends, most VOCs were underestimated, highlighting under-representation of emission sources and oxidation pathways in the model. Overall, the study emphasizes temperature and regional transport as key drivers of VOC variability in the Eastern Mediterranean.
- Article
(12611 KB) - Full-text XML
-
Supplement
(2361 KB) - BibTeX
- EndNote


Volatile Organic Compounds (VOCs) are a diverse group of carbon-based chemicals with high vapor pressures that play a central role in atmospheric chemistry (Atkinson, 2000; Kamal et al., 2016). Upon release into the atmosphere, VOCs participate in the photochemical reactions that contribute to the formation of tropospheric ozone (O3), aerosol precursors, and secondary organic aerosol (SOA), all of which have far-reaching implications for air quality, human health, and climate (Atkinson, 2000; Ehn et al., 2014; Koppmann, 2020; Mellouki et al., 2015; Pennington et al., 2021; Wang et al., 2024). In scientific literature, VOCs are often categorized either by their chemical composition or by their source (Debevec et al., 2017; Koppmann, 2020; Yuan et al., 2024). These compounds with lifetimes ranging from minutes to months originate from both anthropogenic sources such as fossil fuel combustion, solvent use, industrial processes, and biogenic sources such as vegetation, soils, and marine emissions, and also emissions from biomass burning and wildfires (Atkinson, 2000; Bourtsoukidis et al., 2018; Capes et al., 2009; Civan et al., 2015; Debevec et al., 2017; Desservettaz et al., 2023; Huang et al., 2020; Kaltsonoudis et al., 2016; Pinthong et al., 2022; Pugliese et al., 2023; Koppmann, 2007; Sindelarova et al., 2014; Wang et al., 2022a; Yuan et al., 2024).
Terpenes (isoprene, monoterpenes, and sesquiterpenes) are primarily emitted (90 %–95 %) by vegetation through enzyme-driven processes influenced by environmental drivers (Bourtsoukidis et al., 2024, 2025; Brito et al., 2018; Ciccioli et al., 2023; Sindelarova et al., 2014; Wang et al., 2024), but some studies (Bryant et al., 2023; Panopoulou et al., 2020) shows that they also have smaller anthropogenic contributions. In the Mediterranean, pine and oak forests are major sources of terpenes (Mecca et al., 2024; Song et al., 2011). Others VOCs such as alkanes, alkenes, and aromatic hydrocarbons, whose major emission sources are anthropogenic arise primarily from fossil fuel combustion, industrial activities, solvent use, biomass burning (both through direct emissions and secondary production) and vehicular traffic, with elevated levels observed in urban areas and near industrial and shipping activities (Atkinson, 2000; Civan et al., 2015; Kajos et al., 2015; Kaltsonoudis et al., 2016; Perrone et al., 2014; Sicre et al., 1987). Oxygenated VOCs (OVOCs) including alcohols, aldehydes, ketones, and organic acids constitute a chemical class with both biogenic and anthropogenic origins, but they are also predominantly formed secondarily via the oxidation of primary VOCs by hydroxyl radicals (OH), O3, and nitrate radicals (NO3) (Huang et al., 2020; Mellouki et al., 2015; Wang et al., 2022c). These compounds are important intermediates in the photochemical formation of SOA and contribute to the oxidative capacity of the atmosphere over both local and regional scales (Huang et al., 2020; Liu et al., 2009; Mellouki et al., 2015; Wang et al., 2020, 2022c).
The eastern mediterranean and middle east (EMME) region is a climatically sensitive and chemically dynamic region (Lazoglou et al., 2024; Zittis et al., 2022) owing to high solar radiation, elevated temperatures, and complex meteorology. This region experiences mixed air masses from Western and Eastern Europe, the Middle East, and North Africa, bringing emissions from industrial, biogenic, marine, and biomass burning sources (Bourtsoukidis et al., 2018; Germain-Piaulenne et al., 2024; Lelieveld et al., 2002; Traub et al., 2003). This convergence, combined with the increasing frequency of heatwaves (Lazoglou et al., 2024), enhances VOCs emissions and hence, photochemical activity, raising concerns over regional ozone and SOA formation. Cyprus, located at the core of this region, offers a unique setting to investigate these interactions.
Multi-year measurements of VOCs in the EMME are scarce. At Finokalia, Greece, the studies of Liakakou et al. (2007, 2009) reported extended records of isoprene and C2–C8 hydrocarbons, while in Athens, the studies of Panopoulou et al. (2018, 2020) presented multi-year observations of isoprene, terpenes, and C2–C8 non-methane hydrocarbons (NMHCs). In contrast to these gas chromatography-based observations, proton-transfer-reaction time-of-flight mass spectrometry (PTR-ToF-MS) studies in the region have thus far been limited to short-term, campaign-based deployments (Derstroff et al., 2017; Kaltsonoudis et al., 2016; Salisbury et al., 2003). Overall, despite extensive research in diverse regions, the understanding of VOCs variability and drivers in the EMME region remains limited, particularly in terms of long-term and multi-year observations that can capture seasonal and climate change-driven dynamical responses to extreme heat.
Addressing this gap, the current study presents multi-year high-resolution VOCs measurements collected from 2022 to 2024 at a rural background site in Cyprus located in EMME region. Using PTR-ToF-MS, we quantified and classified 76 VOCs. To identify regional transport, we apply hybrid single-particle lagrangian integrated trajectory (HYSPLIT) airmass back-trajectory analysis and examine air mass origins across seven distinct geographical sectors. Furthermore, we evaluated selected VOCs simulated by the weather research forecast model coupled with chemistry (WRF-Chem) model which includes a high-resolution mapping of local emissions (Georgiou et al., 2022). This integrated approach enables us to (i) characterize diurnal and seasonal VOCs patterns, (ii) assess the influence of temperature on VOCs composition, (iii) understand key emission sources, (iv) evaluate the impact of long-range transport on VOCs variability, and (v) assess the model performance in the estimation of VOCs.
2.1 Study area and VOCs measurement timeline
Cyprus, the third-largest island in the Mediterranean is situated at the air pollution crossroads of Europe, Asia, and Africa, making it a receptor for long-range atmospheric transport from diverse source regions (Lelieveld et al., 2002). Air masses influencing the island originate from Western and Eastern Europe, Turkey, North Africa, Southwest and Northwest Asia, the Middle East, and the surrounding Mediterranean Sea (Fig. 1a). This convergence of continental and marine influences makes Cyprus an ideal location for investigating the chemical complexity of both long-range transported and local air pollutants (Meusel et al., 2016; Derstroff et al., 2017; Debevec et al., 2017; Vrekoussis et al., 2022).
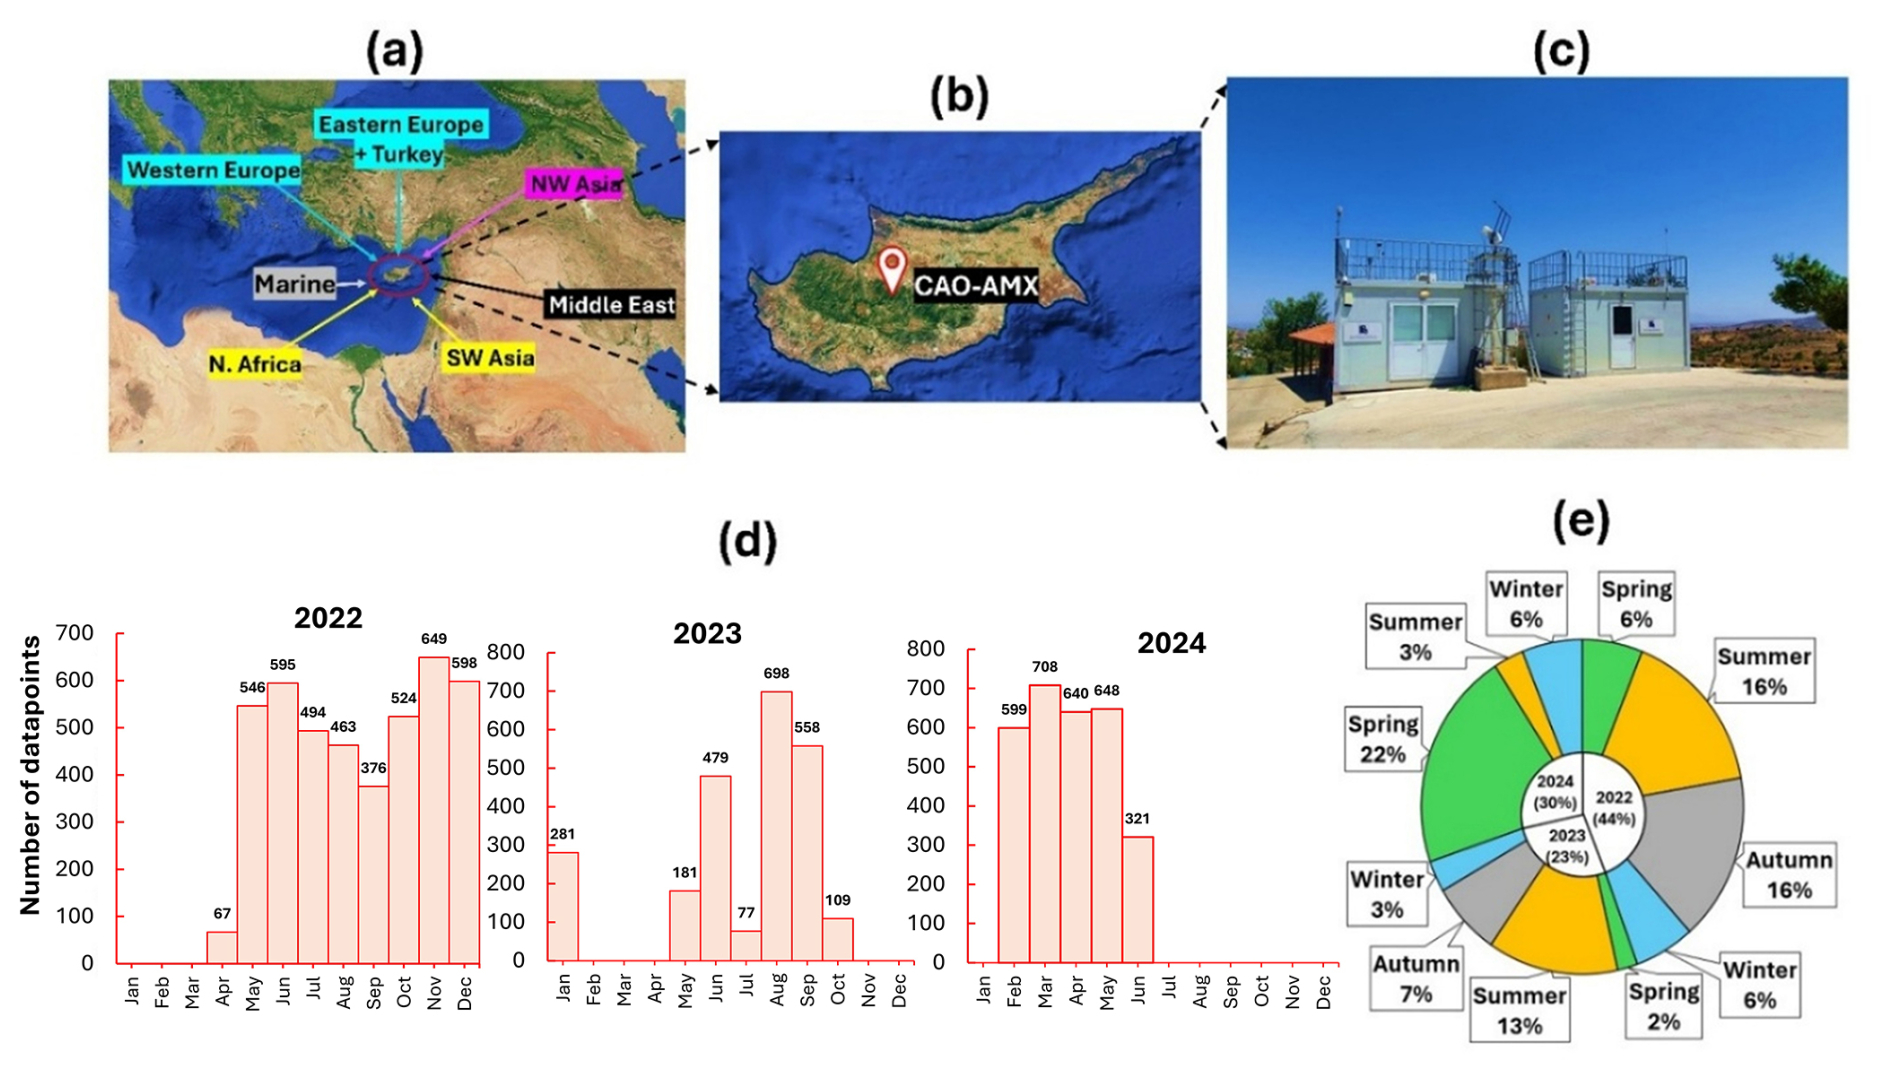
Figure 1Geographic context, air mass origins, and VOC measurement coverage at the CAO-AMX site (2022–2024). (a) Major regional air mass source areas influencing Cyprus; (b) location of the CAO-AMX in the Troodos Mountains; (c) the CAO-AMX monitoring station, a designated regional background site; (d) monthly distribution of number of datapoints for VOC measurements from April 2022 to June 2024; (e) summary of data coverage by season and year, showing overall representativeness of the dataset for multi-seasonal and multi-year analysis.
The present study was conducted at the Cyprus Atmospheric Observatory-Agia Marina Xyliatou (CAO-AMX, 35.0387° N, 33.0579° E), located at 532 m above mean sea level at the foothills of the Troodos Mountains (Fig. 1b–c). Established in 1997 and upgraded in 2015 to a “supersite”, CAO-AMX provides high-quality, long-term measurements of aerosols and their properties, greenhouse gases, meteorological parameters, and trace gases. It is designed and operated as a rural background site (CAO-AMX, https://cao.cyi.ac.cy/, last access: 4 July 2025) primarily by the climate and atmosphere research center (CARE-C) of the Cyprus institute (CyI), in collaboration with national authorities such as the department of labour inspection (DLI) of the ministry of labour and social insurance, while it is part of major international atmospheric monitoring networks, including ACTRIS (https://www.actris.eu/, last access: 8 July 2025); EMEP (https://www.emep.int/, last access: 8 July 2025); and AERONET (https://aeronet.gsfc.nasa.gov/, last access: 8 July 2025) (Sciare, 2016). The station is situated near the small villages of Agia Marina (∼ 630 inhabitants) and Xyliatos (∼ 150 inhabitants), surrounded by oak-pine forests and Maquis shrubland, with agricultural fields ∼ 4 km to the north (Baalbaki et al., 2021). The nearest urban area lies > 5 km away, ensuring minimal influence from local pollution sources aside from limited vehicle traffic. Its rural setting, surrounded by forested and low-population areas and situated far from major urban sources (Nicosia about 35 km to the northeast and Larnaca about 50 km to the southeast) ensures that measurements are minimally influenced by major nearby local anthropogenic emissions. This allows the observation of representative background concentrations and the signatures of regional and long-range transported pollutants.
VOCs observations were conducted at the CAO-AMX site from 27 April 2022 to 15 June 2024, with occasional interruptions caused by other field campaigns or instrument downtime. Meteorological data were recorded at a temporal resolution of 5 min from a dedicated station located in the village of Xyliatos, approximately 2.85 km from the primary observational site at the CAO-AMX. DLI managed the installation and operation of a relatively dense monitoring network at this station. As shown in Fig. 1d, monthly data coverage varied but provided efficient coverage across all seasons. Figure 1e summarizes the seasonal and annual distribution of data points: summer (32 %) was the most represented season, followed by spring (30 %) and autumn (23 %), while winter accounted for 15 % of the data. In terms of annual contribution, 2022 comprised 44 % of the total dataset, 2023 contributed 25 %, and 2024 contributed 31 %.
2.2 VOCs measurements
Online measurements of VOCs were performed using a high-resolution PTR-ToF-MS (Model: 4000; Ionicon Analytik GmbH, Innsbruck, Austria) following the methodology as described by Desservettaz et al. (2023). PTR-Tof-MS is a high-sensitivity, real-time technique that measures VOCs by transferring a proton from H3O+ ions to VOC molecules. It provides rapid, accurate, and high-resolution detection of a wide range of atmospheric VOCs without sample preparation.
Briefly about the methodology for VOCs measurement, the drift tube of the PTR-ToF-MS was operated under controlled conditions with an electric field to number density ratio () of 128 Townsend (Td), a pressure of 2.2 mbar, an applied voltage of 630 V, and a temperature of 85 °C. Ambient air was sampled at a flow rate of 210 mL min−1 through a 2.0 m long, in. PEEK (polyether ether ketone) heated inlet line, equipped with a 0.45 µm PTFE particulate filter (PALL, USA). The inlet drew air from a common glass manifold shared with other atmospheric measurement instruments. The use of chemically inert materials such as PTFE and PEEK minimized potential compound losses within the sampling line.
The instrument was automatically switched to measure VOC-free air for 20 min after every 23 h, followed by 40 min of calibration using a certified gas standard (Apel-Riemer Environmental, USA) containing major VOCs diluted to ∼ 20 ppbv; this 23 h cycle caused the non-measurement period to shift by approximately 1 h each day, ensuring that no specific time of day was systematically underrepresented and that diurnal patterns were not biased. VOCs not included in the gas standard were calibrated using established relative response factors determined from prior laboratory experiments and, where possible, verified with secondary standards. Mass spectra were acquired at 1 min time resolution and averaged to 1 h intervals for the analysis in this study. The instrument sensitivity was interpolated between calibrations and adjusted for humidity dependence based on water cluster ion ratios. Calibrated sensitivities showed modest temporal variability (∼ 10 %–23 %) for most compounds. Post-acquisition analysis was carried out using the Ionicon data analyzer (IDA), with mass axis calibration based on H3O+ and internal reference peaks (e.g., C6H5I+). The software retrieved exact masses and chemical formulas for ∼ 1200 peaks, of which 400–500 were assigned tentative structures using the GLOVOCS database, which is a master compound assignment guide that can be referred to as PTR-MS practitioners (Yáñez-Serrano et al., 2021). A set of 131 common species across analysis periods was further corrected using transmission curves derived from zero and calibration air sampling. Mixing ratios (ppbv) were calculated from ion counts, incorporating species-specific reaction rate constants (k-values) based on molecular dipole moments and polarizabilities (Desservettaz et al., 2023; Pagonis et al., 2019). The limit of detection (LOD) for each species was defined as three times the standard deviation observed during zero-air measurements and averaged over the entire campaign. VOC species with more than 30 % of their data below the LOD were excluded, resulting in a final dataset of 76 species, with sub-LOD concentrations appropriately flagged. Measurements impacted by filter changes, exhibiting short-term interference (notably acids and certain hydrocarbons), were filtered by removing a conservative 2 h window following each swap. Formaldehyde was not included in this study due to its inconsistent identification by the IDA software during part of the measurement period. Furthermore, quantification of formaldehyde via PTR-based techniques is known to be highly sensitive to humidity variations (Vlasenko et al., 2010), which complicates reliable detection. Accurate quantification would require water-dependent calibrations and a dedicated formaldehyde calibration standard, conditions that were not met during the measurement period.
2.3 Meteorological and air pollutant data
Meteorological and auxiliary air quality parameters were analyzed to provide contextual insight into atmospheric dynamics and pollutant characteristics. The meteorological station (mentioned in Sect. 2.1) continuously measured key meteorological parameters including ambient temperature (AT), relative humidity (RH), solar radiation (SR), wind speed (WS), and wind direction (WD). In addition, a range of trace gases and particulate pollutant levels were measured at a co-located air quality monitoring station (∼ 20 m from CAO-AMX, main VOCs measurement container), operating under the European monitoring and evaluation programme (EMEP) framework provides hourly-resolved concentrations of major atmospheric pollutants: ozone (O3), carbon monoxide (CO), nitrogen oxides (NO, NO2, and NOx), sulfur dioxide (SO2), and particulate matter with aerodynamic diameters less than 10 µm (PM10) and 2.5 µm (PM2.5). These measurements serve as critical auxiliary data for assessing the chemical background of the region, evaluating pollutant transport processes, and validating model simulations. Instrument specifications, calibration protocols, and operational details of the meteorological and air quality monitoring systems are extensively documented in previous studies (Kleanthous et al., 2014; Pikridas et al., 2018; Vrekoussis et al., 2022).
2.4 HYSPLIT backward trajectory
To assess the influence of long-range atmospheric transport on local air quality, 5 d back trajectories were computed using the HYSPLIT model (version 4.4; Draxler and Hess, 1997; Stein et al., 2015). These calculations were performed using the PC-based version of HYSPLIT provided by the national oceanic and atmospheric administration's (NOAA) air resources laboratory (ARL), incorporating meteorological data from the global data assimilation system (GDAS) with a spatial resolution of 1° × 1° and a temporal resolution of 1 h (Draxler and Hess, 1997). Trajectories were initialized every hour at an altitude of 500 m above ground level (a.g.l.), and each point along the trajectory was calculated at a one h time step. The airmass trajectory cluster analysis, following the methodology previously applied by Debevec et al. (2017) identified a total of seven air mass clusters: (C0) slow-moving or stagnant local air masses, (C1) North Africa, (C2) marine-influenced, (C3) Europe, (C4) Northwest Asia, (C5) West Turkey, and (C6) Middle east origins. For the cluster analysis, the altitude of the end point was set at 1000 m a.g.l. for each trajectory (Debevec et al., 2017).
2.5 WRF-Chem model configuration for VOC simulation in Cyprus
To assess VOCs variability and compare modeled and observed mixing ratios over Cyprus, we employed the WRF-Chem model as described and evaluated in Georgiou et al. (2022). The setup used three nested domains with horizontal resolutions of 50, 10, and 2 km, the later focusing on Cyprus, with meteorological inputs from the global forecast system (GFS) every 3 h. Key parameterizations included Yonsei University (YSU) planetary boundary layer (PBL) scheme for boundary layer, Noah land surface model (LSM) for land surface processes, the rapid radiative transfer model for global applications (RRTMG) for radiation, the regional atmospheric chemistry mechanism (RACM) for gas-phase chemistry and Modal Aerosol Dynamics for Europe (MADE) for inorganic aerosols and Volatility Basis Set (VBS) for organic aerosols as described in Georgiou et al. (2022). Photolysis was calculated using Fast-J. Anthropogenic emissions were sourced from emissions database for global atmospheric research-hemispheric transport of air pollution (EDGAR-HTAP; version 2) emission inventory, while BVOCs were simulated online using the Model of Emissions of Gases and Aerosols from Nature version (MEGAN) version 2.1 based on weather and land use data (Guenther et al., 2012).
For the innermost domain, a high-resolution emission inventory developed by Georgiou et al. (2020) is used. This emission inventory uses the total reported emissions of CO, NOx, non-methane VOCs (NMVOCs), SO2, and PM on a 1 km × 1 km resolution (Georgiou et al., 2020) which is upscaled to the resolution of the innermost domain of the simulations (2 km) using a nearest-neighbor grid-point attribution algorithm, while diurnal, weekly, and monthly emission cycles are applied to each species and the predominant emission activity per season according to the (Schaap et al., 2011). The high -resolution emission inventory was found to adequately simulate of the daily profiles of NOx and O3 at measurement sites over Cyprus, and compared to CAMS, the WRF-Chem model predicts more accurately NO2 mixing ratios with 7 % during winter and −44 % during summer normalized mean bias during winter/summer, compared to −81 % and −84 % biases for the CAMS ensemble using the CAMS inventory (Georgiou et al., 2022). In the outer model domain, the EDGAR emission inventory is used for anthropogenic emissions, and MEGAN for biogenic emissions. In comparison with other emission inventories for VOCs, EDGAR provides a larger estimate than the EMEP emission inventory. The CAMS-REG-AP inventory also gives a smaller estimate, in comparison to EMEP. Comparing the VOC by the EDGAR inventory to the EMEP inventory, the higher emission estimates are greatest over Belgium, Austria, Switzerland, Germany and Finland, with differences mainly encountered in the industrial combustion sector and fugitive emissions. Regarding the modelled O3 concentrations over Europe, all emission inventories were shown very similar patterns despite the noted differences in terms of emissions, particularly VOCs, indicating a low sensitivity to VOCs emissions (Thunis et al., 2021).
Major VOCs such as isoprene, monoterpenes, and aromatics were explicitly modeled. Outputs at hourly resolution were validated against PTR-ToF-MS measurements from CAO-AMX, enabling robust interpretation of VOC sources and atmospheric transport in the eastern mediterranean. The VOCs included in this study are based on the RACM (Stockwell et al., 1997) and encompass key anthropogenic and biogenic compounds relevant to regional air quality. These include isoprene (ISO), monoterpenes represented by α-pinene and related monocyclic terpenes with a single double bond (API), and d-limonene, along with other cyclic dienes (LIM). Aromatic compounds are grouped as toluene (TOL), which includes toluene and less reactive aromatics, and xylenes (XYL), representing xylenes and more reactive aromatic species. OVOCs are categorized as aldehydes (ALD), ketones (KET), and glyoxal (GLY).
3.1 Meteorological and atmospheric composition variability
Mean meteorological conditions included WS of 2.6 ± 1.4 m s−1, RH of 55 ± 20 %, AT of 17.7 ± 7.9 °C, and SR of 224.75 ± 305.85 W m−2 (Fig. 2a). Average AT (> 0 °C) and SR (> 800 W m−2) peaked during daytime in summer, while winter had the lowest daytime values (< 15 °C and < 400 W m−2) Fig. 2e–f). RH showed the opposite pattern during daytime (∼ 60 % in winter, < 40 % in summer) (Fig. 2g). Midday peaks in temperature and radiation were strongest in summer, with RH lowest in the afternoon (Fig. 2e–g). RH and SR were inversely correlated, consistent with previous studies (Emekwuru and Ejohwomu, 2023; Matthew, 2022). Daily average WS ranged from 1 to 4 m s−1, with slightly higher values observed in spring and summer, suggesting enhanced mixing during these periods (Fig. 2h). Diurnal patterns were also pronounced as WS showed afternoon maxima in all seasons, with enhanced values in spring and summer, likely driven by thermal convection and sea breeze circulation (Fig. 2h), promoting more effective dispersion of air pollutants (Deot et al., 2025; Pérez et al., 2020; Soukissian and Sotiriou, 2022).
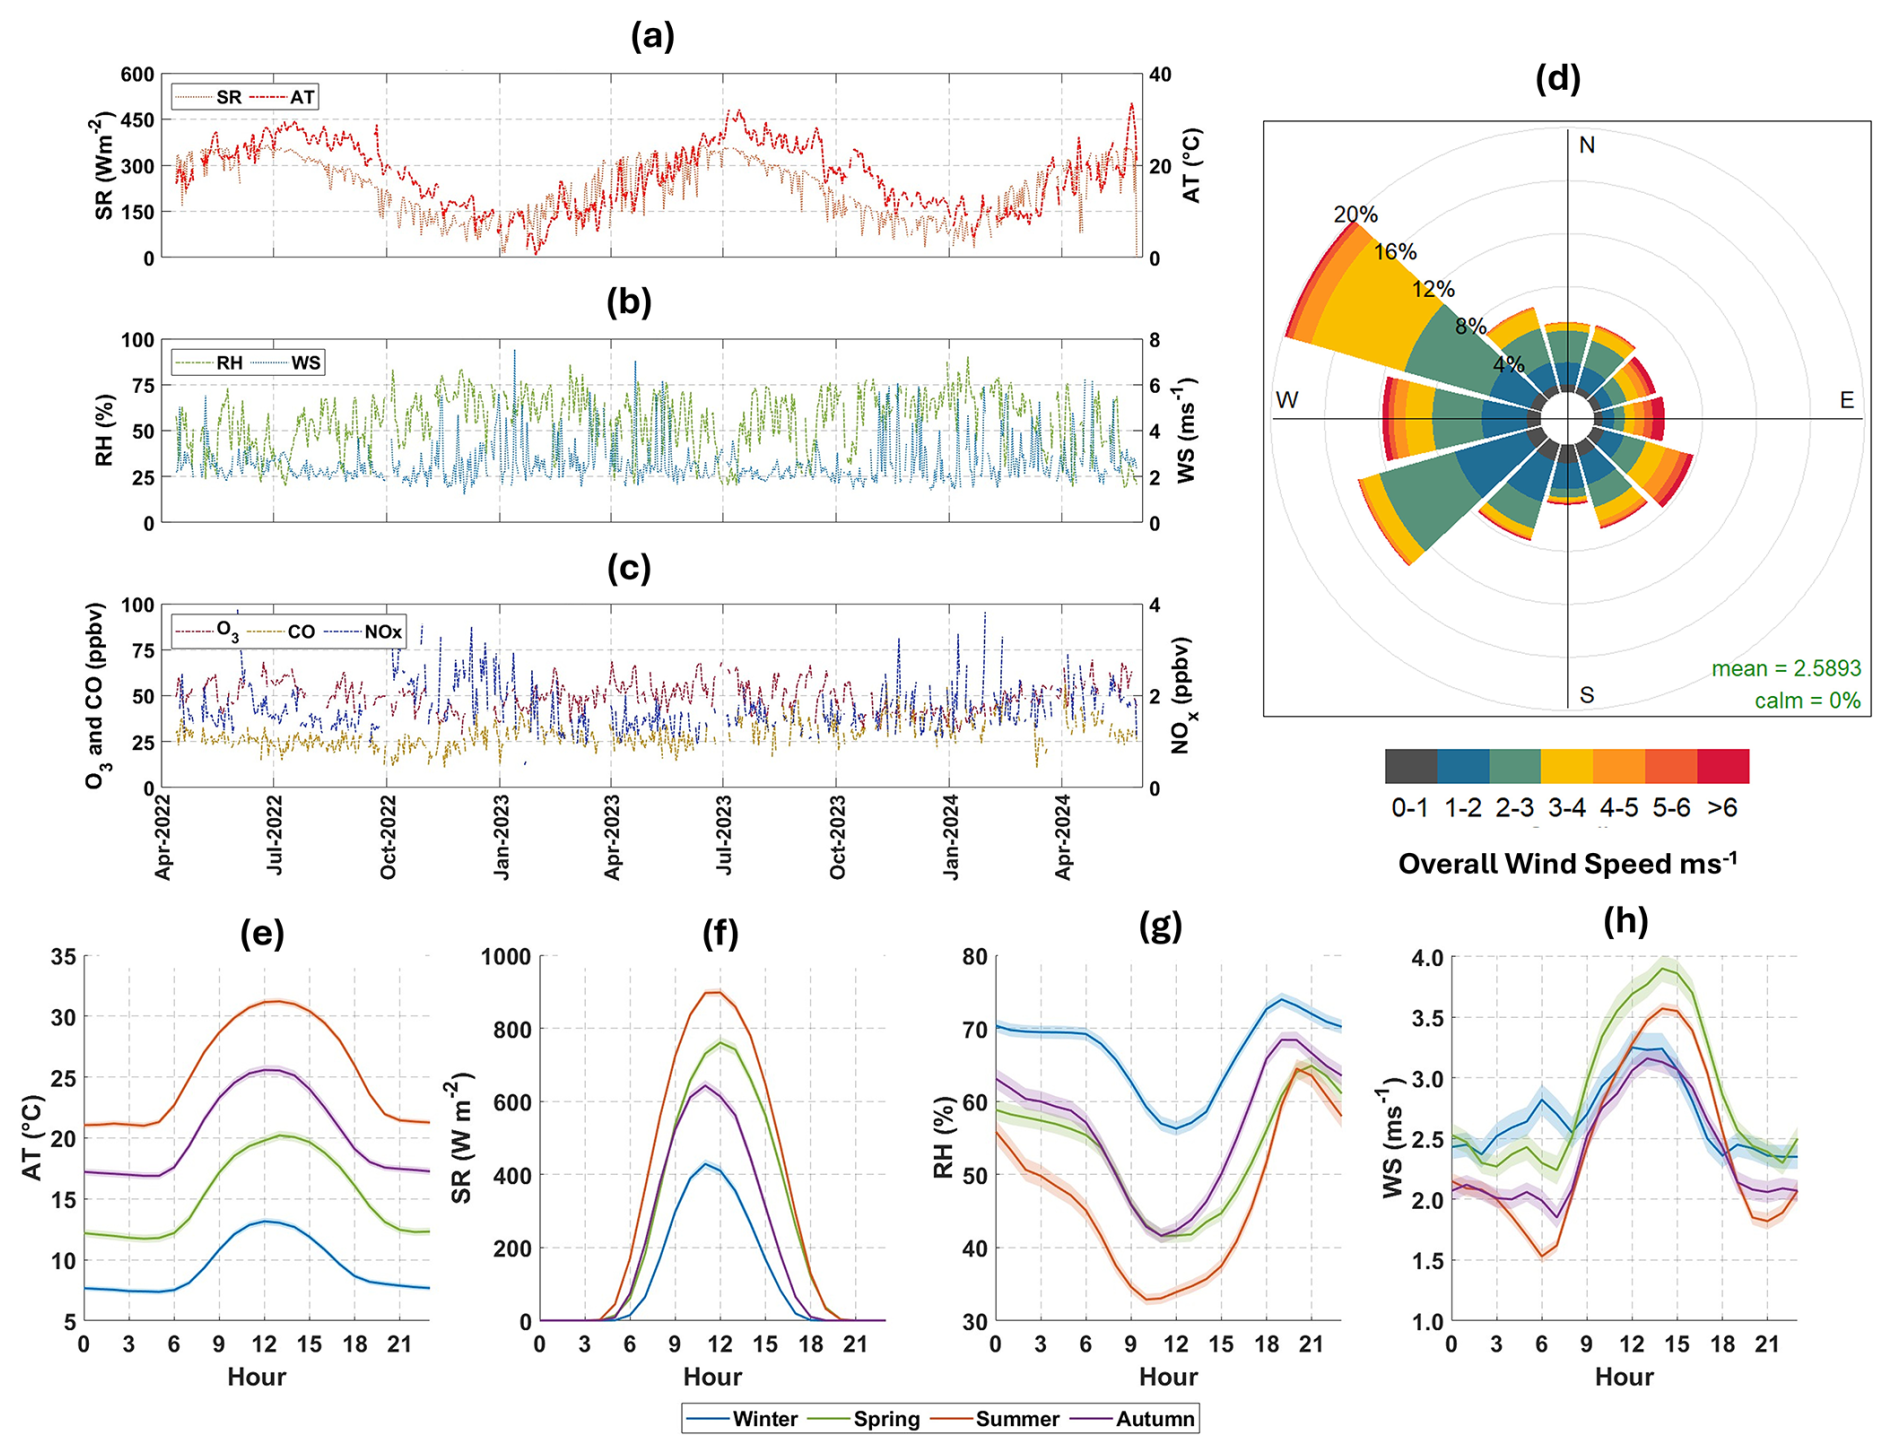
Figure 2Seasonal and diurnal variability of meteorological parameters and air pollutants in Cyprus. Panels (a)–(c) show time series (24 h rolling average) of (a) ambient temperature (AT) and solar radiation (SR), (b) relative humidity (RH) and wind speed (WS), and (c) gaseous pollutants, including ozone (O3), carbon monoxide (CO), and nitrogen dioxide (NO2) for study period. Panel (d) display wind rose diagrams indicating wind speed and direction for the entire study period. Panels (e)–(h) present the diurnal profiles of (e) ambient temperature (°C), (f) solar radiation (W m−2), (g) relative humidity (%), and (h) wind speed (m s−1) across the four seasons (spring, summer, autumn, winter). Shaded regions in panels (e)–(h) represent the standard error, capturing variability in diurnal cycles.
Wind analysis throughout the study period revealed predominantly moderate conditions, with over 70 % wind speeds falling below 3 m s−1, and 94 % below 5 m s−1. The wind rose diagrams (Fig. 2d) highlight the prevalence of moderate-speed winds and dominant directions ranging from northwesterly to west-southwesterly. Figure S1 in the Supplement shows seasonal and monthly variability in wind direction, and suggests that during the winter, the winds were mainly coming from the southeast, followed by the southwest, with most wind speeds exceeding 4 m s−1; whereas, for the other seasons, the winds originated predominantly from the northwest.
Atmospheric conditions were characterized by the following mean mixing ratios for gaseous pollutants such as NO at 0.3 ± 0.2 ppbv, NO2 at 1.4 ± 0.8 ppbv, NOx at 1.7 ± 0.9 ppbv, SO2 at 0.5 ± 0.4 ppbv, O3 at 49.2 ± 9.0 ppbv, and CO at 145.8 ± 49.5 ppbv. During daytime O3 remained consistently elevated throughout the year, with a significant increase of (8–20 ppbv) of its mixing ratio in summer, indicating a strong influence from regional transport and photochemical formation (Kleanthous et al., 2014; Lee et al., 2021; Pochanart et al., 2003). A notable increase in CO levels was observed between 2022 and 2024, particularly linked to increase in anthropogenic activities A modest rise in CO observed during winter is likely due to increased combustion emissions, lower sink due to low photochemistry, variable residence time of upto 90 d in winter and 30 d in summer, and weaker atmospheric dispersion (Koppmann et al., 2005; Pochanart et al., 2003). NOx showed a winter maximum, consistent with increased anthropogenic emissions and reduced photochemical degradation (Atkinson, 2000; Civan et al., 2015; Koppmann et al., 2005).
3.2 Overview of atmospheric VOCs observations
A total of 76 VOCs were quantified, and their descriptive statistics for key species (the most studied VOCs in EMME region and European studies) are summarized in Table 1, while the complete list is provided in Table S1 in the Supplement. These VOCs were grouped into five major chemical classes: (i) OVOCs (alcohols, aldehydes, ketones, acids, and other oxygenates); (ii) aliphatic hydrocarbons; (iii) aromatic hydrocarbons; (iv) terpenes; and (v) nitrogen- and sulfur-containing VOCs. An overview of the average mixing ratios is shown in Fig. 3, while Fig. S2 illustrates the time series of selected VOCs. The selected VOCs shown in Table 1 were most studied in the previous Mediterranean and European studies, whereas Fig. S3 shows the 20 most abundant VOCs observed in this study.
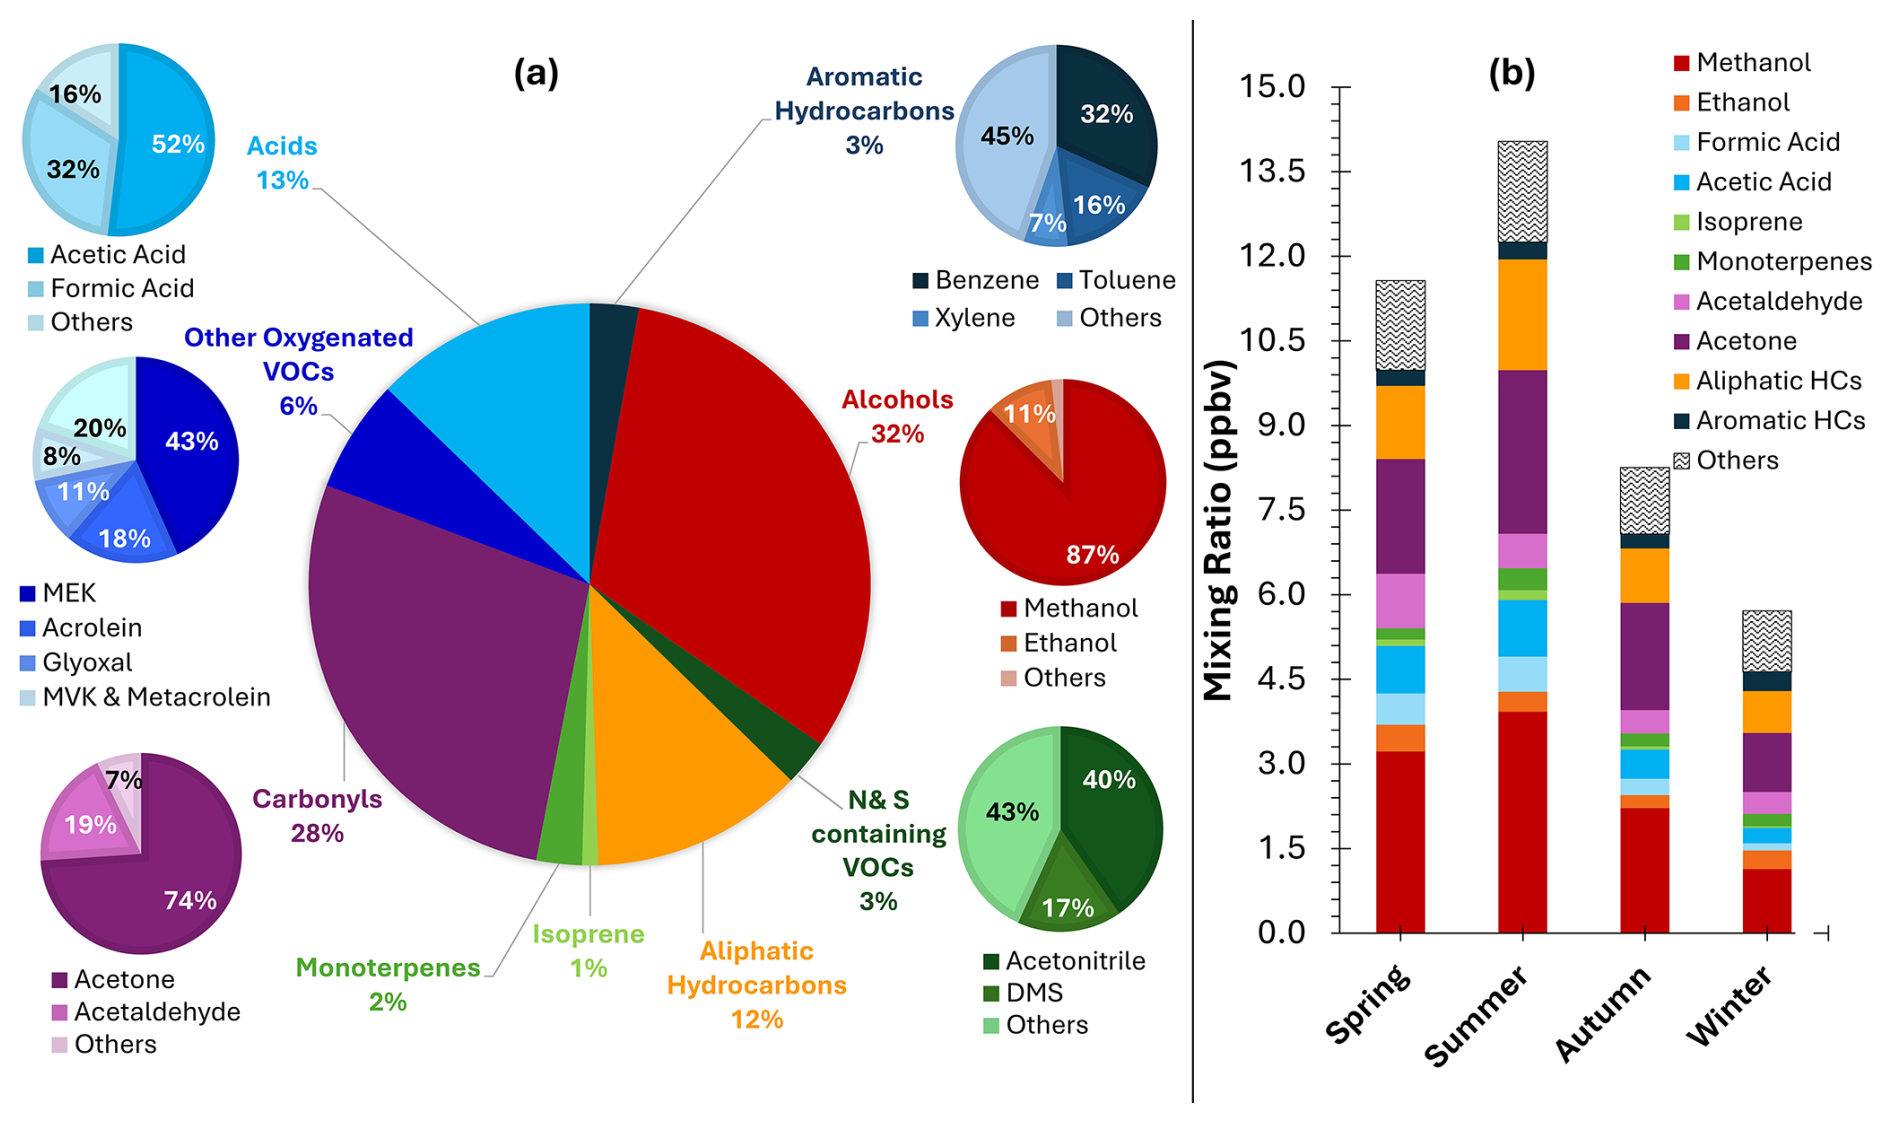
Figure 3Overview of VOCs in Cyprus: Composition and seasonal variability in its composition. (a) % contribution of different VOC groups in Cyprus, highlighting the dominance of alcohols (32 %), carbonyls (28 %), and acids (13 %). Subcategories within each VOC group are detailed in smaller pie charts. (b) Seasonal variability of the VOCs mixing ratio. Here carbonyls include aldehydes, and ketones. Overall OVOCs include alcohol, carbonyls, acids, and other oxygenated VOCs. Isoprene and Monoterpenes combine together to form terpenes class.
Table 1Descriptive statistics of selected VOCs (in ppbv) measured in Cyprus (April 2022–June 2024).
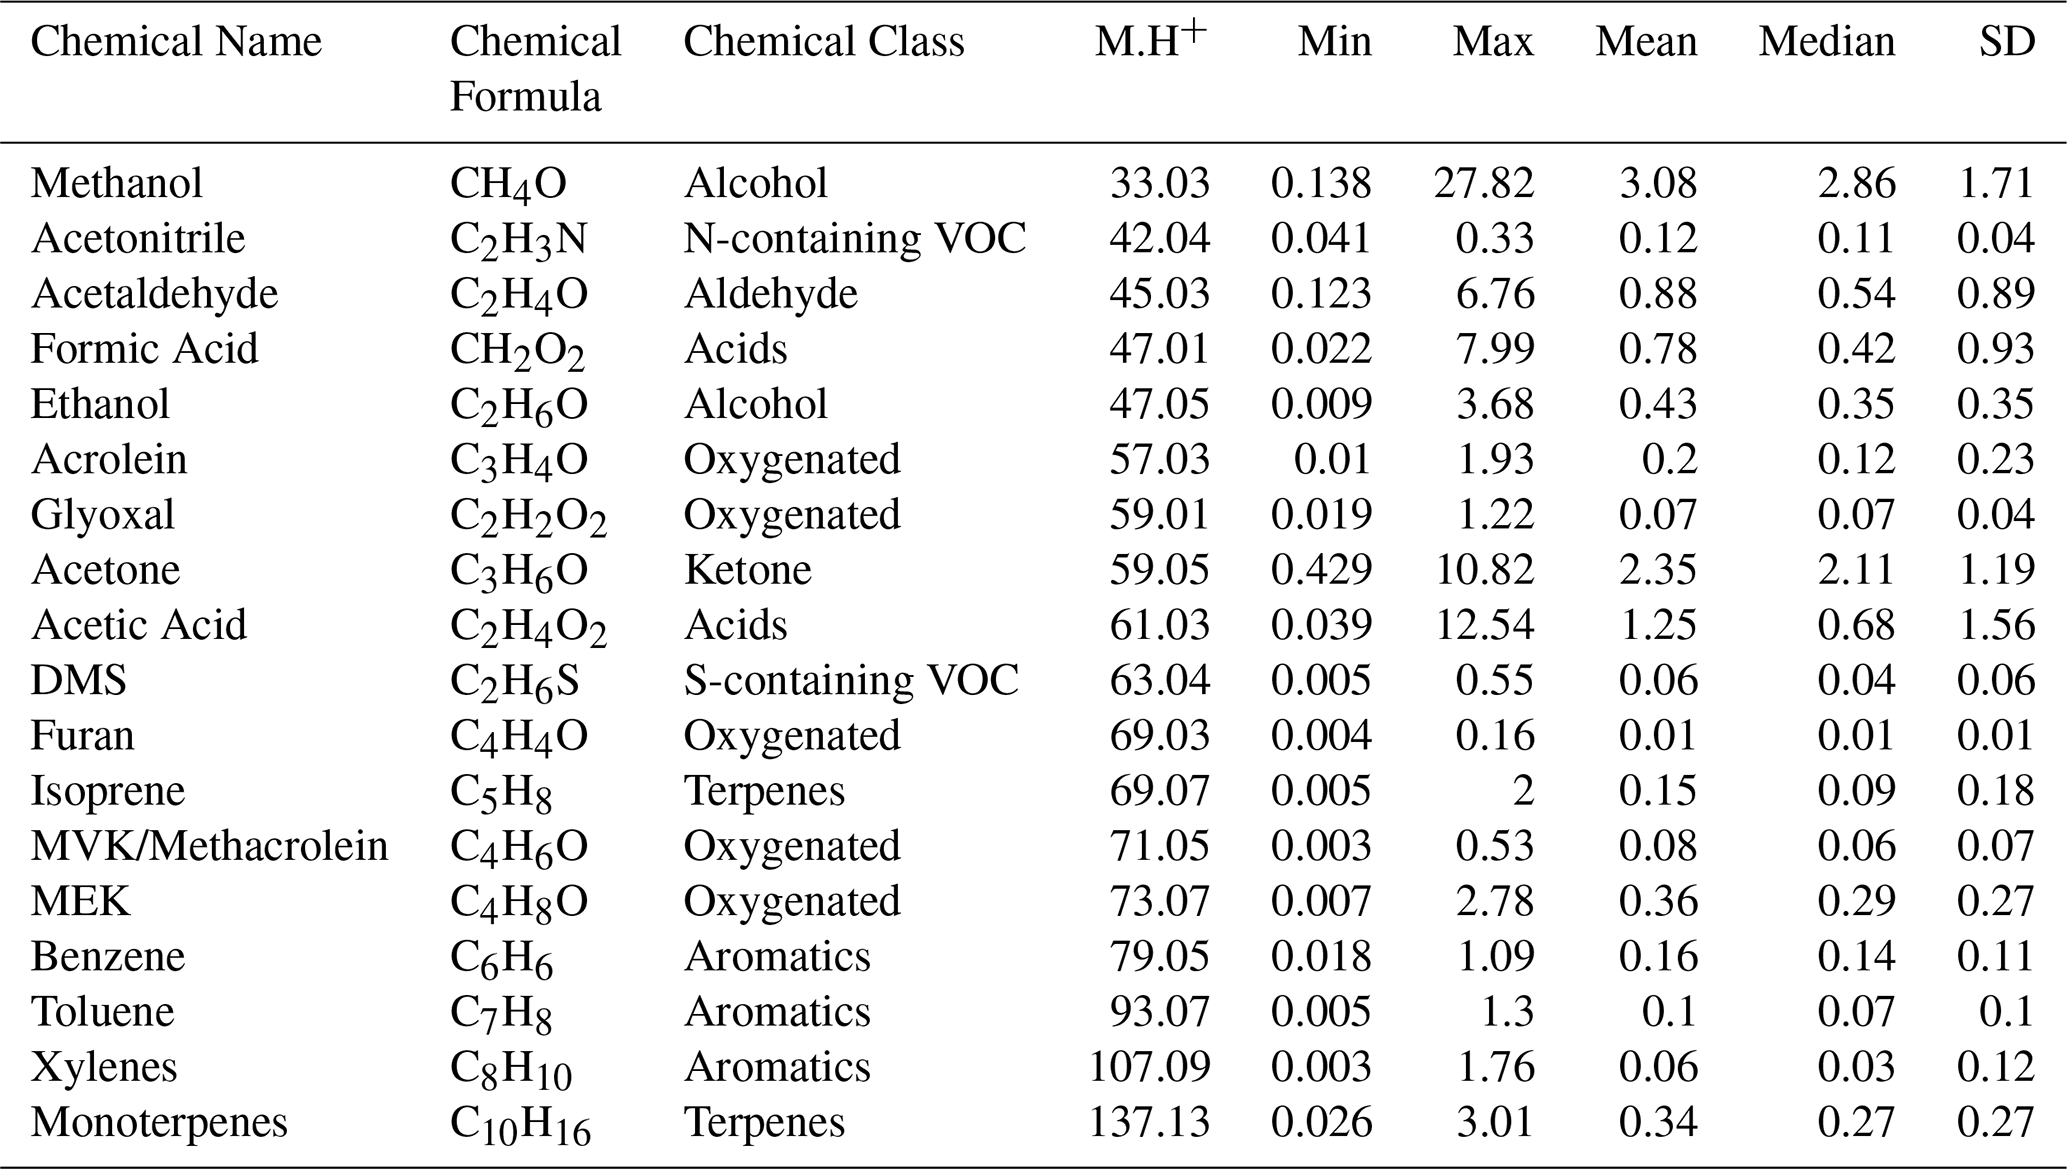
Compounds are grouped by chemical class, with molecular hydronated ion mass (M.H+) shown for each. These data provide insight into the variability and typical concentrations of VOCs in the region, relevant to air quality and atmospheric chemistry assessments. These are the most studied VOCs in EMME region and European studies. For clarity, nitrogen and sulfur containing VOCs class has been separated into distinct classes, N-containing VOC and S-containing VOC in this table to explicitly highlight the nitrogen contribution in acetonitrile and the sulfur contribution in DMS.
OVOCs were the dominant chemical class as also observed by Debevec et al. (2017). In our study OVOCs contributed approximately 79 % to the total measured VOC burden. Among these, alcohol was the most abundant subgroup, comprising 32 % of total VOCs. Methanol was found as the single most dominant species, with a median mixing ratio of 2.86 ppbv, accounting for 87 % of the total alcohol fraction. Its high dominance reflects oxidation of biogenic and biomass burning emissions, consistent with previous findings (Debevec et al., 2017; Mukherjee et al., 2024; Yuan et al., 2024). Carbonyls (aldehydes, and ketones) represented the second largest OVOCs subgroup (28 % of total VOCs), with median levels dominated by acetone (2.11 ppbv, 74 % of the carbonyl group), followed by acetaldehyde (0.54 ppbv, 19 % of the carbonyl group). These compounds are known to originate from both primary sources and secondary oxidation of VOCs (Capes et al., 2009; Mellouki et al., 2015; Mukherjee et al., 2024; Pennington et al., 2021; Wang et al., 2024, 2022c). Organic acids, dominated by acetic acid (median: 0.68 ppbv) and formic acid (median: 0.42 ppbv), contributed 13 % of total VOCs. Their contributions likely arise from a combination of direct biogenic and anthropogenic emissions, as well as secondary formation, which could not be quantitatively distinguished (Derstroff et al., 2017; Huang et al., 2020; Kamal et al., 2016; Koppmann, 2020; Wang et al., 2024, 2022c). Other oxygenates, such as methyl ethyl ketone (MEK) and acrolein, also contributed to the OVOCs group and may originate from industrial sources and atmospheric oxidation (Schieweck et al., 2021; Torres-Vinces et al., 2020; Yáñez-Serrano et al., 2016).
Aliphatic hydrocarbons accounted for 12 % of total VOCs, with species such as propylene, propyne, 1,3-butadiene, and cyclohexadiene likely reflecting emissions from vehicular traffic, fossil fuel combustion and industrial activities (Perrone et al., 2014; Sicre et al., 1987). Aromatic hydrocarbons, though less abundant (3 %), were dominated by benzene (0.14 ppbv, 32 % of the aromatic fraction), followed by toluene and xylenes. These compounds are well-known tracers of urban and industrial emissions (Abbasi et al., 2020; Bourtsoukidis et al., 2019; Bourtsoukidis et al., 2020; Das et al., 2024), though their overall concentrations were low, consistent with the remote and background nature of the site.
Terpenes, such as monoterpenes (median = 0.27 ppbv) and isoprene (median = 0.09 ppbv), collectively contributing ∼ 3 % of the VOC budget. Their mixing ratio peaked in summer, aligning with increased biogenic emissions driven by higher temperatures and SR (Gu et al., 2021; Liakakou et al., 2007; Mukherjee et al., 2024; Sindelarova et al., 2014; Strada et al., 2023; Wang et al., 2024).
Nitrogen- and sulfur-containing VOCs also contributed approximately 3 %, with median acetonitrile (0.11 ppbv) and dimethyl sulfide (DMS, 0.04 ppbv) mixing ratios as the major constituents. Acetonitrile, a tracer for biomass burning, accounted for 40 % of this group, while DMS accounted for 17 % of this group reflects both marine and biological sources (Deschaseaux et al., 2022; Edtbauer et al., 2020; Huangfu et al., 2021; Robles, 2005).
The analysis of the 20 most abundant VOCs (Fig. S3) also reinforced the dominance of OVOCs, particularly methanol, acetone, and acetic acid, which together formed a substantial fraction of the observed VOC mass. The relatively low levels of aromatics and aliphatic further support the interpretation that this rural background site is primarily influenced by transported VOC precursors, secondary atmospheric processes and regional-scale transport, rather than direct anthropogenic emissions. A major reason for the low burden of aliphatic hydrocarbons in the PTR-ToF-MS measurements is their inherently low proton affinities, which result in weak ionization and significant fragmentation. Consequently, their signals are unreliable or very small, preventing a clear aliphatic hydrocarbon profile from being obtained in this study.
Table 2Seasonal mean mixing ratios (ppbv) of VOCs measured in our study compared with previous regional and European studies.
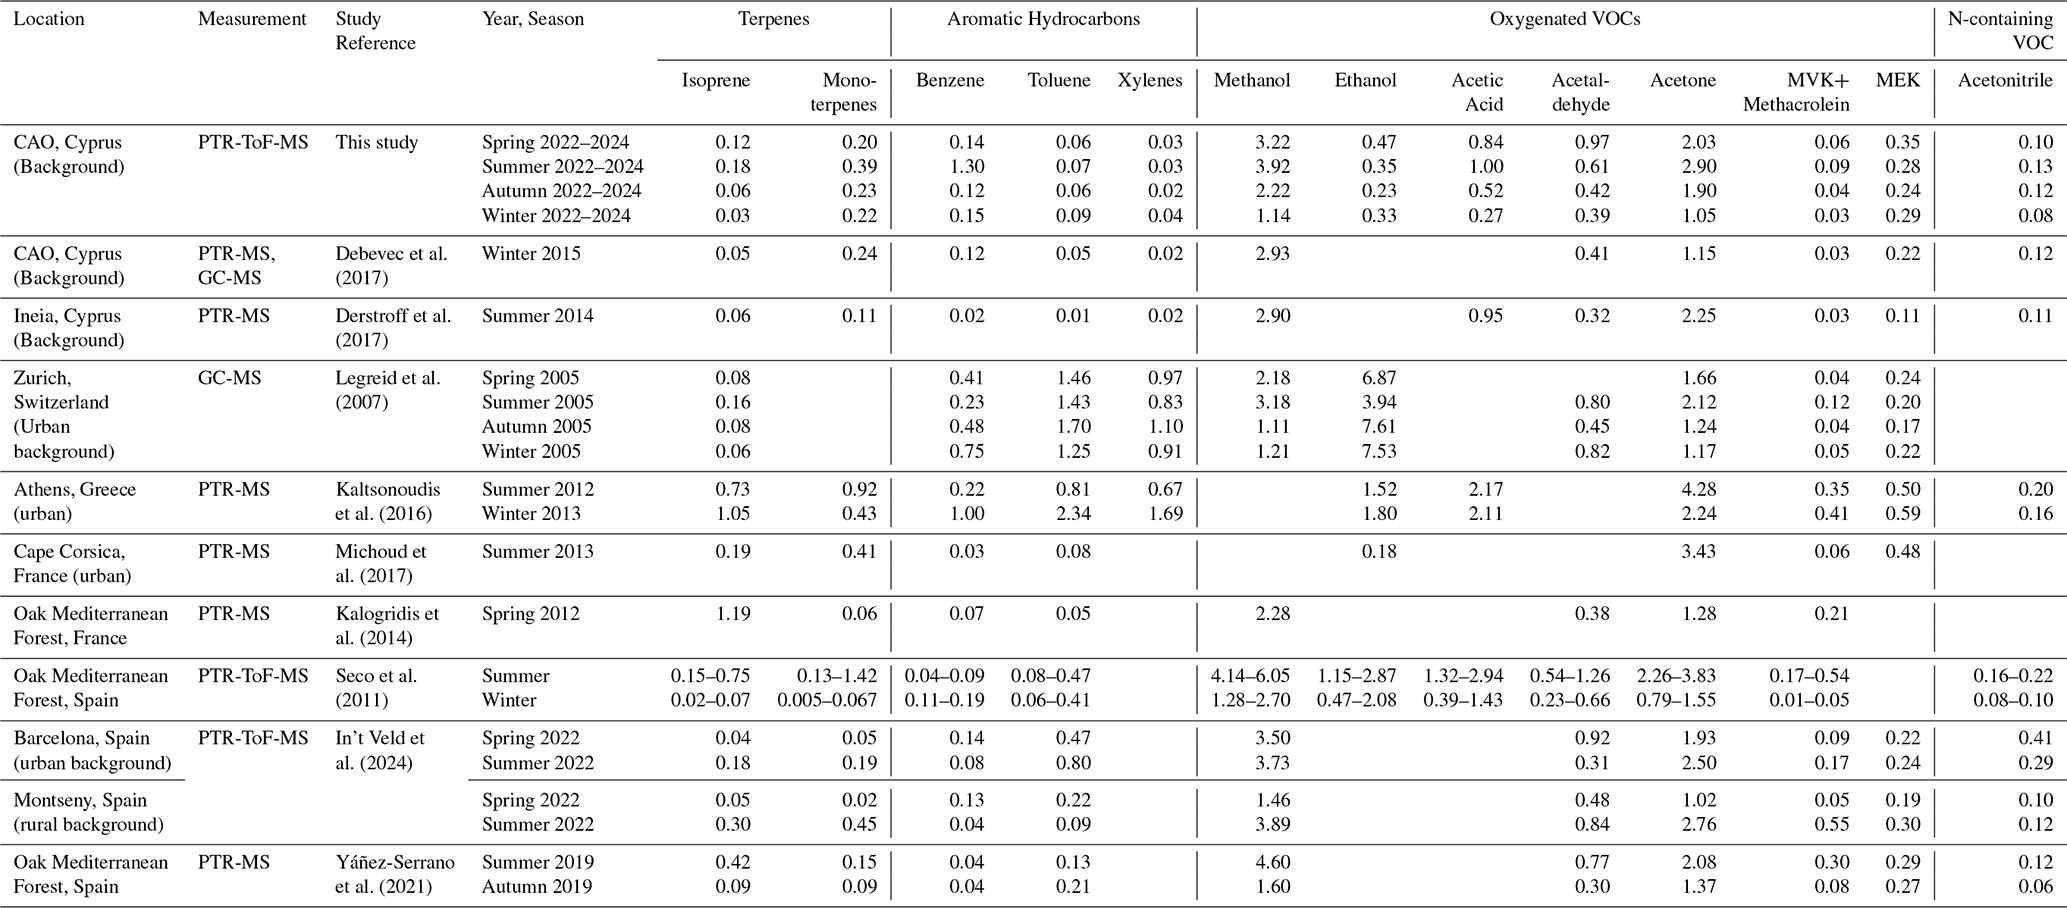
As shown in Table 2, VOC mixing ratios measured in our study are within the range reported from other European background and rural sites. Winter mixing ratios for acetaldehyde, acetone, MVK, MEK, acetonitrile, benzene, isoprene, and monoterpene were also comparable to those measured during the same period in 2015 at this site (Debevec et al., 2017), suggesting stable background concentrations and low interannual variability in the Eastern Mediterranean. However, summertime isoprene mixing ratios at Ineia, Cyprus, were about three times lower. Derstroff et al. (2017) demonstrates potential contribution of downwind forest emissions or the effect of hotter summers and stress induced emissions. Elevated levels of most VOCs during summer (Fig. 3b) suggest the influence of increased biogenic activity and enhanced photochemical production, as well as contributions from solvent use and fuel evaporation.
As shown in Table 2, the Mediterranean forested sites in France and Spain are characterised by higher daily mean isoprene levels up to 1 ppbv (Kalogridis et al., 2014; Seco et al., 2011), consistent with strong direct emissions from oak-dominated ecosystems compared to the conifer-dominated forest in Cyprus. The urban site of Zurich, Switzerland shows similar seasonal pattern as our study, where isoprene, methanol, acetone, and MVK all showed a summer maximum and a winter minimum (Legreid et al., 2007). However, wintertime aromatic (BTX) concentrations were much higher in Zurich presumably due to combustion sources related to anthropogenic activities. Nitriles and MEK concentrations in our study fall in the range of those reported for previous European background studies (Table 2) and confirm their regional well-mixing as resulting from both anthropogenic and biomass-burning sources.
3.3 Seasonal and diurnal variability of VOCs functional groups
The diurnal variation of total VOCs (TVOCs) across all seasons and years (Fig. S4) reveals clear patterns influenced by temperature, photochemistry, boundary layer dynamics, and emission sources. TVOCs mixing ratio typically observed high between 09:00–14:00 UTC, corresponding to enhanced daytime emissions and increased atmospheric reactivity. The highest median TVOCs mixing ratios were observed during summer 2024 (25.76 ppbv), followed by summer 2023 (16.27 ppbv), spring 2024 (13.71 ppbv), and summer 2022 (12.35 ppbv), whereas winter exhibited the lowest levels (5.83 ppbv). The less pronounced seasonal enhancement observed in summer 2022 compared to 2023 and 2024 is likely due to comparatively lower ambient temperature of about 1–3 °C resulting in weaker photochemical activity during that period, and reduced temperature-driven biogenic emissions. In contrast, summer 2024 was characterized by exceptional heat, including record-breaking temperatures (> 45 °C) across Cyprus, which strongly intensified direct VOCs emissions and secondary production.
June 2024 was the warmest June on record in Cyprus, with 43 of 52 stations registering record maximum temperatures; during the 14–15 June heatwave, maximum temperature reached 45.3 °C, resulting in two heat-related deaths and widespread wildfire impacts (Department of Meteorology (Cyprus), 2024). During summer, there is also northerlies that promote the transport of species from regions with pronounced anthropogenic emissions, including biomass burning, contributing to elevated levels (Vrekoussis et al., 2022). The prolonged heat (summer 2024) was attributed to a persistent heatwave influenced by global climate change, with such extreme events forecasted to become more frequent and intense in the future (Yáñez-Serrano et al., 2016; Zittis et al., 2022). Similarly, the higher VOCs mixing ratio measured during spring 2024 relative to earlier spring campaigns can also be attributed to warmer-than-usual conditions, which enhanced biogenic release and photochemical reactivity. Figure 4 presents the diurnal profiles of VOCs for multiple seasons (2022–2024), which demonstrate pronounced variability on seasonal and diurnal dynamics, particularly during summer 2024, when elevated temperatures significantly enhanced VOCs levels across most chemical classes.
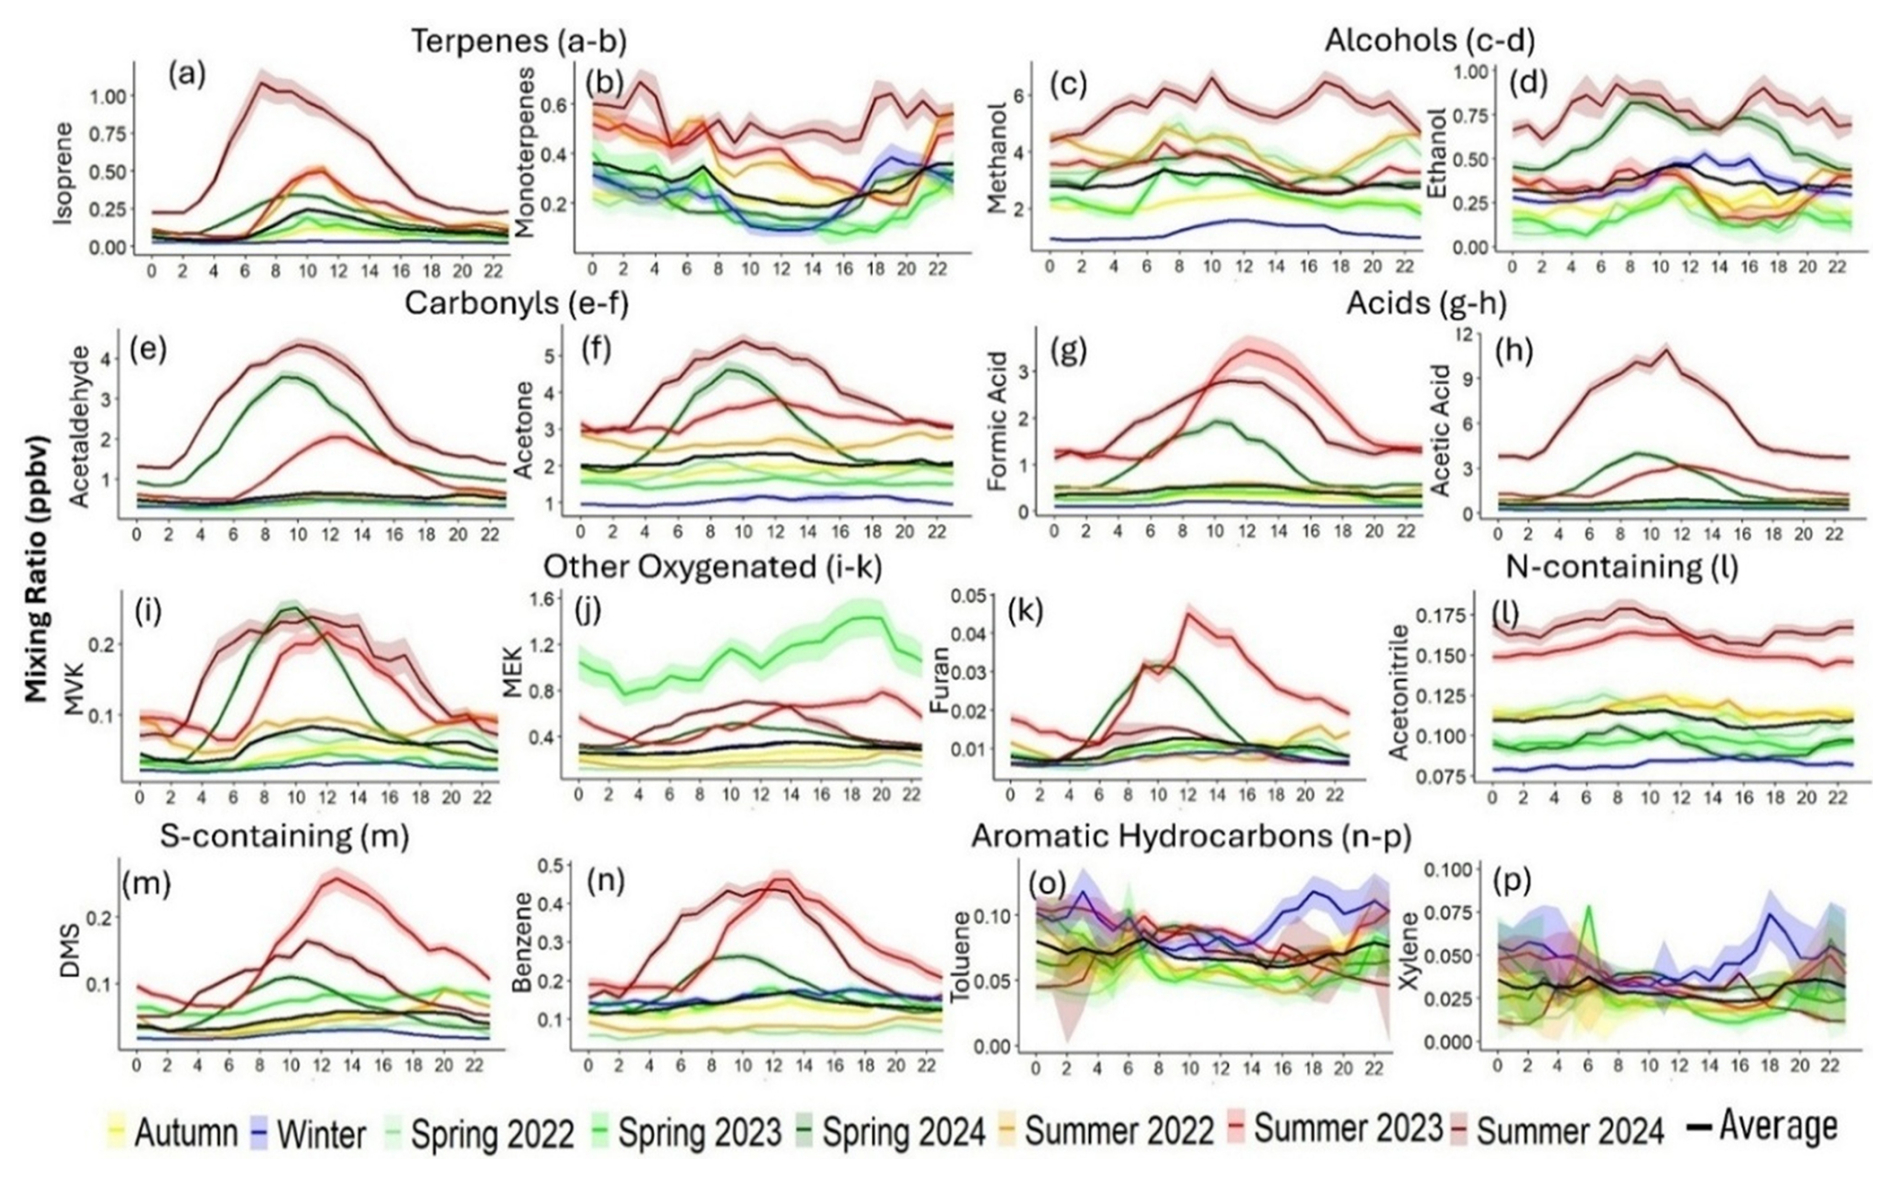
Figure 4Diurnal profiles (hourly averages) for mixing ratio (ppbv) of major VOCs. It includes- terpenes (a–b), oxygenated VOCs (alcohols, carbonyls, acids, other oxygenated (c–k)), nitrogen and sulfur-containing VOCs (l–m), and aromatic hydrocarbons (n–p), measured at a rural background site in Cyprus from 2022 to 2024. Seasonal variations are color-coded, highlighting year-wise spring and summer trends alongside autumn, winter, and overall averages. Shaded areas indicate standard error for median values. x-axis here reprents time in hours in UTC. The VOCs selected in this figure serve as representative indicators for their respective chemical families.
3.3.1 Terpenes (isoprene and monoterpenes)
High isoprene levels occurred during 08:00–14:00 UTC (the time when SR and AT are highest) in summer 2023 and 2024 (Fig. 4a). In summer 2024, the median isoprene mixing ratio reached approximately 1.0 ppbv during the day, with daily average median values of 0.43 ± 0.36 ppbv. Interestingly, the observed isoprene maximum at 08:00 UTC does not coincide with the peaks in SR and AT. This suggests that under the extreme drought conditions of 2023 and 2024, vegetation may have downregulated photosynthesis unusually early in the day. Such an early shutdown indicates that a physiological threshold was crossed, whereby plants shift their carbon allocation strategy from growth toward survival. While drought stress is often associated with an initial increase in isoprene emissions (Byron et al., 2022), prolonged or severe stress can suppress photosynthesis and consequently reduce isoprene release (Potosnak et al., 2014; Byron et al., 2022). On the other hand, monoterpenes showed broader diurnal presence, with early morning and evening peaks in all seasons, and a summer median of 0.51 ± 0.20 ppbv.
Isoprene and monoterpenes exhibited distinctly different temporal patterns, reflecting their contrasting emission drivers and atmospheric dynamics. The seasonal pattern in isoprene align with established findings, where approximately 77 % of annual emissions occur in spring (31 %) and summer (46 %), driven by elevated light intensity and temperature, which activate isoprene synthase enzymes (Fortunati et al., 2008; Monson et al., 1992). Autumn and winter emissions are markedly lower due to reduced photosynthetic activity and enzymatic downregulation (Panopoulou et al., 2020).
Monoterpenes, while also of biogenic origin mainly, demonstrated a more even seasonal distribution, with 38 % of levels occurring in summer (0.39 ppbv) and 19 %–22 % across other seasons (0.20–0.23 ppbv). This distribution reflects not only temperature dependence but also anthropogenic and ecological responses to herbivory, wounding, and water stress, particularly relevant under changing climate conditions (Bourtsoukidis et al., 2025; Peñuelas and Staudt, 2010; Strada et al., 2023; Wang et al., 2022a). The winter levels remain relatively stable, as stored monoterpenes in plant tissues continue to be emitted even during periods of low biosynthesis (Bourtsoukidis et al., 2024; Ciccioli et al., 2023; Wang et al., 2022a, 2024). Consistent with the findings of Debevec et al., 2018, our observations also revealed elevated nighttime concentrations of monoterpenes, likely attributable to reduced oxidative sinks, boundary layer dynamics, and continuous emissions from vegetative storage pools.
3.3.2 Oxygenated VOCs
Methanol and ethanol exhibited moderate diurnal variation with elevated daytime and evening levels in summer (Fig. 4c–d). Median methanol observed as ∼ 5.52 ± 1.27 ppbv and ethanol as ∼ 0.76 ± 0.26 ppbv in summer 2024, reflecting both biogenic emissions and anthropogenic activities such as solvent use and burning. Carbonyls including acetaldehyde (2.38 ± 1.21 ppbv) and acetone (3.82 ± 1.02 ppbv), displayed sharp midday peaks in summer, consistent with secondary formation via photochemical oxidation. Their diurnal and seasonal consistency between 2023 and 2024 highlights photochemical production pathways. Organic acids such as formic and acetic acid showed significant daytime enhancements in summer, particularly in 2024. Their median mixing ratios reached 1.76 ± 0.70 and 5.60 ± 2.75 ppbv, respectively, suggesting combined direct emissions and oxidative formation, possibly influenced by biomass burning or regional wildfires (Holzinger et al., 2005). Among other OVOCs, methyl vinyl ketone (MVK), a product of isoprene oxidation, peaked at 0.15 ± 0.08 ppbv during summer midday. Furan, a tracer of biomass burning, showed morning maxima in summer 2023, indicating episodic fire activity. Consistent with isoprene emission, MVK also shows almost 42 % of its emission during the summer season. A total of 60 %–70 % levels of acetic acid, acetaldehyde, acetone, formic acid, and methanol emissions occur during summer and spring season, collectively showing their biogenic origin and secondary formation.
3.3.3 Nitrogen and sulfur-containing VOCs
Acetonitrile (C2H3N), a N-containg VOC and a biomass burning tracer, showed minimal diurnal variation (Fig. 4l) due to its long atmospheric lifetime, which is approximately 620 d (Robles, 2005). Nevertheless, elevated levels were observed throughout the summer of 2023–2024, pointing to regional fire events during summer or long-range transport. The median acetonitrile seasonal mixing ratios were found to be highest during summer 2024 as 0.17 ± 0.02 ppbv, while lowest during winter as 0.08 ± 0.01 ppbv. DMS (C2H6S), a S-containing VOC, exhibited its highest average levels during summer 2023 (0.12 ± 0.09 ppbv) (Fig. 4m), likely due to enhanced marine biogenic emission from the nearby Mediterranean sea. The pronounced seasonal variation of DMS supports a temperature-driven biogenic source (Deschaseaux et al., 2022; Edtbauer et al., 2020).
3.3.4 Aromatic hydrocarbons
Benzene showed summer midday enhancements (0.26 ± 0.12 ppbv), while toluene and xylenes exhibited flatter or bimodal patterns (high during morning and evening, probably due to increased vehicular activities) with higher variability. Toluene and xylenes mixing ratios peaked in winter and spring, consistent with local combustion under shallow boundary layers. The large standard error variation (Fig. 4o–p), especially for xylenes and toluene, indicates episodic anthropogenic inputs from traffic or regional pollution. Compared with benzene, these more reactive aromatics exhibited flat or noisy diurnal profiles with limited seasonal variability, aside from the winter-spring xylenes enhancement.
3.4 Temperature-driven enhancement of VOCs emissions in EMME region
3.4.1 Temperature sensitivity of VOCs
The variation in VOCs mixing ratios with temperature revealed clear temperature-dependent trends across most VOCs (Fig. 5). Among terpenes, isoprene, showed strong responses to rising temperatures, as their mixing ratio increased markedly beyond 25 °C, with a peak observed between 35–38 °C (0.53 ± 0.22 ppbv). There is an exponential increase in isoprene levels up to 38 °C, however, a slight decline (0.02–0.06 ppbv) in its level above 38 °C suggests crossing a tipping point through inhibition under extreme heat stress conditions (Fortunati et al., 2008). Monoterpenes exhibited a comparatively low increase in mixing ratios with an increase in temperature, and its trend was more gradual. The moderate rise at 35–38 °C (from 0.34 to 0.41 ppbv, ∼ 21 % increase) supports a biogenic contribution during summer, while the relatively stable levels across temperature bins may indicate sustained emissions throughout the day.
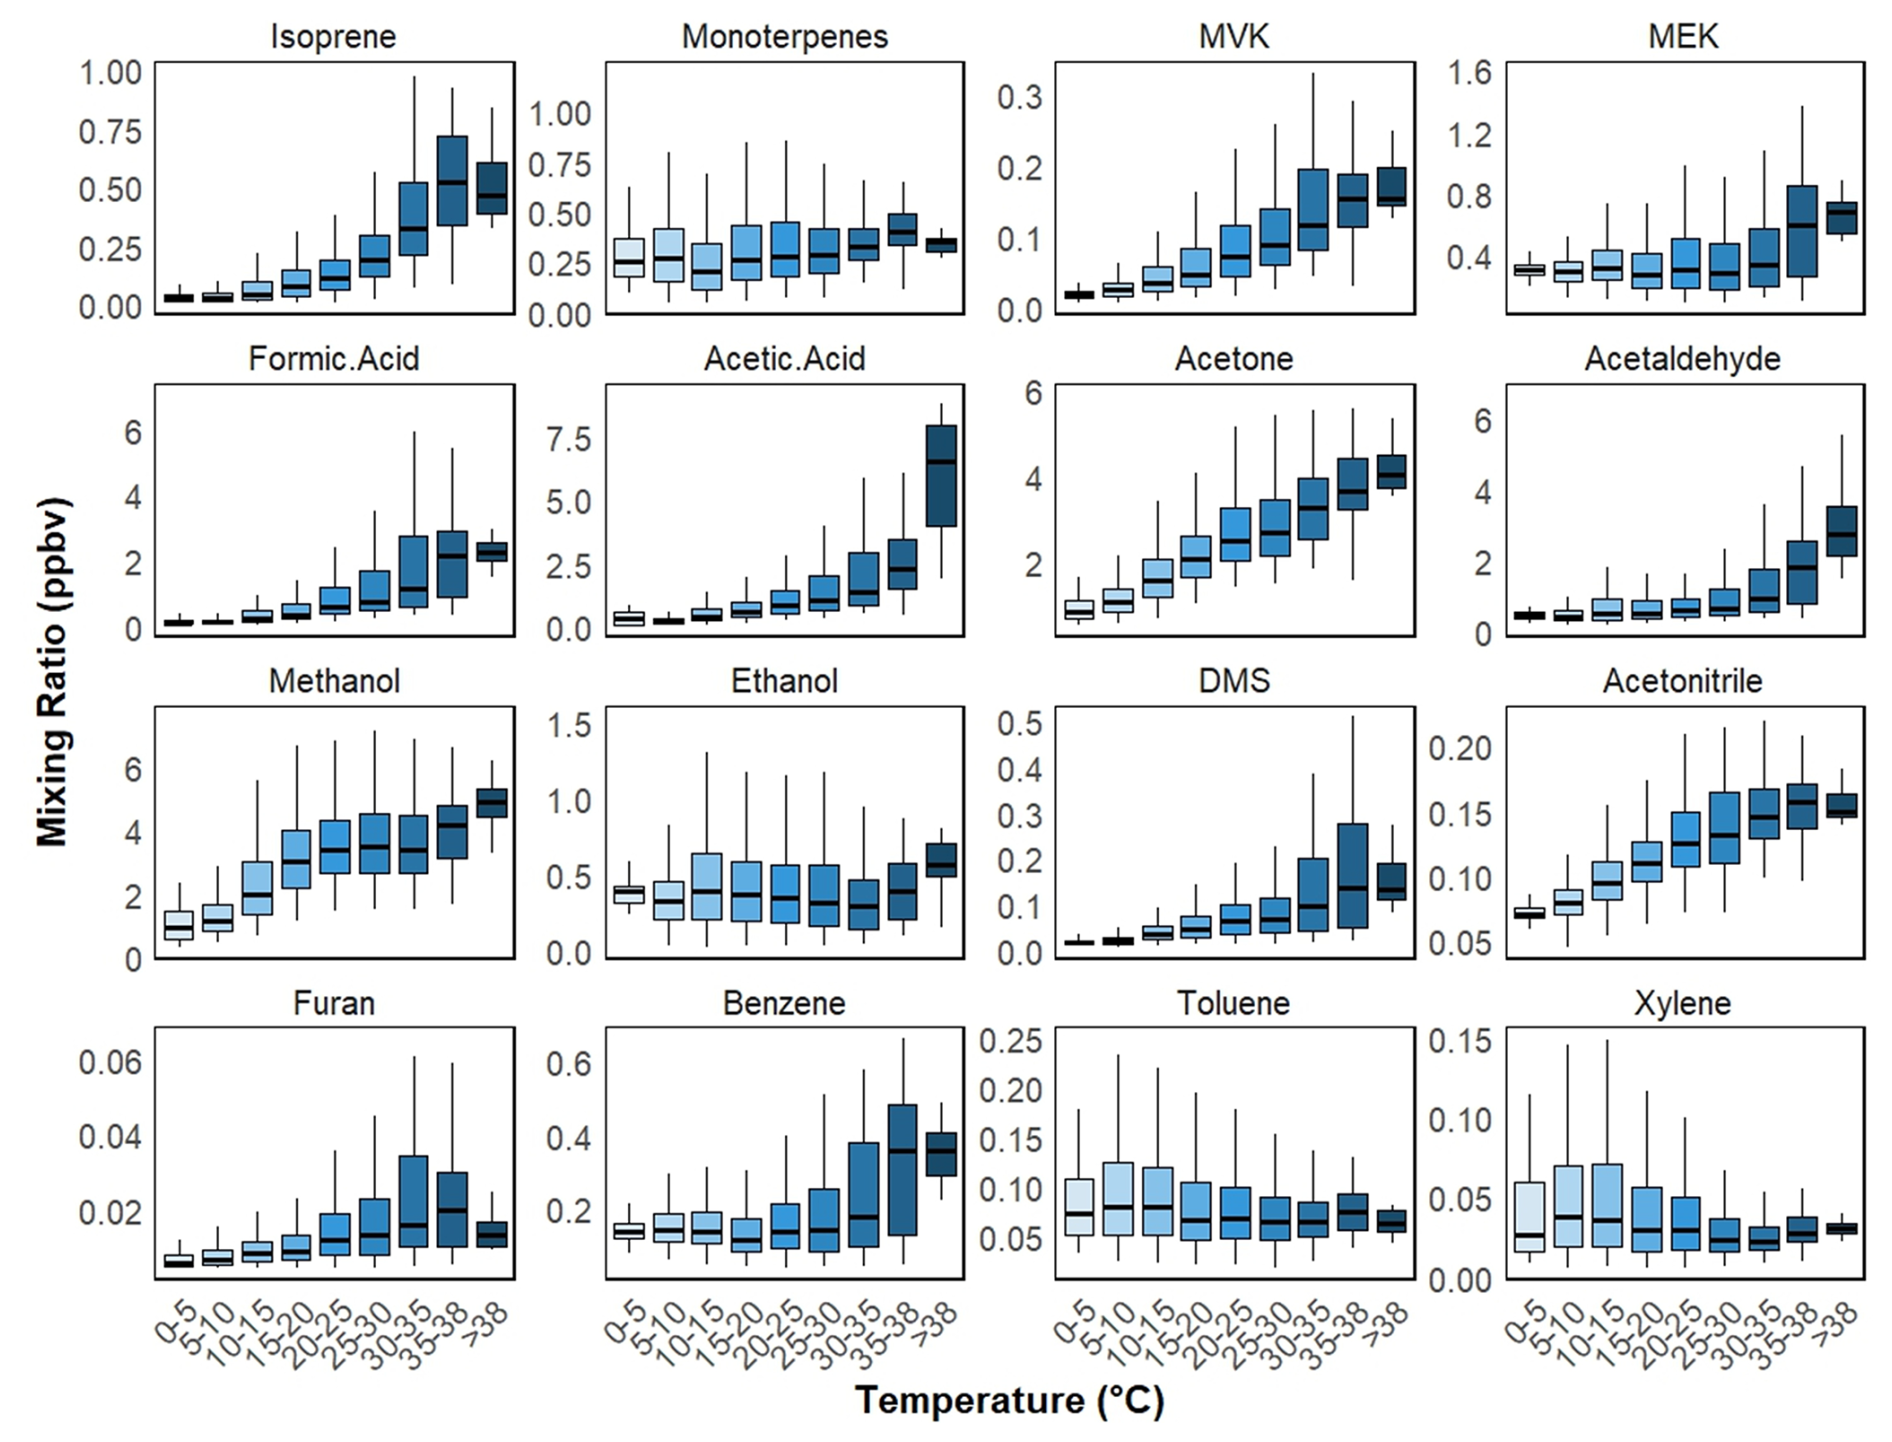
Figure 5Temperature Dependence of Ambient VOC mixing ratio in Cyprus. Box plots showing the variation in ambient mixing ratio (in ppbv) of selected VOCs across different temperature ranges (°C) at a rural background site in Cyprus. Each box represents the interquartile range (IQR) with the median marked, and whiskers indicating variability outside the upper and lower quartiles. The VOCs selected in this figure are serve as representative indicators for their respective chemical families.
DMS levels also rose steadily with temperature, with maximum values observed between 35–38 °C (0.18 ± 0.13 ppbv). This trend is likely driven by enhanced microbial activity in the Mediterranean Sea (Edtbauer et al., 2020) and increased volatilization rates in warm, semi-arid, and coastal conditions typical of the region (Edtbauer et al., 2020).
OVOCs also exhibited strong temperature dependence. Acetone and methanol levels increased progressively, reflecting a combination of direct biogenic emissions and secondary formation via oxidation of precursor compounds (Huang et al., 2020; Liu et al., 2009; Mellouki et al., 2015; Wang et al., 2022c). Methanol levels rose sharply above 38 °C (∼ 19 % with mean value of 4.85 ± 0.91 ppbv).Click or tap here to enter text.Elevated methanol levels at high temperature are primarily consistent with biogenic sources, such as plant metabolism and microbial activity, although emissions from forest fires may also contribute under high-temperature conditions (Paton-Walsh et al., 2008; Yokelson et al., 1999; Dorokhov et al., 2018). Ethanol also shows temperature dependence, but it is weaker compared to methanol likely reflects its mixed source profile at the study site. While methanol is largely controlled by temperature-driven biogenic emissions and photochemistry, ethanol receives significant contributions from non-biogenic sources (e.g., solvent use, vehicular exhaust, long-range transport, and agriculture), which are less temperature-sensitive. As shown in Fig. 5, ethanol levels increase markedly only above 38 °C, suggesting additional evaporative emissions from anthropogenic sources. Acetic acid and acetaldehyde showed particularly sharp increases above 35 °C, with acetic acid levels ∼ 2.8 times higher beyond 38 °C (5.4 ± 2.9 ppbv) when compared with the levels at 35–38 °C. These patterns indicate enhanced photochemical production and possible evaporation-driven emissions (Debevec et al., 2017; Xu et al., 2023; Yuan et al., 2024). The increase of OVOCs under warmer conditions (> 8 °C) highlights their potentially significant role in SOA formation in the EMME region (Azmi and Sharma, 2023; Pennington et al., 2021).
Among aromatic hydrocarbons, benzene displayed a notable rise above 35 °C (0.35 ppbv), suggesting contributions from evaporate emissions, or long-range transport (Dimitriou and Kassomenos, 2020; Gjesteland et al., 2019). Another possible reason for the high daytime benzene levels, particularly during hot days (AT > 5 °C) could be heat-stress-induced biogenic emissions (Misztal et al., 2015), where vegetation was found to release diverse benzenoid compounds under stress, potentially for communication or protective functions. However, the exact cause remains uncertain and warrants further investigation. In contrast, both toluene and xylenes levels were highest at lower temperatures (< 15 °C), likely reflecting solvent use, decreased photochemistry, or indoor emissions during cooler periods (Abbasi et al., 2020; Song et al., 2011). A minor elevation (∼ 0.01 ppbv) in toluene and xylenes was observed at 35–38 °C, potentially due to evaporative processes or reduced atmospheric dispersion.
3.4.2 Intensified VOC loading during the Summer 2024 heatwaves
June 2024 was the hottest month on record in Cyprus and coincided with the highest TVOCs mixing ratios observed during the 2022–2024 period (25.76 ± 8.29 ppbv), exceeding summer maxima recorded in 2023 and 2022 (Fig. S4). As illustrated in Fig. 4, most VOCs also showed markedly higher emissions in 2024 compared to previous years. Considering that our observations span only until 15 June 2024, we focused on the comparison of the first half of June across the three years. The data revealed that TVOCs mixing ratio in early June 2024 (23.53 ppbv) were more than double compared to those measured during the same period in 2022 (9.98 ppbv) and 2023 (8.59 ppbv). This sharp rise was accompanied by extreme meteorological conditions: record-breaking average temperatures (24.95 °C), intense SR (314.81 W m−2), and very low RH (27 %). In contrast, temperatures in early June 2022 and 2023 averaged 21.91 and 20.61 °C, with RH at 59.73 % and 56.39 %, respectively.
These conditions favored both primary biogenic emissions and secondary atmospheric processes. Rapid vegetative growth in spring, followed by early thermal stress, likely stimulated isoprene and monoterpene emissions, and maybe also benzene. Elevated temperatures and oxidant availability enhanced both the emission (Bourtsoukidis et al., 2014) and formation of OVOCs such as acetaldehyde, acetic acid, and methanol. Concurrently, increased levels of CO (144.77 ppbv) and O3 (58.77 ppbv) in 2024, compared to 2022 (132.69 and 45.13 ppbv) and 2023 (119.27 and 51.88 ppbv), indicate stronger photochemical activity and increased ozone formation potential (OFP).
Midday peaks in isoprene, along with enhanced OVOCs mixing ratios (acetone, acetic acid, acetaldehyde), reflect intense photochemical production under elevated SR. Also, the elevated nighttime MVK Isoprene ratio (0.96) indicates substantial isoprene oxidation, consistent with an aged air mass that has undergone prolonged exposure to OH radicals. This further supports enhanced oxidation of biogenic precursors (Guo et al., 2012). In contrast, the lower daytime ratio (0.62) suggests comparatively fresher isoprene emissions, reflecting active daytime production of isoprene and limited conversion to MVK, which requires time to form through photochemical processes (Apel et al., 2002). The findings suggest that escalating heatwave intensity and frequency in the EMME region could significantly increase VOC burdens, contributing to secondary pollutant formation (O3 and SOA) and worsening regional air quality.
Wildfire activity may also exhibit pronounced variability and likely influenced the observed VOC composition at the CAO-AMX site (Fig. S6). From 2022–2024, the regional fire activity began in spring; however, its timing and intensity differed substantially. In 2022, the burned area increased rapidly in early summer, exceeding ∼ 1800 ha in June (EFFIS, 2025). In 2023, fire activity was comparatively weaker during spring and early summer, with the largest burned areas occurring later in the season (August-September, 900 and 700 ha respectively). In contrast, 2024 was characterized by an earlier onset of wildfires, with fires occurring from April onwards and peak burned areas of > 700 ha in May and ∼ 2250 ha in June. As a result, springtime fire influence was strongest in 2024 compared to 2022 and 2023 (EFFIS, 2025). These spring and summer wildfire episodes, particularly in 2024, are expected to have enhanced biomass-burning-related VOCs at the site. Fire-influenced air masses typically exhibit elevated concentrations of acetonitrile, methanol, and other OVOCs.
3.5 Inter-species relationship
Based on the comprehensive correlation analysis in Fig. 6, clear patterns emerge among VOCs, meteorological parameters, and pollutant levels. The overall correlation matrix reveals strong positive associations among OVOCs, including acetaldehyde, acetic acid, acetone, methanol, and formic acid (r > 0.6–0.9), suggesting common sources and secondary formation. Ethanol does not cluster closely (r < 0.5) with other OVOCs in the hierarchical analysis (Fig. S7). Its more mixed source profile, including contributions from both local and transported anthropogenic activities, results in distinct temporal behaviour relative to primarily biogenic or photochemical VOCs. Thus, the clustering and weaker temperature dependence are consistent with ethanol's more complex source influences at the site. Isoprene strongly correlates with MVK (r = 0.75), indicating secondary photochemical formation and biogenic influence during high radiation periods. Isoprene is also positively associated with temperature, and solar radiation (r = 0.5) indicating that variability in isoprene and MVK is driven by photochemical processing. On the contrary, monoterpenes show weak correlation at both interspecies levels, and with meteorological parameters, showing its mixed sources from both biogenic and anthropogenic origins.
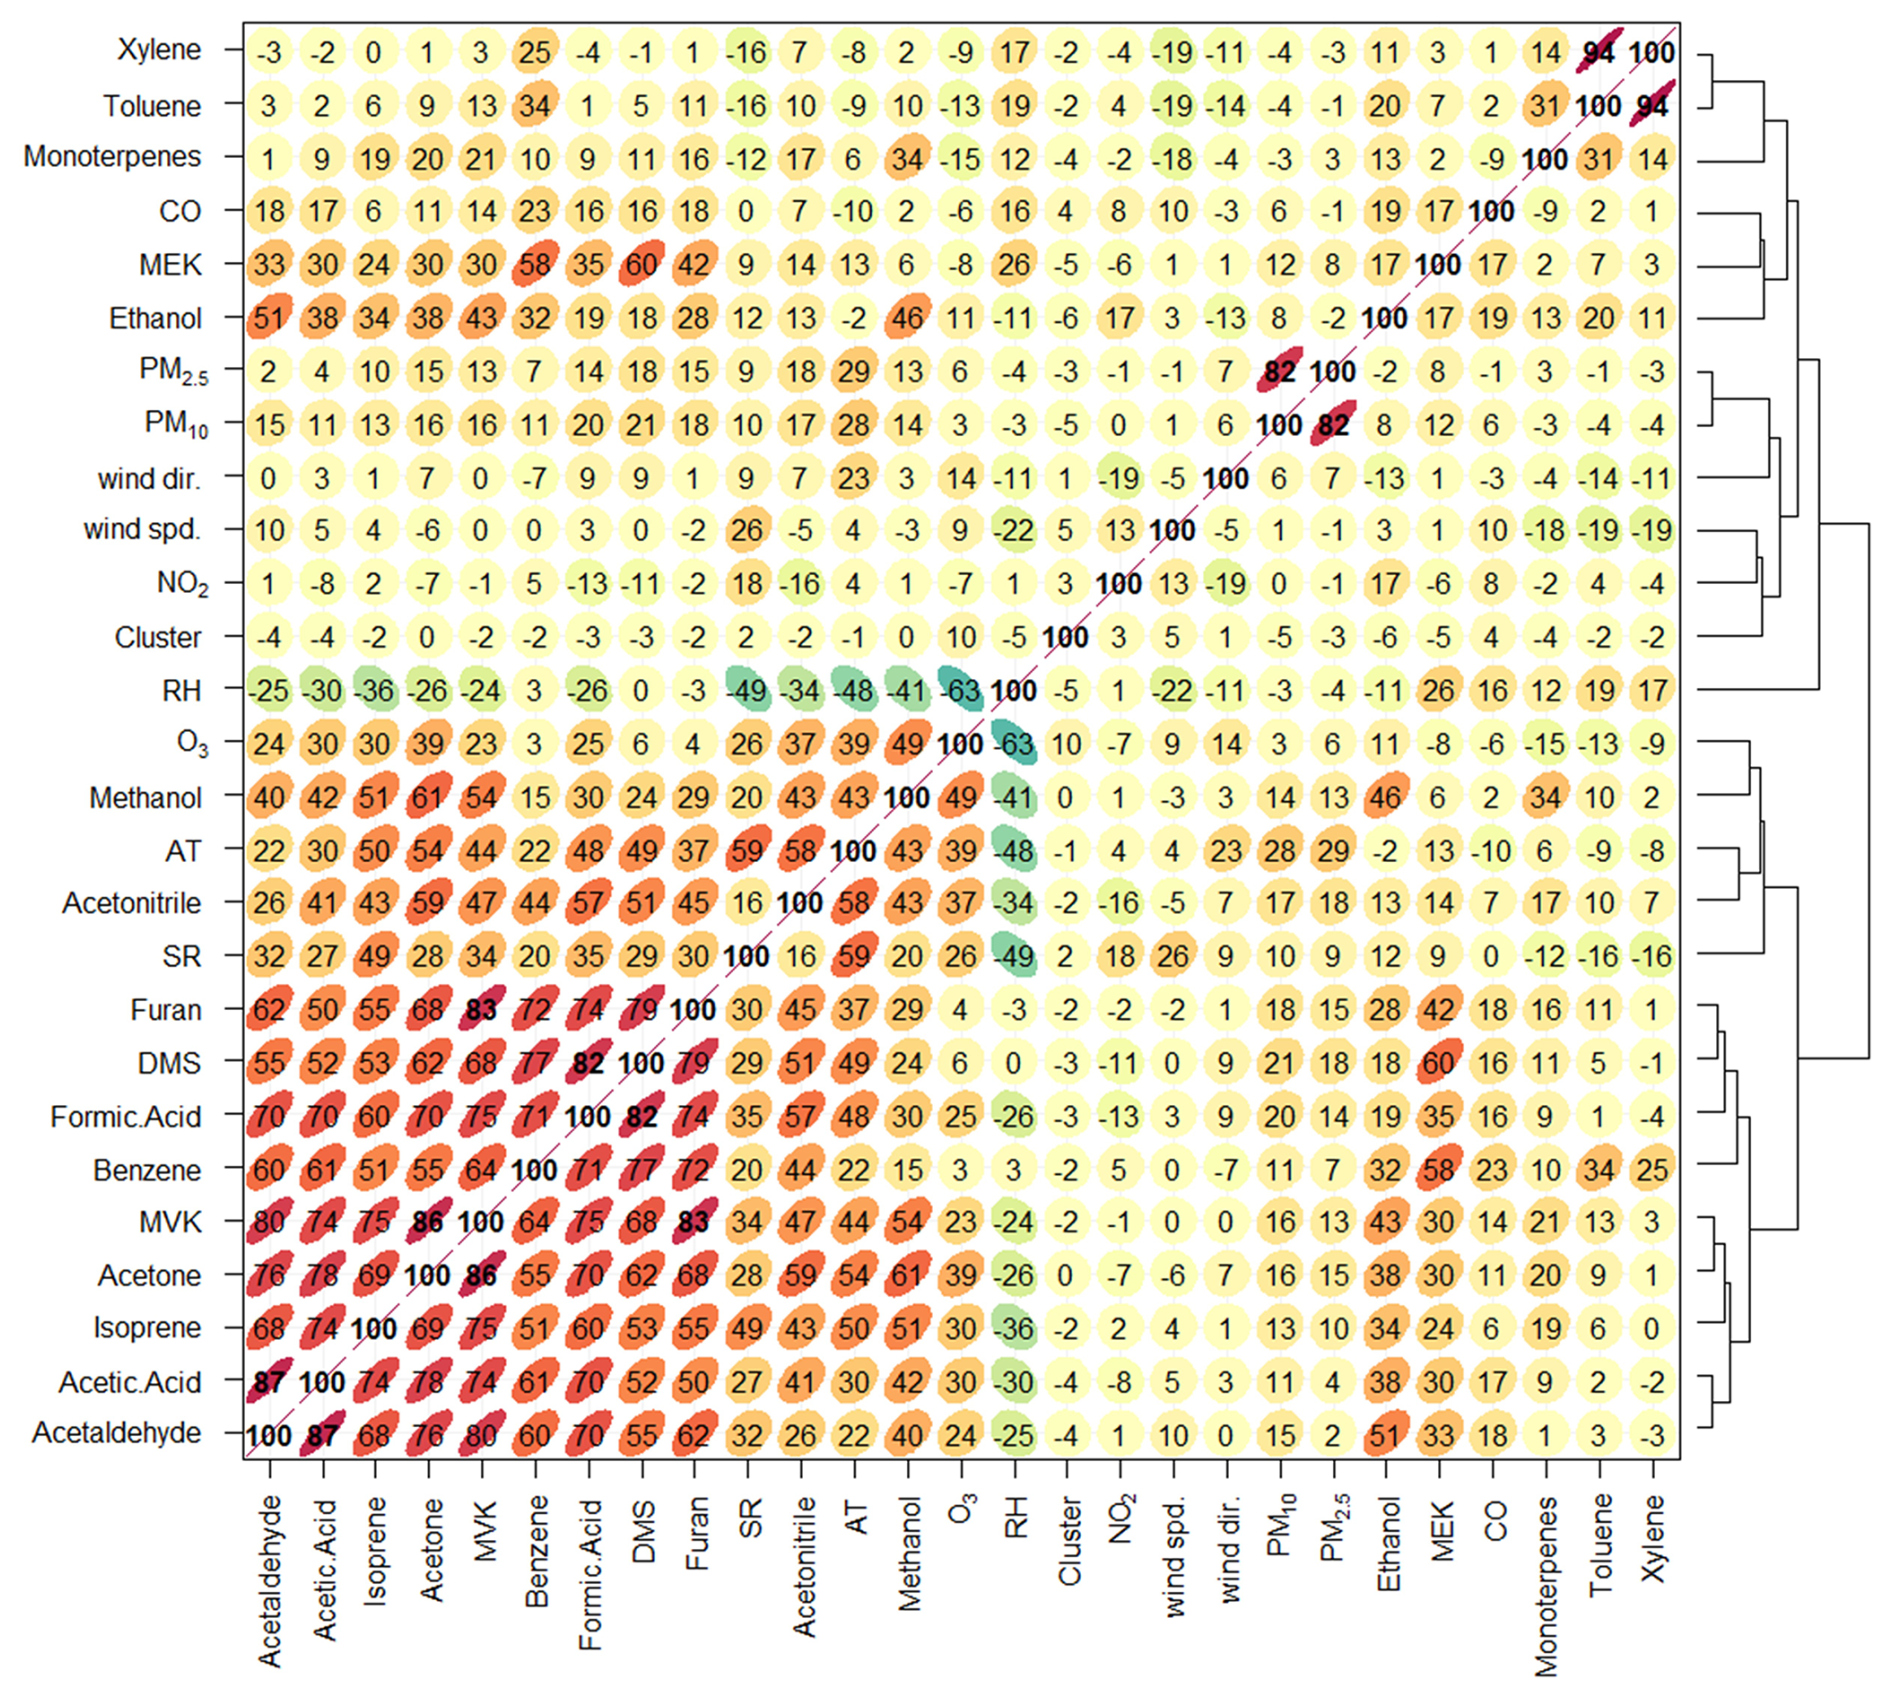
Figure 6Correlation matrix and hierarchical clustering of VOCs, meteorological parameters, and air pollutants. Pearson correlation matrix illustrates the relationships among VOCs, meteorological variables (e.g., temperature, solar radiation, humidity), and air pollutants (NO2, O3, CO, PM2.5, PM10). Here, cluster refers to the air-mass trajectory cluster index obtained from the HYSPLIT back-trajectory analysis (shown in Fig. 7), where each number corresponds to a distinct air-mass transport pathway. Positive correlations are shown in orange to red, while negative correlations are represented in green to blue. Hierarchical clustering (dendrogram) on the right group's variables with similar correlation patterns.
Aromatic hydrocarbons (e.g., toluene and xylenes) form another cluster with moderate-to-strong correlations (r = 0.94), consistent with urban combustion sources. Among aromatic hydrocarbons, benzene show comparatively weaker relation with toluene and xylenes. Benzene-toluene (r = 0.6) and benzene-xylenes (r = 0.4) correlation is moderate in winter, maybe due to low photochemical loss due to low temperature, but weakens in summer (r < 0.3) due to faster toluene degradation and variable sources (Gelencsér et al., 1997). Toluene is showing weak correlation (r < 0.3) with other VOCs and environmental parameters, showing their main source is anthropogenic in origin. Whereas benzene shows strong correlation with other VOCs specially OVOCs (r > 0.6) showing either similar sources or evaporation process.
At the rural Cyprus background site, CO shows a diurnal cycle with an early-morning minimum and an afternoon-late evening maximum, which may be driven by boundary-layer dilution after sunrise and subsequent accumulation under regionally influenced air masses. The generally weak correlation between CO and aromatic VOCs suggests that CO variability is primarily controlled by regional transport and its longer atmospheric lifetime, rather than local traffic emissions. Seasonally, CO exhibits moderate correlations with benzene in autumn (r ≈ 0.4) and winter (r ≈ 0.5), likely reflecting enhanced regional combustion sources, reduced boundary-layer heights, and slower photochemical removal during colder months. Correlations are weak in spring and summer due to stronger photochemical processing and deeper boundary layers. CO shows no correlation with toluene or xylene in any season, consistent with their shorter lifetimes and the absence of fresh local emissions at this background site.
RH shows negative correlations with most VOCs, likely due to emission suppression or enhanced wet removal. O3 correlated moderate but positive (r > 0.25) with methanol, acids, acetone, isoprene and also with AT and SR reflecting active photochemical processes especially during summer. Although in correlation matrix, WS and WD show weaker correlations but may still influence variability, as suggested by backward trajectory analysis in Sect. 3.6. Overall hierarchical clustering in Fig. 6 groups of species by chemical and functional similarity. OVOCs cluster tightly, as do aromatics, while temperature, radiation, and ozone form a separate group. These clusters reflect common sources and atmospheric behaviors. Seasonal correlation matrices (Fig. S7) also highlight dynamic VOC-environment interactions, with the strongest correlation among most VOCs during summer.
The diurnal variation of selected interspecies mixing ratios (Fig. S8) reveals distinct patterns driven by emission sources, photochemical processing, and atmospheric reactivity. Ratios such as toluene benzene, and xylenes benzene decrease during the day (minima: ∼ 0.45, and ∼ 0.15 respectively), indicating stronger photochemical degradation of toluene and xylenes compared to the more stable benzene (Tiwari et al., 2010). The MVK isoprene ratio increases from ∼ 0.5 in the early morning to ∼ 1.0 by midday, reflecting active daytime oxidation of isoprene to MVK (Guo et al., 2012). Similarly, the isoprene/monoterpenes ratio peaks around 1.2 between 10:00–14:00 UTC, highlighting the temperature- and radiation-driven nature of isoprene emissions, while monoterpenes remain relatively stable (Kiendler-Scharr et al., 2009). The ozone NO2 ratio exhibits a strong daytime increase, rising from ∼ 30 to over 60 at noon, reflecting photochemical ozone formation from NO2 under solar radiation. Overall, the interspecies ratios effectively differentiate between primary emissions and secondary formation, with photochemically active species (isoprene, MVK, ozone) showing strong diurnal variability.
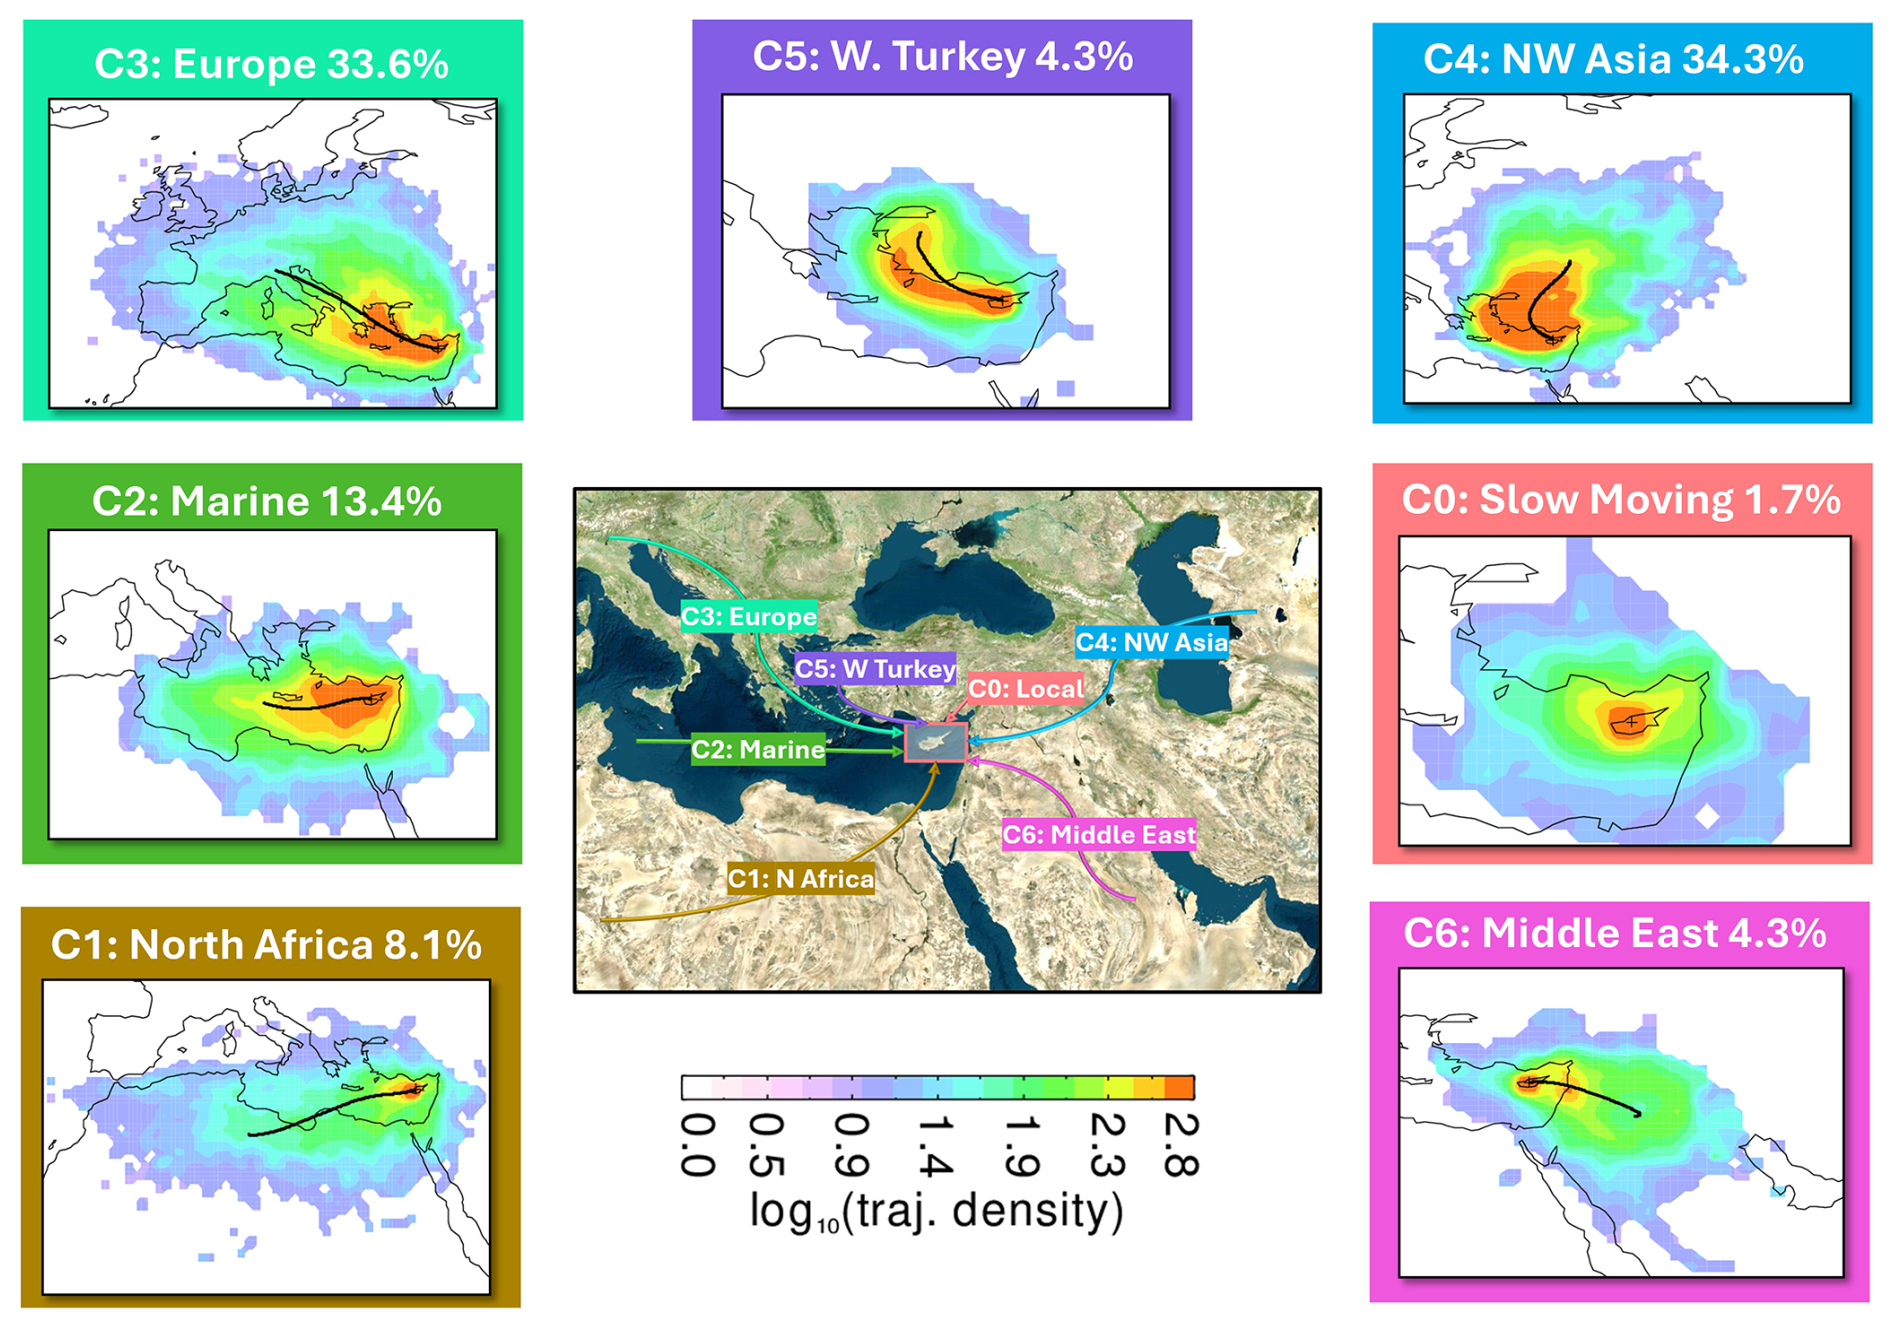
Figure 75 d air mass backward trajectories starting at 500 m above the ground level starting at every hour. These were calculated from the NOAA ARL PC-version HYSPLIT transport and dispersion model using gridded wind fields from the GDAS, which has a spatial resolution of 1° × 1° longitude by latitude and a time resolution of 1 h (Draxler and Hess, 1997) to demonstrate the influence of long-range transported air masses at the measurement site.
3.6 Air mass origins and transport patterns
Using the HYSPLIT model to calculate air mass backward trajectories, we identified seven air mass clusters (Fig. 7) influencing VOCs transport and composition over Cyprus. The dominant clusters originated from Northwest Asia (C4, 34.3 %) and Europe (C3, 33.6 %), jointly accounting for more than two-thirds of the long-range air mass transport. These clusters represent strong, recurrent long-range synoptic-scale transport from urbanized and industrialized continental regions, which occur more frequently than locally influenced trajectories, and thus playe a key role in shaping seasonal and spatial VOC variability. Marine-influenced air masses (C2, 13.4 %) reflected mixed characteristics, carrying both marine biogenic signatures and aged anthropogenic pollution. Less frequent clusters included air masses from North Africa (C1, 8.1 %), Western Turkey (C5, 4.3 %), Middle East (C6, 4.3 %), and stagnant local conditions (C0, 1.7 %). Notably, C6, although infrequent overall, was more prevalent during winter (10.7 %) and exhibited elevated levels of benzene, toluene, and xylenes (BTX) during winter, suggesting long-range transport of aromatic hydrocarbons from the Middle East (Fig. 8). C0, characterized by low wind speeds and residence near the site, showed high concentrations of primary pollutants such as benzene, acetonitrile, ethanol, and NO2, consistent with local anthropogenic and biomass burning sources. Despite dominant local Northwest winds (as shown in Windrose diagram Fig. 2d), back trajectories show multi-day synoptic transport. The more frequent large-scale flows (C3–C4) therefore contribute over two-thirds of long-range air mass transport, exceeding the influence of local pathways (C1–C2). Distinct chemical signatures were observed across clusters. European clusters (C3) exhibited elevated OVOCs such as methanol, acetone, and acetic acid, indicating the presence of aged air masses and secondary formation processes. C3 also carried higher levels of isoprene and MVK, possibly from transported biogenic emissions. C4 was associated with elevated O3, potentially due to photochemical aging during long-range transport. In contrast, Western Turkey (C5) air masses had generally low VOC mixing ratios, though slight O3 enhancement was observed, possibly due to regional NOx-rich emissions and transport.
Seasonal analysis (Figs. S9–S10) revealed pronounced variability in both air mass distribution and VOC loading. Spring and summer were dominated by clusters from Europe and NW Asia, corresponding with enhanced biogenic emissions, active photochemistry, and increased long-range transport. These seasons showed elevated mixing ratios of isoprene, monoterpenes, methanol, acetic acid, and O3. Summer and spring exhibited the highest overall VOC and O3 levels across most clusters, underscoring strong atmospheric photochemical reactivity. Summer maintained high VOC loadings, particularly in C2 and C3 clusters, driven by elevated temperatures and insolation. Autumn displayed a relatively balanced air mass distribution with moderate VOC levels. Winter was characterized by reduced photochemical activity and lower overall VOC concentrations, except for C6, which exhibited persistently elevated anthropogenic markers such as BTX likely associated with heating-related emissions and regional transport under more stagnant meteorological conditions. These findings underscore the interplay between long-range transport, regional meteorology, and local emissions in shaping atmospheric VOCs variability over Cyprus. The combined influence of continental, marine, and regional sources contributes to complex spatiotemporal variability, with implications for air quality, ozone formation, and atmospheric oxidation capacity in the EMME region.
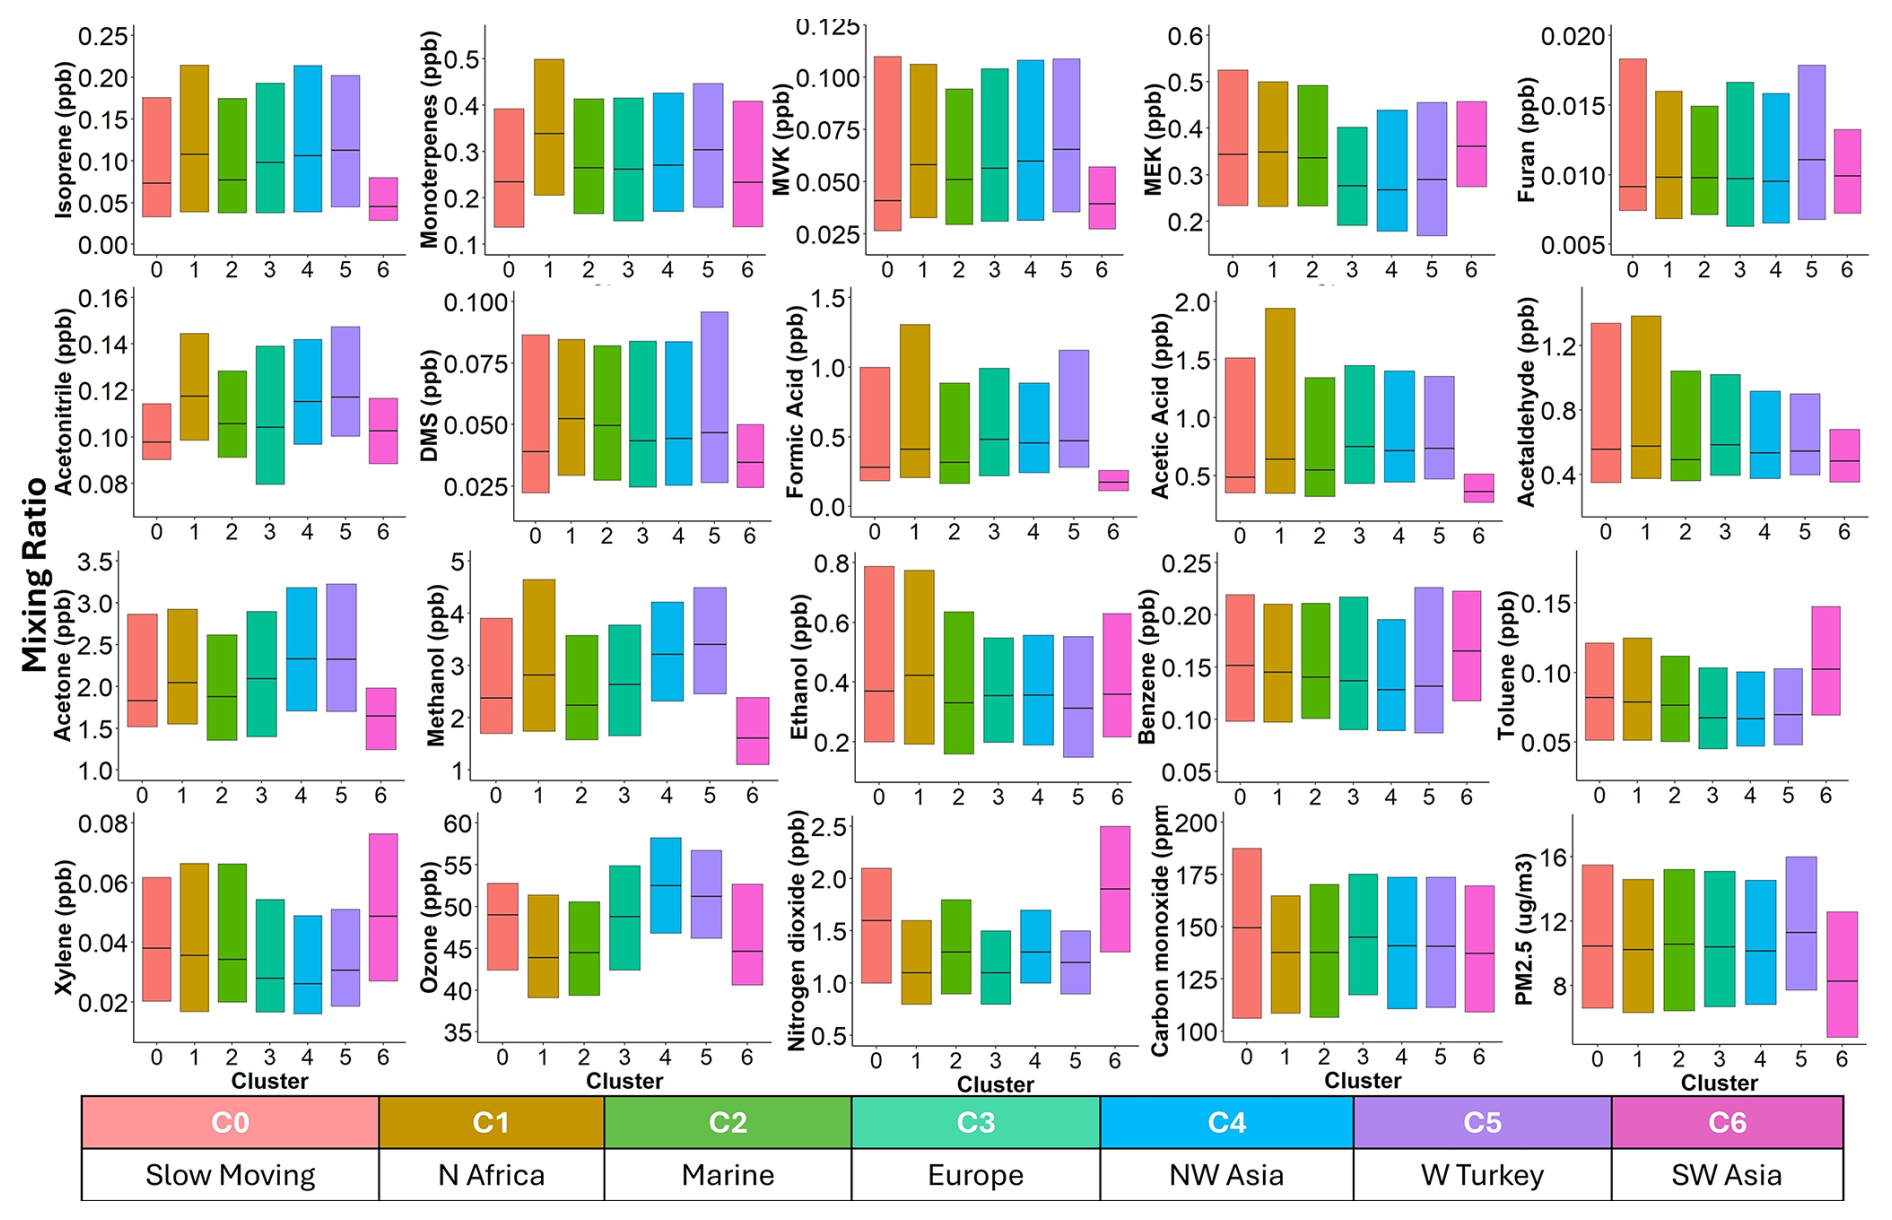
Figure 8Mixing ratios of VOCs, and other air pollutants (in ppbv except PM2.5, which is in µg m−3) across air mass clusters in the regional site at Eastern Mediterranean. Boxplots showing the distribution of mixing ratios of selected VOCs, and other air pollutants for different air mass clusters (C0–C6) identified by back trajectory analysis. The black line within each box represents the median; boxes indicate the interquartile range, and whiskers denote variability outside the upper (75th) and lower (25th) quartiles. The VOCs selected in this figure are serve as representative indicators for their respective chemical families.
3.7 WRF-Chem model simulations
WRF-Chem simulations were evaluated against high-resolution PTR-ToF-MS observations at CAO-AMX across multiple seasons to assess the model's capability to reproduce VOCs variability in the EMME region. BVOCs (isoprene and monoterpenes) emissions were online estimated by MEGAN v2.1 (Guenther et al., 2012), while anthropogenic emissions were derived from EDGAR-HTAP for the outer domains and a Cyprus high-resolution inventory for the innermost domain (Georgiou et al., 2020, 2022). Key biogenic species include isoprene and monoterpenes, while anthropogenic aromatics include benzene, toluene, and xylenes. These species, together with OVOCs, are evaluated using seasonal distributions, diurnal behavior, and annual averages (Figs. 9 and S11–S12). The model successfully captured the seasonal and diurnal variability of several VOCs, particularly the strong summer enhancement associated with elevated temperatures and photochemical activity. Terpenes exhibited pronounced daytime and summertime maximum levels in both observations and simulations, consistent with temperature- and light-driven biogenic emissions reported at other Mediterranean and European background sites (Ge et al., 2024; Genard-Zielinski et al., 2015). Among the evaluated species, isoprene showed the best agreement, with the model reproducing its temporal variability (r = 0.52, p < 0.05), although absolute mixing ratios were overestimated by approximately a factor of three. This overestimation is consistent with previous European-scale studies showing that MEGAN-based WRF-Chem simulations tend to overpredict isoprene emissions, particularly in southern and semi-arid regions (Morichetti et al., 2022). These biases have been primarily attributed to the model's lack of an effective drought stress and soil-moisture constraints in the current MEGAN emission parameterization (Ge et al., 2024; Genard-Zielinski et al., 2015; Morichetti et al., 2022).
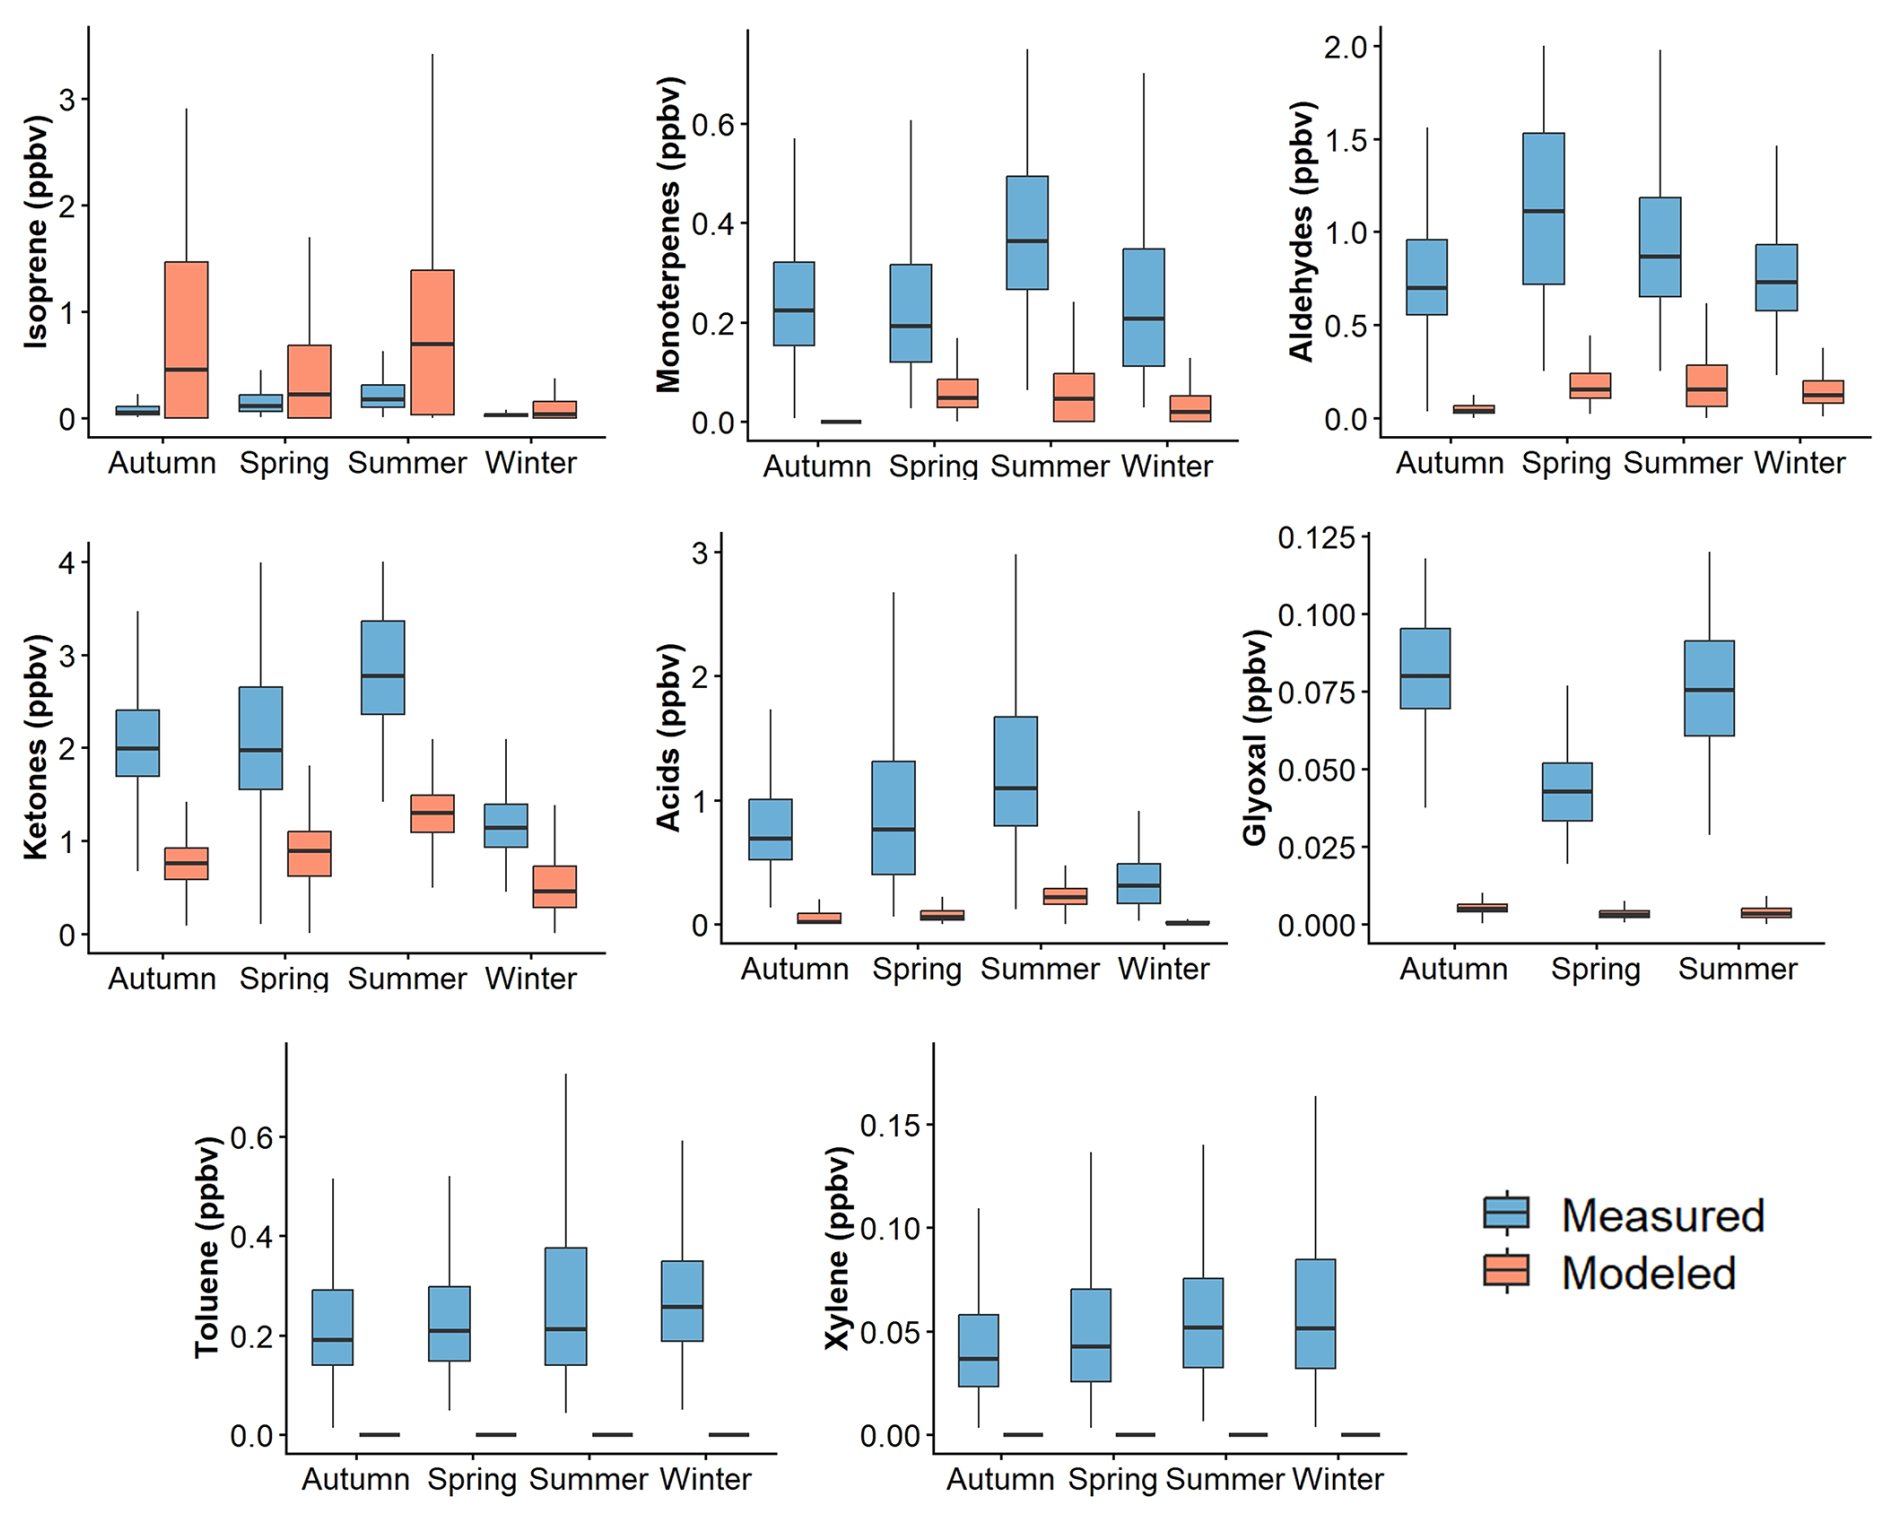
Figure 9Seasonal variation among measured and simulated VOCs mixing ratios at rural background site in Cyprus. The selection, grouping, and classification of VOCs presented in this figure follow the compound categories available within the chemical mechanism of the model to ensure consistency between observations and simulations.
In contrast, Strada et al. (2023) reported strong underprediction of isoprene mixing ratios for Cyprus, that was also attributed to uncertainties in water availability dynamics, demonstrating inadequate understanding of the role of soil moisture in regulating isoprene emissions in the EMME region. These contrasting results emphasize the need for improved, region-specific parameterizations of plant stress responses under extreme meteorological conditions. For monoterpenes, the model significantly underestimated the measured mixing ratios, by up to a factor of 6–7 during daytime and 3–4 at night (Fig. S12). The underestimation of monoterpenes in the model could stem from the assumption that their emissions are primarily controlled by light and temperature. If monoterpenes originate predominantly from storage pools, their fluxes will exhibit only a weak light dependency, which could explain the observed discrepancies. In contrast, the overestimation of isoprene in our study may be linked to heat- and drought-induced stress during the summer months. Such conditions can alter plant carbon allocation strategies, leading to reduced isoprene emissions and enhanced monoterpene release, consistent with observations reported by Byron et al. (2022), but this mechanism may not be represented in current MEGAN parameterizations. Incorporating storage-driven emissions and stress-dependent emission pathways would therefore be critical for improving monoterpene simulations in hot, semi-arid regions. Biogenic emission (isoprene, and monoterpenes) parameterisations require improved representation of high-temperature and water-stress responses (Sindelarova et al., 2014). In particular, heat-stress emission factors and land-atmosphere coupling should be targeted in future work, consistent with studies showing that drought stress algorithms improve the capability of MEGAN isoprene emission estimates (Wang et al., 2022b). Photochemical reaction pathways, chemical ageing and deposition processes that show sensitivity to heat wave atmospheric states can be investigated to more properly quantify atmospheric removal in WRF-CHEM (Knote et al., 2015a, b). In addition, wildfire and anthropogenic VOC emissions should be produced using high spatiotemporal (hourly, 1 × 1 km) resolution to capture the impact of applying diurnal variability and vertical distribution to fire emissions, along with VOC speciation that better reflects regional source profiles.
OVOCs including acids, aldehydes, and ketones showed strong diurnal and seasonal enhancements during summer, consistent with intense photochemical production and evaporative processes, yet were underestimated by factors of 3–12 depending on chemical class. These discrepancies are aligned with underprediction of OVOCs across Europe due to missing secondary formation chemistry, incomplete representation of oxidation products, and inadequate representation of temperature-dependent evaporative emissions (Ge et al., 2024). Taken together, these results indicate that there are significant deficiencies in the representation of OVOCs precursors and multi-phase processing by RACM.
Aromatic hydrocarbons like toluene and xylenes showed relatively flat diurnal profiles with slight morning and evening peaks in cooler months (Fig. S12), indicative of local anthropogenic sources under stable atmospheric conditions. However, WRF-Chem significantly underestimated these species, particularly xylenes, implying incomplete representation of urban emissions, traffic sources, and solvent use in anthropogenic inventories. Glyoxal, an important secondary oxidation product, exhibited a clear midday peak in measurements, but modeled values were significantly lower, even though the timing of the peak was captured, suggesting underestimation of precursor VOCs and low yields in photochemical pathways.
Seasonal comparisons (Fig. 9) confirmed these discrepancies. Observed levels of isoprene, aldehydes, ketones, and monoterpenes peaked in spring and summer, consistent with enhanced biogenic and photochemical activity. Modeled outputs, however, underrepresented OVOCs and AVOCs across all seasons. Despite some agreement in seasonal patterns, WRF-Chem was unable to reproduce the magnitude and timing of peak VOC levels. The annual comparison (Fig. S11) showed that while isoprene mean simulated values were relatively aligned with observations, most other VOC groups, particularly OVOCs and aromatics, were systematically underestimated.
EDGAR generally reports higher VOC emissions compared to EMEP or CAMS-REG-AP due to differences in industrial combustion and fugitive sector representation (Thunis et al., 2021). However, these differences in VOC emissions have a limited impact on European-scale ozone modelling, and chemical regime and meteorology remain dominant drivers of O3 variability (Thunis et al., 2021). A high-resolution Cyprus inventory may significantly improve the spatial representation of anthropogenic emissions and reduces NO2 and O3 biases compared to simulations based on CAMS (Georgiou et al., 2022), but uncertainties in BVOCs and OVOCs sources remain the largest contributors to discrepancies.
Overall, the analysis reveals that the heat extremes of the Eastern Mediterranean evoke a distinctive VOC emission response that enhances differences between observations and models based on traditional parameterizations developed in temperate conditions. The systematic underprediction of monoterpenes and OVOCs, when taken together with the overestimation of isoprene, suggests that incorporation of drought-sensitive plant physiology, storage-driven emission dynamics, and extended secondary oxidation chemistry within regional air quality models is required. Both focused biogenic emission modeling efforts and OVOC reaction pathways are necessary to appropriately quantify atmospheric reactivity and chemical transport in this climate-sensitive region. Also, as the frequency and intensity of heatwaves are projected to increase under future climate scenarios (Zittis et al., 2022; Lelieveld et al., 2016), the non-linear response of VOC emissions to temperature stress must be better parameterized to prevent significant underestimations of SOA and ozone formation.
This study provides the first multi-year, high-resolution characterization of volatile organic compounds (VOCs) in the Eastern Mediterranean based on continuous PTR-ToF-MS measurements at the Cyprus Atmospheric Observatory. By integrating detailed chemical observations with meteorological analyses, HYSPLIT air-mass trajectories, and WRF-Chem simulations, we offer a comprehensive assessment of the processes governing VOC variability in a rapidly warming and climatically sensitive region. Across the 2022–2024 period, oxygenated VOCs dominated the total VOC burden (∼ 79 %), reflecting the strong influence of direct sources, secondary formation, and long-range transport on regional atmospheric composition.
Among terpenes, isoprene, exhibited pronounced summer peaks and daytime maxima, closely linked to solar radiation and temperature. Isoprene increased with temperature up to 38 °C before declining, suggesting thermal stress emission suppression, while monoterpenes showed both daytime and nocturnal presence may be due to diverse emission drivers from vegetation, boundary layer dynamics, or anthropogenic contribution. OVOCs (acetone, methanol, acetic acid, acetaldehyde) were enhanced during hot, dry periods, indicating amplified primary emissions and secondary formation. DMS peaks under high temperatures pointed to microbial activity and volatilization in semi-arid and coastal environments. Among aromatic hydrocarbons benzene increased sharply above 35 °C, likely from biogenic origin, evaporative emissions and long-range transport, whereas toluene and xylenes were more abundant in cooler periods and degraded rapidly at higher temperatures.
HYSPLIT trajectory cluster analysis revealed elevated aromatic hydrocarbons, under the influence of long-range transported continental air masses from middle east cluster (C6). The variability in organic acid and sulfur compound was attributed to marine and North African air masses. Slow-moving local air masses, although infrequent, showed disproportionately high VOCs mixing ratio, indicating strong local emission influence. Seasonal patterns showed summer dominated by biogenic emissions and active photochemistry, while winter was characterized by anthropogenic influences under stagnant conditions; spring emerged as a particularly reactive period.
WRF-Chem model simulations captured general seasonal patterns of isoprene but systematically underpredicted OVOCs, aromatics, and secondary VOCs, with notable temporal mismatches in diurnal cycles. These shortcomings reflect limitations in emission inventories, oxidation schemes, and meteorological coupling, particularly for region-specific and stress-induced emissions.
Overall, this work demonstrates that VOC variability in the Eastern Mediterranean is governed by the combined influence of extreme heat, seasonal variation, regional transport, and complex photochemistry. The findings underscore the need for improved VOC parameterizations in regional to global models, region-specific source inventories, and adaptive air quality management strategies that account for both local and long-range transported emissions. With heatwaves expected to intensify across the EMME region, understanding how VOC emissions respond to climatic extremes is critical for predicting future ozone formation, secondary organic aerosol production, and the broader oxidative capacity of the atmosphere. This multi-year dataset provides a valuable foundation for future source apportionment analysis, evaluation of regional model performance, and development of improved emission inventories. As one of the few long-term VOC records in the region, it represents an important step toward constraining atmospheric processes in a globally significant climate hotspot.
All data used in this study are openly available at https://doi.org/10.5281/zenodo.17483541 (Desservettaz et al., 2025).
The supplement related to this article is available online at https://doi.org/10.5194/acp-26-2597-2026-supplement.
AG: Conceptualization, Data curation, Methodology, Validation, Formal analysis, Investigation, Writing – original draft, Writing – review & editing, Visualization. MD: Data curation, Methodology, Software, Validation, Formal analysis, Writing – review & editing. AC: Methodology, Data curation, Formal analysis, Writing – review & editing. TC: Data curation, Software, Writing – review & editing. VPK: Methodology, Software, Writing – review & editing. CS: Data curation, Resources, Writing – review & editing. MV: Methodology, Writing – review & editing. SN: Formal analysis, Writing – review & editing. TJ: Writing – review & editing. JB: Writing – review & editing. JW: Writing – review & editing. NM: Writing – review & editing. EL: Writing – review & editing. JS: Funding acquisition, Resources, Writing – review & editing. EB: Conceptualization, Project administrator, Methodology, Validation, Investigation, Writing – review & editing, Supervision.
The contact author has declared that none of the authors has any competing interests.
Views and opinions expressed are those of the author(s) only and do not necessarily reflect those of the European Union or the European Research Council Executive Agency. Neither the European Union nor the granting authority can be held responsible for them.
Publisher's note: Copernicus Publications remains neutral with regard to jurisdictional claims made in the text, published maps, institutional affiliations, or any other geographical representation in this paper. The authors bear the ultimate responsibility for providing appropriate place names. Views expressed in the text are those of the authors and do not necessarily reflect the views of the publisher.
This work was supported by the European Union's Horizon 2020 research and innovation program (grant No. 856612) and the Cyprus Government (EMME-CARE). The authors thank the CAO technical team for the routine upkeep of the AMX station. EB and SN acknowledge support from the EVOCPOLIS project, funded by the Cyprus Research and Innovation Foundation (grant no. Vision ERC-Parth 2/0524/0215).
This research has been supported by the Horizon 2020 (grant no. 856612).
This paper was edited by Harald Saathoff and reviewed by Arnaud P. Praplan and one anonymous referee.
Abbasi, F., Pasalari, H., Delgado-Saborit, J. M., Rafiee, A., Abbasi, A., and Hoseini, M.: Characterization and risk assessment of BTEX in ambient air of a Middle Eastern City, Process Safety and Environmental Protection, 139, 98–105, https://doi.org/10.1016/j.psep.2020.03.019, 2020.
Apel, E. C., Riemer, D. D., Hills, A. J., Baugh, W., Orlando, J. J., Faloona, I., Tan, D., Brune, W. H., Lamb, B., Westberg, H., Carroll, M. A., Thornberry, T., and Geron, C. D.: Measurement and interpretation of isoprene fluxes and isoprene, methacrolein, and methyl vinyl ketone mixing ratios at the PROPHET site during the 1998 intensive, J. Geophys. Res.-Atmos., 107, ACH-7, https://doi.org/10.1029/2000JD000225, 2002.
Atkinson, R.: Atmospheric chemistry of VOCs and NOx, Atmos. Environ., 34, 2063–2101, https://doi.org/10.1016/S1352-2310(99)00460-4, 2000.
Azmi, S. and Sharma, M.: Global PM2.5 and secondary organic aerosols (SOA) levels with sectorial contribution to anthropogenic and biogenic SOA formation, Chemosphere, 336, https://doi.org/10.1016/j.chemosphere.2023.139195, 2023.
Baalbaki, R., Pikridas, M., Jokinen, T., Laurila, T., Dada, L., Bezantakos, S., Ahonen, L., Neitola, K., Maisser, A., Bimenyimana, E., Christodoulou, A., Unga, F., Savvides, C., Lehtipalo, K., Kangasluoma, J., Biskos, G., Petäjä, T., Kerminen, V.-M., Sciare, J., and Kulmala, M.: Towards understanding the characteristics of new particle formation in the Eastern Mediterranean, Atmos. Chem. Phys., 21, 9223–9251, https://doi.org/10.5194/acp-21-9223-2021, 2021.
Bourtsoukidis, E., Williams, J., Kesselmeier, J., Jacobi, S., and Bonn, B.: From emissions to ambient mixing ratios: online seasonal field measurements of volatile organic compounds over a Norway spruce-dominated forest in central Germany, Atmos. Chem. Phys., 14, 6495–6510, https://doi.org/10.5194/acp-14-6495-2014, 2014.
Bourtsoukidis, E., Behrendt, T., Yañez-Serrano, A. M., Hellén, H., Diamantopoulos, E., Catão, E., Ashworth, K., Pozzer, A., Quesada, C. A., Martins, D. L., Sá, M., Araujo, A., Brito, J., Artaxo, P., Kesselmeier, J., Lelieveld, J., and Williams, J.: Strong sesquiterpene emissions from Amazonian soils, Nat. Commun., 9, 2226, https://doi.org/10.1038/s41467-018-04658-y, 2018.
Bourtsoukidis, E., Ernle, L., Crowley, J. N., Lelieveld, J., Paris, J.-D., Pozzer, A., Walter, D., and Williams, J.: Non-methane hydrocarbon (C2–C8) sources and sinks around the Arabian Peninsula, Atmos. Chem. Phys., 19, 7209–7232, https://doi.org/10.5194/acp-19-7209-2019, 2019.
Bourtsoukidis, E., Pozzer, A., Sattler, T., Matthaios, V. N., Ernle, L., Edtbauer, A., Fischer, H., Könemann, T., Osipov, S., Paris, J.-D., Pfannerstill, E. Y., Stönner, C., Tadic, I., Walter, D., Wang, N., Lelieveld, J., and Williams, J.: The Red Sea Deep Water is a potent source of atmospheric ethane and propane, Nat. Commun., 11, 447, https://doi.org/10.1038/s41467020143750, 2020.
Bourtsoukidis, E., Pozzer, A., Williams, J., Makowski, D., Peñuelas, J., Matthaios, V. N., Lazoglou, G., Yañez-Serrano, A. M., Lelieveld, J., Ciais, P., Vrekoussis, M., Daskalakis, N., and Sciare, J.: High temperature sensitivity of monoterpene emissions from global vegetation, Commun. Earth Environ., 5, 23, https://doi.org/10.1038/s43247-023-01175-9, 2024.
Bourtsoukidis, E., Guenther, A., Wang, H., Economou, T., Lazoglou, G., Christodoulou, A., Christoudias, T., Nölscher, A., Yañez-Serrano, A. M., and Peñuelas, J.: Environmental Change Is Reshaping the Temperature Sensitivity of Sesquiterpene Emissions and Their Atmospheric Impacts, Glob. Chang. Biol., 31, https://doi.org/10.1111/gcb.70258, 2025.
Brito, J., Freney, E., Dominutti, P., Borbon, A., Haslett, S. L., Batenburg, A. M., Colomb, A., Dupuy, R., Denjean, C., Burnet, F., Bourriane, T., Deroubaix, A., Sellegri, K., Borrmann, S., Coe, H., Flamant, C., Knippertz, P., and Schwarzenboeck, A.: Assessing the role of anthropogenic and biogenic sources on PM1 over southern West Africa using aircraft measurements, Atmos. Chem. Phys., 18, 757–772, https://doi.org/10.5194/acp-18-757-2018, 2018.
Bryant, D. J., Nelson, B. S., Swift, S. J., Budisulistiorini, S. H., Drysdale, W. S., Vaughan, A. R., Newland, M. J., Hopkins, J. R., Cash, J. M., Langford, B., Nemitz, E., Acton, W. J. F., Hewitt, C. N., Mandal, T., Gurjar, B. R., Shivani, Gadi, R., Lee, J. D., Rickard, A. R., and Hamilton, J. F.: Biogenic and anthropogenic sources of isoprene and monoterpenes and their secondary organic aerosol in Delhi, India, Atmos. Chem. Phys., 23, 61–83, https://doi.org/10.5194/acp-23-61-2023, 2023.
Byron, J., Kreuzwieser, J., Purser, G., van Haren, J., Ladd, S. N., Meredith, L. K., Werner, C., and Williams, J.: Chiral monoterpenes reveal forest emission mechanisms and drought responses, Nature, 609, 307–312, https://doi.org/10.1038/s41586-022-05020-5, 2022.
Capes, G., Murphy, J. G., Reeves, C. E., McQuaid, J. B., Hamilton, J. F., Hopkins, J. R., Crosier, J., Williams, P. I., and Coe, H.: Secondary organic aerosol from biogenic VOCs over West Africa during AMMA, Atmos. Chem. Phys., 9, 3841–3850, https://doi.org/10.5194/acp-9-3841-2009, 2009.
Ciccioli, P., Silibello, C., Finardi, S., Pepe, N., Ciccioli, P., Rapparini, F., Neri, L., Fares, S., Brilli, F., Mircea, M., Magliulo, E., and Baraldi, R.: The potential impact of biogenic volatile organic compounds (BVOCs) from terrestrial vegetation on a Mediterranean area using two different emission models, Agric. For. Meteorol., 328, 109255, https://doi.org/10.1016/j.agrformet.2022.109255, 2023.
Civan, M. Y., Elbir, T., Seyfioglu, R., Kuntasal, Ö. O., Bayram, A., Doğan, G., Yurdakul, S., Andiç, Ö., Müezzinoğlu, A., Sofuoglu, S. C., Pekey, H., Pekey, B., Bozlaker, A., Odabasi, M., and Tuncel, G.: Spatial and temporal variations in atmospheric VOCs, NO2, SO2, and O3 concentrations at a heavily industrialized region in Western Turkey, and assessment of the carcinogenic risk levels of benzene, Atmos. Environ., 103, 102–113, https://doi.org/10.1016/j.atmosenv.2014.12.031, 2015.
Das, A., Giri, B. S., and Manjunatha, R.: Systematic review on benzene, toluene, ethylbenzene, and xylene (BTEX) emissions; health impact assessment; and detection techniques in oil and natural gas operations, Environmental Science and Pollution Research, 32, 1–22, https://doi.org/10.1007/s11356-024-35698-1, 2024.
Debevec, C., Sauvage, S., Gros, V., Sciare, J., Pikridas, M., Stavroulas, I., Salameh, T., Leonardis, T., Gaudion, V., Depelchin, L., Fronval, I., Sarda-Esteve, R., Baisnée, D., Bonsang, B., Savvides, C., Vrekoussis, M., and Locoge, N.: Origin and variability in volatile organic compounds observed at an Eastern Mediterranean background site (Cyprus), Atmos. Chem. Phys., 17, 11355–11388, https://doi.org/10.5194/acp-17-11355-2017, 2017.
Debevec, C., Sauvage, S., Gros, V., Sellegri, K., Sciare, J., Pikridas, M., Stavroulas, I., Leonardis, T., Gaudion, V., Depelchin, L., Fronval, I., Sarda-Esteve, R., Baisnée, D., Bonsang, B., Savvides, C., Vrekoussis, M., and Locoge, N.: Driving parameters of biogenic volatile organic compounds and consequences on new particle formation observed at an eastern Mediterranean background site, Atmos. Chem. Phys., 18, 14297–14325, https://doi.org/10.5194/acp-18-14297-2018, 2018.
Department of Meteorology (Cyprus): Ministry of Agriculture, Rural Development and Environment, 15 July 2024, Monthly Weather Report: The Weather in June 2024, https://www.dom.org.cy/CLIMATOLOGY/English/Monthly%20Weather%20Bulletin/2024/06_Monthly%20Weather%20Report_Jun2024_ENG.pdf (last access: 10 January 2026), 2024.
Derstroff, B., Hüser, I., Bourtsoukidis, E., Crowley, J. N., Fischer, H., Gromov, S., Harder, H., Janssen, R. H. H., Kesselmeier, J., Lelieveld, J., Mallik, C., Martinez, M., Novelli, A., Parchatka, U., Phillips, G. J., Sander, R., Sauvage, C., Schuladen, J., Stönner, C., Tomsche, L., and Williams, J.: Volatile organic compounds (VOCs) in photochemically aged air from the eastern and western Mediterranean, Atmos. Chem. Phys., 17, 9547–9566, https://doi.org/10.5194/acp-17-9547-2017, 2017.
Deschaseaux, E. S. M., Swan, H. B., Maher, D. T., Jones, G. B., Schulz, K. G., Koveke, E. P., Toda, K., and Eyre, B. D.: The Interplay Between Dimethyl Sulfide (DMS) and Methane (CH4) in a Coral Reef Ecosystem, Front. Mar. Sci., 9, https://doi.org/10.3389/fmars.2022.910441, 2022.
Desservettaz, M., Pikridas, M., Stavroulas, I., Bougiatioti, A., Liakakou, E., Hatzianastassiou, N., Sciare, J., Mihalopoulos, N., and Bourtsoukidis, E.: Emission of volatile organic compounds from residential biomass burning and their rapid chemical transformations, Science of the Total Environment, 903, 166592, https://doi.org/10.1016/j.scitotenv.2023.166592, 2023.
Desservettaz, M., Christodoulou, A., Garg, A., Savvides, C., and Bourtsoukidis, E.: Multiyear observations of VOCs in Cyprus, Zenodo [data set], https://doi.org/10.5281/zenodo.17483541, 2025.
Deot, N., Kanawade, V. P., Papetta, A., Baalbaki, R., Pikridas, M., Marenco, F., Kulmala, M., Sciare, J., Lehtipalo, K., and Jokinen, T.: Effect of planetary boundary layer evolution on new particle formation events over Cyprus, Aerosol Research, 3, 139–154, https://doi.org/10.5194/ar-3-139-2025, 2025.
Dimitriou, K. and Kassomenos, P.: Background concentrations of benzene, potential long range transport influences and corresponding cancer risk in four cities of central Europe, in relation to air mass origination, J. Environ. Manage., 262, 110374, https://doi.org/10.1016/j.jenvman.2020.110374, 2020.
Dorokhov, Y. L., Sheshukova, E. V., and Komarova, T. V.: Methanol in Plant Life, Front. Plant. Sci., 9, https://doi.org/10.3389/fpls.2018.01623, 2018.
Draxler, R. R. and Hess, G. D.: Description of the HYSPLIT_4 modeling system, NOAA Tech. Memo., ERL ARL-224, NOAA Air Resources Laboratory, Silver Spring, MD, 24 pp., https://www.arl.noaa.gov/documents/reports/arl-224.pdf (last access: 17 February 2026), 1997.
Edtbauer, A., Stönner, C., Pfannerstill, E. Y., Berasategui, M., Walter, D., Crowley, J. N., Lelieveld, J., and Williams, J.: A new marine biogenic emission: methane sulfonamide (MSAM), dimethyl sulfide (DMS), and dimethyl sulfone (DMSO2) measured in air over the Arabian Sea, Atmos. Chem. Phys., 20, 6081–6094, https://doi.org/10.5194/acp-20-6081-2020, 2020.
Ehn, M., Thornton, J. A., Kleist, E., Sipilä, M., Junninen, H., Pullinen, I., Springer, M., Rubach, F., Tillmann, R., Lee, B., Lopez-Hilfiker, F., Andres, S., Acir, I.-H., Rissanen, M., Jokinen, T., Schobesberger, S., Kangasluoma, J., Kontkanen, J., Nieminen, T., Kurtén, T., Nielsen, L. B., Jørgensen, S., Kjaergaard, H. G., Canagaratna, M., Maso, M. D., Berndt, T., Petäjä, T., Wahner, A., Kerminen, V.-M., Kulmala, M., Worsnop, D. R., Wildt, J., and Mentel, T. F.: A large source of low-volatility secondary organic aerosol, Nature, 506, 476–479, https://doi.org/10.1038/nature13032, 2014.
Emekwuru, N. and Ejohwomu, O.: Temperature, Humidity and Air Pollution Relationships during a Period of Rainy and Dry Seasons in Lagos, West Africa, Climate, 11, 113, https://doi.org/10.3390/cli11050113, 2023.
European Forest Fire Information System (EFFIS): Copernicus Emergency Management Service: Annual fire reports, European Commission, https://forest-fire.emergency.copernicus.eu/reports-and-publications/annual-fire-reports, last access: 27 November 2025.
Fortunati, A., Barta, C., Brilli, F., Centritto, M., Zimmer, I., Schnitzler, J., and Loreto, F.: Isoprene emission is not temperature-dependent during and after severe drought-stress: a physiological and biochemical analysis, The Plant Journal, 55, 687–697, https://doi.org/10.1111/j.1365-313X.2008.03538.x, 2008.
Ge, Y., Solberg, S., Heal, M. R., Reimann, S., van Caspel, W., Hellack, B., Salameh, T., and Simpson, D.: Evaluation of modelled versus observed non-methane volatile organic compounds at European Monitoring and Evaluation Programme sites in Europe, Atmos. Chem. Phys., 24, 7699–7729, https://doi.org/10.5194/acp-24-7699-2024, 2024.
Gelencsér, A., Siszler, K., and Hlavay, J.: Toluene-Benzene Concentration Ratio as a Tool for Characterizing the Distance from Vehicular Emission Sources, Environ. Sci. Technol., 31, 2869–2872, https://doi.org/10.1021/es970004c, 1997.
Genard-Zielinski, A.-C., Boissard, C., Fernandez, C., Kalogridis, C., Lathière, J., Gros, V., Bonnaire, N., and Ormeño, E.: Variability of BVOC emissions from a Mediterranean mixed forest in southern France with a focus on Quercus pubescens, Atmos. Chem. Phys., 15, 431–446, https://doi.org/10.5194/acp-15-431-2015, 2015.
Georgiou, G. K., Kushta, J., Christoudias, T., Proestos, Y., and Lelieveld, J.: Air quality modelling over the Eastern Mediterranean: Seasonal sensitivity to anthropogenic emissions, Atmos. Environ., 222, 117119, https://doi.org/10.1016/j.atmosenv.2019.117119, 2020.
Georgiou, G. K., Christoudias, T., Proestos, Y., Kushta, J., Pikridas, M., Sciare, J., Savvides, C., and Lelieveld, J.: Evaluation of WRF-Chem model (v3.9.1.1) real-time air quality forecasts over the Eastern Mediterranean, Geosci. Model Dev., 15, 4129–4146, https://doi.org/10.5194/gmd-15-4129-2022, 2022.
Germain-Piaulenne, E., Paris, J.-D., Gros, V., Quéhé, P.-Y., Pikridas, M., Baisnée, D., Berchet, A., Sciare, J., and Bourtsoukidis, E.: Middle East oil and gas methane emissions signature captured at a remote site using light hydrocarbon tracers, Atmos. Environ. X, 22, 100253, https://doi.org/10.1016/j.aeaoa.2024.100253, 2024.
Gjesteland, I., Hollund, B. E., Kirkeleit, J., Daling, P. S., Sørheim, K. R., and Bråtveit, M.: Determinants of airborne benzene evaporating from fresh crude oils released into seawater, Mar. Pollut. Bull., 140, 395–402, https://doi.org/10.1016/j.marpolbul.2018.12.045, 2019.
Gu, S., Guenther, A., and Faiola, C.: Effects of Anthropogenic and Biogenic Volatile Organic Compounds on Los Angeles Air Quality, Environ. Sci. Technol., 55, 12191–12201, https://doi.org/10.1021/acs.est.1c01481, 2021.
Guenther, A. B., Jiang, X., Heald, C. L., Sakulyanontvittaya, T., Duhl, T., Emmons, L. K., and Wang, X.: The Model of Emissions of Gases and Aerosols from Nature version 2.1 (MEGAN2.1): an extended and updated framework for modeling biogenic emissions, Geosci. Model Dev., 5, 1471–1492, https://doi.org/10.5194/gmd-5-1471-2012, 2012.
Guo, H., Ling, Z. H., Simpson, I. J., Blake, D. R., and Wang, D. W.: Observations of isoprene, methacrolein (MAC) and methyl vinyl ketone (MVK) at a mountain site in Hong Kong, Journal of Geophysical Research: Atmospheres, 117, https://doi.org/10.1029/2012JD017750, 2012.
Holzinger, R., Williams, J., Salisbury, G., Klüpfel, T., de Reus, M., Traub, M., Crutzen, P. J., and Lelieveld, J.: Oxygenated compounds in aged biomass burning plumes over the Eastern Mediterranean: evidence for strong secondary production of methanol and acetone, Atmos. Chem. Phys., 5, 39–46, https://doi.org/10.5194/acp-5-39-2005, 2005.
Huang, X.-F., Zhang, B., Xia, S.-Y., Han, Y., Wang, C., Yu, G.-H., and Feng, N.: Sources of oxygenated volatile organic compounds (OVOCs) in urban atmospheres in North and South China, Environmental Pollution, 261, 114152, https://doi.org/10.1016/j.envpol.2020.114152, 2020.
Huangfu, Y., Yuan, B., Wang, S., Wu, C., He, X., Qi, J., de Gouw, J., Warneke, C., Gilman, J. B., Wisthaler, A., Karl, T., Graus, M., Jobson, B. T., and Shao, M.: Revisiting Acetonitrile as Tracer of Biomass Burning in Anthropogenic-Influenced Environments, Geophys. Res. Lett., 48, https://doi.org/10.1029/2020GL092322, 2021.
Kajos, M. K., Rantala, P., Hill, M., Hellén, H., Aalto, J., Patokoski, J., Taipale, R., Hoerger, C. C., Reimann, S., Ruuskanen, T. M., Rinne, J., and Petäjä, T.: Ambient measurements of aromatic and oxidized VOCs by PTR-MS and GC-MS: intercomparison between four instruments in a boreal forest in Finland, Atmos. Meas. Tech., 8, 4453–4473, https://doi.org/10.5194/amt-8-4453-2015, 2015.
Kalogridis, C., Gros, V., Sarda-Esteve, R., Langford, B., Loubet, B., Bonsang, B., Bonnaire, N., Nemitz, E., Genard, A.-C., Boissard, C., Fernandez, C., Ormeño, E., Baisnée, D., Reiter, I., and Lathière, J.: Concentrations and fluxes of isoprene and oxygenated VOCs at a French Mediterranean oak forest, Atmos. Chem. Phys., 14, 10085–10102, https://doi.org/10.5194/acp-14-10085-2014, 2014.
Kaltsonoudis, C., Kostenidou, E., Florou, K., Psichoudaki, M., and Pandis, S. N.: Temporal variability and sources of VOCs in urban areas of the eastern Mediterranean, Atmos. Chem. Phys., 16, 14825–14842, https://doi.org/10.5194/acp-16-14825-2016, 2016.
Kamal, M. S., Razzak, S. A., and Hossain, M. M.: Catalytic oxidation of volatile organic compounds (VOCs) – A review, Atmos. Environ., 140, 117–134, https://doi.org/10.1016/j.atmosenv.2016.05.031, 2016.
Kiendler-Scharr, A., Wildt, J., Maso, M. D., Hohaus, T., Kleist, E., Mentel, T. F., Tillmann, R., Uerlings, R., Schurr, U., and Wahner, A.: New particle formation in forests inhibited by isoprene emissions, Nature, 461, 381–384, https://doi.org/10.1038/nature08292, 2009.
Kleanthous, S., Vrekoussis, M., Mihalopoulos, N., Kalabokas, P., and Lelieveld, J.: On the temporal and spatial variation of ozone in Cyprus, Science of the Total Environment, 476–477, 677–687, https://doi.org/10.1016/j.scitotenv.2013.12.101, 2014.
Knote, C., Hodzic, A., and Jimenez, J. L.: The effect of dry and wet deposition of condensable vapors on secondary organic aerosols concentrations over the continental US, Atmos. Chem. Phys., 15, 1–18, https://doi.org/10.5194/acp-15-1-2015, 2015a.
Knote, C., Tuccella, P., Curci, G., Emmons, L. K., Orlando, J. J., Madronich, S., Baró, R., Jiménez Guerrero, P., Luecken, D., Hogrefe, C., Forkel, R., Werhahn, J., Hirtl, M., Pérez, J. L., San José, R., Giordano, L., Brunner, D., Yahya, K., and Zhang, Y.: Influence of the choice of gas-phase mechanism on predictions of key gaseous pollutants during the AQMEII phase-2 intercomparison, Atmos. Environ., 115, 553–568, https://doi.org/10.1016/j.atmosenv.2014.11.066, 2015b.
Koppmann, R. (Ed.): Volatile Organic Compounds in the Atmosphere, Wiley, https://doi.org/10.1002/9780470988657, 2007.
Koppmann, R.: Chemistry of Volatile Organic Compounds in the Atmosphere, in: Hydrocarbons, Oils and Lipids: Diversity, Origin, Chemistry and Fate, Springer International Publishing, Cham, 811–822, https://doi.org/10.1007/978-3-319-90569-3_24, 2020.
Koppmann, R., von Czapiewski, K., and Reid, J. S.: A review of biomass burning emissions, part I: gaseous emissions of carbon monoxide, methane, volatile organic compounds, and nitrogen containing compounds, Atmos. Chem. Phys. Discuss., 5, 10455–10516, https://doi.org/10.5194/acpd-5-10455-2005, 2005.
Lazoglou, G., Hadjinicolaou, P., Sofokleous, I., Bruggeman, A., and Zittis, G.: Climate change and extremes in the Mediterranean island of Cyprus: from historical trends to future projections, Environ. Res. Commun., 6, 095020, https://doi.org/10.1088/2515-7620/ad7927, 2024.
Lee, J. D., Squires, F. A., Sherwen, T., Wilde, S. E., Cliff, S. J., Carpenter, L. J., Hopkins, J. R., Bauguitte, S. J., Reed, C., Barker, P., Allen, G., Bannan, T. J., Matthews, E., Mehra, A., Percival, C., Heard, D. E., Whalley, L. K., Ronnie, G. V., Seldon, S., Ingham, T., Keller, C. A., Knowland, K. E., Nisbet, E. G., and Andrews, S.: Ozone production and precursor emission from wildfires in Africa, Environmental Science: Atmospheres, 1, 524–542, https://doi.org/10.1039/D1EA00041A, 2021.
Legreid, G., Balzani Lööv, J., Staehelin, J., Hueglin, C., Hill, M., Buchmann, B., Prevot, A. S. H., and Reimann, S.: Oxygenated volatile organic compounds (OVOCs) at an urban background site in Zürich (Europe): seasonal variation and source allocation, Atmos. Environ., 41, 8409–8423, https://doi.org/10.1016/j.atmosenv.2007.07.026, 2007.
Lelieveld, J., Berresheim, H., Borrmann, S., Crutzen, P. J., Dentener, F. J., Fischer, H., Feichter, J., Flatau, P. J., Heland, J., Holzinger, R., Korrmann, R., Lawrence, M. G., Levin, Z., Markowicz, K. M., Mihalopoulos, N., Minikin, A., Ramanathan, V., de Reus, M., Roelofs, G. J., Scheeren, H. A., Sciare, J., Schlager, H., Schultz, M., Siegmund, P., Steil, B., Stephanou, E. G., Stier, P., Traub, M., Warneke, C., Williams, J., and Ziereis, H.: Global Air Pollution Crossroads over the Mediterranean, Science, 298, 794–799, https://doi.org/10.1126/science.1075457, 2002.
Lelieveld, J., Proestos, Y., Hadjinicolaou, P., Tanarhte, M., Tyrlis, E., and Zittis, G.: Strongly increasing heat extremes in the Middle East and North Africa (MENA) in the 21st century, Climatic Change, 137, 245–260, https://doi.org/10.1007/s10584-016-1665-6, 2016
Liakakou, E., Vrekoussis, M., Bonsang, B., Donousis, C., Kanakidou, M., and Mihalopoulos, N.: Isoprene above the Eastern Mediterranean: Seasonal variation and contribution to the oxidation capacity of the atmosphere, Atmos. Environ., 41, 1002–1010, https://doi.org/10.1016/j.atmosenv.2006.09.034, 2007.
Liakakou, E., Bonsang, B., Williams, J., Kalivitis, N., Kanakidou, M., and Mihalopoulos, N.: C2–C8 NMHCs over the Eastern Mediterranean: Seasonal variation and impact on regional oxidation chemistry, Atmos. Environ., 43, 5611–5621, https://doi.org/10.1016/j.atmosenv.2009.07.067, 2009.
Liu, Y., Shao, M., Kuster, W. C., Goldan, P. D., Li, X., Lu, S., and Gouw, J. A. de: Source Identification of Reactive Hydrocarbons and Oxygenated VOCs in the Summertime in Beijing, Environ. Sci. Technol., 43, 75–81, https://doi.org/10.1021/es801716n, 2009.
Matthew, O. J.: Estimation of diurnal patterns of global solar radiation, temperature, relative humidity and wind speed from daily datasets at a humid tropical location, Agric. For. Meteorol., 322, 109003, https://doi.org/10.1016/j.agrformet.2022.109003, 2022.
Mecca, M., Todaro, L., D'Auria, M., Italiano, S. S. P., Sofo, A., and Ripullone, F.: Volatile Organic Compounds (VOCs) in Mediterranean Oak Forests of Hungarian Oak (Quercus frainetto Ten) Affected by Dieback Phenomena, Forests, 15, 1072, https://doi.org/10.3390/f15061072, 2024.
Mellouki, A., Wallington, T. J., and Chen, J.: Atmospheric Chemistry of Oxygenated Volatile Organic Compounds: Impacts on Air Quality and Climate, Chem. Rev., 115, 3984–4014, https://doi.org/10.1021/cr500549n, 2015.
Meusel, H., Kuhn, U., Reiffs, A., Mallik, C., Harder, H., Martinez, M., Schuladen, J., Bohn, B., Parchatka, U., Crowley, J. N., Fischer, H., Tomsche, L., Novelli, A., Hoffmann, T., Janssen, R. H. H., Hartogensis, O., Pikridas, M., Vrekoussis, M., Bourtsoukidis, E., Weber, B., Lelieveld, J., Williams, J., Pöschl, U., Cheng, Y., and Su, H.: Daytime formation of nitrous acid at a coastal remote site in Cyprus indicating a common ground source of atmospheric HONO and NO, Atmos. Chem. Phys., 16, 14475–14493, https://doi.org/10.5194/acp-16-14475-2016, 2016.
Misztal, P. K., Hewitt, C. N., Wildt, J., Blande, J. D., Eller, A. S. D., Fares, S., Gentner, D. R., Gilman, J. B., Graus, M., Greenberg, J., Guenther, A. B., Hansel, A., Harley, P., Huang, M., Jardine, K., Karl, T., Kaser, L., Keutsch, F. N., Kiendler-Scharr, A., Kleist, E., Lerner, B. M., Li, T., Mak, J., Nölscher, A. C., Schnitzhofer, R., Sinha, V., Thornton, B., Warneke, C., Wegener, F., Werner, C., Williams, J., Worton, D. R., Yassaa, N., and Goldstein, A. H.: Atmospheric benzenoid emissions from plants rival those from fossil fuels, Sci. Rep., 5, 12064, https://doi.org/10.1038/srep12064, 2015.
Monson, R. K., Jaeger, C. H., Adams, W. W., Driggers, E. M., Silver, G. M., and Fall, R.: Relationships among Isoprene Emission Rate, Photosynthesis, and Isoprene Synthase Activity as Influenced by Temperature, Plant Physiol., 98, 1175–1180, https://doi.org/10.1104/pp.98.3.1175, 1992.
Morichetti, M., Madronich, S., Passerini, G., Rizza, U., Mancinelli, E., Virgili, S., and Barth, M.: Comparison and evaluation of updates to WRF-Chem (v3.9) biogenic emissions using MEGAN, Geosci. Model Dev., 15, 6311–6339, https://doi.org/10.5194/gmd-15-6311-2022, 2022.
Mukherjee, S., Pandithurai, G., Waghmare, V., Mahajan, A. S., Tinel, L., Aslam, M. Y., Meena, G. S., Patil, S., Buchunde, P., and Kumar, A.: Seasonal variability of volatile organic compounds (VOCs) at a high-altitude station in the Western Ghats, India: Influence of biogenic, anthropogenic emissions and long-range transport, Atmos. Environ., 331, 120598, https://doi.org/10.1016/j.atmosenv.2024.120598, 2024.
Pagonis, D., Sekimoto, K., and de Gouw, J.: A Library of Proton-Transfer Reactions of H 3O+ Ions Used for Trace Gas Detection, J. Am. Soc. Mass Spectrom., 30, 1330–1335, https://doi.org/10.1007/s13361-019-02209-3, 2019.
Panopoulou, A., Liakakou, E., Gros, V., Sauvage, S., Locoge, N., Bonsang, B., Psiloglou, B. E., Gerasopoulos, E., and Mihalopoulos, N.: Non-methane hydrocarbon variability in Athens during wintertime: the role of traffic and heating, Atmos. Chem. Phys., 18, 16139–16154, https://doi.org/10.5194/acp-18-16139-2018, 2018.
Panopoulou, A., Liakakou, E., Sauvage, S., Gros, V., Locoge, N., Stavroulas, I., Bonsang, B., Gerasopoulos, E., and Mihalopoulos, N.: Yearlong measurements of monoterpenes and isoprene in a Mediterranean city (Athens): Natural vs anthropogenic origin, Atmos. Environ., 243, 117803, https://doi.org/10.1016/j.atmosenv.2020.117803, 2020.
Paton-Walsh, C., Wilson, S. R., Jones, N. B., and Griffith, D. W. T.: Measurement of methanol emissions from Australian wildfires by ground-based solar Fourier transform spectroscopy, Geophys. Res. Lett., 35, https://doi.org/10.1029/2007GL032951, 2008.
Pennington, E. A., Seltzer, K. M., Murphy, B. N., Qin, M., Seinfeld, J. H., and Pye, H. O. T.: Modeling secondary organic aerosol formation from volatile chemical products, Atmos. Chem. Phys., 21, 18247–18261, https://doi.org/10.5194/acp-21-18247-2021, 2021.
Peñuelas, J. and Staudt, M.: BVOCs and global change, Trends Plant Sci., 15, 133–144, https://doi.org/10.1016/j.tplants.2009.12.005, 2010.
Pérez, I. A., García, M. Á., Sánchez, M. L., Pardo, N., and Fernández-Duque, B.: Key Points in Air Pollution Meteorology, Int. J. Environ. Res. Public Health, 17, 8349, https://doi.org/10.3390/ijerph17228349, 2020.
Perrone, M. G., Carbone, C., Faedo, D., Ferrero, L., Maggioni, A., Sangiorgi, G., and Bolzacchini, E.: Exhaust emissions of polycyclic aromatic hydrocarbons, n-alkanes and phenols from vehicles coming within different European classes, Atmos. Environ., 82, 391–400, https://doi.org/10.1016/j.atmosenv.2013.10.040, 2014.
Pikridas, M., Vrekoussis, M., Sciare, J., Kleanthous, S., Vasiliadou, E., Kizas, C., Savvides, C., and Mihalopoulos, N.: Spatial and temporal (short and long-term) variability of submicron, fine and sub-10 µm particulate matter (PM1, PM2.5, PM10) in Cyprus, Atmos. Environ., 191, 79–93, https://doi.org/10.1016/j.atmosenv.2018.07.048, 2018.
Pinthong, N., Thepanondh, S., and Kondo, A.: Source Identification of VOCs and their Environmental Health Risk in a Petrochemical Industrial Area, Aerosol Air Qual. Res., 22, 210064, https://doi.org/10.4209/aaqr.210064, 2022.
Pochanart, P., Akimoto, H., Kajii, Y., Potemkin, V. M., and Khodzher, T. V.: Regional background ozone and carbon monoxide variations in remote Siberia/East Asia, Journal of Geophysical Research: Atmospheres, 108, https://doi.org/10.1029/2001JD001412, 2003.
Potosnak, M. J., LeStourgeon, L., Pallardy, S. G., Hosman, K. P., Gu, L., Karl, T., Geron, C., and Guenther, A. B.: Observed and modeled ecosystem isoprene fluxes from an oak-dominated temperate forest and the influence of drought stress, Atmos. Environ., 84, 314–322, https://doi.org/10.1016/j.atmosenv.2013.11.055, 2014.
Pugliese, G., Ingrisch, J., Meredith, L. K., Pfannerstill, E. Y., Klüpfel, T., Meeran, K., Byron, J., Purser, G., Gil-Loaiza, J., van Haren, J., Dontsova, K., Kreuzwieser, J., Ladd, S. N., Werner, C., and Williams, J.: Effects of drought and recovery on soil volatile organic compound fluxes in an experimental rainforest, Nat. Commun., 14, 5064, https://doi.org/10.1038/s41467-023-40661-8, 2023.
Robles, H.: Acetonitrile, in: Encyclopedia of Toxicology, Elsevier, 28–30, https://doi.org/10.1016/B0-12-369400-0/00015-6, 2005.
Salisbury, G., Williams, J., Holzinger, R., Gros, V., Mihalopoulos, N., Vrekoussis, M., Sarda-Estève, R., Berresheim, H., von Kuhlmann, R., Lawrence, M., and Lelieveld, J.: Ground-based PTR-MS measurements of reactive organic compounds during the MINOS campaign in Crete, July–August 2001, Atmos. Chem. Phys., 3, 925–940, https://doi.org/10.5194/acp-3-925-2003, 2003.
Schaap, M., Otjes, R. P., and Weijers, E. P.: Illustrating the benefit of using hourly monitoring data on secondary inorganic aerosol and its precursors for model evaluation, Atmos. Chem. Phys., 11, 11041–11053, https://doi.org/10.5194/acp-11-11041-2011, 2011.
Schieweck, A., Uhde, E., and Salthammer, T.: Determination of acrolein in ambient air and in the atmosphere of environmental test chambers, Environ. Sci. Process Impacts, 23, 1729–1746, https://doi.org/10.1039/D1EM00221J, 2021.
Sciare, J.: The Agia Marina Xyliatou Observatory: A remote supersite in Cyprus to monitor changes in the atmospheric composition of the Eastern Mediterranean and the Middle East, in: EGU General Assembly Conference Abstracts, https://meetingorganizer.copernicus.org/EGU2016/EGU2016-11493.pdf (last access: 17 February 2026), 2016.
Seco, R., Peñuelas, J., Filella, I., Llusià, J., Molowny-Horas, R., Schallhart, S., Metzger, A., Müller, M., and Hansel, A.: Contrasting winter and summer VOC mixing ratios at a forest site in the Western Mediterranean Basin: the effect of local biogenic emissions, Atmos. Chem. Phys., 11, 13161–13179, https://doi.org/10.5194/acp-11-13161-2011, 2011.
Sicre, M. A., Marty, J. C., Saliot, A., Aparicio, X., Grimalt, J., and Albaiges, J.: Aliphatic and Aromatic Hydrocarbons in the Mediterranean Aerosol, Int. J. Environ. Anal. Chem., 29, 73–94, https://doi.org/10.1080/03067318708078412, 1987.
Sindelarova, K., Granier, C., Bouarar, I., Guenther, A., Tilmes, S., Stavrakou, T., Müller, J.-F., Kuhn, U., Stefani, P., and Knorr, W.: Global data set of biogenic VOC emissions calculated by the MEGAN model over the last 30 years, Atmos. Chem. Phys., 14, 9317–9341, https://doi.org/10.5194/acp-14-9317-2014, 2014.
Song, W., Williams, J., Yassaa, N., Martinez, M., Carnero, J. A. A., Hidalgo, P. J., Bozem, H., and Lelieveld, J.: Winter and summer characterization of biogenic enantiomeric monoterpenes and anthropogenic BTEX compounds at a Mediterranean Stone Pine forest site, J. Atmos. Chem., 68, 233–250, https://doi.org/10.1007/s10874-012-9219-4, 2011.
Soukissian, T. and Sotiriou, M.-A.: Long-Term Variability of Wind Speed and Direction in the Mediterranean Basin, Wind, 2, 513–534, https://doi.org/10.3390/wind2030028, 2022.
Stein, A. F., Draxler, R. R., Rolph, G. D., Stunder, B. J. B., Cohen, M. D., and Ngan, F.: NOAA's HYSPLIT Atmospheric Transport and Dispersion Modeling System, Bull. Am. Meteorol. Soc., 96, 2059–2077, https://doi.org/10.1175/BAMS-D-14-00110.1, 2015.
Stockwell, W. R., Kirchner, F., Kuhn, M., and Seefeld, S.: A new mechanism for regional atmospheric chemistry modeling, Journal of Geophysical Research: Atmospheres, 102, 25847–25879, https://doi.org/10.1029/97JD00849, 1997.
Strada, S., Pozzer, A., Giuliani, G., Coppola, E., Solmon, F., Jiang, X., Guenther, A., Bourtsoukidis, E., Serça, D., Williams, J., and Giorgi, F.: Assessment of isoprene and near-surface ozone sensitivities to water stress over the Euro-Mediterranean region, Atmos. Chem. Phys., 23, 13301–13327, https://doi.org/10.5194/acp-23-13301-2023, 2023.
Thunis, P., Crippa, M., Cuvelier, C., Guizzardi, D., de Meij, A., Oreggioni, G., and Pisoni, E.: Sensitivity of air quality modelling to different emission inventories: a case study over Europe, Atmos. Environ. X, 10, 100111, 2021.
Tiwari, V., Hanai, Y., and Masunaga, S.: Ambient levels of volatile organic compounds in the vicinity of petrochemical industrial area of Yokohama, Japan, Air Qual. Atmos. Health, 3, 65–75, https://doi.org/10.1007/s11869-009-0052-0, 2010.
Torres-Vinces, L., Contreras-Zarazua, G., Huerta-Rosas, B., Sánchez-Ramírez, E., and Segovia-Hernández, J. G.: Methyl Ethyl Ketone Production through an Intensified Process, Chem. Eng. Technol., 43, 1433–1441, https://doi.org/10.1002/ceat.201900664, 2020.
Traub, M., Fischer, H., de Reus, M., Kormann, R., Heland, H., Ziereis, H., Schlager, H., Holzinger, R., Williams, J., Warneke, C., de Gouw, J., and Lelieveld, J.: Chemical characteristics assigned to trajectory clusters during the MINOS campaign, Atmos. Chem. Phys., 3, 459–468, https://doi.org/10.5194/acp-3-459-2003, 2003.
Vlasenko, A., Macdonald, A. M., Sjostedt, S. J., and Abbatt, J. P. D.: Formaldehyde measurements by Proton transfer reaction – Mass Spectrometry (PTR-MS): correction for humidity effects, Atmos. Meas. Tech., 3, 1055–1062, https://doi.org/10.5194/amt-3-1055-2010, 2010.
Vrekoussis, M., Pikridas, M., Rousogenous, C., Christodoulou, A., Desservettaz, M., Sciare, J., Richter, A., Bougoudis, I., Savvides, C., and Papadopoulos, C.: Local and regional air pollution characteristics in Cyprus: A long-term trace gases observations analysis, Science of the Total Environment, 845, 157315, https://doi.org/10.1016/j.scitotenv.2022.157315, 2022.
Wang, H., Ma, X., Tan, Z., Wang, H., Chen, X., Chen, S., Gao, Y., Liu, Y., Liu, Y., Yang, X., Yuan, B., Zeng, L., Huang, C., Lu, K., and Zhang, Y.: Anthropogenic monoterpenes aggravating ozone pollution, Natl. Sci. Rev., 9, https://doi.org/10.1093/nsr/nwac103, 2022a.
Wang, H., Lu, X., Seco, R., Stavrakou, T., Karl, T., Jiang, X., Gu, L., and Guenther, A. B.: Modeling isoprene emission response to drought and heatwaves within MEGAN using evapotranspiration data and by coupling with the Community Land Model, J. Adv. Model. Earth Syst., 14, e2022MS003174, https://doi.org/10.1029/2022MS003174, 2022b.
Wang, L., Lun, X., Wang, Q., and Wu, J.: Biogenic volatile organic compounds emissions, atmospheric chemistry, and environmental implications: a review, Environ. Chem. Lett., 22, 3033–3058, https://doi.org/10.1007/s10311-024-01785-5, 2024.
Wang, N., Edtbauer, A., Stönner, C., Pozzer, A., Bourtsoukidis, E., Ernle, L., Dienhart, D., Hottmann, B., Fischer, H., Schuladen, J., Crowley, J. N., Paris, J.-D., Lelieveld, J., and Williams, J.: Measurements of carbonyl compounds around the Arabian Peninsula: overview and model comparison, Atmos. Chem. Phys., 20, 10807–10829, https://doi.org/10.5194/acp-20-10807-2020, 2020.
Wang, S., Yuan, B., Wu, C., Wang, C., Li, T., He, X., Huangfu, Y., Qi, J., Li, X.-B., Sha, Q., Zhu, M., Lou, S., Wang, H., Karl, T., Graus, M., Yuan, Z., and Shao, M.: Oxygenated volatile organic compounds (VOCs) as significant but varied contributors to VOC emissions from vehicles, Atmos. Chem. Phys., 22, 9703–9720, https://doi.org/10.5194/acp-22-9703-2022, 2022c.
Xu, Z., Zou, Q., Jin, L., Shen, Y., Shen, J., Xu, B., Qu, F., Zhang, F., Xu, J., Pei, X., Xie, G., Kuang, B., Huang, X., Tian, X., and Wang, Z.: Characteristics and sources of ambient Volatile Organic Compounds (VOCs) at a regional background site, YRD region, China: Significant influence of solvent evaporation during hot months, Science of the Total Environment, 857, 159674, https://doi.org/10.1016/j.scitotenv.2022.159674, 2023.
Yáñez-Serrano, A. M., Nölscher, A. C., Bourtsoukidis, E., Derstroff, B., Zannoni, N., Gros, V., Lanza, M., Brito, J., Noe, S. M., House, E., Hewitt, C. N., Langford, B., Nemitz, E., Behrendt, T., Williams, J., Artaxo, P., Andreae, M. O., and Kesselmeier, J.: Atmospheric mixing ratios of methyl ethyl ketone (2-butanone) in tropical, boreal, temperate and marine environments, Atmos. Chem. Phys., 16, 10965–10984, https://doi.org/10.5194/acp-16-10965-2016, 2016.
Yáñez-Serrano, A. M., Filella, I., LLusià, J., Gargallo-Garriga, A., Granda, V., Bourtsoukidis, E., Williams, J., Seco, R., Cappellin, L., Werner, C., de Gouw, J., and Peñuelas, J.: GLOVOCS – Master compound assignment guide for proton transfer reaction mass spectrometry users, Atmos. Environ., 244, 117929, https://doi.org/10.1016/j.atmosenv.2020.117929, 2021.
Yokelson, R. J., Goode, J. G., Ward, D. E., Susott, R. A., Babbitt, R. E., Wade, D. D., Bertschi, I., Griffith, D. W. T., and Hao, W. M.: Emissions of formaldehyde, acetic acid, methanol, and other trace gases from biomass fires in North Carolina measured by airborne Fourier transform infrared spectroscopy, Journal of Geophysical Research: Atmospheres, 104, 30109–30125, https://doi.org/10.1029/1999JD900817, 1999.
Yuan, Q., Zhang, Z., Chen, Y., Hui, L., Wang, M., Xia, M., Zou, Z., Wei, W., Ho, K. F., Wang, Z., Lai, S., Zhang, Y., Wang, T., and Lee, S.: Origin and transformation of volatile organic compounds at a regional background site in Hong Kong: Varied photochemical processes from different source regions, Science of the Total Environment, 908, 168316, https://doi.org/10.1016/j.scitotenv.2023.168316, 2024.
Zittis, G., Almazroui, M., Alpert, P., Ciais, P., Cramer, W., Dahdal, Y., Fnais, M., Francis, D., Hadjinicolaou, P., Howari, F., Jrrar, A., Kaskaoutis, D. G., Kulmala, M., Lazoglou, G., Mihalopoulos, N., Lin, X., Rudich, Y., Sciare, J., Stenchikov, G., Xoplaki, E., and Lelieveld, J.: Climate Change and Weather Extremes in the Eastern Mediterranean and Middle East, Reviews of Geophysics, 60, e2021RG000762, https://doi.org/10.1029/2021RG000762, 2022.