the Creative Commons Attribution 4.0 License.
the Creative Commons Attribution 4.0 License.
 | 03 Feb 2026
Evaluation of factors affecting total ozone column and its trend at three Antarctic stations in the years 2007–2023
David Tichopád
Kamil Láska
Tove Svendby
Klára Čížková
Andrea Pazmiño
Boyan Petkov
Ladislav Metelka
This study assesses trends in the total ozone column (TOC) and the atmospheric factors influencing ozone variability at three Antarctic stations (Marambio, Troll/Trollhaugen, and Concordia) from 2007 to 2023. Ground-based TOC measurements were used, supplemented by satellite observations from the Ozone Monitoring Instrument on NASA's Aura satellite. TOC trends were derived using a multiple linear regression model provided by the Long-term Ozone Trends and Uncertainties in the Stratosphere (LOTUS) project. The selected LOTUS model was able to explain 94 %–97 % of the TOC variability at all three stations. The regression analysis showed that ozone variability at these stations is mainly driven by the lower stratospheric temperature, eddy heat flux, and the Quasi-Biennial Oscillation. A statistically significant increasing trend was found at the Marambio station (3.43 ± 3.22 DU per decade), while statistically insignificant trends were detected at the other two stations. Using MERRA-2 reanalyses, the LOTUS model was applied to each grid point in the 40–90° S region, which effectively illustrates the spatial distribution of the impacts of individual predictors. It was found that warmer conditions in the Antarctic stratosphere in September 2019 caused TOC to be up to 100 DU higher than normal, especially over East Antarctica. The results improve understanding of regional TOC trends and how the Antarctic ozone layer responds to changes in ozone-depleting substances.
- Article
(6771 KB) - Full-text XML
-
Supplement
(1557 KB) - BibTeX
- EndNote


The stratospheric ozone layer is very important for life on Earth because it protects the biosphere from the harmful solar UV radiation (Brasseur and Solomon, 2005). The discovery of the Antarctic ozone hole (Chubachi, 1986; Farman et al., 1985; Solomon et al., 1986) has been important, demonstrating the need to protect the ozone layer and leading to the Vienna Convention in 1985 and the signing of the Montreal Protocol in 1987. Due to this successful international treaty, the emission of ozone-depleting substances (ODS), which are the sources of ozone-depleting active halogens in the stratosphere, began to decline (e.g., Solomon, 1999). In response to the reduction of ODS in the stratosphere, the total ozone column (TOC) is expected to recover globally. The ozone depletion is most severe at southern high latitudes, but in recent years, several studies (e.g., Solomon et al., 2016; Kuttippurath and Nair, 2017; Pazmiño et al., 2018; Weber et al., 2022) point out the possible onset of TOC recovery in Antarctic spring, especially in September. Despite the ongoing reduction in ODS concentrations, the magnitude of chemical ozone depletion over Antarctica can fluctuate significantly from year to year, depending on varying meteorological and dynamical conditions (Newman et al., 2006; Keeble et al., 2014; de Laat et al., 2017; Tully et al., 2019; Stone et al., 2021).
The strong, cold polar vortex is the main feature of the winter stratospheric circulation over Antarctica, which greatly affects the severity of the annual ozone depletion. The presence of the polar vortex causes the isolation of the Antarctic stratosphere from the surrounding air masses, creating unique chemical and dynamic conditions (Nash et al., 1996). Annually, the southern polar vortex forms during autumn, intensifies to its peak in mid-winter, and typically dissipates by November or December (Waugh and Polvani, 2010). Nevertheless, there have been instances of premature disruption; for example, in September 2019, a strong wave-1 disturbance developed in the southern stratosphere, triggering a sudden stratospheric warming (SSW) and an earlier breakdown of the polar vortex (Hendon et al., 2019; Eswaraiah et al., 2020; Yamazaki et al., 2020). Many studies, such as Schoeberl et al. (1996), Newman and Nash (2000), and Newman et al. (2006), stress the importance of the polar vortex properties in relation to the variability of the Antarctic ozone loss. Additional influences on the Antarctic stratosphere and ozone loss may come from events such as wildfires or volcanic eruptions. Known cases are, for example, the extensive fires observed in Australia at the turn of 2019 and 2020 (Salawitch and McBride, 2022) and the strong eruption of the Hunga Tonga-Hunga Ha'api volcano in mid-January 2022 (Fleming et al., 2024; Kozubek et al., 2024).
Antarctic ozone trends have been extensively studied recently (e.g. Weber et al., 2018, 2022; Pazmiño et al., 2023; Johnson et al., 2023; Fioletov et al., 2023). However, less attention has been paid so far to the regional variability of TOC and the atmospheric factors that influence ozone variability in the southern polar regions.
The purpose of this study is to assess the 2007–2023 trends in Antarctic TOC and the factors affecting it, using the novel Long-term Ozone Trends and Uncertainties in the Stratosphere (LOTUS) regression method applied to ground-based data from three Antarctic stations (Sect. 2). The set of regression predictors suitable for the southern high latitudes is defined in Sect. 3. Moreover, this study is the first to perform LOTUS regressions (SPARC/IO3C/GAW, 2019) for Antarctic stations and for each grid point in the 40–90° S region using MERRA-2 reanalyses (Sect. 4), leading to a better understanding of how the spatial patterns of total ozone column are affected by individual atmospheric predictors.
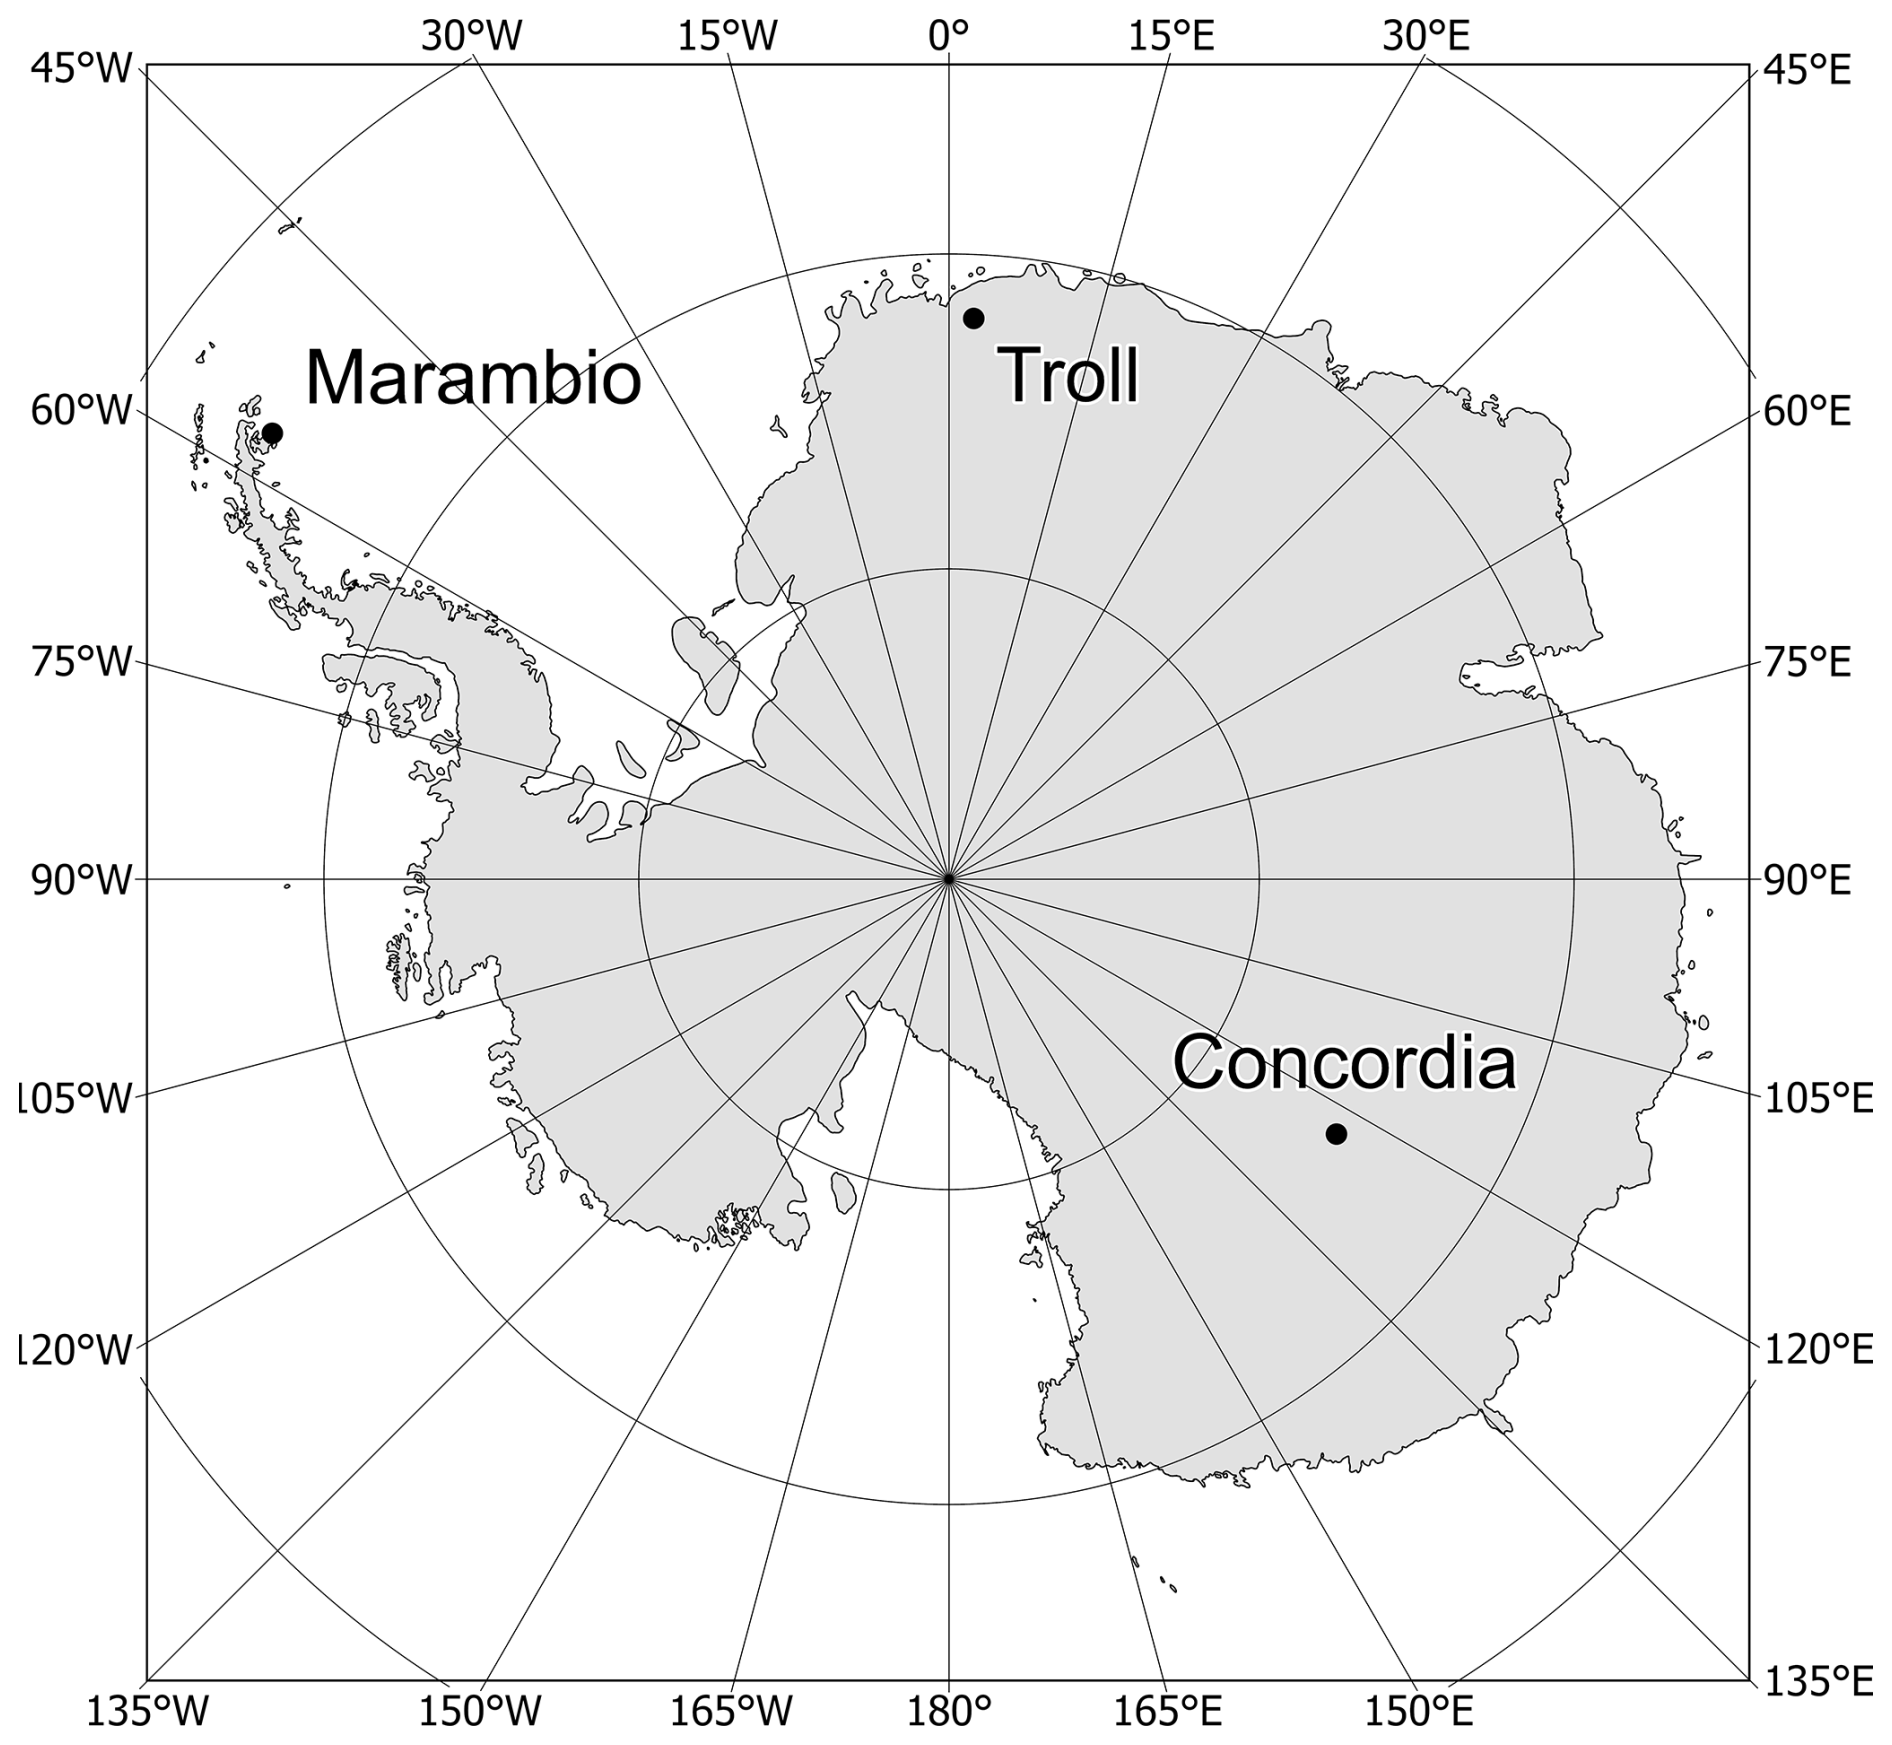
Figure 1Location of the three Antarctic stations used in this study.
2.1 Ground-based TOC data
This study analysed ground-based TOC measurements from three Antarctic stations: Marambio, Troll & Trollhaugen, and Concordia. Marambio station (64.14° S, 56.37° E, 196 m a.s.l.) is a permanent Argentine base established in 1969, situated on the ice-free Seymour Island within the Antarctic Peninsula region (Fig. 1). Daily TOC observations at Marambio were obtained using the B199 double-monochromator Brewer spectrophotometer over the period from February 2010 to January 2020, during which the instrument was operated jointly by the Czech Hydrometeorological Institute (CHMI) and the National Meteorological Service of Argentina (NMSI). To ensure the highest precision, only direct Sun measurements were utilized. The B199 instrument has a reported precision of up to 0.15 % (Scarnato et al., 2010). Calibration was performed regularly in accordance with international standards, following the procedures described in Čížková et al. (2023). The uncertainty associated with the temperature dependence of absorption coefficients and the choice of cross-section datasets remains small, typically below ∼1 % (e.g., Redondas et al., 2014), making any potential bias in the derived TOC time series negligible. The TOC was calculated using the ozone absorption cross-sections of Bass and Paur (1985).
Furthermore, daily TOC from the Troll station was used. Troll is Norway's only year-round research station in Antarctica, located in Jutulsessen, 235 km offshore in the eastern part of the Princess Martha Coast in Queen Maud Land, Antarctica. At the Troll station, data were obtained from the NILU-UV radiometer, which is a ground-based filter instrument with five UV channels at wavelengths centred around 302, 312, 320, 340, and 380 nm (Sztipanov et al., 2020). From 27 January 2007 to 19 January 2014, the NILU-UV radiometer, designated 015, was located at 72.01° S, 2.535° E (1270 m a.s.l.). On 30 January 2014, the instrument was moved to a new location at Trollhaugen, approximately 1 km from Troll and 1553 m a.s.l. However, in January 2015, technical problems with the filters in the NILU-UV led to a decrease in data reliability, and measurements with the instrument 015 were terminated on 11 May 2015. A new instrument (number 005) was installed on 24 November 2015 at the Trollhaugen site and has been in continuous operation since then (Sztipanov et al., 2020). For cloud-free conditions and SZA<70°, the overall uncertainty in NILU-UV is estimated to be ±5 % (Sztipanov et al., 2020). For SZA>70°, the impact of cloudiness, the vertical profile of ozone and temperature, the imperfect cosine response of the instrument, and the absolute calibration error will reduce the accuracy of the TOC values (Sztipanov et al., 2020; Kazantzidis et al., 2009). Detailed information on instrument calibration can be found in Sztipanov et al. (2020). Hereinafter, this station will be referred to as Troll.
The last station used in this study is Concordia, which is located at 3233 m a.s.l. on the Dome C in the Antarctic Plateau (Fig. 1). At the Concordia station, daily TOC was obtained using the SAOZ instrument (Système d'Analyse par Observation Zénithale, Pommereau and Goutail, 1988) located at 75.1° S, 124.4° E. TOC data from this instrument have been available since January 2007. This instrument is included in the International Network for the Detection of Atmospheric Composition Change (NDACC; De Mazière et al., 2018) and is also part of the French research infrastructure dedicated to aerosols, clouds, and trace gases (ACTRIS). The SAOZ is a passive remote-sensing instrument designed to detect sunlight scattered from the zenith sky. The SAOZ instrument uses Bogumil et al. (2003) ozone cross sections in the visible, where temperature dependency is practically negligible. The systematic uncertainties on the ozone absorption cross sections, considering slight dependence on temperature, are approximately 3 % in the SAOZ spectral range (Orphal, 2003). A complete budget estimation can be found in Hendrick et al. (2011). This allows for accurate monitoring of stratospheric constituents during twilight, both at sunrise and sunset, within a solar zenith angle (SZA) range of 86 to 91° (Hendrick et al., 2011; Pazmiño et al., 2023).
2.2 Satellite TOC data
To supplement the ground-based observations, the TOC product OMTO3 V003 derived from the Ozone Monitoring Instrument (OMI) overpass data was used (https://avdc.gsfc.nasa.gov/pub/data/satellite/Aura/OMI/V03/L2OVP/OMTO3/, last access: 15 July 2025). This TOC product is retrieved from the enhanced TOMS version-8 algorithm developed by NASA (Bhartia and Wellemeyer, 2002). Similar to Brewer spectrophotometers, this algorithm utilises the Bass-Paur ozone absorption cross-section (Bass and Paur, 1985). As seen from Fig. 2a–c, the ground-based TOC observations at remote Antarctic stations have numerous gaps in the record throughout the study period. Therefore, the missing daily TOC data were supplemented using the OMI satellite data. If a given month still had more than five missing values after the OMI data were added, it was not included in the analyses. Unlike the Troll and Concordia stations, which have been operating since 2007, the Marambio station only provided ground-based measurements between February 2010 and January 2020. Therefore, in order to maintain a consistent study period (2007–2023), TOC data between January 2007 and January 2010, and February 2020 and December 2023 were supplemented from OMI. A study by Čížková et al. (2019), which compared TOC from the B199 instrument and satellite data from OMI (OMTO3 product) in the period 2011–2013, concluded that among the available satellite data products, the OMTO3 product was in the best agreement with the B199 Brewer spectrophotometer measurements. This data product generally has a good agreement with a mean difference of less than 1 % (Čížková et al., 2019). For the SAOZ instrument, the mean difference from satellite products in polar regions ranges between +1 % and +2 % (Hendrick et al., 2011).
2.3 MERRA-2 TOC data
In this study, reanalysis data from the second version of the Modern-Era Retrospective analysis for Research and Applications (MERRA-2), with a horizontal grid resolution of 0.625°×0.5°, have been utilised for the addition of annual cycles and spatial analysis (https://gmao.gsfc.nasa.gov/reanalysis/merra-2/, last access: 15 July 2025). MERRA-2 is an atmospheric reanalysis produced by the Global Modelling and Assimilation Office of NASA (Gelaro et al., 2017). Studies utilising ozone data from MERRA-2 have shown that these datasets exhibit high quality when evaluated against both satellite and ground-based observations (e.g., Rienecker et al., 2011; Wargan et al., 2017; Zhao et al., 2017, 2019, 2021; Fioletov et al., 2023). According to Zhao et al. (2021), the bias between MERRA-2 and Brewer world reference instruments ranges from −0.27 % to 1.05 %, based on hourly data from 1999 to 2019, with the standard deviation of monthly differences remaining below 1.2 %.
Starting in October 2004, MERRA-2 began integrating ozone profile data from the Microwave Limb Sounder (MLS) along with total column measurements provided by the Ozone Monitoring Instrument (OMI) (Wargan et al., 2017). Both instruments are components of NASA's Earth Observing System Aura satellite, which was launched in 2004. OMI retrieves ozone concentrations by detecting backscattered solar radiation in the atmosphere, whereas MLS derives its observations from thermal microwave emissions (Wargan et al., 2017). MERRA-2 provides a continuous and homogeneous ozone record spanning from 1980 to 2023, with a temporal resolution of one hour. The study by Wargan et al. (2017) offers strong support for the use of MERRA-2 data in scientific research focused on stratospheric and upper tropospheric ozone.
To assess the trend in Antarctic TOC and the factors affecting it, the multiple linear regression model developed as part of the Long-term Ozone Trends and Uncertainties in the Stratosphere (LOTUS) activity was applied. This LOTUS regression was tested with several ozone datasets, described in detail in SPARC/IO3C/GAW (2019). The method is suitable for both point station TOC data (Bernet et al., 2023) and spatial data. This study uses the model version 0.8.0 (USask ARG and LOTUS Group, 2017; Bernet et al., 2023), which was extended with additional predictors to increase the description of the ozone variability (see Sect. 4.1). The regression function has the following form:
where y(t) is the modelled TOC time series, t is the time vector of monthly means, constant intercept a and linear term b. The seasonal cycle is accounted for by adding annual oscillations and some overtones (ln=12, 4 and 3 months) with fitted coefficients cn and dn. Because of the incomplete seasonal cycles resulting from missing winter data, the 6 month period was not used in the model as it did not provide additional explained variability. Furthermore, m explanatory variables Xn and their fitted coefficients βn were included in the regression to explain the natural variability of ozone.
The regression model was applied to monthly averages from the compiled daily TOC time series at three Antarctic stations (see Sect. 2.2). Months with more than 5 missing measurements were not included. In contrast, Bernet et al. (2023) excluded months with fewer than 25 measurement days, a conceptually similar approach. This choice was made to balance data coverage and representativity; months exceeding the threshold were excluded. This ensures a representative TOC average for the given month. This means that for all three stations, monthly averages are excluded for April to August. The trend analysis starts in 2007, as data from Troll and Concordia are available from January 2007.
Furthermore, the LOTUS regression was applied to each grid (0.625°×0.5°) in the 40–90° S region using TOC from MERRA-2 data. These data are complete for all months, so oscillations with ln=12, 6, 4, and 3 were included (in Sect. 4.4). In its first phase, LOTUS primarily aimed to determine ozone trends using global satellite datasets. In the current third phase, the focus has shifted to trends at individual monitoring stations, regional differences, and the influence of dynamic and physical processes.
Predictor choice
The primary objective of the LOTUS regression was to estimate stratospheric TOC trend profiles using an extensive range of global satellite datasets (SPARC/IO3C/GAW, 2019). The default predictors initially included the El Niño–Southern Oscillation (ENSO) (e.g., Oman et al., 2013), the Quasi-Biennial Oscillation (QBO) (e.g., Baldwin et al., 2001), the 10.7 cm solar flux, and aerosol optical depth (AOD) at 3.0 cm wavelength (e.g., Solomon et al., 1998). AOD was not included in this study because its influence on TOC is relevant mainly for important volcanic eruptions (e.g., Solomon et al., 1998). Furthermore, AOD did not contribute any additional explained variability to the model. It was also not included in the final version of the model in a study by Bernet et al. (2023). LOTUS regression can also be used to assess TOC at individual stations, where additional explanatory predictors are included (Van Malderen et al., 2021; Bernet et al., 2023).
In addition to the default LOTUS predictors, several other relevant predictors are used in this study, all of which are described in Table 1. The 100 hPa temperature (T100) was used as the first additional predictor. This predictor represents the temperature in the lower stratosphere and plays a significant role in the dynamics of TOC variability (Ningombam et al., 2020). Unlike the study by Bernet et al. (2023), the tropopause pressure (TropP) predictor was not used due to its strong correlation with T100 (r=0.93–0.98).
Table 1Predictors for use in the multiple linear regression model. The default LOTUS predictors are marked with an asterisk (∗).
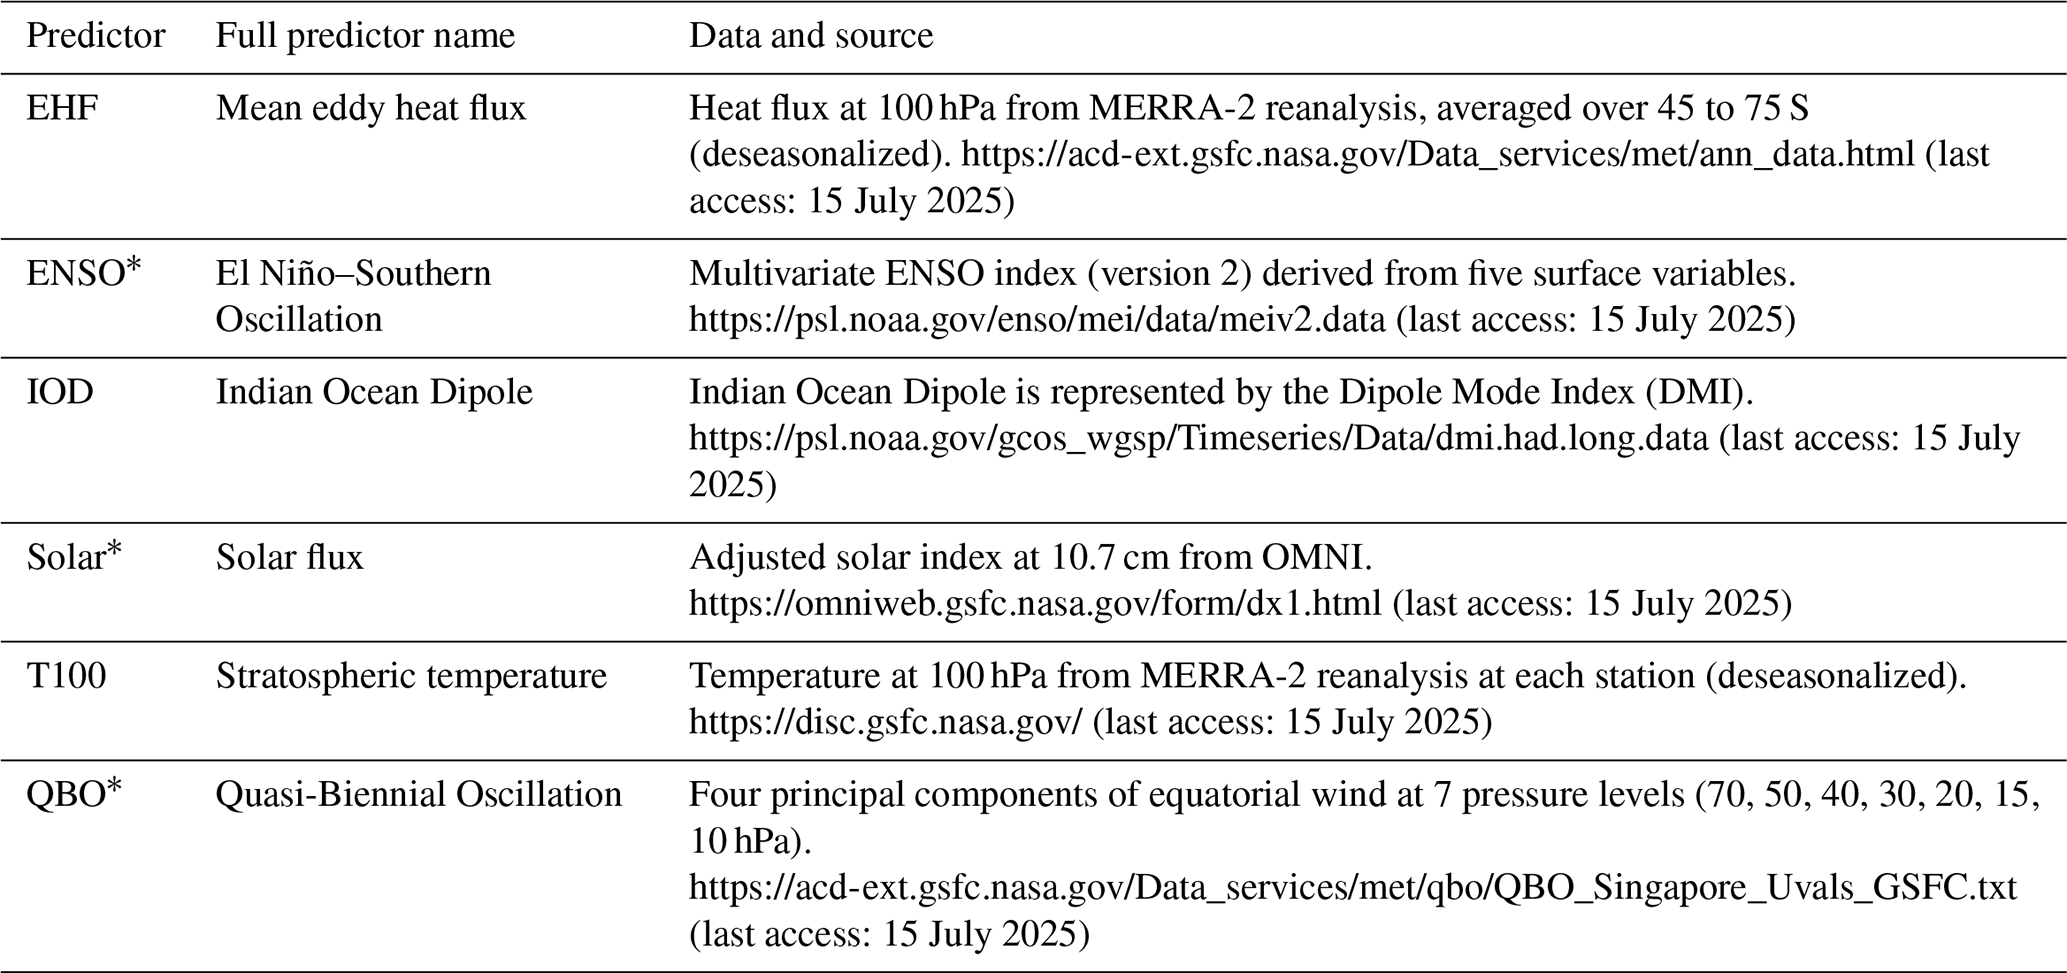
Inclusion of the Brewer–Dobson Circulation (BDC) is important for explaining natural ozone variability at high latitudes (Plumb, 2002; Bernet et al., 2023). BDC intensity was represented by the mean meridional eddy heat flux (EHF) at 100 hPa, averaged over 45–75° S (Gabriel and Schmitz, 2003). Additional circulation patterns, such as the IOD, were also considered due to their potential influence on Antarctic TOC. Adjustments were made to the QBO, which is the initial LOTUS regression predictor. The equatorial zonal mean wind at seven pressure levels between 70–10 hPa was used, following the methodology of Bernet et al. (2023), from which the principal component analysis was calculated. The first four principal components were then used in the study (will be designated as QBOa–QBOd). The Quasi-Biennial Oscillation (QBO) arises from oscillations of equatorial stratospheric winds, which influence ozone concentrations from the tropics to the polar regions (Wang et al., 2022). At higher latitudes, however, the amplitude, phase, and frequency of these oscillations can vary (Damadeo et al., 2014). Therefore, it is preferable to use the principal components of QBO at seven pressure levels in higher latitudes rather than relying on the direct QBO time series (Damadeo et al., 2014; SPARC/IO3C/GAW, 2019; Bernet et al., 2023). No statistically significant trend (p<0.05) was detected in the time series of predictors (Fig. S1 in the Supplement). To evaluate the net QBO signal, the first four components were summed, and their statistical significance was verified by the joint F-test.
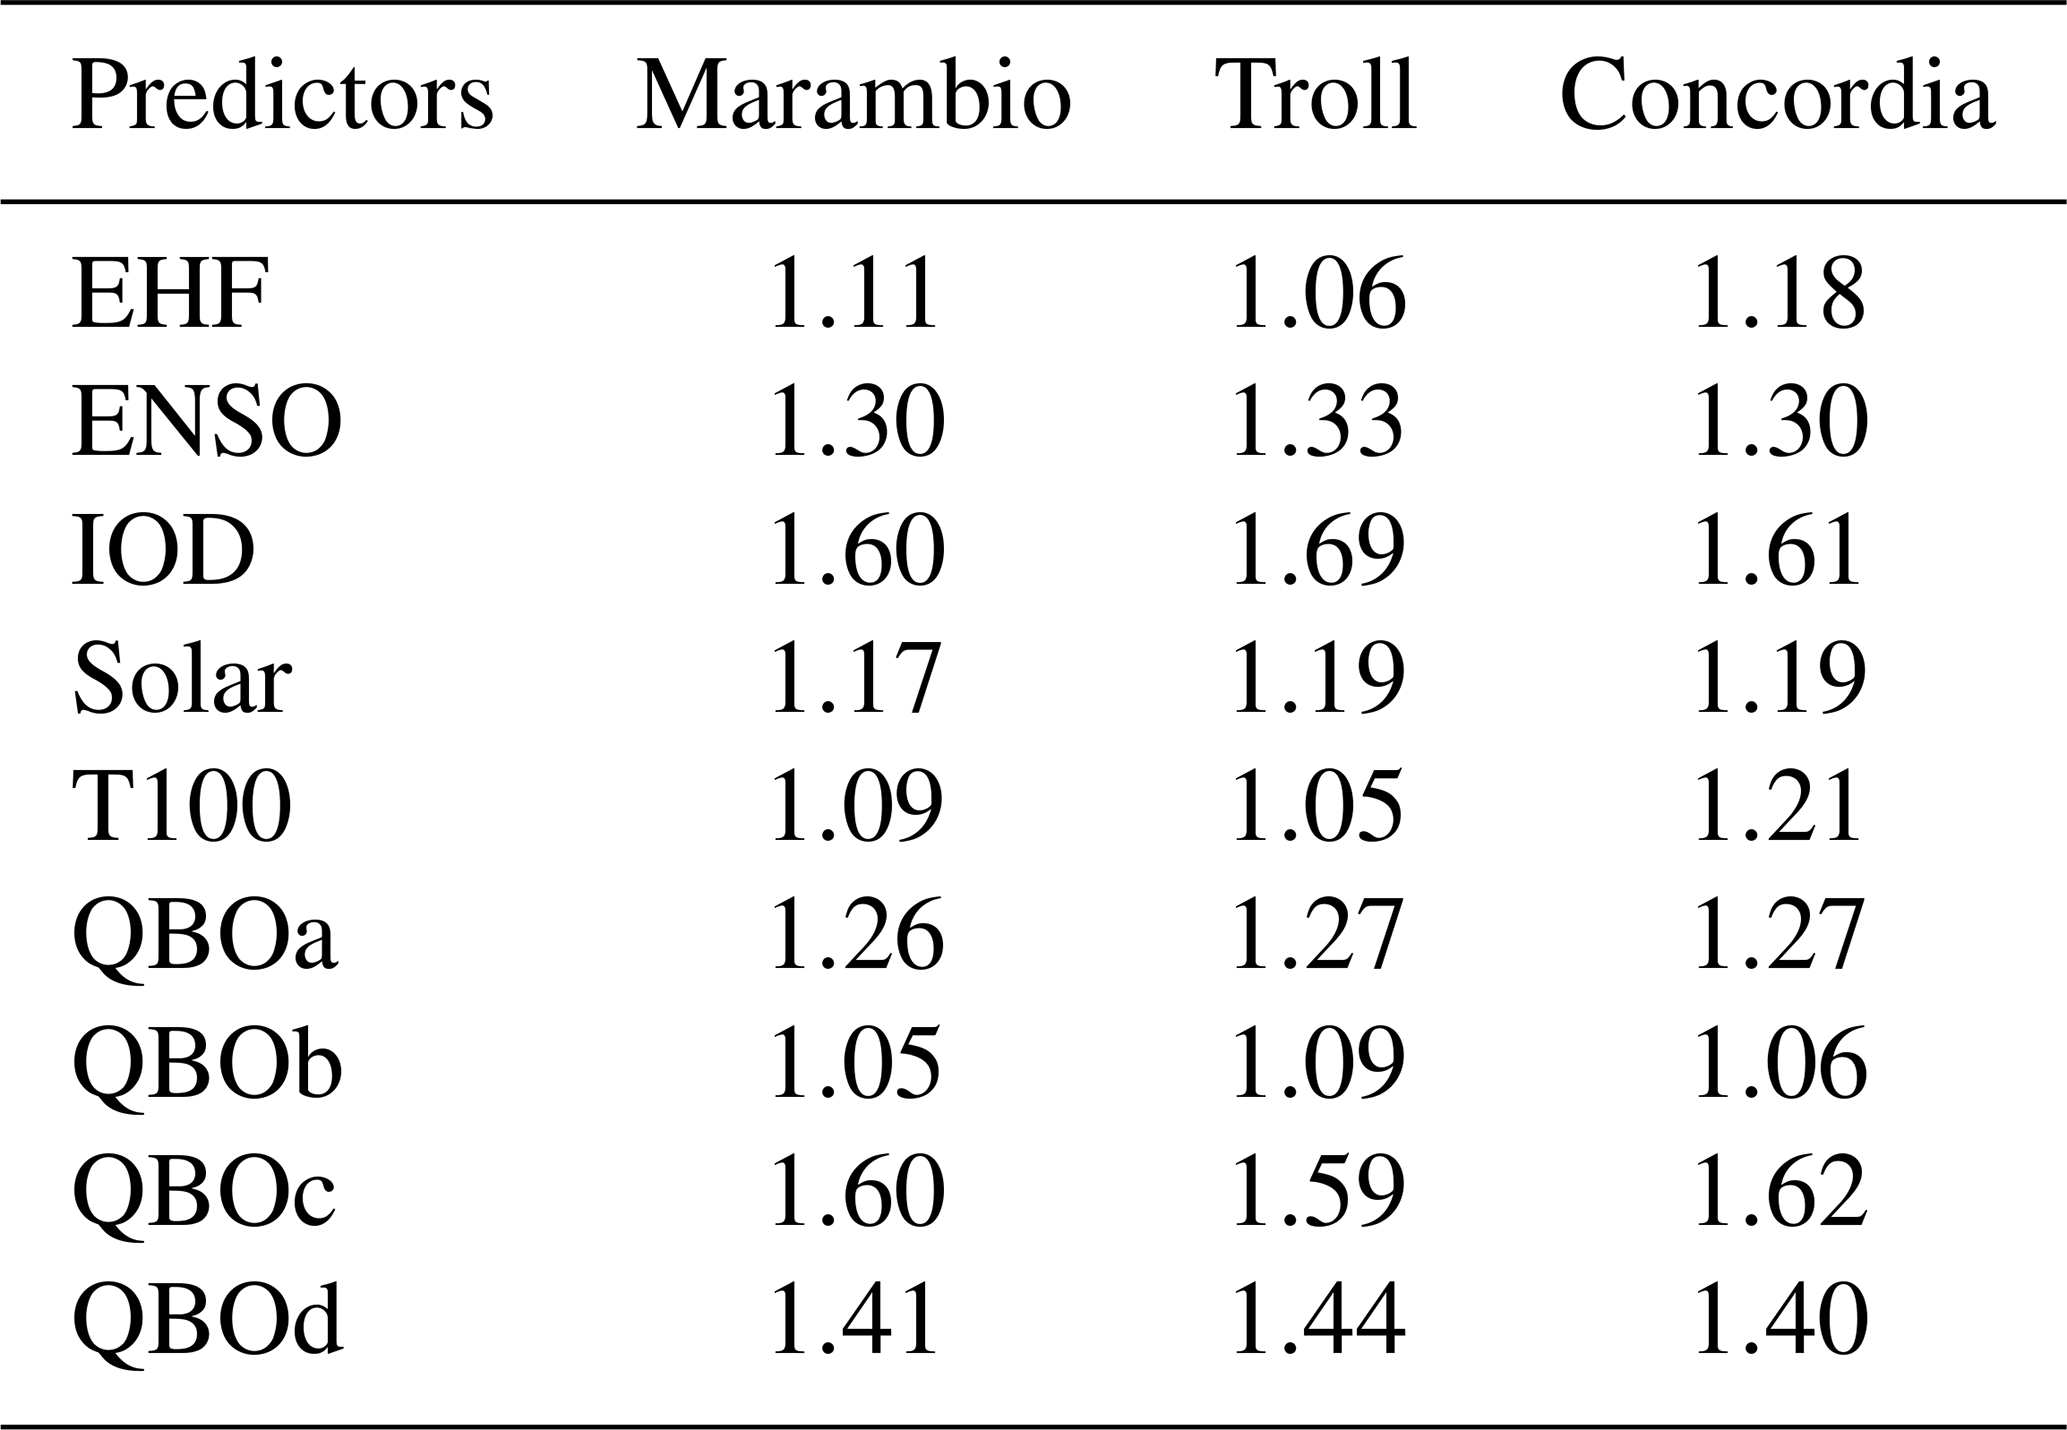
Multicollinearity between predictors was assessed using variance inflation factors (VIF), as shown in Table 2. For all predictors, the VIF value ranges between 1–2. Multicollinearity is not considered problematic when the VIF is below 5, as suggested by Schuenemeyer and Drew (2010). Concrete Pearson correlation coefficients for individual stations are shown in Fig. S2.
Table 2Variance inflation factors (VIF) for selected predictors included in the regression model.
4.1 Time series comparison and validation with OMI and MERRA-2
Figure 2 compares ground-based TOC measurements, MERRA-2 reanalysed data, and satellite overpasses at three Antarctic stations. The ground-based TOC measurements, shown in the first row, are supplemented with the OMI and MERRA-2 data. TOC variation at individual stations well demonstrates the occurrence of a seasonal cycle, which is most pronounced in the case of the Troll station. At the Marambio station, the effect of ozone depletion is not as great as at the Troll and Concordia stations. This is due to Marambio's location at the edge of the polar vortex and the subsequent frequent alternation of polar and subpolar air masses (Čížková et al., 2023). The Troll station achieves the lowest winter TOC averages (about 150–190 DU) annually.
The second row (Fig. 2d–f) presents a comparison of monthly TOC means between ground-based (GB) measurements, satellite overpasses and MERRA-2 reanalysed data. All stations' average relative deviations between GB and OMI data are within 3 %. The lowest mean deviation is at the Troll station (−0.28 %), followed by Marambio (−1.30 %) and the Concordia station (−2.42 %). These results align with the satellite measurement uncertainties of around 2 %, as reported by Bodeker and Kremser (2021). Similar deviations between GB and OMI data have been observed in the Arctic (Bernet et al., 2023). Larger differences can be seen for individual months, but they are never greater than ±9 %. The differences between GB and MERRA-2 data are very similar; the mean bias is highest at the Concordia station (−4.31 %), and it is within ±1 % at the other stations. The monthly differences are highest at the Concordia station, but do not exceed ±10 %, which is comparable to the OMI data.
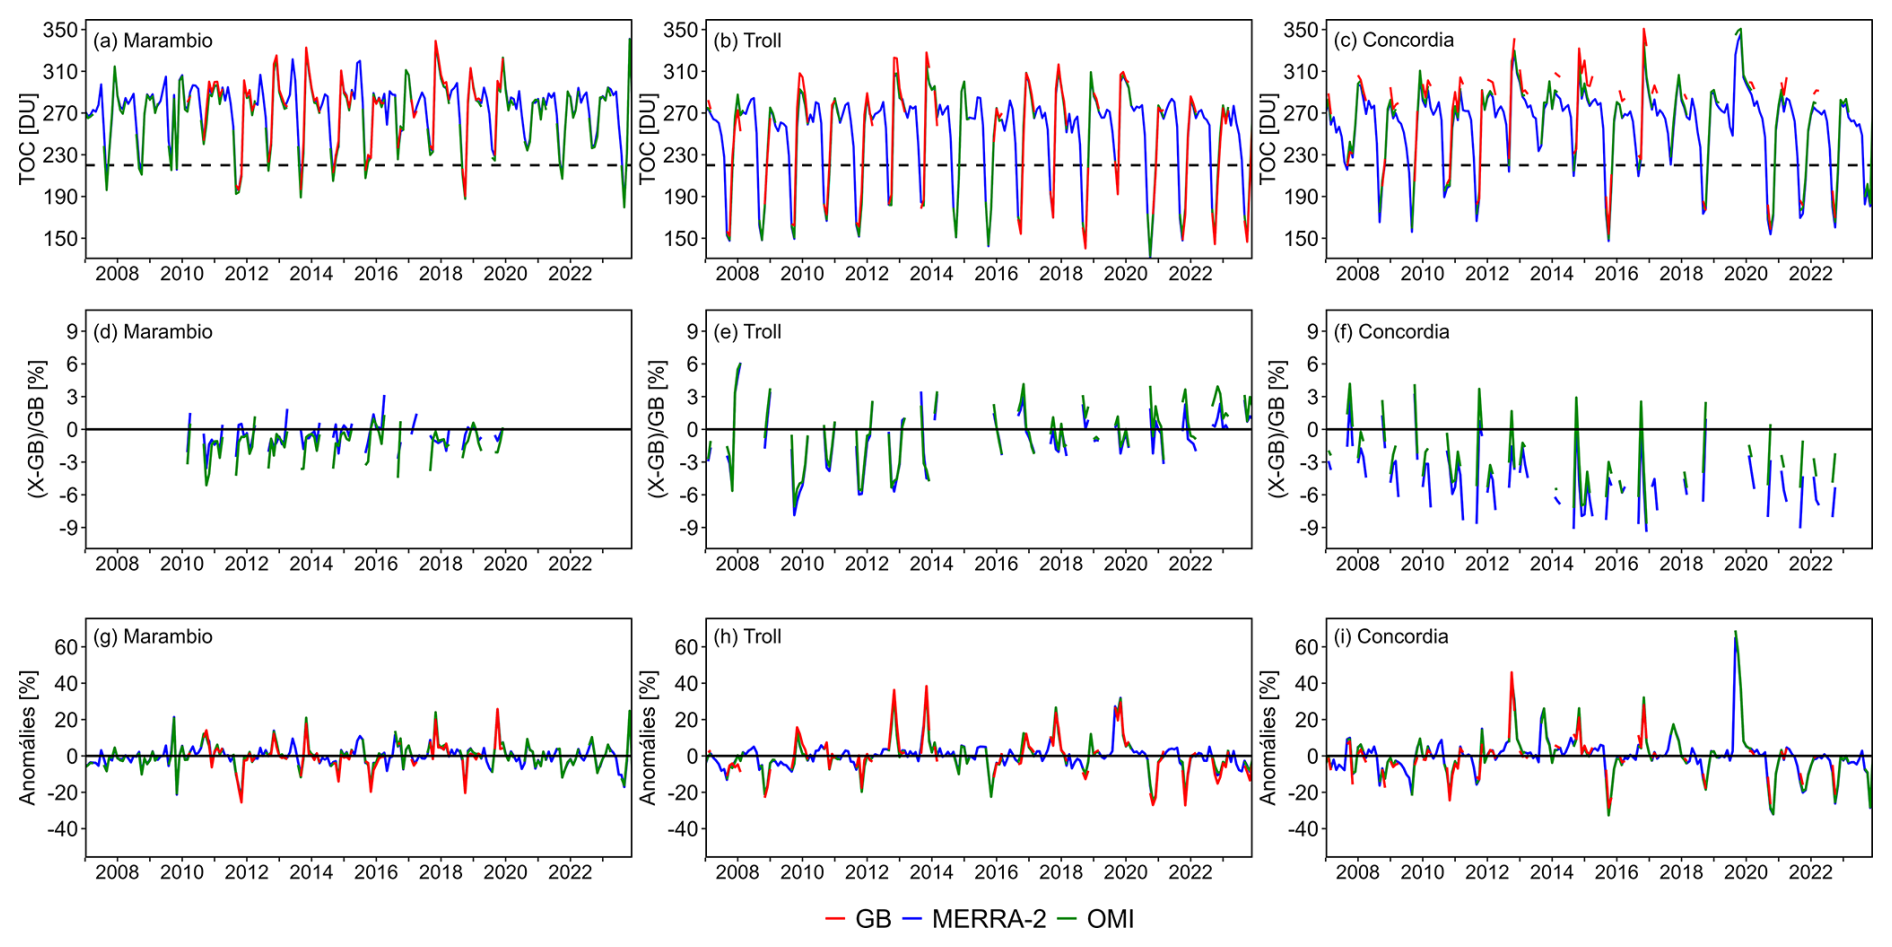
Figure 2Comparison of ground-based total ozone column (TOC) data with satellite overpasses from OMI and MERRA-2 data at the Marambio, Troll and Concordia stations for the period 2007–2023. The first row (a–c) shows monthly means of the ground-based data (red) together with OMI (green), and MERRA-2 (blue) monthly means. The second row (d–f) shows monthly relative differences between ground-based data and other datasets (blue with MERRA-2 and green with OMI). The third row (g–i) shows relative anomalies for each dataset (red – the ground-based data, blue – MERRA-2, and green – OMI), which are defined as the deviation of each month from the monthly mean climatology (2007–2023) of the respective dataset. The dashed lines in panels (a)–(c) show TOC=220 DU.
The monthly TOC anomalies represent deviations from the 2007–2023 monthly means (Fig. 2g–i). This implies that at the Marambio station, TOC naturally varies in the range of ∼20 %, at the Troll and Concordia stations in the range of ∼40 %. Individual data sets move within their natural variability, but some years show more significant anomalies. For example, in the winter of 2019, Antarctica experienced a sudden stratospheric warming, causing generally higher TOC (e.g., Safieddine et al., 2020), which resulted in the strong positive anomaly (∼60 %) at the Concordia station in September 2019.
Section 2.2 clarifies that the time series of GB measurements were supplemented with satellite overpass data from OMI. Figure S3 shows monthly medians and quantiles of TOC at the three stations. At Marambio, the lowest median TOC was recorded in September (207.52 DU) and the highest in December (308.31 DU), with the greatest variability observed from September to November. Troll showed the lowest median in October (156.23 DU) and the highest in December (292.40 DU), with the highest variability in November and December. Concordia exhibited a similar seasonal pattern, with the lowest TOC in October (192.93 DU) and the highest in December (296.42 DU), and increased variability during the austral spring. Outliers in September and October at Troll and Concordia likely reflect a weaker polar vortex and elevated TOC levels in 2019.
4.2 Linear regression and key drivers of TOC variability at Marambio, Troll, and Concordia
Figure 3a shows the results of the linear regression model for the Marambio station, where the adjusted coefficient of determination () explains 94 % of the TOC variance. The residuals mostly lie within the 5 % range, with the Shapiro–Wilk test (Shapiro and Wilk, 1965), confirming the normal distribution of the residuals and the Durbin–Watson test (Durbin and Watson, 1950) indicating no autocorrelation of the residuals (the value of the test statistic was close to 2). A normal distribution and no autocorrelation of the residuals were also demonstrated for the Troll and Concordia stations. At the Marambio station, an increasing statistically significant trend of 3.43 ± 3.22 DU per decade was detected.
The results of the linear regression model for the Troll station, where the adjusted coefficient of determination () explained 97 % of the TOC variance, are shown in Fig. 3c. The residuals are mostly within ±10 %. In the case of the Troll station, a decreasing but statistically insignificant trend of −1.09 ± 3.91 DU per decade was found. The larger percentage of explained variability at the Troll station compared to Marambio may be due to the lower interannual variability of the monthly mean TOC. The last station for which a linear regression model was applied is Concordia (Fig. 3e). At this station, the adjusted coefficient of determination () explained 96 % of the TOC variance. The trend (1.15 ± 4.25 DU per decade) was not statistically significant. The residuals are mostly within ±9 %. The linear regression results for all stations are summarized in Table 3.
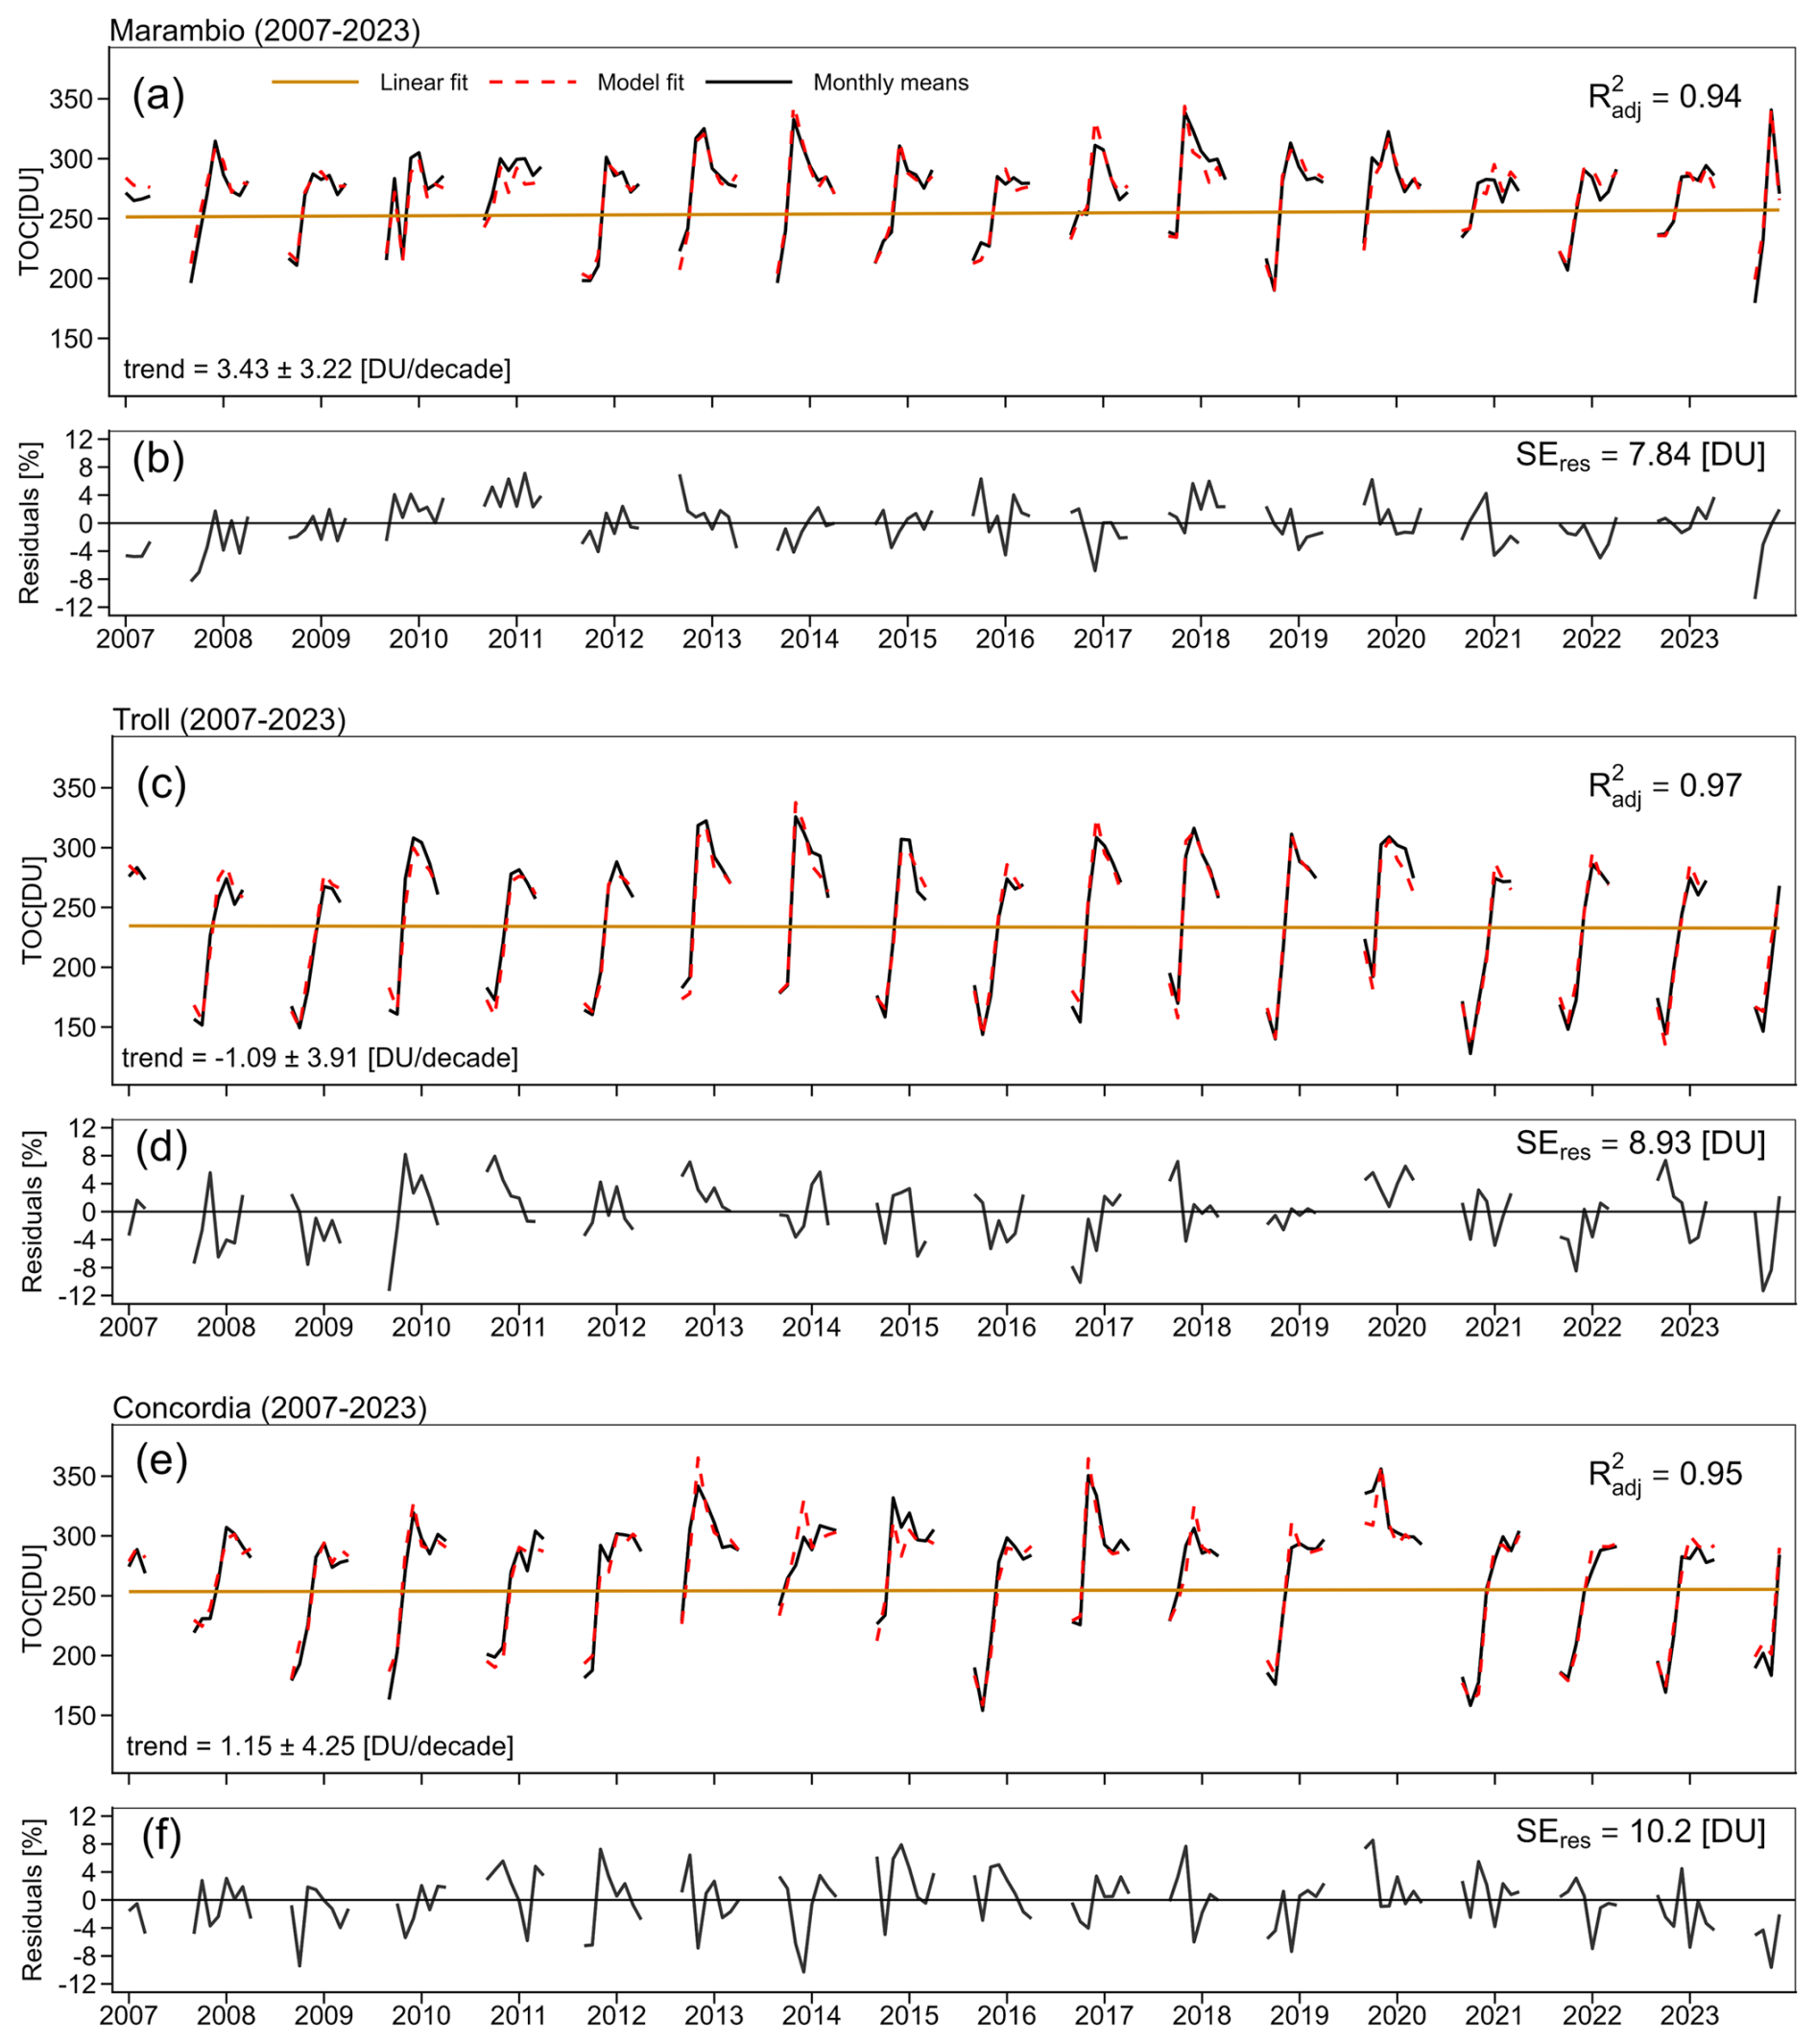
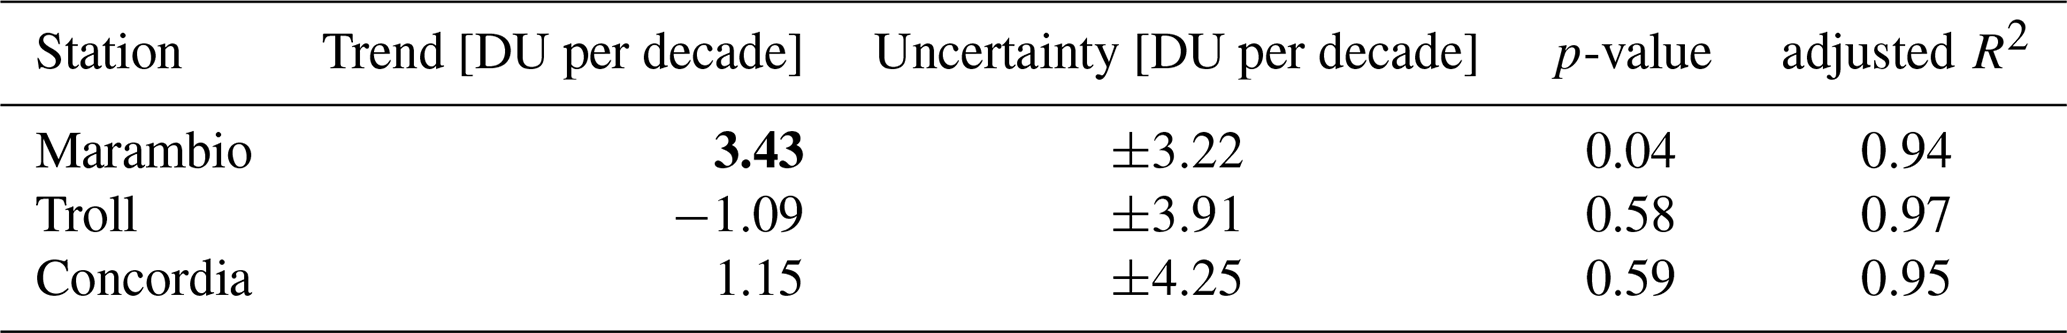
Figure 3Mean monthly total ozone column and regression fits (a) and residuals (b) at Marambio, while panels (c) and (d) show results for Troll, (e) and (f) for Concordia.
Table 3Linear trends of TOC at the three Antarctic stations (Marambio, Troll, and Concordia) in 2007–2023. The table presents the estimated trend (DU per decade), the associated uncertainty, the p-value, and the adjusted R2 for each station. A statistically significant trend is marked in bold (p<0.05).
In addition, the LOTUS regression (Table 2) was calculated separately for the OMI and MERRA-2 data, using the same months. At the Marambio station, statistically significant trends were obtained for all datasets, although the magnitudes differed slightly. For Troll and Concordia, where trends were statistically insignificant in all cases, slight differences in trend magnitudes between datasets were also observed.
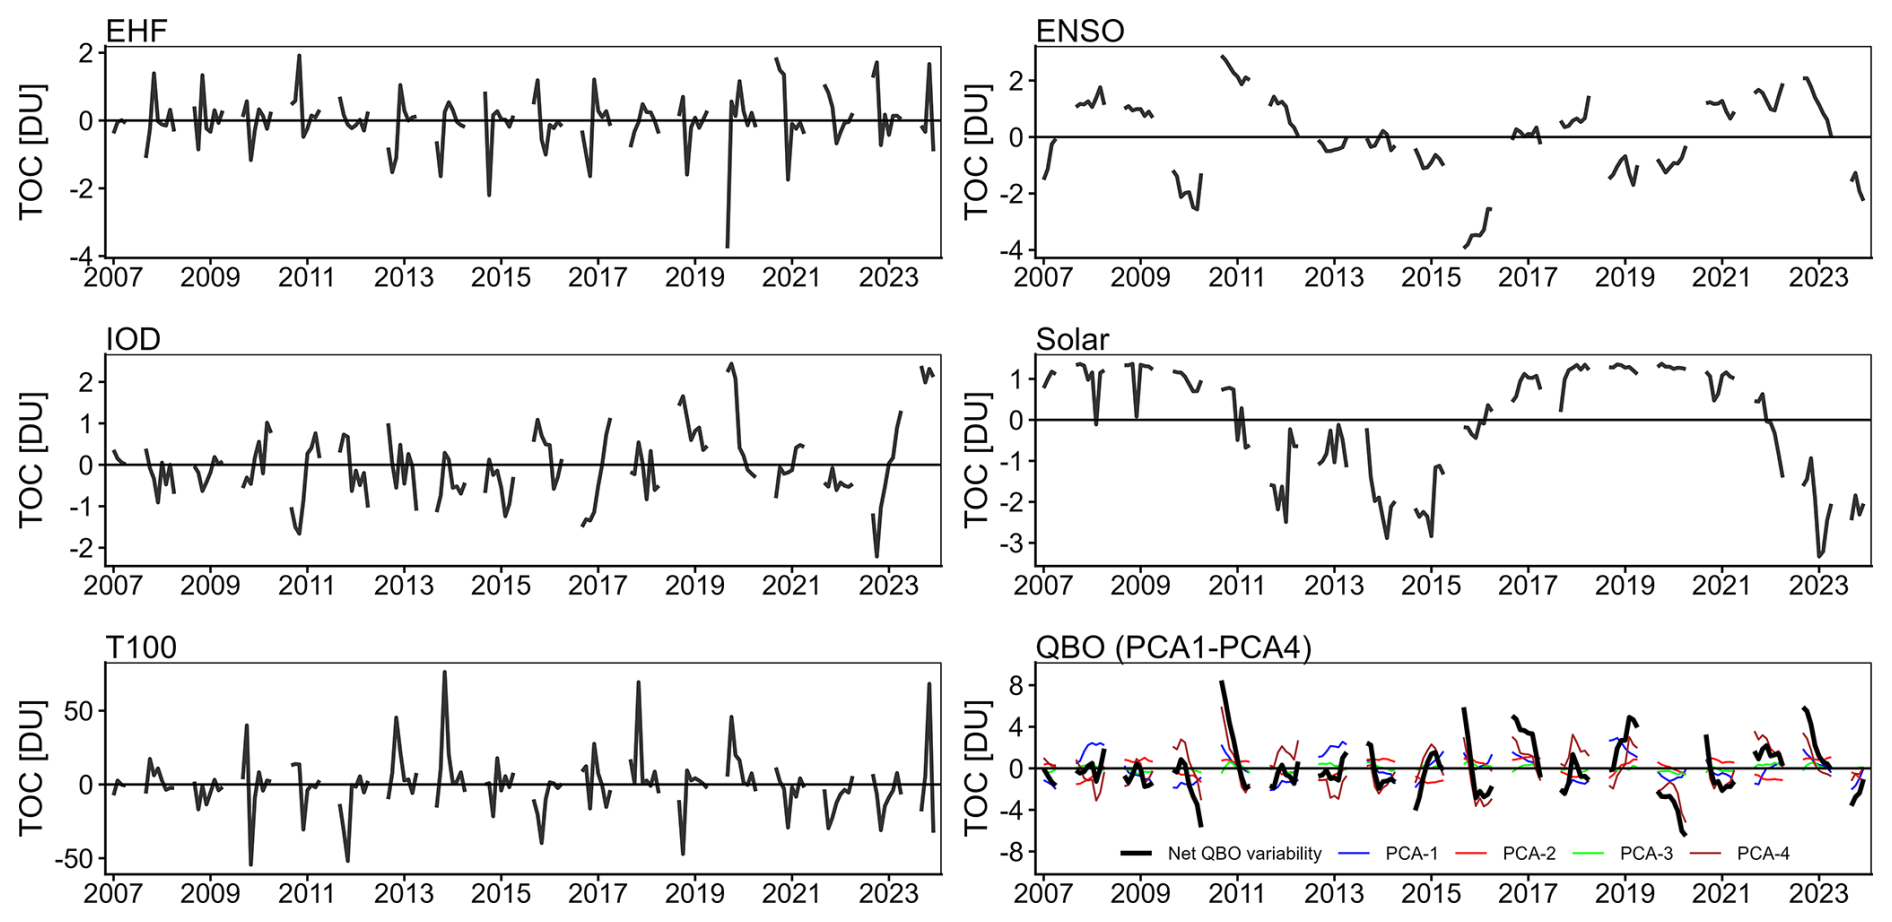
Figure 4 shows that a large part of the TOC variability at the Marambio station can be explained by T100. This predictor causes the change in TOC between −50 and 60 DU. EHF affects TOC variability between −4 and 2 DU, and it is clear that in 2019, when the SSW occurred at Marambio, EHF caused a TOC decrease of approximately 4 DU. The TOC variability explained by ENSO shows that La-Niña events, for example, in 2011 (Bastos et al., 2013), increase the TOC amount, while El-Niño events, such as in 2015 (Santoso et al., 2017), decrease TOC at Marambio. The IOD oscillation has only a negligible (±2 DU) effect on TOC at Marambio. In the case of the solar factor, 11 year solar cycles are clearly visible, with TOC decreasing by almost 3 DU during solar maxima and TOC increasing slightly (1 DU) during solar minima. The last of the QBO predictors affects TOC variability by up to ±5 DU.
At the Troll station, TOC variability is mainly influenced by T100, as is the case at the Marambio station (Fig. S4 in the Supplement). Temperature in the lower stratosphere causes a change in TOC between −50 and 100 DU. The largest TOC loss due to temperature in the lower stratosphere occurred in 2020, when the Antarctic stratosphere was very cold during the winter and spring months. On the contrary, in October 2012 and 2013, ozone increased by ∼80 DU at the Troll station due to the disruption of the polar vortex by heat fluxes (Klekociuk et al., 2014, 2015). The influence of EHF and QBO between −5 and 10 DU on TOC was more significant, whereas the effects of the other predictors were negligible. Interestingly, at Troll, predictors such as EHF and ENSO behave oppositely to those at the Marambio station. This leads to the possible conclusion that on the opposite coastal parts of the Weddell Sea, some predictors may influence TOC with opposite effects.
Figure S5 shows that, also at Concordia, the variability of TOC is driven mainly by the temperature in the lower stratosphere (T100). In 2019, TOC increased by approximately 20 DU due to EHF. This predictor behaves similarly to the Troll station, but in the opposite way compared to Marambio. The other included predictors contribute to the TOC variability by up to 5 DU. The solar factor is worth mentioning, as it exhibits the opposite behaviour here than at the Troll and Marambio stations. The solar factor also explains a greater amount of TOC variability than at the previous two stations.
The coefficients of the individual predictors and their statistical significance for the annual regression fit at Marambio are shown in Fig. 5a. For a direct comparison, the coefficients have been standardised. Brunner et al. (2006) define the standardised coefficients βstd as the percentage change in TOC associated with a 1σ change in each predictor:
where β denotes the predictor coefficient, σX the standard deviation of the predictor X, and the mean TOC. The predictor T100 exhibited the largest statistically significant (p<0.05) contribution to the variability of TOC (Fig. 5a). Other statistically significant predictors include only QBOd. Other predictors have a statistically insignificant effect on the TOC variability at Marambio. A joint F-test of all QBO terms (QBOa–QBOd) indicated that the combined QBO signal was not statistically significant (F=2.07, p=0.089).
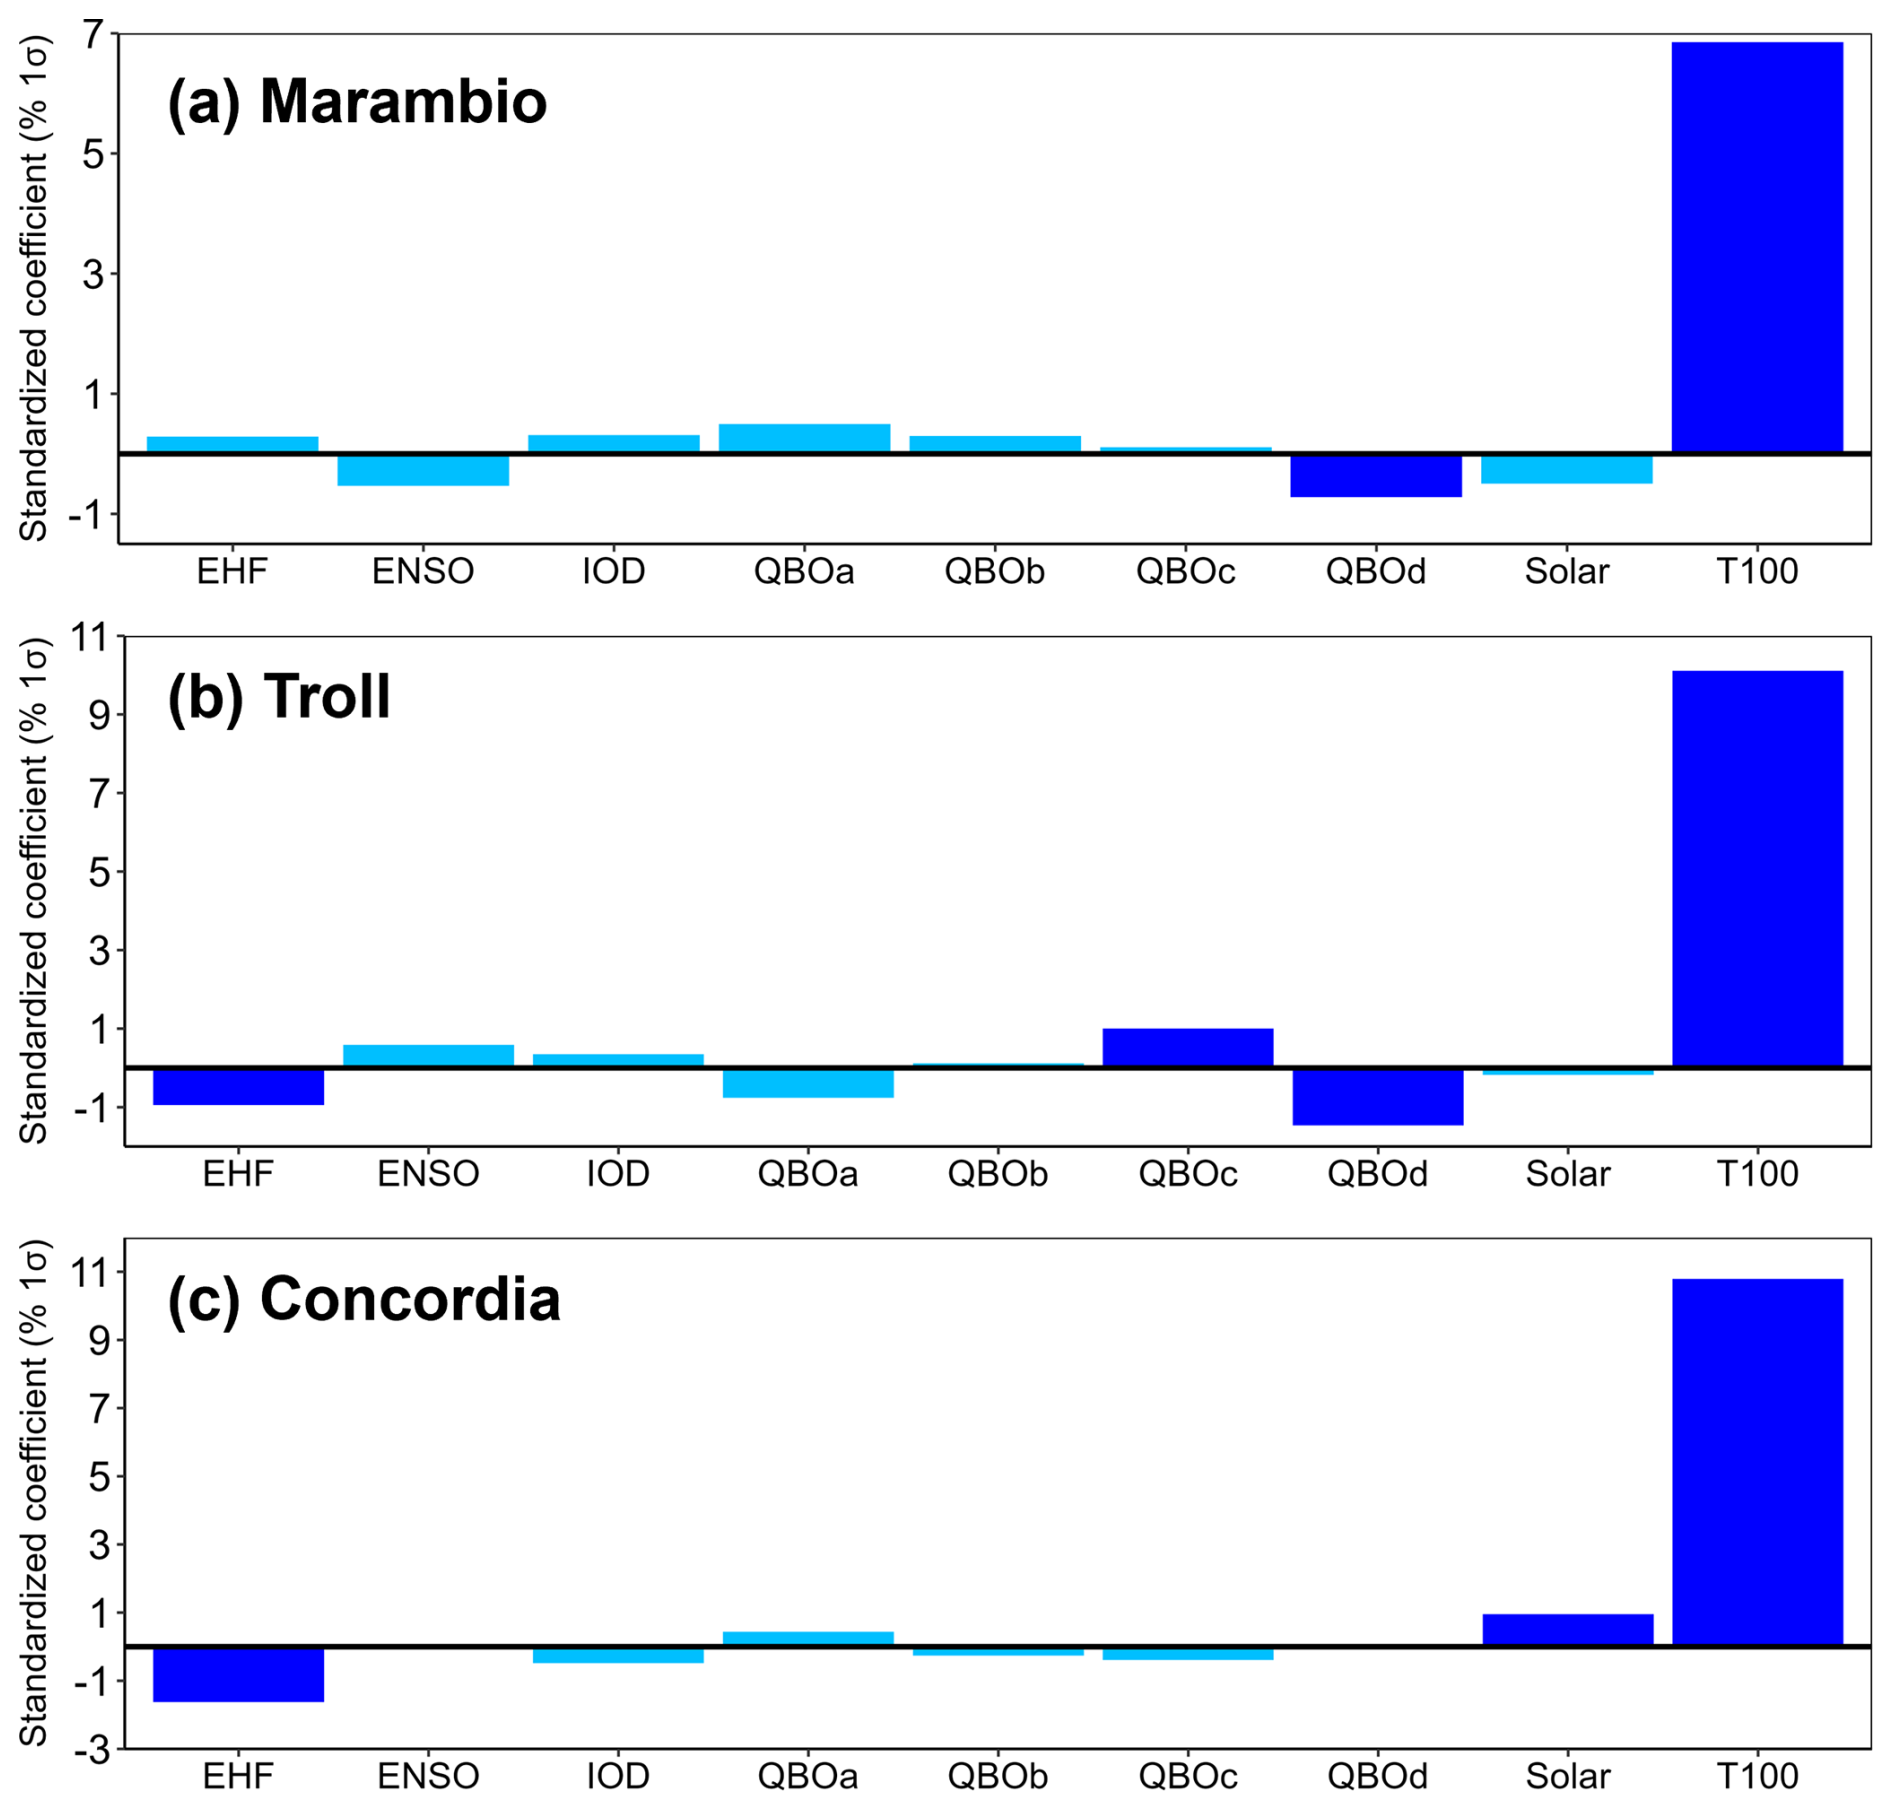
Figure 5Predictor contributions to the annual regression fit at Marambio (a), Troll (b) and Concordia (c). Standardised coefficients indicate the percentage change in TOC associated with a one standard deviation change in the predictor. Light blue bars denote predictors whose effect on ozone is not statistically significant (p-value of the coefficient <0.05).
Figure 5b shows the standardised coefficients of determination for each predictor and their statistical significance. At the Troll station, T100 has the largest and statistically significant influence on TOC variability. This influence is approximately 4 % higher than at the Marambio station. Other statistically significant predictors include QBOc,d and EHF. The rest of the predictors do not have a statistically significant influence. Compared to the Marambio station, at Troll, a greater influence of QBO and EHF can be observed. A joint F-test of all QBO terms (QBOa–QBOd) at Troll indicated that the combined QBO signal is statistically significant (F=4.51, p=0.002), confirming that the net QBO effect contributes meaningfully to TOC variability at this station.
At the Concordia station, based on the standardised coefficients of determination for individual predictors, the T100 predictor has the greatest and statistically significant influence on TOC variability at the Concordia station (Fig. 5c). The influence of this predictor on TOC is comparable to that of the Troll station. Other statistically significant predictors at Concordia are EHF and solar. The EHF predictor negatively affects TOC, which is different from the Marambio station, where this predictor has a statistically insignificant but positive effect on TOC. A joint F-test including all QBO components (QBOa–QBOd) at Concordia showed no statistically significant effect (F=0.46, p=0.765), indicating that the combined QBO signal does not substantially influence TOC variability at this station.
A similar study was conducted for European subpolar and polar stations, where their ground-based time series for the period 2000–2020 are assessed (Bernet et al., 2023). The study by Bernet et al. (2023) used QBO, Solar, ENSO, EHF, TropP and T50 as predictors. At the Oslo, Andoya and Ny-Ålesund stations, the TropP predictor had the greatest and statistically significant influence on TOC variability, followed by T50 (stratospheric temperature at 50 hPa) at the Oslo and Andoya stations and EHF at the Ny-Ålesund station.
Comparatively, in the present study, it is found that in Antarctica, the temperature in the lower stratosphere (T100) has the greatest influence on TOC variability. TropP was not used precisely because of the high correlation with T100. Interestingly, T100 has a slightly different influence on TOC variability in individual years at each station. However, in October 2013, TOC increased uniformly at all stations due to T100. The predictor time series (Fig. S1) shows that in October 2013, T100 had one of the highest positive anomalies at all three stations. According to the study by Klekociuk et al. (2015) the 2013 early winter temperatures were anomalously low in the polar stratosphere, with a concomitant strong and stable polar vortex supporting the potential for strong ozone depletion. However, from late August onwards, anomalous warming of the polar vortex occurred, limiting ozone depletion during the spring and leading to a relatively early ozone hole breakdown (Klekociuk et al., 2015).
When comparing the predictor contributions from the compiled time series (Fig. 5) with the OMI overpass (Fig. S6) and MERRA-2 (Fig. S7) datasets, only small differences were observed. T100 remains statistically significant at all three stations, consistently showing the largest influence on TOC variability. In contrast, other predictors exhibit some variations depending on the dataset. At Marambio, QBOd becomes statistically insignificant in the OMI and MERRA-2 datasets, while the solar factor gains statistical significance. At Troll, QBOc loses statistical significance when using either the OMI or MERRA-2 datasets. At Concordia, the solar factor is not statistically significant when using either dataset.
4.3 Trends during SON
Trend analysis at the three Antarctic stations was also performed for the spring months (SEP, OCT, NOV). In this case, the LOTUS regression was not used due to multicollinearity between predictors at the monthly scale (VIF>5; not shown). Previous studies suggest that signs of ozone recovery can be observed over Antarctica during September since 2000 (Solomon et al., 2016; Weber et al., 2018, 2022), with the magnitude of the Antarctic ozone anomaly gradually increasing to reach its maximum in late September and early October (Weber et al., 2018). Pazmiño et al. (2018) evaluated TOC trends within the southern polar vortex and found that the largest trends and highest significance were found for September in the period 2001–2017, with a trend value of 1.84 ± 1 DU. TOC trends in the spring months are of great interest in the polar regions, as these regions experienced the largest ozone depletion in the period before 2000 (e.g. Solomon, 1999). Trend analysis in Fig. 6 showed that in the period 2007–2023, the trend at all stations in all three months is statistically insignificant (2σ is higher than the trend value at all stations). The reason for the statistically insignificant trend may be the larger and more persistent spring ozone anomalies that were observed between 2020 and 2023 (Kessenich et al., 2023; Kozubek et al., 2024). Interestingly, the trends for October and November are decreasing but not statistically significant at all stations except Marambio in November, while the trends for September at all stations are increasing, but also not statistically significant. The different behaviour of the trends may be related to the later onset of the ozone anomaly, which in 2015 and 2020 reached record size only in October–December (Stone et al., 2021). The persistence of the polar vortex during these years was likely enhanced by external factors: the 2015 eruption of the Calbuco volcano (Zhu et al., 2018), and the extensive biomass burning in Australia in 2019–2020 (Salawitch and McBride, 2022). It is important to note that determining precise ozone trends in the southern polar stratosphere is difficult due to the saturation of ozone loss, i.e. complete or near-zero ozone destruction in the lower stratospheric layers, mostly at an altitude of 13–21 km (Kuttippurath et al., 2018). At the higher latitudes (Troll and Concordia), the saturation of ozone loss may obscure signs of recovery, in contrast to the vortex edge latitudes (Marambio).
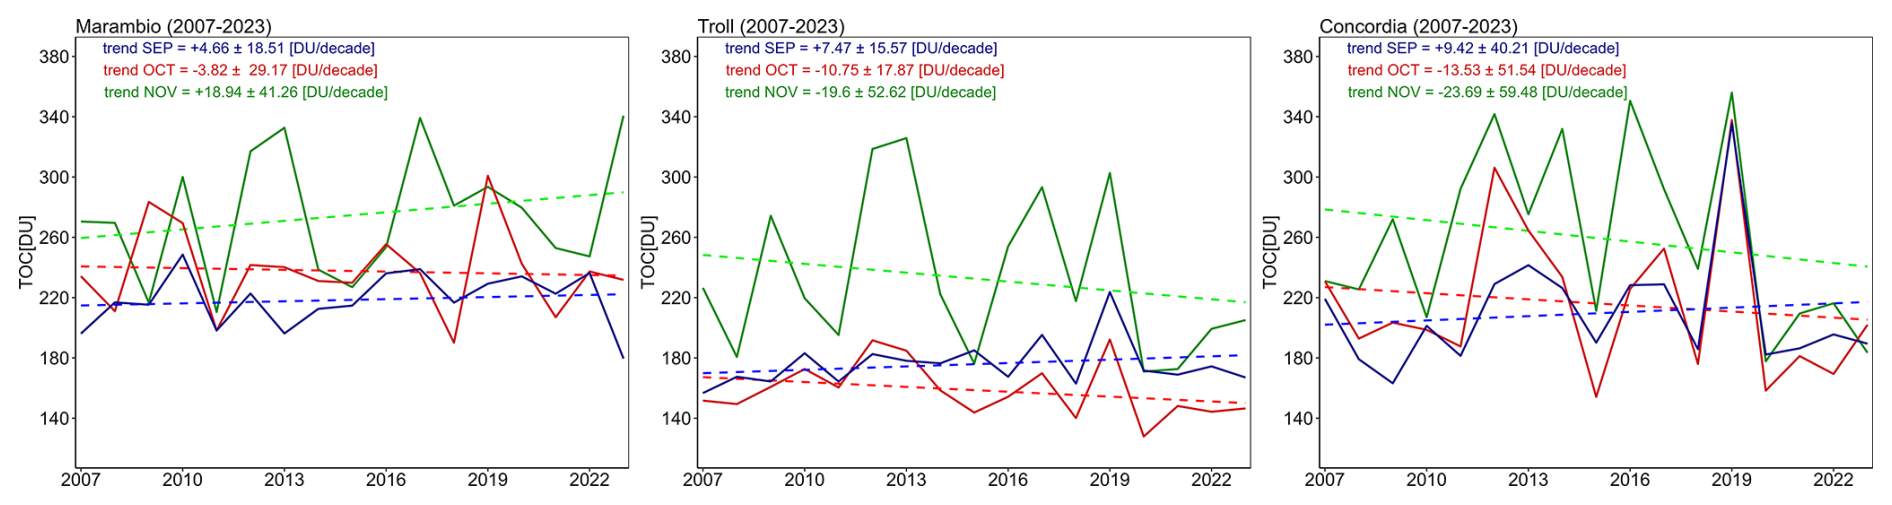
Figure 6TOC variability for September (blue), October (red) and November (green) supplemented with the linear trend (dashed) for Marambio (left), Troll (middle) and Concordia (right) in the period 2007–2023.
4.4 Spatial effect of factors affecting TOC
The linear regression from Eq. (1) was calculated for each grid point (0.625°×0.5°) in the 40–90° S area in the period 2007–2023 based on TOC from the MERRA-2 reanalysis (Fig. 7). The T100 and TropP predictors had individual values for each grid point, while the other predictors (e.g., ENSO, IOD, etc.) had the same value for the entire region. All months have been included in the assessment; therefore, multiple linear regression was calculated with the periods l=12, 6, 4, and 3.
Time series analysis at each grid point shows the spatial distribution of the fits to each parameter, which are expressed using standardized coefficients of determination. The spatial distribution of the adjusted coefficient of determination shows that the used LOTUS model best represents the real TOC series over the Queen Maud Land and the Weddell Sea, where approaches 0.97. Furthermore, the model performs well over the Indian Ocean and Australia (). It is less representative of TOC in the Atlantic Ocean sector and in the marginal parts of Antarctica, which may be caused by the increased TOC and dynamical variability of the edge of the polar vortex. However, even in the subantarctic areas, the adjusted determination coefficient explains more than 70 % of TOC variance.
The EHF predictor has a positive, statistically significant effect on TOC over the ocean west of Antarctica, but it affects TOC negatively over East Antarctica. The influence of ENSO on the TOC over Antarctica is statistically insignificant, except in the sector near Australia, which has a statistically significant positive influence. Lin and Qian (2019) show that the strongest ozone anomalies over Antarctica occur one year after El Niño and La Niña, which have a dipole structure between the upper and lower stratosphere. The IOD has a statistically insignificant effect on TOC in Antarctica, while it has a positive effect in the surrounding oceans. The solar factor has a statistically significant positive effect on TOC over East Antarctica and a negative effect in the Atlantic Ocean sector. The strongest and statistically significant positive effect on TOC over Antarctica is characterised by the temperature in the lower stratosphere (T100) as seen on individual stations considered in this study (Sect. 4.2).
The last predictor evaluated was the QBO, represented by the first four principal components (QBOa–QBOd) calculated from the equatorial zonal wind at seven pressure levels between 10 and 70 hPa. QBOa has a statistically significant positive effect on TOC over central and West Antarctica, whereas QBOd has a significant negative effect over West Antarctica. QBOb affects TOC with a statistically significant negative effect in Antarctica over a small area near Concordia station and over the Southern Ocean. The Antarctic TOC was not significantly affected by QBOc, as there is only a small area over the Amundsen Sea where a significant negative effect was found. Figure S8 illustrates the statistical significance of the net QBO variability, showing that its influence is mostly statistically insignificant over East Antarctica, while it is statistically significant in the surrounding ocean regions.
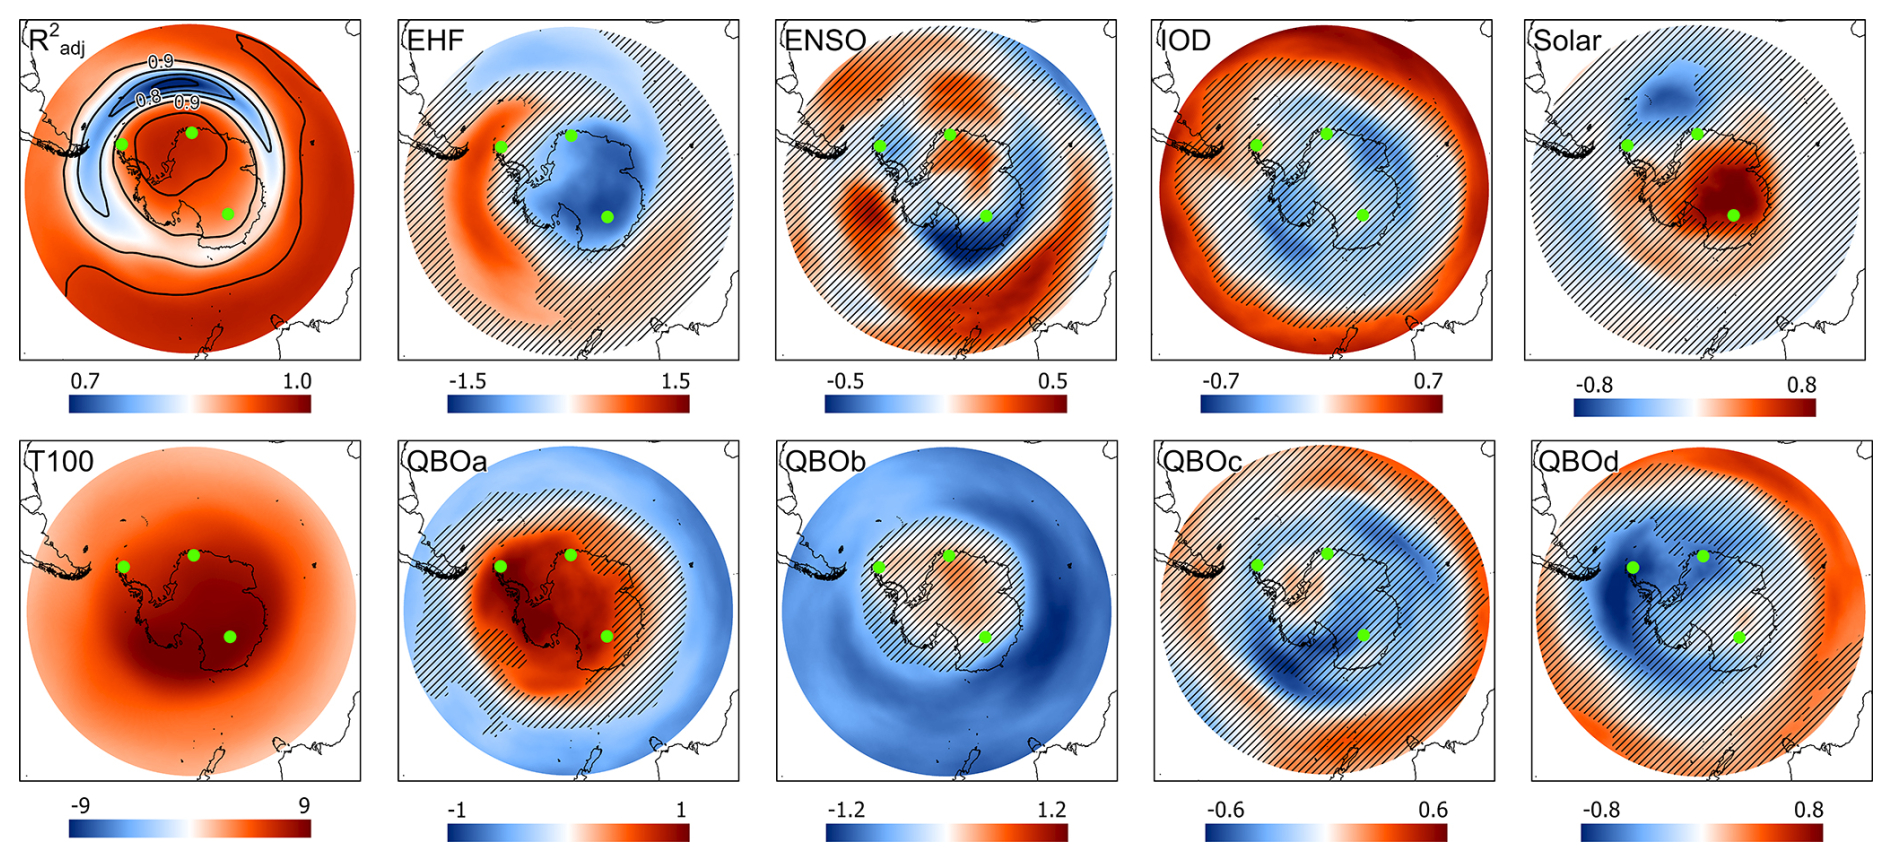
Figure 7Spatial distribution of the adjusted coefficient of determination () and the effect of individual predictors shown using standardised coefficients of determination. The unshaded area is statistically significant (p<0.05).
Comparison of September 2019 and 2020
The spring seasons of 2019 and 2020 were very different in Antarctica in terms of stratospheric dynamics and TOC evolution. In the first half of September 2019, a minor sudden stratospheric warming (SSW) occurred in the Southern Hemisphere (Liu et al., 2022). The SSW was caused by a quasi-stationary planetary wave of zonal wavenumber 1 (Liu et al., 2022). In 2019, an atypical warming of the polar vortex lessened ozone depletion in early September, resulting in the second smallest ozone hole ever recorded (Johnson et al., 2023). Wargan et al. (2020) and Safieddine et al. (2020) also concluded that a reduced ozone hole area was indeed observed in Antarctica in 2019. In contrast, during the spring of 2020, the polar vortex was unusually strong and persistent. Lim et al. (2024) reported that it was the strongest and coldest event since 1979 in the middle to lower stratosphere on average from October to December, resulting in a significantly lower TOC during this period.
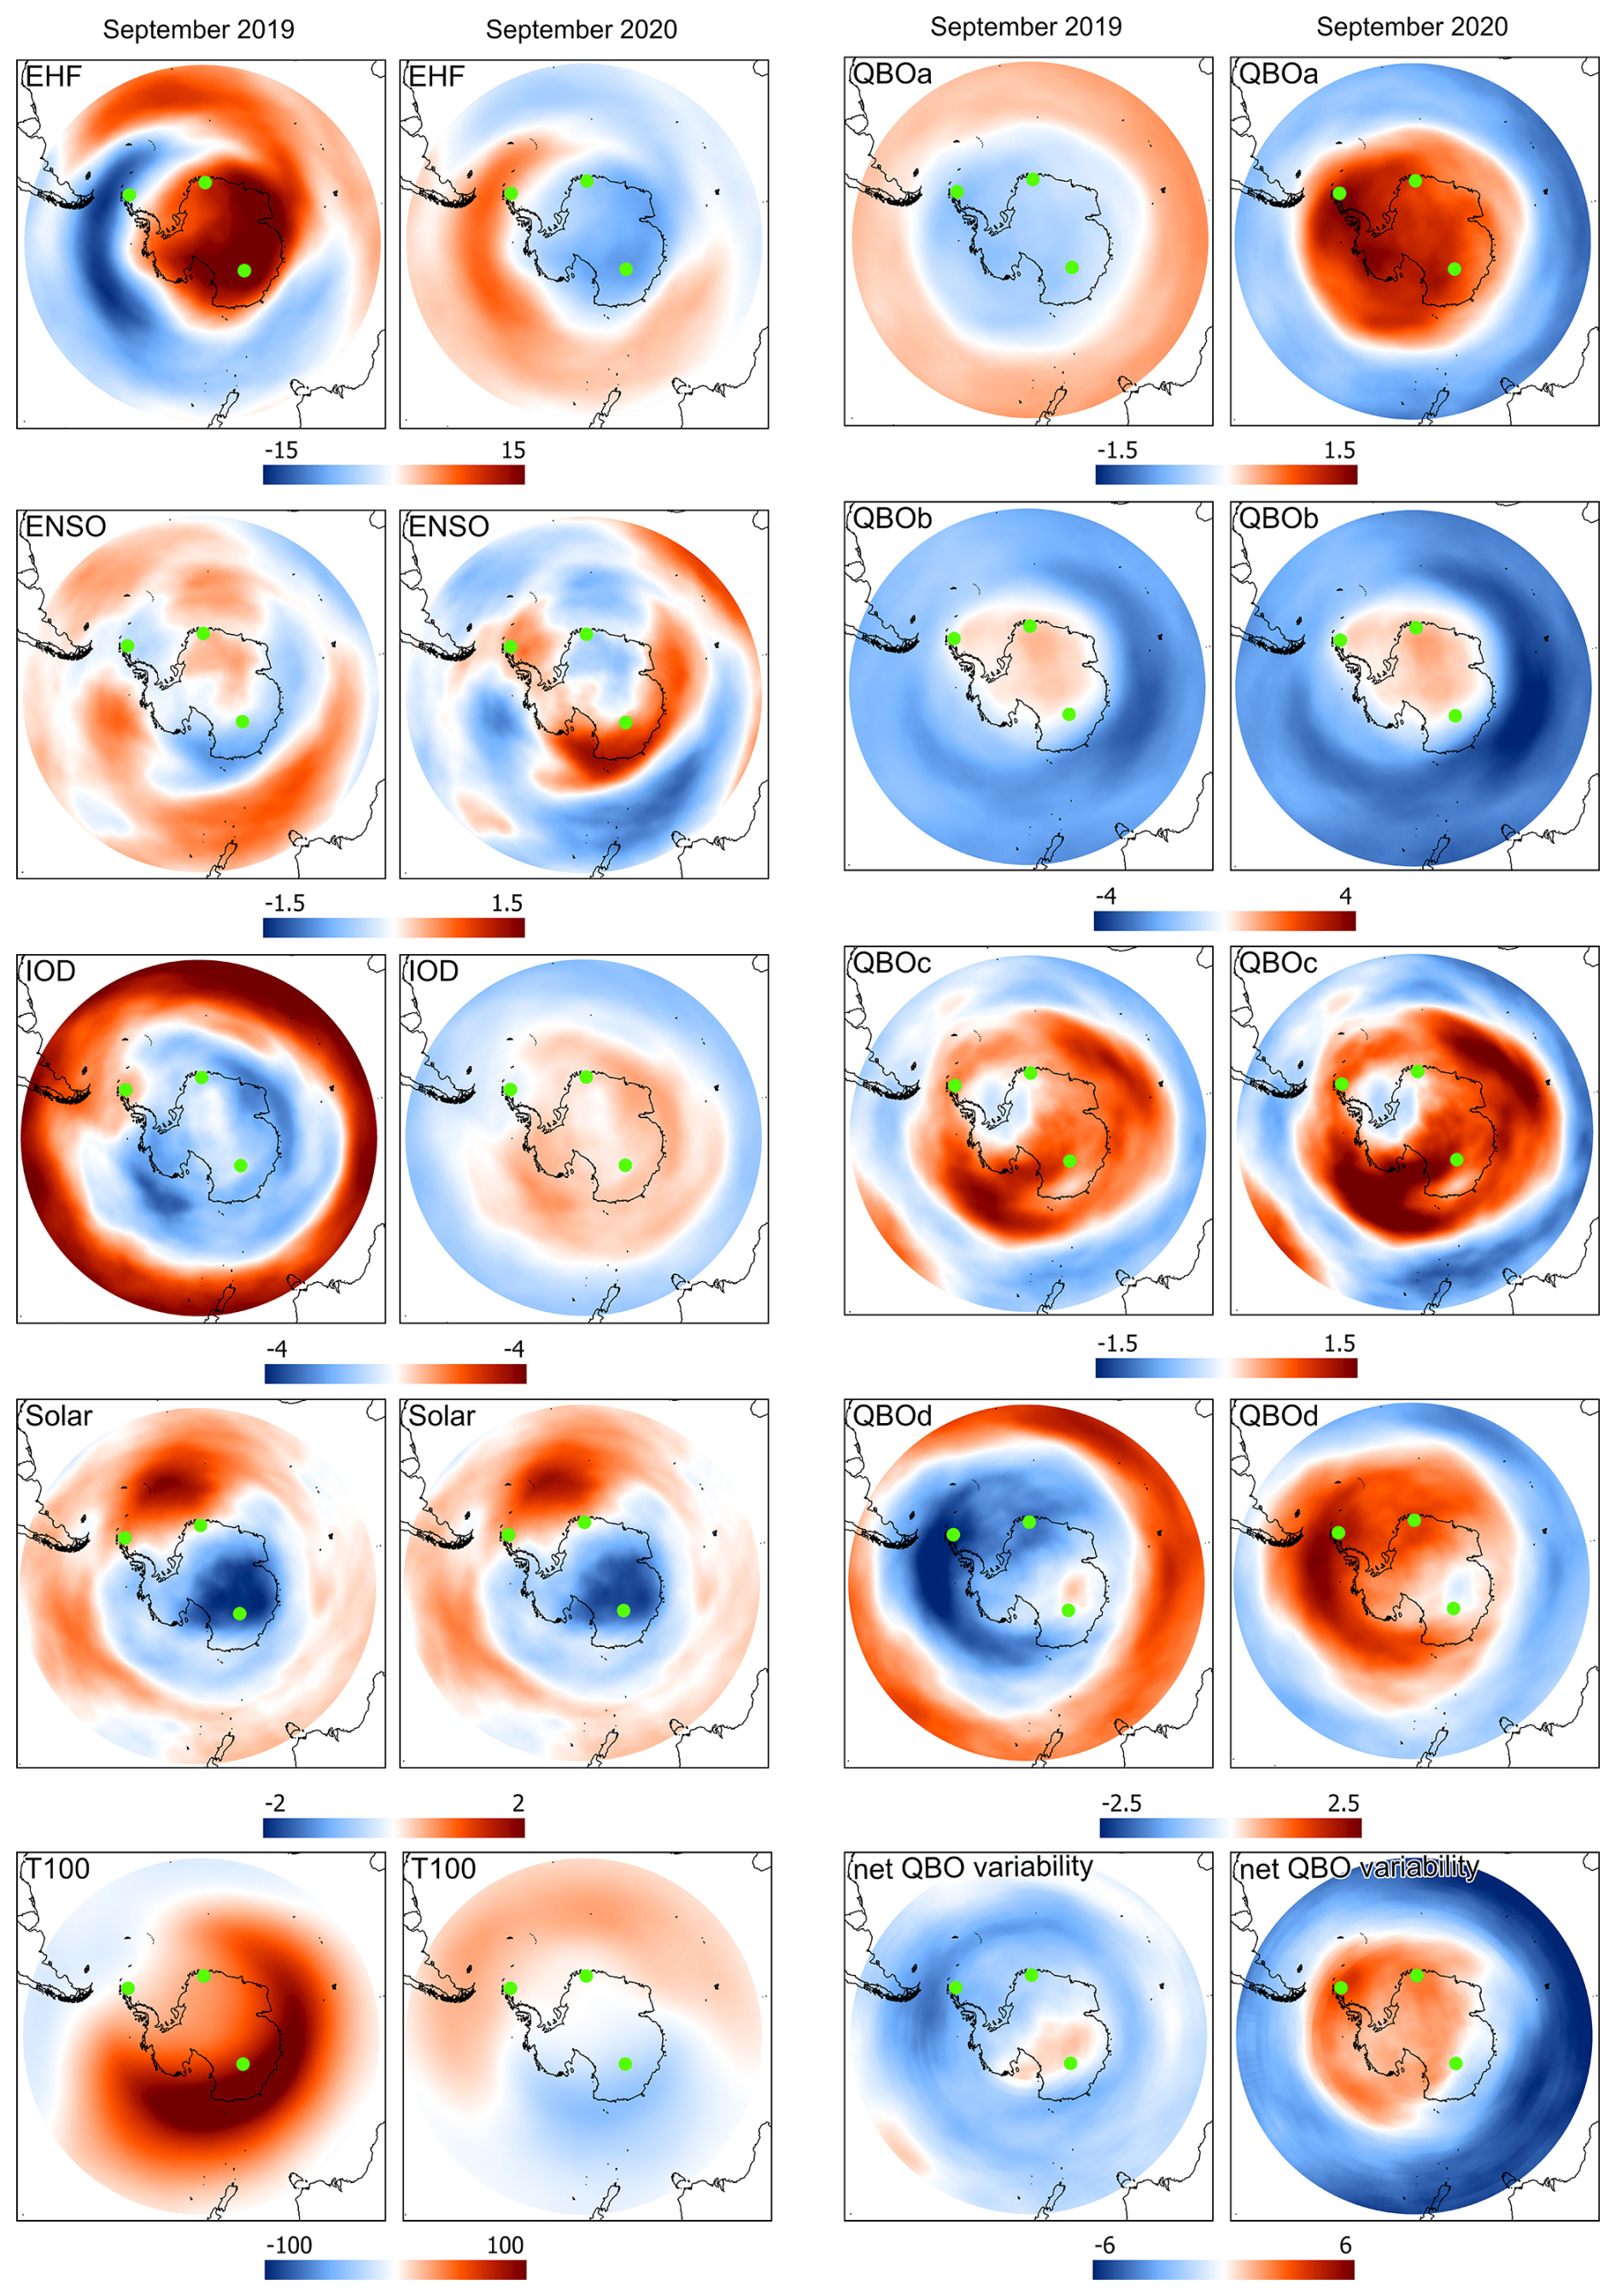
Figure 8Predictor contribution (βn⋅Xn, with coefficient βn and monthly means of predictor Xn) of TOC [DU] during September 2019 and 2020.
Figure 8 compares these two contrasting months in terms of the impact of individual LOTUS regression predictors. Similarly to the previous results presented in this study, lower stratospheric temperature (T100) had the greatest impact on the TOC. In September 2019, the relatively high T100 led to a more than 100 DU increase in TOC in East Antarctica. These results are closely related to the observed temperature contributions to TOC variability in September 2019 and 2020 at individual stations. For example, in September 2019, there was a 60 % increase in TOC compared to the long-term average observed at the Concordia station. The area of significant TOC increase due to higher stratospheric temperatures in September 2019 corresponds to the stratospheric disturbance by a planetary wave with wavenumber 1 (Mitra et al., 2021; Liu et al., 2022). Based on MERRA-2 reanalyses, on 5–11 September 2019, a strong planetary wave during the SSW caused a remarkable temperature increase of 50.8 K (Yamazaki et al., 2020; Lim et al., 2021). This exceeded even the 2002 Antarctic SSW event, when the southern stratospheric polar vortex split in two and when the maximum warming was 38.5 K per week (Leroux and Noel, 2024). In late August 2019, the rapid warming of the stratosphere led to a significant decrease in polar stratospheric clouds (PSC) densities between 50 and 150 hPa (Leroux and Noel, 2024). The unusually high temperature in the polar Antarctic stratosphere leads to a slowdown of the heterogeneous reactions that activate Cl on the surface of PSC, thus slowing ozone depletion and suppressing the formation of the Antarctic ozone anomaly during the Antarctic spring (Liu et al., 2022).
The contribution of the EHF is also significant, leading to an increase in TOC, especially in East Antarctica, by up to 15 DU in September 2019. In the period from August to September 2019, the EHF was the strongest since 1979 (Shen et al., 2020). Based on further decomposition of the EHF, Shen et al. (2020) found that the EHF is dominated by a planetary wave with wave number 1. This wave persisted for approximately 1 month, and during its maximum, it exceeded 10σ with respect to the period 1979–2019 (Shen et al., 2020). The stronger EHF (which is used as a proxy for BDC here) led to a stronger ozone transport from lower latitudes to polar regions (Rao et al., 2003, 2004). Planetary Rossby waves, which drive the BDC and can cause SSWs, represent the largest changes in stratospheric circulation during the winter season and significantly influence the interannual variability of stratospheric transport (Schoeberl, 1978; Butler et al., 2015; de la Cámara et al., 2018; Baldwin et al., 2021). In September 2020, a strong polar vortex blocked the transport of ozone from lower latitudes to the Antarctic stratosphere, resulting in ∼10 DU less TOC over Antarctica due to the EHF. More TOC was present at the edges of the polar vortex, which is clearly visible near the Marambio station.
Other predictors contributed to ozone variability in these two months only by up to 5 DU. It is evident that ENSO and IOD have opposite effects on TOC in both years, while the Solar factor is the same in both years. This implies that the low solar activity that occurred in these years (e.g. Ishkov, 2024) led to a decrease in TOC by approximately 2 DU over the Antarctic Continent and, conversely, increased TOC by approximately 2 DU in the South Atlantic. The QBO predictor components showed different effects on TOC in September 2019 and 2020; however, these differences reflect the natural variability of the QBO signal over time rather than being a direct response to warmer or colder stratospheric conditions. QBOa led to a slight decrease in TOC over Antarctica and an increase in TOC in the surrounding oceans under SSW conditions in September 2019; however, in September 2020, the QBOa effect had the opposite sign, likely due to the time-varying nature of the QBO signal rather than the colder stratosphere itself. The opposite effect was also evident in the case of QBOd, which led to a decrease in TOC in September 2019 and to an increase in September 2020, especially between Antarctica and South America. The remaining QBOb and QBOc showed consistent effects on TOC, independent of the polar stratospheric conditions. Overall, the net QBO variability had a positive influence on TOC over most of Antarctica in September 2020, whereas in September 2019 the effect was generally negative, with the exception of a small region in East Antarctica where a slight positive influence was observed.
The objective of this study was to assess trends in total ozone column (TOC) at three Antarctic stations; Marambio, Troll, and Concordia. Ground-based TOC time series were compared with satellite overpass observations and the MERRA-2 reanalysis. The satellite and reanalysis data agree on average within 1 % to 3 % with the ground-based time series. The ground-based measurements were supplemented then with OMI satellite data.
The LOTUS regression model was used to derive trends in the total ozone column from 2007 to 2023, the first use of this model for ground-based total ozone column data in Antarctica. In addition to the basic LOTUS predictors, additional regression predictors were examined. Lower stratospheric temperature was found to be a dominant predictor. Although T100 was the primary driver of TOC variability at all stations, station-specific influences were also identified, with QBO components playing a significant role at Marambio and Troll, and EHF contributing significantly at Troll and Concordia. The model incorporating the selected predictors accounts for a large portion of the variability in total ozone column at the Antarctic stations, as indicated by high adjusted coefficients of determination (). A statistically significant trend of 3.43 ± 3.22 DU per decade was found at Marambio station, but no significant trends were found at Troll and Concordia stations. Spring trends for September, October and November were statistically insignificant.
Using MERRA-2 reanalyses, the LOTUS regression model was then applied to each grid point in the 40–90° S region. The model was found to perform very well over the Southern Hemisphere, with the highest coefficients of determination () being achieved over West Antarctica and the surrounding oceans. A case study assessing the effects of individual predictors in September 2019 and 2020 found that the exceptionally warm lower stratosphere in September 2019 increased the total ozone column by more than 100 DU, especially over East Antarctica.
The observed trends at individual stations over Antarctica reflect ongoing ozone recovery, driven by the reduction of ozone-depleting substances. The absence of significant trends at some stations highlights that recovery is spatially variable and may be temporarily masked by the variability of the polar vortex and associated dynamical processes, which have been identified as key drivers of the unusually large Antarctic ozone holes in 2020–2023 (Wargan et al., 2025). Declining stratospheric temperatures may also influence the pace of ozone recovery, adding another uncertainty to observed trends. These results underscore the importance of long-term ground-based monitoring, combined with thorough analyses of ground-based, satellite, and reanalyzed data, for detecting ozone recovery over Antarctica. Overall, long-term datasets provide a valuable contribution to understanding TOC trends and the gradual healing of the ozone layer.
The total ozone column data from Marambio are the property of the Czech Hydrometeorological Institute, Hradec Králové, Czech Republic, and are the subject of the data policy of the above-mentioned institution. Any person interested in the underlying data should contact Martin Stránik, the head of the Solar and Ozone Observatory of the Czech Hydrometeorological Institute, Hradec Králové (martin.stranik@chmi.cz). The data from the Norwegian Troll station are available from NILU through Tove Svendby (tms@nilu.no). SAOZ data are accessible via the NDACC database (https://www-air.larc.nasa.gov/missions/ndacc/, last access: 15 July 2025; NDACC UVVIS Working Group, 2025) as well as through the SAOZ website (http://saoz.obs.uvsq.fr/, last access: 15 July 2025; French SAOZ Group (CNRS-UVSQ), 2025).
OMI and overpass data are available at the Aura validation centre, for OMI (OMTO3) through https://avdc.gsfc.nasa.gov/pub/data/satellite/Aura/OMI/V03/L2OVP/OMTO3/ (NASA Goddard Space Flight Center, 2025). The NCEP Reanalysis Derived data used for tropopause predictors were provided by the NOAA/OAR/ESRL PSL, Boulder, Colorado, USA, from their website at https://psl.noaa.gov/data/gridded/data.ncep.reanalysis.derived.tropopause.html (NOAA PSL, 2025). MERRA-2 data are available from NASA's Global Modelling and Assimilation Office (https://gmao.gsfc.nasa.gov/reanalysis/MERRA-2/, EarthData, 2025). The other sources for the predictors used in the trend model are given in Table 1. The R version of the data processing is available upon request by David Tichopád (david.tichopad@mail.muni.cz).
The supplement related to this article is available online at https://doi.org/10.5194/acp-26-1751-2026-supplement.
DT, KL, and TS designed the study; LM, TS and AP provided the resources; DT and TS designed the multiple linear regression model; DT performed the data analyses and prepared the original paper draft; and KČ, KL, TS, AP, BP and LM reviewed and edited the paper.
The contact author has declared that none of the authors has any competing interests.
Publisher's note: Copernicus Publications remains neutral with regard to jurisdictional claims made in the text, published maps, institutional affiliations, or any other geographical representation in this paper. The authors bear the ultimate responsibility for providing appropriate place names. Views expressed in the text are those of the authors and do not necessarily reflect the views of the publisher.
The authors gratefully acknowledge the Czech Hydrometeorological Institute (CHMI), Hradec Králové, Czech Republic, for providing the total ozone column data from the Marambio station. Special thanks go to Martin Stránik, head of the Solar and Ozone Observatory at CHMI, for facilitating access to the data. The authors are also grateful to the LAMBI laboratory and Marambio Base staff for operating the B199 Brewer spectrophotometer, namely to Michal Janouch, Ladislav Sieger, Michael Brohart, Martin Stráník, Peter Hrabčák, Vladimir Savastiouk, and Hector Ochoa. The authors gratefully acknowledge the support of the Institut National des Sciences de l'Univers (INSU) of the Centre National de la Recherche Scientifique (CNRS), the IPEV, and the Centre National d'Études Spatiales (CNES), which made the observations with the SAOZ instruments within the French ACTRIS Research Infrastructure possible. The authors also thank the technical teams responsible for operating the SAOZ instruments. The authors also thank the Norwegian Ministry of Climate and Environment for funding the NILU-UV measurements at Troll/Trollhaugen. Technical personnel from the Norwegian Polar Institute are responsible for the daily maintenance of the instrument.
We also acknowledge the NASA Goddard Space Flight Center for providing the OMI and overpass data (OMTO3) through the Aura Validation Data Center. The NCEP Reanalysis Derived data used for the tropopause-related predictors were kindly provided by the NOAA/OAR/ESRL Physical Sciences Laboratory, Boulder, Colorado, USA. We further thank NASA's Global Modeling and Assimilation Office for making the MERRA-2 reanalysis data available. We also thank the two referees for their helpful comments and constructive suggestions.
This research was funded by the projects Czech Antarctic Research Programme 2024 (VAN 2024), Ministry of Education, and the project of Masaryk University “MUNI/A/1648/2024”.
This paper was edited by Jayanarayanan Kuttippurath and reviewed by two anonymous referees.
Baldwin, M. P., Gray, L. J., Dunkerton, T. J., Hamilton, K., Haynes, P. H., Randel, W. J., Holton, J. R., Alexander, M. J., Hirota, I., Horinouchi, T., Jones, D. B. A., Kinnersley, J. S., Marquardt, C., Sato, K., and Takahashi, M.: The Quasi-Biennial Oscillation, Rev. Geophys., 39, 179–229, https://doi.org/10.1029/1999RG000073, 2001.
Baldwin, M. P., Ayarzagüena, B., Birner, T., Butchart, N., Butler, A. H., Charlton-Perez, A. J., Domeisen, D. I. V., Garfinkel, C. I., Garny, H., Gerber, E. P., Hegglin, M. I., Langematz, U., and Pedatella, N. M.: Sudden Stratospheric Warmings, Reviews of Geophysics, 59, https://doi.org/10.1029/2020RG000708, 2021.
Bass, A. M. and Paur, R. J.: The Ultraviolet Cross-Sections of Ozone: I. The Measurements, in: Atmospheric Ozone, edited by: Zerefos, C. S. and Ghazi, A., Springer, Dordrecht, https://doi.org/10.1007/978-94-009-5313-0_120, 1985.
Bastos, A., Running, S. W., Gouveia, C., and Trigo, R. M.: The global NPP dependence on ENSO: La Niña and the extraordinary year of 2011, J. Geophys. Res. Biogeosci., 118, 1247–1255, https://doi.org/10.1002/jgrg.20100, 2013.
Bernet, L., Svendby, T., Hansen, G., Orsolini, Y., Dahlback, A., Goutail, F., Pazmiño, A., Petkov, B., and Kylling, A.: Total ozone trends at three northern high-latitude stations, Atmos. Chem. Phys., 23, 4165–4184, https://doi.org/10.5194/acp-23-4165-2023, 2023.
Bhartia, P. K. and Wellemeyer, C.: TOMS V8 total O3 algorithm, in: OMI Algorithm Theoretical Basis Document, vol. II: OMI Ozone Products, edited by: Bhartia, P. K., 15–31, NASA Goddard Space Flight Center, Greenbelt, MD, 2002.
Bodeker, G. E. and Kremser, S.: Indicators of Antarctic ozone depletion: 1979 to 2019, Atmos. Chem. Phys., 21, 5289–5300, https://doi.org/10.5194/acp-21-5289-2021, 2021.
Bogumil, K., Orphal, J., Homann, T., Voigt, S., Spietz, P., Fleischmann, O. C., Vogel, A., Hartmann, M., Bovensmann, H., Frerik, J., and Burrows, J. P.: Measurements of molecular absorption spectra with the SCIAMACHY Pre-Flight Model: Instrument characterization and reference spectra for atmospheric remote sensing in the 230–2380 nm region, J. Photochem. Photobiol. A, 157, 167–184, 2003.
Brasseur, G. P. and Solomon, S.: Aeronomy of the Middle Atmosphere: Chemistry and Physics of the Stratosphere and Mesosphere, 3rd revised and enlarged edn., Springer, Dordrecht, https://doi.org/10.1007/1-4020-3824-0, 2005.
Brunner, D., Staehelin, J., Maeder, J. A., Wohltmann, I., and Bodeker, G. E.: Variability and trends in total and vertically resolved stratospheric ozone based on the CATO ozone data set, Atmos. Chem. Phys., 6, 4985–5008, https://doi.org/10.5194/acp-6-4985-2006, 2006.
Butler, A. H., Seidel, D. J., Hardiman, S. C., Butchart, N., Birner, T., and Match, A.: Defining Sudden Stratospheric Warmings, Bull. Am. Meteorol. Soc., 96, 1913–1928, https://doi.org/10.1175/BAMS-D-13-00173.1, 2015.
Chubachi, S.: On the cooling of stratospheric temperature at Syowa, Antarctica, Geophys. Res. Lett., 13, 1221–1223, https://doi.org/10.1029/GL013i012p01221, 1986.
Čížková, K., Láska, K., Metelka, L., and Staněk, M.: Intercomparison of ground- and satellite-based total ozone data products at Marambio Base, Antarctic Peninsula region, Atmosphere, 10, 721, https://doi.org/10.3390/atmos10110721, 2019.
Čížková, K., Láska, K., Metelka, L., and Staněk, M.: Assessment of spectral UV radiation at Marambio Base, Antarctic Peninsula, Atmos. Chem. Phys., 23, 4617–4636, https://doi.org/10.5194/acp-23-4617-2023, 2023.
Damadeo, R. P., Zawodny, J. M., and Thomason, L. W.: Reevaluation of stratospheric ozone trends from SAGE II data using a simultaneous temporal and spatial analysis, Atmos. Chem. Phys., 14, 13455–13470, https://doi.org/10.5194/acp-14-13455-2014, 2014.
de la Cámara, A., Abalos, M., Hitchcock, P., Calvo, N., and Garcia, R. R.: Response of Arctic ozone to sudden stratospheric warmings, Atmos. Chem. Phys., 18, 16499–16513, https://doi.org/10.5194/acp-18-16499-2018, 2018.
de Laat, A. T. J., van Weele, M., and van der A, R. J.: Onset of Stratospheric Ozone Recovery in the Antarctic Ozone Hole in Assimilated Daily Total Ozone Columns, Journal of Geophysical Research: Atmospheres, 122, https://doi.org/10.1002/2016JD025723, 2017.
De Mazière, M., Thompson, A. M., Kurylo, M. J., Wild, J. D., Bernhard, G., Blumenstock, T., Braathen, G. O., Hannigan, J. W., Lambert, J.-C., Leblanc, T., McGee, T. J., Nedoluha, G., Petropavlovskikh, I., Seckmeyer, G., Simon, P. C., Steinbrecht, W., and Strahan, S. E.: The Network for the Detection of Atmospheric Composition Change (NDACC): history, status and perspectives, Atmos. Chem. Phys., 18, 4935–4964, https://doi.org/10.5194/acp-18-4935-2018, 2018.
Durbin, J. and Watson, G. S.: Testing for Serial Correlation in Least Squares Regression: I, Biometrika, 37, 409, https://doi.org/10.2307/2332391, 1950.
EarthData: MERRA-2 tavg1_2d_slv_Nx: 2d, 1-Hourly, Time-Averaged, Single-Level, Assimilation, Single-Level Diagnostics V5.12.4 (M2T1NXSLV), NASA [data set], https://gmao.gsfc.nasa.gov/reanalysis/MERRA-2/, last access: 7 August 2025.
Eswaraiah, S., Kim, J., Lee, W., Hwang, J., Kumar, K. N., and Kim, Y. H.: Unusual Changes in the Antarctic Middle Atmosphere During the 2019 Warming in the Southern Hemisphere, Geophys. Res. Lett., 47, https://doi.org/10.1029/2020GL089199, 2020.
Farman, J. C., Gardiner, B. G., and Shanklin, J. D.: Large losses of total ozone in Antarctica reveal seasonal interaction, Nature, 315, 207–210, https://doi.org/10.1038/315207a0, 1985.
Fioletov, V., Zhao, X., Abboud, I., Brohart, M., Ogyu, A., Sit, R., Lee, S. C., Petropavlovskikh, I., Miyagawa, K., Johnson, B. J., Cullis, P., Booth, J., McConville, G., and McElroy, C. T.: Total ozone variability and trends over the South Pole during the wintertime, Atmos. Chem. Phys., 23, 12731–12751, https://doi.org/10.5194/acp-23-12731-2023, 2023.
Fleming, E. L., Newman, P. A., Liang, Q., and Oman, L. D.: Stratospheric Temperature and Ozone Impacts of the Hunga Tonga-Hunga Ha'apai Water Vapor Injection, Journal of Geophysical Research: Atmospheres, 129, https://doi.org/10.1029/2023JD039298, 2024.
Gabriel, A. and Schmitz, G.: The Influence of Large-Scale Eddy Flux Variability on the Zonal Mean Ozone Distribution, J. Clim., 16, 2615–2627, https://doi.org/10.1175/1520-0442(2003)016<2615:TIOLEF>2.0.CO;2, 2003.
Gelaro, R., McCarty, W., Suárez, M. J., Todling, R., Molod, A., Takacs, L., Randles, C. A., Darmenov, A., Bosilovich, M. G., Reichle, R., Wargan, K., Coy, L., Cullather, R., Draper, C., Akella, S., Buchard, V., Conaty, A., da Silva, A. M., Gu, W., Kim, G.-K., Koster, R., Lucchesi, R., Merkova, D., Nielsen, J. E., Partyka, G., Pawson, S., Putman, W., Rienecker, M., Schubert, S. D., Sienkiewicz, M., and Zhao, B.: The Modern-Era Retrospective Analysis for Research and Applications, Version 2 (MERRA-2), J. Climate, 30, 5419–5454, https://doi.org/10.1175/JCLI-D-16-0758.1, 2017.
Hendon, H. H., Thompson, D. W. J., Lim, E.-P., Butler, A. H., Newman, P. A., Coy, L., Scaife, A., Polichtchouk, I., Garreaud, R. S., Shepherd, T. G., and Nakamura, H.: Rare forecasted climate event under way in the Southern Hemisphere, Nature, 573, 495–495, https://doi.org/10.1038/d41586-019-02858-0, 2019.
Hendrick, F., Pommereau, J.-P., Goutail, F., Evans, R. D., Ionov, D., Pazmino, A., Kyrö, E., Held, G., Eriksen, P., Dorokhov, V., Gil, M., and Van Roozendael, M.: NDACC/SAOZ UV-visible total ozone measurements: improved retrieval and comparison with correlative ground-based and satellite observations, Atmos. Chem. Phys., 11, 5975–5995, https://doi.org/10.5194/acp-11-5975-2011, 2011.
Ishkov, V. N.: Current Solar Cycle 25 on the Eve of the Maximum Phase, Geomagnetism and Aeronomy, 64, 1167–1175, https://doi.org/10.1134/S0016793224700257, 2024.
Johnson, B. J., Cullis, P., Booth, J., Petropavlovskikh, I., McConville, G., Hassler, B., Morris, G. A., Sterling, C., and Oltmans, S.: South Pole Station ozonesondes: variability and trends in the springtime Antarctic ozone hole 1986–2021, Atmos. Chem. Phys., 23, 3133–3146, https://doi.org/10.5194/acp-23-3133-2023, 2023.
Kazantzidis, A. Bais, A. F., Zempila, M. M., Meleti, C., Eleftheratos, K., and Zerefos, C. S.: Evaluation of ozone column measurements over Greece with NILU-UV multi-channel radiometers, Int. J. Remote Sens., 30, 4273–4281, 2009.
Keeble, J., Braesicke, P., Abraham, N. L., Roscoe, H. K., and Pyle, J. A.: The impact of polar stratospheric ozone loss on Southern Hemisphere stratospheric circulation and climate, Atmos. Chem. Phys., 14, 13705–13717, https://doi.org/10.5194/acp-14-13705-2014, 2014.
Kessenich, H. E., Seppälä, A., and Rodger, C. J.: Potential drivers of the recent large Antarctic ozone holes, Nat. Commun., 14, 7259, https://doi.org/10.1038/s41467-023-42637-0, 2023.
Klekociuk, A. R., Tully, M. B., Krummel, P. B., Gies, H. P., Alexander, S. P., Fraser, P. J., Henderson, S. I., Javorniczky, J., Petelina, S. V., Shanklin, J. D., Schofield, R., and Stone, K. A.: The Antarctic ozone hole during 2012, Aust. Meteorol. Oceanogr. J., 64, 313–330, 2014.
Klekociuk, A. R., Krummel, P. B., Tully, M. B., Gies, H. P., Alexander, S. P., Fraser, P. J., Henderson, S. I., Javorniczky, J., Shanklin, J. D., Schofield, R., and Stone, K. A.: The Antarctic Ozone Hole during 2013, Aust. Meteorol. Oceanogr. J., 65, 247–266, 2015.
Kozubek, M., Krizan, P., Ramatheerthan, S. K., and Laštovička, J.: Large Ozone Hole in 2023 and the Hunga Tonga Volcanic Eruption, Pure Appl. Geophys., 181, 2391–2402, https://doi.org/10.1007/s00024-024-03546-5, 2024.
Kuttippurath, J. and Nair, P. J.: The signs of Antarctic ozone hole recovery, Sci. Rep., 7, 585, https://doi.org/10.1038/s41598-017-00722-7, 2017.
Kuttippurath, J., Kumar, P., Nair, P. J., and Pandey, P. C.: Emergence of ozone recovery evidenced by reduction in the occurrence of Antarctic ozone loss saturation, NPJ Clim. Atmos. Sci., 1, 42, https://doi.org/10.1038/s41612-018-0052-6, 2018.
Leroux, M. and Noel, V.: Investigating long-term changes in polar stratospheric clouds above Antarctica during past decades: a temperature-based approach using spaceborne lidar detections, Atmos. Chem. Phys., 24, 6433–6454, https://doi.org/10.5194/acp-24-6433-2024, 2024.
Lim, E., Zhou, L., Young, G., Abhik, S., Rudeva, I., Hope, P., Wheeler, M. C., Arblaster, J. M., Hendon, H. H., Manney, G. L., Son, S., Oh, J., and Garreaud, R. D.: Predictability of the 2020 Strong Vortex in the Antarctic Stratosphere and the Role of Ozone, Journal of Geophysical Research: Atmospheres, 129, https://doi.org/10.1029/2024JD040820, 2024.
Lim, E.-P., Hendon, H. H., Butler, A. H., Thompson, D. W. J., Lawrence, Z. D., Scaife, A. A., Shepherd, T. G., Polichtchouk, I., Nakamura, H., Kobayashi, C., Comer, R., Coy, L., Dowdy, A., Garreaud, R. D., Newman, P. A., and Wang, G.: The 2019 Southern Hemisphere Stratospheric Polar Vortex Weakening and Its Impacts, Bull. Am. Meteorol. Soc., 102, E1150–E1171, https://doi.org/10.1175/BAMS-D-20-0112.1, 2021.
Lin, J. and Qian, T.: Impacts of the ENSO Lifecycle on Stratospheric Ozone and Temperature, Geophys. Res. Lett., 46, 10646–10658, https://doi.org/10.1029/2019GL083697, 2019.
Liu, G., Hirooka, T., Eguchi, N., and Krüger, K.: Dynamical evolution of a minor sudden stratospheric warming in the Southern Hemisphere in 2019, Atmos. Chem. Phys., 22, 3493–3505, https://doi.org/10.5194/acp-22-3493-2022, 2022.
Mitra, G., Guharay, A., Batista, P. P., and Buriti, R. A.: Impact of the September 2019 Minor Sudden Stratospheric Warming on the Low-Latitude Middle Atmospheric Planetary Wave Dynamics, Journal of Geophysical Research: Atmospheres, 127, https://doi.org/10.1029/2021JD035538, 2021.
NASA Goddard Space Flight Center: OMI overpass (OMTO3) data from the Aura Validation Data Center (AVDC), https://avdc.gsfc.nasa.gov/pub/data/satellite/Aura/OMI/V03/L2OVP/OMTO3/, last access: 3 March 2025.
Nash, E. R., Newman, P. A., Rosenfield, J. E., and Schoeberl, M. R.: An objective determination of the polar vortex using Ertel's potential vorticity, Journal of Geophysical Research: Atmospheres, 101, 9471–9478, https://doi.org/10.1029/96JD00066, 1996.
Newman, P. A. and Nash, E. R.: Quantifying the wave driving of the stratosphere, Journal of Geophysical Research: Atmospheres, 105, 12485–12497, https://doi.org/10.1029/1999JD901191, 2000.
Newman, P. A., Nash, E. R., Kawa, S. R., Montzka, S. A., and Schauffler, S. M.: When will the Antarctic ozone hole recover?, Geophys. Res. Lett., 33, https://doi.org/10.1029/2005GL025232, 2006.
Ningombam, S. S., Vemareddy, P., and Song, H.-J.: Effect of lower stratospheric temperature on total ozone column (TOC) during the ozone depletion and recovery phases, Atmos. Res., 232, 104686, https://doi.org/10.1016/j.atmosres.2019.104686, 2020.
NOAA PSL: NCEP Reanalysis Derived data for tropopause predictors, https://psl.noaa.gov/data/gridded/data.ncep.reanalysis.derived.tropopause.html, last access: 3 March 2025.
Oman, L. D., Douglass, A. R., Ziemke, J. R., Rodriguez, J. M., Waugh, D. W., and Nielsen, J. E.: The ozone response to ENSO in Aura satellite measurements and a chemistry-climate simulation: OZONE RESPONSE TO ENSO, J. Geophys. Res.-Atmos., 118, 965–976, https://doi.org/10.1029/2012JD018546, 2013.
Orphal, J.: A critical review of the absorption cross-sections of O3 and NO2 in the 240–790 nm region, J. Photochem. Photobiol. A: Chemistry, 157, 185–209, 2003.
Pazmiño, A., Godin-Beekmann, S., Hauchecorne, A., Claud, C., Khaykin, S., Goutail, F., Wolfram, E., Salvador, J., and Quel, E.: Multiple symptoms of total ozone recovery inside the Antarctic vortex during austral spring, Atmos. Chem. Phys., 18, 7557–7572, https://doi.org/10.5194/acp-18-7557-2018, 2018.
Pazmiño, A., Goutail, F., Godin-Beekmann, S., Hauchecorne, A., Pommereau, J.-P., Chipperfield, M. P., Feng, W., Lefèvre, F., Lecouffe, A., Van Roozendael, M., Jepsen, N., Hansen, G., Kivi, R., Strong, K., and Walker, K. A.: Trends in polar ozone loss since 1989: potential sign of recovery in the Arctic ozone column, Atmos. Chem. Phys., 23, 15655–15670, https://doi.org/10.5194/acp-23-15655-2023, 2023.
Plumb, R. A.: Stratospheric Transport, Journal of the Meteorological Society of Japan. Ser. II, 80, 793–809, https://doi.org/10.2151/jmsj.80.793, 2002.
Pommereau, J. P. and Goutail, F.: Stratospheric O3 and NO2 observations at the southern polar circle in summer and fall 1988, Geophys. Res. Lett., 15, 895–897, https://doi.org/10.1029/GL015i008p00895, 1988.
Rao, T. N., Kirkwood, S., Arvelius, J., von der Gathen, P., and Kivi, R.: Climatology of UTLS ozone and the ratio of ozone and potential vorticity over northern Europe, Journal of Geophysical Research: Atmospheres, 108, https://doi.org/10.1029/2003JD003860, 2003.
Rao, T. N., Arvelius, J., Kirkwood, S., and von der Gathen, P.: Climatology of ozone in the troposphere and lower stratosphere over the European Arctic, Advances in Space Research, 34, 754–758, https://doi.org/10.1016/j.asr.2003.05.055, 2004.
Redondas, A., Evans, R., Stuebi, R., Köhler, U., and Weber, M.: Evaluation of the use of five laboratory-determined ozone absorption cross sections in Brewer and Dobson retrieval algorithms, Atmos. Chem. Phys., 14, 1635–1648, https://doi.org/10.5194/acp-14-1635-2014, 2014.
Rienecker, M. M., Suarez, M. J., Gelaro, R., Todling, R., Bacmeister, J., Liu, E., Bosilovich, M. G., Schubert, S. D., Takacs, L., Kim, G.-K., Bloom, S., Chen, J., Collins, D., Conaty, A., da Silva, A., Gu, W., Joiner, J., Koster, R. D., Lucchesi, R., Molod, A., Owens, T., Pawson, S., Pegion, P., Redder, C. R., Reichle, R., Robertson, F. R., Ruddick, A. G., Sienkiewicz, M., and Woollen, J.: MERRA: NASA's Modern-Era Retrospective Analysis for Research and Applications, J. Climate, 24, 3624–3648, https://doi.org/10.1175/JCLI-D-11-00015.1, 2011.
Safieddine, S., Bouillon, M., Paracho, A., Jumelet, J., Tencé, F., Pazmino, A., Goutail, F., Wespes, C., Bekki, S., Boynard, A., Hadji-Lazaro, J., Coheur, P., Hurtmans, D., and Clerbaux, C.: Antarctic Ozone Enhancement During the 2019 Sudden Stratospheric Warming Event, Geophys. Res. Lett., 47, https://doi.org/10.1029/2020GL087810, 2020.
Salawitch, R. J. and McBride, L. A.: Australian wildfires depleted the ozone layer, Science (1979), 378, 829–830, https://doi.org/10.1126/science.add2056, 2022.
Santoso, A., Mcphaden, M. J., and Cai, W.: The Defining Characteristics of ENSO Extremes and the Strong 2015/2016 El Niño, Reviews of Geophysics, 55, 1079–1129, https://doi.org/10.1002/2017RG000560, 2017.
Scarnato, B., Staehelin, J., Stübi, R., and Schill, H.: Long-term total ozone observations at Arosa (Switzerland) with Dobson and Brewer instruments (1988–2007), Journal of Geophysical Research: Atmospheres, 115, https://doi.org/10.1029/2009JD011908, 2010.
Schoeberl, M. R.: Stratospheric warmings: Observations and theory, Reviews of Geophysics, 16, 521–538, https://doi.org/10.1029/RG016i004p00521, 1978.
Schoeberl, M. R., Douglass, A. R., Kawa, S. R., Dessler, A. E., Newman, P. A., Stolarski, R. S., Roche, A. E., Waters, J. W., and Russell, J. M.: Development of the Antarctic ozone hole, Journal of Geophysical Research: Atmospheres, 101, 20909–20924, https://doi.org/10.1029/96JD01707, 1996.
Schuenemeyer, J. H. and Drew, L. J.: Statistics for Earth and Environmental Scientists, Wiley, https://doi.org/10.1002/9780470650707, 2010.
Shapiro, S. S. and Wilk, M. B.: An Analysis of Variance Test for Normality (Complete Samples), Biometrika, 52, 591, https://doi.org/10.2307/2333709, 1965.
Shen, X., Wang, L., and Osprey, S.: Tropospheric Forcing of the 2019 Antarctic Sudden Stratospheric Warming, Geophys. Res. Lett., 47, https://doi.org/10.1029/2020GL089343, 2020.
Solomon, S.: Stratospheric ozone depletion: A review of concepts and history, Reviews of Geophysics, 37, 275–316, https://doi.org/10.1029/1999RG900008, 1999.
Solomon, S., Garcia, R. R., Rowland, F. S., and Wuebbles, D. J.: On the depletion of Antarctic ozone, Nature, 321, 755–758, https://doi.org/10.1038/321755a0, 1986.
Solomon, S., Portmann, R. W., Garcia, R. R., Randel, W., Wu, F., Nagatani, R., Gleason, J., Thomason, L., Poole, L. R., and McCormick, M. P.: Ozone depletion at mid-latitudes: Coupling of volcanic aerosols and temperature variability to anthropogenic chlorine, Geophys. Res. Lett., 25, 1871–1874, https://doi.org/10.1029/98GL01293, 1998.
Solomon, S., Ivy, D. J., Kinnison, D., Mills, M. J., Neely, R. R., and Schmidt, A.: Emergence of healing in the Antarctic ozone layer, Science (1979), 353, 269–274, https://doi.org/10.1126/science.aae0061, 2016.
SPARC/IO3C/GAW: SPARC/IO3C/GAW Report on Long-term Ozone Trends and Uncertainties in the Stratosphere, edited by: Petropavlovskikh, I., Godin-Beekmann, S., Hubert, D., Damadeo, R., Hassler, B., and Sofieva, V., SPARC Report No. 9, GAW Report No. 241, WCRP-17/2018, https://doi.org/10.17874/f899e57a20b, 2019.
Stone, K. A., Solomon, S., Kinnison, D. E., and Mills, M. J.: On Recent Large Antarctic Ozone Holes and Ozone Recovery Metrics, Geophys. Res. Lett., 48, https://doi.org/10.1029/2021GL095232, 2021.
Sztipanov, M., Tumeh, L., Li, W., Svendby, T., Kylling, A., Dahlback, A., Stamnes, J. J., Hansen, G., and Stamnes, K.: Ground-based measurements of total ozone column amount with a multichannel moderate-bandwidth filter instrument at the Troll research station, Antarctica, Appl. Opt., 59, 97, https://doi.org/10.1364/AO.59.000097, 2020.
Tully, M. B., Krummel, P. B., and Klekociuk, A. R.: Trends in Antarctic ozone hole metrics 2001–17, Journal of Southern Hemisphere Earth Systems Science, 69, 52, https://doi.org/10.1071/ES19020, 2019.
USask ARG and LOTUS Group: LOTUS regression, https://arg.usask.ca/docs/LOTUS_regression/ (last access: 15 July 2025), 2017.
Van Malderen, R., De Muer, D., De Backer, H., Poyraz, D., Verstraeten, W. W., De Bock, V., Delcloo, A. W., Mangold, A., Laffineur, Q., Allaart, M., Fierens, F., and Thouret, V.: Fifty years of balloon-borne ozone profile measurements at Uccle, Belgium: a short history, the scientific relevance, and the achievements in understanding the vertical ozone distribution, Atmos. Chem. Phys., 21, 12385–12411, https://doi.org/10.5194/acp-21-12385-2021, 2021.
Wang, W., Hong, J., Shangguan, M., Wang, H., Jiang, W., and Zhao, S.: Zonally asymmetric influences of the quasi-biennial oscillation on stratospheric ozone, Atmos. Chem. Phys., 22, 13695–13711, https://doi.org/10.5194/acp-22-13695-2022, 2022.
Wargan, K., Labow, G., Frith, S., Pawson, S., Livesey, N., and Partyka, G.: Evaluation of the ozone fields in NASA's MERRA-2 reanalysis, J. Climate, 30, 2961–2988, https://doi.org/10.1175/JCLI-D-16-0699.1, 2017.
Wargan, K., Weir, B., Manney, G. L., Cohn, S. E., and Livesey, N. J.: The Anomalous 2019 Antarctic Ozone Hole in the GEOS Constituent Data Assimilation System With MLS Observations, Journal of Geophysical Research: Atmospheres, 125, https://doi.org/10.1029/2020JD033335, 2020.
Wargan, K., Manney, G. L., and Livesey, N. J.: Factors Contributing to the Unusually Low Antarctic Springtime Ozone in 2020–2023, Journal of Geophysical Research: Atmospheres, https://doi.org/10.1029/2025JD043621, 2025.
Waugh, D. W. and Polvani, L. M.: Stratospheric polar vortices, 43–57, https://doi.org/10.1029/2009GM000887, 2010.
Weber, M., Coldewey-Egbers, M., Fioletov, V. E., Frith, S. M., Wild, J. D., Burrows, J. P., Long, C. S., and Loyola, D.: Total ozone trends from 1979 to 2016 derived from five merged observational datasets – the emergence into ozone recovery, Atmos. Chem. Phys., 18, 2097–2117, https://doi.org/10.5194/acp-18-2097-2018, 2018.
Weber, M., Arosio, C., Coldewey-Egbers, M., Fioletov, V. E., Frith, S. M., Wild, J. D., Tourpali, K., Burrows, J. P., and Loyola, D.: Global total ozone recovery trends attributed to ozone-depleting substance (ODS) changes derived from five merged ozone datasets, Atmos. Chem. Phys., 22, 6843–6859, https://doi.org/10.5194/acp-22-6843-2022, 2022.
Yamazaki, Y., Matthias, V., Miyoshi, Y., Stolle, C., Siddiqui, T., Kervalishvili, G., Laštovička, J., Kozubek, M., Ward, W., Themens, D. R., Kristoffersen, S., and Alken, P.: September 2019 Antarctic Sudden Stratospheric Warming: Quasi-6-Day Wave Burst and Ionospheric Effects, Geophys. Res. Lett., 47, https://doi.org/10.1029/2019GL086577, 2020.
Zhao, X., Weaver, D., Bognar, K., Manney, G., Millán, L., Yang, X., Eloranta, E., Schneider, M., and Strong, K.: Cyclone-induced surface ozone and HDO depletion in the Arctic, Atmos. Chem. Phys., 17, 14955–14974, https://doi.org/10.5194/acp-17-14955-2017, 2017.
Zhao, X., Bognar, K., Fioletov, V., Pazmino, A., Goutail, F., Millán, L., Manney, G., Adams, C., and Strong, K.: Assessing the impact of clouds on ground-based UV–visible total column ozone measurements in the high Arctic, Atmos. Meas. Tech., 12, 2463–2483, https://doi.org/10.5194/amt-12-2463-2019, 2019.
Zhao, X., Fioletov, V., Brohart, M., Savastiouk, V., Abboud, I., Ogyu, A., Davies, J., Sit, R., Lee, S. C., Cede, A., Tiefengraber, M., Müller, M., Griffin, D., and McLinden, C.: The world Brewer reference triad – updated performance assessment and new double triad, Atmos. Meas. Tech., 14, 2261–2283, https://doi.org/10.5194/amt-14-2261-2021, 2021.
Zhu, Y., Toon, O. B., Kinnison, D., Harvey, V. L., Mills, M. J., Bardeen, C. G., Pitts, M., Bčgue, N., Renard, J., Berthet, G., and Jégou, F.: Stratospheric Aerosols, Polar Stratospheric Clouds, and Polar Ozone Depletion After the Mount Calbuco Eruption in 2015, Journal of Geophysical Research: Atmospheres, 123, https://doi.org/10.1029/2018JD028974, 2018.