the Creative Commons Attribution 4.0 License.
the Creative Commons Attribution 4.0 License.
 | 05 Sep 2025
Measurement report: New particle formation events observed during the COALA-2020 campaign
Jhonathan Ramirez-Gamboa
Melita Keywood
Ruhi Humphries
Asher Mouat
Jennifer Kaiser
Malcom Possell
Jack Simmons
Travis Naylor
Aerosols play an important role in atmospheric processes influencing cloud formation, scattering and absorbing solar radiation and affecting trace gases through chemical reactions occurring in and on aerosol particles. Ultimately, aerosols affect the radiative balance of the Earth, modifying climate. A large fraction of aerosols is formed through chemical reactions following gas-to-particulate processes in the atmosphere: nucleation and growth. Biogenic secondary organic aerosols (BSOAs) are formed when plant-produced volatile organic compounds (VOCs) react in the atmosphere through gas-phase oxidation. One of the highest biogenic VOC (BVOC)-emitting regions in the world is Southeast Australia due to the high density of Eucalyptus species. The Characterizing Organics and Aerosol Loading over Australia (COALA)-2020 (Characterizing Organics and Aerosol Loading over Australia) campaign worked towards gaining a better understanding of biogenic VOCs in quasi-pristine conditions in the atmosphere and their role in particle formation.
The observations showed a highly reactive atmosphere with frequent new particle formation (NPF) occurring (42 % d with data), often associated with pollution plumes. Analysis of NPF events suggested that SO2 plumes likely triggered particle formation, while particle growth depended on available VOCs and hydroxyl radicals, and the presence of multiple SO2 intrusions promoted the growth of smaller clusters. Nighttime NPF events coincided with monoterpene ozonolysis but were rare. These findings highlight the significant role of biogenic VOCs in driving NPF and secondary organic aerosol (SOA) formation in Southeast Australia. The COALA-2020 campaign provided valuable insights into local atmospheric chemistry and its potential impact on regional air quality and climate. However, longer-term observations are crucial to understand seasonal variations, trends, and extreme events.
- Article
(9702 KB) - Full-text XML
-
Supplement
(2318 KB) - BibTeX
- EndNote


Aerosols can influence our health (Annesi-Maesano et al., 2013; Shi et al., 2016) but also play an important role in regulating Earth's energy balance, the hydrological cycle, and even the abundance of key chemical species in the atmosphere such as hydroxyl radicals (OH) and, indirectly, greenhouse gases (e.g. Kerminen et al., 2012). The chemical composition, size, and concentration of aerosols determine the effects on health and the environment (Liu et al., 2016b; Pope and Dockery, 2006; Ren et al., 2017). Aerosols can be directly emitted (primary aerosols), or they can be a product of chemical reactions in the atmosphere (secondary aerosols) (Pöschl, 2005).
Secondary aerosols are produced via a gas-to-particle transition. New particle formation (NPF) occurs when multiple reactions in the atmosphere create stable molecular clusters. Once the clusters are formed, they can grow through coagulation and condensation, potentially resulting in cloud condensation nuclei (CCN) (Dal Maso et al., 2005; Hussein et al., 2005; Kulmala et al., 2001). Multiple factors determine NPF in the atmosphere, including the atmosphere composition and boundary conditions (temperature, humidity, planetary boundary layer (PBL) height, and turbulence) (Bousiotis et al., 2021; Wu et al., 2021; Xu et al., 2021a). Sulfuric acid (H2SO4) is one of the main drivers of the nucleation process in the continental boundary layer, but it does not explain all growth and nucleation rates (Sihto et al., 2006). The presence of ammonia (NH3), amines, or ions in the atmosphere can enhance H2SO4 nucleation rates (Kirkby et al., 2023; Zhao et al., 2011; Zheng et al., 2015). High levels of SO2 and volatile organic compounds (VOCs) will enhance NPF (Nestorowicz et al., 2018; Song et al., 2019, p.20; Xu et al., 2021).
VOCs are a group of carbon-based gases emitted by biological and anthropogenic sources that are characterized by their high vapour pressure (Goldstein and Galbally, 2007; Kesselmeier and Staudt, 1999; Matsui, 2006). VOCs can undergo hydroxyl radical (OH), ozone, or nitrate radical (NO3) oxidation in the gas phase, producing compounds of varying volatilities, and products with low enough volatility can contribute to NPF or partition to existing particles, resulting in particle growth.
The most common biogenic VOC (BVOC) is isoprene, followed by monoterpenes. BVOCs play an important role in secondary organic aerosol (SOA) formation (e.g. Mahilang et al., 2021). VOCs have been associated with particle growth (Riipinen et al., 2012), but their role and the autoxidation mechanism were not understood until recently (Bianchi et al., 2019). Autoxidation of monoterpenes supports the particle growth process by generating highly oxygenated molecules (HOMs) via the formation of peroxy radicals (Bianchi et al., 2019; Kirkby et al., 2023; Lehtipalo et al., 2018). HOMs can be characterized as ultra-low VOCs (ULVOCs) or extremely low VOCs (ELVOCs) depending upon the saturation concentration (Bianchi et al., 2019; Peräkylä et al., 2020).
Oxidation of monoterpenes is a significant pathway for SOA formation, yielding higher amounts of low-volatility molecules like ULVOCs and ELVOCs compared to isoprene oxidation (Friedman and Farmer, 2018; Lee et al., 2023; Luo et al., 2024; Riva et al., 2019; Zhang et al., 2018). HOMs are key precursors for new particle formation. However, the atmospheric production of HOMs can be limited by competing reactions and the presence of other VOCs. For instance, as a general principle, once a VOC molecule oxidizes, it becomes more complex and forms larger oxygenated VOCs (OVOCs) that are less likely to undergo further oxidation, especially in the presence of other VOCs with higher reactivity towards OH or O3 (Kiendler-Scharr et al., 2009). An example of this limitation is the suppression of monoterpene-derived HOM formation by isoprene oxidation products. These products can interfere with the formation of C20 dimers from monoterpene oxidation, leading to a reduced yield of HOMs and favouring the formation of weaker nucleating species C15 (Dada et al., 2023; Heinritzi et al., 2020; Liu et al., 2016a). This suppression effect is dynamic, varying non-linearly with the local atmospheric composition (e.g. isoprene and monoterpene concentrations, oxidant availability) and atmospheric conditions (e.g. temperature, humidity, stability), which ultimately determine the dominant SOA formation pathways (e.g. Song et al., 2019).
Understanding BVOC emissions and their role in SOA formation is important to accurately predict aerosol properties and their impact on climate. However, BVOCs are poorly characterized under Australian conditions (Paton-Walsh et al., 2022). MEGAN (Model of Emissions of Gases and Aerosols from Nature) emissions show Southeast Australia as one of the BVOC hot spots in the region (Guenther et al., 2012), but multiple modelling studies have shown that MEGAN emissions estimation might not represent local conditions correctly in this region (Emmerson et al., 2016, 2018, 2019). Most of the Australian forested regions are dominated by high emitting Eucalyptus species (ABARES, 2019; Aydin et al., 2014; Padhy and Varshney, 2005) that, combined with periods of high temperature and drought stress, create the conditions for high emissions/concentrations of BVOCs in the atmosphere (Emmerson et al., 2020; Fini et al., 2017; Ormeño et al., 2007). The emissions ratios of isoprene to other VOCs are poorly constrained, and the local chemistry is not well understood.
The Characterizing Organics and Aerosol Loading over Australia (COALA)-2020 campaign worked towards a better understanding of biogenic VOCs in quasi-pristine conditions in the atmosphere and their role in local atmospheric chemistry in Southeast Australia. COALA-2020 was a collaborative effort between local institutions – including the University of Wollongong, CSIRO, ANSTO, and the University of Sydney – and international peers from the Georgia Institute of Technology, the University of California, Irvine, Nagoya University, and Lancaster University. This part of the study focused on identifying and characterizing NPF events after the “Black Summer” 2019–2020 Australian bushfire season. Here, we focus on identifying drivers and conditions in which NPF started or were enhanced in the local environment.
2.1 The COALA-2020 campaign
The COALA-2020 campaign took place at Cataract Scout camp (34° S, 150° E) located 20 km north-northwest of Wollongong on the east coast of New South Wales (NSW), Australia. The site is surrounded by a heavily forested area mainly stocked with Eucalyptus species (see Fig. 1). North of the sampling site is a four-lane arterial road connecting the M1 motorway on the east coast with southwestern Sydney. Other possible anthropogenic sources impacting the site are two underground coal mine heads, located 1.5 km to the northeast and 2.5 km to the north. Further afield sources include the Sydney suburban area (around 18 km northwest), Sydney city (45 km north), Wollongong urban area, and Port Kembla steelworks in the southern part of Wollongong (28 km southeast).
The campaign was conducted from 17 January to 23 March 2020. The first period of the campaign (17 January to 5 February) was heavily impacted by smoke pollution from the bushfires affecting the region. On 5 February, a substantial rain event extinguished the fires and cleared the atmosphere of residual smoke pollution (Mouat et al., 2022; Simmons et al., 2022). The smoke pollution period has been removed from the analysis presented here because we focus on understanding atmospheric processes during more normal conditions. Thus, this paper presents the analysis of BVOCs alongside anthropogenic emissions and their role in NPF during the second part of the COALA-2020 ambient measurements campaign running from 5 February until 17 March 2020.
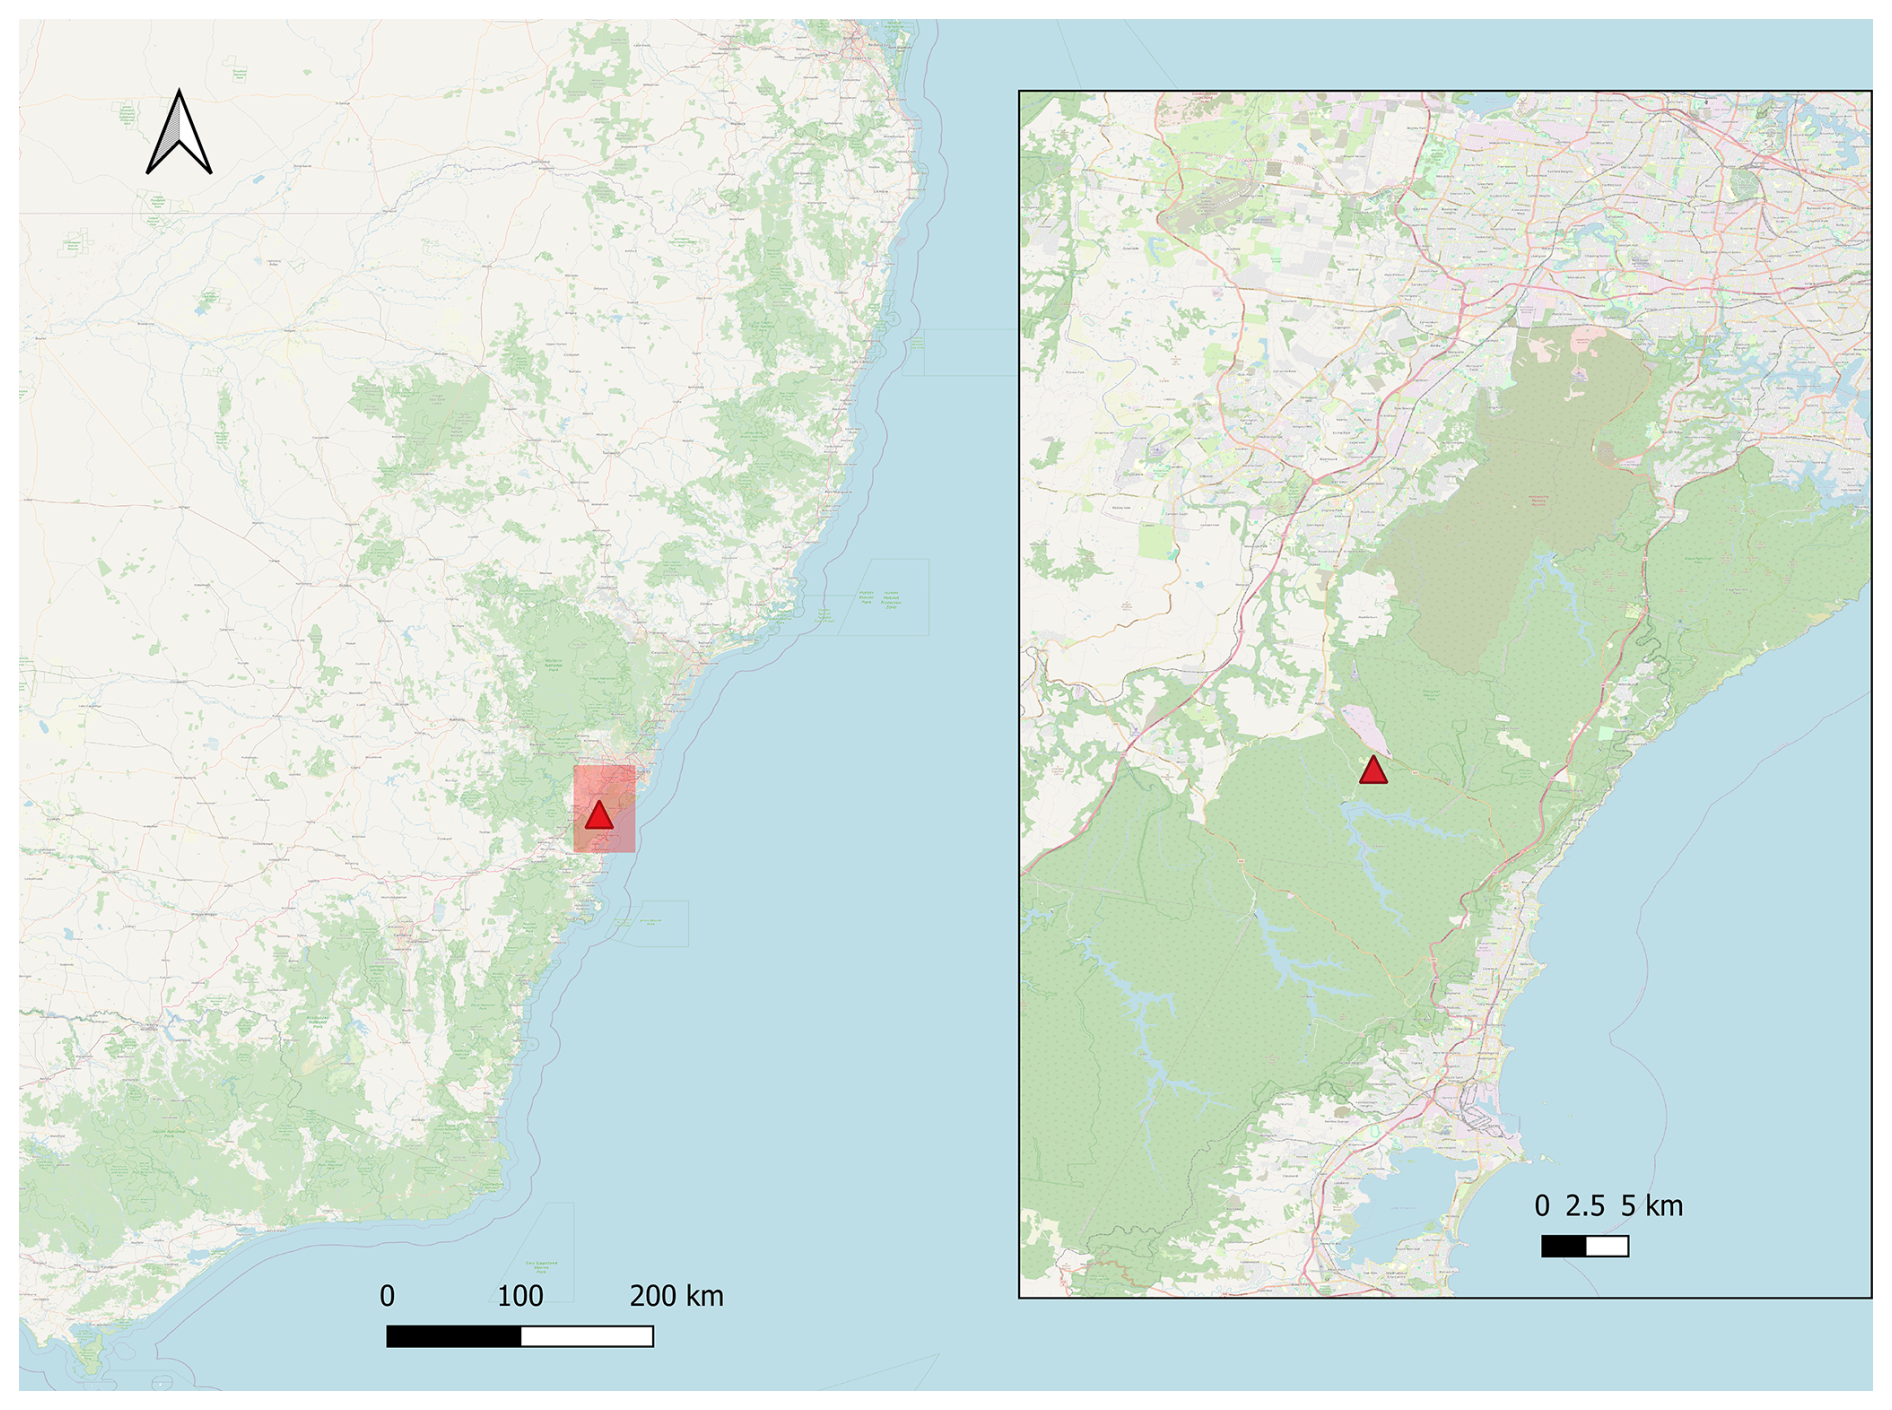
Figure 1Location of the sampling site relative to Sydney, NSW, in the north. The sampling site had four different climate control containers for the instruments, as well as a soil sampling site around 50 metres northeast from the main sampling site and the High-Vol PM filter. Map data: ©OpenStreetMap contributors 2025. Distributed under the Open Data Commons Open Database License (ODbL) v1.0.
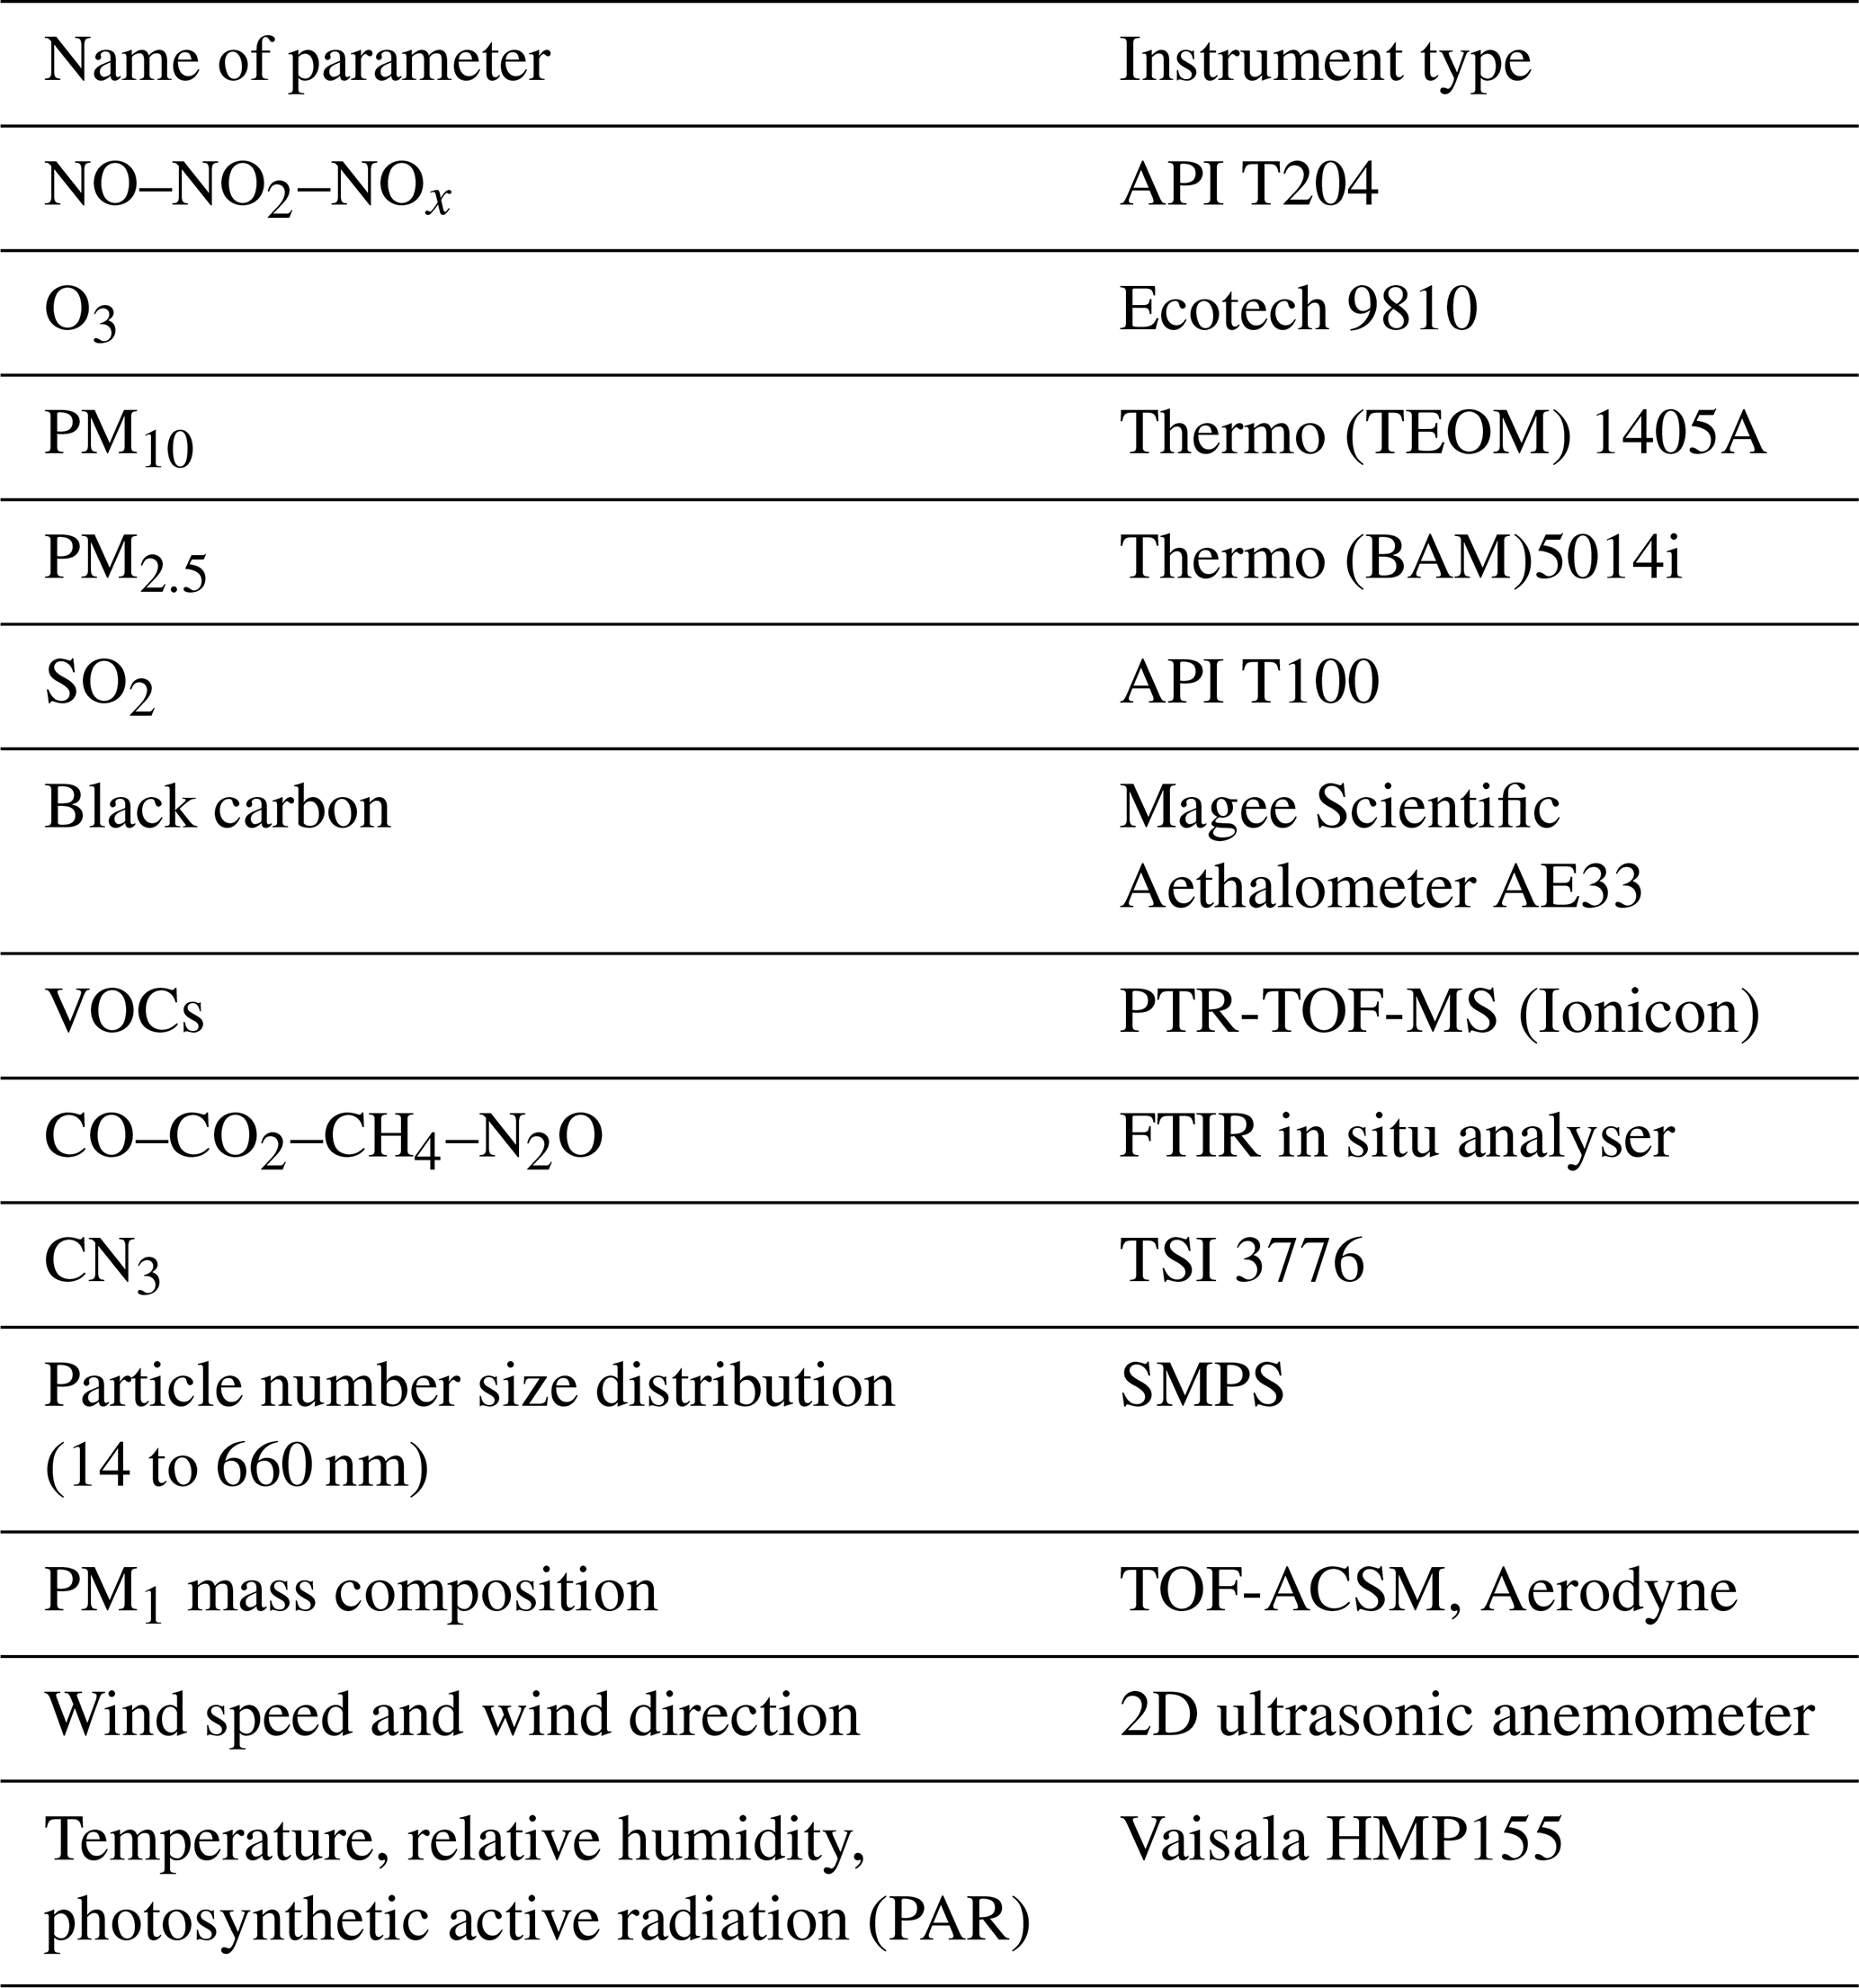
2.2 Instrumentation
The instruments deployed in the campaign are presented in Table 1. They included an air quality monitoring station owned and operated by the NSW Government Department of Climate Change, Energy, the Environment, and Water (DCCEEW), located approximately 10 m away from the main sampling line for VOCs. This station included measurements of temperature, wind speed and direction, PM10, PM2.5, O3, SO2, NOx, CO, and visibility. Inlet heights on this station were between 4.5 and 5.6 m above ground level. All NSW air quality monitoring stations are accredited by the National Association of Testing Authorities (Australia); however, it should be noted that these instruments are targeted at regulatory standards and are not research grade. In particular, this means that measurements made close to the detection limits are likely to be inaccurate and should be interpreted as indicative measures rather than accurate quantitative measures of atmospheric concentrations.
VOCs were measured using a proton transfer reaction mass spectrometer (Ionicon PTR-TOF-MS 4000), which operated with a mass range spanning –256. The drift tube was held at a temperature of 70 °C, pressure at 2.60 mbar, and an electric field to molecular number density ratio of 120 Td. The instrument was housed in a separate climate-controlled unit. Samples were drawn from an inlet on a 10 m mast through a 20 m long PTFE line using a bypass flow of 1.2–3 L min−1. Calibrations were made on site using standardized cylinders containing 17 compounds, including isoprene, monoterpenes, methyl vinyl ketone (MVK) & methacrolein (MACR), benzene, C8-aromatics, and C9-benzenes (Mouat et al., 2022). Mass spectra were integrated to produce data at 1 min temporal resolution. Mole fractions were further averaged on a 5 min basis.
A suite of aerosol instruments were operated within the Atmospheric Integrated Research facility for Boundaries and Oxidative eXperiment (AIRBOX) container (Chen et al., 2019). Sample air was drawn from a common aerosol bypass inlet. The inlet was located 5 m above ground level for the following instruments:
-
An Ultrafine Condensation Particle Counter (UCPC TSI 3776) was used to measure condensation nuclei number concentrations greater than 3 nm (CN3) (TSI Incorporated, Shoreview, MI, USA). The instrument was operated at a sample flow rate of 300 mL min−1. Measurements were recorded at 1 Hz temporal resolution.
-
A scanning mobility particle sizer (SMPS) was used to measure aerosol size distributions between 14 and 670 nm mobility diameter. Full scans of this size range were recorded every 5 min. The system consisted of an X-ray aerosol neutralizer and a 3071 Long Electrostatic Classifier (TSI Incorporated, Shoreview, MI, USA) coupled to a 3772 CPC (TSI Incorporated, Shoreview, MI, USA). Sample was drawn from the same inlet as used by the UCPC.
-
Chemical compositions of aerosols with diameters smaller than 1 µm (PM1) were taken using a Time-of-Flight Aerosol Chemical Speciation Monitor (ACSM; Aerodyne Research Inc., Billerica, MA, USA). Mass concentrations of organics (Org), sulfate (SO), nitrate (NO), ammonium (NH), and chloride (Cl−) in the aerosol fraction 40–1000 nm vacuum aerodynamic diameter range, referred to as PM1, are reported. Measurements were taken at 10 min resolution. Sample air was drawn from the aerosol inlet common to the CPC and SMPS and dried using a Nafion dryer to <40 % relative humidity before sampling.
Table 1Instruments deployed during the COALA-2020 campaign and included in the present analysis.
2.3 NPF classification method
The method proposed by Dal Maso et al. (2005) was used to classify the particle size distribution data. To apply the method, the particle number density plots were made for each day during the campaign, and the plots were visually inspected to identify if an event occurred on that day. A day of data was classified as an event if there was nucleation and growth up to 25 nm for at least 2 h.
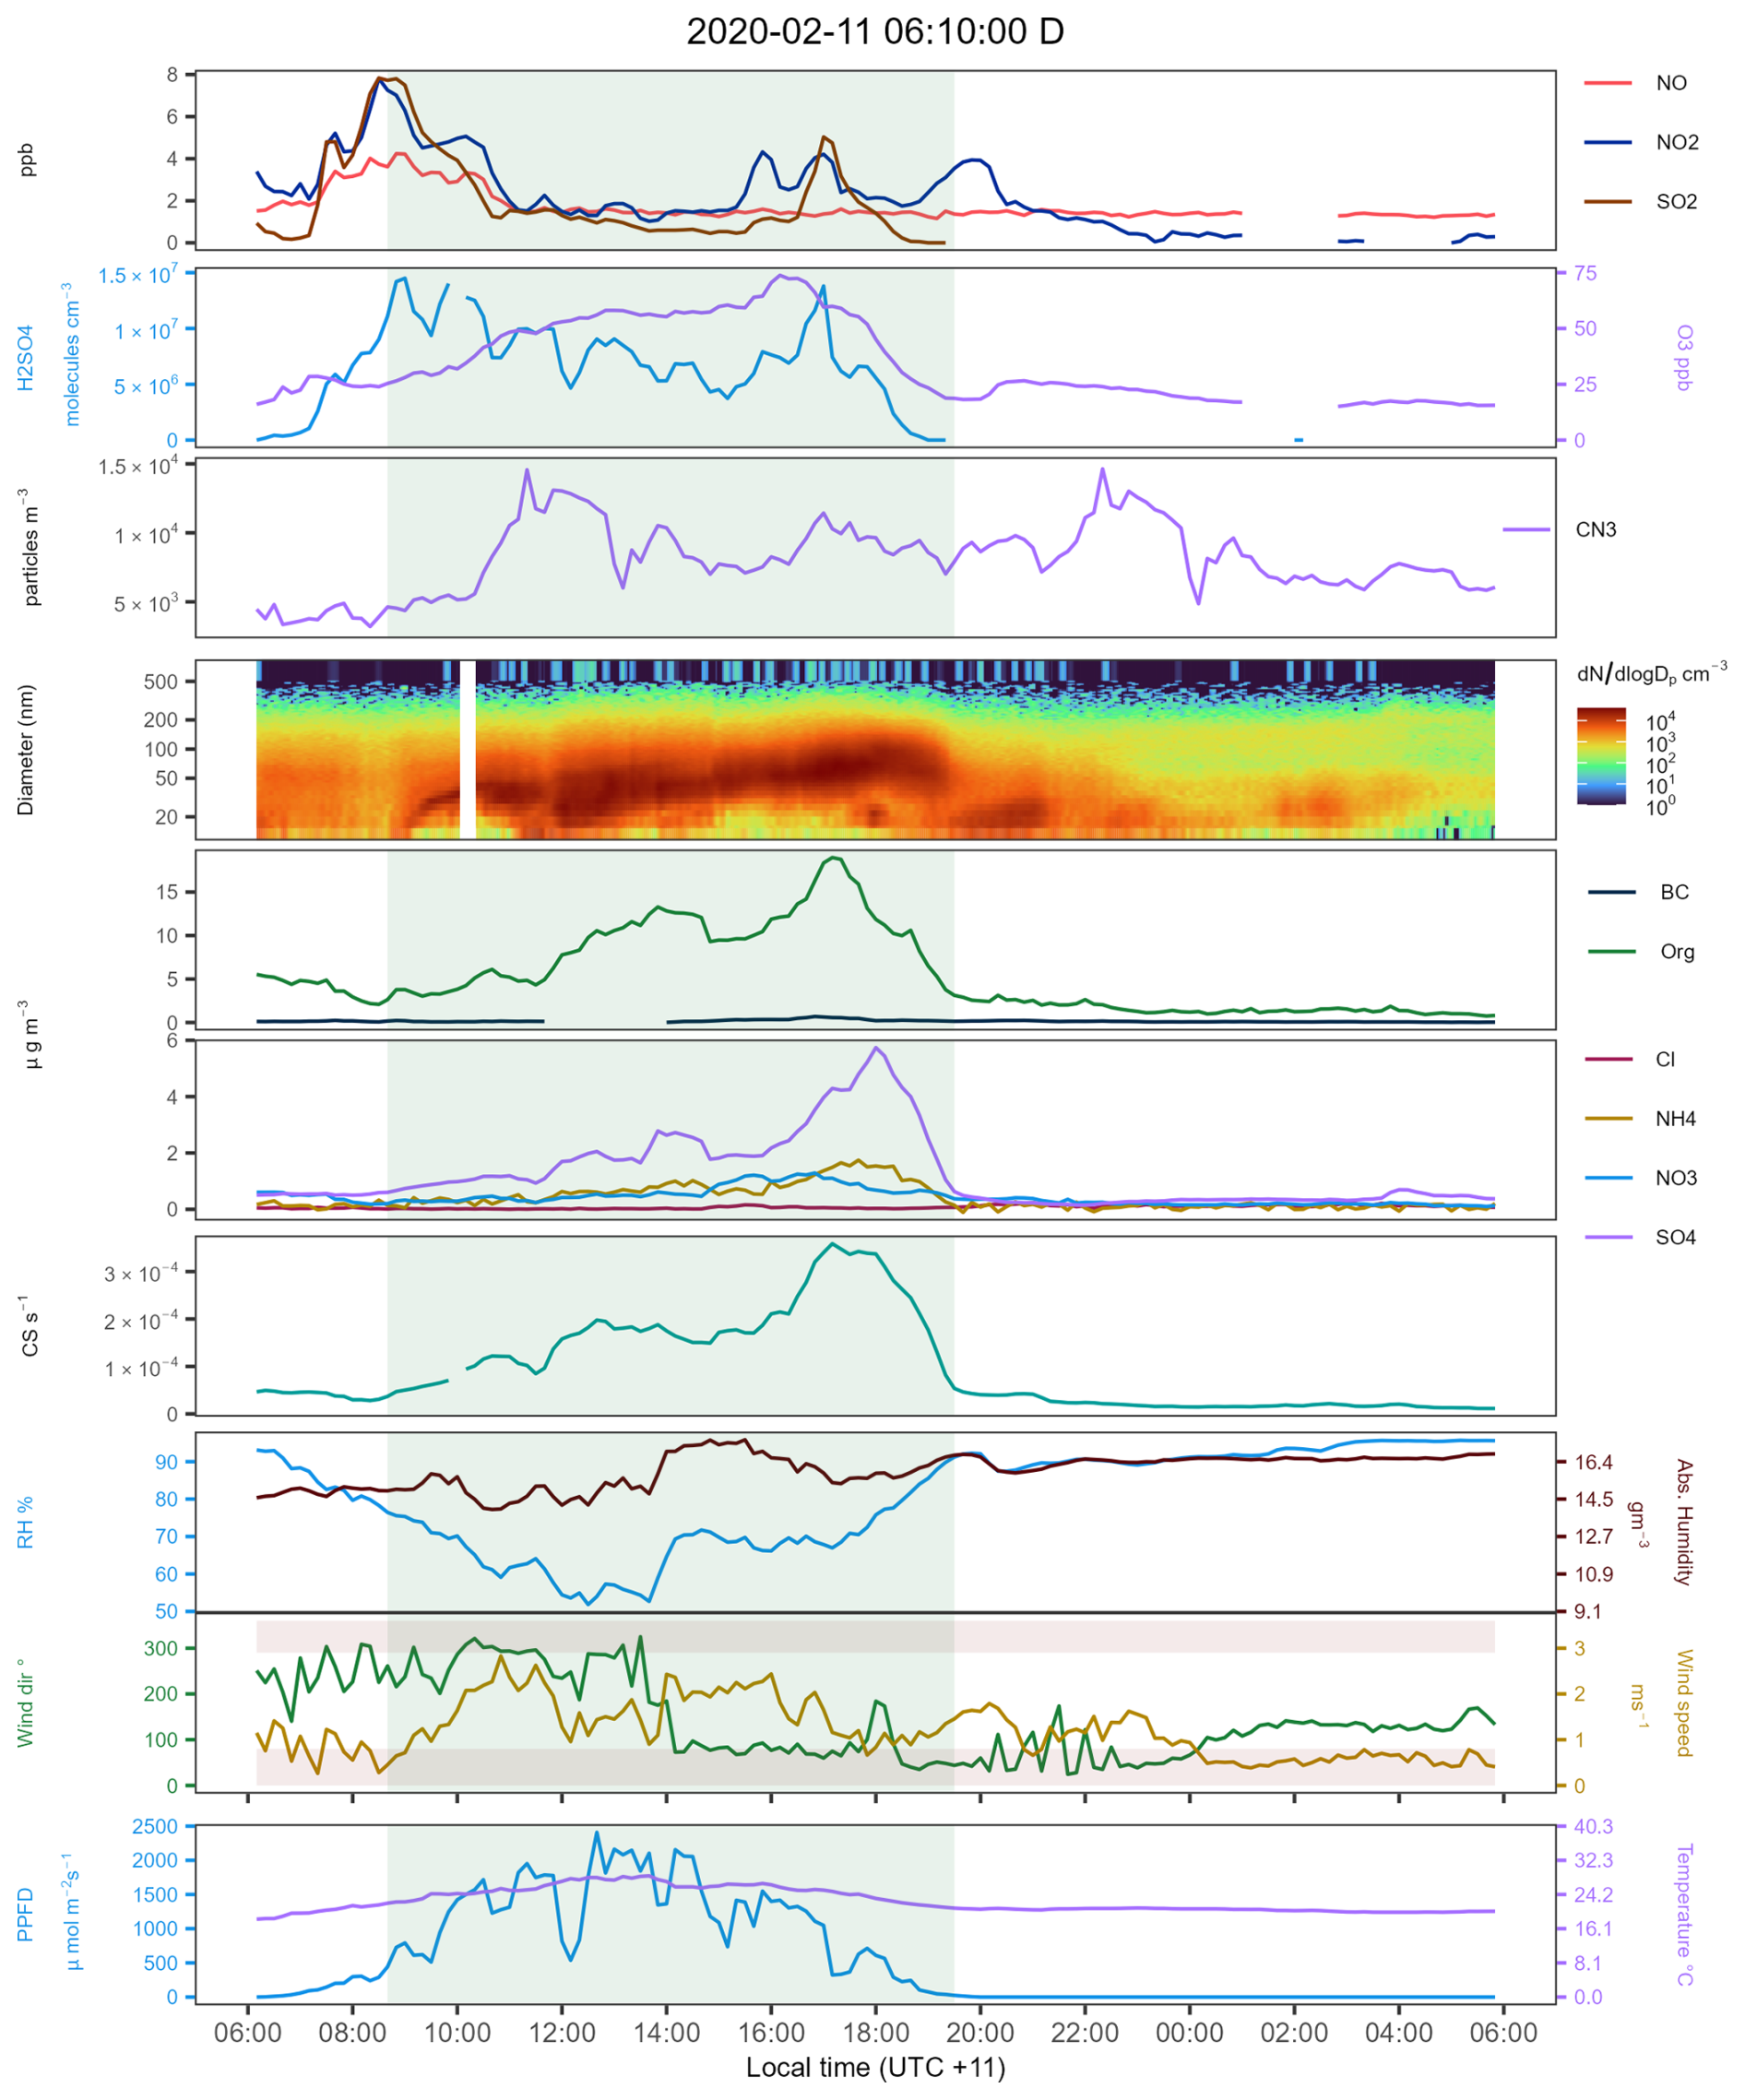
Figure 2Time series for all selected variables during the NPF event during 11 February 2020. NO = nitric oxide, NO2= nitrogen dioxide, SO2= sulfur dioxide, H2SO4= sulfuric acid, O3= ozone, CN3= condensation nuclei > 3 nm, CN3–CN14= difference of CN3 minus the sum of all channels from the SMPS data. BC = black carbon. Org = organic mass fraction, NH4 = ammonium mass fraction, NO3= nitrates mass fraction, SO sulfates mass fraction, Cl = chloride mass fraction. CS = condensation sink. PPFD = photosynthetic photon flux density. VOC mole fractions were not available during this specific event. Note how the fractions of organics, sulfates, and ammonium increase with a positive correlation, dominating over the nitrate and chloride fractions until the end of the event. The light-green area marks the NPF and growth period mentioned in the analysis. The brown shaded areas in the wind panel highlight areas where the wind comes from nearby roads. Note that the NO values are close to the detection limit and appear biased high and hence should be interpreted as an indicative rather than accurate quantitative measure of atmospheric concentration.
Once the events were classified, a logarithmic fit was applied to determine the geometric diameter of each mode. The data were manually divided into chunks of 10 min to visually inspect and determine the number of modes and the geometrical diameter range of each event (nucleation <25 nm, Aitken 25–100 nm, accumulation >100 nm). Once those parameters were defined and included in the code, each event was divided into periods of time with similar distribution modes.
For illustration, a hypothetical event lasting 2 h was divided in two: 1 h with two simultaneous particle modes (nucleation and Aitken) and then 1 h with just one particle mode (Aitken). This was done to estimate an accurate geometrical particle diameter based on the number of modes. This avoided the problems of changes in the number of modes in the sample. Finally, the data were merged again to obtain a time series of the number of particles predicted with the fit, number of modes predicted, and geometrical particle diameter.
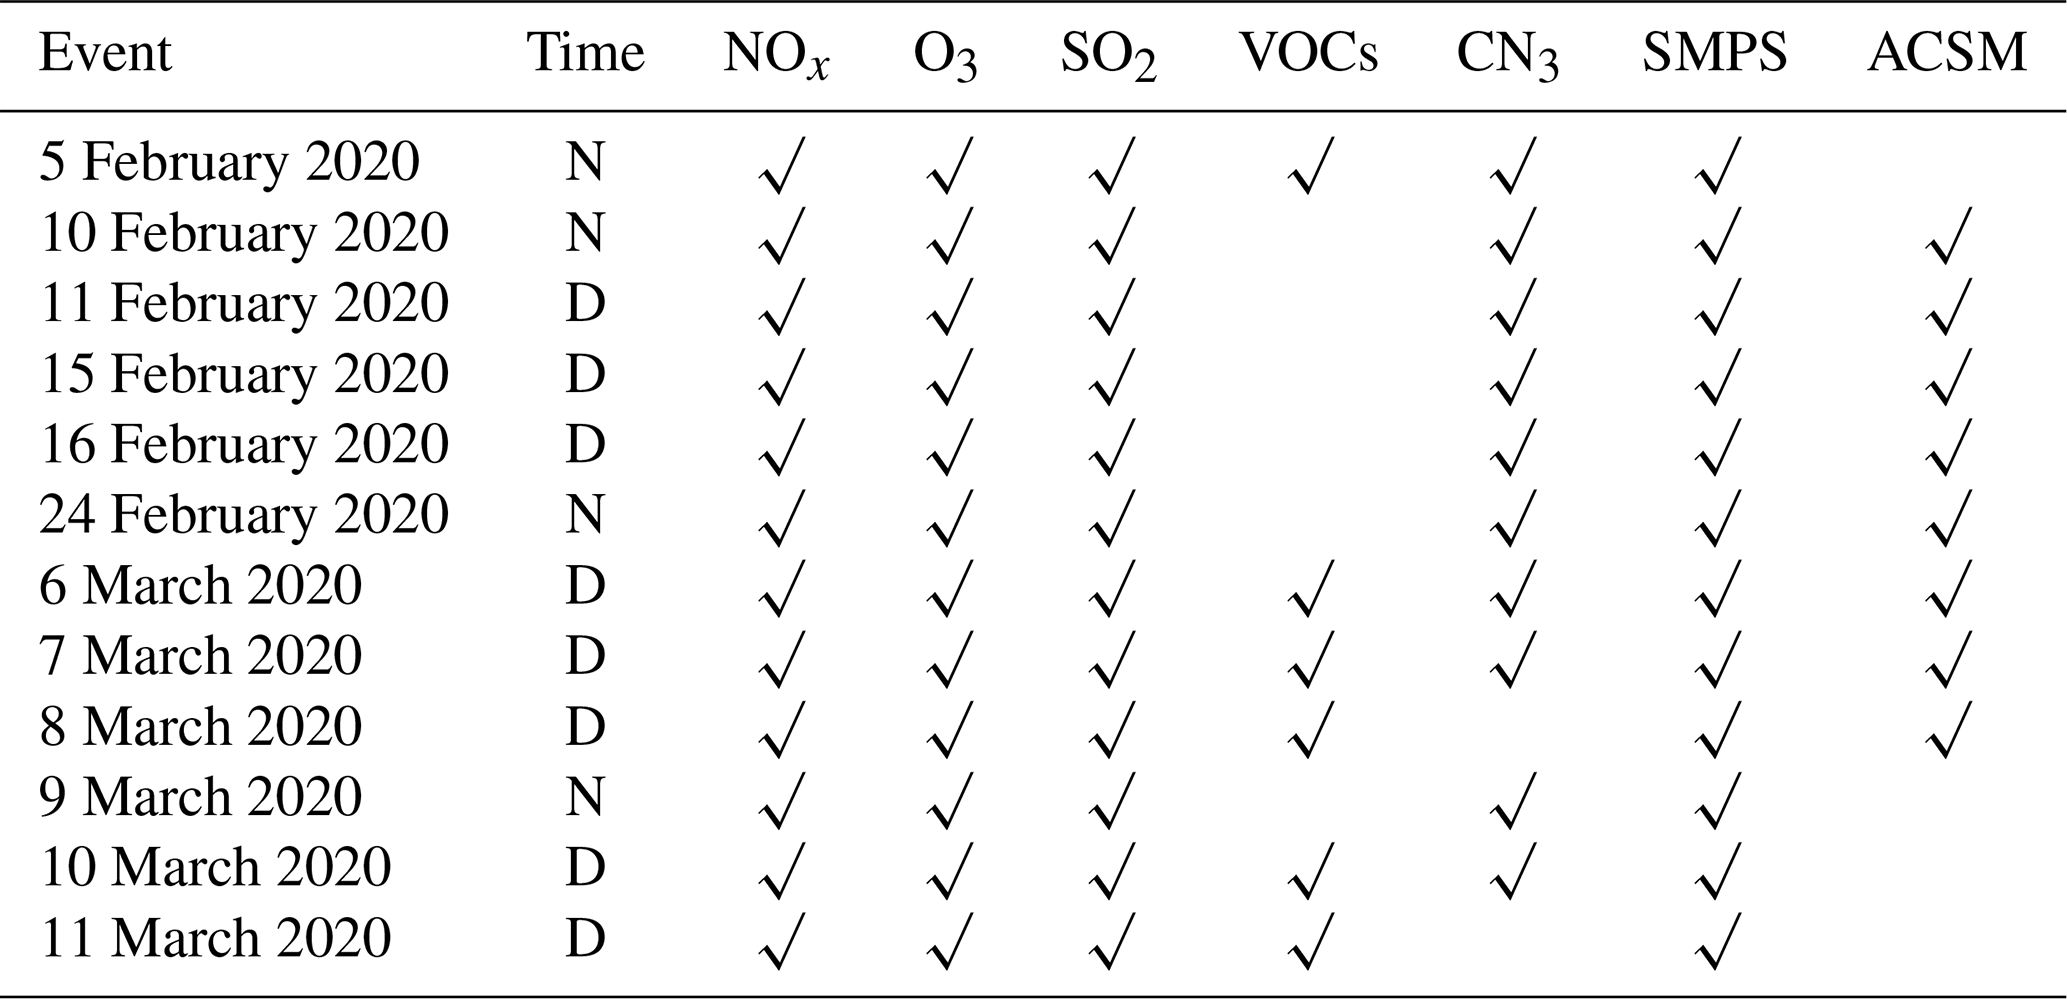
Table 2Data available for each NPF event identified during the COALA campaign.
The algorithm works by providing the number of modes observed in the input dataset. Then, it selects the provided model equation for each mode number and iterates over 100 fits looking for the best fit. The Bayesian information criterion (BIC) was used to identify the best fit, looking for the lowest values. Once the best fit was selected, the total particle number estimated by the model was compared with the sample record for each sample to assure it was within a 5 % difference compared to the total particle number reported in the sample. The result was then visually checked to find the geometrical diameter and how it compares to the distribution size plots from the raw aerosol distribution size data. Once the model was considered representative and accurate enough, the growth rate for each event was determined using a simple linear regression of the change in the geometrical diameter in time from nucleation to Aitken and eventually to the accumulation mode.
3.1 Frequency of NPF events
Of the 40 d included in the analysis, nine did not have any data. Of the 31 d with data, 12 (39 %) showed clear NPF events, nine (29 %) were considered undefined, and 10 (32 %) did not have enough data or were classified as a non-event The percentage of days with NPF is similar to those of other sites in forested areas in the Northern Hemisphere (Kalkavouras et al., 2020; Uusitalo et al., 2021). Thirty-nine percent of days with NPF events and 29 % with undefined events implies a highly reactive atmosphere even in this rural area, with some anthropogenic influence of mobile sources and occasionally a coal-fired power plant in the Hunter Valley region.
Figure 2 illustrates the time series of an NPF event observed on 11 February 2020. The NPF event commenced at 8 a.m., preceded by a peak in both SO2 concentrations and the estimated H2SO4 proxy. The shaded area in the plot highlights the growth period, which is marked by an increase in mode diameter and condensation sink. Ozone is also increasing at this time. The increase in aerosol SO and organics during this period shows the influence of this reaction chemistry on particles larger than 100 nm in the aerosol size distribution. We estimated the H2SO4 proxy using the rural model developed by Dada et al. (2020). This model was chosen from among the options because the environmental conditions under which it was derived are the most similar to those of our sampling site. The equation used to estimate the H2SO4 proxy was
where CS is the condensation sink, SO2 is the concentration of SO2, and GlobRad is the global radiation obtained from the photosynthetic photon flux density (PPFD) values, with GlobRad = 0.327*PPFD.
3.2 Triggers for NPF events
Of the 12 d with NPF, four occurred during the night or early morning (before sunrise) and eight during the day. The time series of SO2, NOx, ozone, VOCs, and the aerosol composition were used to identify which variables triggered and influenced the aerosol formation and growth. Of the 12 event days of NPF, six include VOC data and eight include aerosol composition data, noting that the composition data are not applicable to particles <100 nm and only three events led to accumulation-sized particles (diameter >100 nm). The data available for each event are summarized in Table 2.
From the daily time series of all available variables over the 12 d of NPF events, it is evident that SO2 frequently triggers or at least influences the particle formation. However, the trigger for nighttime events seems to be NO2-related chemistry, but without complementary measurements, it's unclear. To group the common factors influencing NPF for daytime and nighttime events, a comparison of the growth rate was used to determine whether the rates were similar during the day and during the night.
3.3 Particle growth rates during daytime and nighttime events
The estimated growth rate is presented in Fig. 3. Only four of the nine events during daytime (upper panel of Fig. 3) had a representative Pearson coefficient (R>0.6); the remaining five events did not have a stable linear growth and are not shown in the plot. The events that showed unstable growth patterns suggest a highly variable condensation source, possibly resulting from changing H2SO4 concentrations. This is complicated further by changing wind directions.
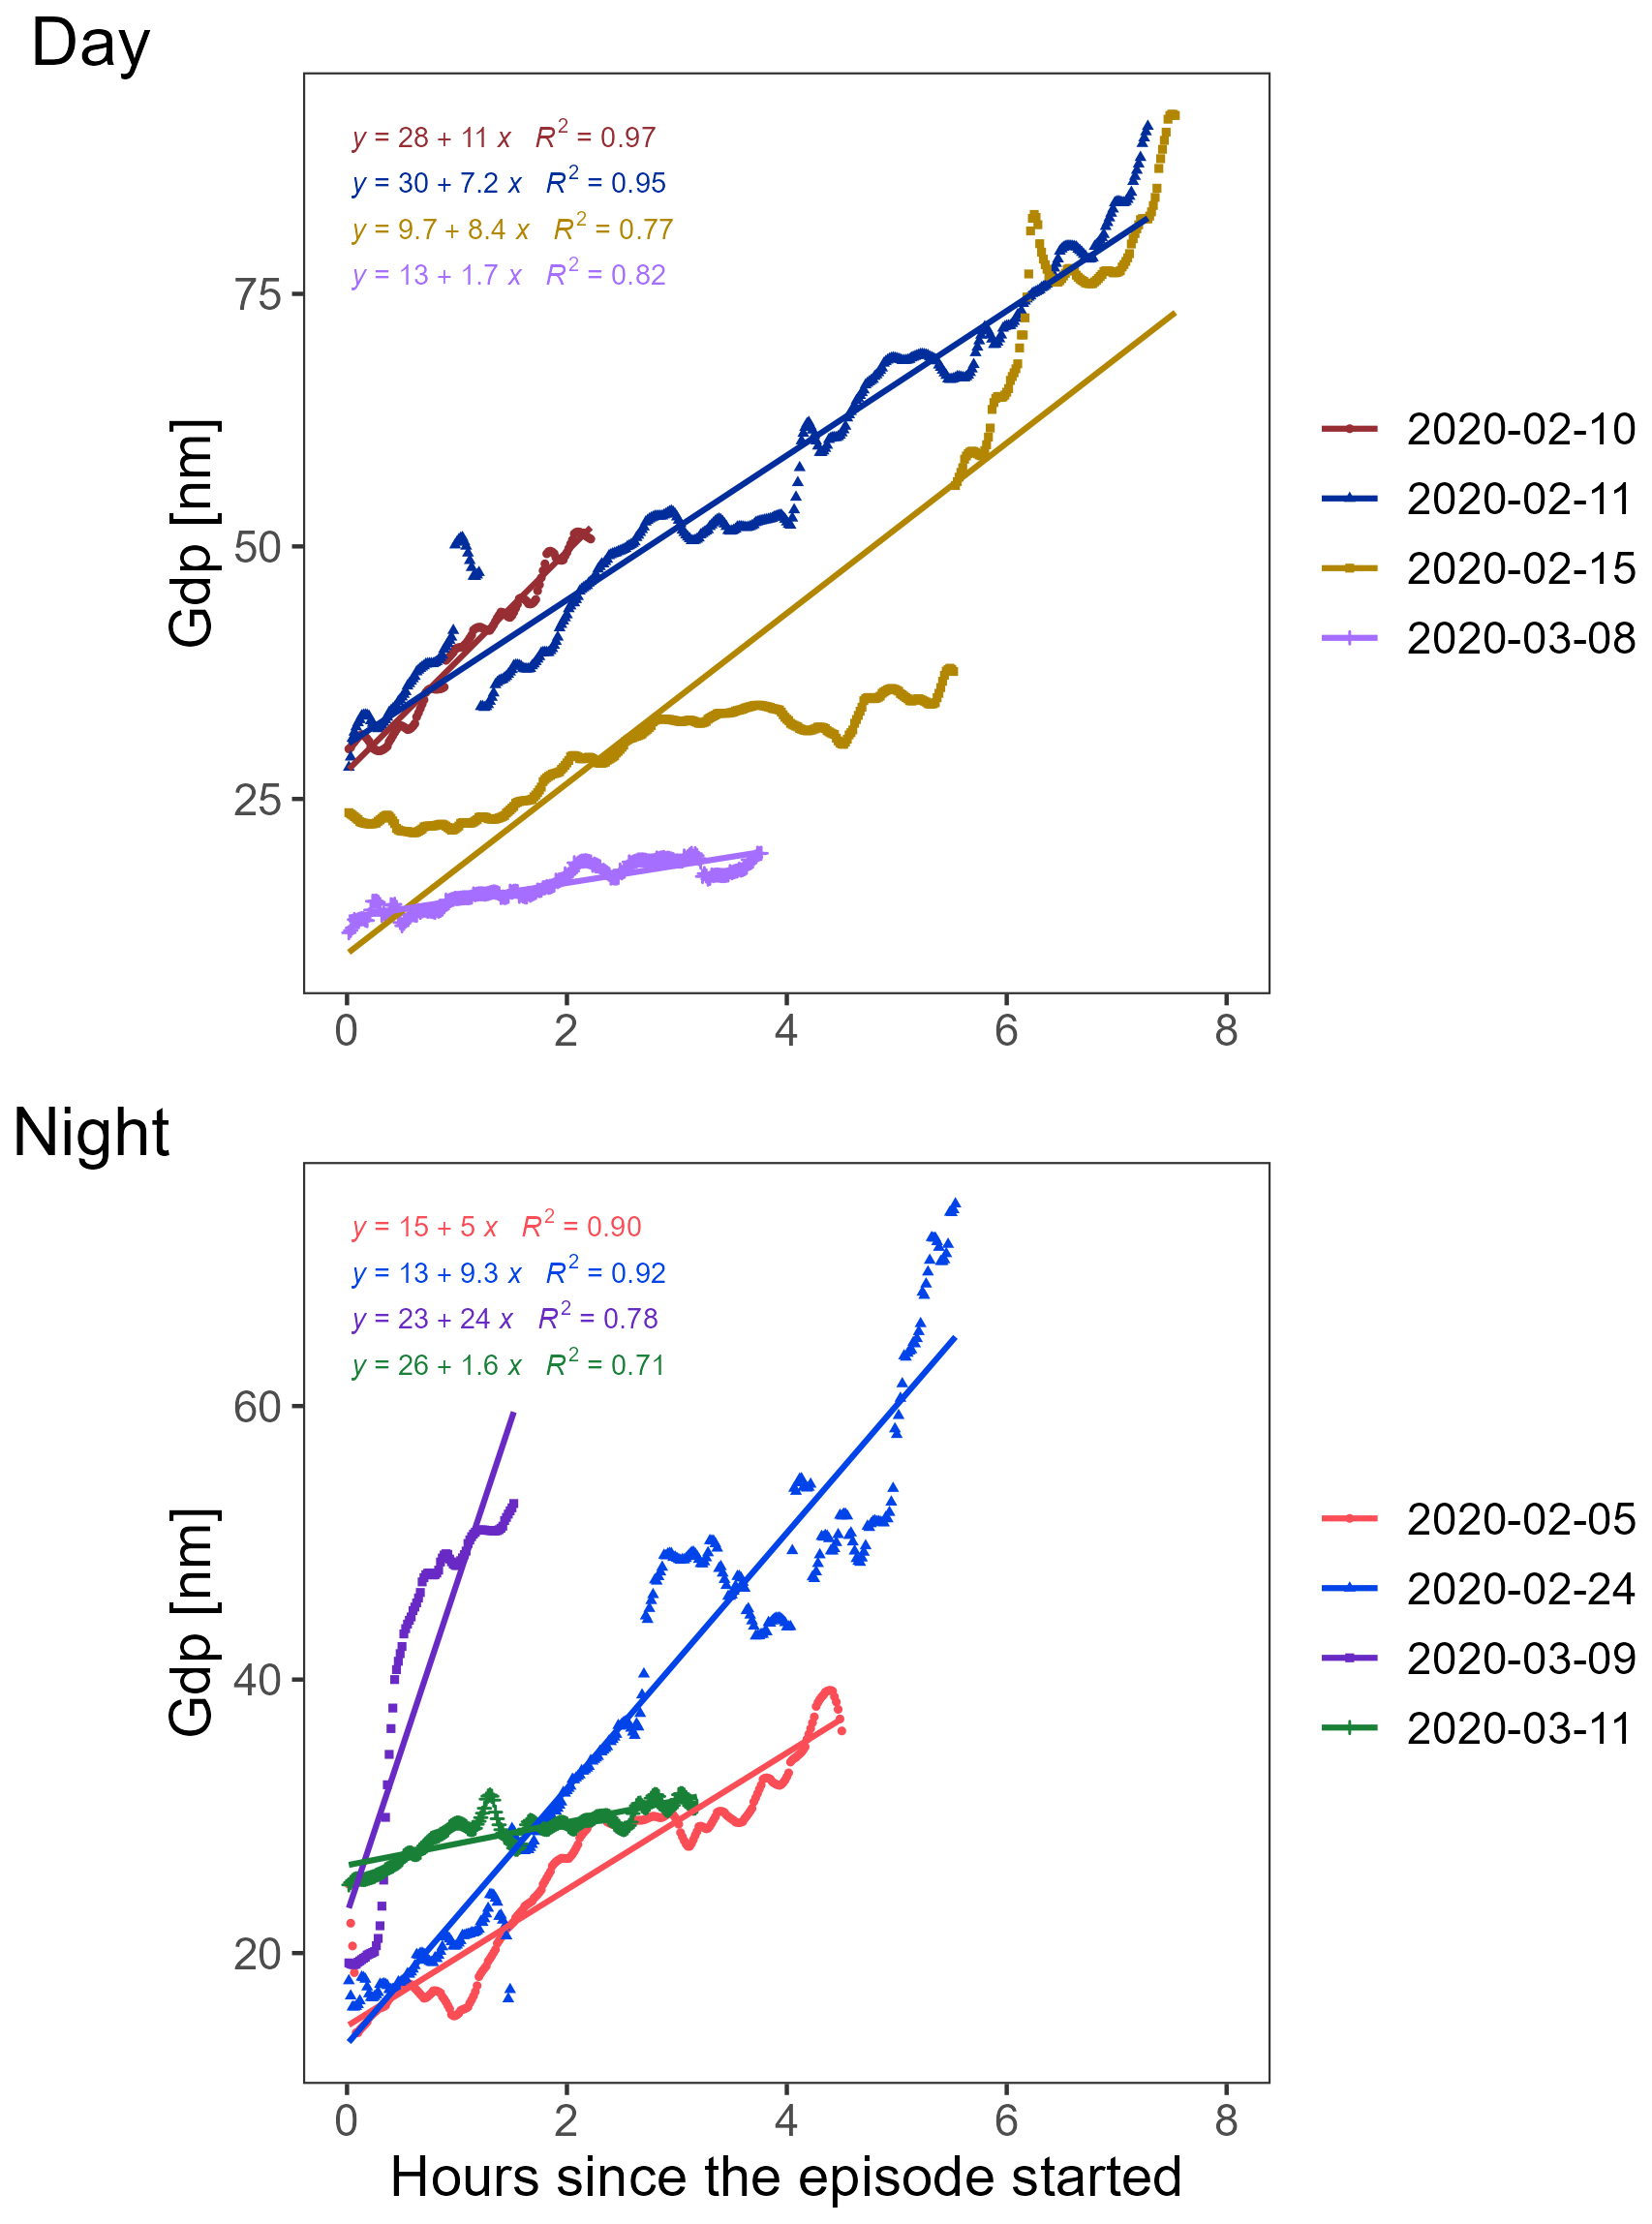
Figure 3Geometric particle diameter evolution in each event where the logarithmic fit converged. The top panel presents the daytime data (only four events converged to a statistically significant model). The bottom panel presents the nighttime events.
Some events highlight how the dynamic nature of daytime concentrations of O2, NO2, and O3 complicate the analysis (see Fig. S1 in the Supplement). Nonetheless, these events provide insight into the factors that may drive the growth and particle formation and hence were included in all the analysis. Event 15-02-2020 in Fig. 3 is an example of how the geometric particle diameter can change when there is rapid growth. The first part of the regression shows a slower growth rate. After the sixth hour of slow growth, the rate increases substantially, attributed to an increase in H2SO4 around this time. Shortly after this accelerated growth, there is a wind change from northerly to southerly (Fig. S4). Following the southerly wind shift, a lower condensation sink and higher relative humidity likely contributed to the geometric particle diameter (Gdp) increase via enhanced condensation and water uptake. Declining tracer levels SO2 and NOx indicate that local particle growth mechanisms were likely dominant over the influence of a new air mass up to the seventh hour, when increases in NOx and SO2 are observed.
In contrast to the daytime events, all the nighttime events were stable enough to determine the event growth rate. The growth rate varied considerably between events (see lower panel of Fig. 3) and most likely reflects differences in the factors driving the particle formation between these episodes. The specific oxidation pathways that were active during each event likely had a direct impact on the observed differences in growth rates. These reaction pathways might include monoterpene ozonolysis and condensation over previously formed clusters (Liu et al., 2023; Wang et al., 2023) or oxygenated VOCs (OVOCs) brought to the site and condensed on formed seeds, possibly initiating nucleation (Bianchi et al., 2019; Higgins et al., 2022). Some of these processes were observed during the campaign and will be further explored in the nighttime events section.
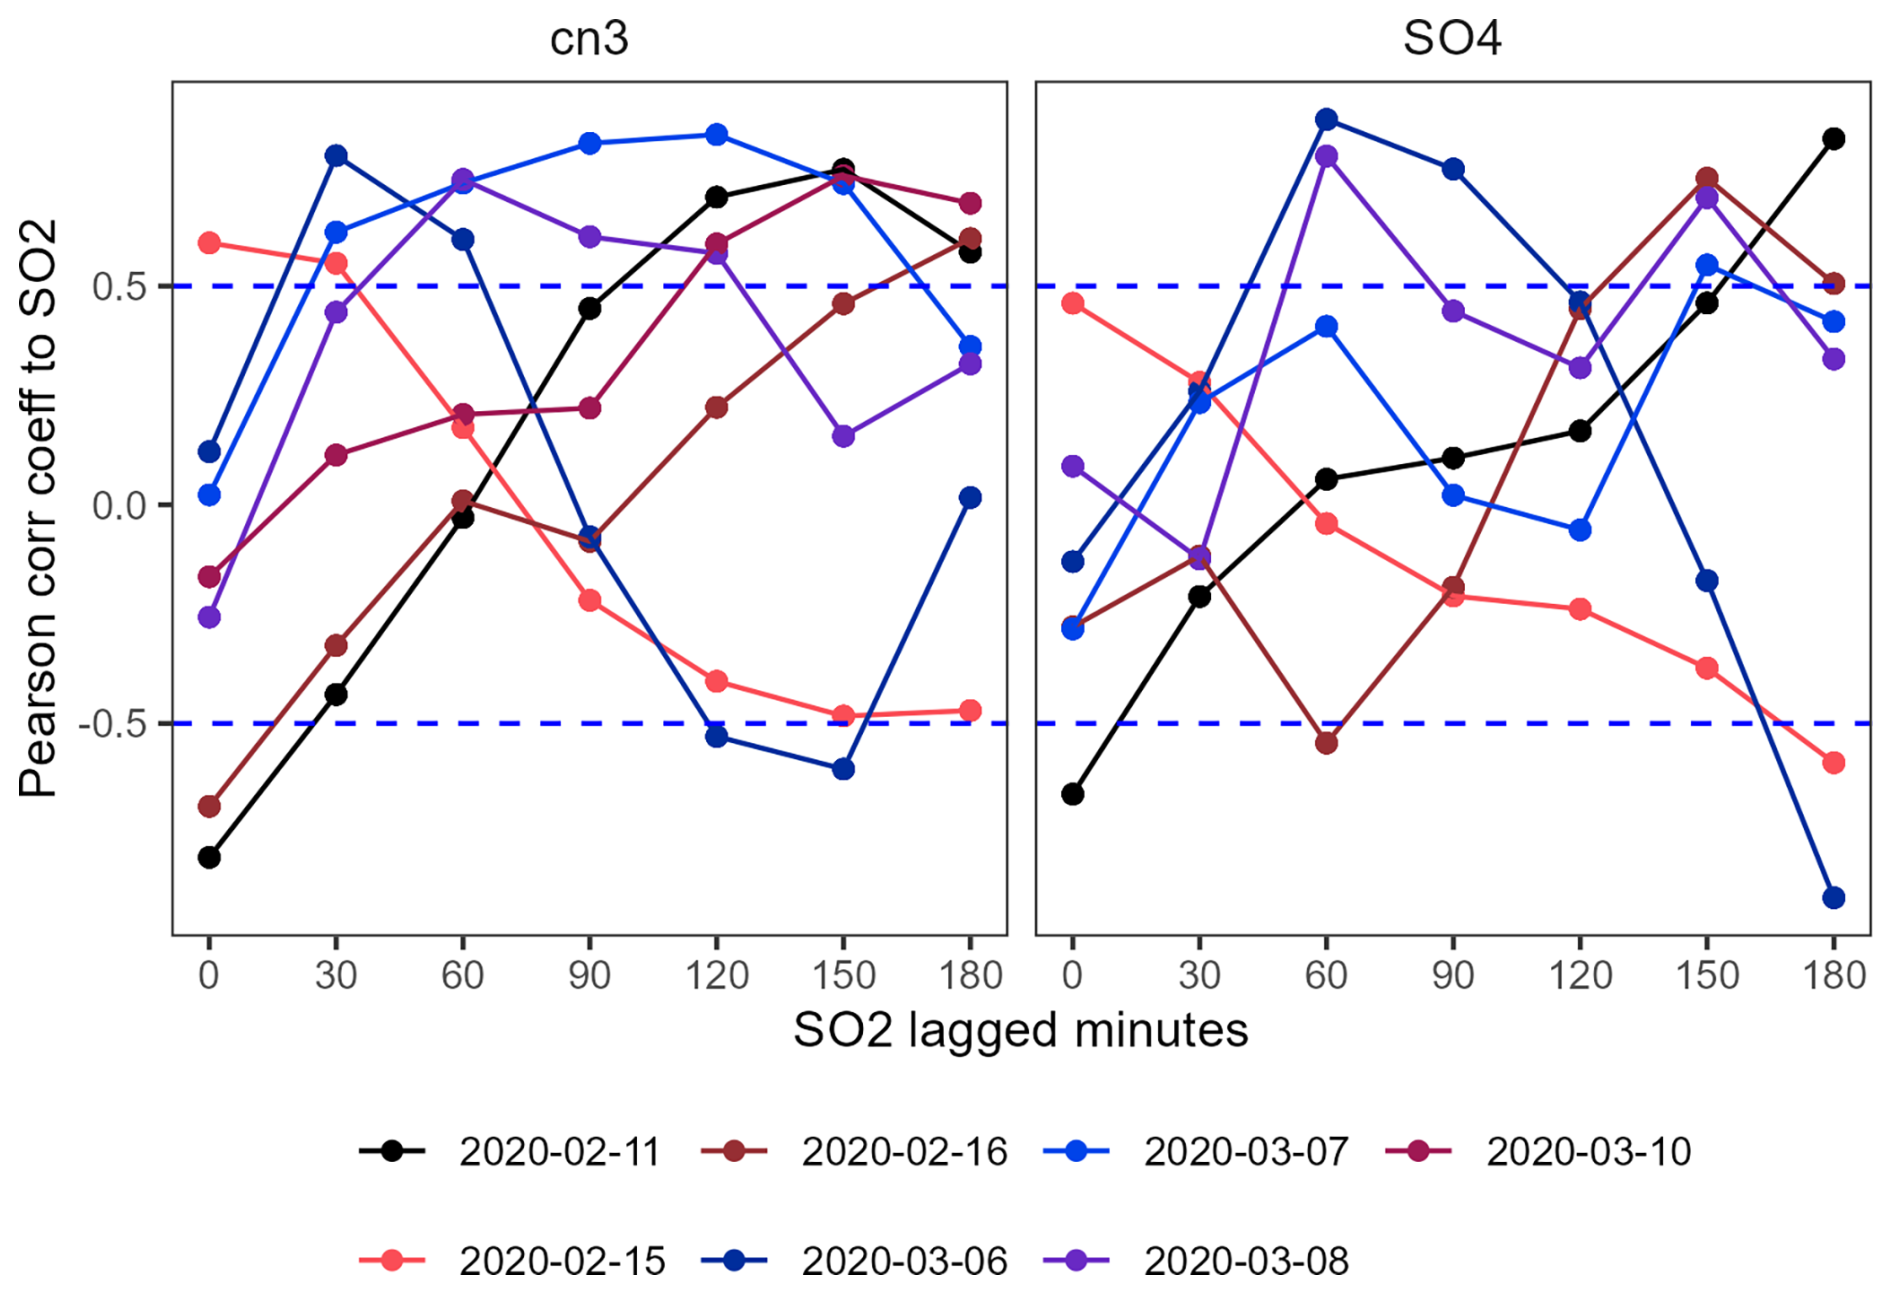
Figure 4Pearson correlation values obtained from the cross correlation between SO2 and CN3 or SO mass. The dashed lines represent the 0.5 threshold as a reference to identify significant correlations. Events on 10 February and 11 March did not follow this pattern and were removed from the plot.
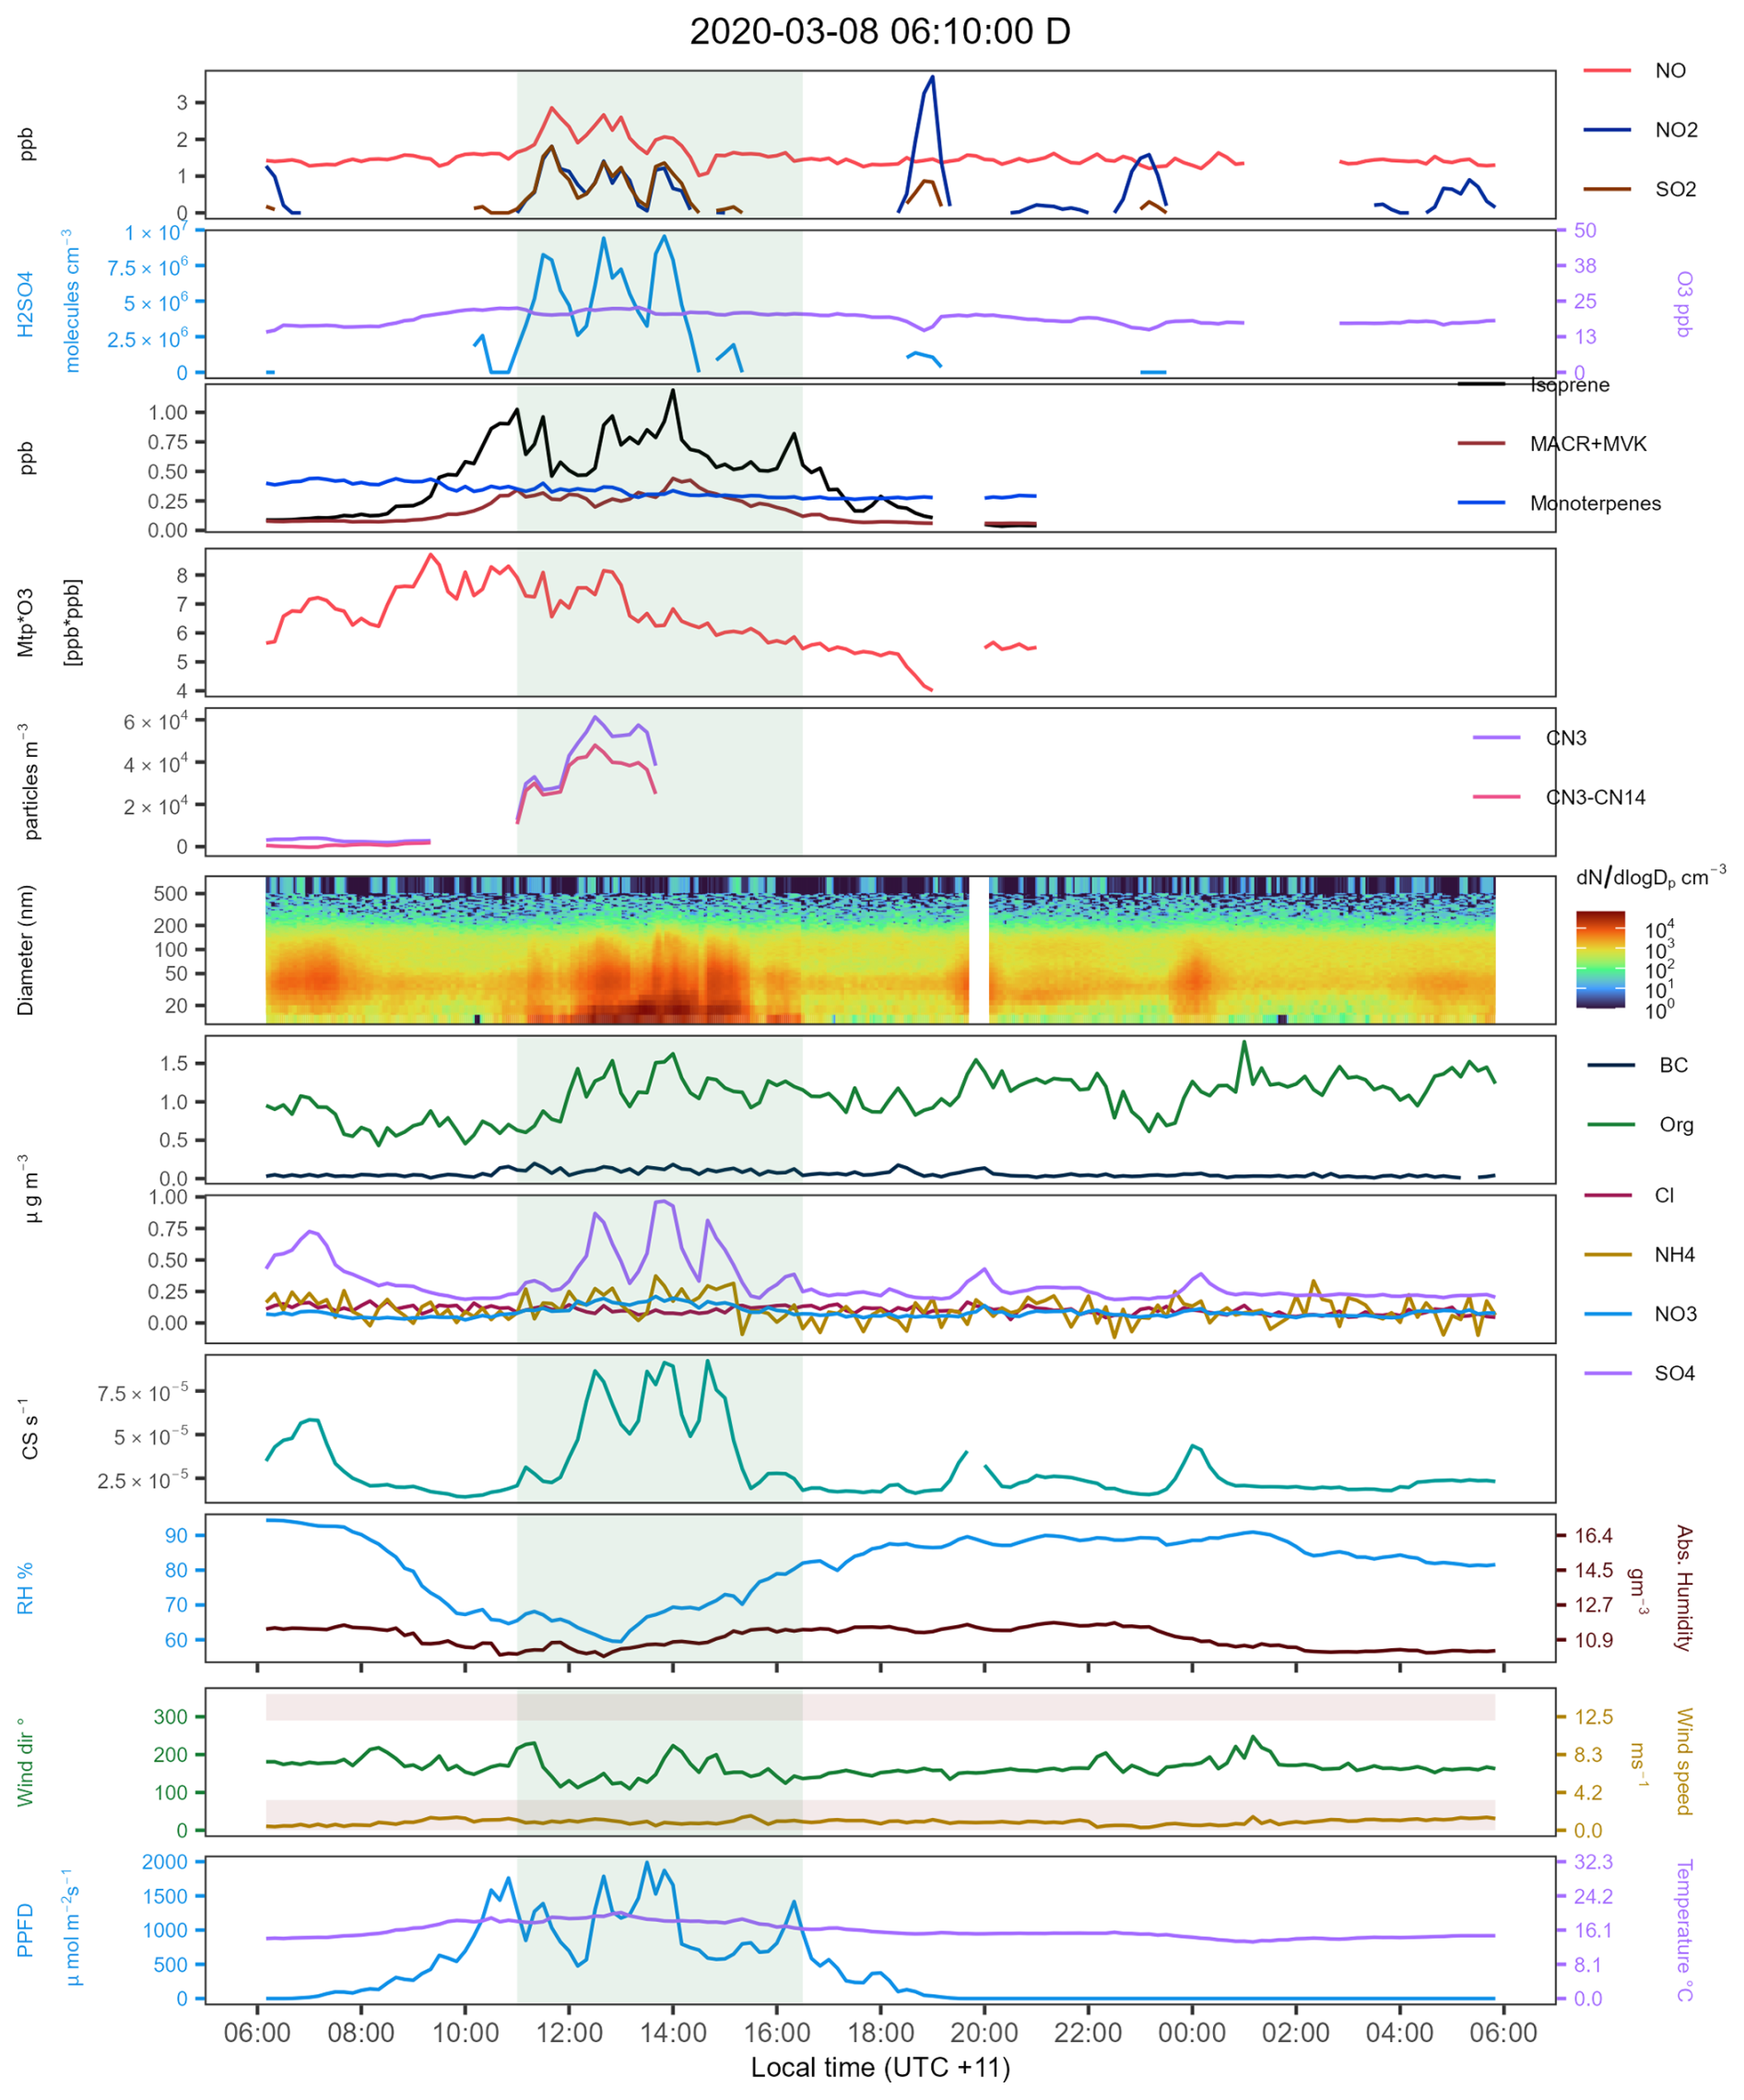
Figure 5Time series of all selected variables during the NPF event on 8 March 2020. NO = nitric oxide, NO2= nitrogen dioxide, SO2= sulfur dioxide, H2SO4= sulfuric acid, O3= ozone, MACR + MVK = isoprene ox. products methacrolein and methyl-vinyl-ketone, CN3= condensation nuclei >3 nm, CN3–CN14= difference of CN3 minus the sum of all channels from the SMPS data. BC = black carbon. Org = organic mass fraction, NH4= ammonium mass fraction, NO3= nitrates mass fraction, SO sulfates mass fraction, Cl = chloride mass fraction. CS = condensation sink. Mtp*ozone = HOM proxy product monoterpenes and ozone [ppb*ppb].
3.4 Daytime NPF events
From the time series analysis of all daytime events (see Figs. 2, 5–6, and S1–S4), four key points were identified for NPF in the area:
-
SO2 arriving at the site appears to trigger nucleation and growth events.
-
VOC availability (monoterpenes and isoprene) enhances nucleation and growth.
-
The hours with high VOC concentrations and higher oxidation capacity in the atmosphere (OH concentrations are assumed to be higher during the hours with higher PAR) have higher particle number concentrations and generally guaranteed growth up to the accumulation mode.
-
Growth without the influence of SO2 may occur but will do so at a slower rate.
During most of the daytime events, SO2 and NO2 plumes impacted the site at some stage of each event.
On some occasions, the SO2 plume might last for a couple hours, as shown in the first part of the event on 11 February 2020 (see Fig. 2), while at other times, there are multiple peaks of high SO2 measured at the site, as shown in several other events in the record (e.g. Figs. S2, S3, S4). However, subsequent nucleation was observed on every occasion in which SO2 was observed above the detection limit at the site, and growth occurred within 0 to 150 min after the SO2 was first detected. The time window difference between events reflects the influence of conditions at the start of a particle growth event. To highlight this phenomenon, a cross correlation between SO2 and the aerosol mass of aerosol SO time series obtained from the TOF-ACSM and the measured particle number concentration (CN3) was applied. Figure 4 shows the Pearson correlation between SO2 and the CN3 and aerosol SO in a window period of 4 h, i.e. starting 2 h before the nucleation commenced and ending after the first 2 h of the event. This time window captures the SO2 influence on the particle formation. Each line/point shows the correlations at 0, 30, 60, 90, 120, and 150 min lagged for each daytime event. The dotted blue lines show where the lagged correlation is significant at (|r|>0.5).
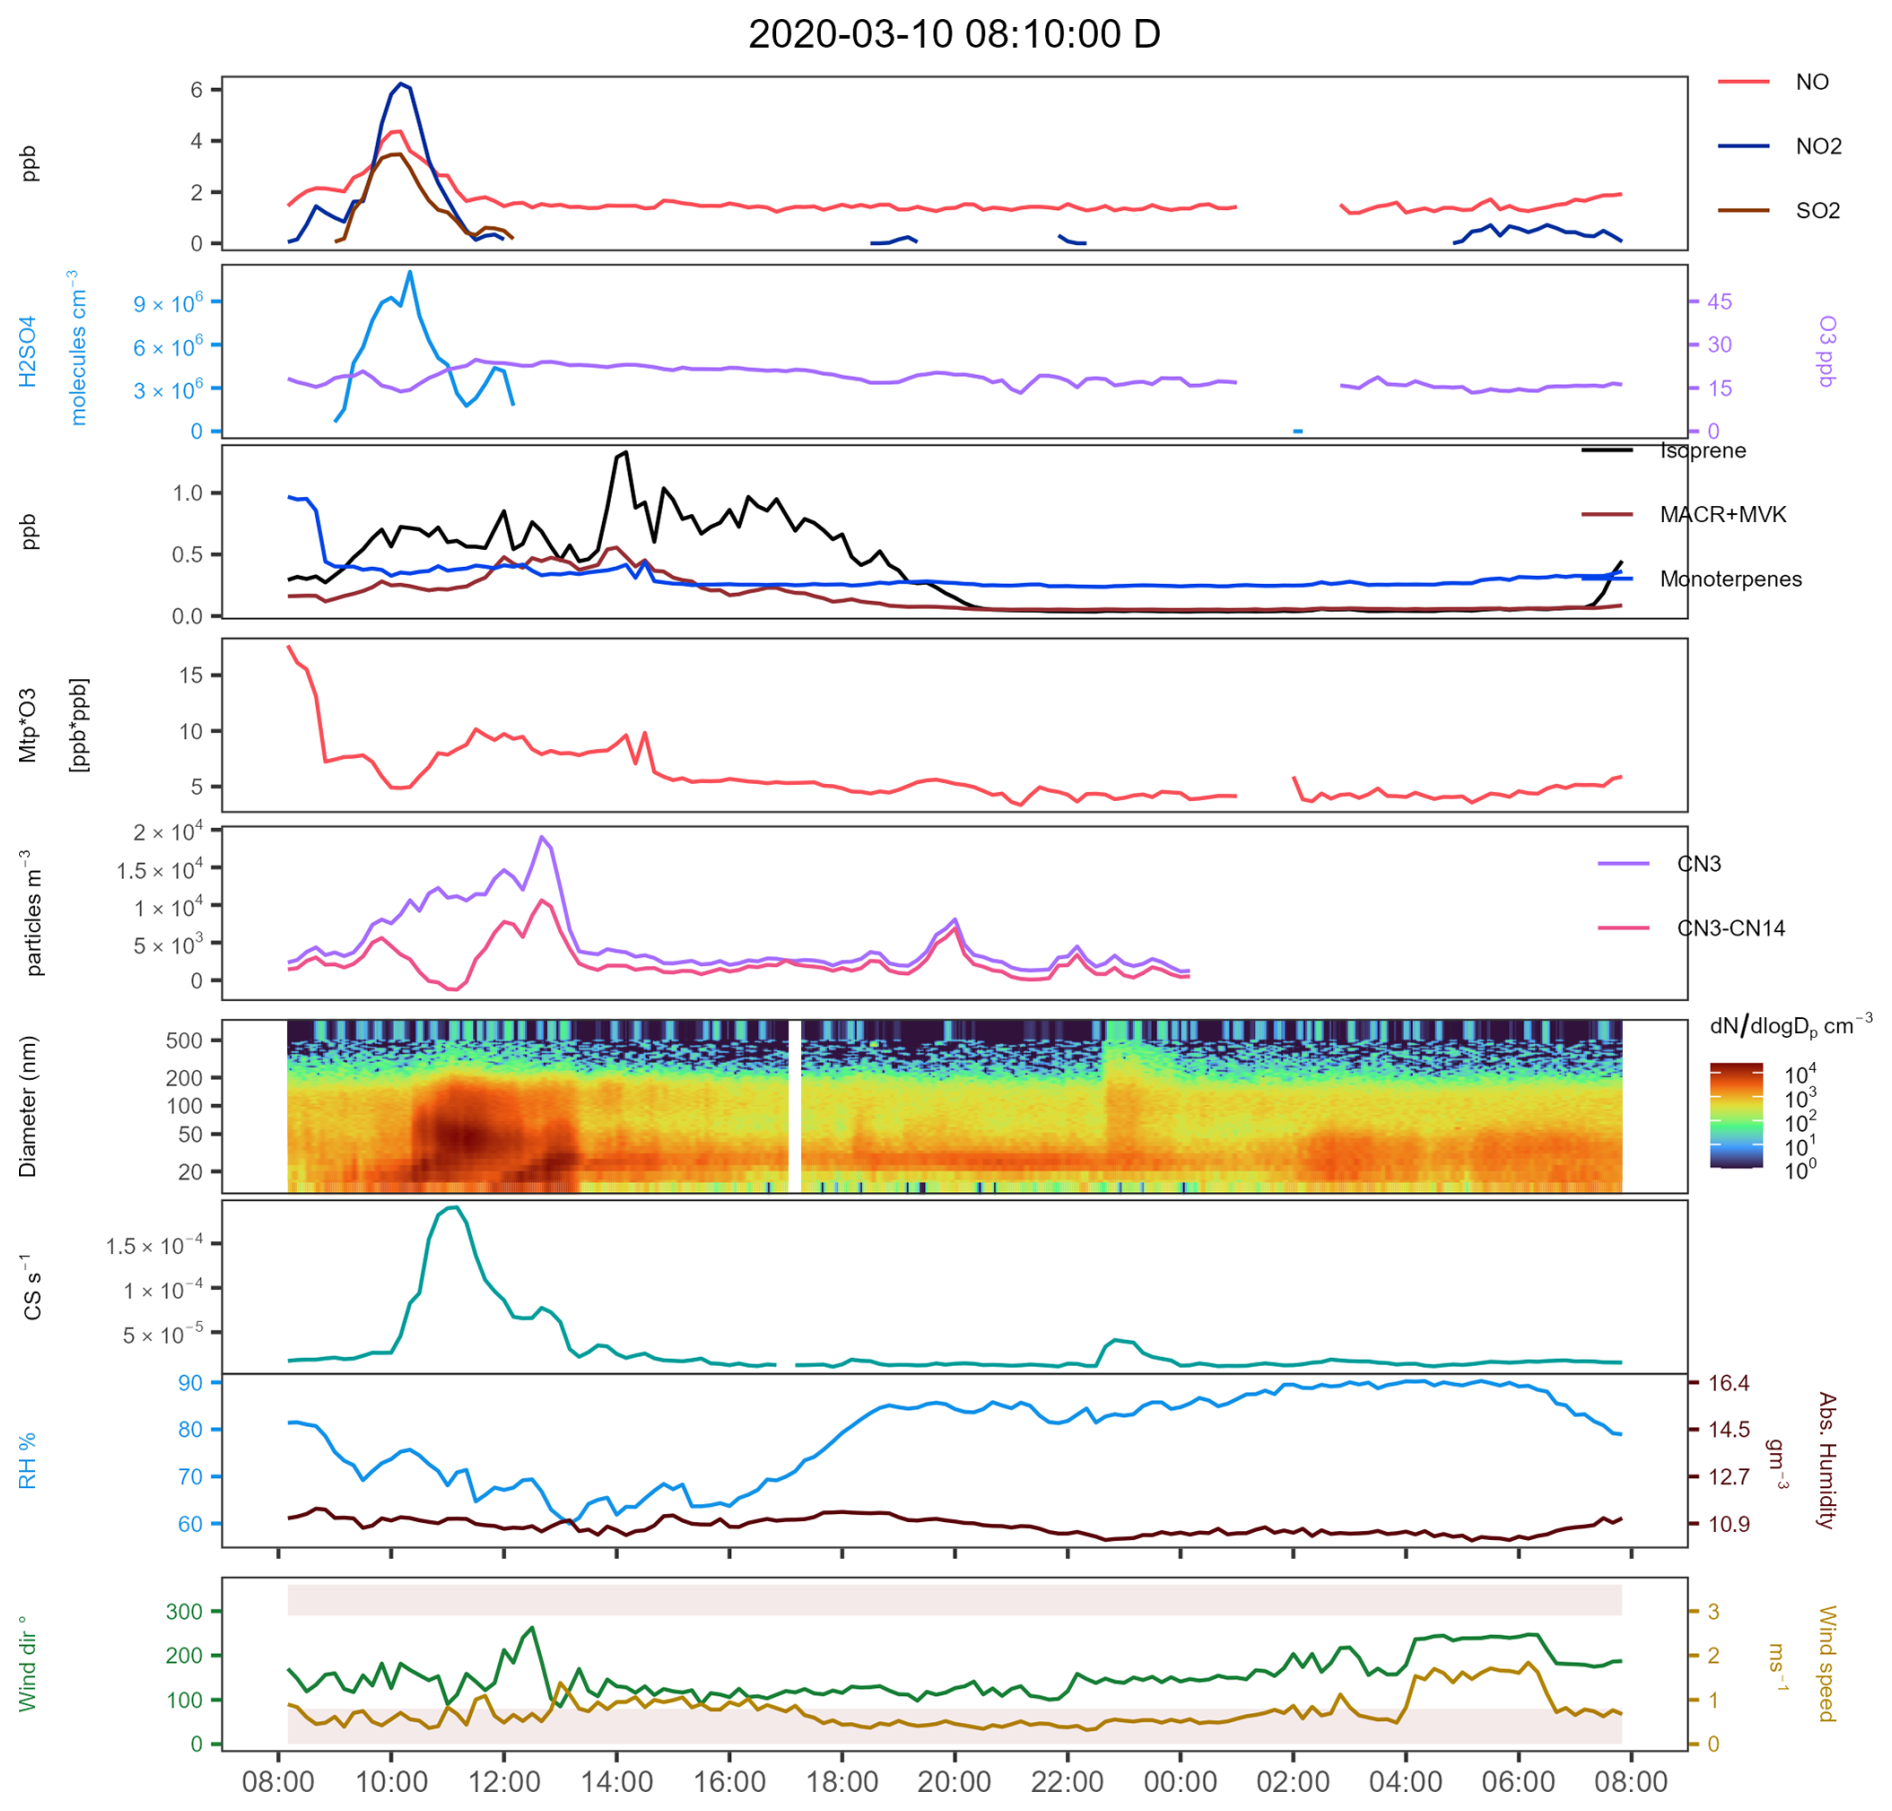
Figure 6Time series of all selected variables during the NPF event on 10 March 2020. The drop in CN3 seem related to the lack of SO2 after 11:00. NO = nitric oxide, NO2= nitrogen dioxide, SO2= sulfur dioxide, H2SO4= sulfuric acid, O3= ozone, MACR + MVK = isoprene ox. products methacrolein and methyl-vinyl-ketone, CN3= condensation nuclei >3 nm, CN3–CN14= difference of CN3 minus the sum of all channels from the SMPS data. CS = condensation sink. Mtp*ozone = HOM proxy product monoterpenes and ozone [ppb*ppb].
To interpret Fig. 4, we can use the event on 11 February (black line) as an example. Here, the correlation between SO2 and CN3 becomes significant (at |r|> 0.5) if the SO2 time series is lagged 120 min with respect to the aerosol data, and the correlation between SO2 and aerosol SO becomes significant after 3 h. This means that if we move the SO2 time series 2 h forward, it will be better correlated with the particle number concentration, accounting for the reaction time of SO2 to produce H2SO4 and enhance/trigger the particle formation under the conditions in the atmosphere at the time. Usually, the SO2 correlation with aerosol SO needs a longer lag time to be significant. This is a potential indication of the order in which the chemical reactions happen. First, we will see oxidation of the SO2 to H2SO4, then nucleation, and finally growth in mass when there is condensation or coagulation near CCN sizes. Using time series analysis as shown here can provide more evidence when the chemical mechanisms are known but observations of other variables are not available.
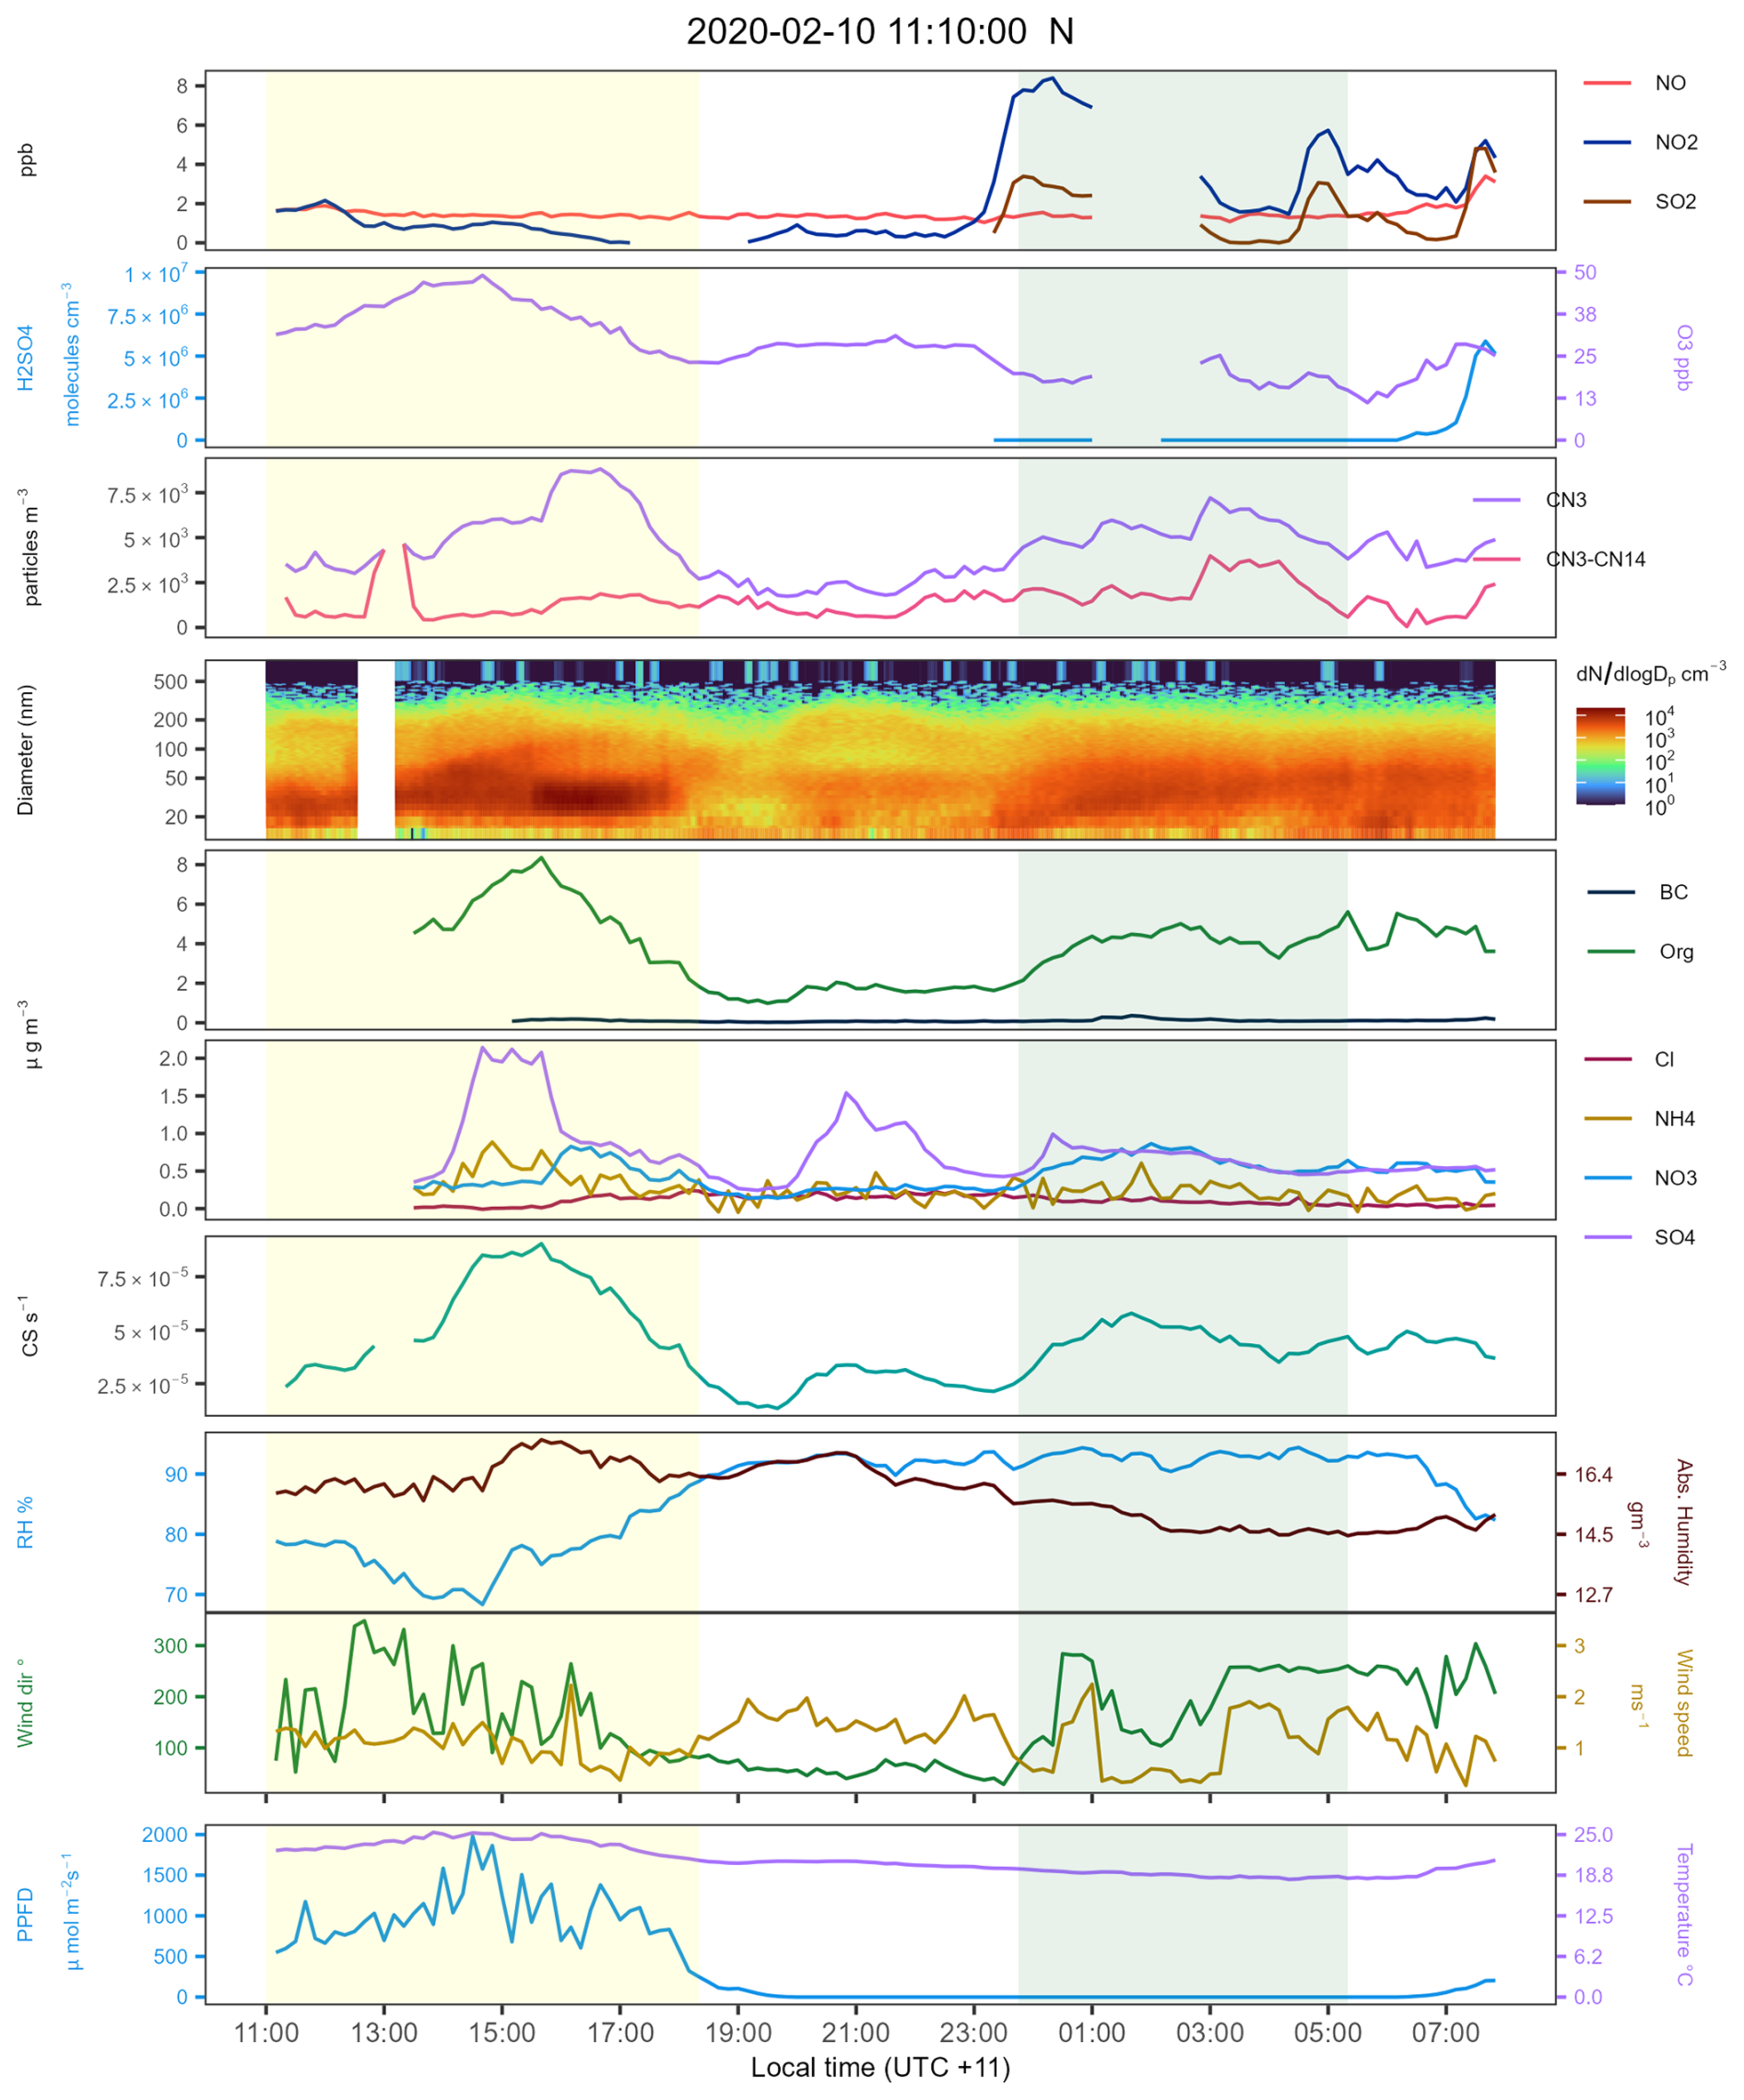
Figure 7Time series for all selected variables during the NPF event on 10 February 2020. NO = nitric oxide, NO2= nitrogen dioxide, SO2= sulfur dioxide, H2SO4= sulfuric acid, O3= ozone, CN3= condensation nuclei >3 nm, CN3–CN14= difference of CN3 minus the sum of all channels from the SMPS data. BC = black carbon. Org = organic mass fraction, NH4= ammonium mass fraction, NO3= nitrates mass fraction, SO sulfates mass fraction, Cl = chloride mass fraction. CS = condensation sink. Mtp*ozone = HOM proxy product monoterpenes and ozone [ppb*ppb]. VOC mole fractions were not available during this specific event. Note how there does not seem to be any significant SO2 or NO2 pollution prior to the NPF start. Simultaneous with the particle growth, there are enhancements in the organic, sulfate, and ammonium mass fractions. There are two events in this plot: one in the morning with an unknown start and ending around 18:00 and the other at night. The light-green area marks the night event, and the yellow highlighted area refers to the daytime event.
A similar result is observed for other events at different lagged times. The difference in the time necessary to achieve a significant correlation between SO2 and the particle number seems to be related to the quantity of VOCs available when the SO2 plume arrives at the site. This aligns with our understanding of the transition from nucleation to particle growth. In the early hours, observed monoterpene levels are sufficient to drive nucleation through ozonolysis and subsequent HOM formation (Iyer et al., 2021; Kirkby et al., 2023; Wang et al., 2023). Particle growth was observed later in the day (see Fig. 2 for example), likely driven by the condensation of OVOCs. The increase in the sulfate fraction observed in the ACSM supports the condensation of sulfate-related species onto the growing particles. Events on 15 February and 6 and 7 March showed the highest correlations within the first 30 min of lagging the data. Common to these events were relatively high levels of monoterpenes (∼1 ppb either directly observed or inferred from high PAR and temperature) in the hour before NPF detection at the site (see Figs. S1, S2, and S4). The elevated monoterpene levels and subsequent ozonolysis likely initiated particle formation during these times, with the available H2SO4 further facilitating nucleation. The HOM proxy (monoterpenes*ozone; e.g. Zhang et al., 2024) also peaked during this period, supporting the idea that HOM formation via ozonolysis was a dominant oxidation pathway driving initial nucleation.
The event on 8 March also met this condition (see Fig. 5), although it exhibited a relatively low growth rate. Elevated isoprene and MACR + MVK concentrations during this event suggest the potential for isoprene to suppress new particle formation, as described by Heinritzi et al. (2020). Higher isoprene levels after 12:00, accompanied by increased MACR + MVK, coincided with a decline in the number of smaller particles (although the CN3 data are incomplete). This is the first step in the reaction chain to produce C15 dimers. This observation aligns with the HOM proxy (monoterpenes × ozone): higher proxy values corresponded to periods of higher particle numbers, while a decrease in the HOM proxy coincided with a decrease in particle numbers and an increase in MACR + MVK products, suggesting a shift towards more isoprene-influenced atmospheric chemistry. Concurrently, increases in the organic and sulfate fractions, along with the condensation sink, indicate a shift towards conditions favouring the growth of existing larger particles through condensation and coagulation, rather than nucleation events.
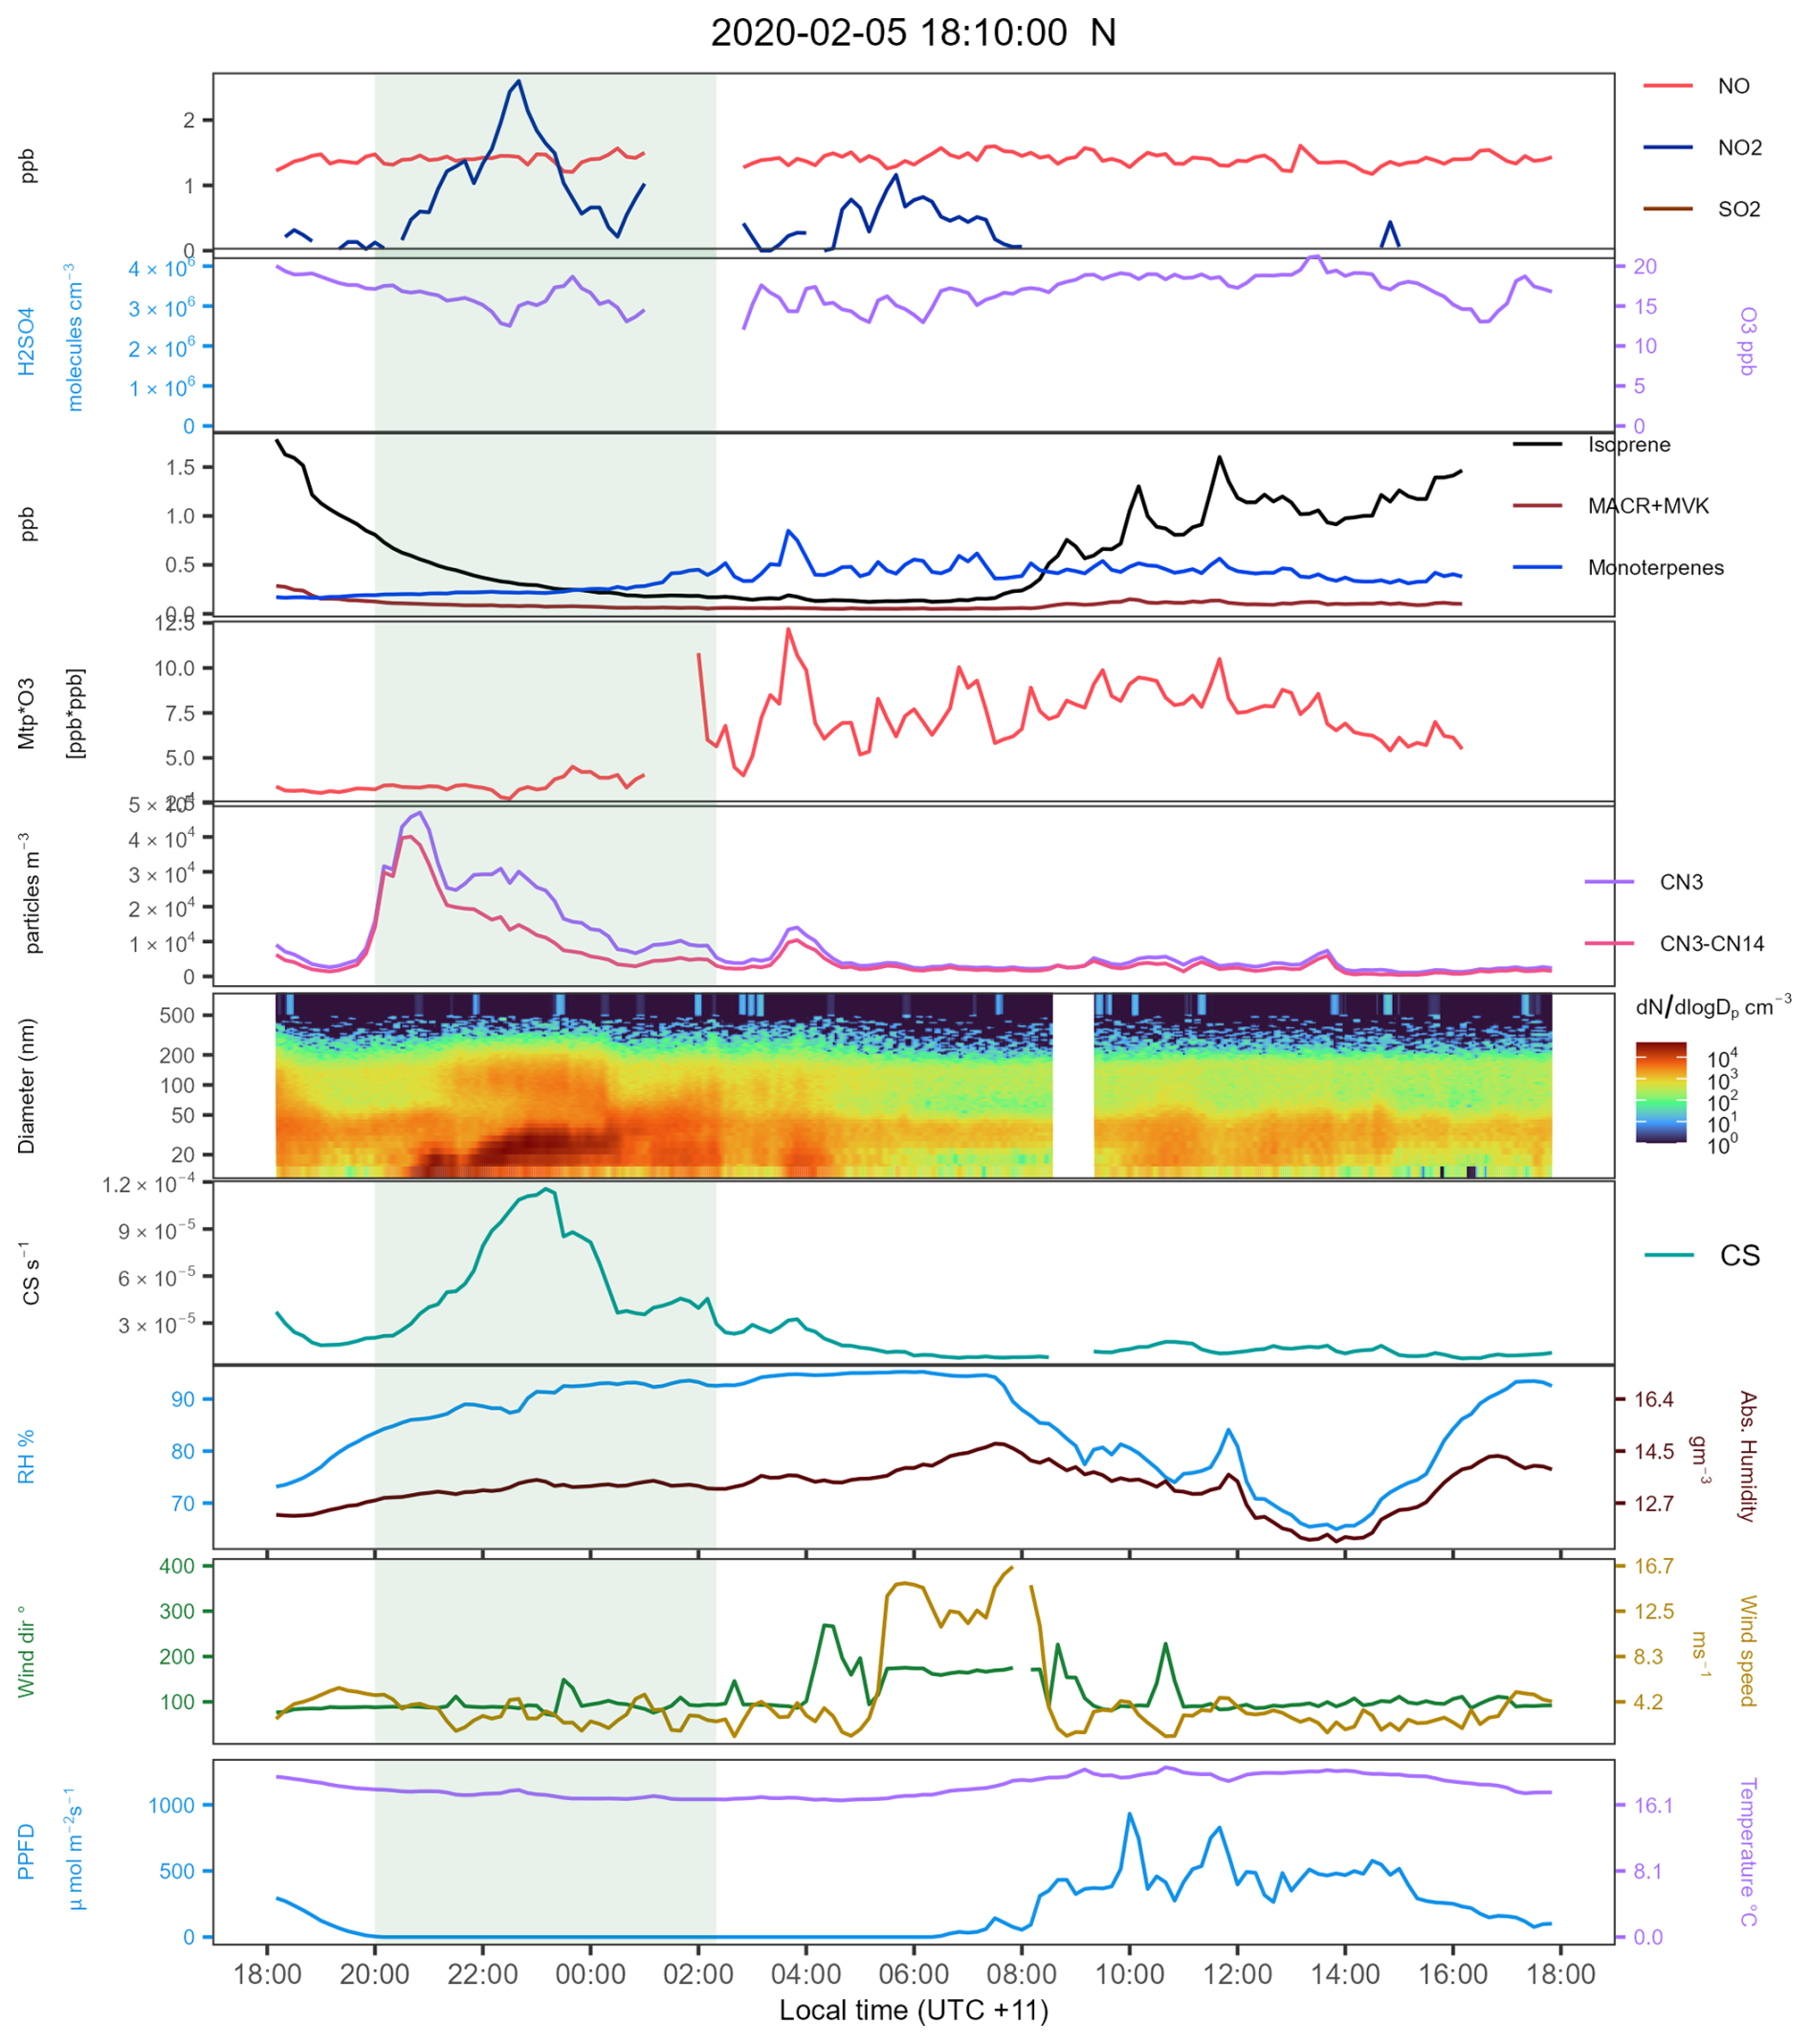
Figure 8Time series for all selected variables during the NPF event on 5 February 2020. NO = nitric oxide, NO2= nitrogen dioxide, SO2= sulfur dioxide, H2SO4= sulfuric acid, O3= ozone, MACR + MVK = isoprene ox. products methacrolein and methyl-vinyl-ketone, CN3= condensation nuclei >3 nm, CN3–CN14= difference of CN3 minus the sum of all channels from the SMPS data. BC = black carbon. Org = organic mass fraction, NH4= ammonium mass fraction, NO3= nitrates mass fraction, SO4= sulfates mass fraction, Cl = chloride mass fraction. CS = condensation sink. Mtp*ozone = HOM proxy product monoterpenes and ozone [ppb*ppb]. Note how the particle number goes below 10 000 after the growth reached the Aitken mode (00:00). There is not a substantial increase in the aerosol mass when the particle number and geometrical particle diameter increase. The light-green area marks the NPF and growth period mentioned in the analysis.
The 11 and 16 February events had similar arrival times for the SO2 pollution (08:00 to 09:00), although the photochemistry was not fully active yet (see H2SO4); monoterpenes levels were consistently high during all the campaign (∼0.4 ppb based on the days with data), enough to promote nucleation. This presumption is supported by looking at the event on 16 February (see Fig. S3). In this event, a first peak of SO2 at 08:00 started nucleation, but then condensation or coagulation dominated, favouring growth. The CN3–CN14 data show that after that initial nucleation period, the particle number was dominated by the >14 nm fraction. Multiple SO2 plumes reaching the site produced higher ratios of H2SO4 but promoted growth to larger particles sizes, particularly on the sulfates fraction that correlates with the SO2 peaks. In the evening, there were a couple of small particle bursts that were quickly coagulated on larger-size particles.
On 10 March (see Fig. 6), a sharp decline in high monoterpene concentrations was observed just before the aerosol event. The aerosol growth phase was then observed to correlate with peaks in SO2 and NOx, as well as elevated levels of isoprene. This suggests monoterpene ozonolysis initiated nucleation, and the observed particle growth coincided with periods indicative of increased atmospheric pollution, potentially contributing condensable material.
For all daytime events, SO2 and NO2 are significantly correlated, with a Pearson correlation of 0.78, suggesting a common source for both pollutants. The closest source of combustion products is the Appin Road located north of the sampling site. Given that the sampling site is away from other possible sources of SO2 and NO2 and that wind speeds during most of the campaign were relatively low (see Fig. S6), combustion from mobile sources is considered the most likely source of both compounds, but there might be some influence of more distant coal-fired power stations. Another factor to contribute to this theory is that the SO2 levels were higher during the day, when most of the commuting takes place, i.e. when there is higher vehicle density on the roads. The intermittent SO2 and NO2 peaks suggest the influence of mobile sources with poor emission control onboard. The effects of vehicles with poor emission control technologies on ambient concentrations of SO2, NOx, anthropogenic VOCs, and PM have been seen in different studies (Kari et al., 2019; Phillips et al., 2019; Smit et al., 2019), and the legislation controlling fuel standards and emissions is relatively lax in New South Wales (Paton-Walsh et al., 2019).
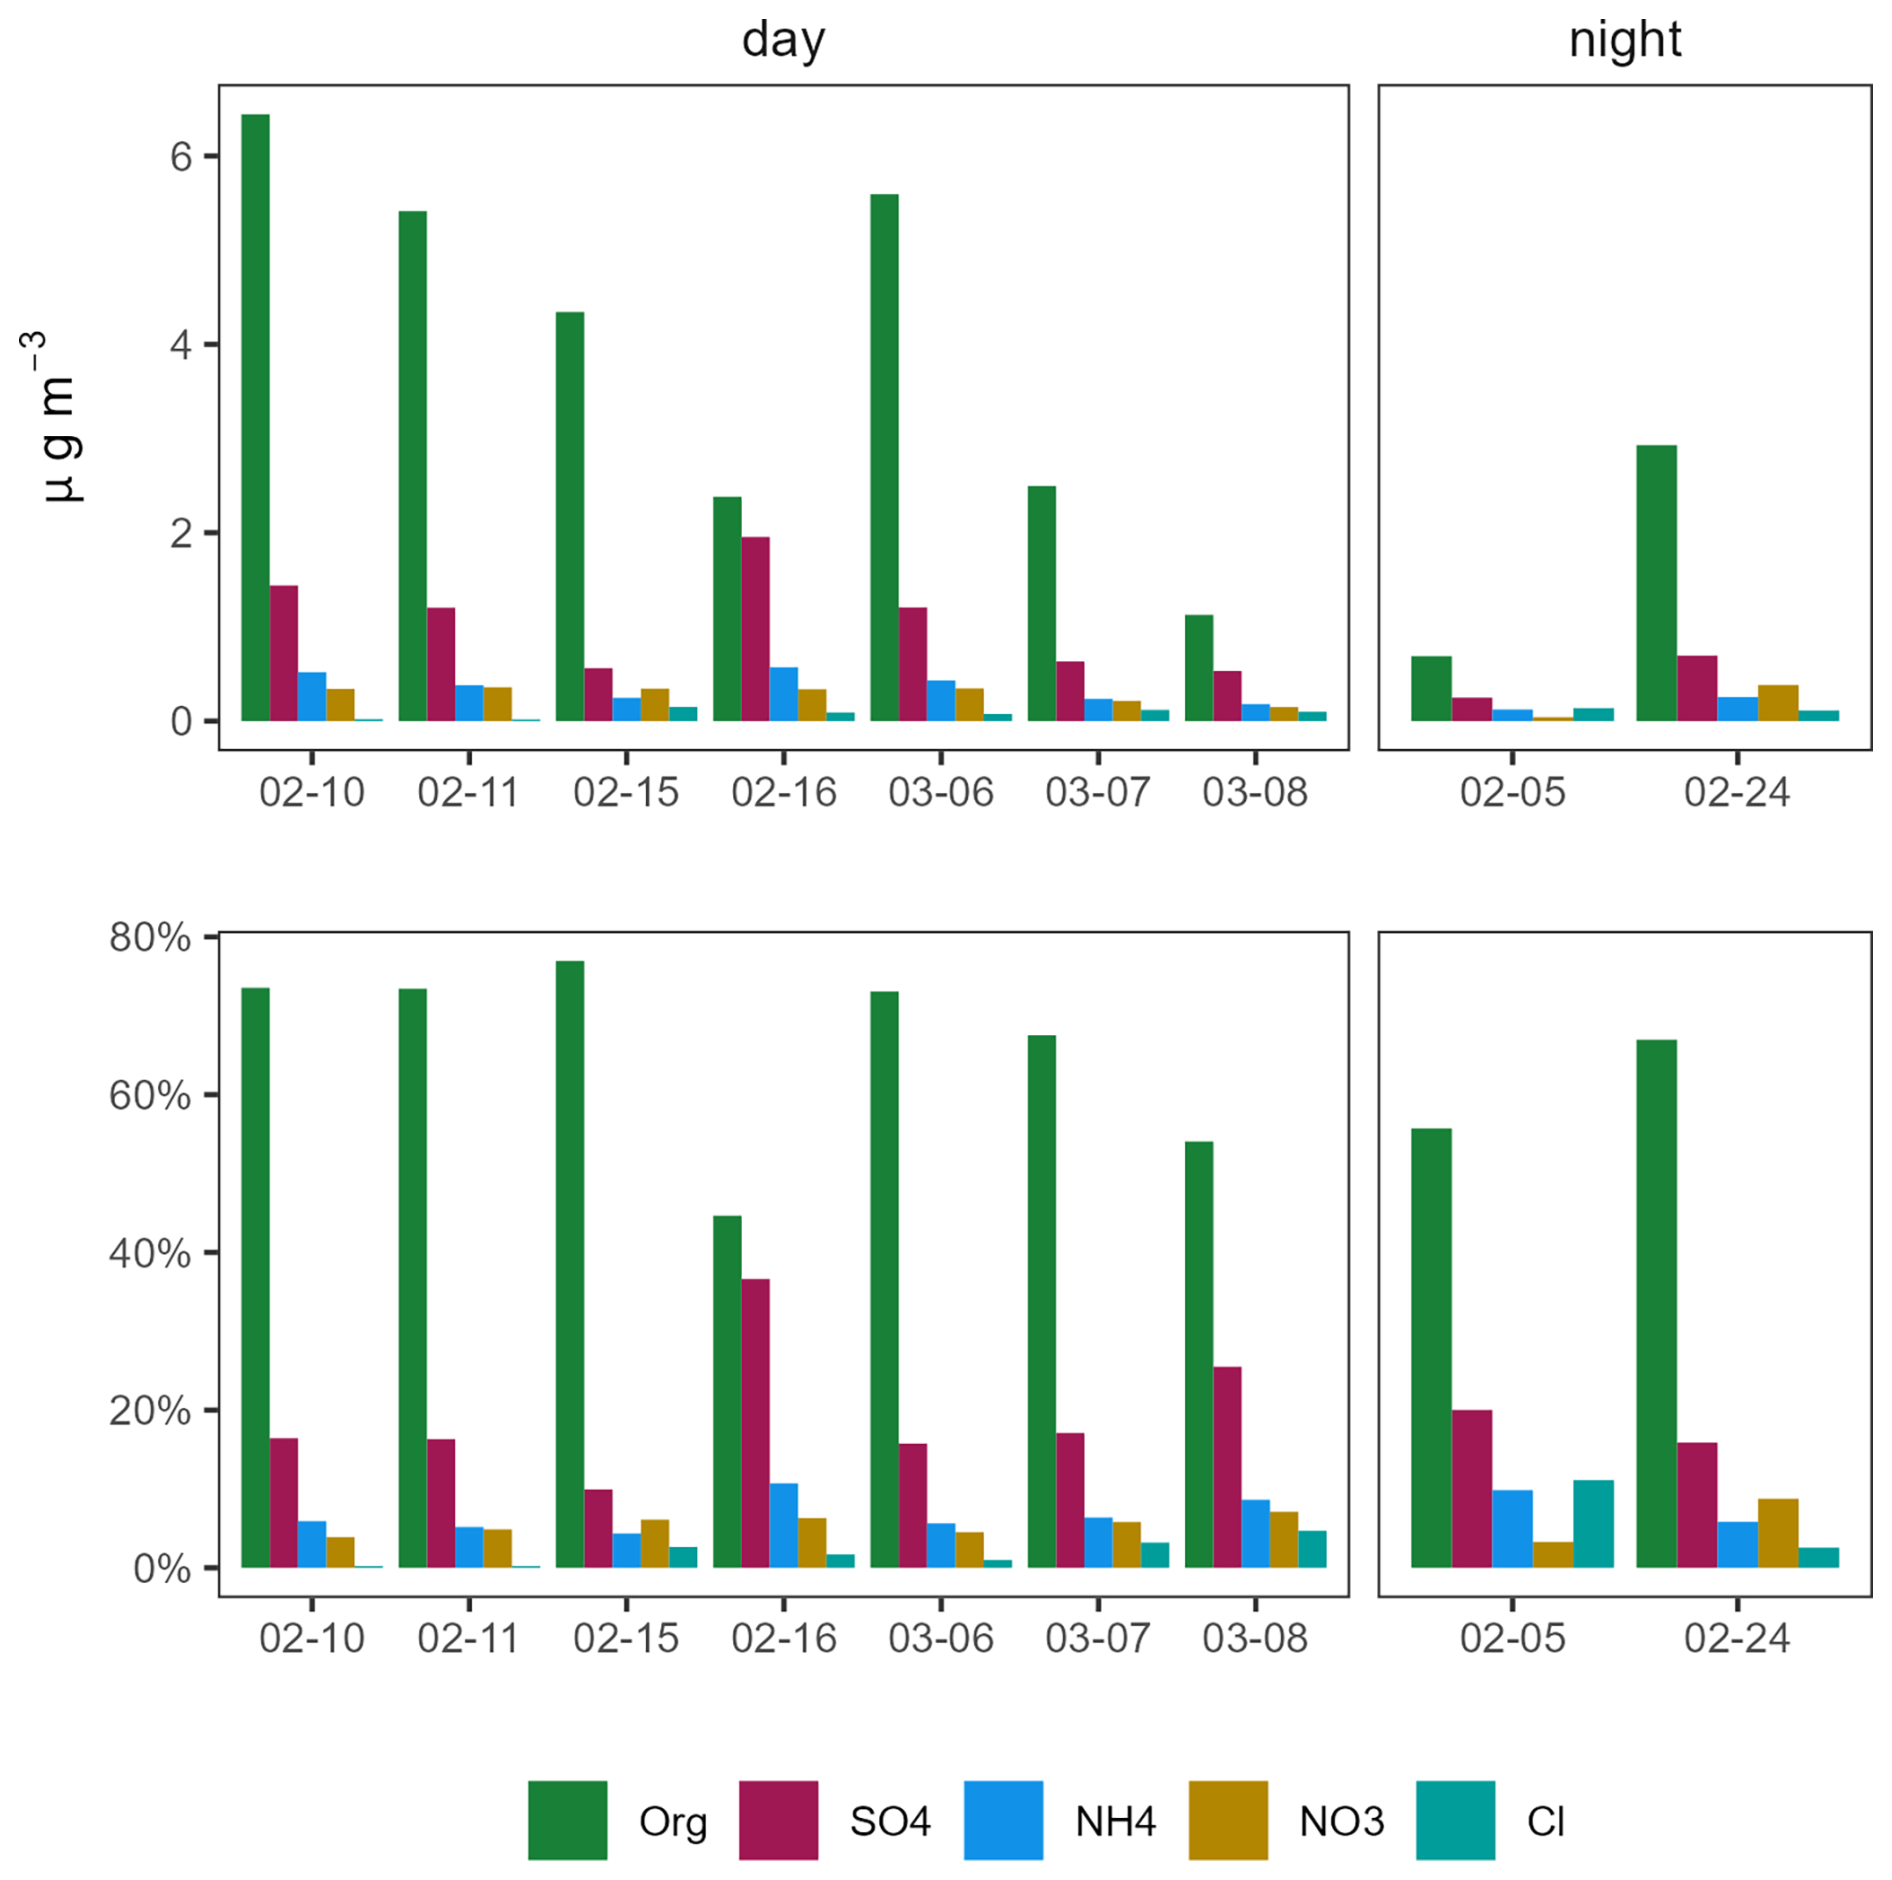
Figure 9Average mass for each chemical group and event (top panels). The bottom panels present the percentage contribution to the mass of each of those fractions based on the average value presented above. Org = organics; SO4= sulfates; NH4= ammonium; NO3= nitrates, and Cl = chlorides.
During the COALA-2020 campaign, many events, such as the one on 16 February (Fig. S3), exhibited elevated gas-phase SO2. The availability of monoterpene to form highly condensable ULVOC ELVOC is crucial in the observed events. While the oxidation products of isoprene can also condense on pre-existing particles (Stangl et al., 2019), the dominant pathways and their efficiency are likely driven by monoterpenes. Although VOC data were not available for 16 February, the consistent diurnal profile of VOCs observed throughout the remaining dataset (Fig. S5) suggests enhanced monoterpene and isoprene availability during the daytime. Under these conditions of available BVOCs, particle growth was frequently observed, suggesting a contribution from condensed organic material. As the night approaches and BVOC emissions decrease with temperature, the remaining OVOCs can undergo further oxidation, forming less volatile species that are more prone to condensation on existing particles. However, the limited availability of VOCs after their consumption (estimated around 22:00 based on diurnal cycles in Fig. S5) likely limits further growth.
When there is negligible SO2 in the atmosphere but high VOC concentrations (particularly monoterpenes), auto-oxidation processes can be initiated, potentially leading to both nucleation and subsequent particle growth (Bianchi et al., 2019). Growth was observed during the first event on 10 February (see daytime data in Fig. 7) despite low SO2 and may be related to the condensation of HOMs formed through monoterpene auto-oxidation. The average concentration of monoterpenes during the campaign in the morning was often sufficient to initiate reactions leading to ULVOC that favour both new particle formation and the growth of pre-existing particles.
Australia experiences an isoprene-dominated atmosphere (Emmerson et al., 2016; Ramirez-Gamboa et al., 2021), and the chemical balance in the atmosphere can rapidly change, particularly in the hotter seasons when more isoprene is emitted. While SOA formation on pre-existing particles can involve molecules with relatively high saturation vapour pressures, new particle formation critically depends on molecules with extremely low saturation vapour pressures due to the Kelvin effect (Tröstl et al., 2016). Heinritzi et al. (2020) showed that reducing C20 formation (α-pinene oxidation in the presence of isoprene) to favour C15 formation reduces nucleation rates. However, it is also important to highlight that C15, C10, and even C5 oxidation products from isoprene oxidation can contribute to SOA mass on existing particles. Therefore, in Australia's isoprene-dominated environment, higher isoprene to monoterpene ratios could lead to a greater production of C5 and C15 products that contribute to particle growth on existing aerosols (and SOA mass) while simultaneously hindering new particle formation by reducing the formation of C20 dimers from monoterpenes.
3.5 Nighttime NPF events
We observed three nighttime events during COALA. Unfortunately, none of these events coincided with all datasets being collected, which limits our ability to discuss the reactions driving the nighttime events. Consistent between all nighttime events is an increase in particles (CN3), elevated NO2, and an increasing condensation sink. Unfortunately, the NOx instrument available in this study was not ideal for this type of measurement for several reasons: it is not designed to be sensitive to the low NOx levels observed in rural areas; it is not capable of separating NOx from NOy; and it was set up to calibrate in the night hours between 01:00 and 02:00 every day. Nonetheless, during the nighttime events, the particle size distribution data and the CN3 data showed particle formation and growth from the nucleation to Aitken modes when there were considerable increases in NO2 and simultaneous decreases in ozone.
When VOC data were available, monoterpene concentrations were moderate and increased steadily during the event (5 February and 9 March). Isoprene was high at the start of the event on 5 February (see Fig. 8); however, the sudden decrease in isoprene concentration likely coincides with sunset on that day. When aerosol composition data were available (10 February), aerosol organic, nitrate, and sulfate concentrations increased during the event. When ozone data were available, concentrations decreased slightly during the course of the event.
The frequency of nocturnal events observed in this study is lower than observed previously at a nearby location (Tumbarumba, a eucalypt forest site located 300 km southeast of Cataract; Suni et al., 2009), where, in the summer of 2006, nocturnal NPF events were observed on 32 % of the analysed nights and occurred 2.5 times more frequently than daytime events. Simulating the NPF at Tumbarumba, Ortega et al. (2012) was able to reproduce the observations from Tumbarumba by ozonolysis of 13-carene to initiate nucleation and a-pinene to grow particle diameters. Ozonolysis of limonene was found to contribute to both nucleation and aerosol growth. The lower frequency observed in our study may be linked to the apparent inhibition of nucleation by NO2, which nocturnally can react with O3 to form nitrate radicals. Li et al. (2024) suggest that even trace amounts of NO3 radicals suppress the NPF.
3.6 Aerosol fraction: day vs night
Figure 9 shows the mass fraction of the PM1 aerosol mass measured in the ACSM. Most of the daytime events show a similar mass fraction distribution. The organic fraction is the largest mass fraction, followed by sulfates, ammonium, nitrates, and chlorides. We observed higher sulfate mass fractions in days with higher SO2 availability such as the events on 16 February and 8 March, where the average sulfate mass fraction was larger or similar to the organic fraction (see Fig. 9). These two events also display the highest proportion of ammonium during daytime events. The overall mass during nighttime is much lower than during daytime, likely related to the lower concentrations of VOCs available during the night, resulting in growth not reaching sizes where it was detectable by the ACSM. Even with less total mass during the night, the contribution of each fraction is similar to the daytime events. The most notable difference between the mass fractions during daytime and nighttime NPF events is the higher fraction of chlorides during nighttime. Chloride is a primarily sourced aerosol component, so it is not influenced by the aerosol formation capacity of the atmosphere at night that reduces the total organic, sulfate, nitrate, and ammonia mass but does not impact chlorides.
Something to highlight is the higher fraction of ammonium compared to nitrates through most of the events. Regions with low NOx have been previously characterized with higher ammonium fractions compared to nitrates (Du et al., 2015; Liu et al., 2022; Petit et al., 2015; Takami et al., 2005; Topping et al., 2004), while regions with higher NOx concentrations favour nitrate formation (Hu et al., 2015; Parworth et al., 2015; Poulain et al., 2020; Schlag et al., 2016). The urban vs rural difference in relative mass composition is evident when comparing this study with the aerosol mass fractions observed at an urban site in Sydney (Keywood et al., 2016), in which high nitrate fractions were observed during most of the campaign.
Here, we present aerosol concentration and composition data, VOCs, and air pollutant concentrations collected during part of the COALA-2020 campaign, which includes data from 5 February to 17 March at a rural site south of Sydney, Australia. This period followed the Black Summer fires after heavy rainfall cleared the smoke, offering insights into atmospheric processes under clean background conditions.
The atmosphere during the sampling period was classified as highly reactive, with particle formation identified on more than 39 % of the sampling days. Like previous studies, daytime NPF events coincided with the arrival of anthropogenic plumes at the site, suggesting their role in initiating particle formation. The positive relationship between monoterpene concentrations and both PM1 organic aerosol mass and CN3 suggests a direct relationship between biogenic emissions and organic aerosol formation.
The change from gas to aerosol phase was indirectly analysed through the evaluation of the conditions leading to NPF events. This analysis showed how SO2 plumes impacting the site drove NPF. The particle growth rate was dependent on available VOCs in the atmosphere and OH availability, also enhanced during periods with higher relative humidity and multiple intrusions of SO2 and NOx plumes producing particles larger than 100 nm.
Nighttime events were attributed mainly to oxidation with ozone. Although most of the nighttime events showed the influence of monoterpene ozonolysis on NPF events, our data were limited, and we acknowledge that other factors may have influenced nighttime NPF.
The COALA-2020 campaign highlights the significant role of biogenic emissions, particularly monoterpenes driving NPF and isoprene enhancing particle growth in Southeast Australia. These findings contribute to a better understanding of local atmospheric chemistry and its potential impact on regional air quality and climate. However, longer-term observations are necessary to capture the full picture of seasonal variations and non-fire-related extreme events.
Data are available at PANGAEA via the following links: VOCs – https://doi.org/10.1594/PANGAEA.927277 (Mouat et al., 2021). Aerosol size distributions – https://doi.org/10.1594/PANGAEA.928853 (Humphries et al., 2021a). Condensation nuclei >3 nm in diameter – https://doi.org/10.1594/PANGAEA.925555 (Keywood et al., 2020). Cloud condensation nuclei – https://doi.org/10.1594/PANGAEA.928925 (Humphries et al., 2021b). Greenhouse gases – https://doi.org/10.1594/PANGAEA.927313 (Griffith et al., 2021a). Air quality data – https://doi.org/10.1594/PANGAEA.929001 (Gunashanhar et al., 2021). Meteorological data – https://doi.org/10.1594/PANGAEA.928929 (Griffiths et al., 2021b). ACSM data – https://doi.org/10.1594/PANGAEA.973272 (Humphries et al., 2024). PAR data – https://doi.org/10.1594/PANGAEA.928051 (Naylor et al., 2021).
The supplement related to this article is available online at https://doi.org/10.5194/acp-25-9937-2025-supplement.
The experiment design was made by CPW and MK. The data collection was done by JS, TN, CPW, AM, MK, RH, MP, and JRG. The data processing to convert mass spectra to concentrations of VOCs was done by AM under the direction and supervision of JK. The data analysis was done by JRG. The paper was written by JRG and CPW.
The contact author has declared that none of the authors has any competing interests.
Publisher’s note: Copernicus Publications remains neutral with regard to jurisdictional claims made in the text, published maps, institutional affiliations, or any other geographical representation in this paper. While Copernicus Publications makes every effort to include appropriate place names, the final responsibility lies with the authors.
We are grateful to all who contributed to the COALA-2020 campaign. Particular thanks are due to all the staff at Cataract Scout Camp and the research students and staff: Ian Galbally, Kathryn Emmerson, Gunashanhar Gunaratnam, John Kirkwood, Warren White, David Griffiths, Alex Carter, Alan Griffiths, Hamish McDougall, and Graham Kettlewell.
COALA-2020 was supported by Australia's National Environmental Science Program through the Clean Air and Urban Landscapes hub. Jhonathan Ramirez-Gamboa was supported during his PhD studies by a commonwealth-funded University Post-Graduate Award at the University of Wollongong.
This paper was edited by Joachim Curtius and reviewed by two anonymous referees.
ABARES: Australian forest profiles 2019: Eucalypt, Australian Bureau of Agricultural Resource Economics and Sciences (ABARES), https://www.agriculture.gov.au/sites/default/files/abares/forestsaustralia/publishingimages/forest%20profiles%202019/eucalypt/AusForProf_2019_Eucalypt_v.1.0.0.pdf (last access: 25 August 2025), 2019.
Annesi-Maesano, I., Baiz, N., Banerjee, S., Rudnai, P., Rive, S., and the, S. G.: Indoor Air Quality and Sources in Schools and Related Health Effects, J. Toxicol. Environ. Health Part B, 16, 491–550, https://doi.org/10.1080/10937404.2013.853609, 2013.
Aydin, Y. M., Yaman, B., Koca, H., Dasdemir, O., Kara, M., Altiok, H., Dumanoglu, Y., Bayram, A., Tolunay, D., Odabasi, M., and Elbir, T.: Biogenic volatile organic compound (BVOC) emissions from forested areas in Turkey: Determination of specific emission rates for thirty-one tree species, Sci. Total Environ., 490, 239–253, https://doi.org/10.1016/J.SCITOTENV.2014.04.132, 2014.
Bianchi, F., Kurtén, T., Riva, M., Mohr, C., Rissanen, M. P., Roldin, P., Berndt, T., Crounse, J. D., Wennberg, P. O., Mentel, T. F., Wildt, J., Junninen, H., Jokinen, T., Kulmala, M., Worsnop, D. R., Thornton, J. A., Donahue, N., Kjaergaard, H. G., and Ehn, M.: Highly Oxygenated Organic Molecules (HOM) from Gas-Phase Autoxidation Involving Peroxy Radicals: A Key Contributor to Atmospheric Aerosol, Chem. Rev., 119, 3472–3509, https://doi.org/10.1021/acs.chemrev.8b00395, 2019.
Bousiotis, D., Brean, J., Pope, F. D., Dall'Osto, M., Querol, X., Alastuey, A., Perez, N., Petäjä, T., Massling, A., Nøjgaard, J. K., Nordstrøm, C., Kouvarakis, G., Vratolis, S., Eleftheriadis, K., Niemi, J. V., Portin, H., Wiedensohler, A., Weinhold, K., Merkel, M., Tuch, T., and Harrison, R. M.: The effect of meteorological conditions and atmospheric composition in the occurrence and development of new particle formation (NPF) events in Europe, Atmos. Chem. Phys., 21, 3345–3370, https://doi.org/10.5194/acp-21-3345-2021, 2021.
Chen, Z., Schofield, R., Rayner, P., Zhang, T., Liu, C., Vincent, C., Fiddes, S., Ryan, R. G., Alroe, J., Ristovski, Z. D., Humphries, R. S., Keywood, M. D., Ward, J., Paton-Walsh, C., Naylor, T., and Shu, X.: Characterization of aerosols over the Great Barrier Reef: The influence of transported continental sources, Sci. Total Environ., 690, 426–437, https://doi.org/10.1016/j.scitotenv.2019.07.007, 2019.
Dada, L., Ylivinkka, I., Baalbaki, R., Li, C., Guo, Y., Yan, C., Yao, L., Sarnela, N., Jokinen, T., Daellenbach, K. R., Yin, R., Deng, C., Chu, B., Nieminen, T., Wang, Y., Lin, Z., Thakur, R. C., Kontkanen, J., Stolzenburg, D., Sipilä, M., Hussein, T., Paasonen, P., Bianchi, F., Salma, I., Weidinger, T., Pikridas, M., Sciare, J., Jiang, J., Liu, Y., Petäjä, T., Kerminen, V.-M., and Kulmala, M.: Sources and sinks driving sulfuric acid concentrations in contrasting environments: implications on proxy calculations, Atmos. Chem. Phys., 20, 11747–11766, https://doi.org/10.5194/acp-20-11747-2020, 2020.
Dada, L., Stolzenburg, D., Simon, M., Fischer, L., Heinritzi, M., Wang, M., Xiao, M., Vogel, A. L., Ahonen, L., Amorim, A., Baalbaki, R., Baccarini, A., Baltensperger, U., Bianchi, F., Daellenbach, K. R., DeVivo, J., Dias, A., Dommen, J., Duplissy, J., Finkenzeller, H., Hansel, A., He, X.-C., Hofbauer, V., Hoyle, C. R., Kangasluoma, J., Kim, C., Kürten, A., Kvashnin, A., Mauldin, R., Makhmutov, V., Marten, R., Mentler, B., Nie, W., Petäjä, T., Quéléver, L. L. J., Saathoff, H., Tauber, C., Tome, A., Molteni, U., Volkamer, R., Wagner, R., Wagner, A. C., Wimmer, D., Winkler, P. M., Yan, C., Zha, Q., Rissanen, M., Gordon, H., Curtius, J., Worsnop, D. R., Lehtipalo, K., Donahue, N. M., Kirkby, J., El Haddad, I., and Kulmala, M.: Role of sesquiterpenes in biogenic new particle formation, Sci. Adv., 9, eadi5297, https://doi.org/10.1126/sciadv.adi5297, 2023.
Dal Maso, M., Kulmala, M., Riipinen, I., and Wagner, R.: Formation and growth of fresh atmospheric aerosols: Eight years of aerosol size distribution data from SMEAR II, Hyytiälä, Finland, Boreal Environ. Res., 10, 323–336, 2005.
Du, W., Sun, Y. L., Xu, Y. S., Jiang, Q., Wang, Q. Q., Yang, W., Wang, F., Bai, Z. P., Zhao, X. D., and Yang, Y. C.: Chemical characterization of submicron aerosol and particle growth events at a national background site (3295 m a.s.l.) on the Tibetan Plateau, Atmos. Chem. Phys., 15, 10811–10824, https://doi.org/10.5194/acp-15-10811-2015, 2015.
Emmerson, K. M., Galbally, I. E., Guenther, A. B., Paton-Walsh, C., Guerette, E.-A., Cope, M. E., Keywood, M. D., Lawson, S. J., Molloy, S. B., Dunne, E., Thatcher, M., Karl, T., and Maleknia, S. D.: Current estimates of biogenic emissions from eucalypts uncertain for southeast Australia, Atmos. Chem. Phys., 16, 6997–7011, https://doi.org/10.5194/acp-16-6997-2016, 2016.
Emmerson, K. M., Cope, M. E., Galbally, I. E., Lee, S., and Nelson, P. F.: Isoprene and monoterpene emissions in south-east Australia: comparison of a multi-layer canopy model with MEGAN and with atmospheric observations, Atmos. Chem. Phys., 18, 7539–7556, https://doi.org/10.5194/acp-18-7539-2018, 2018.
Emmerson, K. M., Palmer, P. I., Thatcher, M., Haverd, V., and Guenther, A. B.: Sensitivity of isoprene emissions to drought over south-eastern Australia: Integrating models and satellite observations of soil moisture, Atmos. Environ., 209, 112–124, https://doi.org/10.1016/j.atmosenv.2019.04.038, 2019.
Emmerson, K. M., Possell, M., Aspinwall, M. J., Pfautsch, S., and Tjoelker, M. G.: Temperature response measurements from eucalypts give insight into the impact of Australian isoprene emissions on air quality in 2050, Atmos. Chem. Phys., 20, 6193–6206, https://doi.org/10.5194/acp-20-6193-2020, 2020.
Fini, A., Brunetti, C., Loreto, F., Centritto, M., Ferrini, F., and Tattini, M.: Isoprene responses and functions in plants challenged by environmental pressures associated to climate change, Front. Plant Sci., 8, 1281, https://doi.org/10.3389/fpls.2017.01281, 2017.
Friedman, B. and Farmer, D.: SOA and gas phase organic acid yields from the sequential photooxidation of seven monoterpenes, Atmos. Environ., 187, 335–345, https://doi.org/10.1016/j.atmosenv.2018.06.003, 2018.
Goldstein, A. H. and Galbally, I. E.: Known and unexplored organic constituents in the earth's atmosphere, Environ. Sci. Technol., 41, 1514–1521, https://doi.org/10.1021/es072476p, 2007.
Griffith, D. W. T., Paton-Walsh, C., Naylor, T. A., Kettlewell, G., Ramirez-Gamboa, J., Simmons, J. B., Carter, A., Dang, Q. P., and Webb, A.: Greenhouse gases measurements at Cataract Scout Park, Australia, taken during the COALA-2020 campaign, PANGAEA [data set], https://doi.org/10.1594/PANGAEA.927313, 2021a.
Griffiths, A. D., Naylor, T. A., Paton-Walsh, C., and Carter, A.: Wind speed and direction measurements at Cataract Scout Park, Australia, taken during the COALA-2020 campaign, PANGAEA [data set], https://doi.org/10.1594/PANGAEA.928929, 2021b.
Guenther, A. B., Jiang, X., Heald, C. L., Sakulyanontvittaya, T., Duhl, T., Emmons, L. K., and Wang, X.: The Model of Emissions of Gases and Aerosols from Nature version 2.1 (MEGAN2.1): an extended and updated framework for modeling biogenic emissions, Geosci. Model Dev., 5, 1471–1492, https://doi.org/10.5194/gmd-5-1471-2012, 2012.
Gunashanhar, G., Kirkwood, J., White, W. B., and Paton-Walsh, C.: Air quality pollutants measurements at Cataract Scout Park, Australia, taken during the COALA-2020 campaign, PANGAEA [data set], https://doi.org/10.1594/PANGAEA.929001, 2021.
Heinritzi, M., Dada, L., Simon, M., Stolzenburg, D., Wagner, A. C., Fischer, L., Ahonen, L. R., Amanatidis, S., Baalbaki, R., Baccarini, A., Bauer, P. S., Baumgartner, B., Bianchi, F., Brilke, S., Chen, D., Chiu, R., Dias, A., Dommen, J., Duplissy, J., Finkenzeller, H., Frege, C., Fuchs, C., Garmash, O., Gordon, H., Granzin, M., El Haddad, I., He, X., Helm, J., Hofbauer, V., Hoyle, C. R., Kangasluoma, J., Keber, T., Kim, C., Kürten, A., Lamkaddam, H., Laurila, T. M., Lampilahti, J., Lee, C. P., Lehtipalo, K., Leiminger, M., Mai, H., Makhmutov, V., Manninen, H. E., Marten, R., Mathot, S., Mauldin, R. L., Mentler, B., Molteni, U., Müller, T., Nie, W., Nieminen, T., Onnela, A., Partoll, E., Passananti, M., Petäjä, T., Pfeifer, J., Pospisilova, V., Quéléver, L. L. J., Rissanen, M. P., Rose, C., Schobesberger, S., Scholz, W., Scholze, K., Sipilä, M., Steiner, G., Stozhkov, Y., Tauber, C., Tham, Y. J., Vazquez-Pufleau, M., Virtanen, A., Vogel, A. L., Volkamer, R., Wagner, R., Wang, M., Weitz, L., Wimmer, D., Xiao, M., Yan, C., Ye, P., Zha, Q., Zhou, X., Amorim, A., Baltensperger, U., Hansel, A., Kulmala, M., Tomé, A., Winkler, P. M., Worsnop, D. R., Donahue, N. M., Kirkby, J., and Curtius, J.: Molecular understanding of the suppression of new-particle formation by isoprene, Atmos. Chem. Phys., 20, 11809–11821, https://doi.org/10.5194/acp-20-11809-2020, 2020.
Higgins, D. N., Taylor Jr., M. S., Krasnomowitz, J. M., and Johnston, M. V.: Growth Rate Dependence of Secondary Organic Aerosol on Seed Particle Size, Composition, and Phase, ACS Earth Space Chem., 6, 2158–2166, https://doi.org/10.1021/acsearthspacechem.2c00049, 2022.
Hu, W. W., Campuzano-Jost, P., Palm, B. B., Day, D. A., Ortega, A. M., Hayes, P. L., Krechmer, J. E., Chen, Q., Kuwata, M., Liu, Y. J., de Sá, S. S., McKinney, K., Martin, S. T., Hu, M., Budisulistiorini, S. H., Riva, M., Surratt, J. D., St. Clair, J. M., Isaacman-Van Wertz, G., Yee, L. D., Goldstein, A. H., Carbone, S., Brito, J., Artaxo, P., de Gouw, J. A., Koss, A., Wisthaler, A., Mikoviny, T., Karl, T., Kaser, L., Jud, W., Hansel, A., Docherty, K. S., Alexander, M. L., Robinson, N. H., Coe, H., Allan, J. D., Canagaratna, M. R., Paulot, F., and Jimenez, J. L.: Characterization of a real-time tracer for isoprene epoxydiols-derived secondary organic aerosol (IEPOX-SOA) from aerosol mass spectrometer measurements, Atmos. Chem. Phys., 15, 11807–11833, https://doi.org/10.5194/acp-15-11807-2015, 2015.
Humphries, R. S., Keywood, M. D., Paton-Walsh, C., Naylor, T. A., Simmons, J. B., Ramirez-Gamboa, J., Carter, A., Dang, Q. P., and Webb, A.: Aerosol size distribution measurements at Cataract Scout Park, Australia, taken during the COALA-2020 campaign, PANGAEA [data set], https://doi.org/10.1594/PANGAEA.928853, 2021a.
Humphries, R. S., Keywood, M. D., Paton-Walsh, C., Naylor, T. A., Simmons, J. B., Ramirez-Gamboa, J., Carter, A., Dang, Q. P., and Webb, A.: Cloud condensation nuclei (CCN) measurements at Cataract Scout Park, Australia, taken during the COALA-2020 campaign, PANGAEA [data set], https://doi.org/10.1594/PANGAEA.928925, 2021b.
Humphries, R. S., Keywood, M. D., Paton-Walsh, C., Naylor, T. A., Simmons, J. B., Ramirez-Gamboa, J., Dang, Q. P., and Sutresna, A.: COALA-2020: Measurements of aerosol composition by ACSM at Cataract Scout Park, NSW, January–March 2020, PANGAEA [data set], https://doi.org/10.1594/PANGAEA.973272, 2024.
Hussein, T., Dal Maso, M., Petäjä, T., Koponen, I., Paatero, P., Aalto, P., Hämeri, K., and Kulmala, M.: Evaluation of an automatic algorithm for fitting the particle number size distribution, Boreal Environ. Res., 10, 337–355, 2005.
Iyer, S., Rissanen, M. P., Valiev, R., Barua, S., Krechmer, J. E., Thornton, J., Ehn, M., and Kurtén, T.: Molecular mechanism for rapid autoxidation in α-pinene ozonolysis, Nat. Commun., 12, 878, https://doi.org/10.1038/s41467-021-21172-w, 2021.
Kalkavouras, P., Bougiatioti, A., Grivas, G., Stavroulas, I., Kalivitis, N., Liakakou, E., Gerasopoulos, E., Pilinis, C., and Mihalopoulos, N.: On the regional aspects of new particle formation in the Eastern Mediterranean: A comparative study between a background and an urban site based on long term observations, Atmos. Res., 239, 104911, https://doi.org/10.1016/j.atmosres.2020.104911, 2020.
Kari, E., Hao, L., Ylisirniö, A., Buchholz, A., Leskinen, A., Yli-Pirilä, P., Nuutinen, I., Kuuspalo, K., Jokiniemi, J., Faiola, C. L., Schobesberger, S., and Virtanen, A.: Potential dual effect of anthropogenic emissions on the formation of biogenic secondary organic aerosol (BSOA), Atmos. Chem. Phys., 19, 15651–15671, https://doi.org/10.5194/acp-19-15651-2019, 2019.
Kerminen, V.-M., Paramonov, M., Anttila, T., Riipinen, I., Fountoukis, C., Korhonen, H., Asmi, E., Laakso, L., Lihavainen, H., Swietlicki, E., Svenningsson, B., Asmi, A., Pandis, S. N., Kulmala, M., and Petäjä, T.: Cloud condensation nuclei production associated with atmospheric nucleation: a synthesis based on existing literature and new results, Atmos. Chem. Phys., 12, 12037–12059, https://doi.org/10.5194/acp-12-12037-2012, 2012.
Kesselmeier, J. and Staudt, M.: Biogenic Volatile Organic Compounds (VOC): An Overview on Emission, Physiology and Ecology, J. Atmos. Chem., 33, 23–88, https://doi.org/10.1023/A:1006127516791, 1999.
Keywood, M., Selleck, P., Galbally, I., Lawson, S., Powell, J., Cheng, M., Gillett, R., Ward, J., Harnwell, J., Dunne, E., Boast, K., Reisen, F., Molloy, S., Griffiths, A., Chambers, S., Humphries, R., Guerette, E.-A., and Cohen, D.: Sydney Particle Study 2 – Aerosol and gas data collection. v1., edited by: Crumeyrolle, S., Zhang, C., Zeng, J., and Fedele, R., CSIRO, https://doi.org/10.4225/08/57903B83D6A5D, 2016.
Keywood, M. D., Humphries, R. S., Paton-Walsh, C., Naylor, T. A., Ramirez-Gamboa, J., Simmons, J. B., Carter, A., Dang, Q. P., and Webb, A.: Condensation nuclei >3 nm (CN3) measurements at Cataract Scout Park, Australia, taken during the COALA-2020 campaign, PANGAEA [data set], https://doi.org/10.1594/PANGAEA.925555, 2020.
Kiendler-Scharr, A., Wildt, J., Maso, M. D., Hohaus, T., Kleist, E., Mentel, T. F., Tillmann, R., Uerlings, R., Schurr, U., and Wahner, A.: New particle formation in forests inhibited by isoprene emissions, Nature, 461, 381–384, 2009.
Kirkby, J., Amorim, A., Baltensperger, U., Carslaw, K. S., Christoudias, T., Curtius, J., Donahue, N. M., Haddad, I. E., Flagan, R. C., Gordon, H., Hansel, A., Harder, H., Junninen, H., Kulmala, M., Kürten, A., Laaksonen, A., Lehtipalo, K., Lelieveld, J., Möhler, O., Riipinen, I., Stratmann, F., Tomé, A., Virtanen, A., Volkamer, R., Winkler, P. M., and Worsnop, D. R.: Atmospheric new particle formation from the CERN CLOUD experiment, Nat. Geosci., 16, 948–957, https://doi.org/10.1038/s41561-023-01305-0, 2023.
Kulmala, M., Maso, M. D., Mäkelä, J. M., Pirjola, L., Väkevä, M., Aalto, P., Miikkulainen, P., Hämeri, K., and O'dowd, C. D.: On the formation, growth and composition of nucleation mode particles, Tellus B, 53, 479–490, https://doi.org/10.1034/j.1600-0889.2001.530411.x, 2001.
Lee, B. H., Iyer, S., Kurtén, T., Varelas, J. G., Luo, J., Thomson, R. J., and Thornton, J. A.: Ring-opening yields and auto-oxidation rates of the resulting peroxy radicals from OH-oxidation of α-pinene and β-pinene, Environ. Sci. Atmos., 3, 399–407, https://doi.org/10.1039/D2EA00133K, 2023.
Lehtipalo, K., Yan, C., Dada, L., Bianchi, F., Xiao, M., Wagner, R., Stolzenburg, D., Ahonen, L. R., Amorim, A., Baccarini, A., Bauer, P. S., Baumgartner, B., Bergen, A., Bernhammer, A.-K., Breitenlechner, M., Brilke, S., Buchholz, A., Mazon, S. B., Chen, D., Chen, X., Dias, A., Dommen, J., Draper, D. C., Duplissy, J., Ehn, M., Finkenzeller, H., Fischer, L., Frege, C., Fuchs, C., Garmash, O., Gordon, H., Hakala, J., He, X., Heikkinen, L., Heinritzi, M., Helm, J. C., Hofbauer, V., Hoyle, C. R., Jokinen, T., Kangasluoma, J., Kerminen, V.-M., Kim, C., Kirkby, J., Kontkanen, J., Kürten, A., Lawler, M. J., Mai, H., Mathot, S., Mauldin, R. L., Molteni, U., Nichman, L., Nie, W., Nieminen, T., Ojdanic, A., Onnela, A., Passananti, M., Petäjä, T., Piel, F., Pospisilova, V., Quéléver, L. L. J., Rissanen, M. P., Rose, C., Sarnela, N., Schallhart, S., Schuchmann, S., Sengupta, K., Simon, M., Sipilä, M., Tauber, C., Tomé, A., Tröstl, J., Väisänen, O., Vogel, A. L., Volkamer, R., Wagner, A. C., Wang, M., Weitz, L., Wimmer, D., Ye, P., Ylisirniö, A., Zha, Q., Carslaw, K. S., Curtius, J., Donahue, N. M., Flagan, R. C., Hansel, A., Riipinen, I., Virtanen, A., Winkler, P. M., Baltensperger, U., Kulmala, M., and Worsnop, D. R.: Multicomponent new particle formation from sulfuric acid, ammonia, and biogenic vapors, Sci. Adv., 4, eaau5363, https://doi.org/10.1126/sciadv.aau5363, 2018.
Li, D., Huang, W., Wang, D., Wang, M., Thornton, J. A., Caudillo, L., Rörup, B., Marten, R., Scholz, W., Finkenzeller, H., Marie, G., Baltensperger, U., Bell, D. M., Brasseur, Z., Curtius, J., Dada, L., Duplissy, J., Gong, X., Hansel, A., He, X.-C., Hofbauer, V., Junninen, H., Krechmer, J. E., Kürten, A., Lamkaddam, H., Lehtipalo, K., Lopez, B., Ma, Y., Mahfouz, N. G. A., Manninen, H. E., Mentler, B., Perrier, S., Petäjä, T., Pfeifer, J., Philippov, M., Schervish, M., Schobesberger, S., Shen, J., Surdu, M., Tomaz, S., Volkamer, R., Wang, X., Weber, S. K., Welti, A., Worsnop, D. R., Wu, Y., Yan, C., Zauner-Wieczorek, M., Kulmala, M., Kirkby, J., Donahue, N. M., George, C., El-Haddad, I., Bianchi, F., and Riva, M.: Nitrate Radicals Suppress Biogenic New Particle Formation from Monoterpene Oxidation, Environ. Sci. Technol., 58, 1601–1614, https://doi.org/10.1021/acs.est.3c07958, 2024.
Liu, D., Zhang, Y., Zhong, S., Chen, S., Xie, Q., Zhang, D., Zhang, Q., Hu, W., Deng, J., Wu, L., Ma, C., Tong, H., and Fu, P.: Large differences of highly oxygenated organic molecules (HOMs) and low-volatile species in secondary organic aerosols (SOAs) formed from ozonolysis of β-pinene and limonene, Atmos. Chem. Phys., 23, 8383–8402, https://doi.org/10.5194/acp-23-8383-2023, 2023.
Liu, J., D'Ambro, E. L., Lee, B. H., Lopez-Hilfiker, F. D., Zaveri, R. A., Rivera-Rios, J. C., Keutsch, F. N., Iyer, S., Kurten, T., Zhang, Z., Gold, A., Surratt, J. D., Shilling, J. E., and Thornton, J. A.: Efficient Isoprene Secondary Organic Aerosol Formation from a Non-IEPOX Pathway, Environ. Sci. Technol., 50, 9872–9880, https://doi.org/10.1021/acs.est.6b01872, 2016a.
Liu, X., Zhu, H., Hu, Y., Feng, S., Chu, Y., Wu, Y., Wang, C., Zhang, Y., Yuan, Z., and Lu, Y.: Public's Health Risk Awareness on Urban Air Pollution in Chinese Megacities: The Cases of Shanghai, Wuhan and Nanchang, Int. J. Environ. Res. Public. Health, 13, 845, https://doi.org/10.3390/ijerph13090845, 2016b.
Liu, Z., Chen, H., Li, L., Xie, G., Ouyang, H., Tang, X., Ju, R., Li, B., Zhang, R., and Chen, J.-M.: Real-time single particle characterization of oxidized organic aerosols in the East China Sea, Npj Clim. Atmos. Sci., 5, 47, https://doi.org/10.1038/s41612-022-00267-1, 2022.
Luo, Y., Thomsen, D., Iversen, E. M., Roldin, P., Skønager, J. T., Li, L., Priestley, M., Pedersen, H. B., Hallquist, M., Bilde, M., Glasius, M., and Ehn, M.: Formation and temperature dependence of highly oxygenated organic molecules (HOMs) from Δ3-carene ozonolysis, Atmos. Chem. Phys., 24, 9459–9473, https://doi.org/10.5194/acp-24-9459-2024, 2024.
Mahilang, M., Deb, M. K., and Pervez, S.: Biogenic secondary organic aerosols: A review on formation mechanism, analytical challenges and environmental impacts, Chemosphere, 262, 127771, https://doi.org/10.1016/j.chemosphere.2020.127771, 2021.
Matsui, K.: Green leaf volatiles: hydroperoxide lyase pathway of oxylipin metabolism., Curr. Opin. Plant Biol., 9, 274–280, 2006.
Mouat, A. P., Kaiser, J., Paton-Walsh, C., Ramirez-Gamboa, J., Naylor, T. A., Simmons, J. B.: Volatile organic compound measurements at Cataract Scout Park, Australia, taken during the COALA-2020 campaign, PANGAEA [data set], https://doi.org/10.1594/PANGAEA.927277, 2021.
Mouat, A. P., Paton-Walsh, C., Simmons, J. B., Ramirez-Gamboa, J., Griffith, D. W. T., and Kaiser, J.: Measurement report: Observations of long-lived volatile organic compounds from the 2019–2020 Australian wildfires during the COALA campaign, Atmos. Chem. Phys., 22, 11033–11047, https://doi.org/10.5194/acp-22-11033-2022, 2022.
Naylor, T. A., Paton-Walsh, C., Ramirez-Gamboa, J., Carter, A., Webb, A., Dang, Q. P., Simmons, J. B., and Griffiths, A. D.: Photosynthetically active radiation measurements at Cataract Scout Park, Australia, taken during the COALA-2020 campaign, PANGAEA [data set], https://doi.org/10.1594/PANGAEA.928051, 2021.
Nestorowicz, K., Jaoui, M., Rudzinski, K. J., Lewandowski, M., Kleindienst, T. E., Spólnik, G., Danikiewicz, W., and Szmigielski, R.: Chemical composition of isoprene SOA under acidic and non-acidic conditions: effect of relative humidity, Atmos. Chem. Phys., 18, 18101–18121, https://doi.org/10.5194/acp-18-18101-2018, 2018.
Ormeño, E., Mévy, J. P., Vila, B., Bousquet-Mélou, A., Greff, S., Bonin, G., and Fernandez, C.: Water deficit stress induces different monoterpene and sesquiterpene emission changes in Mediterranean species. Relationship between terpene emissions and plant water potential, Chemosphere, 67, 276–284, https://doi.org/10.1016/J.CHEMOSPHERE.2006.10.029, 2007.
Ortega, I. K., Suni, T., Boy, M., Grönholm, T., Manninen, H. E., Nieminen, T., Ehn, M., Junninen, H., Hakola, H., Hellén, H., Valmari, T., Arvela, H., Zegelin, S., Hughes, D., Kitchen, M., Cleugh, H., Worsnop, D. R., Kulmala, M., and Kerminen, V.-M.: New insights into nocturnal nucleation, Atmos. Chem. Phys., 12, 4297–4312, https://doi.org/10.5194/acp-12-4297-2012, 2012.
Padhy, P. K. K. and Varshney, C. K. K.: Emission of volatile organic compounds (VOC) from tropical plant species in India, Chemosphere, 59, 1643–1653, 2005.
Parworth, C., Fast, J., Mei, F., Shippert, T., Sivaraman, C., Tilp, A., Watson, T., and Zhang, Q.: Long-term measurements of submicrometer aerosol chemistry at the Southern Great Plains (SGP) using an Aerosol Chemical Speciation Monitor (ACSM), Atmos. Environ., 106, 43–55, https://doi.org/10.1016/j.atmosenv.2015.01.060, 2015.
Paton-Walsh, C., Rayner, P., Simmons, J., Fiddes, S. L., Schofield, R., Bridgman, H., Beaupark, S., Broome, R., Chambers, S. D., Chang, L. T.-C., Cope, M., Cowie, C. T., Desservettaz, M., Dominick, D., Emmerson, K., Forehead, H., Galbally, I. E., Griffiths, A., Guérette, É.-A., Haynes, A., Heyworth, J., Jalaludin, B., Kan, R., Keywood, M., Monk, K., Morgan, G. G., Nguyen Duc, H., Phillips, F., Popek, R., Scorgie, Y., Silver, J. D., Utembe, S., Wadlow, I., Wilson, S. R., and Zhang, Y.: A Clean Air Plan for Sydney: An Overview of the Special Issue on Air Quality in New South Wales, Atmosphere, 10, 774, https://doi.org/10.3390/atmos10120774, 2019.
Paton-Walsh, C., Emmerson, K. M., Garland, R. M., Keywood, M., Hoelzemann, J. J., Huneeus, N., Buchholz, R. R., Humphries, R. S., Altieri, K., Schmale, J., Wilson, S. R., Labuschagne, C., Kalisa, E., Fisher, J. A., Deutscher, N. M., van Zyl, P. G., Beukes, J. P., Joubert, W., Martin, L., Mkololo, T., Barbosa, C., de Fatima Andrade, M., Schofield, R., Mallet, M. D., Harvey, M. J., Formenti, P., Piketh, S. J., and Olivares, G.: Key challenges for tropospheric chemistry in the Southern Hemisphere, Elem. Sci. Anthr., 10, 00050, https://doi.org/10.1525/elementa.2021.00050, 2022.
Peräkylä, O., Riva, M., Heikkinen, L., Quéléver, L., Roldin, P., and Ehn, M.: Experimental investigation into the volatilities of highly oxygenated organic molecules (HOMs) , Atmos. Chem. Phys., 20, 649–669, https://doi.org/10.5194/acp-20-649-2020, 2020.
Petit, J.-E., Favez, O., Sciare, J., Crenn, V., Sarda-Estève, R., Bonnaire, N., Močnik, G., Dupont, J.-C., Haeffelin, M., and Leoz-Garziandia, E.: Two years of near real-time chemical composition of submicron aerosols in the region of Paris using an Aerosol Chemical Speciation Monitor (ACSM) and a multi-wavelength Aethalometer, Atmos. Chem. Phys., 15, 2985–3005, https://doi.org/10.5194/acp-15-2985-2015, 2015.
Phillips, F. A., Naylor, T., Forehead, H., Griffith, D. W. T., Kirkwood, J., and Paton-Walsh, C.: Vehicle Ammonia Emissions Measured in An Urban Environment in Sydney, Australia, Using Open Path Fourier Transform Infra-Red Spectroscopy, Atmosphere, 10, 208, https://doi.org/10.3390/atmos10040208, 2019.
Pope, C. A. and Dockery, D. W.: Health effects of fine particulate air pollution: Lines that connect, J. Air Waste Manag. Assoc., 56, 709–742, 2006.
Pöschl, U.: Atmospheric Aerosols: Composition, Transformation, Climate and Health Effects, Angew. Chem. Int. Ed., 44, 7520–7540, https://doi.org/10.1002/anie.200501122, 2005.
Poulain, L., Spindler, G., Grüner, A., Tuch, T., Stieger, B., van Pinxteren, D., Petit, J.-E., Favez, O., Herrmann, H., and Wiedensohler, A.: Multi-year ACSM measurements at the central European research station Melpitz (Germany) – Part 1: Instrument robustness, quality assurance, and impact of upper size cutoff diameter, Atmos. Meas. Tech., 13, 4973–4994, https://doi.org/10.5194/amt-13-4973-2020, 2020.
Ramirez-Gamboa, J., Paton-Walsh, C., Galbally, I., Simmons, J., Guerette, E.-A., Griffith, A. D., Chambers, S. D., and Williams, A. G.: Seasonal Variation of Biogenic and Anthropogenic VOCs in a Semi-Urban Area Near Sydney, Australia, Atmosphere, 12, 47, https://doi.org/10.3390/atmos12010047, 2021.
Ren, Y., Qu, Z., Du, Y., Xu, R., Ma, D., Yang, G., Shi, Y., Fan, X., Tani, A., Guo, P., Ge, Y., and Chang, J.: Air quality and health effects of biogenic volatile organic compounds emissions from urban green spaces and the mitigation strategies, Environ. Pollut., 230, 849–861, https://doi.org/10.1016/j.envpol.2017.06.049, 2017.
Riipinen, I., Yli-Juuti, T., Pierce, J. R., Petäjä, T., Worsnop, D. R., Kulmala, M., and Donahue, N. M.: The contribution of organics to atmospheric nanoparticle growth, Nat. Geosci., 5, 453–458, https://doi.org/10.1038/ngeo1499, 2012.
Riva, M., Heikkinen, L., Bell, D. M., Peräkylä, O., Zha, Q., Schallhart, S., Rissanen, M. P., Imre, D., Petäjä, T., Thornton, J. A., Zelenyuk, A., and Ehn, M.: Chemical transformations in monoterpene-derived organic aerosol enhanced by inorganic composition, Npj Clim. Atmos. Sci., 2, 2, https://doi.org/10.1038/s41612-018-0058-0, 2019.
Schlag, P., Kiendler-Scharr, A., Blom, M. J., Canonaco, F., Henzing, J. S., Moerman, M., Prévôt, A. S. H., and Holzinger, R.: Aerosol source apportionment from 1-year measurements at the CESAR tower in Cabauw, the Netherlands, Atmos. Chem. Phys., 16, 8831–8847, https://doi.org/10.5194/acp-16-8831-2016, 2016.
Shi, L. H., Zanobetti, A., Kloog, I., Coull, B. A., Koutrakis, P., Melly, S. J., and Schwartz, J. D.: Low-Concentration PM2.5 and Mortality: Estimating Acute and Chronic Effects in a Population-Based Study, Environ. Health Perspect., 124, 46–52, https://doi.org/10.1289/ehp.1409111, 2016.
Sihto, S.-L., Kulmala, M., Kerminen, V.-M., Dal Maso, M., Petäjä, T., Riipinen, I., Korhonen, H., Arnold, F., Janson, R., Boy, M., Laaksonen, A., and Lehtinen, K. E. J.: Atmospheric sulphuric acid and aerosol formation: implications from atmospheric measurements for nucleation and early growth mechanisms, Atmos. Chem. Phys., 6, 4079–4091, https://doi.org/10.5194/acp-6-4079-2006, 2006.
Simmons, J. B., Paton-Walsh, C., Mouat, A. P., Kaiser, J., Humphries, R. S., Keywood, M., Griffith, D. W. T., Sutresna, A., Naylor, T., and Ramirez-Gamboa, J.: Bushfire smoke plume composition and toxicological assessment from the 2019–2020 Australian Black Summer, Air Qual. Atmos. Health, 15, 2067–2089, https://doi.org/10.1007/s11869-022-01237-5, 2022.
Smit, R., Kingston, P., Neale, D. W., Brown, M. K., Verran, B., and Nolan, T.: Monitoring on-road air quality and measuring vehicle emissions with remote sensing in an urban area, Atmos. Environ., 218, 116978, https://doi.org/10.1016/j.atmosenv.2019.116978, 2019.
Song, M., Zhang, C., Wu, H., Mu, Y., Ma, Z., Zhang, Y., Liu, J., and Li, X.: The influence of OH concentration on SOA formation from isoprene photooxidation, Sci. Total Environ., 650, 951–957, https://doi.org/10.1016/j.scitotenv.2018.09.084, 2019.
Stangl, C. M., Krasnomowitz, J. M., Apsokardu, M. J., Tiszenkel, L., Ouyang, Q., Lee, S., and Johnston, M. V.: Sulfur Dioxide Modifies Aerosol Particle Formation and Growth by Ozonolysis of Monoterpenes and Isoprene, J. Geophys. Res.-Atmos., 124, 4800–4811, https://doi.org/10.1029/2018JD030064, 2019.
Suni, T., Sogacheva, L., Lauros, J., Hakola, H., Bäck, J., Kurtén, T., Cleugh, H., van Gorsel, E., Briggs, P., Sevanto, S., and Kulmala, M.: Cold oceans enhance terrestrial new-particle formation in near-coastal forests, Atmos. Chem. Phys., 9, 8639–8650, https://doi.org/10.5194/acp-9-8639-2009, 2009.
Takami, A., Miyoshi, T., Shimono, A., and Hatakeyama, S.: Chemical composition of fine aerosol measured by AMS at Fukue Island, Japan during APEX period, Atmos. Environ., 39, 4913–4924, https://doi.org/10.1016/j.atmosenv.2005.04.038, 2005.
Topping, D., Coe, H., McFiggans, G., Burgess, R., Allan, J., Alfarra, M. R., Bower, K., Choularton, T. W., Decesari, S., and Facchini, M. C.: Aerosol chemical characteristics from sampling conducted on the Island of Jeju, Korea during ACE Asia, Atmos. Environ., 38, 2111–2123, https://doi.org/10.1016/j.atmosenv.2004.01.022, 2004.
Tröstl, J., Chuang, W. K., Gordon, H., Heinritzi, M., Yan, C., Molteni, U., Ahlm, L., Frege, C., Bianchi, F., Wagner, R., Simon, M., Lehtipalo, K., Williamson, C., Craven, J. S., Duplissy, J., Adamov, A., Almeida, J., Bernhammer, A.-K., Breitenlechner, M., Brilke, S., Dias, A., Ehrhart, S., Flagan, R. C., Franchin, A., Fuchs, C., Guida, R., Gysel, M., Hansel, A., Hoyle, C. R., Jokinen, T., Junninen, H., Kangasluoma, J., Keskinen, H., Kim, J., Krapf, M., Kürten, A., Laaksonen, A., Lawler, M., Leiminger, M., Mathot, S., Möhler, O., Nieminen, T., Onnela, A., Petäjä, T., Piel, F. M., Miettinen, P., Rissanen, M. P., Rondo, L., Sarnela, N., Schobesberger, S., Sengupta, K., Sipilä, M., Smith, J. N., Steiner, G., Tomè, A., Virtanen, A., Wagner, A. C., Weingartner, E., Wimmer, D., Winkler, P. M., Ye, P., Carslaw, K. S., Curtius, J., Dommen, J., Kirkby, J., Kulmala, M., Riipinen, I., Worsnop, D. R., Donahue, N. M., and Baltensperger, U.: The role of low-volatility organic compounds in initial particle growth in the atmosphere, Nature, 533, 527–531, https://doi.org/10.1038/nature18271, 2016.
Uusitalo, H., Kontkanen, J., Ylivinkka, I., Ezhova, E., Demakova, A., Arshinov, M., Belan, B. D., Davydov, D., Ma, N., Petäjä, T., Wiedensohler, A., Kulmala, M., and Nieminen, T.: Occurrence of new particle formation events in Siberian and Finnish boreal forest, Atmos. Chem. Phys. Discuss. [preprint], https://doi.org/10.5194/acp-2021-530, 2021.
Wang, S., Zhang, Q., Wang, G., Wei, Y., Wang, W., and Wang, Q.: The neglected autoxidation pathways for the formation of highly oxygenated organic molecules (HOMs) and the nucleation of the HOMs generated by limonene, Atmos. Environ., 304, 119727, https://doi.org/10.1016/j.atmosenv.2023.119727, 2023.
Wu, H., Li, Z., Li, H., Luo, K., Wang, Y., Yan, P., Hu, F., Zhang, F., Sun, Y., Shang, D., Liang, C., Zhang, D., Wei, J., Wu, T., Jin, X., Fan, X., Cribb, M., Fischer, M. L., Kulmala, M., and Petäjä, T.: The impact of the atmospheric turbulence-development tendency on new particle formation: a common finding on three continents, Natl. Sci. Rev., 8, nwaa157, https://doi.org/10.1093/nsr/nwaa157, 2021.
Xu, L., Tsona, N. T., and Du, L.: Relative Humidity Changes the Role of SO2 in Biogenic Secondary Organic Aerosol Formation, J. Phys. Chem. Lett., 12, 7365–7372, https://doi.org/10.1021/acs.jpclett.1c01550, 2021a.
Zhang, H., Yee, L. D., Lee, B. H., Curtis, M. P., Worton, D. R., Isaacman-VanWertz, G., Offenberg, J. H., Lewandowski, M., Kleindienst, T. E., Beaver, M. R., Holder, A. L., Lonneman, W. A., Docherty, K. S., Jaoui, M., Pye, H. O. T., Hu, W., Day, D. A., Campuzano-Jost, P., Jimenez, J. L., Guo, H., Weber, R. J., de Gouw, J., Koss, A. R., Edgerton, E. S., Brune, W., Mohr, C., Lopez-Hilfiker, F. D., Lutz, A., Kreisberg, N. M., Spielman, S. R., Hering, S. V., Wilson, K. R., Thornton, J. A., and Goldstein, A. H.: Monoterpenes are the largest source of summertime organic aerosol in the southeastern United States, P. Natl. Acad. Sci. USA, 115, 2038–2043, https://doi.org/10.1073/pnas.1717513115, 2018.
Zhang, J., Zhao, J., Luo, Y., Mickwitz, V., Worsnop, D., and Ehn, M.: On the potential use of highly oxygenated organic molecules (HOMs) as indicators for ozone formation sensitivity, Atmos. Chem. Phys., 24, 2885–2911, https://doi.org/10.5194/acp-24-2885-2024, 2024.
Zhao, J., Smith, J. N., Eisele, F. L., Chen, M., Kuang, C., and McMurry, P. H.: Observation of neutral sulfuric acid-amine containing clusters in laboratory and ambient measurements, Atmos. Chem. Phys., 11, 10823–10836, https://doi.org/10.5194/acp-11-10823-2011, 2011.
Zheng, J., Ma, Y., Chen, M., Zhang, Q., Wang, L., Khalizov, A. F., Yao, L., Wang, Z., Wang, X., and Chen, L.: Measurement of atmospheric amines and ammonia using the high resolution time-of-flight chemical ionization mass spectrometry, Atmos. Environ., 102, 249–259, https://doi.org/10.1016/j.atmosenv.2014.12.002, 2015.