the Creative Commons Attribution 4.0 License.
the Creative Commons Attribution 4.0 License.
 | 04 Sep 2025
Significant response of methane in the upper troposphere to subseasonal variability in the Asian monsoon anticyclone
Sihong Zhu
Zhaonan Cai
Liang Feng
Pubu Sangmu
Zhongshui Yu
Junji Cao
Substantial methane (CH4) emissions in Asia are efficiently transported to the upper troposphere through the monsoon dynamical system, which forms a remarkable seasonal CH4 enhancement in the upper troposphere. Using a chemical transport model, GEOS-Chem, driven by surface optimized CH4 flux, the CH4 enhancement over the Asian monsoon region is explored as a combined effect of the monsoon dynamical system and regionally increased emissions during the late monsoon season. The spatial distributions of CH4 at the upper troposphere show strong subseasonal variability, which is closely tied to the east–west oscillation of the Asian monsoon anticyclone (AMA). Besides, the AMA patterns influence the efficiency of methane-rich air transport to the upper troposphere and lower stratosphere. The AMA center around 80° E favors the upward transport from organized monsoon convective sources over the Indian subcontinent and Bay of Bengal, while the AMA center around 105° E favors the source from southwest China transported to the upper troposphere. When the AMA shifts over the Iranian Plateau, further vertical transport from the convective outflow level to the upper troposphere is weakened and the horizontal redistribution becomes dominant. According to our model sensitivity study, the differences in the upper-troposphere CH4 anomalies caused by large-scale circulation are 1–2 times the difference caused by regional surface emissions. Our research highlights the complex interaction between monsoon dynamics and surface emissions to determine the upper-troposphere methane.
- Article
(3778 KB) - Full-text XML
-
Supplement
(2268 KB) - BibTeX
- EndNote


Methane (CH4), the second most important greenhouse gas and emitted heavily from South Asia and China, has accounted for ∼25 % of the global anthropogenic emission budget in recent decades (Stavert et al., 2022). The Asian summer monsoon (ASM) has been proven to be an efficient pathway connecting the rich methane boundary layer and the upper troposphere and lower stratosphere (UTLS) (Randel et al., 2010). The CH4 enhancement in the UTLS impacts the climate through radiative forcing (Riese et al., 2012) and influences stratospheric chemistry, e.g., methane oxidation (Rohs et al., 2006). More critically, limited understanding of non-local methane sources might mislead the flux inversion from total columns from satellite products (Zeng et al., 2021).
Observations (satellite retrievals and in situ measurements) and models have evidenced remarkable enhancements of tropospheric tracers over the ASM region in the UTLS, including CO, water vapor, HCN and hydrocarbons, and aerosols (Bucci et al., 2020; Park et al., 2009; Pan et al., 2016, 2024; Randel et al., 2010; Rosenlof et al., 1997; Yu et al., 2017). Similarly to other tropospheric tracers, substantial observational evidence has shown a distinct spatiotemporal distribution of high methane in the middle to upper troposphere over the Asian region during the late monsoon season (Baker et al., 2012; Schuck et al., 2010; Tao et al., 2024; Tomsche et al., 2019) as well as its lasting and traceable pathways into the Southern Hemisphere and the stratosphere after the monsoon withdraws (Belikov et al., 2022; Yan et al., 2019).
The ASM transport structure connecting the surface source regions and the Asian monsoon anticyclone (AMA) in the UTLS has been characteristically described by various studies. The transport system is marked by deep convection, rapidly injecting surface air masses up to the convective outflow level, potential temperature heights of 360 K (∼16 km), which is commonly referred to as the “fast convective chimney” (Pan et al., 2016). Above 370 K, the continuous upward transport is mainly an anticyclonic “spiraling” movement (Bergman et al., 2013; Lau et al., 2018; Ploeger et al., 2017; Vogel et al., 2019) along with a slow upwelling in vertical velocity of typically 0.3–0.8 K d−1 (Garny and Randel, 2016; von Hobe et al., 2021; Legras and Bucci, 2020; Vogel et al., 2024). Significant deep vertical transport is predominantly observed in the southeastern quadrant of the anticyclone, centered near the southern flank of the Tibetan Plateau. This “chimney-like transport” actively uplifts air from highly polluted regions, like northeast India, Nepal, and the northern Bay of Bengal, to the upper troposphere. This rapid convective uprising process is further characterized by a “double-stem-chimney cloud” (Lau et al., 2018) or “two-stem mushroom” (Pan et al., 2022) structure, which indicates two key areas prominently contributing to the “fast convective chimney”: the Himalayas–Gangetic Plain and the Sichuan Basin in southwestern China.
One key dynamical feature of the ASM is its subseasonal variability, which is characterized by the active–break cycle of precipitation and surface pressure patterns (Krishnamurti and Ardanuy, 1980; Krishnamurti and Bhalme, 1976), as well as the east–west oscillation of AMA (Nützel et al., 2016; Zhang et al., 2002) with eddy shedding of low-PV (potential vorticity) air in the UT (Garny and Randel, 2013). The variability in the monsoon convection pattern potentially modulates the intensity and position of the AMA (Garny and Randel, 2013; Nützel et al., 2016; Siu and Bowman, 2020). Moreover, the combined effects of convective uplift and anticyclonic confinement jointly shape the distribution and transport of tracers such as CO in the UTLS, as demonstrated and analyzed in previous studies (Luo et al., 2018; Pan et al., 2016).
According to simulations with chemical transport models as well as according to satellite observations, it is evident that the CH4 in the upper troposphere (UT), similarly to tracers like CO and water vapor, also has an isolated center over the Asian monsoon region during the boreal summer (Park et al., 2004; Tao et al., 2024; Xiong et al., 2009). This increase in CH4 is about 100 ppb higher than its regional annual mean volume mixing ratio (VMR) and is 3 %–10 % higher than the VMRs averaged over the same latitude (Tao et al., 2024; Xiong et al., 2009). The relevant studies rarely use CH4 as a monsoon transport tracer due to its complicated emission sources. Differently from tracers like CO, which has primarily industrial sources and hence displays little seasonal variation, CH4 emissions in Asia, predominantly (over 60 %) from rice cultivation (Stavert et al., 2022), exhibit significant seasonality. The debate persists over which factor plays the dominant role in the seasonal increase in UT methane over the Asian monsoon region – enhanced summer emissions from regional rice paddies (Zhang et al., 2020) or the strong upward transport by the monsoon convection and circulation (Zeng et al., 2021) – as both are known to contribute. Hence, it is crucial to understand how the lower-boundary methane conditions and monsoon circulation interact with each other.
The purpose of this study is to (1) explore the association of UT methane over ASM with subseasonal variability in AMA dynamics and (2) quantify the relative role of the AMA dynamics and regional emissions in shaping UT methane. Our state-of-the-art approach to reach the goal comprises model simulations with a data assimilation system. The reasonable representation of UT CH4 over ASM with this model has been proven through a comprehensive comparison with satellite and in situ observations in a previous study (Tao et al., 2024). In this study, we first show the subseasonal behavior of UT methane modulated by the AMA using the case of summer 2020. Then, we analyze the methane transport pathways under different AMA modes through mode composites. Lastly, we examine the UT methane change in association with AMA dynamics and surface emission, respectively, through a model sensitivity study.
2.1 Global 3-D methane simulation
We use v12.5.0 of GEOS-Chem (http://www.geos-chem.org last access: 14 November 2019, The International GEOS-Chem User Community, 2019) to generate global 3-D methane concentrations for the study period 2015–2020, with a temporal resolution of 1 d and a spatial resolution of 2°×2.5° (longitude×latitude). The model is driven by the Modern-Era Retrospective Analysis for Research and Applications version 2 (MERRA-2) reanalysis from the Global Modeling and Assimilation Office of NASA (Gelaro et al., 2017), which also provides the convective mass fluxes used to represent convection. For consistency, we also use MERRA-2 reanalysis data to analyze dynamical fields.
The surface CH4 fluxes used in the transport model are optimized with atmospheric observations via an ensemble Kalman filter (EnKF) framework (Feng et al., 2009, 2017). In the framework, the a priori emission estimates include natural sources (e.g., wetlands, fires, termites) and anthropogenic sources (e.g., fossil fuels, livestock, rice, and waste) as detailed in Zhu et al. (2022). The atmospheric CH4 observations include the proxy GOSAT v9.0 column methane data (XCH4) from the University of Leicester (https://catalogue.ceda.ac.uk/uuid/18ef8247f52a4cb6a14013f8235cc1eb/, last access: 6 November 2024, Parker et al., 2020) and near-surface methane mole fraction samples from the CH4 GLOBALVIEWplus v5.0 ObsPack (https://gml.noaa.gov/ccgg/obspack/release_notes.html#obspack_ch4_1_GLOBALVIEWplus_v5.0_2022-10-17, last access: 8 February 2023, Schuldt et al., 2022).
The inverted flux-driven global 3-D methane concentrations were evaluated using observations from several platforms, including ground-based XCH4 measurements from the Total Carbon Column Observing Network (TCCON) (https://tccondata.org/, last access: 27 February 2023, TCCON Team, 2022), CH4 flask samples collected by aircraft in the Comprehensive Observation Network for TRace gases by AIrLiner (CONTRAIL) project (https://www.cger.nies.go.jp/contrail/index.html, last access: 23 January 2024, Machida et al., 2023), and CH4 profiles from the ground to 25 km measured over the Tibetan Plateau by an AirCore air sampling and data processing system (Tao et al., 2024). In our simulation experiments, only surface CH4 flux is varied, with no alterations to meteorological fields or initial conditions.
2.2 Classification of Asia monsoon anticyclone modes
In a series of previous studies, the subseasonal variability in AMA has been mainly characterized as “bimodality”, referring to two major modes: the Tibetan mode and the Iranian mode (Nützel et al., 2016; Zhang et al., 2002). It is important to note that the existence and nature of this bimodality remain a topic of ongoing debate. For instance, Nützel et al. (2016) demonstrated that the bimodal distribution of the AMA center is sensitive to the choice of reanalysis datasets. Manney et al. (2021) also proposed that the bimodality is not a prominent feature for the AMA climatological state. Our study does not aim to confirm the existence of AMA bimodality or to explore its underlying dynamics. We aim to investigate the relationship between AMA subseasonal variability and the three-dimensional distribution and transport of methane.
To identify the major AMA center, we use wind and geopotential height (GPH) data from MERRA-2 reanalysis and basically follow the methodology outlined in Zhang et al. (2002), as shown in Fig. 1. The AMA centers are identified as the positions of GPH peaks (magenta crosses in Fig. 1) along the ridgeline of anticyclone (zero u wind within the ASM region, i.e., 30° W–180° E, 10–40° N, shown as a dotted blue line in Fig. 1) on a daily basis. We exclude centers with GPH values in the lowest 70 % of the GPH range measured along the ridgeline. Differently from previous studies, which commonly use 100 hPa as a reference, we use the 150 hPa pressure level because both convection-driven vertical uplift and horizontal confinement are active at this layer, providing significant variability in AMA and its impact on the transport of tracer gases. Meanwhile, the anticyclonic circulation basically remains closed at 150 hPa.
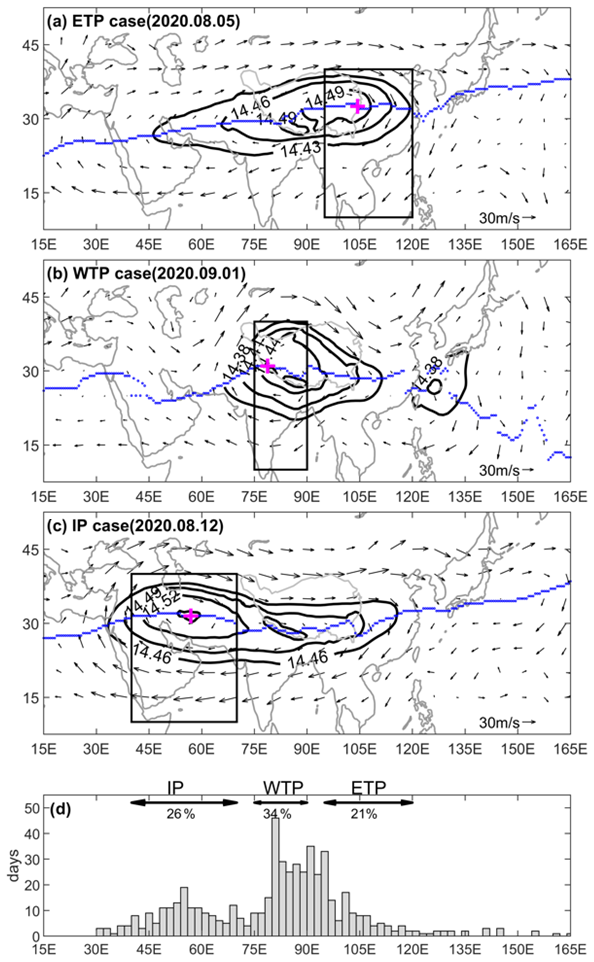
Figure 1The daily meteorological maps are shown as three mode cases in panels (a)–(c), including horizonal wind field (arrows) and geopotential height (GPH, black contours) at 150 hPa. The dotted blue line denotes the zero u wind, indicating the ridgeline of the anticyclone. The magenta cross marks the local GPH peak along the ridgeline, which is identified as the AMA center. The distribution of the major AMA center along the longitude is shown in panel (d). This statistic includes the daily meteorological data covering 6 boreal summers (July, August, and September) from 2015–2020. The frequencies of occurrence (%) for the three AMA modes are also labeled. The rectangle in (a)–(c) outlines the geographic domain corresponding to each mode.
As shown in Fig. 1d, our statistics on the probability distribution of AMA center positions are based on days with a single center during 6 boreal summers (July, August, and September – JAS) from 2015–2020. The distribution exhibits a pattern resembling bimodality, though it is less distinct than that reported in Zhang et al. (2002). The frequency of the Tibetan mode (the eastern phase of the distribution) is nearly twice that of the Iranian mode. Furthermore, within the Tibetan Plateau (TP) cases, we find a weaker bimodal structure, with one peak located to the west of 90° E and another to the east.
Nützel et al. (2016) proposed that due to the continuous spatial variability in the AMA center and its connection to convective activity, a more flexible classification approach should be adopted rather than relying on a fixed bimodal structure. Variations in regions of enhanced convection and associated changes in AMA morphology potentially influence the distribution of upper-troposphere tracers through vertical transport and anticyclonic confinement (e.g., Pan et al., 2016; Tomsche et al., 2019; Vogel et al., 2019). Based on this perspective, our study further subdivides the Tibetan Plateau (TP) mode into the East Tibetan Plateau (ETP) and West Tibetan Plateau (WTP) modes. Consequently, we define three AMA modes in total: the Iranian Plateau (IP) mode (40–70° E), WTP mode (75–90° E), and ETP mode (95–120° E).
3.1 Subseasonal variability in upper-troposphere CH4 during the 2020 Asian summer monsoon
We firstly examine the coverage of the large-scale circulation of ASM and the horizontal distribution of CH4 at 150 hPa using the case in the summer of 2020. Figure 2a and b present Hovmöller diagrams of GPH and CH4 anomalies at 150 hPa referring to their respective daily means averaged over the core ASM region (15–40° N, 15–135° E). The AMA experienced four east–west oscillations from July to mid-August, and the AMA center remained predominantly east of 75° E from mid-August onward (Fig. 1a). The simulated CH4 anomalies display a strong spatial correlation with the GPH field, with a Pearson correlation coefficient of 0.78. This subseasonal variability in AMA significantly modulated the CH4 variations in the middle to upper troposphere (see Fig. 1b), which is similar to the behavior of tracers such as CO (Pan et al., 2016), primarily due to anticyclonic confinement (Ploeger et al., 2015).
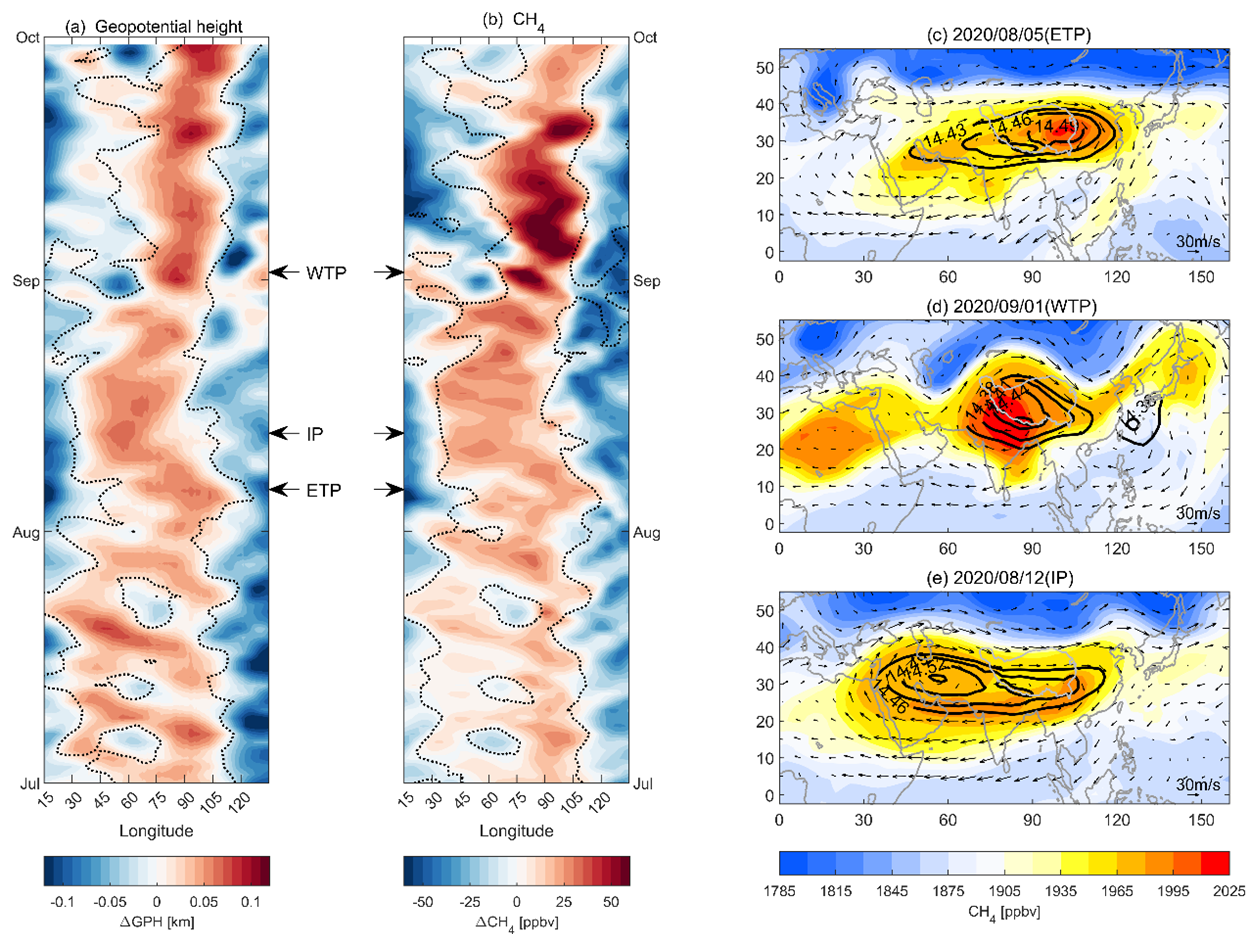
Figure 2Hovmöller diagrams of anomalies in (a) geopotential height and (b) CH4 concentrations at 150 hPa for JAS 2020. Anomalies are calculated with respect to the daily mean values averaged over the main ASM region (15–40° N, 15–135° E). The zero contour (dotted line) of each panel is plotted on the opposite field for reference. The Pearson correlation coefficient between the two anomaly fields is 0.78. Panels (c)–(e) show maps of daily mean CH4 concentration at 150 hPa (color shades) for 3 selected days (indicated by arrows in the Hovmöller diagrams), representing characteristic states for the WTP, IP, and ETP modes of AMA subseasonal oscillation. Black contours denote selected geopotential height levels highlighting the AMA center, and vectors represent the horizontal wind field at 150 hPa.
The east–west migration of CH4 anomalies mirrors the subseasonal oscillations of the AMA on a daily basis, revealing the dynamic nature of the methane distribution over monsoon region. Hereby we select 3 dates to illustrate the spatial distribution of methane and dynamical fields under the three AMA modes in Fig. 2c–e: the East Tibetan Plateau (ETP) mode centering on 90–110° E (5 August), the West Tibetan Plateau (WTP) mode centering on 80–90° E (1 September), and the Iranian Plateau (IP) mode centering on 50–60° E (12 August). The daily maps show that although the high CH4 was largely confined within AMA, the CH4 peak does not invariably align with the AMA center. For example, in IP mode on 12 August, the high-methane center is located on the southern edge of AMA. This pattern results from the “stirring” interaction between convection-uplifted boundary layer air from the Indian subcontinent (as shown by the overlap between the main monsoon convection source and high-methane regions near the lower boundary in Fig. S1 in the Supplement) and the surrounding air, which is similar to the “stirring” interaction proposed by Pan et al. (2016).
The subseasonal dynamical control of AMA on CH4 in the middle to upper troposphere is similar to that on other tracers like CO (Luo et al., 2018; Pan et al., 2016). Contrasting with CO – which typically shows a significant increase in UT around mid-June, correlating with the onset of the South Asian monsoon and its associated convective transport – we observe a pronounced increase in CH4 concentrations in UT starting from mid-August, e.g., the notable CH4 increase within the 75–110° E longitudinal range in Fig. 2b. The timing of this CH4 surge aligns closely with the seasonal emission peak mainly from the rice paddy cultivation, as suggested by Zhang et al. (2020).
Observing the methane behavior throughout this summer, the large-scale monsoon circulation dynamics with a strong subseasonal variability clearly manipulate the spatial distribution of upper-troposphere CH4, which is similar to its impact on tracers like CO and water vapor. Meanwhile, the temporal subseasonal variation in the mean CH4 concentrations over AMA (a remarkable integral rise during mid-August and September) potentially relates to increased emissions in the late monsoon season.
3.2 Composites of AMA modes
To extend the 2020 summer case to a general picture of CH4 distribution with different AMA statuses, we composite the methane daily fields for 6 summers (JAS during 2015–2020) according to the corresponding AMA modes (see the Methods subsection for the classification). According to the limited statistical samples, we found that IP mode predominantly manifests during July each year, while the ETP mode is more frequently observed in September. This phenomenon is also observed in the 2020 case, as shown in Fig. 2. Figure 3 presents the vertical structure of methane (longitude–pressure cross section) associated with three single-center modes (WTP, ETP, and IP mode). It reveals that high concentrations of methane in the boundary layer are localized between 60–105° E and undergo a redistribution to a broader area in the upper troposphere (300–100 hPa).
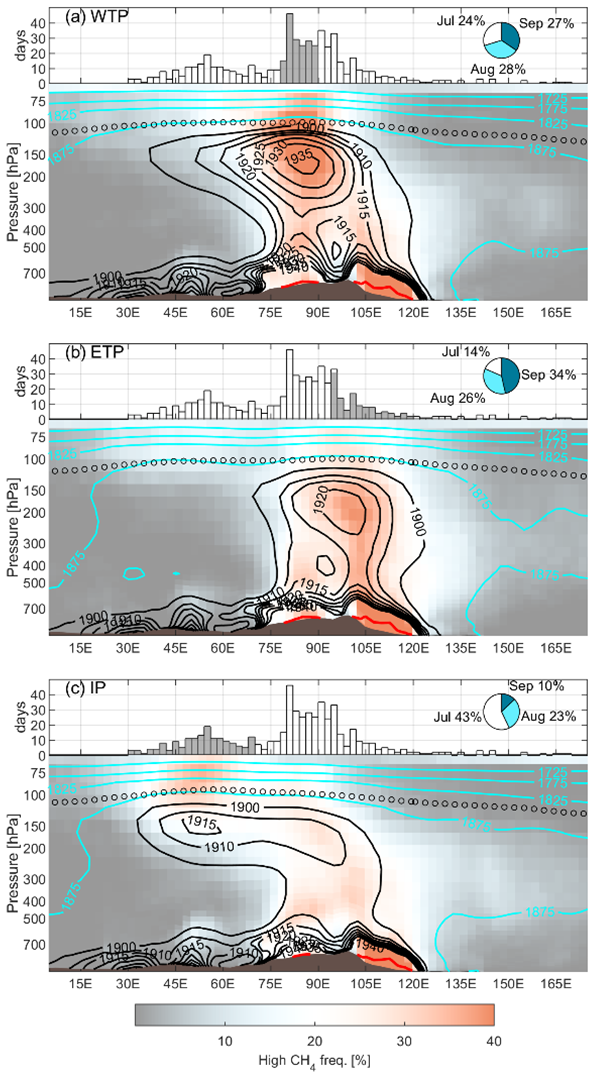
Figure 3Composites of the longitude–pressure cross section of methane (averaged over 15–40° N) for the three modes (2015–2020 JAS). The contours show the averaged methane volume mixing ratios (VMRs) for each mode (VMRs less than 1900 ppbv shown as cyan contours and VMRs equal to or greater than 1900 ppbv shown as black contours). The color shading indicates the occurrence frequency (unit: %) of high CH4 VMR (criterion: higher than 90 % of grids within the Asian monsoon region on the same model level). The longitude distribution of the GPH maximum along the anticyclone ridge is plotted at the top of each panel, where the grey bars cover the longitude range for the corresponding mode. The pie charts show the proportions of months for each mode.
This distribution emerged with the “double-stem-chimney cloud” or “two-stem-mushroom” structure, as characterized by Lau et al. (2018) and Pan et al. (2022), i.e., the two narrow “stems” (centered on 80 and 105° E, respectively) indicating vertical pumping by deep convections as well as the “cap” resulting from the expansion of the uplifted near-surface air masses through quasi-isentropically transport. The composites add details to the “two-stem-mushroom” structure. The WTP mode favors the vertical uplifting over 80–90° E (western “stem”), while the ETP mode favors the vertical transport over 100–110° E (eastern “stem”). Previous work has identified two key regions in connection with these two transport “stems”: one is the Himalayas–Gangetic Plain mainly including the northern Indian region and Bangladesh, i.e., the Indian subcontinent, and the other one is southwest China (Lau et al., 2018; see also the surface flux map for the monsoon season in Fig. S1). As shown in Fig. 3c, CH4 enhancement in the upper troposphere under the IP mode is weaker than in the WTP and ETP modes. The underlying reason for this is not straightforward; it may result from weaker vertical uplift due to weaker convection in IP mode, a shift of the main convection to regions with lower emissions, and/or the position of the AMA center favoring horizontal redistribution over further vertical upwelling.
To further explore this, Fig. 4 presents horizontal views at multiple layers to illustrate the relationship between convective sources and CH4 enhancement in the upper troposphere for each AMA mode. Note that the CH4 enhancement in Fig. 4 is expressed as a percentage (%) relative to the global zonal mean at each latitude band within each pressure layer. The corresponding CH4 VMR absolute values can be found in Fig. S2.
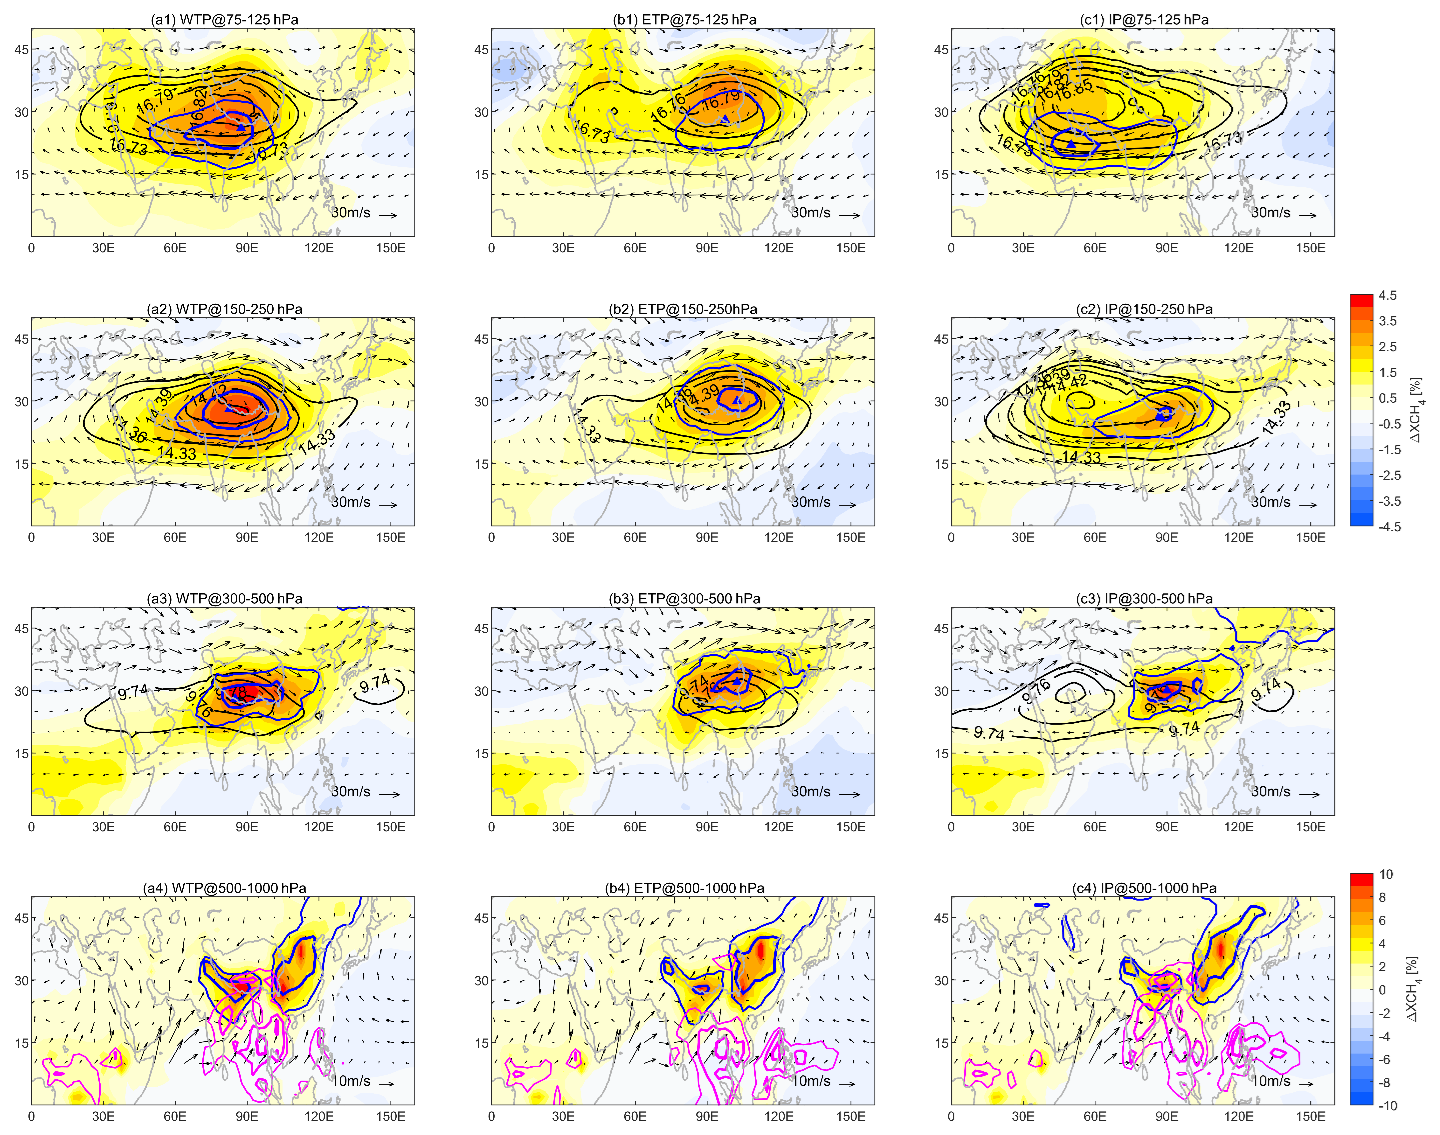
Figure 4Horizonal distribution of XCH4 anomaly composites corresponding to the three dominant AMA modes, shown across 4 vertical layers: the lowermost stratosphere (75–125 hPa; top panels a1, b1, c1), the upper troposphere (150–250 hPa; panels a2, b2, c2), the middle troposphere (300–400 hPa; panels a3, b3, c3), and the lower troposphere (500–1000 hPa; bottom panels a4, b4, c4). Color shading indicates the XCH4 anomalies, expressed as a percentage (%) relative to the global zonal mean at each latitude within each pressure layer. Black contours depict the GPH field outlining the AMA structure. Blue lines enclose regions with high occurrence frequencies (50 % and 70 %) of elevated methane – defined as in Fig. 3 – and triangles mark the locations with highest occurrence frequency. Magenta contours indicate outgoing longwave radiation (OLR) composites lower than 210 K for each mode, with an interval of 10 K, which represents the deep convective cloud.
As suggested by Fig. 3, the horizonal maps confirm that the WTP mode facilitates vertical transport from the southern side of TP to the UT (see Fig. 4, left column, a1–a3), whereas the ETP mode is more conducive to promoting the vertical transport over the eastern side of TP (Fig. 4, middle column, b1–b3). The IP mode composite demonstrates that while UT methane enhancement is observed between 45 and 60° E (Fig. 4, right column, c3), the corresponding enhancement in the middle troposphere is located similarly to that of the TP modes, i.e., at the southern flank of the Tibetan Plateau (Fig. 4c3).
Comparing the three bottom panels, we find that differences in CH4 distribution within the lower troposphere among the three modes are minor. The occurrence of deep convection (shown as magenta contours, outgoing longwave radiation less than 210 K) and high methane emissions (bottom row in Fig. 4) jointly determine the methane distribution in the mid-troposphere (third row in Fig. 4). For example, in both the WTP and the IP modes, deep convection is enhanced over the southern flank of the TP, where methane emissions are intense, resulting in a mid-tropospheric methane enhancement in this region (Fig. 4a3 and c3). In contrast, during the ETP mode, convection is suppressed over the Indian subcontinent but active over southwestern China, causing the high-methane center to shift to southwestern China (Fig. 4b3). It is also notable that these convective sources with elevated methane are subject to redistribution and confinement by the anticyclonic circulation in the upper troposphere (100–300 hPa).
It is suggested that the spatial relationship among surface emissions, convective uplift, and the extent of the AMA collectively shapes the upper-troposphere methane enhancement. Meanwhile, the configuration of ASM subseasonal dynamical variability, including both the monsoon convection and the AMA locations, influences the efficiency of tracer transport from the lower boundary to the upper troposphere. The WTP mode offers the most effective transport for methane-rich air from the Himalayas–Gangetic Plain to the UT because the main convective sources are injected near the center location of the AMA. The methane enhancement observed in the UT is only about 2 % during the IP mode due to a horizontal displacement between its main convective source region (Himalayas–Gangetic Plain) and the AMA.
3.3 Contribution from the emissions and dynamics of the ASM system
In Sect. 3.1 and 3.2, we demonstrate that variability in UTLS methane over the Asian region is influenced by two main factors: firstly, the dynamical east–west oscillation of the ASM, which substantially modulates the 3-D methane distribution and influences the efficiency of upward transport and, secondly, the increase in methane emissions mainly from rice paddy cultivation in late August and early September, which potentially intensifies the upper-level methane structure during the late monsoon season. In this section, we further quantify the contributions of these two factors – specifically, surface emissions and ASM dynamics – to regional methane enhancement, allowing us to assess their relative impact on methane variability in the UTLS.
Figure 5a presents the time series of total methane emissions (blue line) and methane concentrations in the UTLS (orange line), averaged over the ASM region (15–40° N, 15–135° E). The results indicate that the annual maxima of UTLS methane concentrations generally coincide with the peaks in annual emissions. Furthermore, years exhibiting higher emissions during JAS compared to other years tend to correspond to elevated methane concentrations in the UTLS. For instance, during JAS 2020, when seasonal emissions reached a relatively high value (∼19.3 Tg for the entire ASM region), the UTLS methane concentration also peaked (∼1928 ppbv), marking the maximum throughout the simulation period.
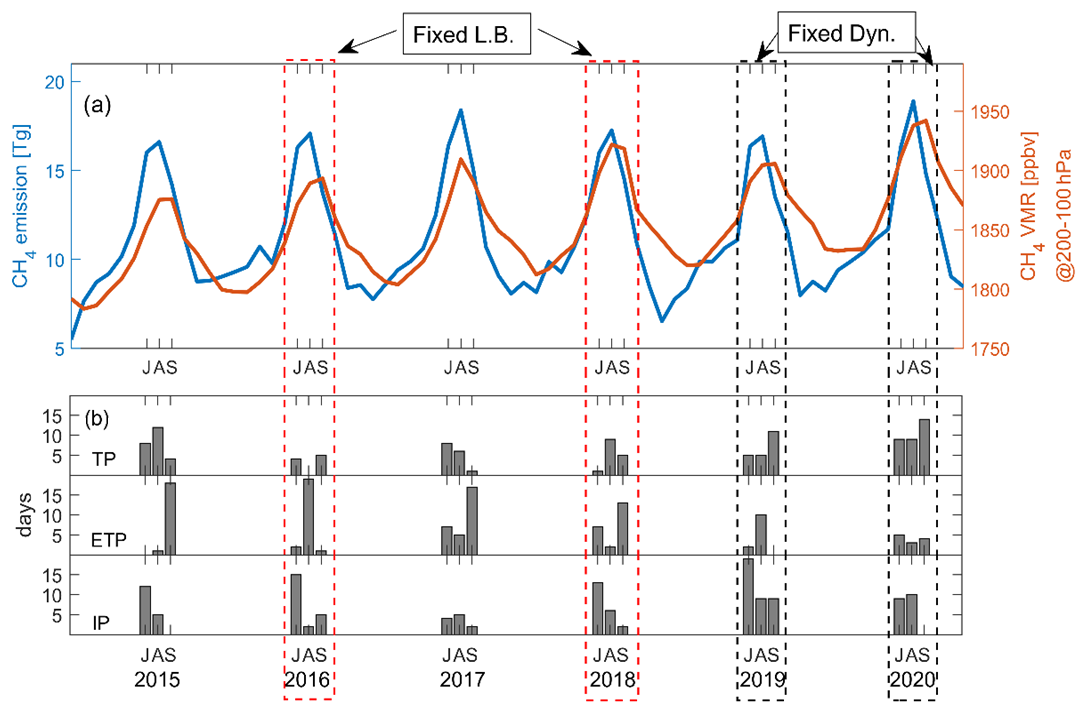
Figure 5(a) Time series of monthly total methane emission (unit: Tg) and VMRs (unit: ppbv) averaged over the ASM region (15–40° N, 15–135° E). (b) Number of days identified for three AMA modes during JAS for each year. The dashed red and black boxes indicate the “Fixed L.B.” and “Fixed Dyn.” experiments, respectively, as described in Table 1.
Meanwhile, we notice that the interannual variability in methane in the UTLS (orange line) during the monsoon season is 40 % larger than other seasons, while the emissions during the monsoon did not show notably larger interannual variability than other seasons. This suggests that upper-level methane during the monsoon season is not solely determined by emission magnitude but also to some extent influenced by the ASM dynamical conditions or other factors. For example, while the seasonal total emissions during JAS 2016 and 2018 are comparable (18.3 Tg versus 18.4 Tg), the seasonal and regional mean methane concentration in the UTLS during JAS 2018 is ∼30 ppbv (∼1.5 %) higher than in 2016, which is a remarkable interannual difference. This difference can be attributed to variations in the distribution of anticyclone modes (Fig. 5b). Specifically, during JAS 2018, the ASM anticyclone exhibited a higher frequency of WTP (West Tibetan Plateau) and ETP (East Tibetan Plateau) modes, particularly in August and September, creating a more favorable configuration for upward transport compared to 2016. A detailed comparison of subseasonal oscillations of the AMA between 2016 and 2018 is provided in the Supplement (Fig. S3). Note that the CH4 interannual variability in the UTLS can be related to other large-scale climate modes. For example, the relatively low CH4 in the UTLS in 2015 is potentially attributed to suppressed updrafts influenced by El Niño–Southern Oscillation (ENSO)-related dynamics (Alladi et al., 2024).
Based on the analysis above, we assess the relative contribution of emissions in the lower boundary and AMA dynamics to the upper-level methane through a sensitivity test. We use the AMA dynamics of 2016 and 2018 as representative cases to examine configurations that suppress and enhance UTLS transport, respectively. To isolate the impact of the AMA configuration, we conducted a test simulation using the lower-boundary emissions of 2016 combined with the meteorological data of 2018 to drive the model (16LB/18Dyn). The resulting change in methane concentrations, compared to the control run for 2016 (16Ctl), represents the effect of AMA dynamics. To confirm that these results are independent of the boundary conditions, we conducted a parallel test using the lower-boundary emissions of 2018 combined with the meteorological data of 2016 (18LB/16Dyn). The methane changes were then compared to the control run for 2018 (18Ctl). We found that the results of 16LB/18Dyn − 16Ctl and 18Ctl − 18LB/16Dyn were nearly identical (see Table 1 and Fig. S4). Consequently, we use the 16LB/18Dyn − 16Ctl simulation to illustrate the influence of AMA dynamics in the following analysis.
Table 1Seasonal (JAS) and ASM regional (15–40° N, 15–135° E) mean CH4 VMR (unit: ppbv) in the UTLS (200–100 hPa) for the control and test runs.
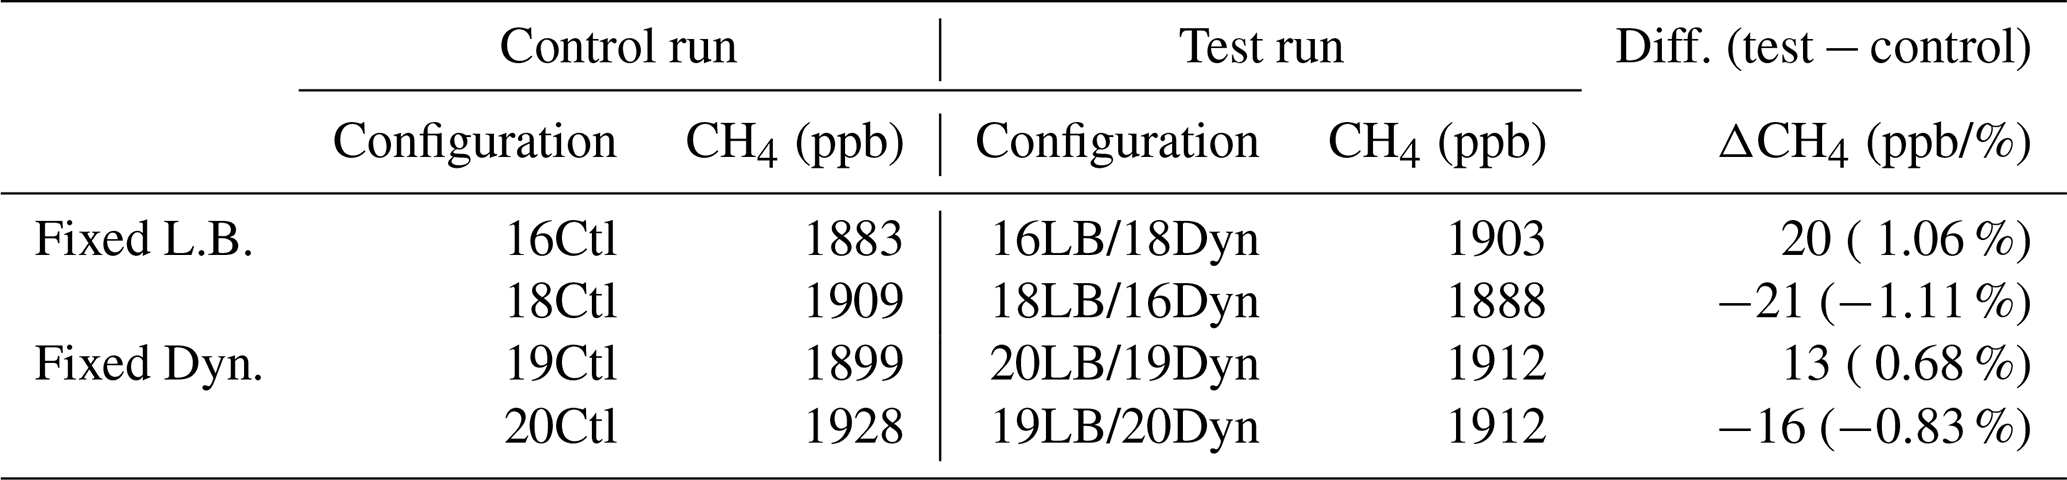
Additionally, we use the lower-boundary conditions of 2019 and 2020 as representative cases of low and high emissions, respectively, over the ASM region. The total emissions over the ASM region during JAS 2020 are remarkably higher (1.3 Tg, ∼7 %) than those in 2019. To isolate the effect of emissions, we conducted a test simulation using the lower-boundary emissions of 2020 with the meteorological data of 2019 (20LB/19Dyn) and compared the results to the control run for 2019. Similarly, we ran a test replacing the 2020 lower boundary with the 2019 emissions (19LB/20Dyn). We found that the differences due to variations in the lower-boundary emissions remained relatively consistent when using different dynamical fields (see details in Fig. S5). Therefore, in the following analysis, we use the results from 20LB/19Dyn − 19Ctl to illustrate the effect of surface emissions.
Figures 6 and 7 illustrate the spatial distribution of the effects from monsoon dynamics and emission conditions, respectively. Quantitatively, monsoon dynamics introduce stronger variations in methane concentrations (1 %–2 %) into the UTLS region compared to the changes driven by emissions, which are less than 1 %. This difference arises because the impact of dynamics is amplified in the UTLS region (Fig. 6a), while the influence of emissions diminishes progressively from the surface to higher altitudes (Fig. 7a).
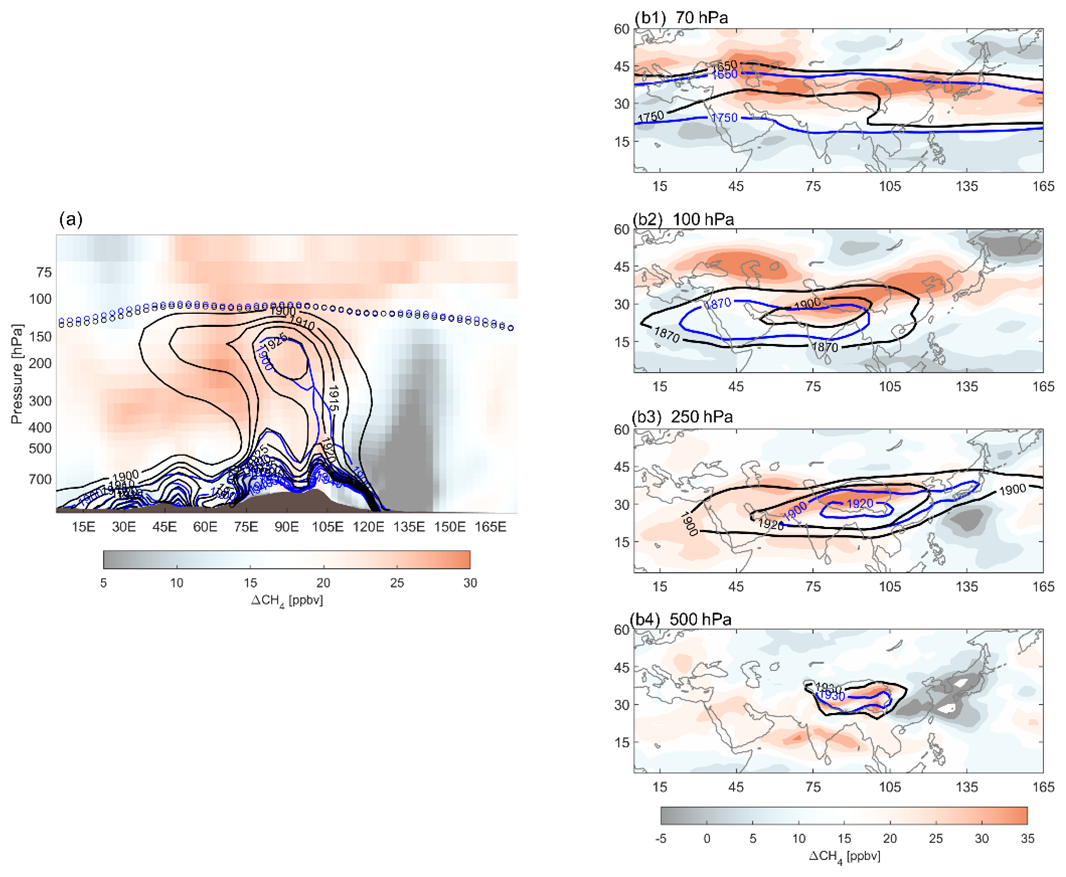
Figure 6The seasonal (JAS) mean differences in CH4 VMR due to anticyclone dynamics (represented by 2016LB/2018Dyn minus 2016Ctl). (a) Longitude–pressure cross section of CH4 differences (averaged over 15–40° N). The horizonal distribution of CH4 differences are shown for 70 hPa (b1), 100 hPa (b2), 250 hPa (b3), and 500 hPa (b4). Contours show the methane VMR for two runs: black for 2016LB/2018Dyn and blue for 2016Ctl. The circles mark the tropopause for 2016 (blue) and 2018 (black).
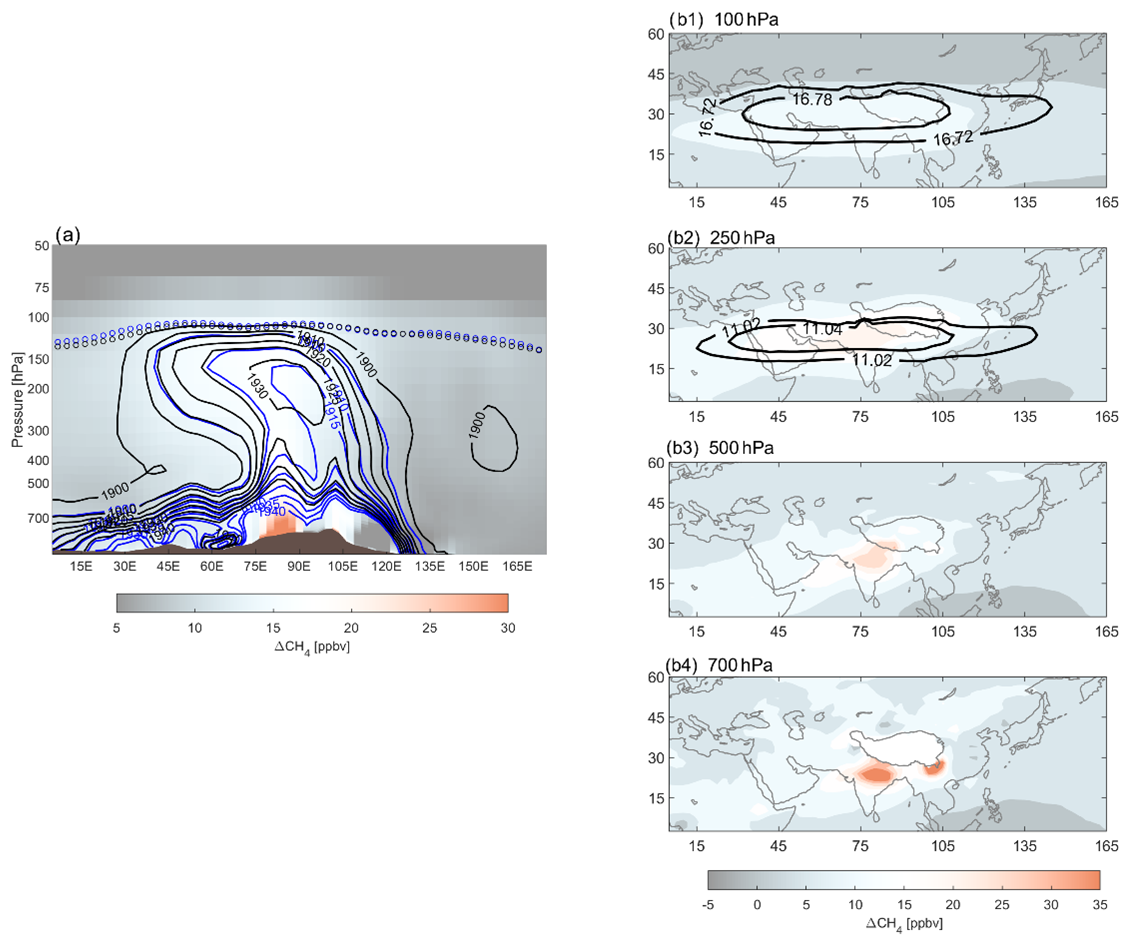
Figure 7Similar to Fig. 6 but for differences in CH4 VMR due to emissions (represented by 2020LB/2019Dyn minus 2019Ctl). Contours show the methane VMR for two runs: black for 2020LB/2019Dyn and blue for 2019Ctl. The black contours in (b1) and (b2) indicate the AMA (GPH contours).
As shown in Fig. 6, changes in CH4 concentrations driven by dynamical fields are significant in the mid-troposphere to lower stratosphere, with variations ranging from 10–40 ppbv. Notably, these dynamically induced changes propagate toward the northern edge of the AMA in the UTLS. The dynamically related methane anomalies extend northward into the lowermost stratosphere and eastward across the Pacific Ocean along the prevailing westerlies (see Fig. S6).
In contrast, differences driven by emission conditions are more localized, concentrating in northern India and the Sichuan Basin within the lower troposphere (Fig. 7b4), regions identified as critical for upward transport in Sect. 3.2. As the methane is transported upward into the upper troposphere, emission-related anomalies are redistributed and confined within the AMA region, as outlined by the GPH isolines (black contours), and do not significantly extend into the stratosphere.
The model results give a reasonable representation of the CH4 vertical and horizontal structure in comparison to the in situ measurements and satellite datasets, which have been discussed in a previous study (Tao et al., 2024). The uncertainty in our simulation includes CH4 emission inversion uncertainty and modeling uncertainties such as representative error (Stanevich et al., 2020, 2021), transport scheme uncertainties (Bisht et al., 2021; Saito et al., 2013), and chemistry scheme uncertainties (Murray et al., 2021; Zhao et al., 2019). Here, the a posteriori CH4 fluxes used in our study show much larger interannual flux variations than the corresponding a priori estimates, with their uncertainties (<3 %) typically 40 % smaller than the a priori uncertainties.
Our study demonstrates two key findings: (1) the subseasonal oscillations of the AMA significantly influence the methane distribution and its transport efficiency from the lower boundary to the UTLS and (2) the interannual variations in methane enhancement in the UTLS are more strongly controlled by the conditions of AMA subseasonal oscillations than by emissions alone.
Notably, regional emissions, the organized monsoon convection, and the AMA modes are not entirely independent. On one hand, monsoon-driven heavy rainfall and resulting floods can increase methane emissions. On the other hand, the pattern of organized monsoon convection is coupled with AMA variations. One potential relationship is that upper-level divergence caused by deep convection potentially shapes the AMA pattern. Therefore, further investigation is needed to understand the complex interactions among monsoon convection, regional emissions, and large-scale anticyclonic circulation, as well as how these interactions evolve under climate change.
Similarly to tropospheric tracers like CO, the spatial distribution of methane in the upper troposphere exhibits remarkable subseasonal variation in strong relation to the east–west oscillation of Asian monsoon anticyclone (AMA). Based on AMA mode composites, we confirm that the dynamic nature of the AMA, in terms of its subseasonal modes, modulates the horizonal distribution of methane as well as efficiency of vertical transport from the convective outflow upward to the upper troposphere over the monsoon region. In particular, the local coincidence of CH4 emissions, strong convection, and the location of the anticyclone around 80° E (WTP mode) favors the vertical transport of air from north India and Bangladesh to the upper troposphere, which contributes most significantly to the total CH4 monsoon plume in the UT. The methane source from south China also contributes to the enhancement, especially when AMA is centered around 105° E (ETP mode). When the AMA center is located over the Iranian Plateau (around 60° E, IP mode), it is positioned far from the primary monsoon convective regions (e.g., the Indian subcontinent and the Bay of Bengal). In such a configuration, horizontal redistribution within the anticyclone becomes more dominant, rather than further vertical upwelling for these organized monsoon convective sources moving into the UTLS. Quantitatively, the CH4 anomaly in the UT under WTP mode is 50 %–100 % higher than that under the other modes, which shows an enhanced connection from the key source region of the Himalayas–Gangetic Plain to the upper-level AMA.
Our study further reveals that methane enhancement in the upper troposphere over the Asian summer monsoon region is a joint effect of the monsoon transport system and annual emission peak in late August mainly from rice cultivation. The monsoon dynamics consistently elevate upper-troposphere CH4 by 2 %–10 % throughout the monsoon's whole course, while emissions from rice cultivation notably contribute to the CH4 peak commonly around late August. Our model sensitivity study reveals that, regarding the monsoon seasonally and regionally averaged methane amplitude in the UTLS region, the influence of the conditions of AMA subseasonal oscillations is more remarkable than that of the conditions of emissions.
Our findings underscore the importance of monsoon dynamics and their subseasonal variability in shaping the 3-D upper-troposphere methane distribution over the Asian monsoon region. Further research is encouraged to unravel the complexities of methane transport within the monsoon system, identify the primary source regions for methane emissions, and trace the trajectory of the monsoon methane plume after the monsoon's withdrawal.
The GEOS-Chem model of atmospheric chemistry and transport is maintained by Harvard University (http://geos-chem.seas.harvard.edu, https://doi.org/10.5281/zenodo.3403111, The International GEOS-Chem User Community, 2019). The ensemble Kalman filter code is publicly available at https://github.com/Rainbow1994/EnKF_CH4.git (https://doi.org/10.5281/zenodo.16947849, Zhu and Palmer Group at the University of Edinburgh, 2025).
All raw data can be provided by the corresponding author upon request.
The supplement related to this article is available online at https://doi.org/10.5194/acp-25-9843-2025-supplement.
MT designed the study; SZ performed the emission inversion, forward simulation, and sensitivity tests; MT analyzed the data; MT and SZ wrote the manuscript draft; all the authors reviewed and edited the manuscript.
The contact author has declared that none of the authors has any competing interests.
Publisher's note: Copernicus Publications remains neutral with regard to jurisdictional claims made in the text, published maps, institutional affiliations, or any other geographical representation in this paper. While Copernicus Publications makes every effort to include appropriate place names, the final responsibility lies with the authors.
We thank the GEOS-Chem community, in particular the Harvard University team which helps maintain the GEOS-Chem model, and the NASA Global Modeling and Assimilation Office (GMAO) for providing the MERRA-2 data product.
This work was supported by the National Key R&D Program of China (2022YFB3904802), by the National Natural Science Foundation of China (42105060), by the China Postdoctoral Science Foundation (E3442418), and by the Tibet Science and Technological Project (CGZH2023000385).
This paper was edited by Stefano Galmarini and reviewed by two anonymous referees.
Alladi, H. K., Satheesh Chandran, P. R., and Ratnam, M. V.: Impact of ENSO on the UTLS chemical composition in the Asian Summer Monsoon Anticyclone, Atmos. Res., 309, 107551, https://doi.org/10.1016/j.atmosres.2024.107551, 2024.
Baker, A. K., Schuck, T. J., Brenninkmeijer, C. A. M., Rauthe-Schöch, A., Slemr, F., van Velthoven, P. F. J., and Lelieveld, J.: Estimating the contribution of monsoon-related biogenic production to methane emissions from South Asia using CARIBIC observations, Geophys. Res. Lett., 39, L10813, https://doi.org/10.1029/2012GL051756, 2012.
Belikov, D. A., Saitoh, N., and Patra, P. K.: An Analysis of Interhemispheric Transport Pathways Based on Three-Dimensional Methane Data by GOSAT Observations and Model Simulations, J. Geophys. Res.-Atmos., 127, e2021JD035688, https://doi.org/10.1029/2021JD035688, 2022.
Bergman, J. W., Fierli, F., Jensen, E. J., Honomichl, S., and Pan, L. L.: Boundary layer sources for the Asian anticyclone: Regional contributions to a vertical conduit, J. Geophys. Res.-Atmos., 118, 2560–2575, https://doi.org/10.1002/jgrd.50142, 2013.
Bisht, J. S. H., Machida, T., Chandra, N., Tsuboi, K., Patra, P. K., Umezawa, T., Niwa, Y., Sawa, Y., Morimoto, S., Nakazawa, T., Saitoh, N., and Takigawa, M.: Seasonal Variations of SF6, CO2, CH4, and N2O in the UT/LS Region due to Emissions, Transport, and Chemistry, J. Geophys. Res.-Atmos., 126, e2020JD033541, https://doi.org/10.1029/2020JD033541, 2021.
Bucci, S., Legras, B., Sellitto, P., D'Amato, F., Viciani, S., Montori, A., Chiarugi, A., Ravegnani, F., Ulanovsky, A., Cairo, F., and Stroh, F.: Deep-convective influence on the upper troposphere–lower stratosphere composition in the Asian monsoon anticyclone region: 2017 StratoClim campaign results, Atmos. Chem. Phys., 20, 12193–12210, https://doi.org/10.5194/acp-20-12193-2020, 2020.
Feng, L., Palmer, P. I., Bösch, H., and Dance, S.: Estimating surface CO2 fluxes from space-borne CO2 dry air mole fraction observations using an ensemble Kalman Filter, Atmos. Chem. Phys., 9, 2619–2633, https://doi.org/10.5194/acp-9-2619-2009, 2009.
Feng, L., Palmer, P. I., Bösch, H., Parker, R. J., Webb, A. J., Correia, C. S. C., Deutscher, N. M., Domingues, L. G., Feist, D. G., Gatti, L. V., Gloor, E., Hase, F., Kivi, R., Liu, Y., Miller, J. B., Morino, I., Sussmann, R., Strong, K., Uchino, O., Wang, J., and Zahn, A.: Consistent regional fluxes of CH4 and CO2 inferred from GOSAT proxy XCH4 : XCO2 retrievals, 2010–2014, Atmos. Chem. Phys., 17, 4781–4797, https://doi.org/10.5194/acp-17-4781-2017, 2017.
Garny, H. and Randel, W. J.: Dynamic variability of the Asian monsoon anticyclone observed in potential vorticity and correlations with tracer distributions, J. Geophys. Res.-Atmos., 118, https://doi.org/10.1002/2013JD020908, 2013.
Garny, H. and Randel, W. J.: Transport pathways from the Asian monsoon anticyclone to the stratosphere, Atmos. Chem. Phys., 16, 2703–2718, https://doi.org/10.5194/acp-16-2703-2016, 2016.
Gelaro, R., McCarty, W., Suárez, M. J., Todling, R., Molod, A., Takacs, L., Randles, C. A., Darmenov, A., Bosilovich, M. G., Reichle, R., Wargan, K., Coy, L., Cullather, R., Draper, C., Akella, S., Buchard, V., Conaty, A., Silva, A. M. da, Gu, W., Kim, G.-K., Koster, R., Lucchesi, R., Merkova, D., Nielsen, J. E., Partyka, G., Pawson, S., Putman, W., Rienecker, M., Schubert, S. D., Sienkiewicz, M., and Zhao, B.: The Modern-Era Retrospective Analysis for Research and Applications, Version 2 (MERRA-2), https://doi.org/10.1175/JCLI-D-16-0758.1, 2017.
von Hobe, M., Ploeger, F., Konopka, P., Kloss, C., Ulanowski, A., Yushkov, V., Ravegnani, F., Volk, C. M., Pan, L. L., Honomichl, S. B., Tilmes, S., Kinnison, D. E., Garcia, R. R., and Wright, J. S.: Upward transport into and within the Asian monsoon anticyclone as inferred from StratoClim trace gas observations, Atmos. Chem. Phys., 21, 1267–1285, https://doi.org/10.5194/acp-21-1267-2021, 2021.
Krishnamurti, T. N. and Ardanuy, P.: The 10 to 20 d westward propagating mode and “Breaks in the Monsoons,” Tellus A, 32, 15, https://doi.org/10.3402/tellusa.v32i1.10476, 1980.
Krishnamurti, T. N. and Bhalme, H. N.: Oscillations of a Monsoon System. Part I. Observational Aspects, J. Atmos. Sci., 33, 1937–1954, https://doi.org/10.1175/1520-0469(1976)033<1937:OOAMSP>2.0.CO;2, 1976.
Lau, W. K. M., Yuan, C., and Li, Z.: Origin, Maintenance and Variability of the Asian Tropopause Aerosol Layer (ATAL): The Roles of Monsoon Dynamics, Sci. Rep.-UK, 8, 3960, https://doi.org/10.1038/s41598-018-22267-z, 2018.
Legras, B. and Bucci, S.: Confinement of air in the Asian monsoon anticyclone and pathways of convective air to the stratosphere during the summer season, Atmos. Chem. Phys., 20, 11045–11064, https://doi.org/10.5194/acp-20-11045-2020, 2020.
Luo, J., Pan, L. L., Honomichl, S. B., Bergman, J. W., Randel, W. J., Francis, G., Clerbaux, C., George, M., Liu, X., and Tian, W.: Space–time variability in UTLS chemical distribution in the Asian summer monsoon viewed by limb and nadir satellite sensors, Atmos. Chem. Phys., 18, 12511–12530, https://doi.org/10.5194/acp-18-12511-2018, 2018.
Machida, T., Matsueda, H., Sawa, Y., Niwa, Y., Tsuboi, K., Ishijima, K., Katsumata, K., Murayama, S., Morimoto, S., Goto, D., Aoki, S., and Sasakawa, M.: Atmospheric trace gas data from the CONTRAIL flask air sampling, ver.2023.1.0 (ver.2023.1.0), https://doi.org/10.17595/20230725.001, 2023.
Manney, G. L., Santee, M. L., Lawrence, Z. D., Wargan, K., and Schwartz, M. J.: A Moments View of Climatology and Variability of the Asian Summer Monsoon Anticyclone, J. Climate, 34, 7821–7841, https://doi.org/10.1175/JCLI-D-20-0729.1, 2021.
Murray, L., Fiore, A., Shindell, D., Naik, V., and Horowitz, L.: Large uncertainties in global hydroxyl projections tied to fate of reactive nitrogen and carbon, P. Natl. Acad. Sci. USA, 118, e2115204118, https://doi.org/10.1073/pnas.2115204118, 2021.
Nützel, M., Dameris, M., and Garny, H.: Movement, drivers and bimodality of the South Asian High, Atmos. Chem. Phys., 16, 14755–14774, https://doi.org/10.5194/acp-16-14755-2016, 2016.
Pan, L. L., Honomichl, S. B., Kinnison, D. E., Abalos, M., Randel, W. J., Bergman, J. W., and Bian, J.: Transport of chemical tracers from the boundary layer to stratosphere associated with the dynamics of the Asian summer monsoon, J. Geophys. Res.-Atmos., 121, 14159–14174, https://doi.org/10.1002/2016JD025616, 2016.
Pan, L. L., Kinnison, D., Liang, Q., Chin, M., Santee, M. L., Flemming, J., Smith, W. P., Honomichl, S. B., Bresch, J. F., Lait, L. R., Zhu, Y., Tilmes, S., Colarco, P. R., Warner, J., Vuvan, A., Clerbaux, C., Atlas, E. L., Newman, P. A., Thornberry, T., Randel, W. J., and Toon, O. B.: A Multimodel Investigation of Asian Summer Monsoon UTLS Transport Over the Western Pacific, J. Geophys. Res.-Atmos., 127, e2022JD037511, https://doi.org/10.1029/2022JD037511, 2022.
Pan, L. L., Atlas, E. L., Honomichl, S. B., Smith, W. P., Kinnison, D. E., Solomon, S., Santee, M. L., Saiz-Lopez, A., Laube, J. C., Wang, B., Ueyama, R., Bresch, J. F., Hornbrook, R. S., Apel, E. C., Hills, A. J., Treadaway, V., Smith, K., Schauffler, S., Donnelly, S., Hendershot, R., Lueb, R., Campos, T., Viciani, S., D’Amato, F., Bianchini, G., Barucci, M., Podolske, J. R., Iraci, L. T., Gurganus, C., Bui, P., Dean-Day, J. M., Millán, L., Ryoo, J.-M., Barletta, B., Koo, J.-H., Kim, J., Liang, Q., Randel, W. J., Thornberry, T., and Newman, P. A.: East Asian summer monsoon delivers large abundances of very short-lived organic chlorine substances to the lower stratosphere, P. Natl. Acad. Sci. USA, 121, e2318716121, https://doi.org/10.1073/pnas.2318716121, 2024.
Park, M., Randel, W. J., Kinnison, D. E., Garcia, R. R., and Choi, W.: Seasonal variation of methane, water vapor, and nitrogen oxides near the tropopause: Satellite observations and model simulations, J. Geophys. Res., 109, 2003JD003706, https://doi.org/10.1029/2003JD003706, 2004.
Park, M., Randel, W. J., Emmons, L. K., and Livesey, N. J.: Transport pathways of carbon monoxide in the Asian summer monsoon diagnosed from Model of Ozone and Related Tracers (MOZART), J. Geophys. Res., 114, 2008JD010621, https://doi.org/10.1029/2008JD010621, 2009.
Parker, R. J., Webb, A., Boesch, H., Somkuti, P., Barrio Guillo, R., Di Noia, A., Kalaitzi, N., Anand, J. S., Bergamaschi, P., Chevallier, F., Palmer, P. I., Feng, L., Deutscher, N. M., Feist, D. G., Griffith, D. W. T., Hase, F., Kivi, R., Morino, I., Notholt, J., Oh, Y.-S., Ohyama, H., Petri, C., Pollard, D. F., Roehl, C., Sha, M. K., Shiomi, K., Strong, K., Sussmann, R., Té, Y., Velazco, V. A., Warneke, T., Wennberg, P. O., and Wunch, D.: A decade of GOSAT Proxy satellite CH4 observations, Earth Syst. Sci. Data, 12, 3383–3412, https://doi.org/10.5194/essd-12-3383-2020, 2020.
Ploeger, F., Gottschling, C., Griessbach, S., Grooß, J.-U., Guenther, G., Konopka, P., Müller, R., Riese, M., Stroh, F., Tao, M., Ungermann, J., Vogel, B., and von Hobe, M.: A potential vorticity-based determination of the transport barrier in the Asian summer monsoon anticyclone, Atmos. Chem. Phys., 15, 13145–13159, https://doi.org/10.5194/acp-15-13145-2015, 2015.
Ploeger, F., Konopka, P., Walker, K., and Riese, M.: Quantifying pollution transport from the Asian monsoon anticyclone into the lower stratosphere, Atmos. Chem. Phys., 17, 7055–7066, https://doi.org/10.5194/acp-17-7055-2017, 2017.
Randel, W. J., Park, M., Emmons, L., Kinnison, D., Bernath, P., Walker, K. A., Boone, C., and Pumphrey, H.: Asian Monsoon Transport of Pollution to the Stratosphere, Science, 328, 611–613, https://doi.org/10.1126/science.1182274, 2010.
Riese, M., Ploeger, F., Rap, A., Vogel, B., Konopka, P., Dameris, M., and Forster, P.: Impact of uncertainties in atmospheric mixing on simulated UTLS composition and related radiative effects, J. Geophys. Res., 117, 2012JD017751, https://doi.org/10.1029/2012JD017751, 2012.
Rohs, S., Schiller, C., Riese, M., Engel, A., Schmidt, U., Wetter, T., Levin, I., Nakazawa, T., and Aoki, S.: Long-term changes of methane and hydrogen in the stratosphere in the period 1978–2003 and their impact on the abundance of stratospheric water vapor, J. Geophys. Res., 111, 2005JD006877, https://doi.org/10.1029/2005JD006877, 2006.
Rosenlof, K. H., Tuck, A. F., Kelly, K. K., Russell, J. M., and McCormick, M. P.: Hemispheric asymmetries in water vapor and inferences about transport in the lower stratosphere, J. Geophys. Res., 102, 13213–13234, https://doi.org/10.1029/97JD00873, 1997.
Saito, R., Patra, P. K., Sweeney, C., Machida, T., Krol, M., Houweling, S., Bousquet, P., Agusti-Panareda, A., Belikov, D., Bergmann, D., Bian, H., Cameron-Smith, P., Chipperfield, M. P., Fortems-Cheiney, A., Fraser, A., Gatti, L. V., Gloor, E., Hess, P., Kawa, S. R., Law, R. M., Locatelli, R., Loh, Z., Maksyutov, S., Meng, L., Miller, J. B., Palmer, P. I., Prinn, R. G., Rigby, M., and Wilson, C.: TransCom model simulations of methane: Comparison of vertical profiles with aircraft measurements, J. Geophys. Res.-Atmos., 118, 3891–3904, https://doi.org/10.1002/jgrd.50380, 2013.
Schuck, T. J., Brenninkmeijer, C. A. M., Baker, A. K., Slemr, F., von Velthoven, P. F. J., and Zahn, A.: Greenhouse gas relationships in the Indian summer monsoon plume measured by the CARIBIC passenger aircraft, Atmos. Chem. Phys., 10, 3965–3984, https://doi.org/10.5194/acp-10-3965-2010, 2010.
Schuldt, K. N., Aalto, T., Arlyn A., Aoki, S., Apadula, F., Arduini J.,Baier, B., Bartyzel, J., Bergamaschi, P., Biermann, T., Biraud, S. C., Boenisch, H., Brailsford, G., Brand, W. A., Chen, H., Colomb, A., Conil, S., Couret, C., Cristofanelli, P., Cuevas, E., Daube, B., Davis, K., De Mazière, M., Delmotte, M., Desai, A., DiGangi, J. P., Dlugokencky, E., Elkins, J. W., Emmenegger, L., Fischer, M. L., Forster, G., Gatti, L. V., Gehrlein, T., Gerbig, C., Gloor, E., Goto, D., Haszpra, L., Hatakka, J., Heimann, M., Heliasz, M., Heltai, D., Hermanssen, O., Hintsa, E., Hoheisel, A., Holst, J., Ivakhov, V., Jaffe, D., Jordan, A., Joubert, W., Kang, H.-Y., Karion, A., Kazan, V., Keeling, R., Keronen, P., Kers, B., Kim, J., Kneuer, T., Ko, M.-Y., Kominkova, K., Kort, E., Kozlova, E., Krummel, P., Kubistin, D., Labuschagne, C., Lan, X., Langenfelds, R., Laurent, O., Laurila, T., Lauvaux, T., Lavric, J., Lee, C.-H., Lee, H., Lee, J., Lehner, I., Lehtinen, K., Leppert, R., Leskinen, A., Leuenberger, M., Lindauer, M., Loh, Z., Lopez, M., Lowry, D., Lunder, C. R., Machida, T., Mammarella, I., Manca, G., Marek, M. V., Martin, M. Y., Martins, G. A., Matsueda, H., McKain, K., Meinhardt, F., Menoud, M., Miles, N., Miller, C. E., Miller, J. B., Monteiro, V., Moore, F., Moossen, H., Morgan, E., Morimoto, S., Munro, D., Myhre, C. L., Mölder, M., Müller-Williams, J., Necki, J., Nichol, S., Nisbet, E., Niwa, Y., O'Doherty, S., Obersteiner, F., Piacentino, S., Pichon, J. M., Pitt, J., Pittman, J., Plass-Duelmer, C., Platt, S. M., Popa, M. E., Prinzivalli, S., Ramonet, M., Richardson, S., Rivas, P. P., Rothe, M., Röckmann, T., Saito, K., Santoni, G., Sasakawa, M., Scheeren, B., Schmidt, M., Schuck, T., Schumacher, M., Seifert, T., Sha, M. K., Shepson, P., Sloop, C. D., Smith, P., Stanisavljević, M., Steinbacher, M., Stephens, B., Sweeney, C., Sørensen, L. L., Thoning, K., Timas, H., Torn, M., Trisolino, P., Turnbull, J., Tørseth, K., Viner, B., Vitkova, G., Watson, A., Weiss, R., Wofsy, S., Worsey, J., Worthy, D., Zaehle, S., Zahn, A., Zazzeri, G., de Souza, R. A., de Vries, M., di Sarra, A. G., and van der Veen, C.: Multi-laboratory compilation of atmospheric carbon dioxide data for the period 1983-2021; obspack_ch4_1_GLOBALVIEWplus_v5.0_2022-10-17, https://doi.org/10.25925/20221001, 2022.
Siu, L. W. and Bowman, K. P.: Unsteady Vortex Behavior in the Asian Monsoon Anticyclone, J. Atmos. Sci., 77, 4067–4088, https://doi.org/10.1175/JAS-D-19-0349.1, 2020.
Stanevich, I., Jones, D. B. A., Strong, K., Parker, R. J., Boesch, H., Wunch, D., Notholt, J., Petri, C., Warneke, T., Sussmann, R., Schneider, M., Hase, F., Kivi, R., Deutscher, N. M., Velazco, V. A., Walker, K. A., and Deng, F.: Characterizing model errors in chemical transport modeling of methane: impact of model resolution in versions v9-02 of GEOS-Chem and v35j of its adjoint model, Geosci. Model Dev., 13, 3839–3862, https://doi.org/10.5194/gmd-13-3839-2020, 2020.
Stanevich, I., Jones, D. B. A., Strong, K., Keller, M., Henze, D. K., Parker, R. J., Boesch, H., Wunch, D., Notholt, J., Petri, C., Warneke, T., Sussmann, R., Schneider, M., Hase, F., Kivi, R., Deutscher, N. M., Velazco, V. A., Walker, K. A., and Deng, F.: Characterizing model errors in chemical transport modeling of methane: using GOSAT XCH4 data with weak-constraint four-dimensional variational data assimilation, Atmos. Chem. Phys., 21, 9545–9572, https://doi.org/10.5194/acp-21-9545-2021, 2021.
Stavert, A. R., Saunois, M., Canadell, J. G., Poulter, B., Jackson, R. B., Regnier, P., Lauerwald, R., Raymond, P. A., Allen, G. H., Patra, P. K., Bergamaschi, P., Bousquet, P., Chandra, N., Ciais, P., Gustafson, A., Ishizawa, M., Ito, A., Kleinen, T., Maksyutov, S., McNorton, J., Melton, J. R., Müller, J., Niwa, Y., Peng, S., Riley, W. J., Segers, A., Tian, H., Tsuruta, A., Yin, Y., Zhang, Z., Zheng, B., and Zhuang, Q.: Regional trends and drivers of the global methane budget, Glob. Change Biol., 28, 182–200, https://doi.org/10.1111/gcb.15901, 2022.
Tao, M., Cai, Z., Zhu, S., Liu, Y., Feng, L., Fang, S., Yi, Y., and Bian, J.: New evidence for CH4 enhancement at upper troposphere associated with Asian summer monsoon, Environ. Res. Lett., 19, 034033, https://doi.org/10.1088/1748-9326/ad2738, 2024.
The International GEOS-Chem User Community: Geoschem/geos-chem: GEOS-Chem 12.5.0, Zenodo [code], https://doi.org/10.5281/zenodo.3403111, 2019.
Tomsche, L., Pozzer, A., Ojha, N., Parchatka, U., Lelieveld, J., and Fischer, H.: Upper tropospheric CH4 and CO affected by the South Asian summer monsoon during the Oxidation Mechanism Observations mission, Atmos. Chem. Phys., 19, 1915–1939, https://doi.org/10.5194/acp-19-1915-2019, 2019.
Total Carbon Column Observing Network (TCCON) Team: 2020 TCCON Data Release, https://doi.org/10.14291/TCCON.GGG2020, 2022.
Vogel, B., Müller, R., Günther, G., Spang, R., Hanumanthu, S., Li, D., Riese, M., and Stiller, G. P.: Lagrangian simulations of the transport of young air masses to the top of the Asian monsoon anticyclone and into the tropical pipe, Atmos. Chem. Phys., 19, 6007–6034, https://doi.org/10.5194/acp-19-6007-2019, 2019.
Vogel, B., Volk, C. M., Wintel, J., Lauther, V., Clemens, J., Grooß, J.-U., Günther, G., Hoffmann, L., Laube, J. C., Müller, R., Ploeger, F., and Stroh, F.: Evaluation of vertical transport in ERA5 and ERA-Interim reanalysis using high-altitude aircraft measurements in the Asian summer monsoon 2017, Atmos. Chem. Phys., 24, 317–343, https://doi.org/10.5194/acp-24-317-2024, 2024.
Xiong, X., Houweling, S., Wei, J., Maddy, E., Sun, F., and Barnet, C.: Methane plume over south Asia during the monsoon season: satellite observation and model simulation, Atmos. Chem. Phys., 9, 783–794, https://doi.org/10.5194/acp-9-783-2009, 2009.
Yan, X., Konopka, P., Ploeger, F., Podglajen, A., Wright, J. S., Müller, R., and Riese, M.: The efficiency of transport into the stratosphere via the Asian and North American summer monsoon circulations, Atmos. Chem. Phys., 19, 15629–15649, https://doi.org/10.5194/acp-19-15629-2019, 2019.
Yu, P., Rosenlof, K. H., Liu, S., Telg, H., Thornberry, T. D., Rollins, A. W., Portmann, R. W., Bai, Z., Ray, E. A., Duan, Y., Pan, L. L., Toon, O. B., Bian, J., and Gao, R.-S.: Efficient transport of tropospheric aerosol into the stratosphere via the Asian summer monsoon anticyclone, P. Natl. Acad. Sci. USA, 114, 6972–6977, https://doi.org/10.1073/pnas.1701170114, 2017.
Zeng, Z.-C., Byrne, B., Gong, F.-Y., He, Z., and Lei, L.: Correlation between paddy rice growth and satellite-observed methane column abundance does not imply causation, Nat. Commun., 12, 1163, https://doi.org/10.1038/s41467-021-21434-7, 2021.
Zhang, G., Xiao, X., Dong, J., Xin, F., Zhang, Y., Qin, Y., Doughty, R. B., and Moore, B.: Fingerprint of rice paddies in spatial–temporal dynamics of atmospheric methane concentration in monsoon Asia, Nat. Commun., 11, 554, https://doi.org/10.1038/s41467-019-14155-5, 2020.
Zhang, Q., Wu, G., and Qian, Y.: The Bimodality of the 100 hPa South Asia High and its Relationship to the Climate Anomaly over East Asia in Summer., J. Meteorol. Soc. Jpn., 80, 733–744, https://doi.org/10.2151/jmsj.80.733, 2002.
Zhao, Y., Saunois, M., Bousquet, P., Lin, X., Berchet, A., Hegglin, M. I., Canadell, J. G., Jackson, R. B., Hauglustaine, D. A., Szopa, S., Stavert, A. R., Abraham, N. L., Archibald, A. T., Bekki, S., Deushi, M., Jöckel, P., Josse, B., Kinnison, D., Kirner, O., Marécal, V., O'Connor, F. M., Plummer, D. A., Revell, L. E., Rozanov, E., Stenke, A., Strode, S., Tilmes, S., Dlugokencky, E. J., and Zheng, B.: Inter-model comparison of global hydroxyl radical (OH) distributions and their impact on atmospheric methane over the 2000–2016 period, Atmos. Chem. Phys., 19, 13701–13723, https://doi.org/10.5194/acp-19-13701-2019, 2019.
Zhu, S., Feng, L., Liu, Y., Wang, J., and Yang, D.: Decadal Methane Emission Trend Inferred from Proxy GOSAT XCH4 Retrievals: Impacts of Transport Model Spatial Resolution, Adv. Atmos. Sci., 39, 1343–1359, https://doi.org/10.1007/s00376-022-1434-6, 2022.
Zhu, S. and Palmer Group at the University of Edinburgh: Rainbow1994/EnKF_CH4, v1.0.0 (v1.0.0), Zenodo [code], https://doi.org/10.5281/zenodo.16947849, 2025.