the Creative Commons Attribution 4.0 License.
the Creative Commons Attribution 4.0 License.
 | 03 Sep 2025
Investigating the link between mineral dust hematite content and intensive optical properties by means of lidar measurements and aerosol modeling
Sofía Gómez Maqueo Anaya
Dietrich Althausen
Julian Hofer
Moritz Haarig
Ulla Wandinger
Bernd Heinold
Ina Tegen
Matthias Faust
Holger Baars
Albert Ansmann
Ronny Engelmann
Annett Skupin
Birgit Heese
Kerstin Schepanski
This study investigates the relationship between lidar-measured intensive optical properties of Saharan dust and simulated hematite content, using data collected during the Joint Aeolus Tropical Atlantic Campaign (JATAC) in 2021 and 2022. Measurements were taken in Mindelo, São Vicente, Cabo Verde. The study aims to determine how changes in hematite content influence the intensive optical properties of dust particles, particularly in the ultraviolet–visible (UV–Vis) spectrum. Given the well-documented impact of hematite on the absorption properties of dust, especially in the UV–Vis range, our hypothesis is that these effects will be detectable in lidar measurements. Specifically, this study focuses on the lidar ratio, particle depolarization ratio, and backscatter- and extinction-related Ångström exponents at 355 and 532 nm wavelengths. By analyzing dust plume cases separately regarding their size differences, the strongest positive correlation was identified between the backscatter-related Ångström exponent and hematite fraction (R2=0.63). These findings contribute to improving the representation of dust in atmospheric models, which often overlook the variability in mineralogical composition in their dust descriptions, and refining calculations of its direct radiative effect.
- Article
(4635 KB) - Full-text XML
- BibTeX
- EndNote


Mineral dust aerosols are present all around the world. They contribute significantly to global and regional aerosol loading (Weinzierl et al., 2017) and correspond to a big part of the atmospheric aerosol burden by mass (Kok et al., 2017). Specifically, the Sahara and the Sahel contribute around 50 % of global dust emissions and mass loading (Kok et al., 2021). During transport, dust interacts with the atmosphere in a variety of ways. It modifies the energy balance of Earth through multiple mechanisms, each producing a radiative effect. These impacts can be instantaneous, such as dust scattering and absorbing radiation, or may take time to adjust, such as dust altering cloud cover (Boucher et al., 2013). The immediate radiation interactions are well studied; it is known that dust absorbs and scatters solar shortwave and terrestrial longwave radiation depending on its composition (Kok et al., 2017). These interactions have the potential to modify the atmospheric radiation balance from meso- to macroscales (Kok et al., 2023; Mahowald et al., 2010; Li et al., 2024). However, the magnitude and sign of this dust radiative effect are still uncertain (Highwood and Ryder, 2014; Kok et al., 2017). One of the major sources of this uncertainty is insufficient knowledge regarding dust absorption properties (Balkanski et al., 2007; Di Biagio et al., 2020; Go et al., 2022). Since dust aerosols are a complex assemblage of various minerals with distinct physicochemical properties (Formenti et al., 2011), differences in their atmospheric radiative impact will arise as a consequence of distinct mineralogical content.
In order to predict and model the direct radiative effect of mineral dust, vertical profiles of its optical properties are part of the basic necessary input. Among these, the profile of the extinction to backscatter ratio, known as the lidar ratio (S), is particularly critical (Veselovskii et al., 2020). The lidar ratio, being an intensive optical property (independent of aerosol quantity), is commonly used to characterize mineral dust. However, it has a complex dependency on three major parameters: size, shape, and composition (Wandinger et al., 2023). Several studies have aligned differences in dust optical properties to distinct mineralogical content according to source regions (Di Biagio et al., 2017, 2019; Lafon et al., 2004; Sokolik and Toon, 1999; Wagner et al., 2012). Some studies have specifically linked changes in S to different source regions (Esselborn et al., 2009) and, further, to the changes that these differences cause in the dust complex refractive index (CRI) (Go et al., 2022; Schuster et al., 2012; Veselovskii et al., 2020).
In particular, when iron oxides are present in dust particles, the imaginary part of the CRI changes across the radiation spectrum, with an increase in the UV–Vis range. Consequently, they are considered effective absorbers of shortwave radiation (Di Biagio et al., 2019; Moosmüller et al., 2012; Sokolik et al., 1993; Sokolik and Toon, 1996; Wagner et al., 2012; Zhang et al., 2024). Furthermore, even small changes in the imaginary part of the CRI (of the order of 10−3) can strongly affect backscattering efficiency in the UV–Vis spectral region (De Leeuw and Lamberts, 1987; Miffre et al., 2020; Chang et al., 2025). These effects are consistent with the differences observed by Di Biagio et al. (2019), who demonstrated that increasing the imaginary part of the CRI from 0.0016 to 0.0048, associated with a change in the hematite fraction of 0.5 %, can reduce the single-scattering albedo (SSA) from 0.95 to 0.75 at 370 nm.
Despite this sensitivity, most characterizations of dust based on lidar-measured optical properties treat it as homogeneous, giving way to unique wavelength-dependent lidar ratio values that indicate “pure Saharan dust” (Haarig et al., 2017, 2022; Groß et al., 2011, 2015; Müller et al., 2013; Schuster et al., 2012; Tesche et al., 2009a, 2011). These studies specifically suggest that the intensive optical properties of dust show no clear regional spectral dependency, despite observed regional spectral differences that have been linked to changes in the CRI, especially for the lidar ratio and the backscatter-related Ångström exponent (Schuster et al., 2012; Veselovskii et al., 2020).
The sensitivity study by Veselovskii et al. (2020) demonstrated the impact of changes in the imaginary part of the CRI due to different iron oxide contents in Saharan dust on the backscatter-related Ångström exponent for the UV–Vis wavelengths. This relationship is further explored in the laboratory studies by Miffre et al. (2020, 2023), which included particle shape and revealed the nonlinearity of the three key physical parameters, size, shape, and composition, affecting the intensive optical properties of dust. Specifically, they measured significant impacts of the changes in the complex refractive index for both the backscatter-related Ångström exponents and the particle depolarization ratio for the UV–Vis wavelength range. Complementing these findings, recent modeling efforts have further reinforced the significance of the impact on increasing imaginary parts of the CRI for dust optical behavior. In the comparative analysis, Chang et al. (2025) evaluated multiple scattering models, including spherical (Mie theory), spheroidal (Dubovik et al., 2006), and irregular hexahedral particle shapes (Saito and Yang, 2021; Saito et al., 2021), and assessed how changes in the imaginary part of the CRI affect the backscatter coefficient at 532 nm and the backscatter-related Ångström exponent for 355 and 532 nm. Although the absolute values differed among the models due to particle geometry, the functional form of the relationship, where increasing imaginary CRI led to decreasing backscatter, remained consistent. This convergence across scattering models supports the robustness of using spectral trends derived from simplified assumptions (e.g., spherical particles) as a first-order approximation for interpreting wavelength-dependent backscattering behavior, particularly via intensive optical properties such as the backscatter-related Ångström exponents.
However, several limitations must be considered. Miffre et al. (2020, 2023) conducted their studies in a laboratory setting, and their findings may not directly translate to atmospheric conditions, as other atmospheric constituents can have an impact on the measurements. In the study by Veselovskii et al. (2020), measurements were taken near to an active dust-emitting area, making the presence of larger particles highly likely. For intensive optical properties where the impact of the complex refractive index has been documented, both the backscatter-related Ångström exponents and the lidar ratio are particularly sensitive to changes in particle size. This impact is illustrated in Fig. 1 of Miffre et al. (2020) for the backscatter-related Ångström exponents and in Fig. 5 of Wandinger et al. (2023) and Fig. 15 in Zhang et al. (2024) for the lidar ratio. Particle size, shape, and composition influence the measurements, making it challenging to isolate the effects of each factor. Additionally, the lidar measurements conducted by Veselovskii et al. (2020) were taken during a season well known for increased biomass burning activity, leading to frequent encounters with polluted dust in the atmosphere. This pollution alters the measured optical properties, particularly in the UV–Vis spectrum (Heinold et al., 2011; Müller et al., 2009; Tesche et al., 2011), adding another layer of complexity in disentangling compositional effects on both the backscatter-related Ångström exponents and the lidar ratio.
The transport of mineral dust from the Sahara towards the Atlantic Ocean is well documented (Schepanski et al., 2009, 2017; Tegen et al., 2013; Wagner et al., 2016). During the northern hemispheric (NH) winter months, polluted dust is observed at near-surface layers, complicating the distinction between dust and other aerosols, such as biomass burning aerosols, in lidar measurements. In contrast, during NH summer months, dust is elevated in the atmosphere (Schepanski et al., 2009). Dust transport in the NH summer months is above the marine boundary layer, i.e., in the free troposphere, which in turn means that dust transport from the Sahara towards the Atlantic Ocean is more direct. Lidar measurements taken during this time show that the elevated dust layers typically contain lower levels of pollution from other aerosols (Esselborn et al., 2009; Freudenthaler et al., 2009; Haarig et al., 2017, 2019; Groß et al., 2015; Tesche et al., 2009b). Therefore, this study focuses on lidar-measured cases from a remote site in Cabo Verde to avoid interference from freshly emitted large dust particles along the mineral dust transport pathway from the Sahara to the Atlantic Ocean. These lidar measurements were taken in Mindelo, São Vicente, Cabo Verde (16°52′39.9′′ N, 24°59′42.3′′ W), during NH summer months, from June to September of 2021 and 2022, as part of the Joint Aeolus Tropical Atlantic Campaign (JATAC).
This study investigates the potential to identify dust mineralogy within lidar-measured optical properties. By analyzing years of continuous, lidar measurements of multiple vertical dust profiles above the marine boundary layer, we aim to correlate lidar-derived intensive optical properties of dust particles with the modeled iron oxide content from an atmospheric model. Given that previous studies have demonstrated the ability of iron oxides to modify the imaginary part of the CRI and the impact of these differences on dust intensive optical properties, particularly for the UV–Vis spectrum (Di Biagio et al., 2019; Miffre et al., 2020, 2023), this work hypothesizes that this effect will manifest in the lidar-measured intensive optical properties at the 355 and 532 nm wavelengths. The aim is to investigate how the iron oxide content, which varies significantly across the Sahara (Formenti et al., 2011, 2014; Scheuvens et al., 2013), affects the intensive optical properties of dust. While regional differences in mineralogy within the Sahara are well known, few atmospheric models account for mineralogy in their mineral dust descriptions (Chatziparaschos et al., 2023; Gonçalves Ageitos et al., 2023; Li et al., 2021; Menut et al., 2020; Pérez García‐Pando et al., 2016; Perlwitz et al., 2015a, b; Solomos et al., 2023).
In a previous study, Gómez Maqueo Anaya et al. (2024a) introduced the global GMINER (Nickovic et al., 2012) mineralogical dataset into the emission code of the aerosol–atmosphere model COSMO-MUSCAT. The configuration presented in that study is what is used here. GMINER provides the spatial distribution of minerals, including iron oxide minerals, based on the methodology of Claquin et al. (1999). This considers an approximate relation of soil mineral fractions to different soil types by taking into account the size distribution, the chemistry, and the color of the soil according to the FAO74 classification (FAO-UNESCO, 1974). However, this approach incurs a handful of misrepresentations when compared to in situ measurements (Li et al., 2024; Gonçalves Ageitos et al., 2023). Despite its limitations, Gonçalves Ageitos et al. (2023) found that the GMINER dataset reproduces the hematite mass content of the Sahara region fairly well (see Fig. 11a from Gonçalves Ageitos et al., 2023). In GMINER, iron oxide minerals are grouped under the name hematite, and therefore we use hematite and iron oxide interchangeably in this paper, even though it is noteworthy that the goethite mineral also contains iron oxide and interacts differently with radiation (Di Biagio et al., 2019; Formenti et al., 2014; Go et al., 2022; Wagner et al., 2012), and iron oxides may not always appear as externally mixed aerosols as represented here (Lafon et al., 2004; Kandler et al., 2009). This study combines the modeled hematite content with the lidar-retrieved intensive optical properties to investigate potential dependencies between them.
This paper has the following structure. The methodology begins with a general description of the COSMO-MUSCAT model (Sect. 2.1), followed by a general overview of the lidar system PollyXT (updated POrtabLe Lidar sYstem) (Sect. 2.2). This is succeeded by an explanation of the data selection (Sect. 2.3) and a description of the comparisons between lidar and model dust layers (Sect. 2.4). The section concludes with a brief outline of the POLIPHON method, which converts lidar measurements into dust mass concentrations (Sect. 2.5). In the results section, a case example is shown in Sect. 3.1, where the vertically resolved optical properties are shown in Sect. 3.1.1, followed by a comparison of the POLIPHON and COSMO-MUSCAT results in Sect. 3.1.2. All case studies are then presented and discussed in Sect. 3.2, the intensive optical property dependency on hematite is further explored in Sect. 3.2.1, and a separate analysis of the cases due to their size differences is shown in Sect. 3.2.2. Finally, Sect. 4 provides a summary of the paper and findings and discusses implications for future work.
2.1 COSMO-MUSCAT
COSMO-MUSCAT is a mesoscale atmospheric model system integrated by two online coupled models. COSMO, developed by the German Weather Service (DWD), is a regional forecast model (Baldauf et al., 2011), while MUSCAT is a chemistry transport model that calculates the atmospheric advective transport of aerosols driven by the forecast model (Heinold et al., 2016; Wolke et al., 2012). The meteorological data are updated every 3 h, and the model runs are reinitialized in overlapping cycles every 48 h. The use of COSMO-MUSCAT in the simulation of mineral dust for the Sahara region has been thoroughly validated (Gómez Maqueo Anaya et al., 2024a; Heinold et al., 2011; Schepanski et al., 2009, 2016, 2017; Tegen et al., 2013). COSMO-MUSCAT is set up to simulate only the transport of Saharan mineral dust including mineralogy within a domain constrained by the following coordinates: 30.75° W, 38.49° N–39.32° E, 0.38° S. The horizontal grid spacing is 0.25° (28 km), and the vertical resolution contains 40 levels, with a layer thickness of 20 m above sea level for the first layer. The thickness of the subsequent vertical layers varies according to pressure levels, varying from 200 m thickness at 1 km height to 600 m thickness at 4 km height, with a maximum altitude of 21.75 km. The output variables are given for every hour of the simulation time. These temporal and spatial resolutions imply a very big difference when compared to a fixed lidar point measurement, which is able to retrieve aerosol signals with significantly higher vertical and temporal resolutions. The difference between these resolutions has to be taken into account when analyzing the results, especially considering that the model gives average dust mass concentration values for the whole São Vicente.
The mineralogy inclusion is done by incorporating the GMINER mineralogical dataset (Nickovic et al., 2012) in the parameterization of the mineral dust aerosol atmospheric life cycle, which includes (1) dust emission following Tegen et al. (2002); (2) aerosol transport (Wolke and Knoth, 2000); and (3) aerosol removal, which includes both dry and wet deposition (Seinfeld and Pandis, 2016; Zhang et al., 2001; Berge, 1997; Jakobsen et al., 1997). Mineral dust aerosols are transported in MUSCAT in five size-segregated classes and are considered passive traces, meaning that chemical aging and chemical interaction are not considered in the simulation.
GMINER follows the Claquin et al. (1999) procedure, which extrapolates the mineralogical measurements done for soil classes (following the FAO74 classification, FAO-UNESCO, 1974) and combines them in order to establish worldwide mineral fractions with regard to its soil class in two size classes, namely clay and silt. The approach is extended in order to consider three new soil types, and in particular, it extends the hematite fraction to cover both clay and silt sizes. Both extensions result in differences of between −0.0007 and 0.08 in the hematite fraction for the studied domain, where the biggest increment of hematite fraction is found in the Sahel following the north-to-south gradient of hematite for the region (Formenti et al., 2014; Scheuvens et al., 2013). It is evident nonetheless that the uncertainties in the GMINER mineralogical dataset induce errors in calculating the hematite fraction per dust layer. From Fig. 1d in Li et al. (2024), a comparison between mineralogical datasets and measured iron oxides shows that the Claquin et al. (1999) mineralogical dataset underrepresents the mass fraction of iron oxides for northern Africa. However, the GMINER dataset by Nickovic et al. (2012) is based on Claquin et al. (1999) but specifically expands the distribution of the hematite content in such a way that it agrees with measurements in both silt and clay sizes (Kandler et al., 2009; Wagner et al., 2012). Additionally, the extra soil classifications introduced in GMINER lead to more realistic results through modeling studies (Scanza et al., 2015; Perlwitz et al., 2015a, b). Furthermore, a modeling study comparing mineralogical datasets with in situ mineralogical aerosol measurements (Gonçalves Ageitos et al., 2023) found that the GMINER dataset better represents the regional variability of emitted iron oxides from northern Africa to the Sahel.
While the GMINER dataset does not distinguish between hematite and goethite content, despite both containing iron oxides, their CRI differs between each other in the UV–Vis spectral range (Formenti et al., 2014; Go et al., 2022; Wagner et al., 2012). Chamber studies by Wagner et al. (2012) and Di Biagio et al. (2019) found that goethite has a lower absorption potential than hematite and is weakly correlated with the imaginary part of the dust CRI. Nonetheless, the modeling study by Li et al. (2024) found that considering the separation of dust iron oxide content between hematite and goethite does not significantly alter the global shortwave direct radiative effect. However, since goethite is a big part of the iron oxide content in western Africa (Formenti et al., 2014; Go et al., 2022) and due to the locality of our study region, the lack of distinction between hematite and goethite in the GMINER dataset could impact our results, as the absorption capacity may vary depending on which iron oxide mineral is present in the atmosphere.
An additional source of error arises from the modeling approach of mimicking the mineralogical soil size distribution for the aerosol size distribution, disregarding that the emission process changes the dust size distribution (Marticorena and Bergametti, 1995; Kok, 2011; Journet et al., 2014). This change in size distribution from soil to aerosol mineralogy was specifically observed in the chamber study by Wagner et al. (2012), highlighting the need to incorporate these size distribution changes for upcoming modeling efforts. Although some modeling approaches consider these size distribution changes (Li et al., 2024, 2021; Pérez García‐Pando et al., 2016; Perlwitz et al., 2015a, b; Scanza et al., 2015), they all consider the emission parameterization based on the brittle fragmentation theory of Kok (2011). At present, there is no parameterization that calculates the emission of specific minerals based on the emission scheme of Marticorena and Bergametti (1995), which is the scheme used in COSMO-MUSCAT.
Along with the GMINER mineralogical dataset, the following input files are used for the atmospheric life cycle simulation of dust: a dust activation frequency map derived from MSG-SEVIRI IR channels (Schepanski et al., 2007), soil vegetation from the Copernicus Global Land Service (Fuster et al., 2020), soil moisture from the ERA5 land hourly data (Muñoz Sabater and Copernicus Climate Change Service, 2019), an aerodynamic roughness length dataset (Prigent et al., 2005), and soil particle size distribution obtained from the SoilGrids database (Poggio et al., 2021). More information regarding the model setup can be found in Gómez Maqueo Anaya et al. (2024a).
For this study, the outputs used from the model are the vertical profiles of total and size-segregated dust mass concentrations and hematite mass concentrations, from which the hematite fraction is obtained by dividing the hematite mass concentration by the total dust mass concentration. The model results are all from above the grid cell corresponding to São Vicente, Cabo Verde, for the simulation periods of 8 August–30 September 2021 and 2 June–31 July 2022.
2.2 PollyXT
The lidar data for this study were obtained from an automated multiwavelength Raman polarization and water-vapor lidar called PollyXT (POrtabLe Lidar sYstem; the XT superscript refers to the updated version) (Althausen et al., 2009; Engelmann et al., 2016). It is part of PollyNET, which is a network of Polly systems around the world (Baars et al., 2016). This specific PollyXT has been providing continuous measurements since June 2021 at the Ocean Science Center Mindelo (OSCM) located in Mindelo, São Vicente, Cabo Verde (16°52′39.9′′ N, 24°59′42.3′′ W). The data produced from this lidar system have been used for aerosol characterization (Gebauer et al., 2024) and validation purposes (Baars et al., 2023; Gómez Maqueo Anaya et al., 2024a). The PollyXT systems emit linearly polarized light pulses at the three wavelengths of 355, 532, and 1064 nm (covering the UV–IR part of the spectrum); the receiver of the system has 15 channels: 3 are used for measuring the backscatter light at the emitted wavelengths, and 3 channels detect cross-polarized light at the 355, 532, and 1064 nm wavelengths. The additional four receiver channels at the 387, 407, 607, and 1058 nm wavelengths are used to detect Raman scattering at nighttime. Signals are measured with a vertical resolution of 7.5 m (one bin) and a temporal resolution of 30 s. The lidar observations presented here were manually analyzed, and vertical smoothing is necessary to reduce noise in the measurements and facilitate their interpretation. However, the vertical smoothing has always been applied in such a manner that the retrieved values represent particle values inside the investigated aerosol layer and do not depend on values from outside the aerosol layer. A thorough system description can be found in Gebauer et al. (2024).
The vertically resolved aerosol optical measurements resulting from the lidar signals can be categorized into two main categories: extensive optical properties and intensive optical properties. Extensive optical properties, which depend on aerosol concentration, include the particle extinction coefficients (absorption and scattering) and the particle backscattering coefficients at the 355, 532, and 1064 nm wavelengths (α355, α532, α1064; β355, β532, β1064). Intensive optical properties, which are independent of aerosol concentration, include the particle linear depolarization ratios at the 355, 532, and 1064 nm wavelengths (δ355, δ532, δ1064), the extinction to backscattering ratio (or lidar ratio) at the UV–Vis wavelengths (S355, S532), and the possibility of obtaining the IR lidar ratio (S1064). The following Ångström exponents are available: backscatter related, extinction related, and lidar ratio related for the 355 to 532 nm and the 532 to 1064 nm wavelength ranges (ÅE, ÅE, ÅE, ÅE, ÅE, ÅE). Uncertainties associated with most of these measurements can be found in Table 1 in Hofer et al. (2017) and are further discussed in Freudenthaler et al. (2009), Baars et al. (2012, 2016), and Engelmann et al. (2016). Intensive optical properties commonly used for dust characterization as the single-scattering albedo or the mass absorption coefficient (Di Biagio et al., 2019; Zhang et al., 2024) cannot be directly obtained from lidar measurements.
The conversion of received signals into optical measurements can generally be done by following one of two methods: the Klett method (Klett, 1985) or a combined Raman elastic-backscatter approach. The Klett method requires an initial estimate of the lidar ratio for the retrievals. In contrast, the Raman method does not require this initial guess, as it allows for the independent determination of the extinction and backscatter coefficients (Ansmann et al., 1992). Since our focus is on independent lidar ratio measurements, we use only the Raman methodology. However, Raman lidar applications are limited to nighttime measurements because of the necessary inelastic-backscattering signal that can only be detected when the strong daylight background is not there (Ansmann et al., 1992).
Intensive optical properties are employed for aerosol characterization. Lidar ratios and particle linear depolarization ratios are dependent on particle size, shape, and composition (Hofer et al., 2020; Huang et al., 2023; Miffre et al., 2023; Saito and Yang, 2021; Schuster et al., 2012; Wandinger et al., 2023; Veselovskii et al., 2020). While the Ångström exponents are initially believed to be primarily related to particle size (Ångström, 1929), laboratory and observational studies suggest a substantial dependence of the backscatter-related Ångström exponent on composition, especially when changes in composition lead to changes in the imaginary part of the CRI at UV–Vis wavelengths (Miffre et al., 2020; Veselovskii et al., 2020). Under varying conditions, changes in these dependencies affect the optical properties differently, portraying nonlinear relationships between particle physical characteristics and their optical properties.
2.3 Data selection
The selection of aerosol layers intended to study the relation of lidar-measured properties and modeled hematite content focuses on identifying cases where mineral dust was the dominant aerosol. This selection process involves three main, consecutive steps: (1) utilizing Aerosol Robotic Network (AERONET; Holben et al., 1998) measurements to identify potential dust layers, (2) analyzing available PollyXT measurements to confirm these dust layers, and (3) reviewing COSMO-MUSCAT simulation output for the identified cases. An overview of this selection process is illustrated by Fig. 1.
The selection process is constrained by two specific time periods from NH summer measurement campaigns centered around Cabo Verde. JATAC, which took place from June to September in both 2021 and 2022, used ground-based measurements, including PollyXT, aircraft, and balloon measurements, to validate data provided by ESA's Aeolus satellite. We decided to focus on these campaign periods for two main reasons. First, in the spirit of the campaigns' objectives, the data were constantly quality controlled and cross-checked between measurement devices. Second, the summer months are ideal due to the seasonality of Saharan dust transport towards the Atlantic Ocean. During these months, dust travels the highest in the atmosphere (Schepanski et al., 2009) with less interference from other aerosols. Given the data availability of the PollyXT lidar, we narrowed our focus down to the following periods for identifying dust-laden aerosol layers: August–September 2021 and June–July 2022.
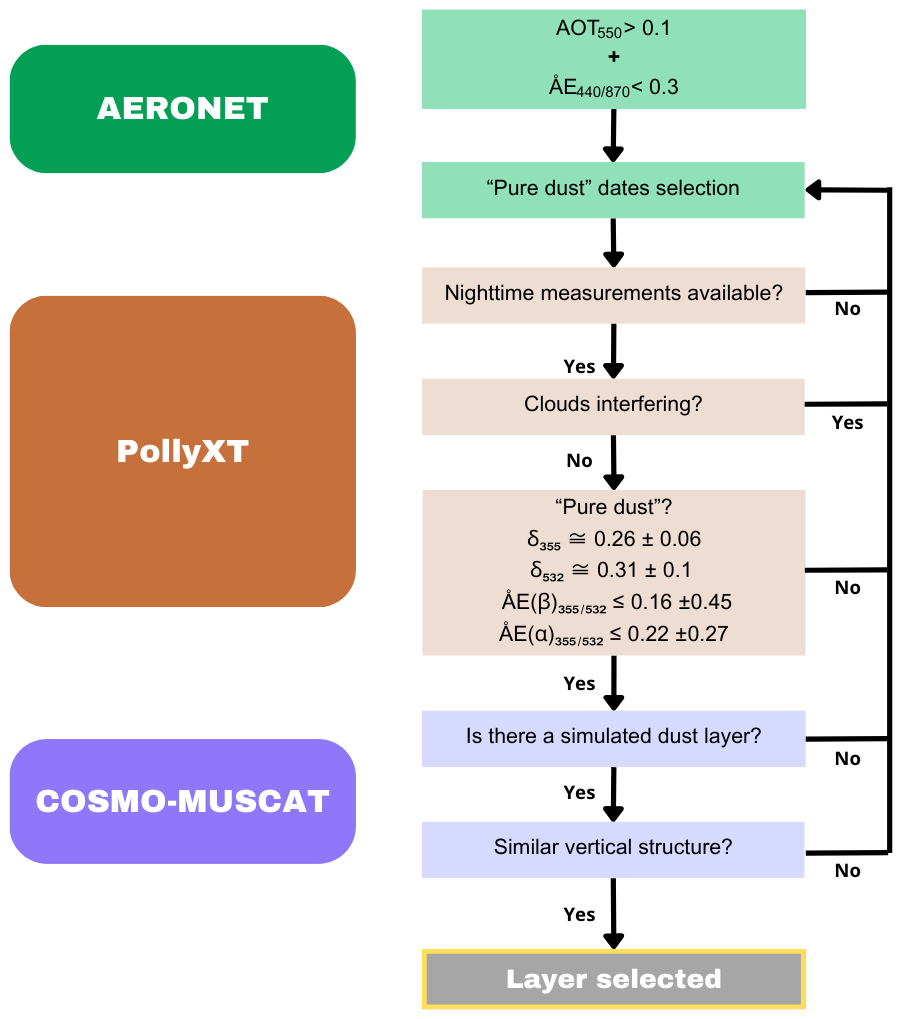
Figure 1Flowchart of the case selection process. Dust layers are selected through three main steps. The first step is depicted with green colors and relates to date filtering through AERONET measurements and the so-called “pure dust” optical measurement values (Ansmann et al., 2019). The second step is through PollyXT measurements, shown in the figure in orange colors. The first two filters are related to the data availability and whether clouds interfere with the measurements, while the last filter is related to the lidar-retrieved optical measurements (Tesche et al., 2011). The third step is pictured in violet colors and is related to the simulation results from COSMO-MUSCAT. The questions to be answered in this section are related to whether the dust layer is simulated in a way similar to the lidar vertical structure. Abbreviations: aerosol optical thickness at 550 nm wavelength (AOT550), extinction-related Ångström exponent for the 440–870 nm wavelengths (ÅE), particle linear depolarization ratio at the 355 nm wavelength (δ355), particle linear depolarization ratio at the 532 nm wavelength (δ532), backscatter-related Ångström exponents for the 355–532 nm wavelengths (ÅE), and extinction-related Ångström exponent for the 355–532 nm wavelengths (ÅE).
Within the selected time frame, the next step involved identifying days with dust-dominated aerosol layers. As a first approximation, the total column optical measurements recorded by the AERONET sun photometer in Mindelo, Cabo Verde, were used. The AERONET level 2.0 (quality assured and cloud screened) dataset was then filtered based on the following “pure dust” criteria: aerosol optical thickness for the 550 nm wavelength (AOT550) >0.1 and the extinction-related Ångström exponent for the 440–870 nm wavelengths (ÅE) <0.3 (Ansmann et al., 2019). As a result of the filtering process, only the dates meeting the pure dust criteria remained for the subsequent steps of the selection process.
The second step of the selection process involved analyzing PollyXT data. The initial task was to verify whether the dates that passed the AERONET-related filters included nighttime lidar measurements. The next step was the manual cloud-screening procedure, as the presence of clouds can influence all particle optical properties. If retrievals can be conducted without cloud interference, or if specific time periods minimize the impact of clouds, the selection process proceeded with those suitable times for dust retrievals. When clouds are located below the aerosol layer, they interfere with lidar retrievals targeting the aerosol plume above. This is because multiple scattering within clouds prevents accurate measurement of the aerosol plume. Conversely, if clouds are above the aerosol layer, they do not necessarily contaminate aerosol signals, provided there is sufficient separation between the clouds and the aerosol layer. This separation needs to be sufficiently distinct to allow for Raman elastic-backscatter retrievals using a reference height in that intermediate space.
From this point forward, the selection of pure dust days and the nighttime hours, from which the vertical optical properties of dust are retrieved from the PollyXT measurements, has been made. Some pure dust days were found to have two distinct dust aerosol layers. Each layer is considered an individual case study because such layering could be due to atmospheric inversions or dust originating from different source regions with their own wind pattern, potentially affecting the modeled hematite content between layers. The subsequent step involves selecting dust layers that meet the pure dust criteria based on lidar optical measurements, excluding considerations for lidar ratios. The criteria, based on Tesche et al. (2011), are as follows: , , ÅE(, and ÅE(, as illustrated in the last subsection of the PollyXT step in Fig. 1.
The third step of the selection process takes into account the COSMO-MUSCAT modeling results. The first criterion is whether the model simulates the dust layer(s) for the same date and time at which the dust layer(s) were observed by PollyXT. If this criterion is met, the next step is to assess whether the model reproduces a similar vertical structure. A dust layer is selected for this study if the model simulates both the dust layer(s) at the corresponding dates and times and a comparable vertical structure. Between 19 August 2021 and 8 July 2022, a total of 22 dust layer cases passed the data selection filters.
2.4 Layer comparison
The comparison between the vertically resolved optical property, the lidar ratio at both the 355 and the 532 nm wavelengths, and the modeled hematite fraction is illustrated in Fig. 2 for a hypothetical case based on lidar and model data. This comparison is done for each dust layer, where a mean value is calculated based on its own vertical structure. Specifically, the optical property means are calculated by taking into account the thicknesses of each dust layer, as retrieved by PollyXT, while the hematite fraction means are calculated based on the thickness of each COSMO-MUSCAT-simulated dust layer. For instance, for the two dust layers depicted in Fig. 2, one mean lidar ratio value at 355 nm and another at 532 nm are calculated for the dust layer in between 1.4 and 3 km. These values are then compared to the mean hematite fraction (hematite mass concentration divided by the total dust mass concentration) for the simulated dust layer in between 0.9 and 2.8 km. For the lofted layer, the lidar ratio means are computed for the range between 3.7 and 5.2 km and are compared with the modeled mean hematite fraction in the range of 3 to 5.3 km.
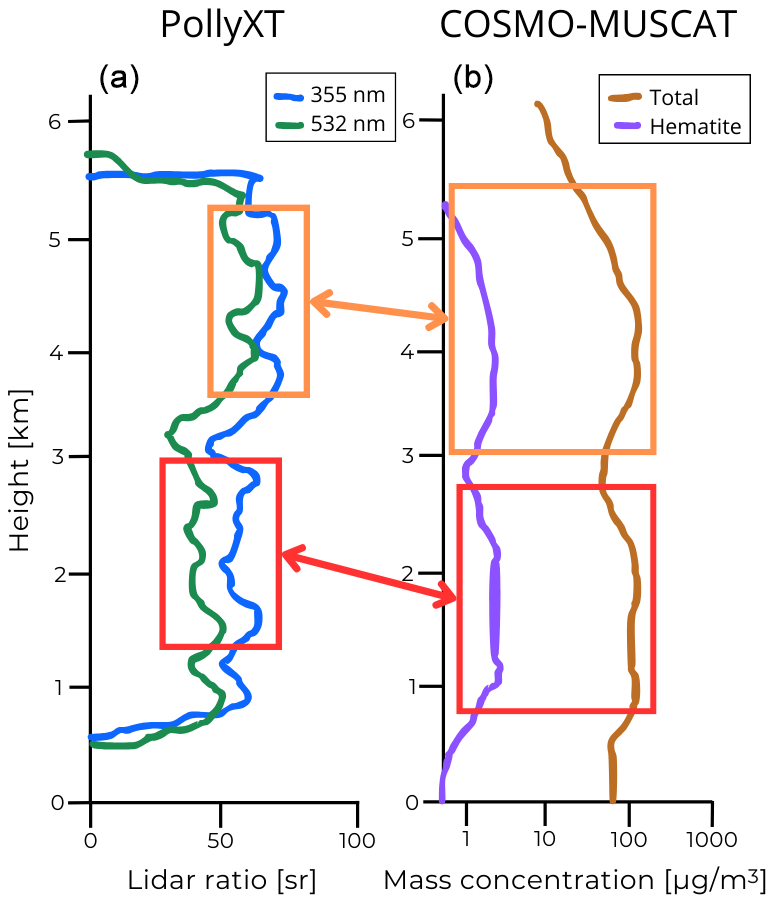
Figure 2Sketch illustrating how the dust layers are compared between the PollyXT results and the COSMO-MUSCAT-simulated dust layers. On the left-hand side, the lidar ratio vertical structure is sketched for the 355 nm (blue) and 532 nm (green) wavelengths. On the right-hand side, the vertical structures of the modeled total dust mass concentration (brown) and hematite mass concentration (purple) are sketched. The boxes represent the domain of one dust layer, and the arrows represent the relation between the measurements. The sketch represents dust-related vertically distributed properties above Mindelo, São Vicente, Cabo Verde.
2.5 POLIPHON
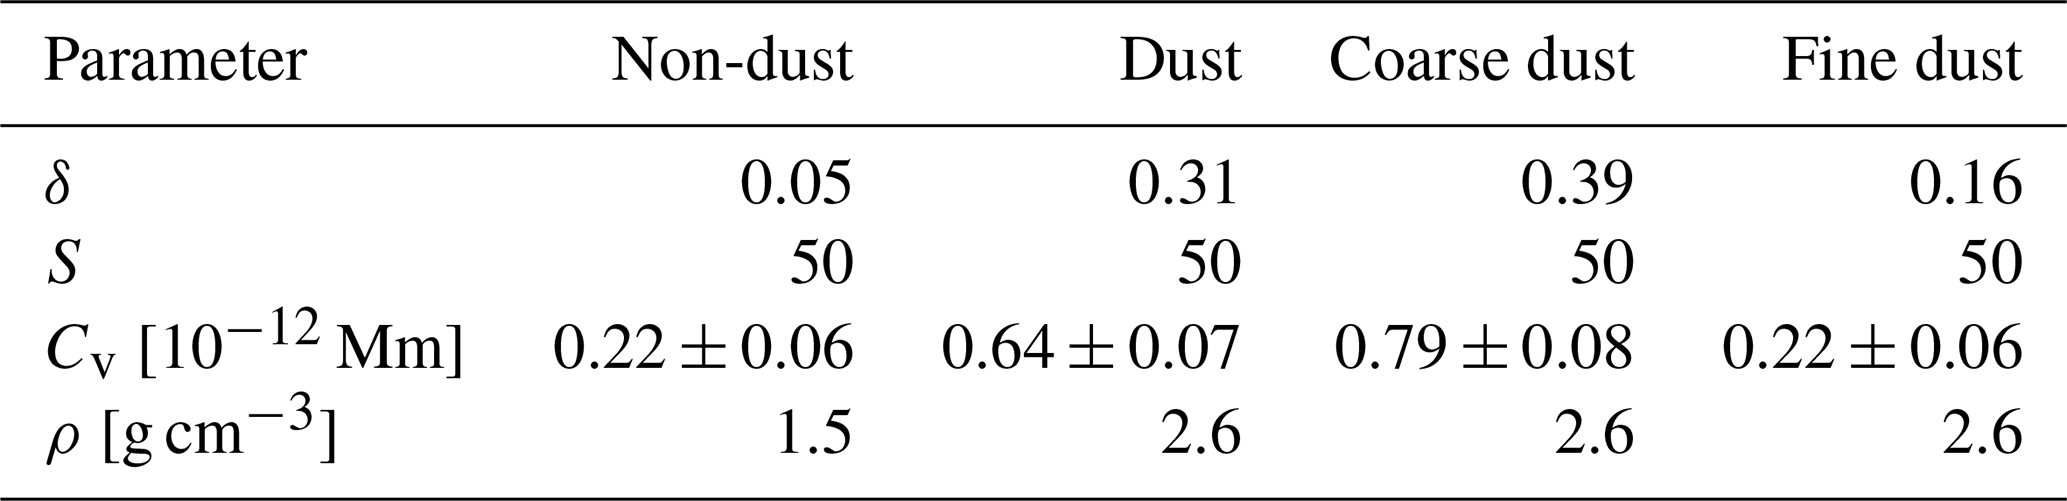
The two-step POLIPHON method (Mamouri and Ansmann, 2014, 2017) translates lidar-retrieved optical properties into mass concentrations of coarse-dust (particle diameter (D) >1 µm), fine-dust (D<1 µm), and non-dust concentrations. This separation is achieved by utilizing the lidar-retrieved δ and β values, AERONET-derived conversion factors, and assumed values for S and density. The method involves the separation of the measured β values using the retrieved δ values to estimate α values based on assumed S values and afterwards converting the calculated particle extinction coefficients into mass concentrations by applying the AERONET-derived conversion factors and representative densities (ρ). The specific values used for the dust layers analyzed in this study are provided in Table 1. The two-step POLIPHON processes are described in detail below.
-
Separation of particle backscatter coefficients. This procedure consists of two processes. Initially, a broad separation between coarse-dust aerosols and the mixture of fine-dust and non-dust aerosols is performed based on δ values (Fig. 3b). Defined threshold values of δ are compared to the lidar-retrieved δ values to achieve this separation. For this first step, the δ values for coarse dust, as listed in Table 1, are applied together with the fine-dust and non-dust mixture δ values. In this study, a δ value of 0.12 is used for the mixture of fine dust and non-dust, as the analyzed dust layers are located above the marine boundary layer, where non-dust aerosols are primarily of a continental nature (Mamouri and Ansmann, 2017).
Separation of fine-dust aerosols from non-dust aerosols. The second process separates fine-dust from non-dust aerosols using δ threshold values for these categories, as shown in Table 1. Ultimately, the values of β for coarse dust, fine dust, and non-dust are determined. Then, δ threshold values used for the separation of non-dust and dust categories are derived from extensive lidar measurements (Mamouri and Ansmann, 2014), while the coarse- and fine-dust δ values are obtained from laboratory studies (Sakai et al., 2010, and Järvinen et al., 2016, respectively). Additionally, the δ values assigned to the fine-dust and non-dust mixture depend on the nature of the non-dust aerosol and is determined iteratively by comparing the results it yields with lidar measurements, as detailed in Mamouri and Ansmann (2014, 2017).
-
Calculation of particle extinction coefficients. Once the backscatter coefficients are separated, α is calculated by applying appropriate lidar ratio values for each fraction. The same S values are assumed for dust-related fractions, while the non-dust value is based on the likelihood of the aerosol origin. The estimates are based on regional data and are derived from an extensive collection of previous lidar observations (Mamouri and Ansmann, 2014, 2017). The extinction coefficient is obtained by multiplying the separated β by its corresponding S values.
-
Conversion to mass concentrations. The extinction coefficients are then converted into volume concentrations using specific conversion factors, followed by the transformation into mass concentrations through the application of appropriate density values. These conversion factors are derived from AERONET aerosol climatologies, while the representative densities are based on previous aerosol studies and the assumption of homogeneity within dust and non-dust categories (Ansmann et al., 2012, 2019).
The POLIPHON method incorporates several assumptions, the most notable being the uniformity of optical properties across all mineral dust particles, disregarding heterogeneity due to different source regions. However, a significant advantage of this approach is that it does not require a dust particle shape model for data analysis, relying solely on the measured optical properties. Nevertheless, since the method involves a conversion factor based on AERONET climatologies, it is important to note that in order for AERONET to derive aerosol mass fractions, a spheroid-shaped model is used (Dubovik et al., 2006). The two-step POLIPHON method has been validated, demonstrating good agreement between airborne measurements and lidar-retrieved, two-step POLIPHON-derived fine and coarse modes of dust mass concentrations in Barbados during the SALTRACE campaign (Haarig et al., 2019).
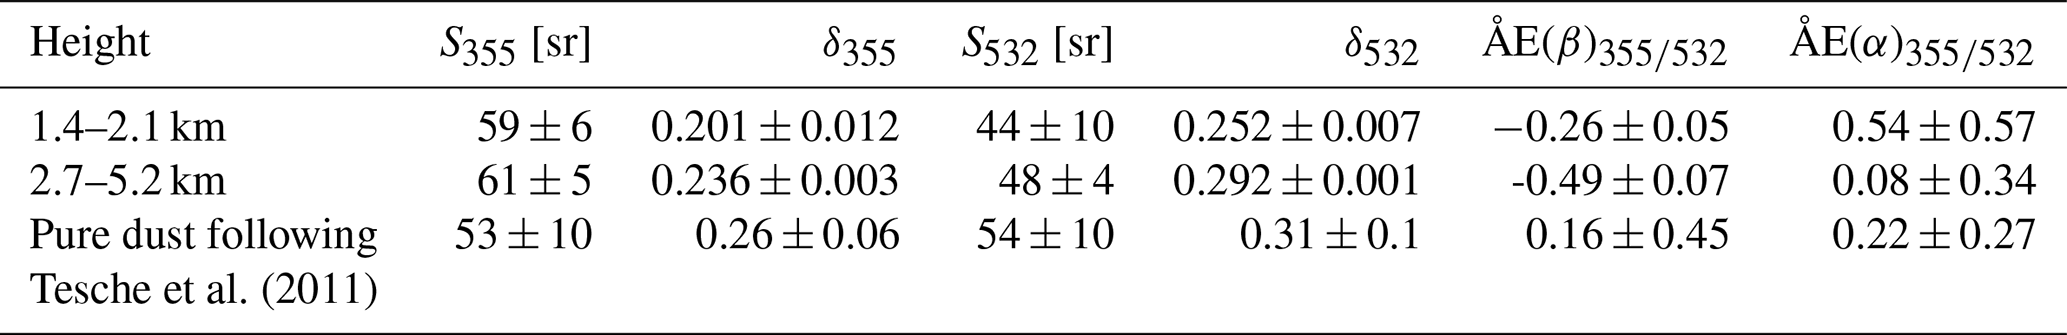
Table 1Values used for implementing the two-step POLIPHON method. Values are obtained from Ansmann et al. (2019, 2012) and Mamouri and Ansmann (2017). δ is the particle depolarization ratio, S is the lidar ratio, Cv is the volume conversion factor, and ρ represents density. Units are in square brackets.
Two-step POLIPHON-derived data are employed in this study as an analytical tool with two key mass concentration ratios serving specific purposes. First, the ratio of non-dust to dust mass concentration is used to color-code each dust layer case and to quantify relationships between different case studies. Second, the fine- to coarse-dust mass concentration ratio is used to categorize the case studies into three distinct groups: (1) dust layers with a higher portion of fine-dust mass concentrations (i.e., fine/coarse >11 %), (2) dust layers with an intermediate proportion of fine-dust mass concentrations (i.e., 9 % < fine/coarse < 11 %), and (3) dust layers with a lower portion of fine-dust mass concentrations (i.e., fine/coarse < 9 %). It is important to emphasize that this classification is specific to the analyzed cases and does not represent a universal standard for defining “high” fine- to coarse-dust mass concentration. Moreover, considering the uncertainties associated with mass concentration calculations, 20 %–30 % for total mass concentration, 40 %–60 % for the fine-mode mass concentration, and 25 %–35 % for the coarse-mode mass concentration (Ansmann et al., 2019), the proposed classification falls outside the uncertainty margin. Therefore, these divisions should be regarded as exploratory and artificial, intended solely for the purposes of this study. The primary objective is to investigate a potential method for disentangling physical parameters influencing intensive optical properties, particularly in light of the evident impact of dust particle size on the lidar ratio, as shown in Fig. 5 in Wandinger et al. (2023) and Fig. 15 in Zhang et al. (2024).
Additionally, to support the validation of model results, the fine- to coarse-dust mass concentration ratio derived from POLIPHON is compared with the corresponding ratio from COSMO-MUSCAT for each dust layer. This comparison enhances the reliability of the analysis by providing a more robust assessment of model- and lidar-derived data agreement. The described products and their application are illustrated in Fig. 3.
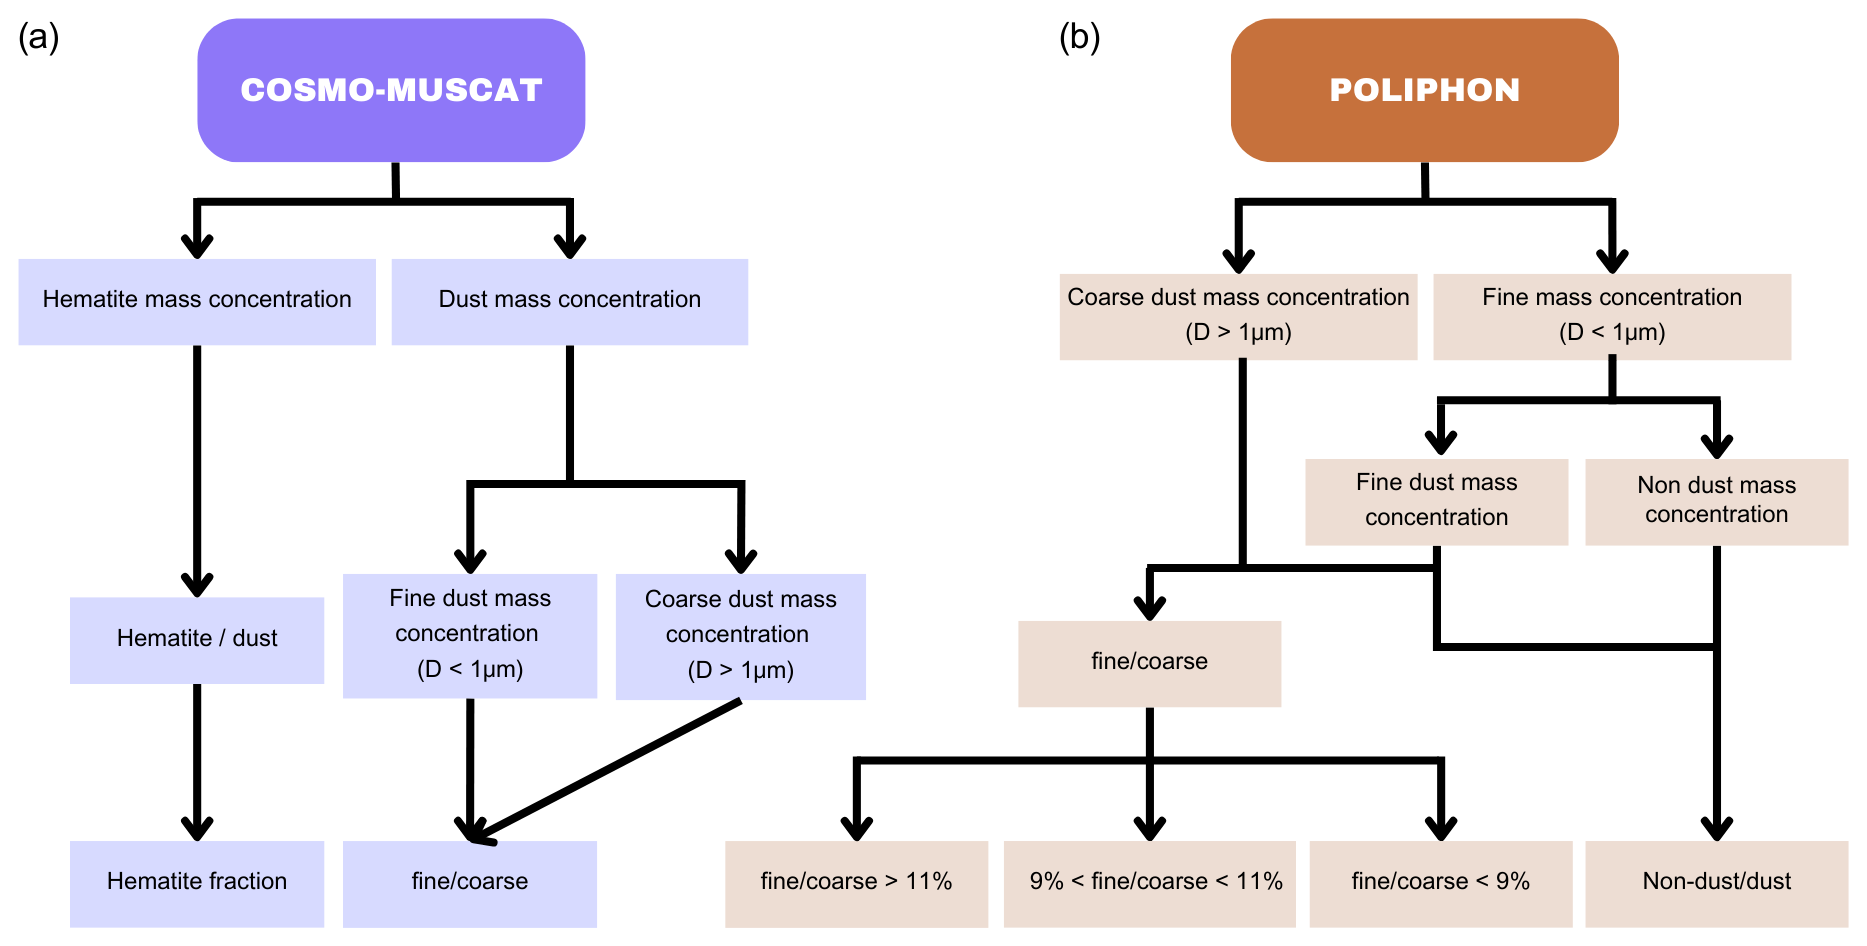
Figure 3Process flow illustrating two main methods and their corresponding data outputs used in the study. (a) Violet colors represent the output from COSMO-MUSCAT. The fine- to coarse-dust mass concentration ratio and hematite fraction are the model output products used for the results. The particle diameter threshold for distinguishing between fine- and coarse-dust mass concentration is set at 1 µm to align with the POLIPHON classification. (b) The POLIPHON output flow is shown in orange colors. The products from the POLIPHON used for the results are the fine- to coarse-dust and the non-dust to dust mass concentration ratios.
This section is structured as follows. First, lidar measurements from 24 August 2021 are shown and described. On this day, two distinct dust layers are identified and analyzed as separate case studies. The dust layers are shown after applying the two-step POLIPHON method, and the results are compared with the corresponding COSMO-MUSCAT results for the same day and time. Next, the bulk of case studies is presented, beginning with a comparison of the fine to coarse ratios derived from COSMO-MUSCAT and POLIPHON. This is followed by an analysis of the relationship between hematite fraction and lidar ratio, the particle linear depolarization ratio at both 355 and 532 nm, and backscatter- and extinction-related Ångström exponents. Finally, the cases are analyzed separately according to size, and the hematite fractions are compared with the aforementioned lidar-measured optical properties.
3.1 Single case study – 24 August 2021
3.1.1 Observed dust optical properties
Figure 4 shows the vertical distribution of optical properties retrieved from PollyXT on 24 August 2021 between 02:45 and 05:27 UTC. The vertical profiles show two aerosol layers. In order to accurately determine their heights, a lower vertical smoothing is used to enhance the distinction between aerosol layers and air layers with less particle contents. The heights of the layers are then set using a vertical smoothing of 22.5 m. By cross-checking the measured optical properties against the values signaling for dust layers (Tesche et al., 2011) in Cabo Verde (step 2 of Fig. 1's flowchart), it is confirmed that the measurements for this day correspond to two distinct dust layers, each to be regarded as a separate case study (see Table 2). The vertical smoothing used to calculate their optical properties is different for the layers to balance the number of independent measurements and the length of their standard variation. For the lower layer near the surface, a vertical smoothing of 232.5 m is applied, while for the upper layer, a vertical smoothing of 577.5 m is used, the profiles of which are illustrated in Fig. 4. It is noteworthy that the particle backscatter coefficient shows a wavelength dependence, with larger β values at 532 nm than at 355 nm for the upper dust layer but not for the lower layer. The mean values of the particle extinction coefficient fall within their measurement error margins when comparing 355 to 532 nm wavelengths across both dust layers, implying wavelength independence. Such behavior is not uncommon for Saharan dust (Veselovskii et al., 2016, 2020). Since our study focuses on the optical properties of dust independent of the amount of dust, with a particular interest in backscattering characteristics, the emphasis is on the intensive optical properties. Table 2 provides the mean values of these intensive optical properties for each dust layer together with the reference pure dust values of Tesche et al. (2011).
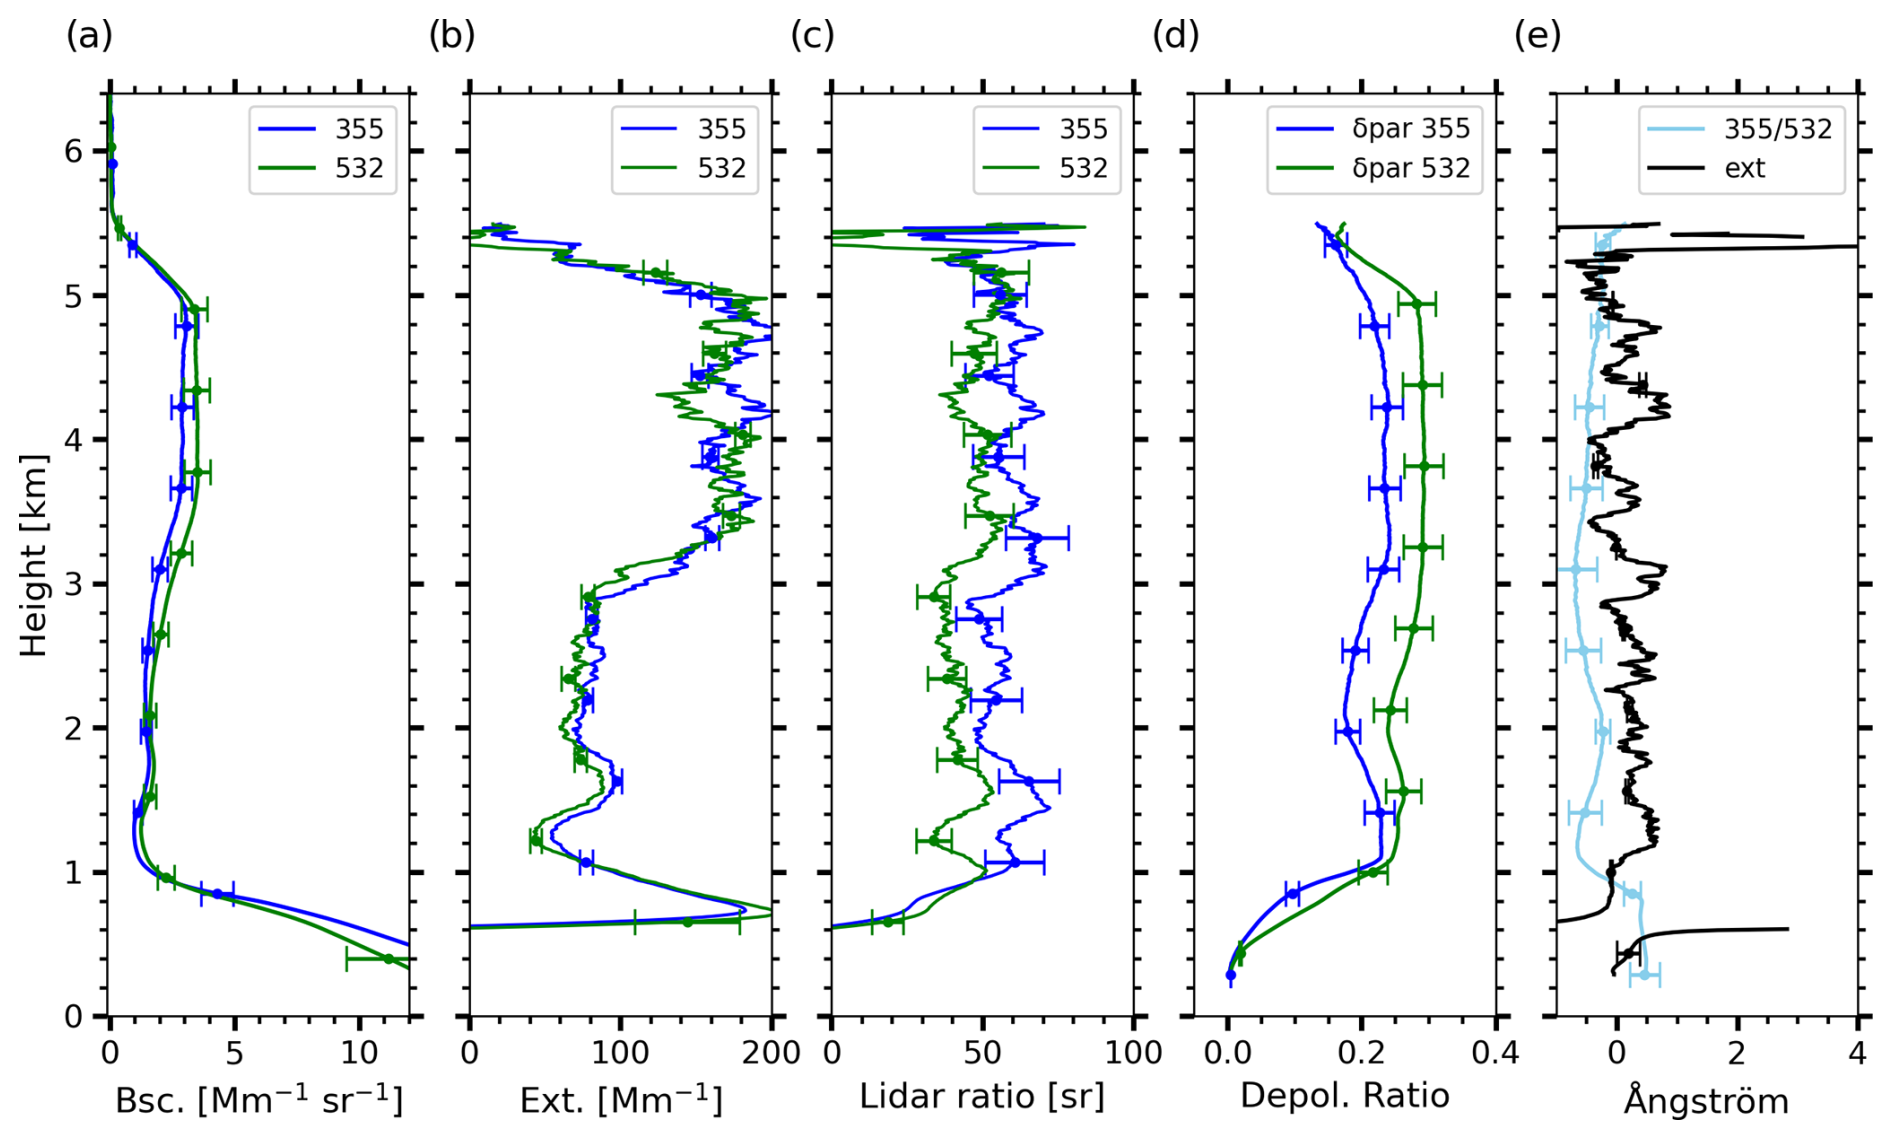
Figure 4Average lidar profiles measured on 24 August 2021, 02:45–05:27 UTC. The vertical profiles are vertically smoothed before calculation with a resolution of 577.5 m. For plots (a)–(d), blue represents measurements at the 355 nm wavelength, and green represents measurements at the 532 nm wavelength. The optical properties shown are the particle backscatter coefficient (Bsc. (β)) (a), particle extinction coefficient (Ext. (α)) (b), lidar ratio (S) (c), and particle linear depolarization ratio (Depol. ratio (δ)) (d). For the Ångström exponent (ÅE) plot (e), both ÅEs shown are calculated for the 355–532 nm wavelengths, with the backscatter-related ÅE shown in light blue and the extinction-related ÅE shown in black.
Table 2Mean values of lidar ratios (S), particle linear depolarization ratios (δ), backscatter-related Ångström exponent (ÅE(β)), and extinction-related Ångström exponent (ÅE(α)) for the 355 and 532 nm wavelengths for two dust layers measured on 24 August 2021, 02:45–05:27 UTC. Reference pure dust values from Tesche et al. (2011) are shown in the last row.
The mean values of the intensive optical properties reveal that the lidar ratios at 355 nm fall within the upper half of the pure dust tolerance range, whereas the lidar ratios at 532 nm are in the lower half of this range. For the particle linear depolarization ratios, the values at 355 nm are in the lower half of the pure dust tolerance range, while the values at 532 nm are within the inner half of the pure dust tolerance range. The backscatter-related Ångström exponent values are either on the lower end (lower layer) or below the lower limit of the specified range (upper layer), whereas the extinction-related Ångström exponent values are either above the upper limit of the pure dust range (upper layer) or on the lower limit of the specified range (lower layer). Values close to zero for both ÅE(β) and ÅE(α) are related to the presence of large particles. Negative values are not unusual for Saharan dust (Haarig et al., 2022; Veselovskii et al., 2016, 2020), with measurements showing ÅE(β) ranging from −0.55 to 0.5 and ÅE(α) ranging from −0.2 to 0.2. Negative ÅE(β) values can result from a spectral dependence on changes in the imaginary part of the dust CRI at UV–Vis wavelengths. A sensitivity study performed in Veselovskii et al. (2020) shows that ÅE(β) is more affected than ÅE(α) by changes in the imaginary CRI part at the UV–Vis range.
In the present case, the increase in S values, along with the changes in ÅE(β) between lower and upper layers, suggest compositional differences, likely the presence of a mineral such as hematite in the lower layer, which enhances absorption by increasing the imaginary part of the CRI, driving the backscattering coefficient to decrease in a spectral-dependent manner (Chang et al., 2025; De Leeuw and Lamberts, 1987; Wandinger et al., 2023). The fact that ÅE(β) in the lower layer is closer to zero supports the hypothesis of higher hematite content in this layer. While the S differences fall within the uncertainty range, the contrast in ÅE(β) is more pronounced and may serve as a more sensitive indicator. To better understand the influence of hematite on the spectral backscattering behavior, and given the limitations of single-layer interpretation, we extend our analysis to a broader set of dust cases. This approach enables a more robust assessment of the role of mineral composition, particularly iron oxides, in shaping lidar-derived intensive optical properties.
3.1.2 POLIPHON-derived vs. COSMO-MUSCAT dust concentrations
The results from applying the two-step POLIPHON method to measurements from 24 August 2021, alongside COSMO-MUSCAT simulation results for the same day at a similar time range (03:00–06:00 UTC), are presented in Fig. 5. The COSMO-MUSCAT simulation results depict a two-layer dust structure; however, the altitudes of these layers do not align precisely with those observed. For comparison purposes, the COSMO-MUSCAT dust layers are defined as follows: the lower layer extends from 0.8 to 2.7 km, while the upper layer ranges from 3 to 4.8 km.
According to the POLIPHON results, the average dust mass concentration in the lower layer is 118 µg m−3, while the upper layer reaches 270 µg m−3. The COSMO-MUSCAT simulation estimates an average dust mass concentration of 179 µg m−3 for the lower layer and 97 µg m−3 for the upper layer. This indicates that the model overestimates the dust concentration in the lower layer by a factor of 1.5 and underestimates it in the upper layer by a factor of 0.35. Despite these discrepancies, the model fits well to the total measured dust mass load. This can be seen in the good agreement between AERONET and COSMO-MUSCAT total column AOT for the Mindelo station on 23 August 2021 at 19:00 UTC, where the model calculates a total column AOT of 0.84, while the AERONET measurements show an AOT of 0.76 (Fig A1).
Regarding the fine- to coarse-dust ratio, POLIPHON-derived values indicate an average of 0.15 for the lower layer and 0.08 for the upper layer. COSMO-MUSCAT simulates a ratio of 0.1 for the lower layer and 0.12 for the upper layer. The model simulates coarser particles for the layer closer to the ground, which may explain the higher modeled dust mass concentration for that layer. Conversely, the model estimates a greater fraction of fine dust in the upper layer compared to observations, which may contribute to the underestimation of mass concentration at those altitudes. Despite these discrepancies, the model effectively represents the two-layer dust structure, and the two datasets are sufficiently well related, as the mass concentrations are of the same order of magnitude. This level of agreement allows for a meaningful combined analysis, particularly since the focus of this study is on mass-independent properties. It is noteworthy that the discrepancies may also stem from the model averaging the dust plumes across the entire island, making it inherently unable to capture the exact same vertical structure that is observed by lidar measurements.
Furthermore, the average hematite fraction per dust layer is 0.009 for the lower layer and 0.011 for the upper layer, indicating only a slight difference between the two. This small difference does not support the expectation that the lower layer contains more hematite, as previously considered based on ÅE(β). Additionally, lidar ratio values are nearly identical between layers, making it difficult to attribute any observed optical differences solely to hematite content. However, the more distinct increase in ÅE(β) remains notable and may reflect other influencing factors, such as differences in particle size distribution.
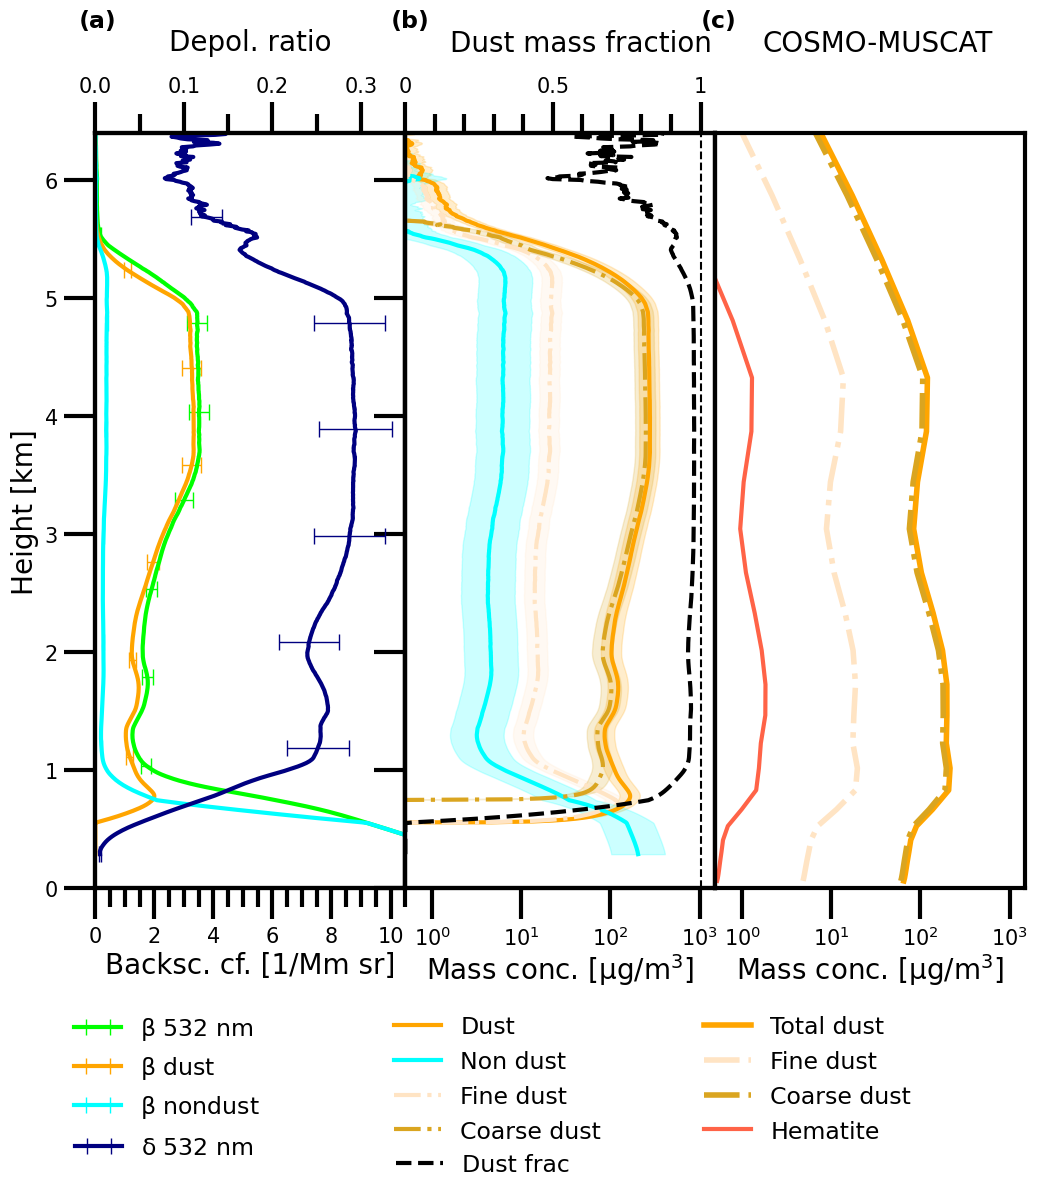
Figure 5Vertical profiles for the POLIPHON-derived products from lidar-measured optical properties on 24 August 2021 at 02:45–05:27 UTC and COSMO-MUSCAT simulation results above Mindelo. The 532 nm particle backscatter coefficient (a, light green) and the particle linear depolarization ratio (a, dark blue) are the input to obtain the separated dust and non-dust profiles in (a) and (b). The POLIPHON products are the derived 532 nm dust backscatter coefficient (a, orange), the non-dust backscatter coefficient (a, light blue), the dust mass concentration (b, orange), the coarse-dust mass concentration (b, gold), the fine-dust mass concentration (b, bisque), the non-dust mass concentration (b, light blue), and the dust mass fraction (b, black, ratio of the dust to the total particle mass concentration; dashed black vertical line indicates a dust mass fraction of 1). Vertical profiles of simulated mineral dust mass concentrations from the COSMO-MUSCAT model (c). The vertical profile corresponds to values calculated for the grid cell, where Mindelo, Cabo Verde, is found in the model for 24 August 2021 at 03:00–06:00 UTC. Total dust mass concentration (c, orange), coarse-dust mass concentration (c, gold), fine-dust mass concentration (c, bisque), and hematite mass concentration (c, red) are shown.
3.2 Multiple case studies
Figure 6 shows the fine- to coarse-dust mass concentration ratios obtained from POLIPHON compared to the COSMO-MUSCAT simulation results for 22 case studies. The results show that the ratios are of the same order of magnitude, and they all fall within the range of the 2-to-1 and 1-to-2 lines. There is a notable tendency for COSMO-MUSCAT to lean towards the 1-to-2 comparison, indicating a slight overestimation of the fine portion of the dust mass concentration.
Studies by Adebiyi and Kok (2020) and Kok et al. (2017) compared ensembles of atmospheric models with dust aerosol in situ measurements and found that atmospheric models tend to overpredict the fine-dust portion, while underestimating the coarse-dust portion. This over- and underprediction has impacts on the calculation of the global direct radiative effect. Fine dust significantly contributes to extinction at 550 nm, with only a few percent of that extinction due to absorption, whereas coarse dust absorbs a larger fraction of the extinguished radiation at 550 nm (Adebiyi et al., 2023).
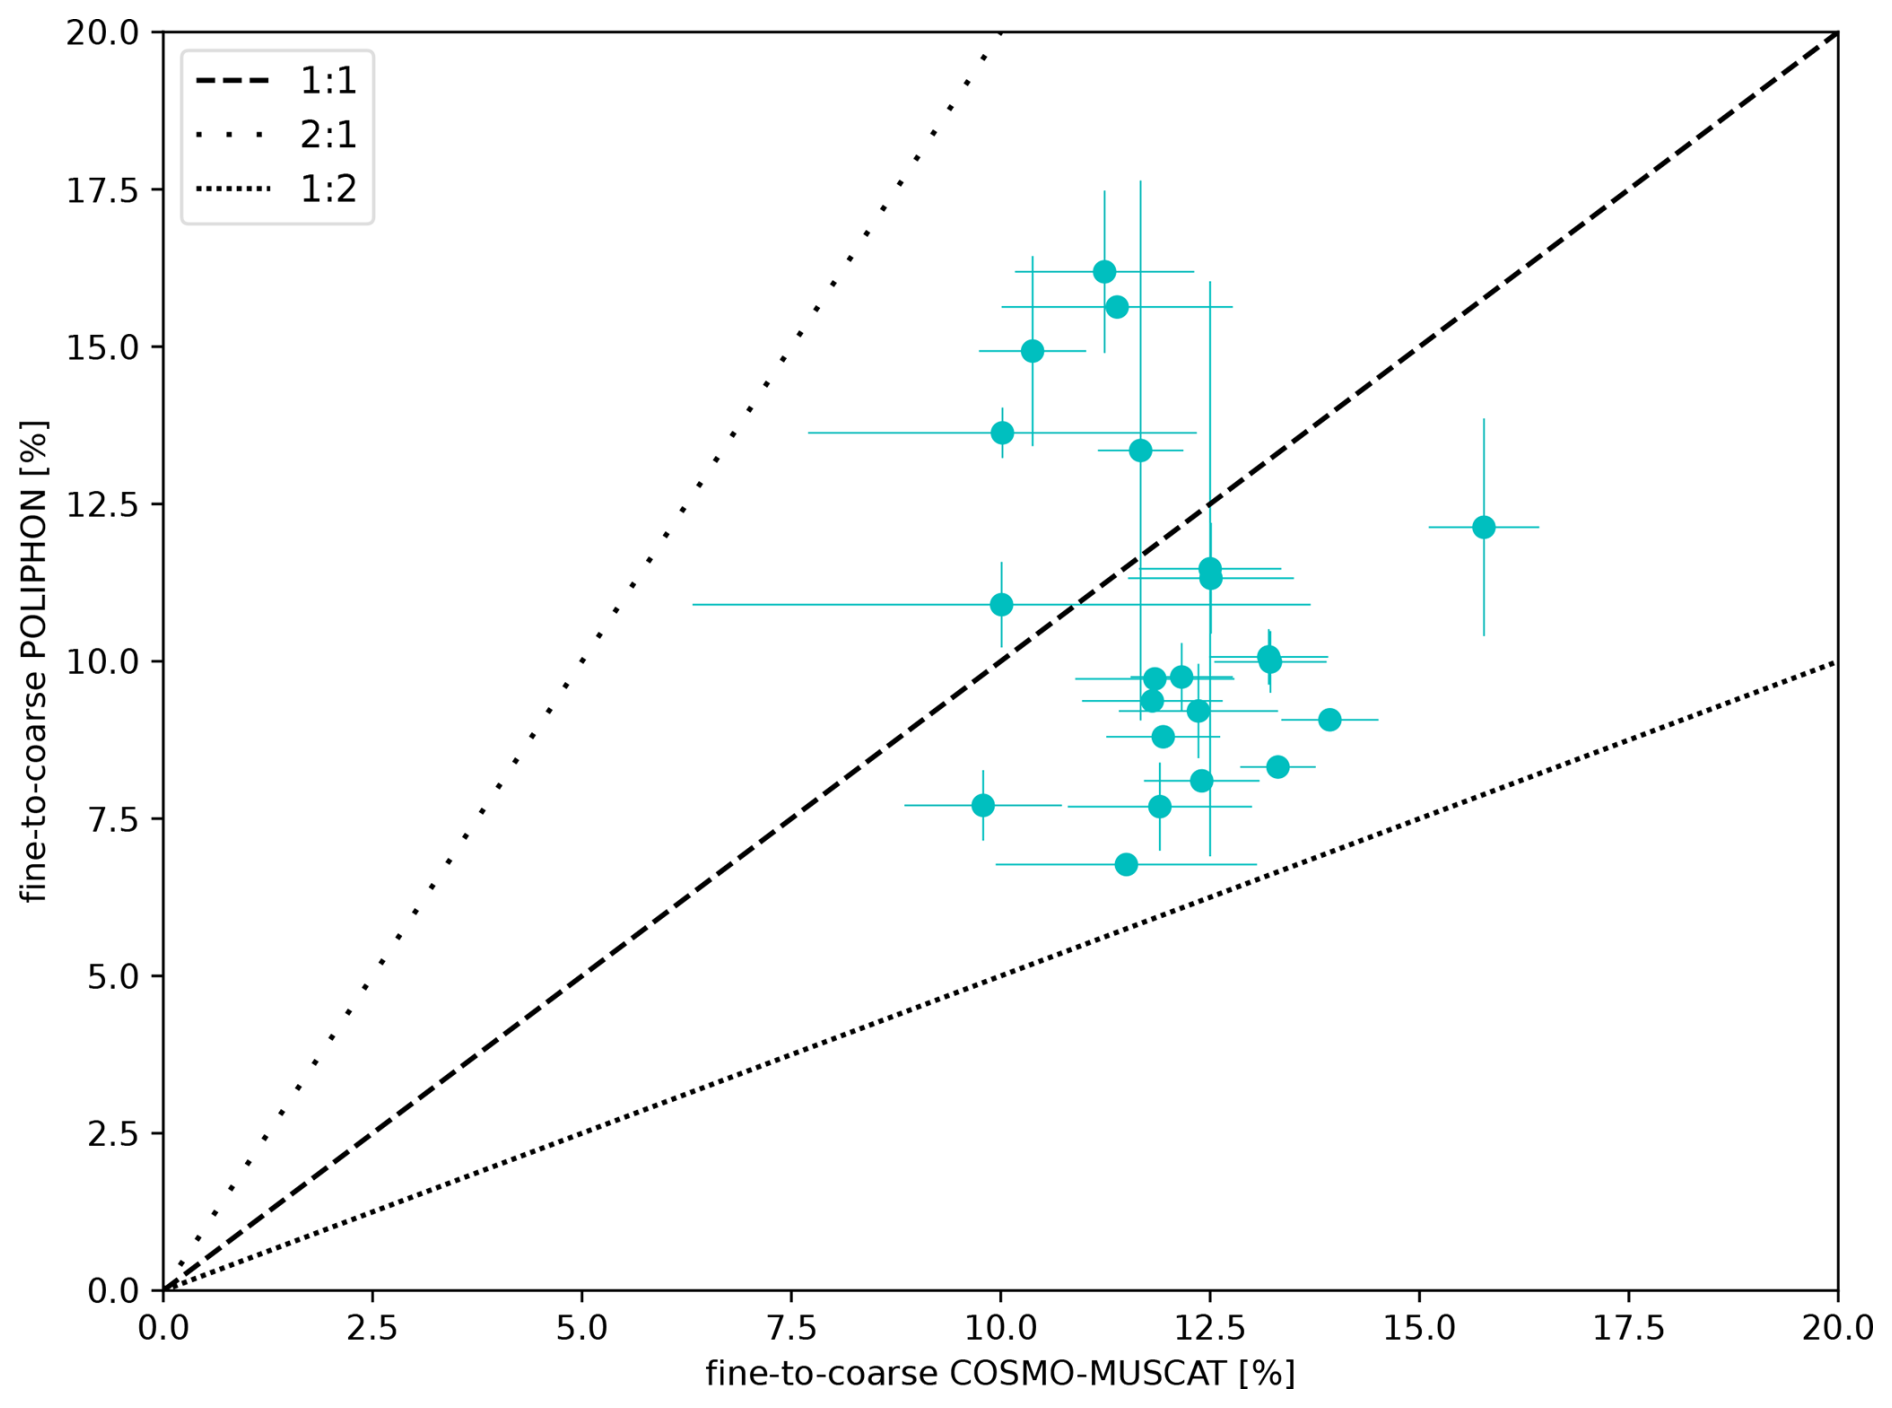
Figure 6Fine- to coarse-dust mass concentration comparison between COSMO-MUSCAT and POLIPHON. The dashed line represents the 1:1, line and the dotted lines represent the 2:1 and 1:2 lines, as indicated in the legend. The error bars represent the standard deviation of the ratio per dust layer.
To further validate the model results, a comparison of the aerosol mass loading was conducted by analyzing total column aerosol optical thickness (AOT) at 550 nm against AERONET data. This comparison considered five AERONET stations strategically distributed across the Sahara region and along the dust transport pathway over the Atlantic, with corresponding grid cell values in the model results. Despite certain limitations, such as extended periods of missing data for some stations and specific events being misrepresented by the model, COSMO-MUSCAT effectively reproduces the temporal evolution of dust plumes in the region, capturing the general patterns of timing and intensity, particularly for the periods of time when ÅE(α) are below 0.3, indicating that dust is the main aerosol type.
These findings suggest that the model effectively captures the dust transport across the region. Furthermore, considering that dust plumes during this season typically travel above the marine boundary layer (Schepanski et al., 2009), the dust observed over Cabo Verde is mostly part of the larger regional transport patterns rather than from local emissions. The results are presented and further discussed in Appendix A.
3.2.1 Dependence of optical properties on hematite fraction
As outlined in the Introduction, changes in the hematite content of mineral dust increase the imaginary part of the complex refractive index (CRI) of dust in the UV–Vis spectral range, dominating light absorption (Di Biagio et al., 2019) and decreasing the backscattering coefficients (Chang et al., 2025; Veselovskii et al., 2016; Wandinger et al., 2023). Assuming a constant particle shape and size, we expect that increasing hematite content should lead to a reduction in the particle depolarization ratio, as suggested by the experimental findings of Miffre et al. (2023), and to a reduction in the backscatter coefficients at both 355 and 532 nm. Crucially, this decrease is considered to be spectrally dependent, with a steeper decline at 532 nm than at 355 nm, a pattern supported by Mie theory (De Leeuw and Lamberts, 1987) through size parameter considerations: for the same particle radius, the size parameter is larger at 355 nm than at 532 nm, leading to a more forward-peaked scattering phase function at the shorter wavelength. As a result, 355 nm backscattering is initially lower and less influenced by internal and surface resonances. In contrast, 532 nm backscatter benefits more from these resonance enhancements, which are more strongly dampened as the imaginary part of the CRI – and consequently absorption – increases, leading to the sharper decline of the backscattering coefficient at this wavelength.
While we acknowledge that non-sphericity of mineral dust significantly influences its optical properties, we adopt the perspective that the spectral behavior of the backscatter response, namely its dependency on the imaginary part of the CRI, is preserved across different particle shapes. This viewpoint is supported by the comparative study of Chang et al. (2025), which showed that the shape of the backscatter coefficient's dependency on the imaginary part of the CRI remains consistent across various scattering models, including those by Dubovik et al. (2006) and Saito et al. (2021). Notably, Chang et al. (2025) also report that the backscatter-related Ångström exponent for 355–532 nm increases for larger particles as the imaginary part of the CRI increases, reinforcing the expected wavelength-dependence suppression of the backscatter coefficient. As a result of this differential sensitivity, the lidar ratio () is expected to increase with hematite content due to the stronger suppression of the backscatter coefficients relative to the extinction coefficients.
Moreover, this spectral imbalance in backscattering manifests in the backscatter-related Ångström exponent for the UV–Vis wavelengths, defined as
When β532 is greater than β355, ÅE( is negative. This is the case for all dust plumes analyzed here. It follows that if both coefficients decrease with an increasing hematite content, particularly with β532 dropping faster than β355, their ratio approaches unity, causing ÅE( to shift towards zero. This behavior is clearly observed in Fig. 7, supporting the hypothesis that hematite fraction influences the spectral shape of the backscattering in a predictable and physically meaningful manner.
In real atmospheric conditions, however, the relationship between hematite content and optical properties is complicated by differences in particle size and shape, which are known to strongly influence lidar-derived intensive optical properties. Figure 7 shows the correlation between the modeled average hematite fraction and lidar-retrieved intensive optical properties across 22 dust-dominated layers. No significant correlation is found between hematite content and lidar ratios or particle depolarization ratios at either 355 nm or 532 nm, suggesting that the effects of hematite on these properties are likely masked by competing influences from size and shape variability. However, a moderately strong positive correlation (R2=0.49) is observed between ÅE and hematite fraction. This result aligns with our theoretical framework and provides direct observational support for the wavelength-dependent impact of hematite on backscattering efficiency.
As hematite content increases, the backscatter coefficient spectrum flattens, especially due to the stronger attenuation of β532, leading to an increase in ÅE. This indicates a reduced spectral gradient in the backscatter signal, which is consistent with a wavelength-dependent absorption increase driven by the imaginary part of the CRI. These findings highlight ÅE(β) as the most sensitive lidar optical parameter to hematite content, reinforcing its potential as a compositional tracer in dust characterization.
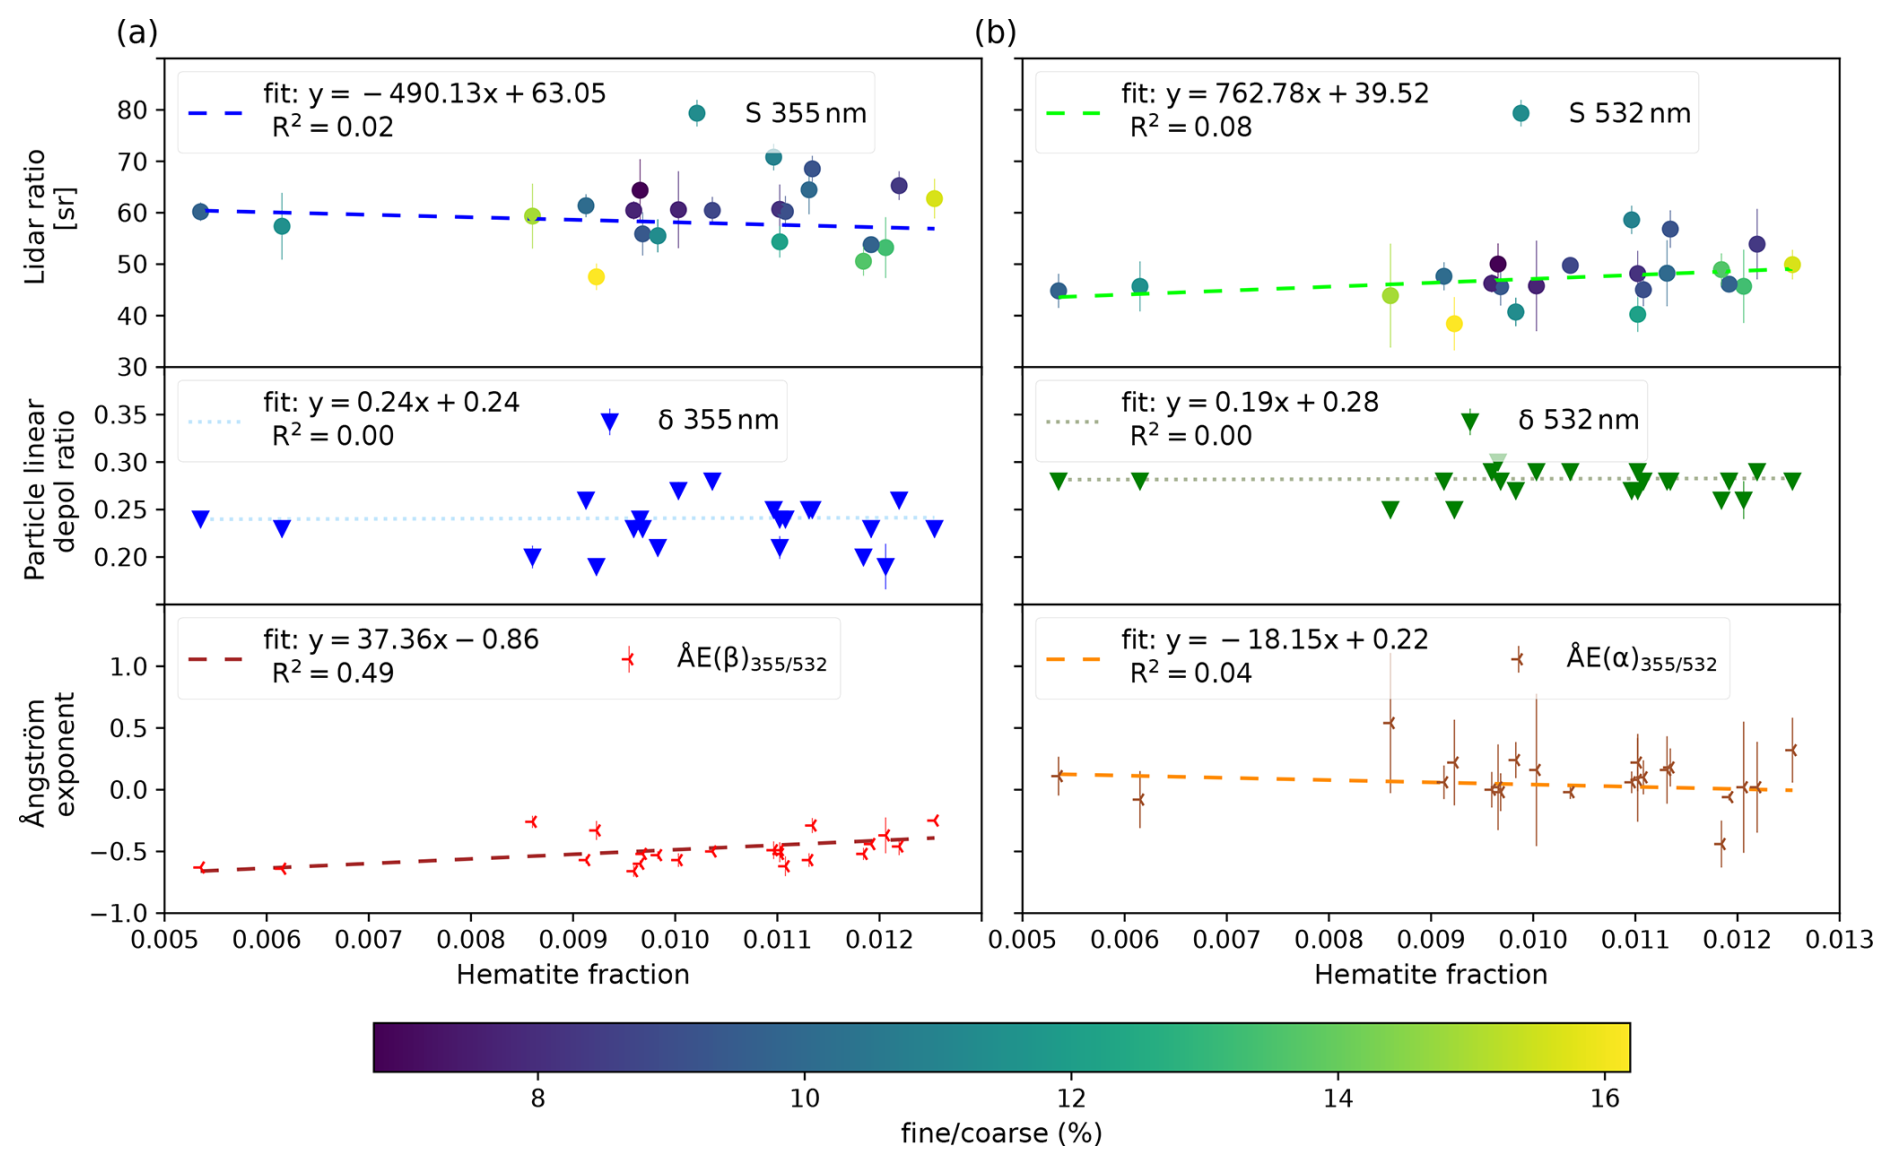
Figure 7Mean values for 22 dust layers, with hematite fractions shown on the x axis and three intensive optical properties shown on the y axis in each panel. Lidar ratios are shown with color-coded dots, and their standard deviations are shown by the error bar. The triangular symbols represent the particle linear depolarization ratios, with the standard deviation shown by the error bar, and the Ångström exponents are depicted by the 45° tilted “Y” symbols. Linear relationships between hematite fraction and each intensive optical property are illustrated by dotted lines. The corresponding linear fit equations and the R2 value are presented in the legend alongside each variable; the units of the variables in the fit equations are as indicated in their respective axis. Panel (a) illustrates S355, δ355, and ÅE, and (b) shows the values related to S532, δ532, and ÅE. The color-coding scale of the lidar ratio depends on the fine to coarse fraction obtained from the POLIPHON method; values in percentage are shown by the color bar.
The color coding in the lidar ratio analysis in Fig. 7 represents the fine to coarse fraction in percentage. Noteworthily, the points with the highest fine to coarse fraction (16 %), shown in yellow, lie outside of the range of the other S values. Lower fine to coarse percentages are clustered around hematite fractions of 0.01 to 0.012. This visual separation suggests that the size distribution may modulate the response of these intensive optical properties to hematite, with fine-mode enrichment possibly enhancing or obscuring compositional signals. Given the known nonlinear dependence of intensive properties on particle size, shape, and composition (Chang et al., 2025; Huang et al., 2023; Miffre et al., 2020, 2023; Saito and Yang, 2021; Wandinger et al., 2023), it is not surprising that only ÅE(β) shows a strong correlation. Prior studies, such as Di Biagio et al. (2019) and Adebiyi and Kok (2020), have shown that absorption efficiency increases with particle diameter, while scattering efficiency decreases, further complicating simple linear interpretations.
For this reason, separating dust cases based on the fine to coarse ratio could improve interpretation by controlling the variability in particle size distributions between layers. This approach may help clarify whether the observed trends truly reflect hematite-driven changes in the imaginary part of the CRI.
Furthermore, the lidar-ratio-related Ångström exponent for the 355 and 532 nm wavelengths (ÅE) exhibits a weak negative correlation with hematite. This suggests that the hematite fraction may influence the lidar ratio with a wavelength dependence, potentially by impacting more S532 than S355. This influence could be attributed to the effect of hematite on the imaginary part of the CRI through its impact on the backscattering properties. However, with a low R2 value of 0.25, this relationship remains too weak and non-significant to provide any conclusions (see Fig. B1).
While dust-dominated layers were carefully selected for this study, the presence of other aerosols, such as those from anthropogenic activity, e.g., black carbon and biomass burning, cannot be entirely ruled out. These aerosols, particularly black carbon, are known to absorb radiation, especially in the UV part of the spectrum (Li et al., 2022; Tesche et al., 2011), which can potentially influence the measured optical properties. However, we minimized the potential impact by applying the ÅE criterion for the dust layer selection (see step 1 in Fig. 1).
Interestingly, the observed moderately linear relationship between ÅE and hematite fraction is not reflected in the lidar ratio analysis. This is partly explained by the lack of correlation with the extinction-related Ångström exponent (ÅE), thereby diminishing the influence of hematite on dust backscattering properties. Given the methodology used for this study, an intriguing opportunity is presented in the following section in order to explore whether limiting size differences within the dust plumes could potentially strengthen correlations between hematite fraction and intensive optical properties.
3.2.2 Size dependency
To gain a clearer understanding of the relationship between the measured intensive optical properties and the modeled hematite fraction, the study cases were separated into three artificial clusters based on different fine- to coarse-dust mass ratios (see Fig. 3). This clustering approach aims to reduce size differences within the dust layers, mitigating the size-dependent effects of the lidar ratio and the backscatter-related ÅE.
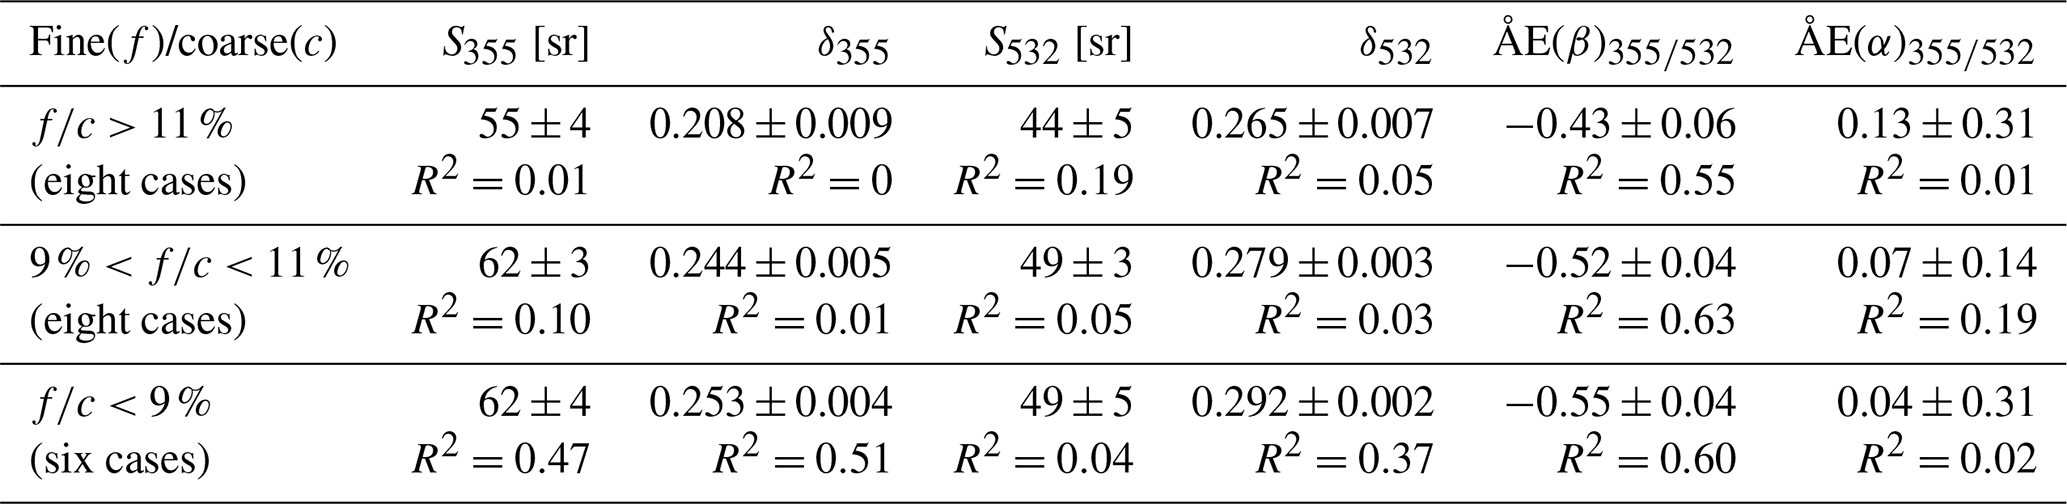
Figure 8 presents the relationships between the modeled hematite fraction and measured intensive optical properties, stratified into three clusters based on the fine- to coarse-dust mass ratio. Corresponding mean values and correlation coefficients for each group are provided in Table 3. Panels a–b show the cases with the highest fine to coarse ratios, reflecting larger proportions of fine dust and, consequently, the greatest particle size differences within a dust layer. In contrast, panels e–f display the cases with the largest coarse-dust portion, indicating less drastic size differences within each dust layer. The intermediate group is shown in panels c–d.
The validity of the size-based clustering is further supported by the trends in the mean values of the intensive optical properties across the groups, as shown in Table 3. As expected from theoretical and observational studies, the lidar ratio (S) increases with particle size due to the greater contribution of coarse particles to extinction relative to backscatter. This trend is clearly reflected in the mean S values across the clusters, confirming that the size separation effectively captures a systematic size-dependent trend in the optical responses. Similarly, the particle linear depolarization ratio (δ) increases with particle size, consistent with findings by Hofer et al. (2020) and Miffre et al. (2023), who demonstrated that larger and more irregularly shaped particles produce higher depolarization. In our data, mean δ355 values increase from 0.21 in the fine-mode cluster (Fig. 8a) to 0.25 in the coarse-mode cluster (Fig. 8e), while a similar rise is seen in δ532.
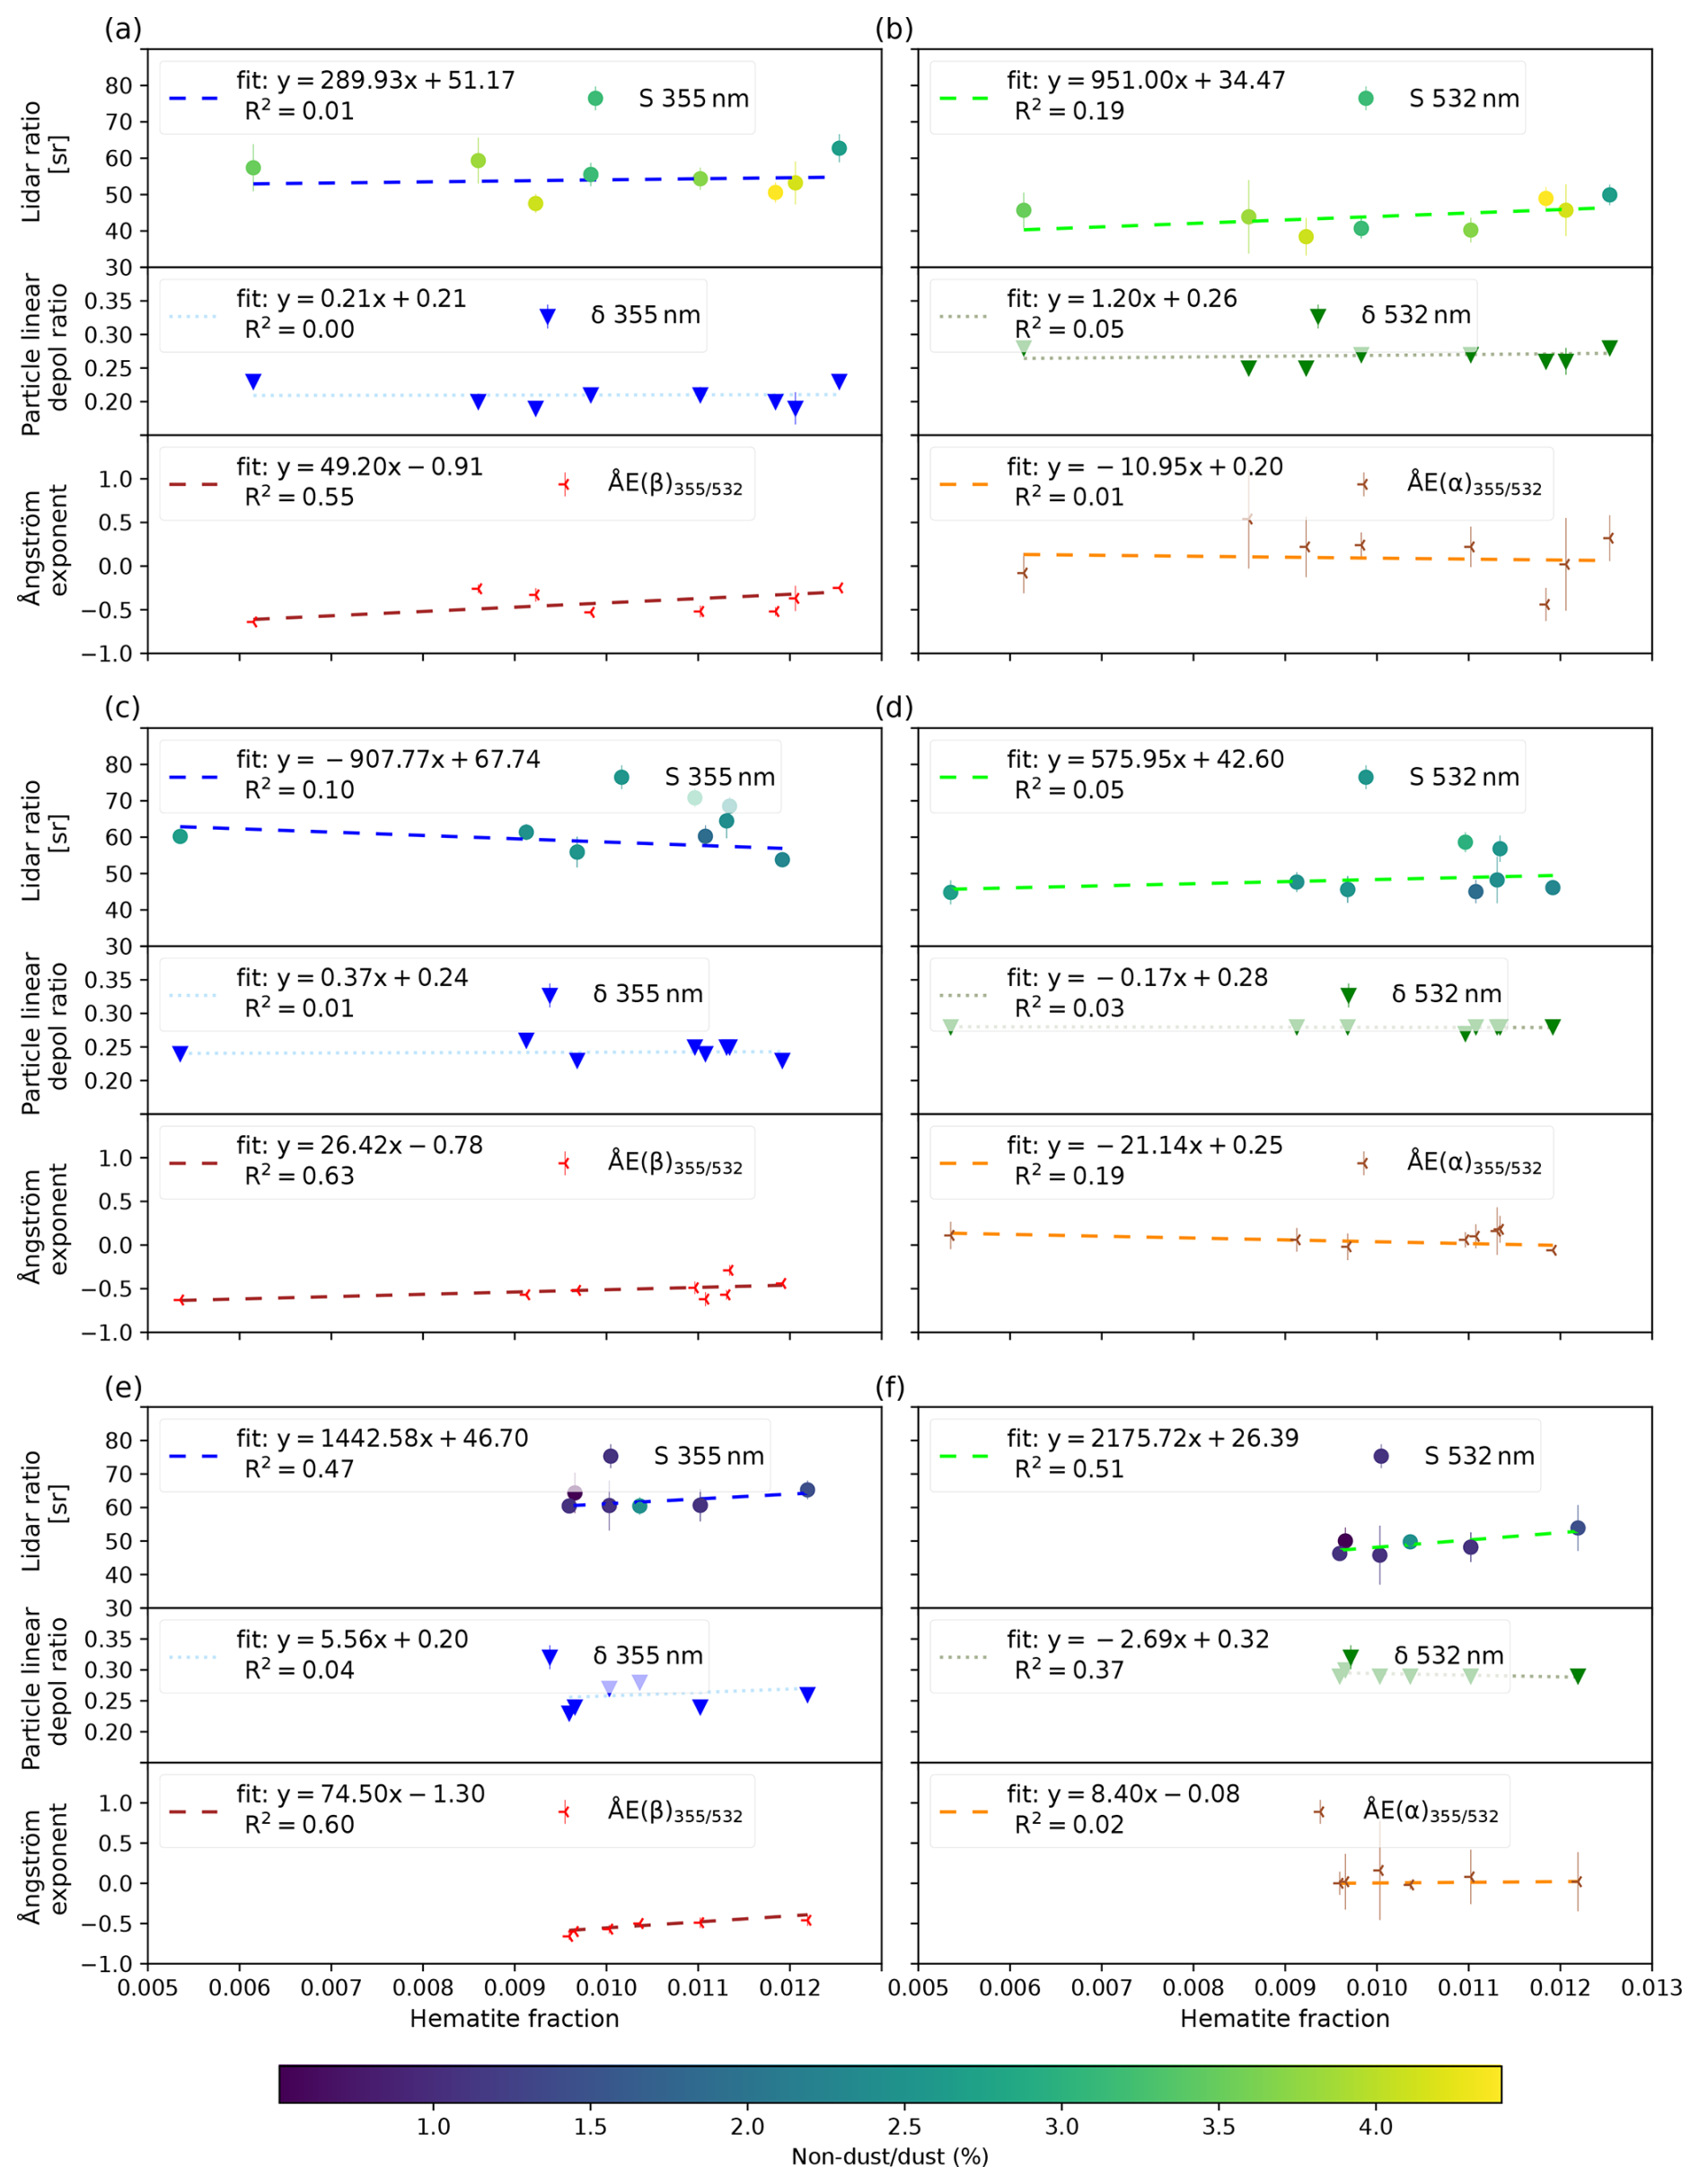
Figure 8As in Fig. 7 but the color coding differs, and the 22 dust cases are separated regarding their fine to coarse fraction: (a–b) dust layers with a fine/coarse fraction above 0.11, (c–d) dust layers with fine/coarse fractions above 0.09 and below 0.11, and (e–f) dust layers with a fine/coarse fraction below 0.09. Panels (a, c, e) illustrate S355, δ355, and ÅE, and (b, d, f) show the values related to S532, δ532, and ÅE. The color-coding scale depends on the non-dust to dust fraction obtained from the POLIPHON method, and values in percentage are shown by the color bar.
Table 3Mean values and the linear correlation coefficient, R2, with respect to changes in the hematite fraction with lidar ratios (S), particle linear depolarization ratios (δ), the backscatter-related Ångström exponent (ÅE(β)), and the extinction-related Ångström exponent (ÅE(α)) for the 355 and 532 nm wavelengths. Categorized according to size differences throughout the case studies following Fig. 3 based on the fine to coarse ratio () from the data obtained by applying the POLIPHON method.
However, particle depolarization ratios remain largely uncorrelated with hematite fraction among size clusters. This is consistent with prior findings, given that depolarization is primarily sensitive to particle shape and less so to composition. While the laboratory study by Miffre et al. (2023) reported that the presence of hematite tends to lower δ355, this is not reflected in the current dataset. A weak negative trend is only hinted at in the coarse-mode cluster (Fig. 8f), where a modest negative correlation is observed between δ532, and hematite fraction is observed for the coarser-particle case. However, given the limited number of samples in this cluster, the result should be interpreted cautiously.
By contrast, the backscatter-related Ångström exponent (ÅE() consistently exhibits moderate and statistically meaningful correlations with hematite fraction in all size clusters. The strongest correlation is observed in the intermediate-size group (Fig. 8c, R2=0.63), followed closely by the coarse-mode group (Fig. 8e, R2=0.60). The fine-mode group also shows a notable though slightly weaker correlation (Fig. 8a, R2=0.55). Notably, the correlation coefficient, R2, increases positively when moving from cases with a higher fine-dust portion to those with lower portions, as seen in Fig. 8a, b compared to Fig. 8e, f, suggesting a stronger relationship between hematite fraction and backscattering properties in coarser-dust layers. The consistently positive slopes of the linear fits across all size clusters further align with theoretical considerations that as hematite content increases, and with it, the imaginary part of the CRI, the backscatter coefficient at 532 nm decreases more steeply than at 355 nm, leading to a convergence of the two values and thus driving ÅE( towards zero.
Conversely, the extinction-related Ångström exponent (ÅE) shows no meaningful correlation with hematite fraction across the size clusters (Fig. 8b, d, e), nor any consistent trend. However, the average values of ÅE decrease towards zero with increasing coarse-mode dominance. This trend highlights the strong sensitivity of ÅE(α) to particle size and suggests that unlike ÅE(β), it is almost decoupled from the change in the imaginary part of the CRI to larger values from Vis to UV.
The relationship between hematite fraction and lidar ratio shows a gradual strengthening across size clusters. For S355, the correlation shifts from non-significant in the fine-mode group to moderately positive in the coarse-mode group (Fig. 8a, e). A similar trend is observed for S532 (Fig. 8b, f). Although the sample size is small, particularly in cases with a larger proportion of coarse particles (six samples), the progressively stronger correlation coefficients, combined with the well-established influence of changes in the imaginary part of the CRI on backscattering properties, suggest a potentially meaningful relationship between the hematite fraction and the lidar ratio, with a more marked tendency for the Vis portion of the spectrum at 532 nm (Chang et al., 2025; De Leeuw and Lamberts, 1987). This is consistent with theoretical predictions, as the backscatter coefficient at 532 nm is more strongly suppressed by increases in the imaginary part of the CRI than at 355 nm. The relatively higher sensitivity of S532 compared to S355 may reflect both spectral dependencies in the imaginary part of the CRI and the intrinsic wavelength-dependent response of the backscatter coefficient. This finding aligns with previous studies on the spectral impact of hematite fraction on absorption. For example, Di Biagio et al. (2019) found a higher R2 when analyzing the changes in the hematite fraction relative to the single-scattering albedo at 520 nm (R2=0.78) compared to 370 nm (R2=0.73).
This analysis highlights that segregating dust plumes into size-based clusters, which reduce size variability within the analyzed dust plumes, enhances the strength and clarity of the correlations between modeled hematite fractions and optical properties. This most consistent improvement is observed for the backscatter-related ÅE across the UV–Vis spectral range, with moderately positive correlations emerging across all three size classes in Fig. 8. This consistency suggests that ÅE is particularly sensitive to compositional diversity, especially when it affects the imaginary part of the CRI. In contrast, this trend is less uniform across other lidar-derived intensive optical properties, reflecting the complex interplay between particle size, shape, and composition. A plausible explanation is that coarser particles exhibit enhanced absorption relative to scattering, as shown in previous studies (Adebiyi and Kok, 2020; Di Biagio et al., 2019), which would amplify the impact of hematite content on optical parameters like the lidar ratio and ÅE(β). This is consistent with the stronger correlations observed for S in the coarse-particle cluster.
Following Miffre et al. (2020), Schuster et al. (2012), Veselovskii et al. (2020), and Wandinger et al. (2023), it is well established that the backscatter-related ÅE for the 355 to 532 nm wavelengths is influenced by the imaginary part of the CRI. Even though the negative relationship found in the sensitivity study of Veselovskii et al. (2020), where ÅE decreases as the imaginary part of the CRI increases, does not align with our findings, the laboratory study of Miffre et al. (2020) suggests a different scenario. In cases with a larger effective radius and considering non-spherical particles, where the real part of the CRI does not vary, ÅE increases towards zero as the imaginary part of the CRI increases. A reasonable interpretation of this discrepancy lies in the design of the Veselovskii et al. (2020) simulations, where only the imaginary part of the CRI at 355 nm was varied while keeping it fixed at 532 nm. As a result, their study captures only the decrease in the backscatter at 355 nm, leading to a reduction in ÅE. This approach inherently overlooks the wavelength-dependent sensitivity of backscattering to absorption, particularly the stronger suppression of β532 with an increasing imaginary part of the CRI. Consequently, their results do not capture the behavior observed in our data (Figs. 7 and 8).
In our study, we consider that hematite content is the main contributor to the variability in the imaginary part of the CRI. This is supported by Di Biagio et al. (2019), who observed negligible changes in the real part of the CRI across various dust samples and a strong positive correlation between hematite content and the imaginary part, particularly in the UV–Vis range (see Fig. 9 in their study). Therefore, the observed increase in ÅE with hematite fraction in our results is best explained by hematite-driven increases in the imaginary part of the CRI, which lead to wavelength-dependent suppression of backscattering, especially at 532 nm. This interpretation is further supported by the fact that the strongest ÅE correlations appear in the size clusters where particle size variability is minimized, allowing the impact of increasing hematite to become more apparent.
The lidar-ratio-related ÅE analysis shows similar results to ÅE, showing the strongest correlation with the varying hematite fraction for the intermediate cluster (R2=0.42). Furthermore, ÅE correlation coefficients become stronger between the cases with finer particles and the ones with coarser particles (see Fig. B2). These results reinforce the idea that hematite influences the lidar ratio with a wavelength dependence by impacting stronger S532 than S355.
Additionally, the color coding provides further insight by highlighting the relationship between the non-dust to dust fraction, as derived from POLIPHON, within each dust layer. As shown in Fig. 8, the highest non-dust portions are found in the layers with the larger fine-dust portion (Fig. 8a–b), and this ratio decreases progressively as the fine-dust portion diminishes. The presence of higher non-dust content, such as soot, whether locally produced or transported within the layer, can influence the measured optical properties by absorbing radiation at UV–Vis wavelengths (Müller et al., 2009). This effect contributes to the understanding of the lack of clear, positive relationships between S355, S532, and the increase in hematite content for cases with a higher portion of non-dust aerosols.
We conclude that the complex interactions between particle size, shape, and composition with intensive optical properties make the effect of the increased hematite fraction more apparent only when dust cases are size-segregated. This approach reduces size differences and minimizes interference from other aerosols. Although these separations are artificial due to the uncertainties in the fine to coarse ratios, they serve as a valuable exploratory analysis, highlighting the importance of size segregation in studying the impacts of iron oxide content on intensive optical properties.
Positive correlations are revealed in the analysis between lidar-retrieved intensive optical properties and modeled hematite fraction in dust cases when considering particle size separately, especially for layers with minimal fine-dust and non-dust content. This suggests that both particle size and composition significantly influence dust optical properties, although their effects are intertwined and difficult to disentangle due to their nonlinear nature. Furthermore, due to the nature of the POLIPHON method, the concentration of non-dust particles is contained within the fine fraction, therefore obscuring the correlation between hematite and optical properties in this size range.
Regarding the positive correlation found with the backscatter-related Ångström exponent, our findings align with Miffre et al. (2020), indicating that an increase in the imaginary part of the CRI, linked to higher hematite content, can lead to an increase in ÅE, particularly when initial values are negative. This supports the notion that changes in ÅE are primarily driven by differences in the imaginary part of the CRI, rather than the real part. This is consistent with previous studies, such as those by Di Biagio et al. (2019), which found no change in the real part of the CRI but identified hematite’s impact on the imaginary part. These correlations indicate a negative relationship between the hematite fraction and dust backscattering properties, with a wavelength-dependent influence. While the lidar ratio does not show a strong correlation, a clear trend emerges as particle size differences become more constrained at both 355 and 532 nm wavelengths. In the size-segregated cases, the positive correlation strengthens. This trend is further supported by the lidar-ratio-related ÅE correlation analysis.
This study presents a framework for understanding the influence of hematite content on lidar measurements. To enhance the statistical validity of these findings, it is essential to identify additional lidar-retrieved dust plumes that meet these study criteria, potentially using machine learning techniques. Expanding this research to other desert regions globally is also recommended, given the lidar ratio variability across different deserts (Hofer et al., 2020; Schuster et al., 2012).
Future modeling efforts should include a parameterization that takes into account the changes in particle size distribution as minerals are emitted and should add the soil distribution content of goethite. Additionally, a new development could replace the use of soil-interpolation-produced databases by providing a mineralogical dataset from spaceborne hyperspectral measurements through NASA's Earth Surface Mineral Dust Source Investigation (EMIT; https://earth.jpl.nasa.gov/emit/, last access: 28 August 2025).
Moreover, if a specific combination of lidar-retrieved measurements can be identified for dust layers with varying hematite content, these measurements could be linked to distinct dust source regions with unique mineralogical distributions (Formenti et al., 2014; Go et al., 2022). This would build on previous studies that have linked differences in measured lidar ratios to dust originating from different regions of the Sahara (Esselborn et al., 2009). To advance this research, efforts could also incorporate the infrared channel from PollyXT retrievals to identify minerals interacting with this part of the spectrum (Gebauer et al., 2024; Haarig et al., 2022, 2025).
To conclude, although a positive correlation has been identified between the backscatter-related Ångström exponent and hematite fraction, it is clear that further research is necessary in order to establish and characterize this relationship and further relationships between hematite content and lidar-retrieved intensive optical properties, especially considering the non-sphericity of the particles. Nonetheless, these findings underscore the importance of considering both size and compositional factors for accurately representing dust optical properties. This could help reduce uncertainties in model estimates of dust and its direct radiative effect.
A comparison of aerosol optical thickness (AOT) at 550 nm was conducted using AERONET data to evaluate the model's performance. The model-derived AOT is calculated based on the simulated total column dust mass loads; an effective radius; a dimensionless dust extinction efficiency at 550 nm, which varies within the model size classifications; and a fixed, homogeneous density of 2650 kg m−3. Further details of this diagnostic approach can be found in Gómez Maqueo Anaya et al. (2024a). The comparison covered the entire simulation period, from 8 August to 30 September 2021 and from 2 June to 31 July 2022. AERONET stations were strategically selected along the dust transport pathway from the Sahara towards the Atlantic, and level 2.0 data, which undergo cloud screening, were used. The results are depicted in Fig. A1 for 2021 and Fig. A2 for 2022.
The COSMO-MUSCAT performance varies across stations. While the model tends to underestimate AOT at certain stations, such as Mindeo and Banizoumbou during JATAC 2021 and Santa Cruz in both campaign periods, it generally overestimates AOT at the other studied stations. Among the stations analyzed, the Santa Cruz station showed the best overall agreement with the modeled values. However, the lack of measurements at some stations during significant periods of time in both campaigns introduces bias into the model–observation correlations. Specific events, such as on 9 August 2021 at Cinzana and during the midday of 23 August 2021 at Mindelo, are significantly overrepresented and underrepresented by the model, respectively. The dust event recorded at the Banizoumbou station on 13 September 2021 also appears to be underrepresented. However, satellite observations suggest potential cloud contamination in AERONET AOT values despite cloud-screening procedures.
It is important to highlight that AERONET AOT retrievals account for all aerosol types potentially present, whereas the model simulates only dust aerosols. To ensure a more direct comparison, the focus is placed on periods when ÅE(α) values are below 0.3, which serves as a reliable indicator that dust is the dominant aerosol type (Ansmann et al., 2019). Despite these challenges, the model effectively reproduces the temporal evolution of dust plumes in the region, successfully capturing the general patterns in timing and intensity. This suggest that the model provides a reliable representation of dust transport across the region and can be confidently used to simulate the life cycle of mineral dust aerosols.
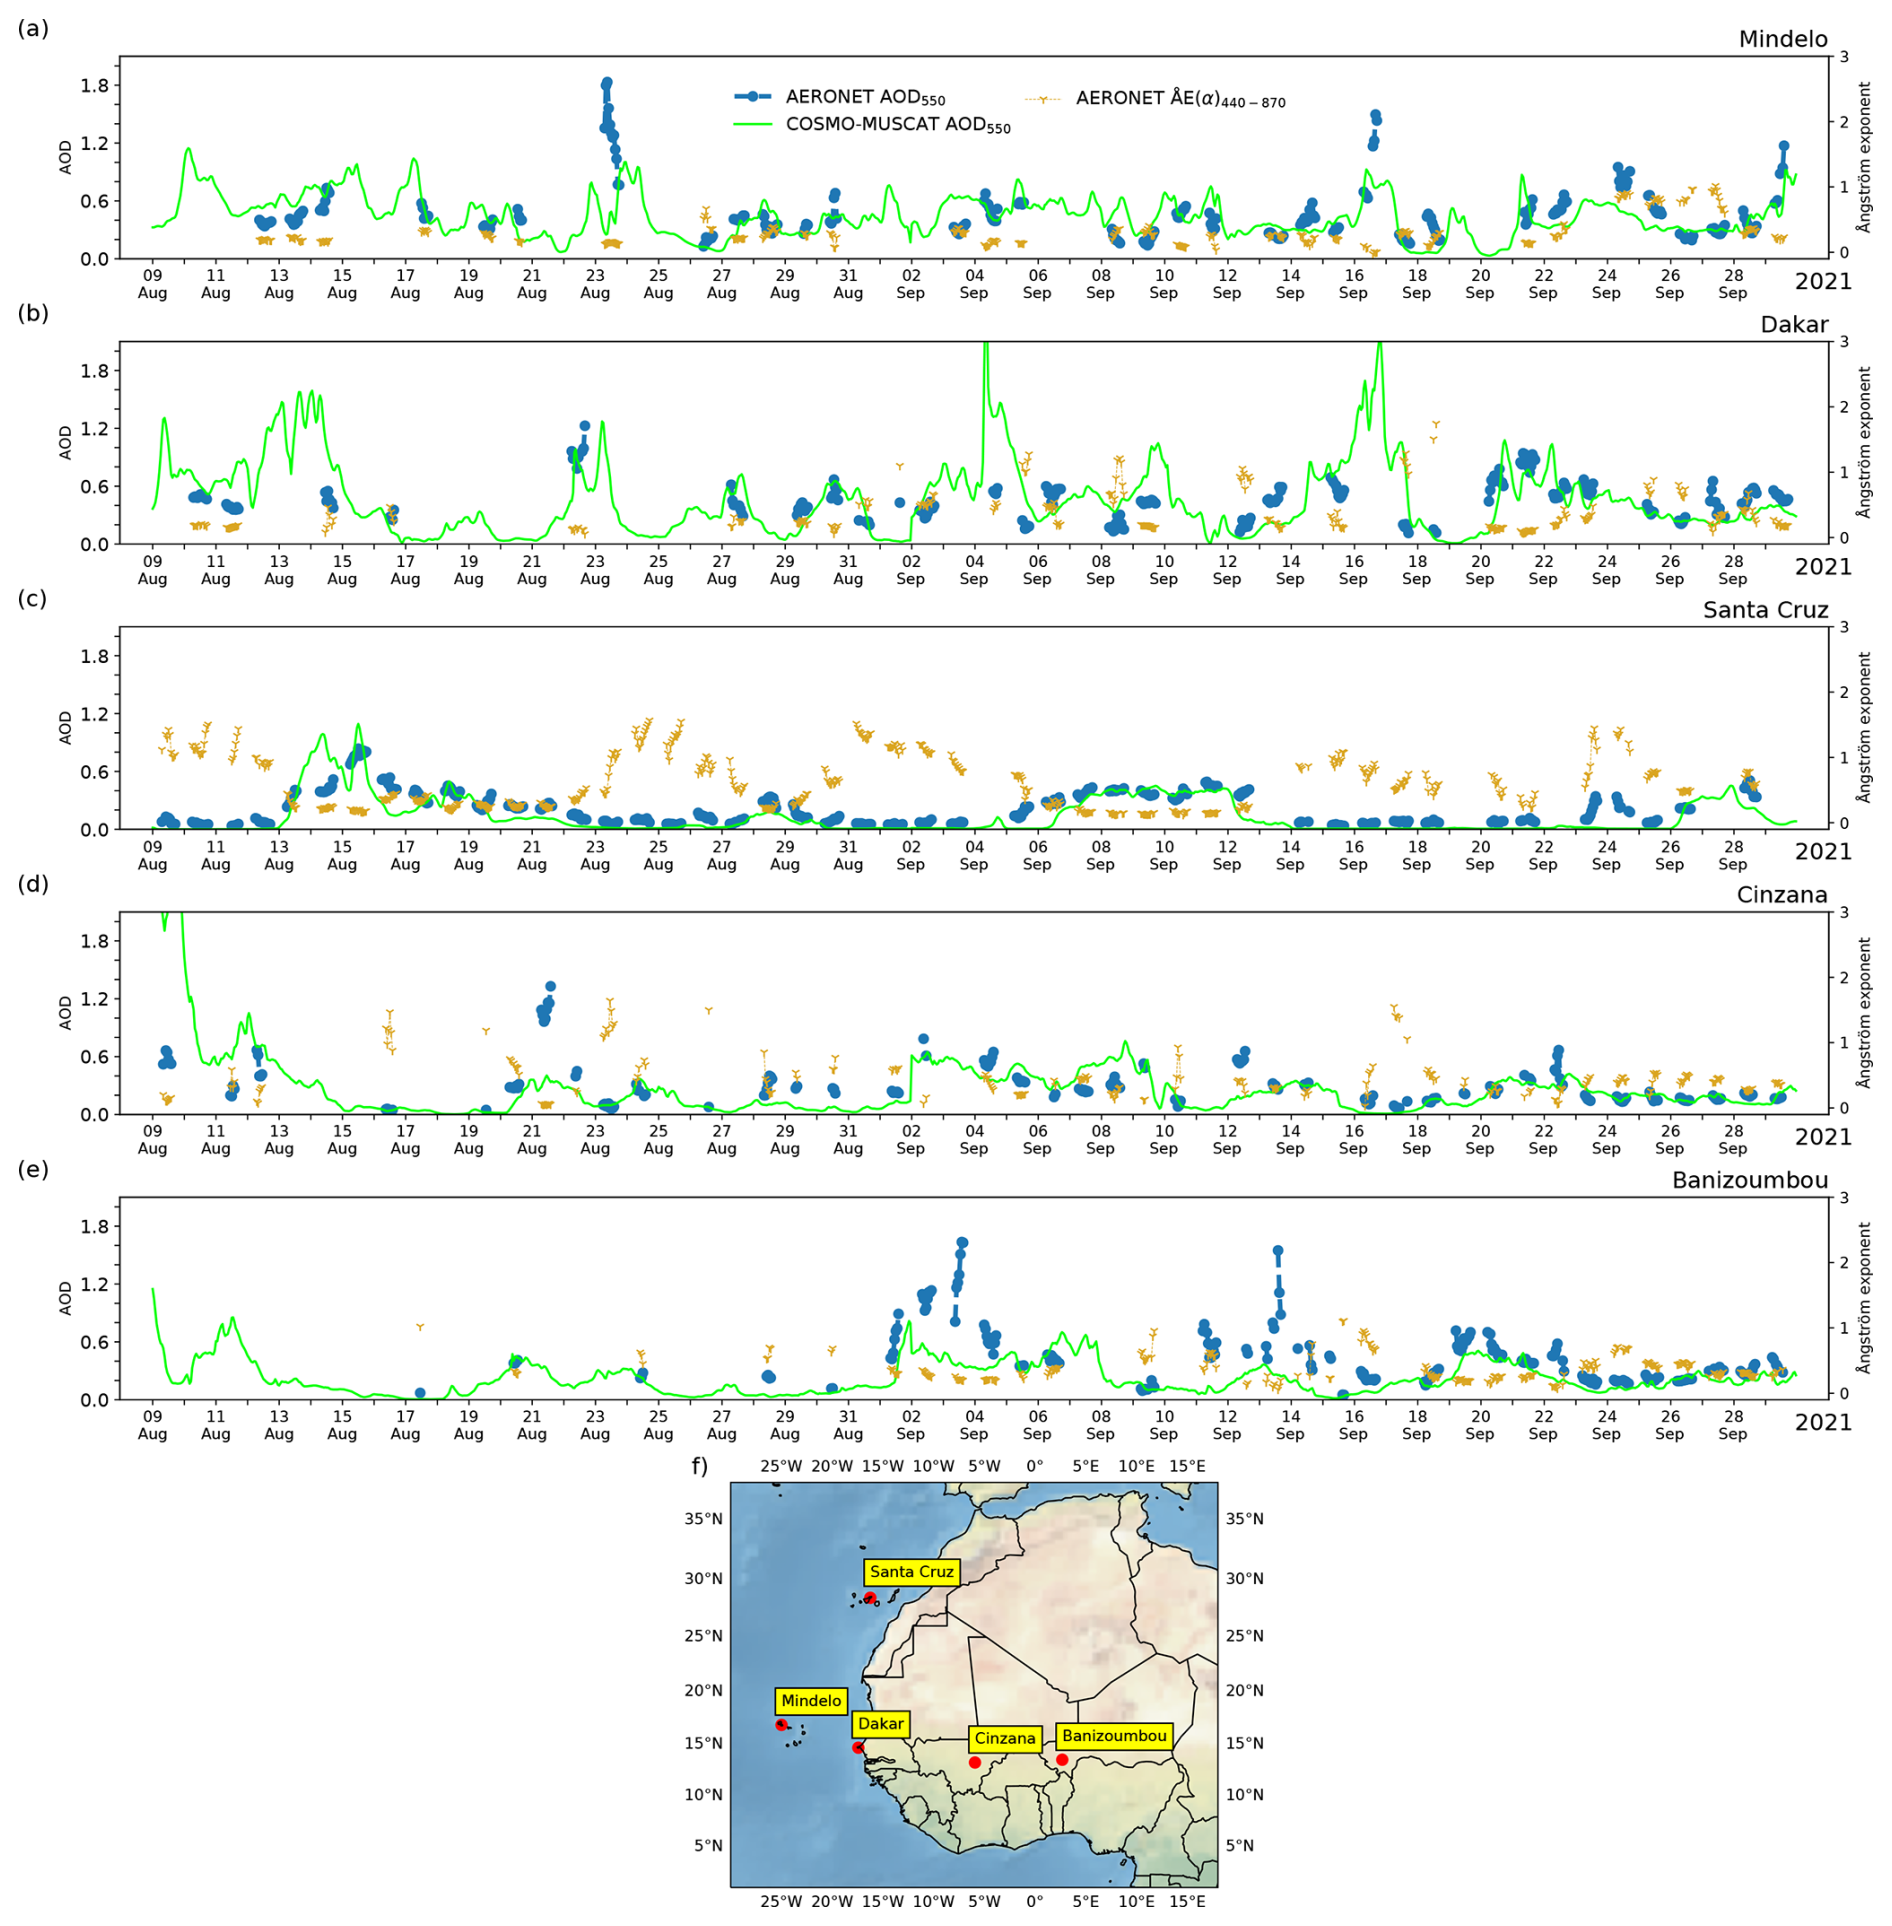
Figure A1Dust AOT at 550 nm calculated from COSMO-MUSCAT dust concentration fields (green) and AOT at 550 nm and the extinction-related Ångström exponent for the 440–870 nm wavelength range (ÅE(α)) from AERONET level 2.0 sun-photometer measurements (blue and gold), where each x-axis tick represents 12:00 UTC for each day in the range of 8 August to 30 September 2021. Five different stations across the Sahara and downwind locations are shown: (a) Mindelo (16.878° N, 24.995° W; Cabo Verde), (b) Dakar Belair (14.702° N, 17.426° W; Senegal), (c) Santa Cruz Tenerife (28.473° N, 16.247° W; Spain), (d) IER Cinzana (13.278° N, 5.934° W; Mali), and (e) Banizoumbou (13.547° N, 2.665° E; Niger). (f) The AERONET station geographic locations and names used in this comparison.
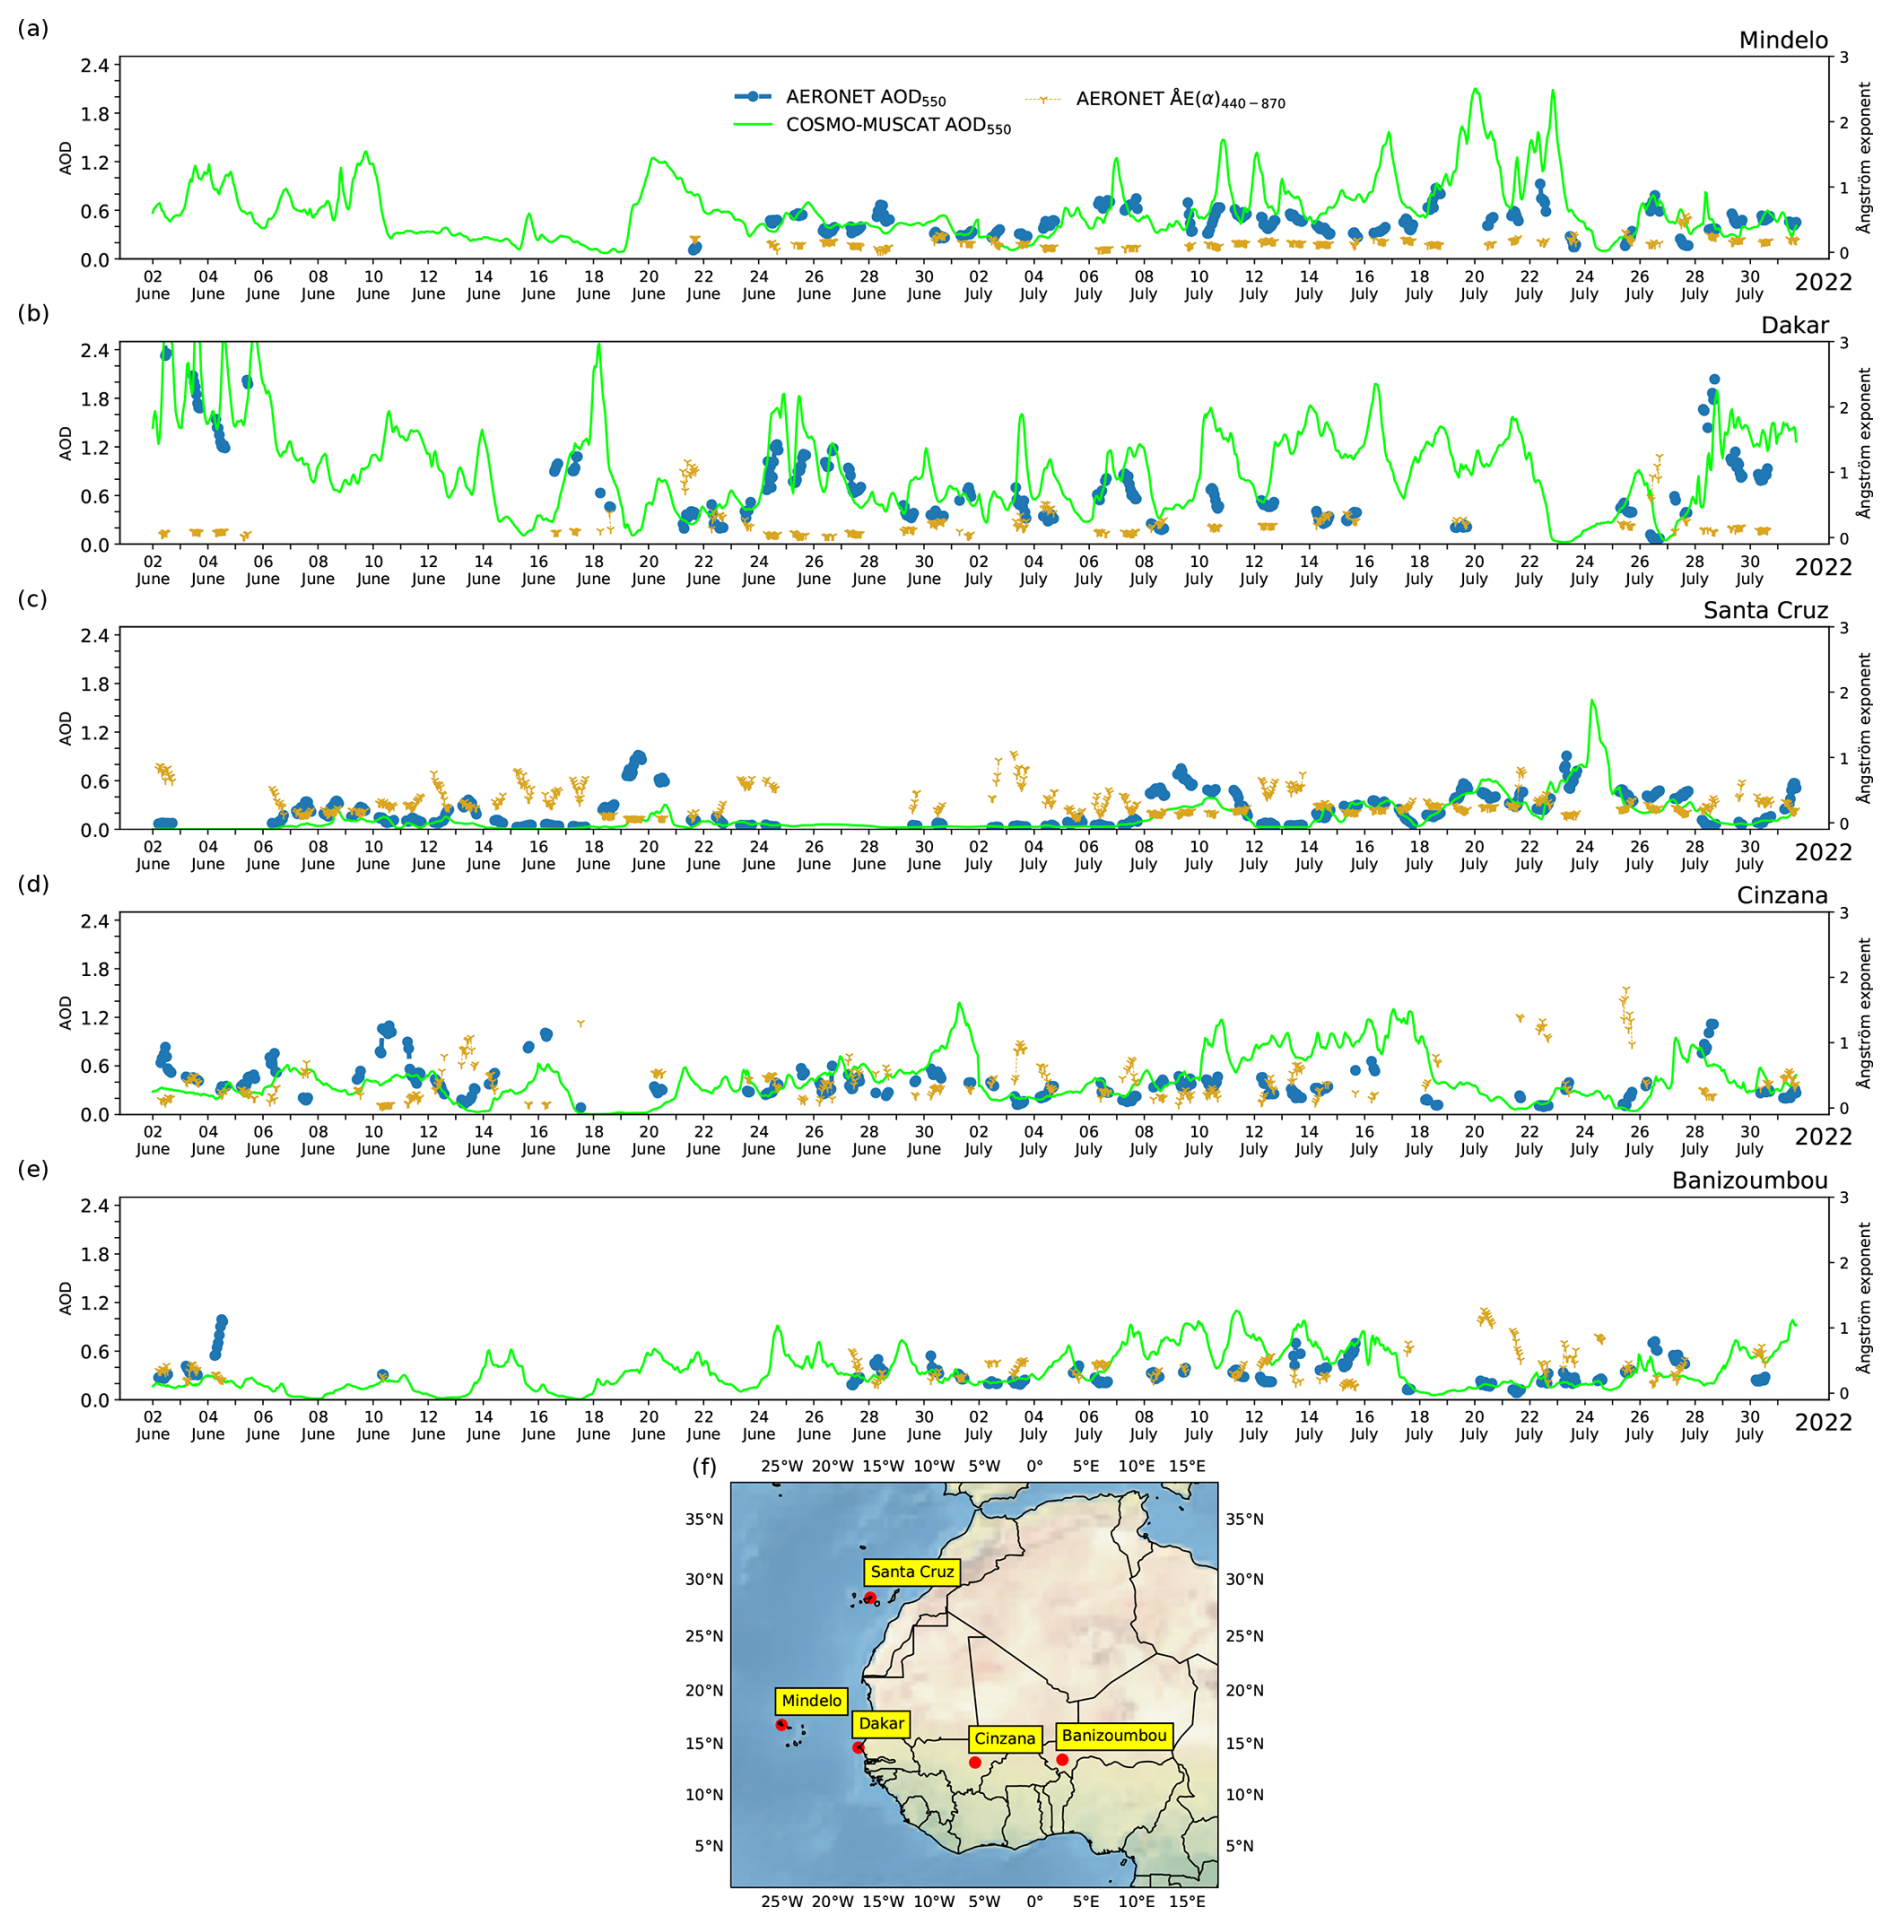
Figure A2As in Fig. A1 but for the period of 2 June to 31 July 2022.
Figures B1 and B2 show the correlation analysis between the averaged modeled hematite fraction and the lidar-ratio-related Ångström exponent considering 22 dust layers. The lidar-ratio-related Ångström exponent is derived from lidar measurements in the following way:
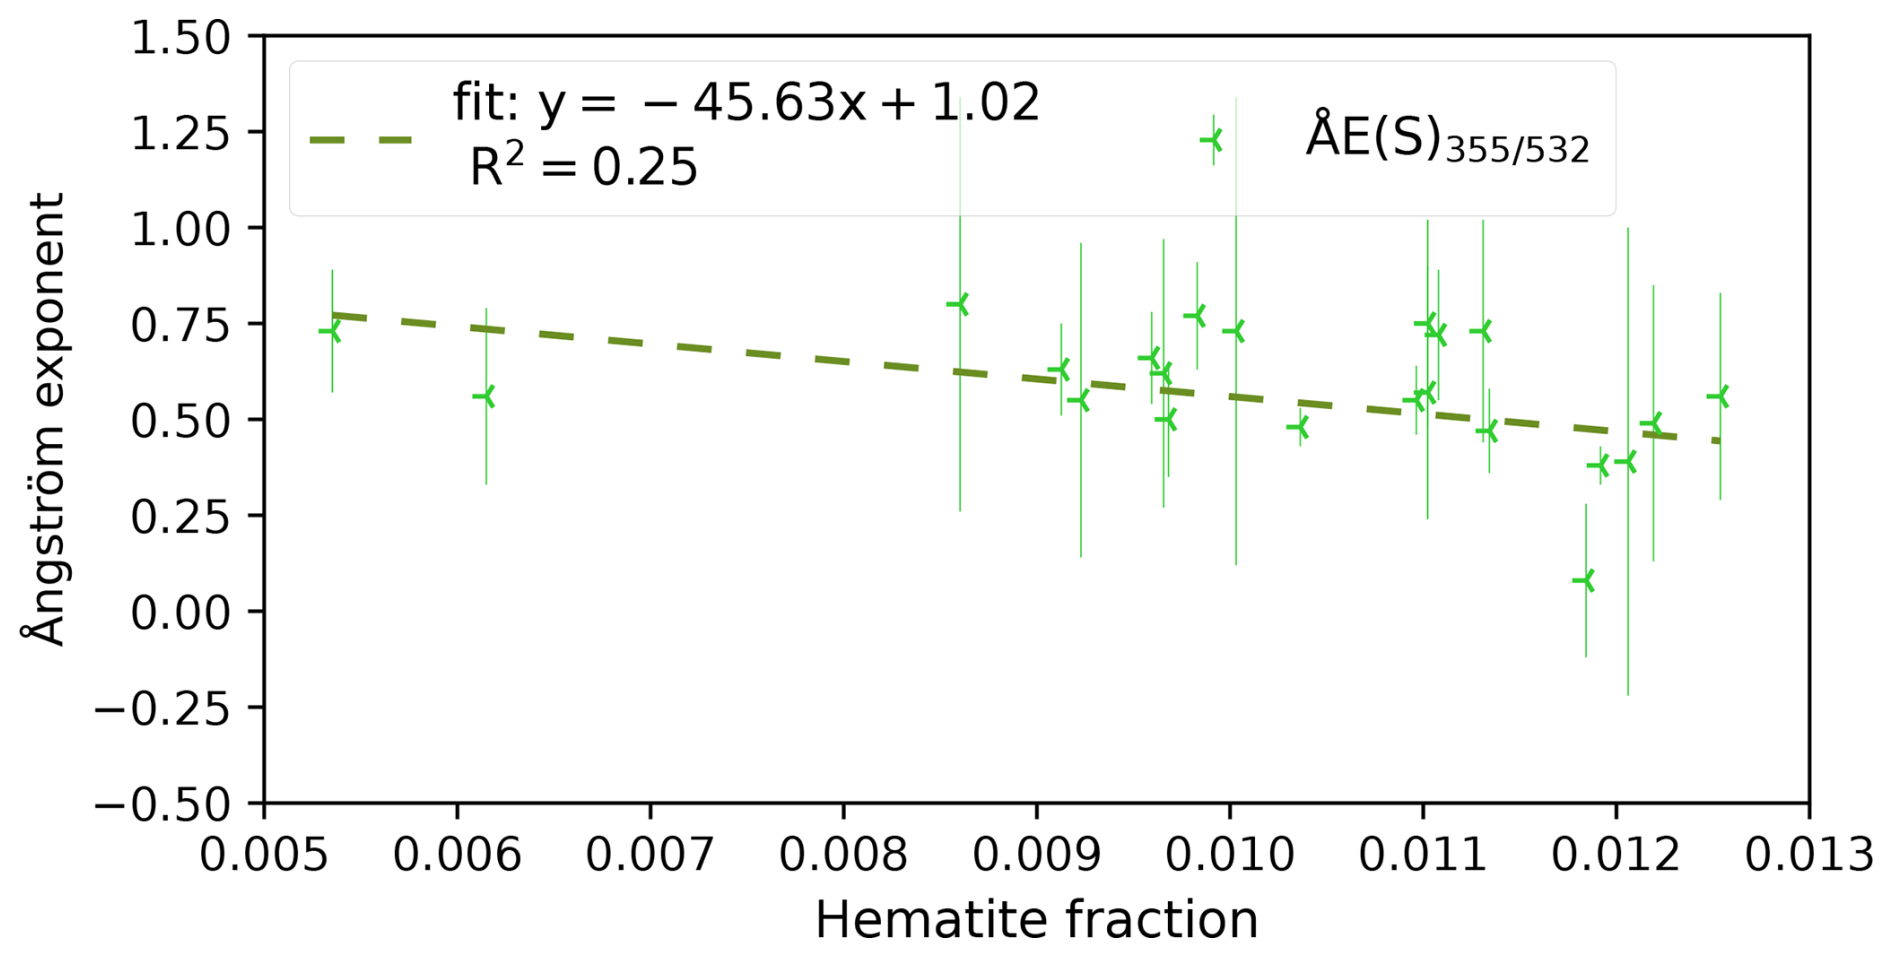
Figure B1Mean values for 22 dust layers. Hematite fractions are shown on the x axis, and the lidar-ratio-related Ångström exponent for the 355 and 532 nm wavelengths is shown on the y axis. The standard deviation of ÅE is shown by the error bar. The linear fit between the hematite fraction and ÅE is illustrated by the dotted lines, and the R2 value of the linear fit is shown in the dashed line legend.
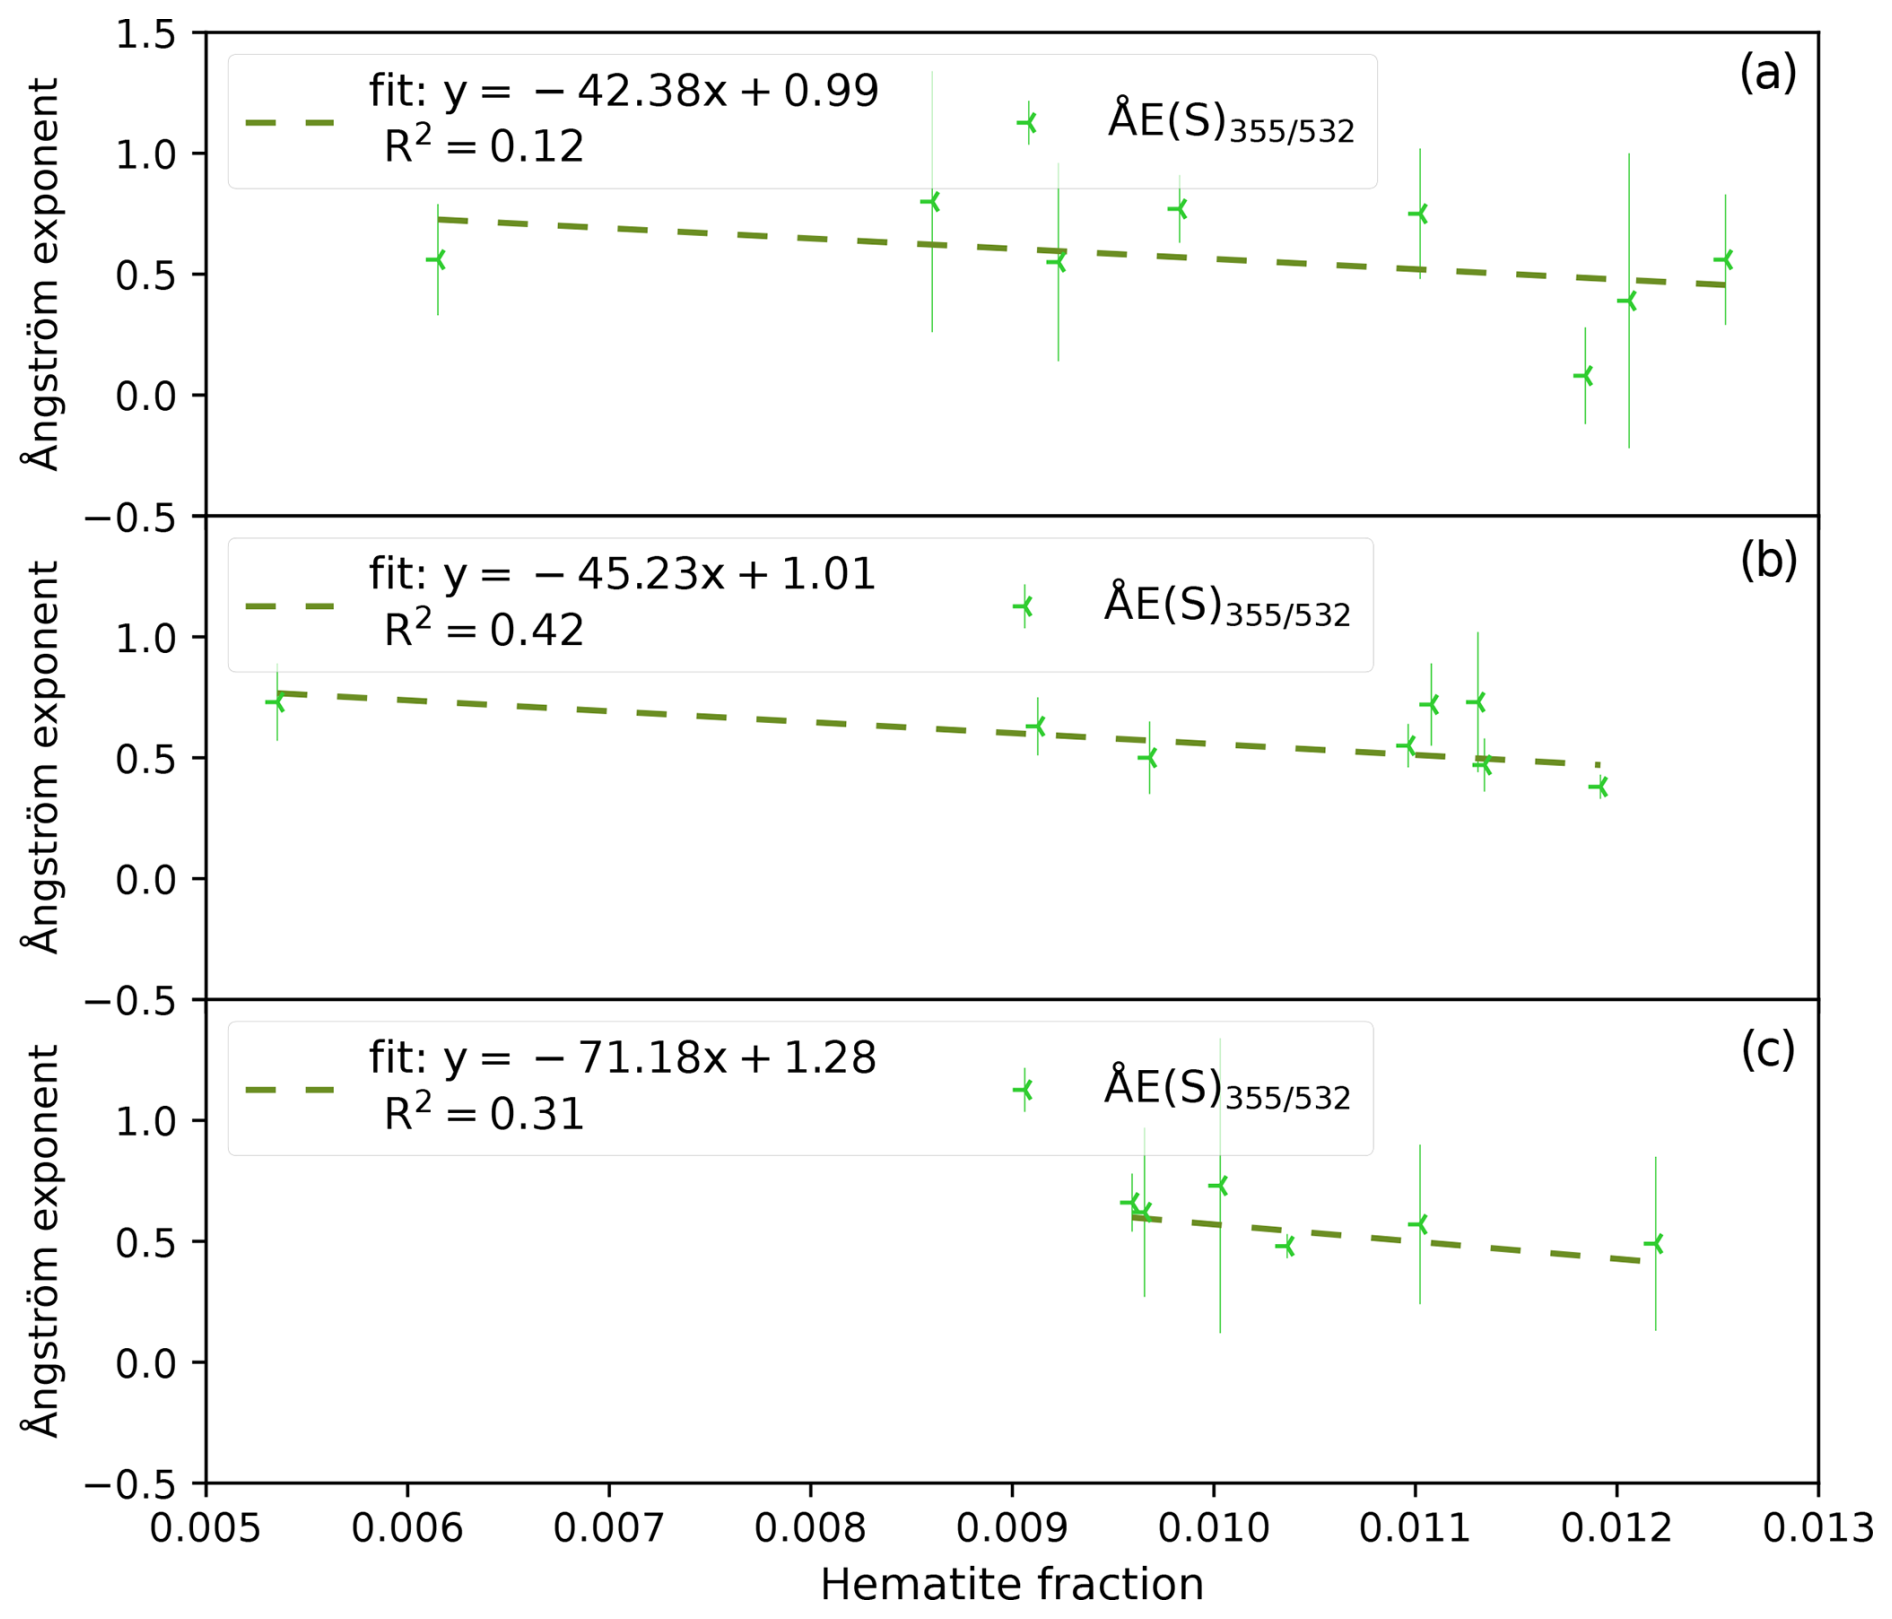
Figure B2Same as Fig. B1 but for the case studies being separated regarding their fine to coarse fraction: the first row shows dust layers with a fine/coarse fraction above 0.11, the middle row illustrates dust layers with fine/coarse fractions above 0.09 and below 0.11, and the last row depicts dust layers with a fine/coarse fraction below 0.09.
The datasets for reproducing the graphs presented here are available at https://doi.org/10.5281/zenodo.13908846 (Gómez Maqueo Anaya et al., 2024b).
Raw Polly lidar observations (level 0 data, measured signals) can be accessed through the PollyNet database (http://polly.tropos.de/, last access: February 2025).
SGMA wrote the manuscript draft; DA, KS, MH, JH, and BeHe reviewed and edited the paper; DA, KS, HB, and AA provided resources such as study materials, instrumentation, and analysis tools and were part of the conceptualization of the project; SGMA, DA, UW, MH, JH, HB, and AA were part of the formal analysis of lidar data. SGMA, KS, and DA performed the analysis of lidar data compared to modeled results. MF contributed to software development (restructured the code around the MUSCAT dust emission scheme); SGMA, MF, BeHe, KS, and IT contributed to code development surrounding the mineralogy inclusion; AS, BiHe, HB, and RE are responsible for the maintenance and continuous improvement of the PollyXT lidar device(s).
The contact author has declared that none of the authors has any competing interests.
Publisher’s note: Copernicus Publications remains neutral with regard to jurisdictional claims made in the text, published maps, institutional affiliations, or any other geographical representation in this paper. While Copernicus Publications makes every effort to include appropriate place names, the final responsibility lies with the authors.
We acknowledge and thank the team of OSCM/INMG for their crucial and ongoing support. We further thank ESA and the ASKOS/JATAC teams for the organization of the JATAC(s) campaign(s) and their continuous support.
Further thanks are due to the Deutscher Wetterdienst (DWD) for cooperation and support and to all PIs of the AERONET stations used in this study for maintaining the instruments, obtaining the measurements, and providing data.
We want to thank all the TROPOS team members involved in PollyNET, the network dedicated to providing continuous aerosol data from automated Raman polarization lidars (Baars et al., 2016, https://polly.tropos.de/, last access: 24 August 2025).
Muñoz Sabater (2019) was downloaded from the Copernicus Climate Change Service (C3S) Climate Data Store. The results contain modified Copernicus Climate Change Service information for 2020 and 2022. Neither the European Commission nor ECMWF is responsible for any use that may be made of the Copernicus information or data it contains.
Furthermore, ChatGPT was utilized in a previous version of the paper to rephrase and shorten sentences and to identify appropriate prepositions.
This study was done under the framework of the DUSTRISK (a risk index for health effects of mineral dust and associated microbes) project, funded by the Leibniz Collaborative Excellence program project (grant no. K255/2019).
This research has been supported by the German Federal Ministry for Economic Affairs and Energy (BMWi) (grant no. 50EE1721C). Furthermore, we also acknowledge the support through ACTRIS-2 under grant agreement no. 654109 from the European Union’s Horizon 2020 research and innovation program and ACTRIS PPP under the Horizon 2020 research and innovation framework program, H2020-INFRADEV-2016-2017, under grant no. 7395302.
This paper was edited by Stelios Kazadzis and reviewed by Ali Omar and two anonymous referees.
Adebiyi, A. A. and Kok, J. F.: Climate models miss most of the coarse dust in the atmosphere, Science Advances, 6, eaaz9507, https://doi.org/10.1126/sciadv.aaz9507, 2020. a, b, c
Adebiyi, A., Kok, J. F., Murray, B. J., Ryder, C. L., Stuut, J.-B. W., Kahn, R. A., Knippertz, P., Formenti, P., Mahowald, N. M., Pérez García-Pando, C., Klose, M., Ansmann, A., Samset, B. H., Ito, A., Balkanski, Y., Di Biagio, C., Romanias, M. N., Huang, Y., and Meng, J.: A review of coarse mineral dust in the Earth system, Aeolian Res., 60, 100849, https://doi.org/10.1016/j.aeolia.2022.100849, 2023. a
Althausen, D., Engelmann, R., Baars, H., Heese, B., Ansmann, A., Müller, D., and Komppula, M.: Portable Raman Lidar PollyXT for Automated Profiling of Aerosol Backscatter, Extinction, and Depolarization, J. Atmos. Ocean. Tech., 26, 2366–2378, https://doi.org/10.1175/2009JTECHA1304.1, 2009. a
Ångström, A.: On the Atmospheric Transmission of Sun Radiation and on Dust in the Air, Geografiska Annaler, 11, 156, https://doi.org/10.2307/519399, 1929. a
Ansmann, A., Wandinger, U., Riebesell, M., Weitkamp, C., and Michaelis, W.: Independent measurement of extinction and backscatter profiles in cirrus clouds by using a combined Raman elastic-backscatter lidar, Appl. Optics, 31, 7113–7131, https://doi.org/10.1364/AO.31.007113, 1992. a, b
Ansmann, A., Seifert, P., Tesche, M., and Wandinger, U.: Profiling of fine and coarse particle mass: case studies of Saharan dust and Eyjafjallajökull/Grimsvötn volcanic plumes, Atmos. Chem. Phys., 12, 9399–9415, https://doi.org/10.5194/acp-12-9399-2012, 2012. a, b
Ansmann, A., Mamouri, R.-E., Hofer, J., Baars, H., Althausen, D., and Abdullaev, S. F.: Dust mass, cloud condensation nuclei, and ice-nucleating particle profiling with polarization lidar: updated POLIPHON conversion factors from global AERONET analysis, Atmos. Meas. Tech., 12, 4849–4865, https://doi.org/10.5194/amt-12-4849-2019, 2019. a, b, c, d, e, f
Baars, H., Ansmann, A., Althausen, D., Engelmann, R., Heese, B., Müller, D., Artaxo, P., Paixao, M., Pauliquevis, T., and Souza, R.: Aerosol profiling with lidar in the Amazon Basin during the wet and dry season, J. Geophys. Res.-Atmos., 117, 2012JD018338, https://doi.org/10.1029/2012JD018338, 2012. a
Baars, H., Kanitz, T., Engelmann, R., Althausen, D., Heese, B., Komppula, M., Preißler, J., Tesche, M., Ansmann, A., Wandinger, U., Lim, J.-H., Ahn, J. Y., Stachlewska, I. S., Amiridis, V., Marinou, E., Seifert, P., Hofer, J., Skupin, A., Schneider, F., Bohlmann, S., Foth, A., Bley, S., Pfüller, A., Giannakaki, E., Lihavainen, H., Viisanen, Y., Hooda, R. K., Pereira, S. N., Bortoli, D., Wagner, F., Mattis, I., Janicka, L., Markowicz, K. M., Achtert, P., Artaxo, P., Pauliquevis, T., Souza, R. A. F., Sharma, V. P., van Zyl, P. G., Beukes, J. P., Sun, J., Rohwer, E. G., Deng, R., Mamouri, R.-E., and Zamorano, F.: An overview of the first decade of PollyNET: an emerging network of automated Raman-polarization lidars for continuous aerosol profiling, Atmos. Chem. Phys., 16, 5111–5137, https://doi.org/10.5194/acp-16-5111-2016, 2016. a, b, c
Baars, H., Gebauer, H., Floutsi, A., Trapon, D., Bley, S., Althausen, D., Engelmann, R., Skupin, A., Radenz, M., Ansmann, A., Klamt, A., Heese, B., Wandinger, U., Silva, E., Rodrigues, E., Silva, P., Zenk, C., Paschou, P., and Marinou, E.: Quality assessment of Aeolus L2A products at Cabo Verde during JATAC and beyond - validation with ground-based lidar observations, EGU General Assembly 2023, Vienna, Austria, 23–28 Apr 2023, EGU23-5631, https://doi.org/10.5194/egusphere-egu23-5631, 2023. a
Baldauf, M., Seifert, A., Förstner, J., Majewski, D., Raschendorfer, M., and Reinhardt, T.: Operational Convective-Scale Numerical Weather Prediction with the COSMO Model: Description and Sensitivities, Mon. Weather Rev., 139, 3887–3905, https://doi.org/10.1175/MWR-D-10-05013.1, 2011. a
Balkanski, Y., Schulz, M., Claquin, T., and Guibert, S.: Reevaluation of Mineral aerosol radiative forcings suggests a better agreement with satellite and AERONET data, Atmos. Chem. Phys., 7, 81–95, https://doi.org/10.5194/acp-7-81-2007, 2007. a
Berge, E.: Transboundary air pollution in Europe. Part 2: Numerical addendum to emissions, dispersion and trends of acidifying and eutrophying agents, Norske Meteorologiske Inst., Oslo (Norway), https://www.osti.gov/etdeweb/biblio/646220 (last access: 28 August 2025), 1997. a
Boucher, O., Randall, D., Artaxo, P., Bretherton, C., Feingold, G., Forster, P., Kerminen, V.-M., Kondo, Y., Liao, H., Lohmann, U., Rasch, P., Satheesh, S., Sherwood, S., Stevens, B., and Zhang, X.: Clouds and aerosols, in: Climate Change 2013: The Physical Science Basis. Contribution of Working Group I to the Fifth Assessment Report of the Intergovernmental Panel on Climate Change, edited by: Stocker, T., Qin, D., Plattner, G.-K., Tignor, M., Allen, S., Doschung, J., Nauels, A., Xia, Y., Bex, V., Midgley, P., Fagerberg, J., Mowery, D. C., and Nelson, R. R., 571–657, Cambridge University Press, https://doi.org/10.1017/CBO9781107415324.016, 2013. a
Chang, Y., Hu, Q., Goloub, P., Podvin, T., Veselovskii, I., Ducos, F., Dubois, G., Saito, M., Lopatin, A., Dubovik, O., and Chen, C.: Retrieval of microphysical properties of dust aerosols from extinction, backscattering and depolarization lidar measurements using various particle scattering models, Atmos. Chem. Phys., 25, 6787–6821, https://doi.org/10.5194/acp-25-6787-2025, 2025. a, b, c, d, e, f, g, h
Chatziparaschos, M., Daskalakis, N., Myriokefalitakis, S., Kalivitis, N., Nenes, A., Gonçalves Ageitos, M., Costa-Surós, M., Pérez García-Pando, C., Zanoli, M., Vrekoussis, M., and Kanakidou, M.: Role of K-feldspar and quartz in global ice nucleation by mineral dust in mixed-phase clouds, Atmos. Chem. Phys., 23, 1785–1801, https://doi.org/10.5194/acp-23-1785-2023, 2023. a
Claquin, T., Schulz, M., and Balkanski, Y.: Modeling the mineralogy of atmospheric dust sources, J. Geophys. Res.-Atmos., 104, 22243–22256, https://doi.org/10.1029/1999JD900416, 1999. a, b, c, d
De Leeuw, G. and Lamberts, C.: Influence of refractive index and particle size interval on mie calculated backscatter and extinction, J. Aerosol Sci., 18, 131–138, https://doi.org/10.1016/0021-8502(87)90050-4, 1987. a, b, c, d
Di Biagio, C., Formenti, P., Balkanski, Y., Caponi, L., Cazaunau, M., Pangui, E., Journet, E., Nowak, S., Caquineau, S., Andreae, M. O., Kandler, K., Saeed, T., Piketh, S., Seibert, D., Williams, E., and Doussin, J.-F.: Global scale variability of the mineral dust long-wave refractive index: a new dataset of in situ measurements for climate modeling and remote sensing, Atmos. Chem. Phys., 17, 1901–1929, https://doi.org/10.5194/acp-17-1901-2017, 2017. a
Di Biagio, C., Formenti, P., Balkanski, Y., Caponi, L., Cazaunau, M., Pangui, E., Journet, E., Nowak, S., Andreae, M. O., Kandler, K., Saeed, T., Piketh, S., Seibert, D., Williams, E., and Doussin, J.-F.: Complex refractive indices and single-scattering albedo of global dust aerosols in the shortwave spectrum and relationship to size and iron content, Atmos. Chem. Phys., 19, 15503–15531, https://doi.org/10.5194/acp-19-15503-2019, 2019. a, b, c, d, e, f, g, h, i, j, k, l, m
Di Biagio, C., Balkanski, Y., Albani, S., Boucher, O., and Formenti, P.: Direct Radiative Effect by Mineral Dust Aerosols Constrained by New Microphysical and Spectral Optical Data, Geophys. Res. Lett., 47, e2019GL086186, https://doi.org/10.1029/2019GL086186, 2020. a
Dubovik, O., Sinyuk, A., Lapyonok, T., Holben, B. N., Mishchenko, M., Yang, P., Eck, T. F., Volten, H., Muñoz, O., Veihelmann, B., Van Der Zande, W. J., Leon, J., Sorokin, M., and Slutsker, I.: Application of spheroid models to account for aerosol particle nonsphericity in remote sensing of desert dust, J. Geophys. Res.-Atmos., 111, 2005JD006619, https://doi.org/10.1029/2005JD006619, 2006. a, b, c
Engelmann, R., Kanitz, T., Baars, H., Heese, B., Althausen, D., Skupin, A., Wandinger, U., Komppula, M., Stachlewska, I. S., Amiridis, V., Marinou, E., Mattis, I., Linné, H., and Ansmann, A.: The automated multiwavelength Raman polarization and water-vapor lidar PollyXT: the neXT generation, Atmos. Meas. Tech., 9, 1767–1784, https://doi.org/10.5194/amt-9-1767-2016, 2016. a, b
Esselborn, M., Wirth, M., Fix, A., Weinzierl, B., Rasp, K., Tesche, M., and Petzold, A.: Spatial distribution and optical properties of Saharan dust observed by airborne high spectral resolution lidar during SAMUM 2006, Tellus B, 61, 131, https://doi.org/10.1111/j.1600-0889.2008.00394.x, 2009. a, b, c
FAO-UNESCO: Soil Map of the World, 1:5 000 000, 10 volumes, UNESCO, Paris, France, 1974.
Formenti, P., Schütz, L., Balkanski, Y., Desboeufs, K., Ebert, M., Kandler, K., Petzold, A., Scheuvens, D., Weinbruch, S., and Zhang, D.: Recent progress in understanding physical and chemical properties of African and Asian mineral dust, Atmos. Chem. Phys., 11, 8231–8256, https://doi.org/10.5194/acp-11-8231-2011, 2011. a, b
Formenti, P., Caquineau, S., Desboeufs, K., Klaver, A., Chevaillier, S., Journet, E., and Rajot, J. L.: Mapping the physico-chemical properties of mineral dust in western Africa: mineralogical composition, Atmos. Chem. Phys., 14, 10663–10686, https://doi.org/10.5194/acp-14-10663-2014, 2014. a, b, c, d, e, f
Freudenthaler, V., Esselborn, M., Wiegner, M., Heese, B., Tesche, M., Ansmann, A., Müller, D., Althausen, D., Wirth, M., Fix, A., Ehret, G., Knippertz, P., Toledano, C., Gasteiger, J., Garhammer, M., and Seefeldner, M.: Depolarization ratio profiling at several wavelengths in pure Saharan dust during SAMUM 2006, Tellus B, 61, 165, https://doi.org/10.1111/j.1600-0889.2008.00396.x, 2009. a, b
Fuster, B., Sánchez-Zapero, J., Camacho, F., García-Santos, V., Verger, A., Lacaze, R., Weiss, M., Baret, F., and Smets, B.: Quality Assessment of PROBA-V LAI, fAPAR and fCOVER Collection 300 m Products of Copernicus Global Land Service, Remote Sensing, 12, 1017, https://doi.org/10.3390/rs12061017, 2020. a
Gebauer, H., Floutsi, A. A., Haarig, M., Radenz, M., Engelmann, R., Althausen, D., Skupin, A., Ansmann, A., Zenk, C., and Baars, H.: Tropospheric sulfate from Cumbre Vieja (La Palma) observed over Cabo Verde contrasted with background conditions: a lidar case study of aerosol extinction, backscatter, depolarization and lidar ratio profiles at 355, 532 and 1064 nm, Atmos. Chem. Phys., 24, 5047–5067, https://doi.org/10.5194/acp-24-5047-2024, 2024. a, b, c
Go, S., Lyapustin, A., Schuster, G. L., Choi, M., Ginoux, P., Chin, M., Kalashnikova, O., Dubovik, O., Kim, J., da Silva, A., Holben, B., and Reid, J. S.: Inferring iron-oxide species content in atmospheric mineral dust from DSCOVR EPIC observations, Atmos. Chem. Phys., 22, 1395–1423, https://doi.org/10.5194/acp-22-1395-2022, 2022. a, b, c, d, e, f
Gonçalves Ageitos, M., Obiso, V., Miller, R. L., Jorba, O., Klose, M., Dawson, M., Balkanski, Y., Perlwitz, J., Basart, S., Di Tomaso, E., Escribano, J., Macchia, F., Montané, G., Mahowald, N. M., Green, R. O., Thompson, D. R., and Pérez García-Pando, C.: Modeling dust mineralogical composition: sensitivity to soil mineralogy atlases and their expected climate impacts, Atmos. Chem. Phys., 23, 8623–8657, https://doi.org/10.5194/acp-23-8623-2023, 2023. a, b, c, d, e
Groß, S., Tesche, M., Freudenthaler, V., Toledano, C., Wiegner, M., Ansmann, A., Althausen, D., and Seefeldner, M.: Characterization of Saharan dust, marine aerosols and mixtures of biomass-burning aerosols and dust by means of multi-wavelength depolarization and Raman lidar measurements during SAMUM 2, Tellus B, 63, 706, https://doi.org/10.1111/j.1600-0889.2011.00556.x, 2011. a
Groß, S., Freudenthaler, V., Schepanski, K., Toledano, C., Schäfler, A., Ansmann, A., and Weinzierl, B.: Optical properties of long-range transported Saharan dust over Barbados as measured by dual-wavelength depolarization Raman lidar measurements, Atmos. Chem. Phys., 15, 11067–11080, https://doi.org/10.5194/acp-15-11067-2015, 2015. a, b
Gómez Maqueo Anaya, S., Althausen, D., Faust, M., Baars, H., Heinold, B., Hofer, J., Tegen, I., Ansmann, A., Engelmann, R., Skupin, A., Heese, B., and Schepanski, K.: The implementation of dust mineralogy in COSMO5.05-MUSCAT, Geosci. Model Dev., 17, 1271–1295, https://doi.org/10.5194/gmd-17-1271-2024, 2024a. a, b, c, d, e
Gómez Maqueo Anaya, S., Althausen, D., Hofer, J., Haarig, M., Baars, H., Faust, M., Heinold, B., Tegen, I., Wandinger, U., Ansmann, A., Engelmann, R., Skupin, A., Heese, B., and Schepanski, K.: PollyXT and COSMO-MUSCAT data for “Investigating the link between mineral dust hematite content and intensive optical properties by means of lidar measurements and aerosol modelling”, Zenodo [data set], https://doi.org/10.5281/zenodo.13908846, 2024b. a
Haarig, M., Ansmann, A., Althausen, D., Klepel, A., Groß, S., Freudenthaler, V., Toledano, C., Mamouri, R.-E., Farrell, D. A., Prescod, D. A., Marinou, E., Burton, S. P., Gasteiger, J., Engelmann, R., and Baars, H.: Triple-wavelength depolarization-ratio profiling of Saharan dust over Barbados during SALTRACE in 2013 and 2014, Atmos. Chem. Phys., 17, 10767–10794, https://doi.org/10.5194/acp-17-10767-2017, 2017. a, b
Haarig, M., Walser, A., Ansmann, A., Dollner, M., Althausen, D., Sauer, D., Farrell, D., and Weinzierl, B.: Profiles of cloud condensation nuclei, dust mass concentration, and ice-nucleating-particle-relevant aerosol properties in the Saharan Air Layer over Barbados from polarization lidar and airborne in situ measurements, Atmos. Chem. Phys., 19, 13773–13788, https://doi.org/10.5194/acp-19-13773-2019, 2019. a, b
Haarig, M., Ansmann, A., Engelmann, R., Baars, H., Toledano, C., Torres, B., Althausen, D., Radenz, M., and Wandinger, U.: First triple-wavelength lidar observations of depolarization and extinction-to-backscatter ratios of Saharan dust, Atmos. Chem. Phys., 22, 355–369, https://doi.org/10.5194/acp-22-355-2022, 2022. a, b, c
Haarig, M., Engelmann, R., Baars, H., Gast, B., Althausen, D., and Ansmann, A.: Discussion of the spectral slope of the lidar ratio between 355 and 1064 nm from multiwavelength Raman lidar observations, Atmos. Chem. Phys., 25, 7741–7763, https://doi.org/10.5194/acp-25-7741-2025, 2025. a
Heinold, B., Tegen, I., Schepanski, K., Tesche, M., Esselborn, M., Freudenthaler, V., Gross, S., Kandler, K., Knippertz, P., Müller, D., Schladitz, A., Toledano, C., Weinzierl, B., Ansmann, A., Althausen, D., Müller, T., Petzold, A., and Wiedensohler, A.: Regional modelling of Saharan dust and biomass-burning smoke: Part 1: Model description and evaluation, Tellus B, 63, 781–799, https://doi.org/10.1111/j.1600-0889.2011.00570.x, 2011. a, b
Heinold, B., Tegen, I., Schepanski, K., and Banks, J. R.: New developments in the representation of Saharan dust sources in the aerosol–climate model ECHAM6-HAM2, Geosci. Model Dev., 9, 765–777, https://doi.org/10.5194/gmd-9-765-2016, 2016. a
Highwood, E. J. and Ryder, C. L.: Radiative effects of dust, in: Mineral Dust: A Key Player in the Earth System, edited by: Knippertz, P. and Stuut J. B., Springer, https://doi.org/10.1007/978-94-017-8978-3_11, 2014. a
Hofer, J., Althausen, D., Abdullaev, S. F., Makhmudov, A. N., Nazarov, B. I., Schettler, G., Engelmann, R., Baars, H., Fomba, K. W., Müller, K., Heinold, B., Kandler, K., and Ansmann, A.: Long-term profiling of mineral dust and pollution aerosol with multiwavelength polarization Raman lidar at the Central Asian site of Dushanbe, Tajikistan: case studies, Atmos. Chem. Phys., 17, 14559–14577, https://doi.org/10.5194/acp-17-14559-2017, 2017. a
Hofer, J., Ansmann, A., Althausen, D., Engelmann, R., Baars, H., Fomba, K. W., Wandinger, U., Abdullaev, S. F., and Makhmudov, A. N.: Optical properties of Central Asian aerosol relevant for spaceborne lidar applications and aerosol typing at 355 and 532 nm, Atmos. Chem. Phys., 20, 9265–9280, https://doi.org/10.5194/acp-20-9265-2020, 2020. a, b, c
Holben, B. N., Eck, T. F., Slutsker, I., Tanré, D., Buis, J. P., Setzer, A., Vermote, E., Reagan, J. A., Kaufman, Y. J., Nakajima, T., Lavenu, F., Jankowiak, I., and Smirnov, A.: AERONET – A Federated Instrument Network and Data Archive for Aerosol Characterization, Remote Sens. Environ., 66, 1–16, https://doi.org/10.1016/S0034-4257(98)00031-5, 1998. a
Huang, Y., Kok, J. F., Saito, M., and Muñoz, O.: Single-scattering properties of ellipsoidal dust aerosols constrained by measured dust shape distributions, Atmos. Chem. Phys., 23, 2557–2577, https://doi.org/10.5194/acp-23-2557-2023, 2023. a, b
Jakobsen, H. A., Berge, E., and Jonson, J. E.: The Multi-layer Eulerian Model: Model Description and Evaluation of Transboundary Fluxes of Sulphur and Nitrogen for One Year, DNMI Research Report 49, Meteorological Synthesizing Centre-West, https://books.google.de/books?id=Lu8ivwEACAAJ (last access: 28 August 2025), 1997. a
Journet, E., Balkanski, Y., and Harrison, S. P.: A new data set of soil mineralogy for dust-cycle modeling, Atmos. Chem. Phys., 14, 3801–3816, https://doi.org/10.5194/acp-14-3801-2014, 2014. a
Järvinen, E., Kemppinen, O., Nousiainen, T., Kociok, T., Möhler, O., Leisner, T., and Schnaiter, M.: Laboratory investigations of mineral dust near-backscattering depolarization ratios, J. Quant. Spectrosc. Ra., 178, 192–208, https://doi.org/10.1016/j.jqsrt.2016.02.003, 2016. a
Kandler, K., Schütz, L., Deutscher, C., Ebert, M., Hofmann, H., Jäckel, S., Jaenicke, R., Knippertz, P., Lieke, K., Massling, A., Petzold, A., Schladitz, A., Weinzierl, B., Wiedensohler, A., Zorn, S., and Weinbruch, S.: Size distribution, mass concentration, chemical and mineralogical composition and derived optical parameters of the boundary layer aerosol at Tinfou, Morocco, during SAMUM 2006, Tellus B, 61, 32, https://doi.org/10.1111/j.1600-0889.2008.00385.x, 2009. a, b
Klett, J. D.: Lidar inversion with variable backscatter/extinction ratios, Applied Optics, 24, 1638, https://doi.org/10.1364/AO.24.001638, 1985. a
Kok, J. F.: A scaling theory for the size distribution of emitted dust aerosols suggests climate models underestimate the size of the global dust cycle, P. Natl. Acad. Sci. USA, 108, 1016–1021, https://doi.org/10.1073/pnas.1014798108, 2011. a, b
Kok, J. F., Ridley, D. A., Zhou, Q., Miller, R. L., Zhao, C., Heald, C. L., Ward, D. S., Albani, S., and Haustein, K.: Smaller desert dust cooling effect estimated from analysis of dust size and abundance, Nat. Geosci., 10, 274–278, https://doi.org/10.1038/ngeo2912, 2017. a, b, c, d
Kok, J. F., Adebiyi, A. A., Albani, S., Balkanski, Y., Checa-Garcia, R., Chin, M., Colarco, P. R., Hamilton, D. S., Huang, Y., Ito, A., Klose, M., Li, L., Mahowald, N. M., Miller, R. L., Obiso, V., Pérez García-Pando, C., Rocha-Lima, A., and Wan, J. S.: Contribution of the world's main dust source regions to the global cycle of desert dust, Atmos. Chem. Phys., 21, 8169–8193, https://doi.org/10.5194/acp-21-8169-2021, 2021. a
Kok, J. F., Storelvmo, T., Karydis, V. A., Adebiyi, A. A., Mahowald, N. M., Evan, A. T., He, C., and Leung, D. M.: Mineral dust aerosol impacts on global climate and climate change, Nature Reviews Earth & Environment, 4, 71–86, https://doi.org/10.1038/s43017-022-00379-5, 2023. a
Lafon, S., Rajot, J.-L., Alfaro, S. C., and Gaudichet, A.: Quantification of iron oxides in desert aerosol, Atmos. Environ., 38, 1211–1218, https://doi.org/10.1016/j.atmosenv.2003.11.006, 2004. a, b
Li, J., Carlson, B. E., Yung, Y. L., Lv, D., Hansen, J., Penner, J. E., Liao, H., Ramaswamy, V., Kahn, R. A., Zhang, P., Dubovik, O., Ding, A., Lacis, A. A., Zhang, L., and Dong, Y.: Scattering and absorbing aerosols in the climate system, Nature Reviews Earth & Environment, 3, 363–379, https://doi.org/10.1038/s43017-022-00296-7, 2022. a
Li, L., Mahowald, N. M., Miller, R. L., Pérez García-Pando, C., Klose, M., Hamilton, D. S., Gonçalves Ageitos, M., Ginoux, P., Balkanski, Y., Green, R. O., Kalashnikova, O., Kok, J. F., Obiso, V., Paynter, D., and Thompson, D. R.: Quantifying the range of the dust direct radiative effect due to source mineralogy uncertainty, Atmos. Chem. Phys., 21, 3973–4005, https://doi.org/10.5194/acp-21-3973-2021, 2021. a, b
Li, L., Mahowald, N. M., Gonçalves Ageitos, M., Obiso, V., Miller, R. L., Pérez García-Pando, C., Di Biagio, C., Formenti, P., Brodrick, P. G., Clark, R. N., Green, R. O., Kokaly, R., Swayze, G., and Thompson, D. R.: Improved constraints on hematite refractive index for estimating climatic effects of dust aerosols, Communications Earth & Environment, 5, 295, https://doi.org/10.1038/s43247-024-01441-4, 2024. a, b, c, d, e
Mahowald, N. M., Kloster, S., Engelstaedter, S., Moore, J. K., Mukhopadhyay, S., McConnell, J. R., Albani, S., Doney, S. C., Bhattacharya, A., Curran, M. A. J., Flanner, M. G., Hoffman, F. M., Lawrence, D. M., Lindsay, K., Mayewski, P. A., Neff, J., Rothenberg, D., Thomas, E., Thornton, P. E., and Zender, C. S.: Observed 20th century desert dust variability: impact on climate and biogeochemistry, Atmos. Chem. Phys., 10, 10875–10893, https://doi.org/10.5194/acp-10-10875-2010, 2010. a
Mamouri, R. E. and Ansmann, A.: Fine and coarse dust separation with polarization lidar, Atmos. Meas. Tech., 7, 3717–3735, https://doi.org/10.5194/amt-7-3717-2014, 2014. a, b, c, d
Mamouri, R.-E. and Ansmann, A.: Potential of polarization/Raman lidar to separate fine dust, coarse dust, maritime, and anthropogenic aerosol profiles, Atmos. Meas. Tech., 10, 3403–3427, https://doi.org/10.5194/amt-10-3403-2017, 2017. a, b, c, d, e
Marticorena, B. and Bergametti, G.: Modeling the atmospheric dust cycle: 1. Design of a soil-derived dust emission scheme, J. Geophys. Res.-Atmos., 100, 16415–16430, https://doi.org/10.1029/95JD00690, 1995. a, b
Menut, L., Siour, G., Bessagnet, B., Couvidat, F., Journet, E., Balkanski, Y., and Desboeufs, K.: Modelling the mineralogical composition and solubility of mineral dust in the Mediterranean area with CHIMERE 2017r4, Geosci. Model Dev., 13, 2051–2071, https://doi.org/10.5194/gmd-13-2051-2020, 2020. a
Miffre, A., Cholleton, D., and Rairoux, P.: On the use of light polarization to investigate the size, shape, and refractive index dependence of backscattering Ångström exponents, Optics Letters, 45, 1084, https://doi.org/10.1364/OL.385107, 2020. a, b, c, d, e, f, g, h, i, j
Miffre, A., Cholleton, D., Noël, C., and Rairoux, P.: Investigating the dependence of mineral dust depolarization on complex refractive index and size with a laboratory polarimeter at 180.0° lidar backscattering angle, Atmos. Meas. Tech., 16, 403–417, https://doi.org/10.5194/amt-16-403-2023, 2023. a, b, c, d, e, f, g, h
Moosmüller, H., Engelbrecht, J. P., Skiba, M., Frey, G., Chakrabarty, R. K., and Arnott, W. P.: Single scattering albedo of fine mineral dust aerosols controlled by iron concentration, J. Geophys. Res.-Atmos., 117, 2011JD016909, https://doi.org/10.1029/2011JD016909, 2012. a
Müller, D., Veselovskii, I., Kolgotin, A., Tesche, M., Ansmann, A., and Dubovik, O.: Vertical profiles of pure dust and mixed smoke–dust plumes inferred from inversion of multiwavelength Raman/polarization lidar data and comparison to AERONET retrievals and in situ observations, Applied Optics, 52, 3178, https://doi.org/10.1364/AO.52.003178, 2013. a
Müller, T., Schladitz, A., Massling, A., Kaaden, N., Kandler, K., and Wiedensohler, A.: Spectral absorption coefficients and imaginary parts of refractive indices of Saharan dust during SAMUM-1, Tellus B, 61, 79, https://doi.org/10.1111/j.1600-0889.2008.00399.x, 2009. a, b
Muñoz Sabater, J. and Copernicus Climate Change Service, S.: ERA5-Land hourly data from 2001 to present [data set], https://doi.org/10.24381/CDS.E2161BAC, 2019. a
Nickovic, S., Vukovic, A., Vujadinovic, M., Djurdjevic, V., and Pejanovic, G.: Technical Note: High-resolution mineralogical database of dust-productive soils for atmospheric dust modeling, Atmos. Chem. Phys., 12, 845–855, https://doi.org/10.5194/acp-12-845-2012, 2012. a, b, c
Pérez García‐Pando, C., Miller, R. L., Perlwitz, J. P., Rodríguez, S., and Prospero, J. M.: Predicting the mineral composition of dust aerosols: Insights from elemental composition measured at the Izaña Observatory, Geophys. Res. Lett., 43, 10520–10529, https://doi.org/10.1002/2016GL069873, 2016. a, b
Perlwitz, J. P., Pérez García-Pando, C., and Miller, R. L.: Predicting the mineral composition of dust aerosols – Part 1: Representing key processes, Atmos. Chem. Phys., 15, 11593–11627, https://doi.org/10.5194/acp-15-11593-2015, 2015a. a, b, c
Perlwitz, J. P., Pérez García-Pando, C., and Miller, R. L.: Predicting the mineral composition of dust aerosols – Part 2: Model evaluation and identification of key processes with observations, Atmos. Chem. Phys., 15, 11629–11652, https://doi.org/10.5194/acp-15-11629-2015, 2015b. a, b, c
Poggio, L., de Sousa, L. M., Batjes, N. H., Heuvelink, G. B. M., Kempen, B., Ribeiro, E., and Rossiter, D.: SoilGrids 2.0: producing soil information for the globe with quantified spatial uncertainty, SOIL, 7, 217–240, https://doi.org/10.5194/soil-7-217-2021, 2021. a
Prigent, C., Aires, F., Rossow, W. B., and Robock, A.: Sensitivity of satellite microwave and infrared observations to soil moisture at a global scale: Relationship of satellite observations to in situ soil moisture measurements, J. Geophys. Res.-Atmos., 110, D07110, https://doi.org/10.1029/2004JD005087, 2005. a
Saito, M. and Yang, P.: Advanced Bulk Optical Models Linking the Backscattering and Microphysical Properties of Mineral Dust Aerosol, Geophys. Res. Lett., 48, e2021GL095121, https://doi.org/10.1029/2021GL095121, 2021. a, b, c
Saito, M., Yang, P., Ding, J., and Liu, X.: A comprehensive database of the optical properties of irregular aerosol particles for radiative transfer simulations, J. Atmos. Sci., 78, 2089–2111, https://doi.org/10.1175/JAS-D-20-0338.1, 2021. a, b
Sakai, T., Nagai, T., Zaizen, Y., and Mano, Y.: Backscattering linear depolarization ratio measurements of mineral, sea-salt, and ammonium sulfate particles simulated in a laboratory chamber, Applied Optics, 49, 4441, https://doi.org/10.1364/AO.49.004441, 2010. a
Scanza, R. A., Mahowald, N., Ghan, S., Zender, C. S., Kok, J. F., Liu, X., Zhang, Y., and Albani, S.: Modeling dust as component minerals in the Community Atmosphere Model: development of framework and impact on radiative forcing, Atmos. Chem. Phys., 15, 537–561, https://doi.org/10.5194/acp-15-537-2015, 2015. a, b
Schepanski, K., Tegen, I., Laurent, B., Heinold, B., and Macke, A.: A new Saharan dust source activation frequency map derived from MSG-SEVIRI IR-channels, Geophys. Res. Lett., 34, L18803, https://doi.org/10.1029/2007GL030168, 2007. a
Schepanski, K., Tegen, I., and Macke, A.: Saharan dust transport and deposition towards the tropical northern Atlantic, Atmos. Chem. Phys., 9, 1173–1189, https://doi.org/10.5194/acp-9-1173-2009, 2009. a, b, c, d, e
Schepanski, K., Mallet, M., Heinold, B., and Ulrich, M.: North African dust transport toward the western Mediterranean basin: atmospheric controls on dust source activation and transport pathways during June–July 2013, Atmos. Chem. Phys., 16, 14147–14168, https://doi.org/10.5194/acp-16-14147-2016, 2016. a
Schepanski, K., Heinold, B., and Tegen, I.: Harmattan, Saharan heat low, and West African monsoon circulation: modulations on the Saharan dust outflow towards the North Atlantic, Atmos. Chem. Phys., 17, 10223–10243, https://doi.org/10.5194/acp-17-10223-2017, 2017. a, b
Scheuvens, D., Schütz, L., Kandler, K., Ebert, M., and Weinbruch, S.: Bulk composition of northern African dust and its source sediments – A compilation, Earth-Sc. Rev., 116, 170–194, https://doi.org/10.1016/j.earscirev.2012.08.005, 2013. a, b
Schuster, G. L., Vaughan, M., MacDonnell, D., Su, W., Winker, D., Dubovik, O., Lapyonok, T., and Trepte, C.: Comparison of CALIPSO aerosol optical depth retrievals to AERONET measurements, and a climatology for the lidar ratio of dust, Atmos. Chem. Phys., 12, 7431–7452, https://doi.org/10.5194/acp-12-7431-2012, 2012. a, b, c, d, e, f
Seinfeld, J. H. and Pandis, S. N.: Atmospheric Chemistry and Physics: From Air Pollution to Climate Change, 3rd edn., John Wiley & Sons, Hoboken, 3 edn., ISBN 978-1-118-94740-1, https://www.wiley.com/en-us/Atmospheric+Chemistry+and+Physics:+From+Air+Pollution+to+Climate+Change,+3rd+Edition-p-9781118947401 (last access: 28 August 2025), 2016. a
Sokolik, I., Andronova, A., and Johnson, T. C.: Complex refractive index of atmospheric dust aerosols, Atmos. Environ. A.-Gen., 27, 2495–2502, https://doi.org/10.1016/0960-1686(93)90021-P, 1993. a
Sokolik, I. N. and Toon, O. B.: Direct radiative forcing by anthropogenic airborne mineral aerosols, Nature, 381, 681–683, https://doi.org/10.1038/381681a0, 1996. a
Sokolik, I. N. and Toon, O. B.: Incorporation of mineralogical composition into models of the radiative properties of mineral aerosol from UV to IR wavelengths, J. Geophys. Res.-Atmos., 104, 9423–9444, https://doi.org/10.1029/1998JD200048, 1999. a
Solomos, S., Spyrou, C., Barreto, A., Rodríguez, S., González, Y., Neophytou, M. K. A., Mouzourides, P., Bartsotas, N. S., Kalogeri, C., Nickovic, S., Vukovic Vimic, A., Vujadinovic Mandic, M., Pejanovic, G., Cvetkovic, B., Amiridis, V., Sykioti, O., Gkikas, A., and Zerefos, C.: The Development of METAL-WRF Regional Model for the Description of Dust Mineralogy in the Atmosphere, Atmosphere, 14, 1615, https://doi.org/10.3390/atmos14111615, 2023. a
Tegen, I., Harrison, S. P., Kohfeld, K., Prentice, I. C., Coe, M., and Heimann, M.: Impact of vegetation and preferential source areas on global dust aerosol: Results from a model study, J. Geophys. Res.-Atmos., 107, AAC 14-1–AAC 14-27, https://doi.org/10.1029/2001JD000963, 2002. a
Tegen, I., Schepanski, K., and Heinold, B.: Comparing two years of Saharan dust source activation obtained by regional modelling and satellite observations, Atmos. Chem. Phys., 13, 2381–2390, https://doi.org/10.5194/acp-13-2381-2013, 2013. a, b
Tesche, M., Ansmann, A., Müller, D., Althausen, D., Engelmann, R., Freudenthaler, V., and Groß, S.: Vertically resolved separation of dust and smoke over Cape Verde using multiwavelength Raman and polarization lidars during Saharan Mineral Dust Experiment 2008, J. Geophys. Res.-Atmos., 114, 2009JD011862, https://doi.org/10.1029/2009JD011862, 2009a. a
Tesche, M., Ansmann, A., Müller, D., Althausen, D., Mattis, I., Heese, B., Freudenthaler, V., Wiegner, M., Esselborn, M., Pisani, G., and Knippertz, P.: Vertical profiling of Saharan dust with Raman lidars and airborne HSRL in southern Morocco during SAMUM, Tellus B, 61, 144, https://doi.org/10.1111/j.1600-0889.2008.00390.x, 2009b. a
Tesche, M., Gross, S., Ansmann, A., Müller, D., Althausen, D., Freudenthaler, V., and Esselborn, M.: Profiling of Saharan dust and biomass-burning smoke with multiwavelength polarization Raman lidar at Cape Verde, Tellus B, 63, 649–676, https://doi.org/10.1111/j.1600-0889.2011.00548.x, 2011. a, b, c, d, e, f, g, h, i
Veselovskii, I., Goloub, P., Podvin, T., Bovchaliuk, V., Derimian, Y., Augustin, P., Fourmentin, M., Tanre, D., Korenskiy, M., Whiteman, D. N., Diallo, A., Ndiaye, T., Kolgotin, A., and Dubovik, O.: Retrieval of optical and physical properties of African dust from multiwavelength Raman lidar measurements during the SHADOW campaign in Senegal, Atmos. Chem. Phys., 16, 7013–7028, https://doi.org/10.5194/acp-16-7013-2016, 2016. a, b, c
Veselovskii, I., Hu, Q., Goloub, P., Podvin, T., Korenskiy, M., Derimian, Y., Legrand, M., and Castellanos, P.: Variability in lidar-derived particle properties over West Africa due to changes in absorption: towards an understanding, Atmospheric Chemistry and Physics, 20, 6563–6581, https://doi.org/10.5194/acp-20-6563-2020, 2020. a, b, c, d, e, f, g, h, i, j, k, l, m, n
Wagner, R., Ajtai, T., Kandler, K., Lieke, K., Linke, C., Müller, T., Schnaiter, M., and Vragel, M.: Complex refractive indices of Saharan dust samples at visible and near UV wavelengths: a laboratory study, Atmos. Chem. Phys., 12, 2491–2512, https://doi.org/10.5194/acp-12-2491-2012, 2012. a, b, c, d, e, f, g
Wagner, R., Schepanski, K., Heinold, B., and Tegen, I.: Interannual variability in the Saharan dust source activation – Toward understanding the differences between 2007 and 2008, J. Geophys. Res.-Atmos., 121, 4538–4562, https://doi.org/10.1002/2015JD024302, 2016. a
Wandinger, U., Floutsi, A. A., Baars, H., Haarig, M., Ansmann, A., Hünerbein, A., Docter, N., Donovan, D., van Zadelhoff, G.-J., Mason, S., and Cole, J.: HETEAC – the Hybrid End-To-End Aerosol Classification model for EarthCARE, Atmos. Meas. Tech., 16, 2485–2510, https://doi.org/10.5194/amt-16-2485-2023, 2023. a, b, c, d, e, f, g, h
Weinzierl, B., Ansmann, A., Prospero, J. M., Althausen, D., Benker, N., Chouza, F., Dollner, M., Farrell, D., Fomba, W. K., Freudenthaler, V., Gasteiger, J., Groß, S., Haarig, M., Heinold, B., Kandler, K., Kristensen, T. B., Mayol-Bracero, O. L., Müller, T., Reitebuch, O., Sauer, D., Schäfler, A., Schepanski, K., Spanu, A., Tegen, I., Toledano, C., and Walser, A.: The Saharan Aerosol Long-Range Transport and Aerosol–Cloud-Interaction Experiment: Overview and Selected Highlights, B. Am. Meteorol. Soc., 98, 1427–1451, https://doi.org/10.1175/BAMS-D-15-00142.1, 2017. a
Wolke, R. and Knoth, O.: Implicit–explicit Runge–Kutta methods applied to atmospheric chemistry-transport modelling, Environ. Modell. Softw., 15, 711–719, https://doi.org/10.1016/S1364-8152(00)00034-7, 2000. a
Wolke, R., Schröder, W., Schrödner, R., and Renner, E.: Influence of grid resolution and meteorological forcing on simulated European air quality: A sensitivity study with the modeling system COSMO–MUSCAT, Atmos. Environ., 53, 110–130, https://doi.org/10.1016/j.atmosenv.2012.02.085, 2012. a
Zhang, L., Gong, S., Padro, J., and Barrie, L.: A size-segregated particle dry deposition scheme for an atmospheric aerosol module, Atmos. Environ., 35, 549–560, https://doi.org/10.1016/S1352-2310(00)00326-5, 2001. a
Zhang, Y., Saito, M., Yang, P., Schuster, G., and Trepte, C.: Sensitivities of Spectral Optical Properties of Dust Aerosols to Their Mineralogical and Microphysical Properties, J. Geophys. Res.-Atmos., 129, e2023JD040181, https://doi.org/10.1029/2023JD040181, 2024. a, b, c, d
- Abstract
- Introduction
- Methodology
- Results and discussion
- Conclusion and implications
- Appendix A: Comparison between COSMO-MUSCAT-derived and AERONET AOT
- Appendix B: Lidar ratio Ångström exponent vs. hematite fraction
- Data availability
- Author contributions
- Competing interests
- Disclaimer
- Acknowledgements
- Financial support
- Review statement
- References