the Creative Commons Attribution 4.0 License.
the Creative Commons Attribution 4.0 License.
 | 03 Sep 2025
Weak influence of anthropogenic emissions on aerosol, cloud, and rain in the wet season of the Amazon rainforest
Xuemei Wang
Kenneth S. Carslaw
Daniel P. Grosvenor
Hamish Gordon
Anthropogenic emissions have been shown to affect new particle formation, aerosol concentrations, and clouds. Such effects vary with region, environmental conditions, and cloud types. In the wet season of Amazonia, anthropogenic emissions emitted from Manaus, Brazil, can significantly increase the cloud condensation nuclei (CCN) concentrations compared to the background of mainly natural aerosols. However, the regional response of cloud and rain to anthropogenic emissions in Amazonia remains very uncertain. Here, we aim to quantify how aerosol concentration, cloud, and rain respond to changes in anthropogenic emissions through parameterized new particle formation and primary aerosol emission in the Manaus region and to understand the underlying mechanisms. We ran the atmosphere-only configuration of the HadGEM3 climate model with a nested regional domain that covers most of the rainforest region (720 km by 1200 km with 3 km resolution) under scaled regional emissions. The 7 d simulations show that, in the areas that are affected by anthropogenic emissions, when aerosol and precursor gas emissions are doubled from the baseline emission inventories, aerosol number concentrations increase by 13 %. The nucleation rate that involves sulfuric acid and biogenic compounds generally increases with pollution levels. However, nucleation is suppressed very close to the pollution source, resulting in lower nucleation and soluble Aitken mode aerosol number concentrations. We also found that doubling the anthropogenic emission can increase the cloud droplet number concentrations (Nd) by 9 %, but cloud water and rain mass mixing ratios do not change significantly. Even very strong reductions in aerosol number concentrations by a factor of 4, which is an unrealistic condition, cause only a 4 % increase in rain over the domain. If we assume our simulation has a fine enough grid resolution and an accurate representation of the relevant atmospheric processes, the simulated weak and non-linear response of cloud and rain properties to linearly scaled anthropogenic emissions suggests that the interactions among aerosol, cloud, and precipitation in the Amazonian convective environment are buffered by microphysical processes. It also implies that the convective environment is resilient to the changes in Nd that occur in response to localized anthropogenic aerosol perturbations.
- Article
(8779 KB) - Full-text XML
- BibTeX
- EndNote


Anthropogenic aerosols contribute a high fraction of uncertainty in the radiative forcing of climate change by acting as cloud condensation nuclei (CCN; Jones et al., 1994; Wang and Penner, 2009). Several modelling studies have shown that anthropogenic emissions can affect aerosol concentrations and CCN (Manktelow et al., 2009; Laakso et al., 2013; Yu et al., 2013; Shrivastava et al., 2019; Zhao et al., 2021). Changes in CCN concentration influence cloud properties such as cloud droplet number concentration (Nd), which then causes cloud adjustments of the liquid water path (LWP) and cloud fraction (Twomey, 1977; Albrecht, 1989; Kamae et al., 2015). The influence of aerosol and pollution on cloud optical depth, cloud thickness, Nd, and precipitation has been investigated by observational studies (Sporre et al., 2012; Gonçalves et al., 2015; Fan et al., 2018; Douglas and L'Ecuyer, 2021). However, it is hard to interpret and quantify the influences of anthropogenic emissions on clouds, especially for convective clouds, which involve a complex relationship between aerosol particles, thermodynamic processes, and cloud microphysics. In this study, we aim to investigate the extent to which the anthropogenic emissions affect aerosol concentration, cloud, rain, and the underlying mechanisms. Despite the difficulties, many previous studies have investigated the relationship between aerosol and convective clouds. Cecchini et al. (2016) used the observations from GoAmazon2014/5 (Observations and Modeling of the Green Ocean Amazon 2014–2015) and showed that, under polluted conditions, the warm-phase cloud droplet effective diameter had changes of 10 %–40 % and Nd differed by a factor of 10 vertically compared to the background conditions (Cecchini et al., 2016). An increased loading of aerosol particles can also influence the mass of liquid that condenses and/or freezes, releasing extra latent heat. Hence, the change in cloud microphysics has the potential to affect cloud dynamics (e.g. updraught velocity), cloud fraction, etc. (Kawamoto, 2006; Rosenfeld et al., 2008; Marinescu et al., 2021). The response of clouds to increasing aerosol concentrations may depend on aerosol sizes. Fan et al. (2018) showed that extra particles, as small as 50 nm in diameter, from pollution plumes could form additional cloud droplets and release extra latent heat, which would subsequently “invigorate” deep convection in Amazonia. This process refers to the strengthening of convective updraughts (Andreae et al., 2004; Rosenfeld et al., 2008) and is a topic of much discussion (e.g. Lebo et al., 2012; Grabowski and Morrison, 2020, 2021; Igel and van den Heever, 2021; Varble et al., 2023). Koren et al. (2010) used satellite data from MODIS and found that more aerosols could cause taller clouds and larger anvils. A greater concentration of aerosol could also cause a higher cloud fraction (Koren et al., 2005, 2008, 2010) and cloud top height (Koren et al., 2012). Zaveri et al. (2022) found that the rapid growth of particles at a few nanometres in diameter could lead to the suppression of precipitation from shallow clouds and then trigger a shallow to deep cloud transition. Increasing aerosol concentrations can also produce more smaller-sized ice crystals. These extra ice crystals are formed by increased concentrations of cloud droplets due to high supersaturation levels in deep convective clouds (Khain et al., 2012; Fan et al., 2013; Herbert et al., 2015; Grabowski and Morrison, 2020). Such increase in ice may affect graupel formation (van den Heever and Cotton, 2007; Khain et al., 2011; Li et al., 2021) and can form a greater anvil (Fan et al., 2010; Morrison and Grabowski, 2011; Yan et al., 2014). The large number of complex interacting processes in deep convective clouds (activation, autoconversion, accretion, sedimentation, latent heat release, etc.) implies that the effects of aerosol on precipitation in these clouds are likely buffered and vary with region, background aerosols, and environmental conditions (Fan et al., 2007; Tao et al., 2007; Khain et al., 2008; Lee et al., 2008; Fan et al., 2009; Khain, 2009; Connolly et al., 2013). The impact of aerosols on deep convective systems is overshadowed by strong large-scale meteorological forcing and dynamical feedbacks that appear to diminish aerosol-induced perturbations (Morrison, 2012; Grabowski, 2018; Dagan et al., 2022). Nonetheless, studies have found both a reduction of light rain in some clouds and enhancements of warm rain in others due to increased aerosol concentrations (Wang et al., 2011; Fan et al., 2012; Tao et al., 2012). A continuous supply of CCN was found necessary to sustain storm clouds, and extra submicron aerosol activation was found to invigorate deep convective clouds (Ekman et al., 2004; Fan et al., 2018), whereas adding large particles to the environment can cause a reduction of rain in mixed-phase clouds (Pan et al., 2022). The suppression of ice clouds occurs because large CCN can directly activate and form warm rain (Feingold et al., 1999; Yin et al., 2000; van den Heever et al., 2006). As a result of this complexity, the effects of anthropogenic emissions on clouds via new particle formation (NPF) and aerosols are still not well understood. Amazonia is one of the most pristine environments in the present day, especially during the wet season, when rain cleans the air, but the environment is still affected by pollution from cities like Manaus in central Amazonia. Aircraft measurements over Manaus and the downwind forest have shown that around 20 % of the total particulate matter at 1 µm diameter are composed of anthropogenic sources, which include sulfates, nitrates, and ammonium (Shilling et al., 2018). Observations from a research tower downwind of Manaus showed that the total submicron particulate matter concentration is up to a factor of 2 higher in polluted conditions than in background conditions (de Sá et al., 2018). Cirino et al. (2018) used observations from two towers downwind of Manaus to show that the fractional contribution of organic gas molecules to aerosol mass increased when the sites were further away from emission sources, implying the decreasing influences of pollution with longer distance from the emission source. Glicker et al. (2019) reported higher particle concentrations during high-pollution days from observations, and their back-trajectory model showed that the high concentrations were due to emissions from Manaus. Other modelling studies have also confirmed that anthropogenic emissions enhanced aerosol mass by a up to factor of 4 and enhanced number concentrations by a factor of 5–25 downwind of Manaus (Shrivastava et al., 2019; Zhao et al., 2021). To study the effects of anthropogenic emissions on aerosol and cloud over Amazonia, especially for deep convective clouds, we use a regional model with high-resolution emissions and resolved convection nested inside a global model. We aim to answer the following two questions:
-
What are the effects of anthropogenic emissions on aerosol, cloud, and rain in Amazonia?
-
What are the mechanisms that drive changes in aerosol and cloud properties?
Our paper is organized as follows. Section 2 presents the observations and model configurations as well as the simulation details used in this study. The results are shown in Sect. 3. Section 3.1 shows a comparison between the regional model results and observations. Sections 3.2 and 3.3 describe the effects of anthropogenic emissions on aerosol particles, cloud, and rain profiles. We discuss and conclude the results in Sect. 4.
2.1 GoAmazon2014/5 campaign and G-1 aircraft observations
The observations used in this study are from the 2-year field campaign Observations and Modeling of the Green Ocean Amazon 2014–2015 (GoAmazon2014/5) in central Amazonia (Martin et al., 2016, 2017). The campaign aimed to study the response of the Amazonian environment under pollution plumes transported from Manaus in 2014 and 2015. The campaign included aircraft measurements on board a low-altitude G-159 Gulfstream I (G-1) in February, March, August, September, and October 2014. There were nine fixed research sites that collected observations in various environments, such as urban, forest, and pasture, both upwind and downwind of Manaus in the form of transects of the pollution plume and the surrounding areas. The measured data include meteorology, aerosol, gas pollutants, and cloud properties (Martin et al., 2016, 2017). We used the aircraft measurements of aerosol number concentrations on board the G-1 aircraft with a time interval of 1 s on 11, 12, 14, 16, and 17 March 2014. There were 15 flights available in February and March 2014. The five selected days are within our regional model simulation time (11–18 March 2014). Figure 1 shows the flight tracks of the five selected days, which are mainly transects of the plume from Manaus. The measured aerosol particles with diameters greater than 3 nm (ND>3 nm), 10 nm (ND>10 nm), and 100 nm (ND>100 nm) are compared to the model. ND>3 nm and ND>10 nm were measured using a condensation particle counter (CPC) with diameter ranges of 3 nm–3 mm and 10 nm–3 mm, respectively. ND>100 nm was measured with a passive cavity aerosol spectrometer probe (PCASP). Full details of the instruments can be found in Martin et al. (2017). During the five days, most of the measurements were made below an altitude of 2 km, with a small fraction collected between 2 and 6 km in altitude. Below 2 km, the concentrations of particles with diameters greater than 3 nm is around 18 000 cm−3, while between 2 and 6 km, the concentration is significantly smaller (100–200 cm−3) compared to those below 2 km. We also used the aerosol size distributions measured at the T3 research tower (3.2° S, 60.6° W), which is southwest (downwind) of Manaus (Martin et al., 2016). The size distributions were measured using the Ultra-High Sensitivity Aerosol Spectrometer (UHSAS) for particles with diameters of 55–1000 nm. The 3-hourly precipitation rates measured by the S-band Amazon Protection National System radar between 11 and 17 March 2014 were additionally used to evaluate the model.
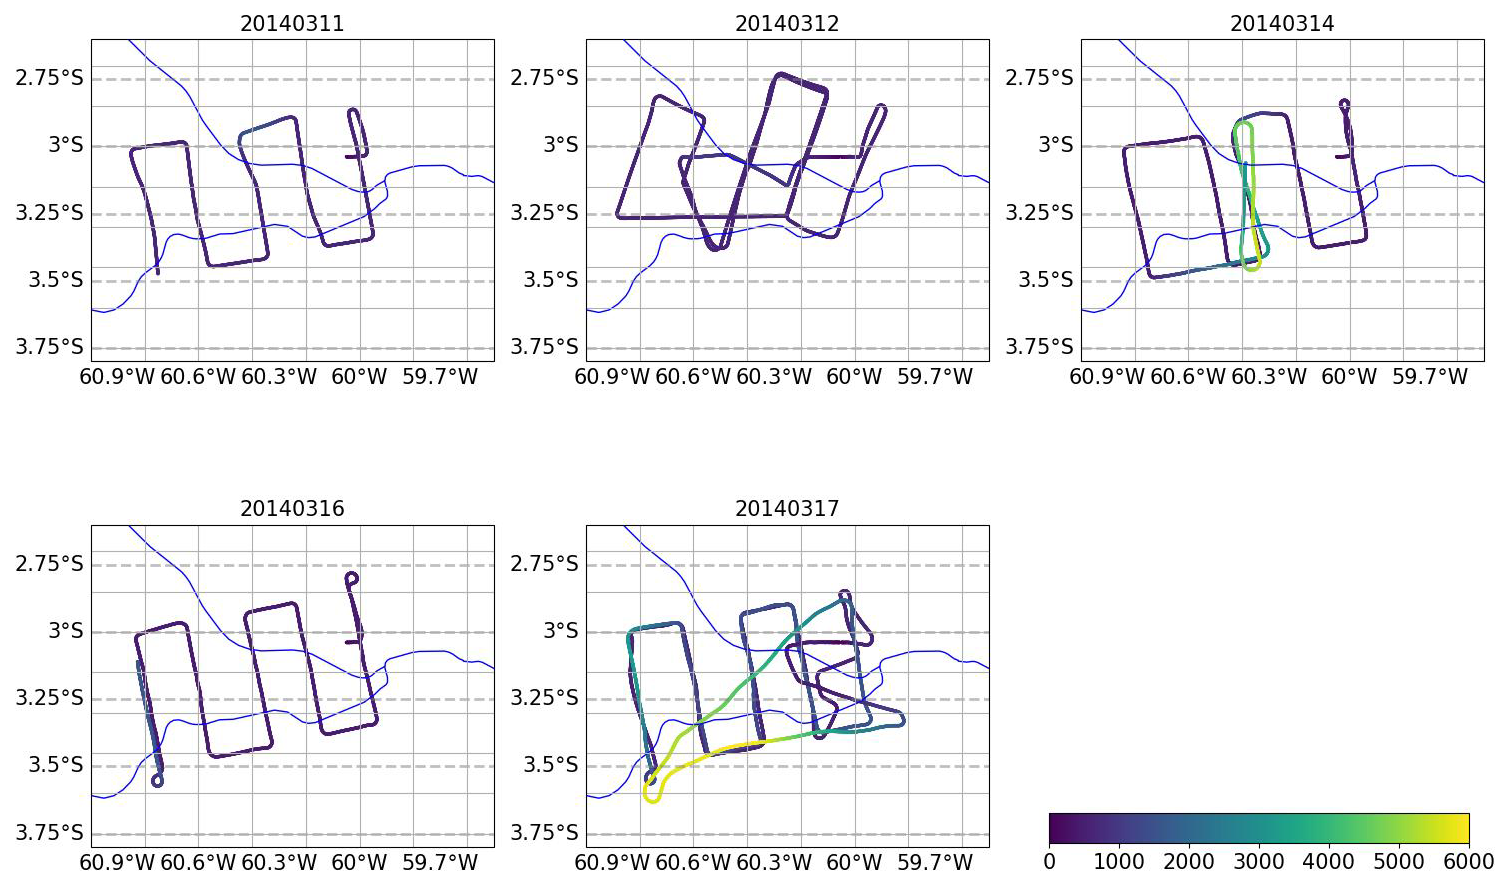
Figure 1G-1 flight tracks on 11, 12, 14, 16, and 17 March 2014. The aircraft flew at altitudes below 2 km on 11, 12, and 16 March and reached around 6 km on 14 and 17 March 2014. The colour bar indicates the flight altitude in m. The blue lines indicate the Rio Negro and the Amazon River.
2.2 Global and regional model configurations
We used a nested regional model located in central Amazonia, embedded in a global model. The global model is the atmosphere-only configuration of the Hadley Centre Global Environment Model version 3 (HadGEM3). Both the global and regional models are based on the Unified Model (UM version 11.6), and both models are coupled to the UKCA (United Kingdom Chemistry and Aerosol) model (Planche et al., 2017; Gordon et al., 2018, 2023). The global and regional model are coupled in a one-way manner that allows the global model to drive the regional model with information including aerosols, trace gases, and meteorology conditions (temperature, 3D wind, cloud liquid, cloud ice, humidity, and rain), while the global model is not affected by the regional model. The global model uses the GA7.1 (Global Atmosphere v7.1) configuration of the UM with the Even Newer Dynamics for General atmospheric modelling of the environment (ENDGame) dynamical core (Wood et al., 2014; Walters et al., 2019). The resolution is N96 (around 135 km) in the horizontal direction, and there are 85 vertical levels up to 80 km in altitude. Parameterized convection is used in the global model (Fritsch and Chappell, 1980; Gregory and Rowntree, 1990; Stratton et al., 2009; Derbyshire et al., 2011; Walters et al., 2019). The nested regional model domain is centred at 3.1° S, 62.7° W. The centre is located downwind of Manaus. The domain is 1200 km (east-to-west direction) by 720 km (north-to-south direction) with a 3 km horizontal resolution. There are 70 vertical model levels, with the highest altitude at 40 km. The lowest 64 levels extend from the surface to 20 km in altitude, which is the main region of interest for aerosol–cloud interactions. The regional model uses explicit convection, which allows heat transfer and tracer transport to be resolved on the model grid, though smaller-scale convection (e.g. shallow convection) is not resolved at the 3 km resolution.
2.3 Aerosol, chemistry, and emissions
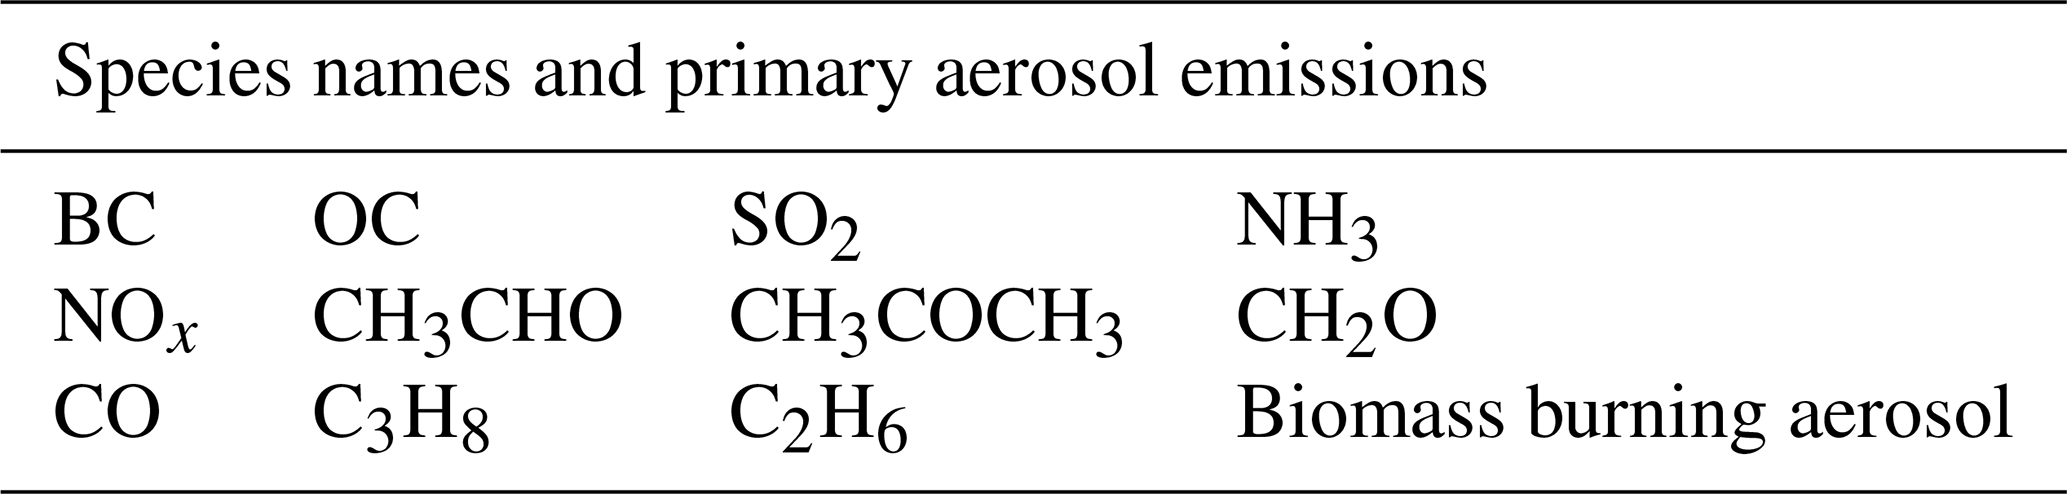
The aerosol-chemistry scheme (UKCA) uses the GLOMAP-mode (Global Model of Aerosol Processes) two-moment aerosol microphysics model, which allows aerosol to form from gaseous precursors, grow to larger sizes, and be transported and removed (Mann et al., 2010). The aerosol particles are represented by four water-soluble modes (nucleation, Aitken, accumulation, and coarse) and an insoluble Aitken mode, which are specified by the number and mass (or, equivalently, size) with a fixed-width log-normal distribution. The particle chemical composition includes sulfate, sea salt, black carbon, and organic carbon. Aerosol particles are scavenged by two processes: impaction scavenging due to precipitation (washout) below clouds and scavenging during rain formation (rainout). Rainout refers to the collision and coalescence of cloud droplets that contain aerosols. When these rain droplets are formed and fall to the surface, the aerosols inside are assumed to be deposited. The aerosol removal processes are size-dependent and controlled by a collection efficiency look-up table (Mann et al., 2010; Kipling et al., 2013). UKCA uses an online chemistry scheme (StratTrop) that involves 84 species, with 81 of them having chemical reactions (Archibald et al., 2020), including several chemical reactions with anthropogenic gas species (ammonia, ethane, nitrogen monoxide, etc.). The StratTrop chemistry scheme can well represent reactions associated with pollution plumes from Manaus and the biogenic emissions from the surrounding forest in Amazonia and subsequently affects NPF in this study. In the UKCA model, the oxidant tracers (OH, O3, and NO3) can react with other chemical components, be transported, and deposited. The StratTrop scheme has been used in global modelling studies (Mulcahy et al., 2020) and was firstly incorporated in a regional modelling of Gordon et al. (2023). Most of the emissions of anthropogenic gases and aerosols are obtained from the high-resolution (0.1° by 0.1°) EDGAR (Emissions Database for Global Atmospheric Research) inventories (Janssens-Maenhout et al., 2015). The fine grid resolution of these emissions allows us to resolve the Manaus pollution plume in our model. The emissions we use in the model are monthly means for the year 2010, and Table 1 shows all the included species. A diurnal cycle is applied for NO, BC, and OC to simulate the time variation of traffic. The emission of marine DMS has been parameterized based on Lana et al. (2011), and the land source is from biomass burning (van der Werf et al., 2006; Lamarque et al., 2010; Granier et al., 2011; Diehl et al., 2012). The emitted CH4 from biomass burning data has been generated by the JULES model (Mangeon et al., 2016). Monoterpenes and isoprene are emitted by vegetation and have been obtained from monthly mean emission inventories generated by the JULES model (Pacifico et al., 2012). We use offline isoprene and monoterpene emissions because our study mainly focuses on the influence of anthropogenic emissions and the vegetation cover is unlikely to change significantly within a short time period. Using a land-surface model with interactive vegetation cover and BVOC emissions would be helpful, but the benefits would be limited under the context of our study. Diurnal variability has been applied to isoprene emissions by scaling them hourly. We do not apply a diurnal cycle to monoterpenes fields. Natural SO2 comes from volcanic eruptions (Stier et al., 2005). Primary biofuel aerosol, biomass burning aerosol, and anthropogenic sulfate aerosol are emitted in the UKCA model as log-normal modes with a fixed geometric mean diameter of 150 nm, while primary aerosol particles from fossil fuel are emitted at 60 nm.
Table 1Gaseous species and aerosol emissions that are anthropogenic.
Our model also includes natural primary aerosol (sea salt and primary marine organic aerosol). The parameterization of sea salt aerosols follows Gong (2003), while primary marine organic aerosol emissions are based on Gantt et al. (2012). Dust emission is parameterized based on Marticorena and Bergametti (1995). Monoterpenes are a class of BVOC (biogenic volatile organic compound) consisting of several compounds, but they are emitted and treated as one tracer in the UKCA model. We assume it to be the main BVOC for biogenic nucleation. Recent work has suggested that isoprene is an important BVOC involved in NPF (Kuhn et al., 2010; Bardakov et al., 2024; Curtius et al., 2024; Shen et al., 2024). However, isoprene is not used in the NPF process in this work because HOM formation from isoprene with NOx is not available in our model configuration, and this fairly new NPF mechanism has not been parameterized or tested in global models (Curtius et al., 2024; Shen et al., 2024). Nevertheless, not incorporating isoprene-NOx is expected to be within the uncertainty of our assumption for monoterpenes. In the parameterizations, the concentrations of monoterpene are used to derive the concentrations of highly oxygenated molecules, which are used to obtain NPF rates (HOM1 and HOM2; Ehn et al., 2014; Kirkby et al., 2016; Tröstl et al., 2016; Stolzenburg et al., 2018; Bianchi et al., 2019). HOM1 is an oxidation product of monoterpenes, oxidized by OH with a yield of 100 % (Riccobono et al., 2014). The unrealistically high yield occurs because the nucleation rate and yield could not be separately constrained in the chamber experiments; thus, the yield has been subsumed into the nucleation rate. HOM2 is the oxidation product of monoterpenes by OH and O3, and HOM2 concentrations are obtained by a steady-state approximation (Franchin et al., 2016; Gordon et al., 2016). A steady state assumes that ion concentrations remain constant over time, given a fixed recombination coefficient, first-order loss term, and coagulation sink (Franchin et al., 2016). This approximation is based on the CLOUD chamber experiments. Yields of HOM2 are 1.2 % when monoterpenes are oxidized by OH and 2.9 % when oxidized by O3, and the concentrations of HOM2 are used to derive the nucleation rates (Gordon et al., 2016).
2.4 New particle formation
New particle formation (NPF) represents the conversion processes from gas vapour to particle phases. We incorporate the following schemes in the UKCA model: the nucleation of sulfuric acid and organic gas molecules (H2SO4-Org, Riccobono et al., 2014) and the pure biogenic nucleation, which uses purely oxidized organic gas molecules (Kirkby et al., 2016). The NPF process in the UKCA model includes the initial formation of a cluster at a diameter of 1.7 nm and the subsequent growth to 3 nm by condensation (Kerminen and Kulmala, 2002). We apply the Kerminen and Kulmala (2002) method to simulate particle growth from 1.7 to 3 nm via the condensation of H2SO4-H2O and HOM1 (or HOM2). The whole NPF process produces aerosol particles up to 3 nm in diameter. Our model tends to overestimate the total aerosol number concentrations in the free and upper troposphere. In our test simulations with the H2SO4-Org and pure biogenic nucleation mechanisms, the total particle number concentrations in the free troposphere were overestimated by more than a factor of 10 if we allowed NPF to occur at all altitudes. The overestimation was even stronger with binary nucleation (H2SO4-H2O) and the H2SO4-Org nucleation schemes. We also found significantly overestimated particle concentrations from NPF at low altitudes in our test simulations, possibly due to the limitations of the model’s mixing scheme close to a heterogeneous forest. Additionally, NPF was rarely observed in the Amazonian boundary layer in previous studies (Krejci et al., 2003; Rizzo et al., 2010; Andreae et al., 2018; Wimmer et al., 2018; Varanda Rizzo et al., 2018). Therefore, in our simulations only, we switched off all new particle formation (H2SO4-Org nucleation and pure biogenic nucleation) above 1 km in altitude and below 100 m in altitude so that our model has a better representation of the observed particle number concentrations (Andreae et al., 2018; Shilling et al., 2018). After switching off NPF at these altitudes, the model produced much lower aerosol concentrations than with NPF. We implement the NPF processes as follows. The inorganic-organic (H2SO4-Org) combined nucleation mechanism has been parameterized in GLOMAP (Riccobono et al., 2014). The formation and subsequent growth of new particles involve highly oxygenated molecules (HOM1; Ehn et al., 2014; Kirkby et al., 2016; Tröstl et al., 2016; Stolzenburg et al., 2018; Bianchi et al., 2019) and H2SO4. Nucleation rates (in cm−3 s−1) at a diameter of 1.7 nm are derived using the concentrations of HOM1 and H2SO4:
where [HOM1] and [H2SO4] represent the concentrations in molecules per cm−3 and k is the kinetic factor, which has a constant value (3.27 × 10⁻²¹ cm6 s−1; Riccobono et al., 2014). The nucleation rates are multiplied by a temperature dependency exp so that they vary with altitude (Gordon et al., 2016; Simon et al., 2020). We also include the pure biogenic nucleation mechanism following Kirkby et al. (2016) and Gordon et al. (2016), but the biogenic nucleation is not expected to significantly influence the particle concentrations between altitudes of 100 m and 1 km compared to the H2SO4-Org mechanism. This NPF parameterization produces particles at 1.7 nm in diameter using HOM2. The nucleation rate sums up the neutral and ion-induced nucleation rate. In this study, for simplicity, the ion-induced nucleation uses a constant ion concentration of 400 cm−3 ([Ion] in Eq. 2):
where T is temperature in K, T0 is a constant temperature (278 K), HOM2 represents the concentrations of HOM2 in molecules per cm−3, and A1−5 are constant parameters (Gordon et al., 2016). The nucleation rates are also multiplied by a temperature dependency exp). A cloud condensation sink term is additionally added to UKCA to suppress the nucleation rates in cloudy regions (Kazil et al., 2011; Wang et al., 2023). The calculation of the cloud condensation sink follows the study of Wang et al. (2023). Commonly, a condensation sink allows gases to condense onto existing aerosol particle surfaces instead of nucleating new particles. The addition of a cloud condensation sink enables gases to also condense onto cloud hydrometeor surfaces. It is obtained by assuming constant values for cloud droplet and ice crystal number concentrations (both at 100 cm−3), which are used along with cloud liquid and ice water content to derive the radii of hydrometeors. We then obtain the condensation sink using Fuchs and Sutugin (1971):
where CCS denotes the cloud condensation sink in s−1, Dv is the gas diffusion coefficient, Nhyd is a constant concentration of cloud hydrometeors (droplets or ice; 100 cm−3), and rcloud and rice are the radii of cloud droplets and ice, respectively. The cloud condensation sink is added to the condensation sink derived from the background particles. The total condensation sink will more realistically influence the concentration of condensable gases and newly formed particles in this convective environment.
2.5 Coupling between aerosol and cloud microphysics
The UKCA aerosol-chemistry model is coupled to the CASIM (Cloud-AeroSol Interacting Microphysics) cloud microphysics scheme in the regional domain of the model for both stratiform and resolved convective clouds. CASIM is a two-moment cloud microphysics model with five types of hydrometeor (cloud droplets, rain, ice, snow, and graupel; Field et al., 2023). Aerosol number concentration and the concentrations of the chemical species are used by CASIM to calculate a weighted mean hygroscopicity for cloud droplet nucleation (Gordon et al., 2020). CASIM then activates aerosols based on the mean grid-box updraught velocity, and the activated prognostic Nd is advected with the resolved wind fields (Grosvenor et al., 2017; Miltenberger et al., 2018a). A diagnostic maximum supersaturation is calculated to activate aerosols within the parameterization of (Abdul-Razzak and Ghan, 2000). The prognostic Nd is replaced by newly activated droplets if the newly activated concentration exceeds the existing concentration. We use a temperature-dependent ice nucleation scheme, which is not sensitive to aerosol, to form ice in the CASIM model (Cooper, 1986). Rain formation (autoconversion and accretion) from cloud droplets follows Khairoutdinov and Kogan (2000). The self-collection of rain droplets (with rain droplets) and cloud droplets (with cloud droplets) is based on Beheng (1994). Scavenging rates of aerosols during precipitation are calculated from precipitation rates derived from autoconversion and accretion rates in the CASIM model (Miltenberger et al., 2018a).
2.6 Simulation details
The global and regional models were run from 11 to 18 March 2014, covering five research flights during GoAmazon2014/5 in the Amazonian wet season (Martin et al., 2016, 2017). The global model was run 69 d prior to the start of the regional simulation for the initialization of the aerosol fields.
Table 2 summarizes the simulations. All the simulations used NPF between 100 m and 1 km and include the cloud condensation sink. The control (CTL) emission simulation included both anthropogenic gas and primary aerosol emissions, and the offREG (off regional) simulation had anthropogenic emissions switched off in the regional domain. The species that were switched off in offREG (see Table 1) include anthropogenic gas emissions and primary aerosol emissions, as well as NO, NVOC from anthropogenic sources, BC, and OC. Because the H2SO4-Org nucleation mechanism is strongly controlled by the concentrations of H2SO4 and the advection from the global model cannot supply enough H2SO4 below 1 km to this region for nucleation, switching off emissions in the regional domain almost disables this nucleation process. We perturbed all anthropogenic emissions by factors of 0.5, 1.5, 2, and 5 in additional simulations to understand the sensitivity of aerosols and cloud properties. The effects of primary anthropogenic aerosol emissions can be determined from the Prim_emis (primary emission) simulation, where only anthropogenic primary aerosol emissions are kept, and the H2SO4-Org nucleation was switched off in the regional domain to prevent secondary aerosol formation from anthropogenic gas precursors (H2SO4). The primary aerosol contribution to the total particle concentration and cloud properties can be derived with the equation . Two additional simulations were performed in which the aerosol concentrations passed from UKCA to the CASIM aerosol activation process were scaled down by a factor of 4 (simulation 0.25 × aero) and up by a factor of 4 (simulation 4 × aero) relative to the CTL simulation. The variable we scaled was the “Ni” in Eq. (13) in the study of Abdul-Razzak and Ghan (2000), where “i” represents an index over the aerosol modes. In this procedure, we directly scaled the number of particles after the maximum supersaturation had been determined and thus did not allow the aerosol activation diameters and concentrations to be adjusted to updraught velocities or water vapour availability. The purpose of these simulations was to force a direct change in cloud droplet numbers compared to the perturbations achieved by changing emissions. As shown in the results section, the 7 d simulations with the six scaled loadings of the anthropogenic emissions showed an insignificant response of cloud properties to reductions in aerosol emissions; therefore, the CTL and offREG simulations were also run for a month so that a longer-term effect on the clouds could be quantified. We ran an extra simulation (CTL + Bn) to examine the effect of binary nucleation (H2SO4-H2O) following Vehkamäki et al. (2002). In this simulation, binary nucleation was switched on in addition to the processes used in the CTL simulation. As binary nucleation is most effective in the upper troposphere, it was permitted at all altitudes above 100 m; due to its strong temperature dependence, it would be negligible below 100 m if it were permitted there.
Table 2Summary of model simulations, detailing the different anthropogenic emissions and nucleation mechanisms used.
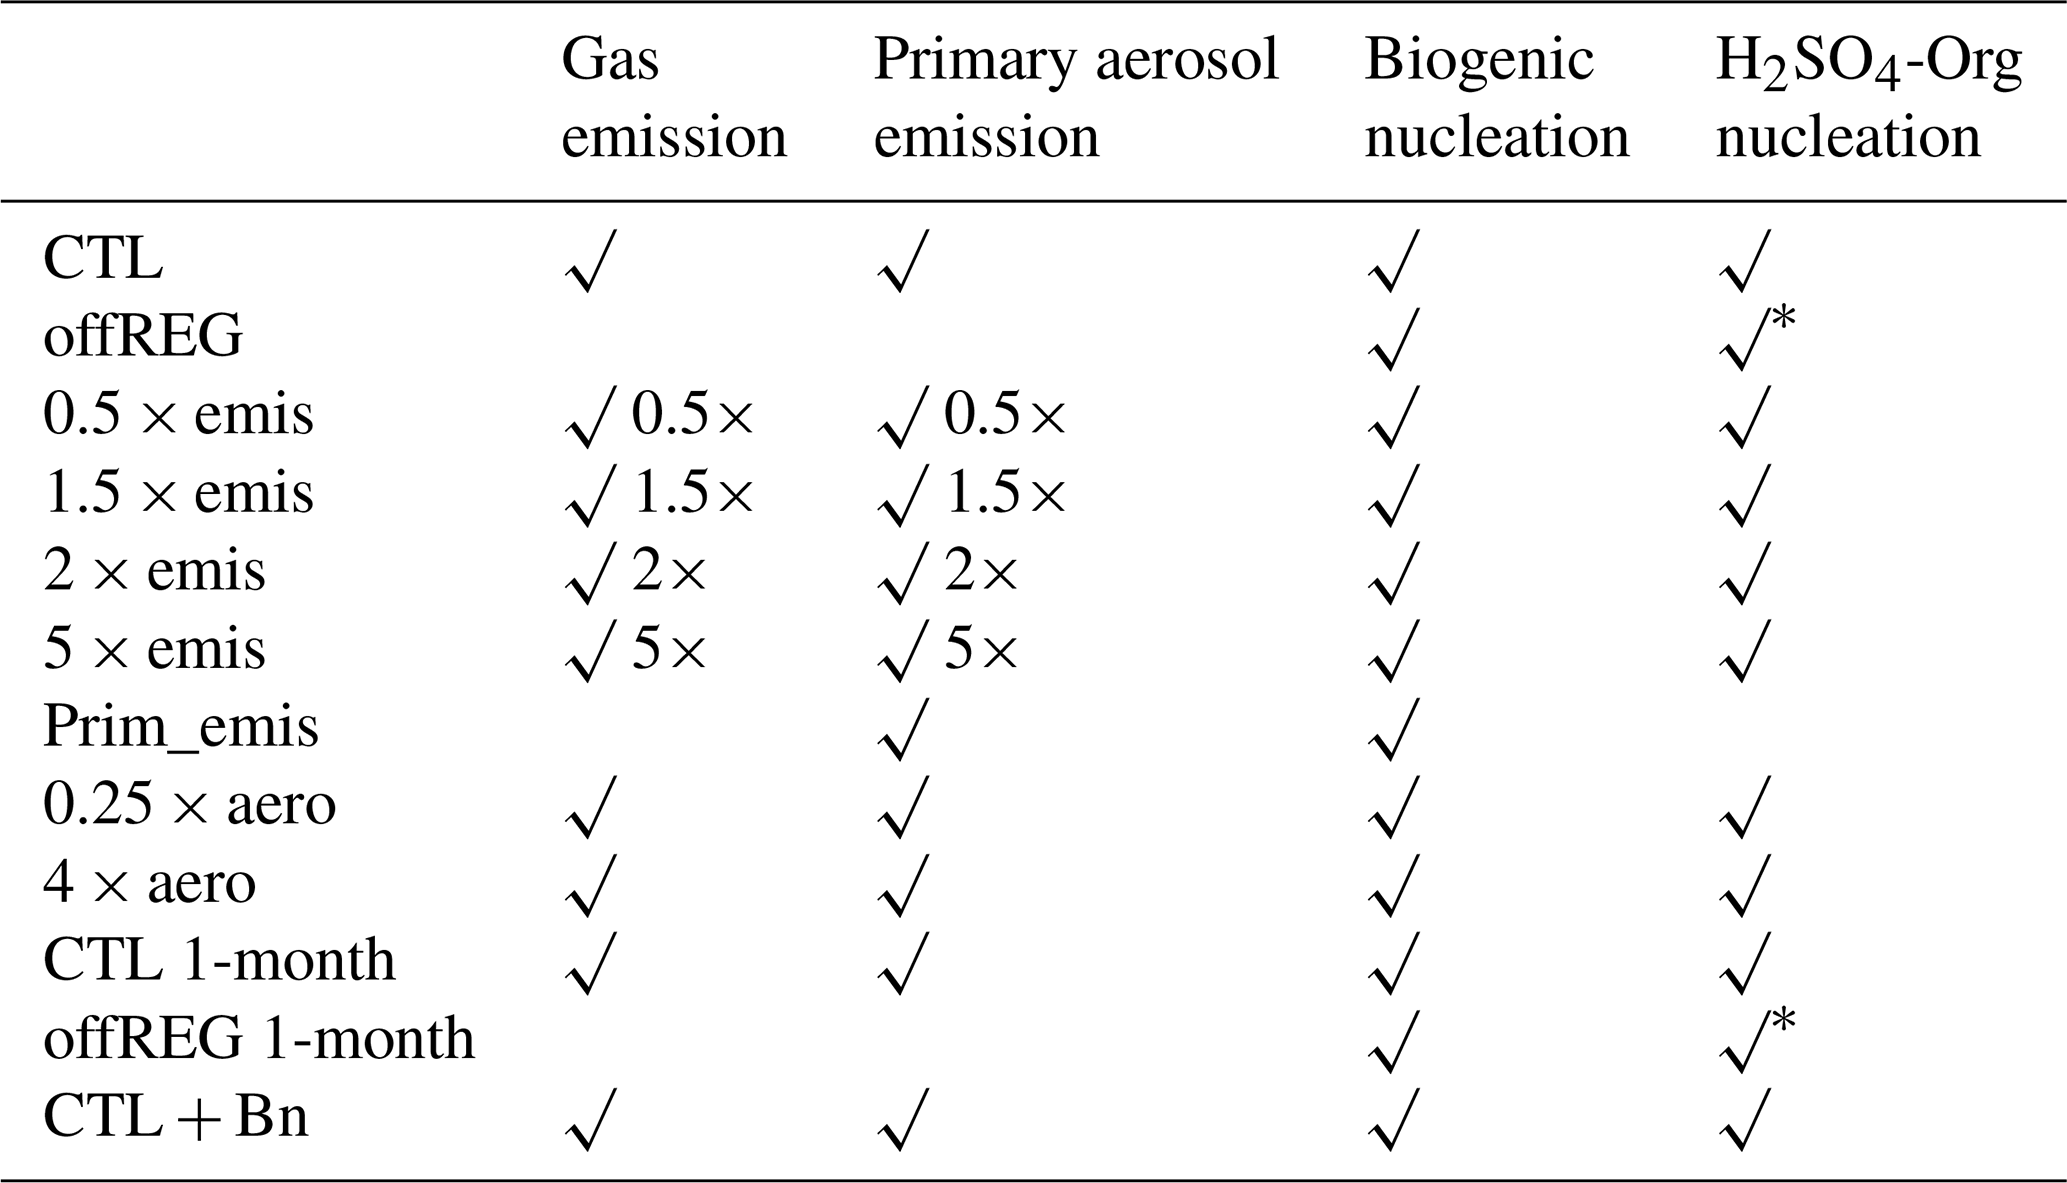
* The H2SO4-Org nucleation relies on H2SO4, an anthropogenic gas precursor emitted in the regional model and advected from the global model through the model boundaries. When anthropogenic emissions in the regional domain are set to zero in the 7 d and 1-month simulations (offREG and offREG 1-month), H2SO4-Org nucleation will still occur due to the small amount of H2SO4 advected from the global model. However, the height-, time- and domain-mean H2SO4-Org nucleation rate at 100 m–1 km in the regional model is reduced by a factor of 3000 after removing all anthropogenic emissions. Consequently, even though H2SO4-Org nucleation is included in these two simulations, the resulting nucleation rates are too small to produce a significant number of aerosols.
3.1 Comparison with observations
Figure 2 shows the time series of the observed and simulated particle number concentrations with diameters greater than 3 nm (ND>3 nm), 10 nm (ND>10 nm) and 100 nm (ND>100 nm) over the five selected days with aircraft observations from 11 to 17 March 2014. As shown in Fig. 1, the G-1 aircraft measured particle number concentrations in Manaus pollution plumes and, for most of the time, flew downwind of the city. Therefore, several peaks in particle number concentrations were observed during the flights. The modelled results in the CTL and offREG simulations are interpolated according to the flight time, coordinates, and altitude for comparison with the observations. All the observed particle concentrations (ND>3 nm, ND>10 nm, and ND>100 nm) exhibit strong temporal as well as spatial variations that are related to pollution plumes from Manaus. Among the five days of measurement, 16 and 17 March have the greatest number concentrations for all particle size ranges (around 11 000 cm−3 for ND>3 nm, 3200 cm−3 for ND>10 nm, and 270 cm−3 for ND>100 nm, averaged over time), which implies that the downwind air was most polluted on 16 and 17 March and the plumes were most distinct from the surrounding environments. The background number concentrations are around 1000 cm−3 for ND>3 nm and ND>10 nm and around 300 cm−3 for ND>100 nm during the five days. The least polluted day is 12 March, when the time-mean particle number concentrations are 1300 cm−3 (ND>3 nm), 900 cm−3 (ND>10 nm), and 75 cm−3 (ND>100 nm), and the variability of ND>3 nm is about 8 times smaller than the time-mean ND>3 nm on 16 and 17 March. On the other two days (11 and 14 March), the time-mean particle number concentrations are factors of around 1.6–3 smaller than the concentrations on 16 and 17 March for ND>3 nm and ND>10 nm and factors of 0.6–1.1 smaller for ND>100 nm.
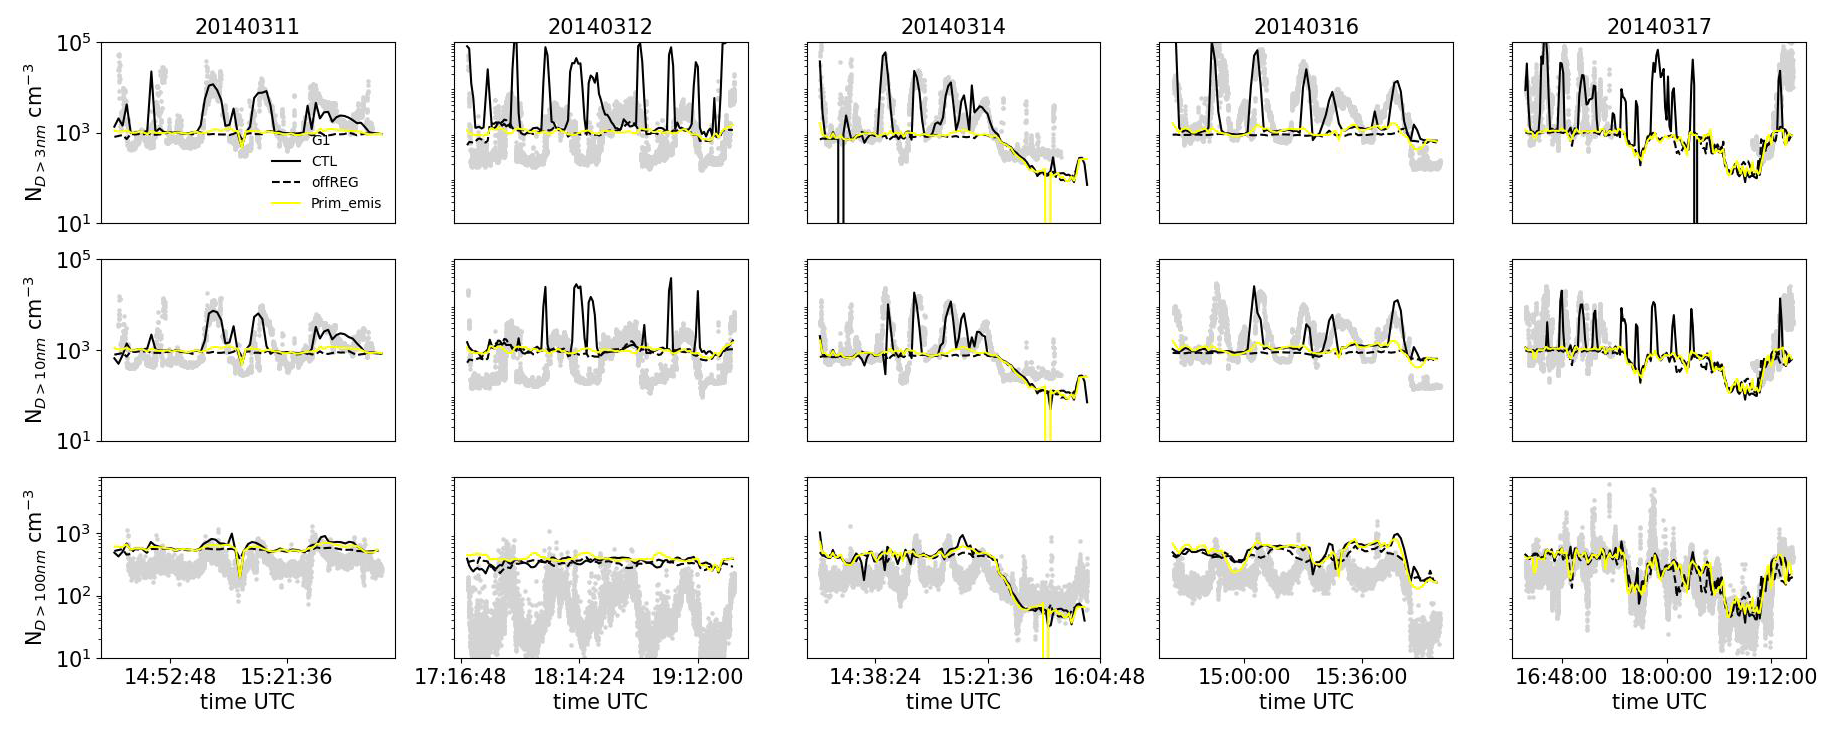
Figure 2Time series of observed (grey dots) and simulated (CTL – black solid, offREG – black dashed, and Prim_emis – yellow; solid lines) particle number concentrations with diameters greater than 3 nm (upper row), 10 nm (middle row), and 100 nm (lower row) on 11, 12, 14, 16, and 17 March 2014. The observations were measured on board the G-1 aircraft during the GoAmazon2014/5 campaign, and model data were interpolated according to the G-1 flight tracks. The concentrations are presented in log-scale.
The CTL simulation reproduces most of the observed in-plume number concentrations for ND>3 nm and ND>10 nm and the general trend for ND>100 nm, except for 12 March. However, the magnitude of concentrations and the temporal variability are not well captured in the first three days (11, 12, and 14 March 2014) for ND>100 nm. The modelled particle concentrations of the three size ranges well reproduce the observations on 11, 14, 16, and 17 March 2014, but the particle concentrations are overestimated on 12 March 2014. Of all the five days, the simulations are the closest to the observations on 11 March, with a mean bias of −8 % for ND>3 nm; for ND>10 nm, the bias is around −3 %; and the model overestimates ND>100 nm by 70 %. On 14 and 16 March, particle number concentrations are generally overestimated by the model by between 15 % and 20 % for ND>3 nm, underestimated by around 25 % to 28 % for ND>10 nm, and overestimated by between 63 % and 130 % for ND>100 nm. On 17 March 2014, ND>3 nm and ND>10 nm are underestimated by around 20 % and 40 %, and ND>100 nm is overestimated by 10 %. The comparisons are worse on 12 March for all three size ranges, with the modelled particle concentrations being factors of 11 (ND>3 nm), 2 (ND>10 nm), and 3.6 (ND>100 nm) too high. This discrepancy is related to the large number of nucleation mode aerosols (Fig. A2). The bursts of nucleation mode aerosols in the model are likely caused either by the residuals of particles of all three size modes from 11 March that have not been scavenged within a day (by 12 March), as the background particle concentrations are around a factor of 3 higher than observed, or because the surface emissions in UKCA on 12 March are higher than reality. The CTL simulation produces similar magnitudes of precipitation compared to the precipitation measurement by the S-band radar during GoAmazon2014/5 (Fig. A3), but whether the modelled rain removed the same number of aerosol particles as in reality remains unknown. We also compare the aerosol size distributions at the location of the T3 research tower (3.2° S, 60.6 ° W) for the CTL and CTL + Bn (binary nucleation H2SO4-H2O) simulations (see Figs. A4 and A5). The results show that in the simulation with binary nucleation in the upper troposphere (CTL + Bn), the modelled aerosol size distributions are closer to the observations than without upper tropospheric nucleation in both the simulation and the model spinup period (CTL simulation), although CTL + Bn does not perfectly reproduce the observations. The time series of the particle number concentrations (Fig. A1) show that the CTL + Bn simulation significantly overestimates the observed particle (diameters greater than 3 nm) number concentrations by factors of between around 2 and 44, producing too many particles. These results imply the efficiency of nucleation in the upper troposphere. The CTL simulation has more realistic particle concentrations than CTL + Bn and is able to reproduce the temporal and spatial evolution of the aircraft measurements. Thus, we use this simulation (CTL) as a baseline for our sensitivity test relative to anthropogenic emissions.
3.2 Effects of anthropogenic emissions on aerosol
In this section, we investigate the influence of anthropogenic emissions along the G-1 aircraft flight tracks on ND>3 nm, ND>10 nm, and ND>100 nm particles. We also evaluate the effects of emissions on aerosol and cloud profiles in the regional domain, but only the areas that are affected by pollution, which we define according to the total gas-phase sulfur species. High-sulfur regions are defined according to the instantaneous column-integrated gas-phase sulfur content from the gas-phase H2SO4 (sulfuric acid) and SO2 in the lowest 2 km, calculated as . Here, z is altitude, ρz is air density at a height of z, and Sz denotes the gas-phase sulfur mass mixing ratio obtained from both H2SO4 and SO2. A threshold value of 6 × 10⁻⁵ g m−2 is chosen to represent polluted conditions. These high-sulfur regions defined by the CTL simulation are used also for the other simulations (offREG, 0.5 × emis, 1.5 × emis, 2 × emis, 5 × emis, 0.25 × aero, and 4 × aero) for consistency, irrespective of the gas-phase sulfur content in the other simulations. Here, we analyse only the data to the west of the red line in the regional domain for each simulation in Fig. 3 because these data represent the regions downwind of Manaus that are likely affected by Manaus pollution. The areas to the east of the red line are not included in the following analyses but are needed as a part of the regional domain in order to allow space for air mass entering the regional domain at the eastern boundary to evolve before reaching the regions of interest. We understand that gas-phase sulfur alone may not be able to mark all the regions that are affected by anthropogenic emissions in the domain, but it has the closest relationship with NPF of all the emissions in our simulations. Figure 3 shows example definitions of where the high-sulfur values (within the contours) are at 21:00 UTC on 14 March 2014; most of the high-sulfur regions are around the Amazon river. Although the high-sulfur regions evolve with time, Manaus, Tapauá, and other riverside areas (where most of the cities are located) are always the most polluted regions in the regional domain.
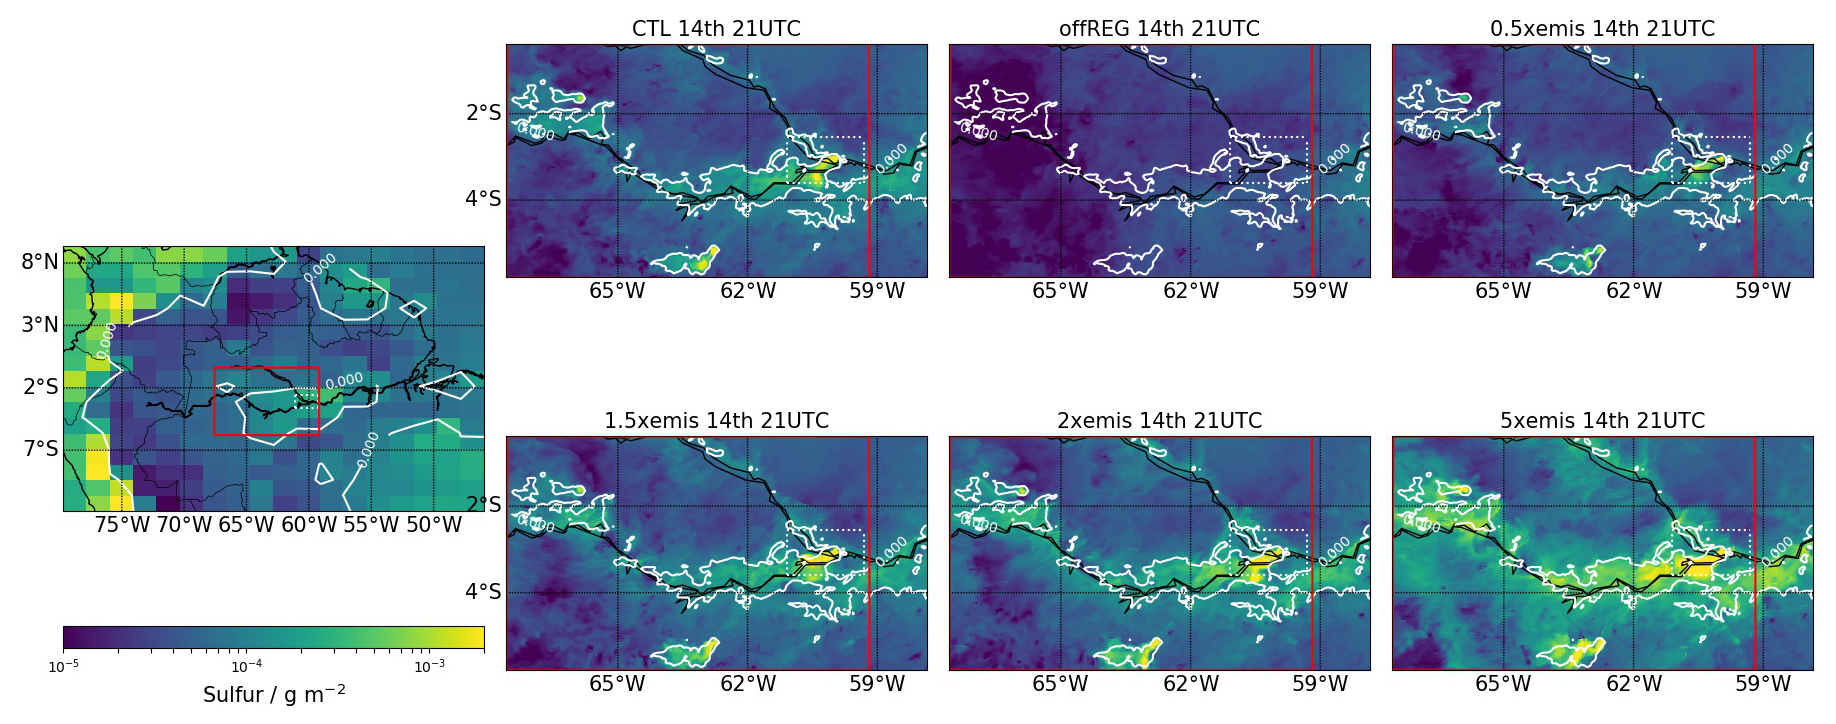
Figure 3Maps of column-integrated gas-phase sulfur (g m−2) at 21 UTC on 14 March 2014 in the CTL simulation in the global model (a) and in the CTL, offREG, 0.5 × emis, 1.5 × emis, 2 × emis, and 5 × emis simulations in the regional model. The dotted rectangles mark where the G-1 aircraft flew in March 2014. The white solid contours in all the maps denote column-integrated gas-phase sulfur equal to 6 × 10⁻⁵ g m−2 in the CTL simulation. The area within the red box in the map of the global model and the area to the east of the red vertical lines in the regional model mark the high-sulfur region at 21:00 UTC on 14 March 2014.
Figure 2 also shows the particle number concentrations along the flight tracks when both anthropogenic gas and primary aerosol emissions are switched off in the regional domain (offREG simulation) and when anthropogenic gas emission and H2SO4-Org nucleation are switched off in the regional domain (Prim_emis simulation). In the offREG simulation, the temporal and spatial variations of ND>3 nm and ND>10 nm are very small compared to the much larger variations in the CTL simulation. Although ND>100 nm in the offREG simulations captures the background values, it misses most of the peak values in ND>3 nm and ND>10 nm. The lack of temporal and spatial variability in the offREG simulation indicates that the variability shown in the CTL simulation is caused by emission and NPF in the region, especially for ND>3 nm, which is reduced by 70 %–90 %, and ND>10 nm, which is reduced by 50 %–70 % during the five days compared to the CTL simulation. ND>100 nm is least affected (6 %–20 % reduction) by anthropogenic emissions. Switching off anthropogenic emissions causes a reduction in the mean nucleation rates (biogenic and H2SO4-Org) along the track by up to a factor of 2.4 × 10⁵ (16 March). On the same day, the condensation sink is reduced by a factor of 125 in the offREG simulation, suggesting that the effect of anthropogenic emissions on nucleation is substantial. ND>100 nm has both increases and reductions in number concentrations when we switch off anthropogenic emissions, with the reductions dominating for most of the time. The increases in ND>100 nm at certain times may be caused by the suppression of NPF when there are no anthropogenic emissions, which thereby allows more condensable gases for particle growth (Sullivan et al., 2018), but we did not perform simulations that would allow the investigation of these changes. The occurrence of both increases and decreases in ND>100 nm for CTL vs offREG implies that the effect of anthropogenic emissions in our simulations on CCN is quite variable. The temporal and spatial variations of ND>3 nm and ND>10 nm in the Prim_emis simulation are similar to those in the offREG simulation (Fig. 2). For most of the time, the Prim_emis simulation reproduces the observed ND>100 nm while missing some peak concentrations. Compared to the offREG simulation, the Prim_emis simulation has a few more overlaps with the CTL for ND>10 nm and ND>100 nm, indicating the contribution of large primary anthropogenic aerosol particles. The absence of peaking concentrations in Prim_emis shows that the discrepancies between the Prim_emis and CTL simulations are mainly caused by NPF induced by the anthropogenic emissions (H2SO4-Org mechanism). The contribution of primary aerosols to the region in which the G-1 aircraft flew is less than 3 % for ND>3 nm, between 1 % and 10 % for ND>10 nm, and less than 20 % for ND>100 nm. The contribution of primary aerosol to the total mean particle concentrations in the lowest 4 km of the atmosphere in the high-sulfur region of the regional domain is around 0.5 %. Thus, the majority of the changes in concentrations are caused by the combination of precursor gas emission and NPF. To better understand the response of aerosols and clouds to anthropogenic emissions using our model, we increase the anthropogenic gas and primary aerosol emissions (1.5 × emis, 2 × emis, and 5 × emis simulations), which amplifies the differences in emissions between the offREG and CTL simulations. We also test the effect of reducing the emissions (0.5 × emis). Figure 4a, b, and c shows the vertical profiles of aerosol number concentrations averaged over the high-sulfur regions. The concentrations have similar shapes with height in all six simulations. The number concentrations are the greatest below 2 km for all three modes of aerosol in the six simulations. In the CTL simulation, the height-mean concentrations below 2 km are 130 cm−3 for the nucleation mode, 530 cm−3 for the Aitken mode, and 430 cm−3 for the accumulation mode. Because we prevented NPF above an altitude of 1 km, the particle concentrations are very low in the upper troposphere, e.g. the total aerosol number concentration is 44 cm−3 at 14 km in altitude in the CTL simulation, whereas the CTL + Bn simulation, which has NPF in the upper troposphere, has around 1700 cm−3 at 14 km in altitude. Above 2 km, the aerosol number concentration quickly falls to very low concentrations until 6 km in altitude, and the concentration remains very low above 6 km in the CTL simulation.
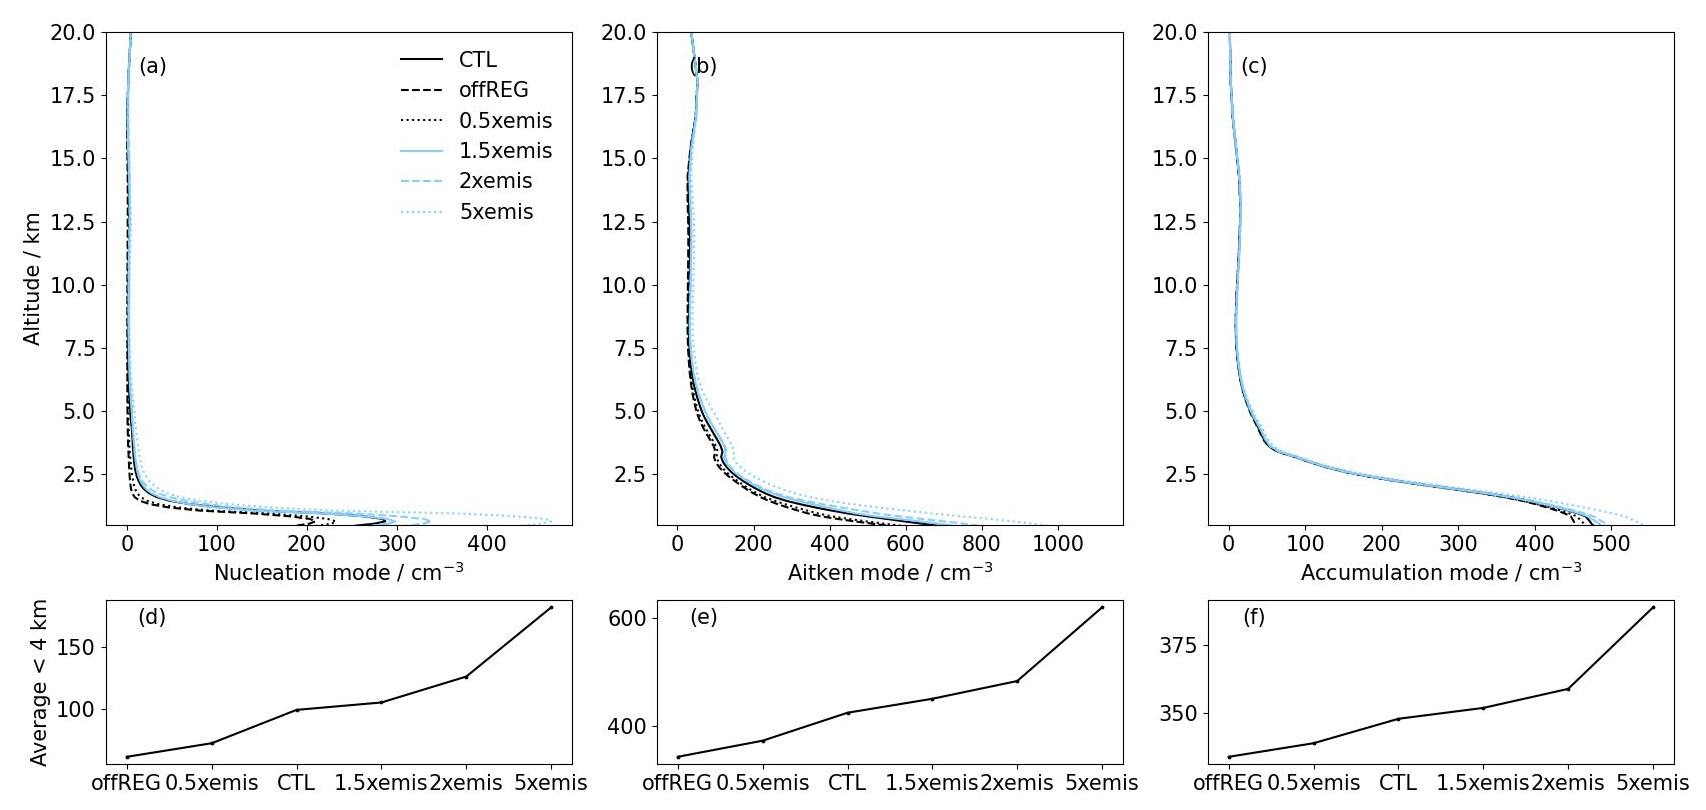
Figure 4Profiles of the (a) nucleation, (b) Aitken, and (c) accumulation mode aerosol number concentrations, averaged over time and the area of the high-sulfur region (a, b, c). Results are shown for the CTL (black solid), offREG (black dashed), 0.5 × emis (black dotted), 1.5 × emis (light-blue solid), 2 × emis (light-blue dashed), and 5 × emis (light-blue dotted) simulations. The results are from the 3-hourly instantaneous model output. The lower panel is the nucleation mode (d), Aitken mode (e), and (f) accumulation mode aerosol concentration averaged over the lowest 4 km in altitude of the profiles in the upper panel for the six simulations.
The influences of anthropogenic emissions on aerosol concentrations are quantified by the ratios of changes in aerosol concentrations to the factors of changes in anthropogenic emissions from the CTL simulation. Then, the means of the ratios are obtained; later in the paper, we refer to the mean ratios as changes per unit of anthropogenic emissions. The relationship between anthropogenic emissions and aerosol is not linear, but we use the mean ratio as a proxy to examine the overall influence of emissions on aerosol and clouds. Taking the 5 × emis simulation as an example, the calculation is as follows: . The most significant changes in aerosol number concentration due to anthropogenic emissions among the six simulations exist in the lowest 4 km in altitude. The height-mean nucleation mode aerosol number concentration below 4 km in altitude changes by −38 to 82 cm−3 in the five simulations, with varied anthropogenic emissions compared to the CTL simulation (Fig. 4d). On average, the nucleation mode aerosol concentration increases by 29 cm−3 (29 % of the concentration in the CTL simulation) per unit increase in anthropogenic emissions. Similarly, the Aitken mode changes by between −82 and 196 cm−3 in each simulation, with scaled loadings of anthropogenic emissions, and the concentration, on average, increases by 68 cm−3 per unit increase in anthropogenic emissions (16 %; Fig. 4e). The changes in the accumulation mode range from −15 to 41 cm−3, and, on average, the accumulation mode concentration increases by 12 cm−3 (4 %) for each unit increase in anthropogenic emissions (Fig. 4f). The total aerosol number, which also includes the insoluble Aitken mode and coarse mode, increases by around 113 cm−3 (13 %) for each unit increase in anthropogenic emissions.
Figures 5 and 6 show the relationship between aerosol number concentration, nucleation rate, condensation sink, sulfuric acid, and gas-phase sulfur content in the lowest 2 km in altitude. The lowest 2 km is used because this is where most of the pollution persists. The concentrations and rates are binned by gas-phase sulfur content, and each bin contains a mean. In all the simulations with anthropogenic gas emissions (CTL, 0.5 × emis, 1.5 × emis, 2 × emis, and 5 × emis), the concentrations of the nucleation mode and Aitken mode aerosol increase with increasing gas-phase sulfur content until around 2–3 ×10⁻³ g m−2. The concentrations significantly decrease in the largest gas-phase sulfur content bin. Meanwhile, the accumulation mode aerosol number concentration remains relatively steady and starts to increase when the gas-phase sulfur content is above 3 × 10⁻³ g m−2. The concentrations of accumulation mode aerosol are also reduced in the largest gas-phase sulfur content bin, although the extent of reduction in concentration is much smaller than that of nucleation and Aitken mode aerosol. The changes in nucleation mode aerosol concentration with gas-phase sulfur content are closely related to the H2SO4-Org nucleation rate and sulfuric acid concentration, while Aitken and accumulation mode aerosols are less affected by the nucleation rate. Overall, as anthropogenic emissions in the regional domain increase, we find increases in aerosol particle concentrations for all size ranges, H2SO4-Org nucleation rates, and condensation sinks in each gas-phase sulfur content bin. Although the H2SO4-Org nucleation rate should be suppressed by a higher condensation sink as gas-phase sulfur content increases, it is also enhanced by higher concentrations of sulfuric acid. This significant increase in the sulfuric acid concentration compensates for the suppression due to the condensation sink as gas-phase sulfur content becomes larger. The offREG simulation generally exhibits relatively small changes in aerosol concentrations, nucleation rate, condensation sink, and sulfuric acid compared to other simulations with varied anthropogenic emission (CTL, 0.5 × emis, 1.5 × emis, 2 × emis, and 5 × emis) as gas-phase sulfur content increases. The concentrations and rates in the offREG simulation are usually several factors to orders of magnitude smaller than those in the other five simulations, except for the condensation sink. These low concentrations indicate the importance of anthropogenic emissions from a small region on particles through the H2SO4-Org nucleation process in our model setup.
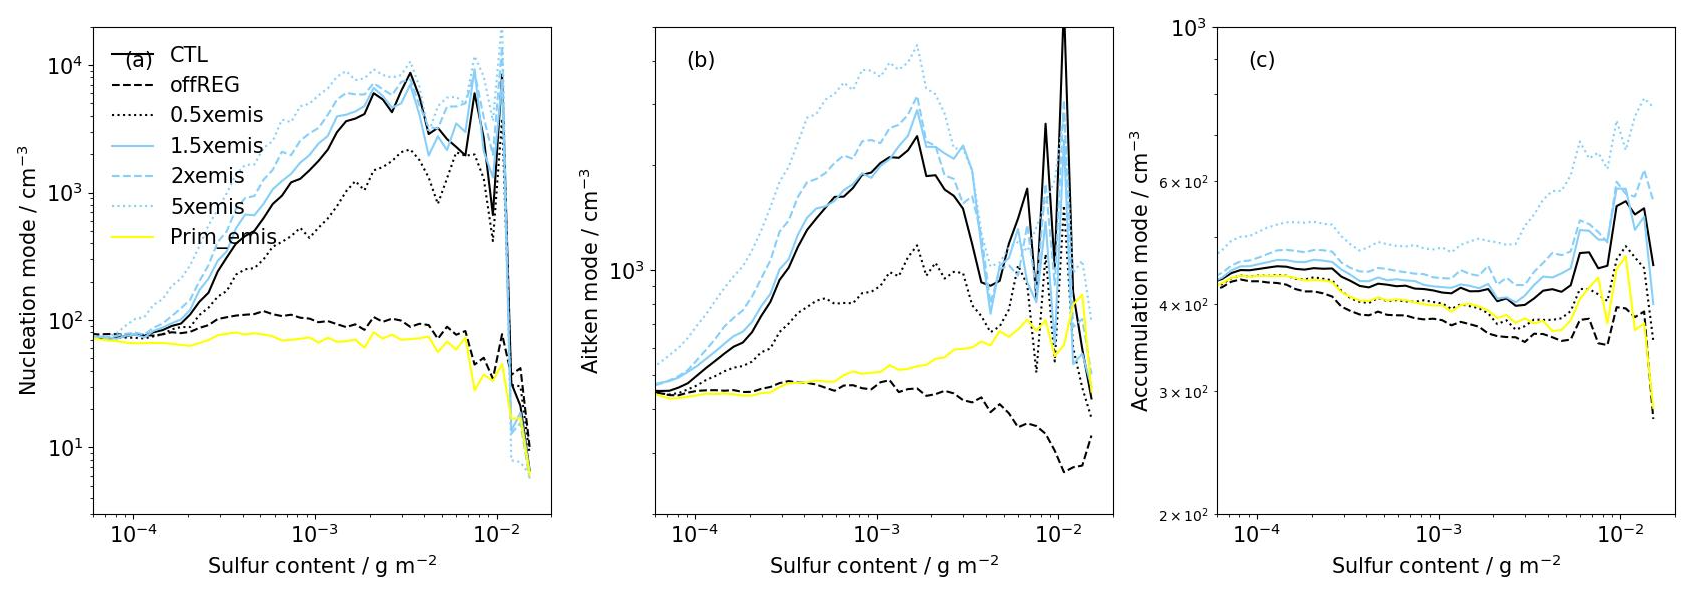
Figure 5Dependence of the (a) nucleation, (b) Aitken, and (c) accumulation mode aerosol number concentrations in the lowest 2 km in altitude on column-integrated gas-phase sulfur content. The mean concentrations are presented for 100 gas-phase sulfur content bins. Results are shown for the CTL (black solid), offREG (black dashed), 0.5 × emis (black dotted), 1.5 × emis (light-blue solid), 2 × emis (light-blue dashed), 5 × emis (light-blue dotted), and Prim_emis (yellow) simulations. The results are from the 3-hourly instantaneous model output.
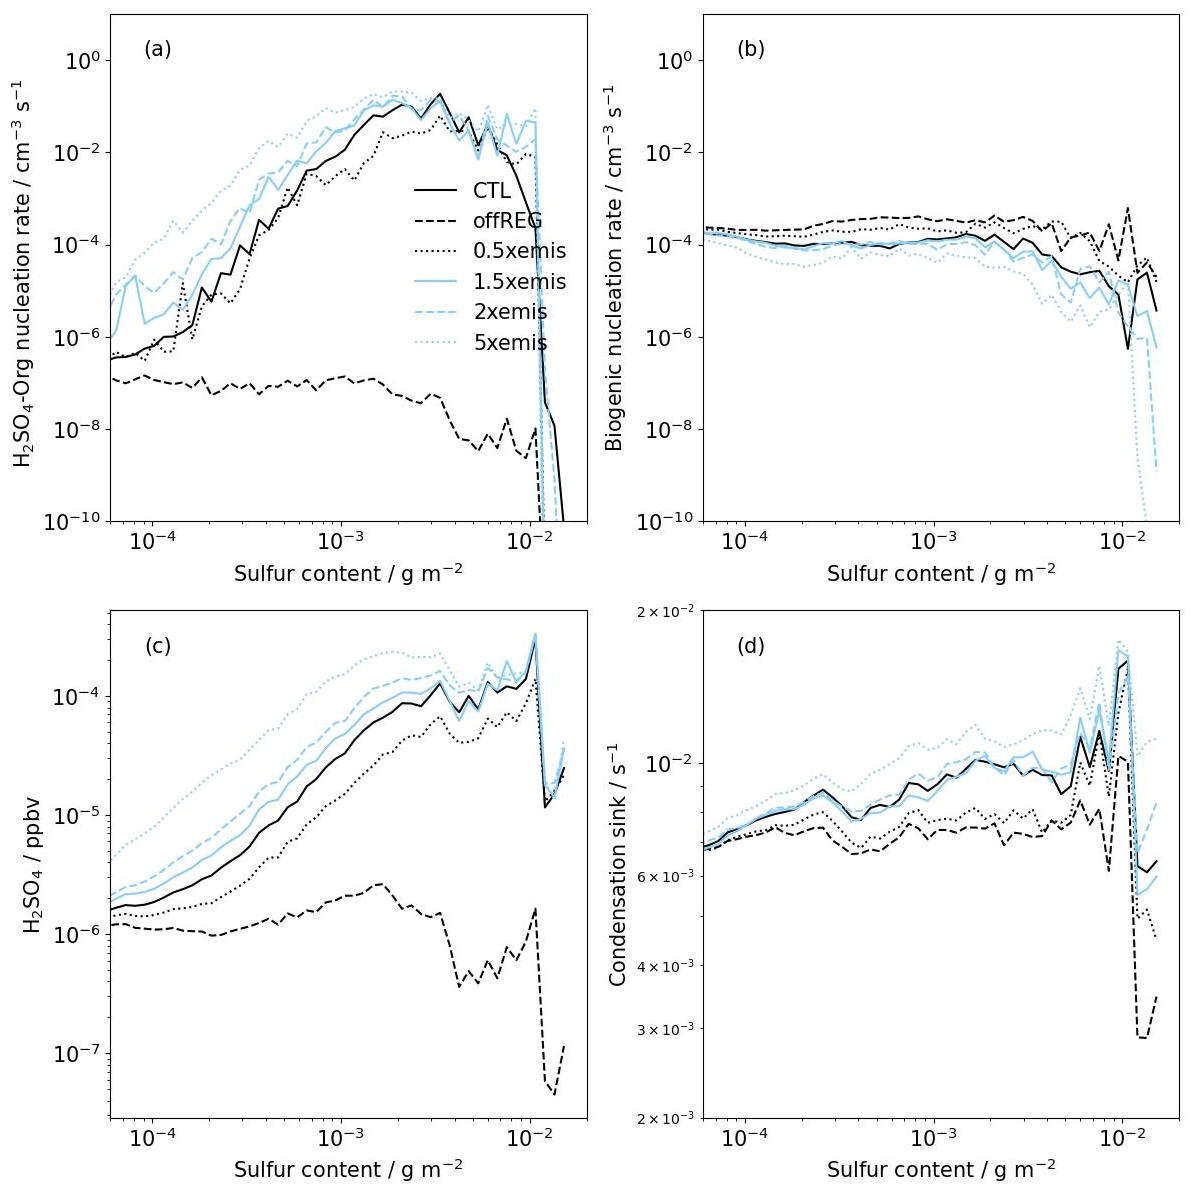
Figure 6Correlations of the (a) H2SO4-Org nucleation rate, (b) biogenic nucleation rate, (c) sulfuric acid concentration, and (d) condensation sink in the lowest 2 km in altitude with column-integrated gas-phase sulfur content. The mean rates and concentrations are presented for 100 gas-phase sulfur content bins. Results are shown for the CTL (black solid), offREG (black dashed), 0.5 × emis (black dotted), 1.5 × emis (light-blue solid), 2 × emis (light-blue dashed), and 5 × emis (light-blue dotted) simulations. The results are from the 3-hourly instantaneous model output.
As the gas-phase sulfur content increases, the concentrations of nucleation and Aitken mode aerosol have a reduction of around a factor of 4 between 4 × 10⁻³ and 1 × 10⁻² g m−2 of the gas-phase sulfur content. The reductions in this range are partly due to the rapidly increasing primary aerosol emissions in this gas-phase sulfur content range, but primary aerosol does not explain the significant reduction in the largest gas-phase sulfur content bin (≥ 1 × 10⁻² g m−2; Fig. 5b and c; yellow). In the absence of anthropogenic gas emissions and H2SO4-Org nucleation, the Prim_emis simulation showed an increase in primary Aitken and accumulation mode aerosol number concentration with increasing gas-phase sulfur content between 4 and 5 × 10⁻³ g m−2. The amplified anthropogenic emissions in this gas-phase sulfur content range can suppress nucleation and accelerate coagulation, resulting in more accumulation mode aerosols. The reduction in sulfuric acid by around a factor of 2 in this gas-phase sulfur content range also implies that more aerosols act as a sink for sulfuric acid, which then suppresses aerosol nucleation. In the largest gas-phase sulfur content bin, the aerosol concentrations of all sizes, nucleation rates, condensation sinks, and sulfuric acid have significant reductions. This finding is related to several factors. Firstly, these data are collected very close to the pollution sources, which are usually below 100 m, where nucleation is not permitted, resulting in a reduction in nucleation rates. Secondly, the sulfur content is derived from the gas-phase SO2 and H2SO4, with SO2 being the dominant contributor (see Fig. A6); therefore, the model grids with the highest SO2 do not always coincide with those with the highest aerosol concentration. Also, as oxidation takes at least a few hours, H2SO4 or particles cannot be formed quickly very close to the source, partly resulting in low particle concentrations, low H2SO4, and a low condensation sink. Thirdly, the largest bin contains less than 0.001 % of all data points in the lowest 2 km in altitude across all time steps, which may not accurately represent the concentrations, nucleation rates, and condensation sink. As a result, the model grids that fall into the largest gas-phase sulfur content bin (≥ 1 × 10⁻² g m−2) have the highest gas-phase SO2, while the other seven variables/tracers (particle concentrations, nucleation rates, condensation sink, and H2SO4) have very low values.
3.3 Effects of anthropogenic emissions on cloud properties
Figure 7 shows the profiles of droplet number concentration (Nd) and ice number concentration (Ni) averaged over time and the cloudy areas in high-sulfur regions. The cloudy areas are defined as model grids with total cloud water content greater than 0.1 g kg−1 and are defined separately for each simulation. In the CTL simulation, the mean Nd in cloudy areas increases with height until around 1.3 km, where it reaches a maximum of 135 cm−3; then, the concentration decreases until around 10 km in altitude. The Nd profiles in other simulations have similar shapes. Most of the differences that are caused by anthropogenic emissions that occur below 4 km and the relative magnitude follow the variations in aerosol concentrations in each simulation. The height-mean Nd below 4 km in altitude increases with increasing emissions, with concentrations of 84 cm−3 in offREG, 87 cm−3 in 0.5 × emis, 95 cm−3 in CTL, 98 cm−3 in 1.5 × emis, 102 cm−3 in 2 × emis, and 120 cm−3 in 5 × emis. Meanwhile, the 0.25 × aero simulation has a mean Nd of 36 cm−3, which is a factor of approximately 0.38 of the CTL simulation, and the 4 × aero simulation has a mean Nd of 224 cm−3 (a factor of 2.4 of the CTL). Concluding from all six simulations with varying emissions, the height-mean Nd in the lowest 4 km over time and cloudy areas in high-sulfur regions increases by around 9 cm−3 for each unit increase in anthropogenic emissions (equivalent to 9 % of the CTL simulation), but the latter two simulations produce more significant changes in Nd because we forced it.
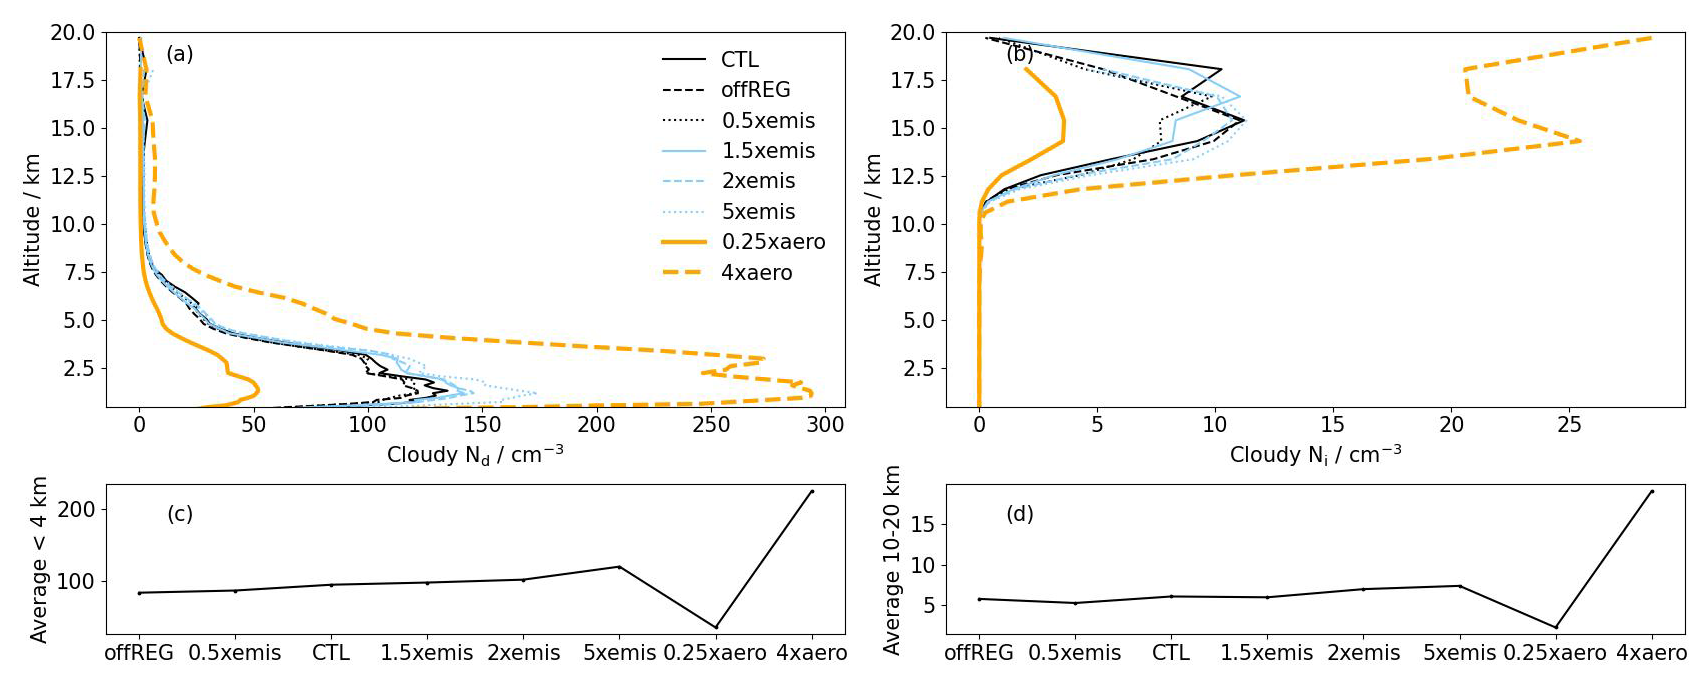
Figure 7Profiles of (a) Nd and (b) Ni, averaged over time and over the cloudy area of the high-sulfur region in the CTL (black solid), offREG (black dashed), 0.5 × emis (black dotted), 1.5 × emis (light-blue solid), 2 × emis (light-blue dashed), 5 × emis (light-blue dotted), 0.25 × aero (thick orange solid), and 4 × aero (thick orange dashed) simulations (a, b). The lower panel is the Nd (c) averaged over the lowest 4 km in altitude of the profiles in the upper panel for the eight simulations and Ni (d) averaged between 12 and 20 km in altitude of the profiles in the upper panel for the eight simulations. The results are from the 3-hourly instantaneous model output.
The in-cloud ice number concentration (Ni) is negligible from the surface to around 11 km in altitude, from which height it increases and peaks at around 15 km (11 cm−3 in the CTL simulation). Changing the anthropogenic emissions in the regional domain does not have a clear effect on Ni between 12 and 20 km. Averaged over height between 12 and 20 km, Ni in the simulations with the six scaled loadings of anthropogenic emissions have similar values (roughly 6 cm−3), and the differences are negligible. However, in the 0.25 × aero simulation, Ni is reduced by a factor of 3 compared to the CTL simulation, and in the 4 × aero simulation, it is increased by a factor of 3. The profiles of in-cloud liquid and ice mass mixing ratios averaged over the high-sulfur regions exhibit several peaks at 3, 6, and around 13 km in altitude for the eight simulations (Fig. 8). The cloud water is in the liquid phase below 4 km in altitude, mixed phase between 4 and 10 km, and ice phase above 10 km (Fig. A7). The cloud liquid water mass mixing ratio is similar among the eight simulations, and it quickly increases with altitude from 1 to 3 km, reaching a maximum (0.46 g kg−1) and then decreasing with height. Some clearer (but still not obviously systematic) differences among the eight simulations are shown for the cloud ice mass mixing ratio, which exist above about 5 km in altitude, allowing the mixed-phase cloud to reach 0.6 g kg−1 at around 6 km and cloud ice mass to become 0.61 g kg−1 at 14 km in altitude. The results show that the variations in cloud ice mass with height are not affected by changes in anthropogenic emissions by factors of between 0 and 5 relative to the CTL simulation or when Nd is significantly reduced or increased (0.25 × aero and 4 × aero).
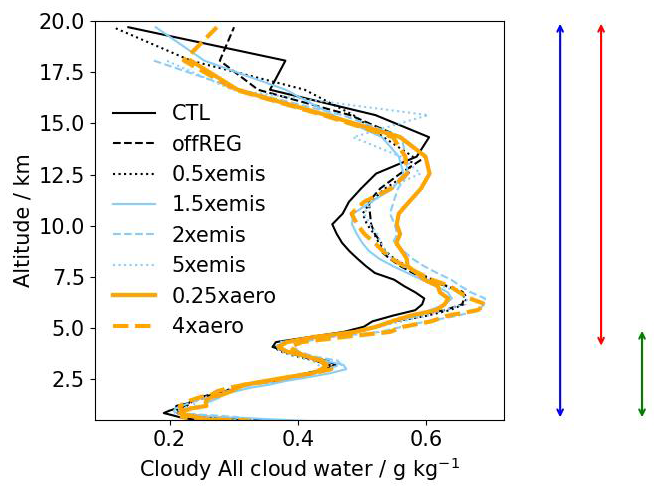
Figure 8Profiles of the total cloud water mass mixing ratio (cloud liquid, ice crystal, snow, and graupel), averaged over time and over the cloudy area of the high-sulfur region in the CTL (black solid), offREG (black dashed), 0.5 × emis (black dotted), 1.5 × emis (light-blue solid), 2 × emis (light-blue dashed), 5 × emis (light-blue dotted), 0.25 × aero (thick orange solid), and 4 × aero (thick orange dashed) simulations. The results are from the 3-hourly instantaneous model output. The three arrows indicate the vertical extent of the cloud heights that we use to identify deep clouds (blue), shallow clouds at high altitude (red), and shallow clouds at low altitude (green) in Fig. 9.
The distributions of the total cloud liquid and ice mass mixing ratios are shown as box plots in Fig. 9 based on 3-hourly instantaneous output in the six simulations with scaled loadings of anthropogenic emission, 0.25 × aero, and 4 × aero simulations separated into deep clouds (thickness greater than 3 km), shallow clouds (thickness smaller than 3 km) situated below 5 km in altitude, and shallow clouds situated above 4 km in altitude. All three cloud categories have the same cloud water mass mixing ratio for the minimum (0.1 g kg−1). Although deep clouds show the largest variability in the cloud water mass mixing ratio, the differences between CTL and other simulations are not large. The maxima for the upper quartile (the edge of the upper 75 %) and the maxima for deep clouds occur in the offREG and 0.25 × aero simulations, which have the fewest cloud droplets. The water content in shallow clouds at low and high altitudes similarly shows no systematic dependence on aerosol concentrations. Overall, the box plots show that the occurrence of “extreme” values is random under varied anthropogenic emissions.
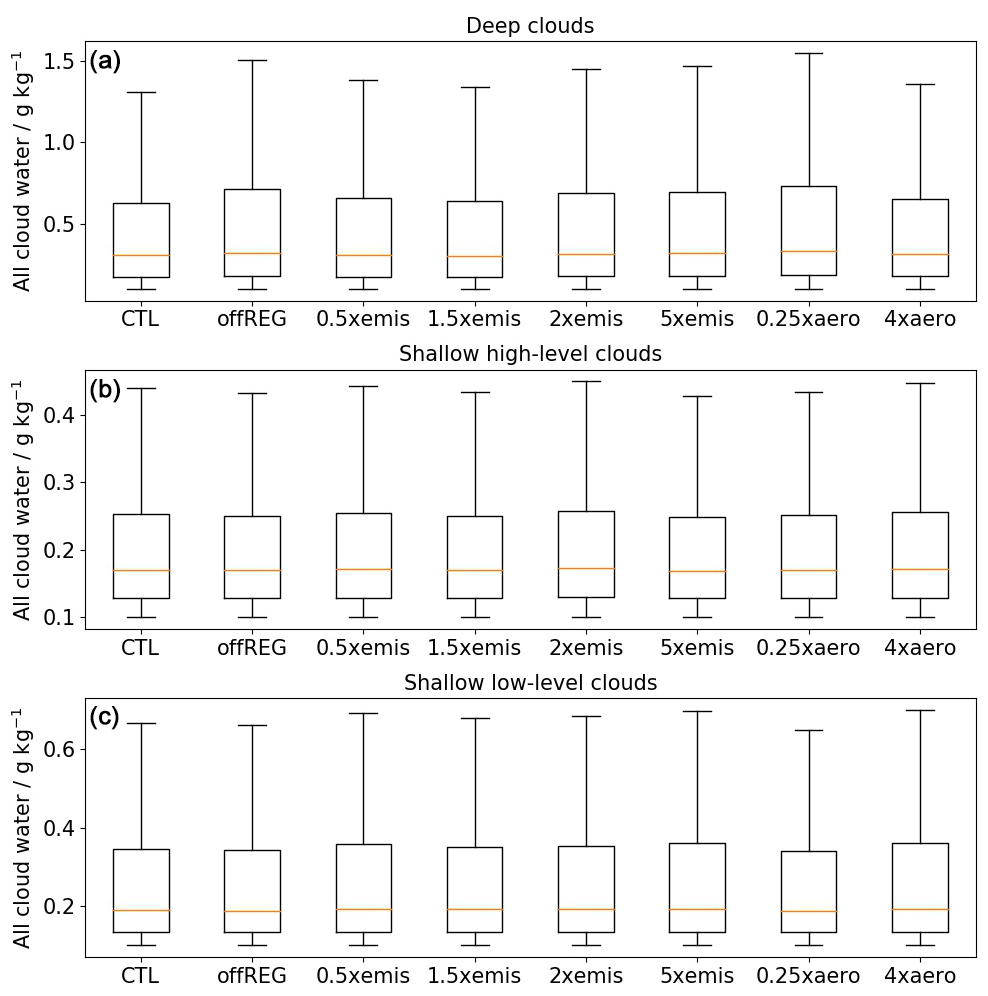
Figure 9Box plots of the total cloud water mass mixing ratios from all the 3-hourly instantaneous output in the cloudy area of the high-sulfur regions in the CTL, offREG, 0.5 × emis, 1.5 × emis, 2 × emis, 5 × emis, 0.25 × aero, and 4 × aero simulations for deep clouds (cloud thickness greater than 3 km; top), shallow clouds at high altitude (cloud thickness smaller than 3 km and at above 4 km in altitude; middle), and shallow clouds at low altitude (cloud thickness smaller than 3 km and at below 5 km in altitude; bottom).
A map of the differences in surface rain rate between the CTL and 0.25 × aero simulations is shown in Fig. 10. The rain rates have been averaged over the simulation period 12–18 March 2014. Because the high-sulfur regions evolve with time, the map shows all the locations where the rain rate has ever occurred in the regions that meet the “high-sulfur” threshold during the 7 d simulations. The perturbations to surface rain occur mostly close to the Amazon river, where cities are located. Averaged over time, the surface rain in high-sulfur regions is increased by 0.16 mm d−1 in the 0.25 × aero simulation from the CTL simulation (4 % increase). The distributions of the surface rain rate in the CTL and 0.25 × aero simulations are shown in Fig. 11. The histograms of the surface rain rate differ between CTL and 0.25 × aero but only for the upper end of the distribution above 16 mm d−1. Similarly, the histograms of the surface rain mass mixing ratios for all eight simulations (Fig. A8) show that the changes are clear only for the maximum values (greater than 2 g kg−1), while light rain is rarely affected. Although the differences in surface rain rate seem small between the CTL and 0.25 × aero simulations, the profiles of the rain mass mixing ratio in Figs. 11 and A7 show that 0.25 × aero exhibited at least twice as much as the change in other simulations vs the CTL simulation. The changes in the rain mass mixing ratio in the 0.25 × aero from the CTL simulation are statistically significant (p value is 0.04). Therefore, rain is appreciably affected only when the total aerosol number concentration is reduced significantly (0.25 × aero).
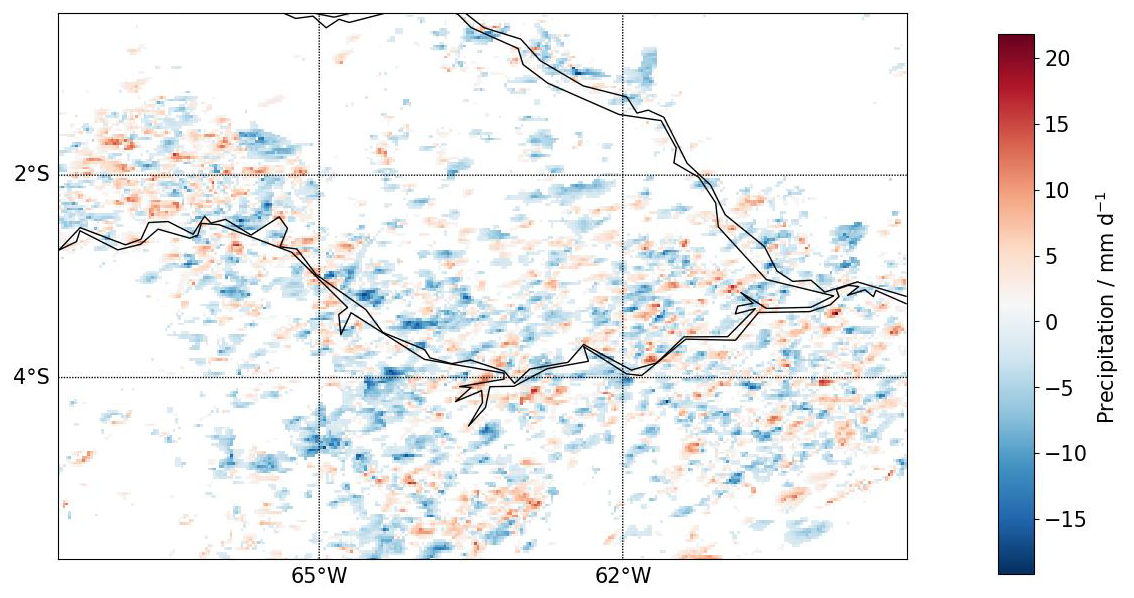
Figure 10The map of the differences between the CTL and 0.25 × aero simulations for the time-mean surface rain rates in all the high-sulfur regions between 12 and 18 March 2014 with the 3-hourly mean model output.
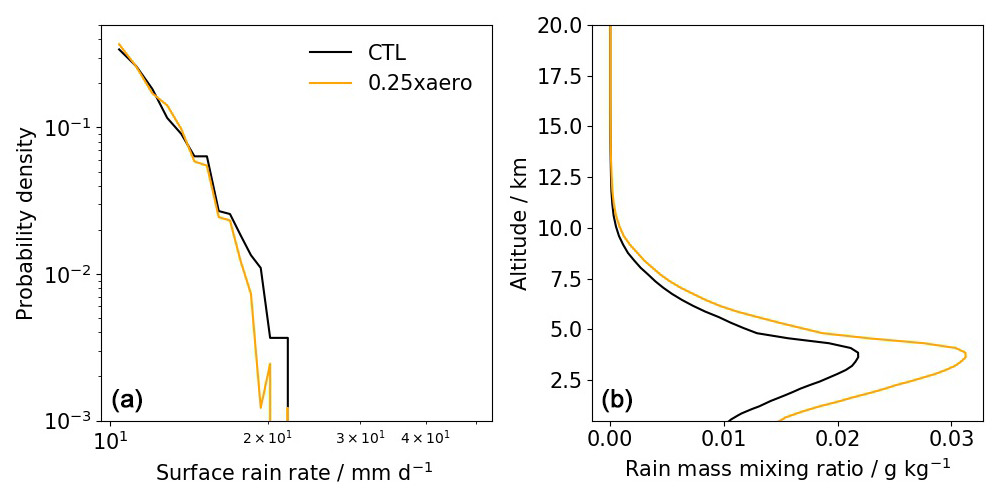
Figure 11Histograms of the surface rain rate (a) and profiles of the rain mass mixing ratio (b) in high-sulfur regions in the CTL (black) and 0.25 × aero (orange) simulations. The results are from the 3-hourly mean model output. The area under each line equals to 1.
The surface rain mass mixing ratios in each simulation are decomposed into several column-mean cloud droplet number concentration bins in Fig. 12 to understand the relationship between cloud droplet concentrations and rain. The probability of a surface rain mass mixing ratio smaller than 0.4 g kg−1 decreases as the cloud droplet concentration increases, while the probability of rain between 0.4 and 3 g kg−1 tends to become larger as cloud droplet concentrations increase. This finding implies that, with relatively light to moderate rain (< 0.4 g kg−1), a higher droplet number concentration suppresses rain, while a high cloud droplet number concentration is necessary to generate or sustain heavier rain (0.4–3 g kg−1). Such effects are less significant in the 4 × aero simulation compared to the others. The probability of rain becomes similar in different cloud droplet number concentration bins, i.e. rain is suppressed because of too many droplets formed from aerosols. To improve the statistical significance of any changes, two 1-month CTL and offREG simulations were run from 11 March to 10 April 2014 (Fig. A9). The results are similar to those of the six 1-week simulations in that the Nd, ice, and liquid cloud mass mixing ratios and rain mass mixing ratio are not significantly different between the CTL 1-month and offREG 1-month simulations. For example, the differences in Nd between the CTL 1-month and offREG 1-month simulations are 10 cm−3 (10 % of the CTL 1-month simulation) when averaged over time, heights below 10 km in altitude, and the cloudy area of the high-sulfur regions. The mean difference for Ni above 10 km in altitude is −0.2 cm−3 (−31 %), and for the total cloud mass mixing ratio at all altitudes, the difference is −0.03 g kg−1 (−7.2 %). The rain mass mixing ratio differences are 0.002 g kg−1 (16 %) below 10 km in altitude in the high-sulfur regions. The histograms of the surface rain mass mixing ratio in the polluted regions in the two simulations show that rain mass differs from that of the other simulations only when rain is greater than around 3 g kg−1 (Fig. A8), with higher frequencies of greater rain mixing ratios in the month-long simulations. This is likely because the longer sampling time allows the occurrence of more extreme rain rates.
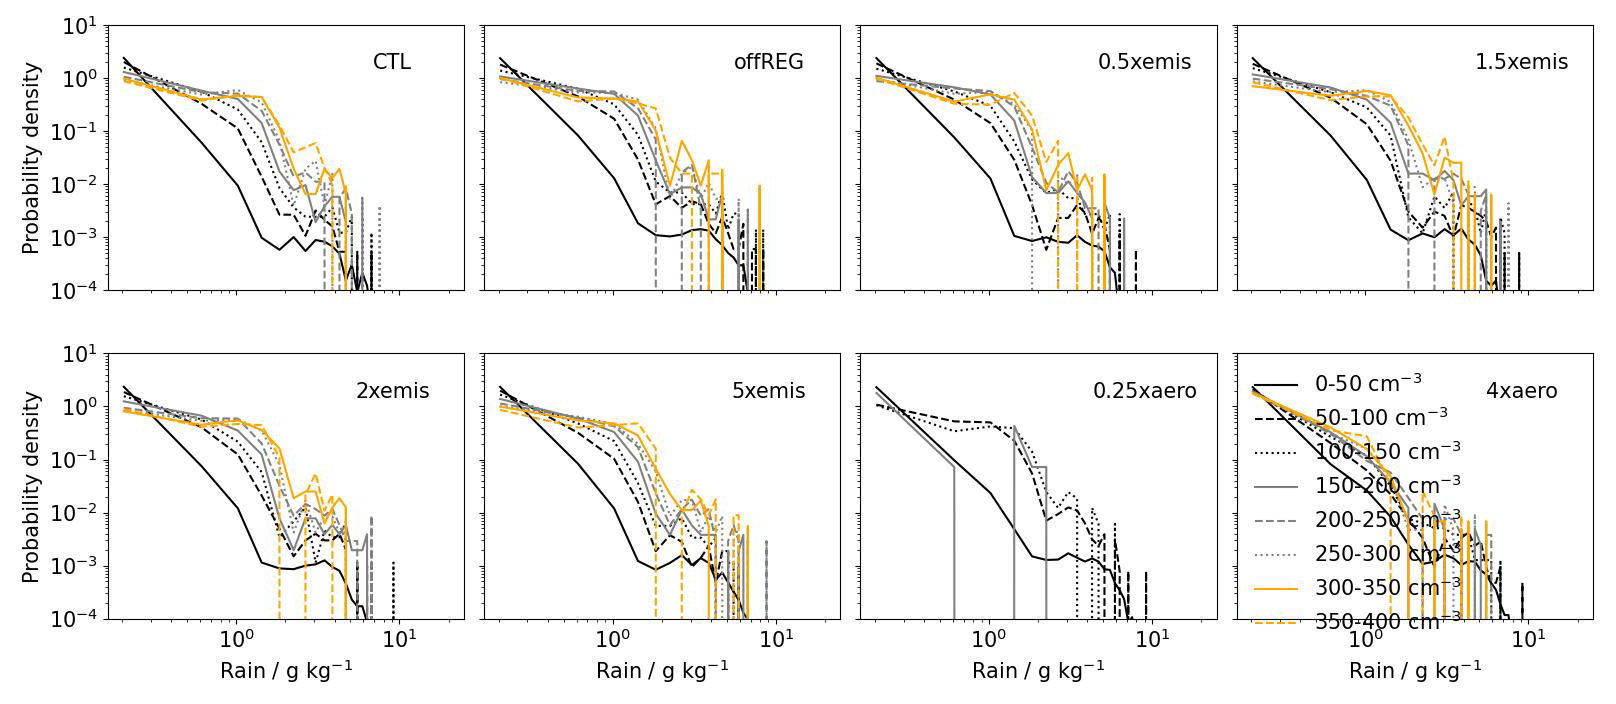
Figure 12Histograms of the surface rain mixing ratio in the high-sulfur regions in the CTL, offREG, 0.5 × emis, 1.5 × emis, 2 × emis, 5 × emis, 0.25 × aero, and 4 × aero simulations. Rain results are separated into several column-mean cloud droplet number concentration bins for each simulation (0–50 cm−3 in black solid, 50–100 cm−3 in black dashed, 100–150 cm−3 in black dotted, 150–200 cm−3 in grey solid, 200–250 cm−3 in grey dashed, 250–300 cm−3 in grey dotted, 300–350 cm−3 in yellow solid, and 350–400 cm−3 in yellow dashed). The results are from the 3-hourly instantaneous model output. The area under each line equals to 1.
We investigated the influences of anthropogenic emissions on aerosol particles, clouds, and rain in central Amazonia using a regional model nested within a global atmosphere-only model, and we scaled the anthropogenic emissions in the regional domain relative to a control simulation. The baseline simulation (CTL) compared well with the observations for particles smaller than 10 nm in diameter in the areas where G-1 aircraft flew (mostly below 2 km), and the model captured the variability across the plume transects for these aerosol particles. However, the model sometimes did not reproduce the magnitude and temporal variability for particles greater than 100 nm. Possible reasons are listed below:
-
It may be related to the absence of some primary sources such as natural pollen or additional anthropogenic emissions from the Manaus region.
-
Upper tropospheric (UT) NPF, along with subsequent downward transport, has been shown to be important for determining low-level particle concentrations (Clarke et al., 1998, 1999; Clarke and Kapustin, 2002; Merikanto et al., 2009; Wang et al., 2016; Williamson et al., 2019; Curtius et al., 2024), and it is important for Amazonia during the dry season (Andreae et al., 2018). Observations have reported bursts of particles due to NPF from organic compounds formed by isoprene with NOx (Kuhn et al., 2010; Bardakov et al., 2024; Shen et al., 2024). Our model does not include this NPF mechanism due to the absence of isoprene-NOx chemistry, but we do not expect the absence of this mechanism to significantly affect our results. In this study, we focus on the wet season and only use the GoAmazon2014/5 observation dataset for our time period, which focused mainly on the boundary layer (below 2 km), although the infrequent sampling casts doubt on how representative of mean conditions these observations were. The aircraft occasionally flew between 2 and 6 km in altitude and found very few particles in the free troposphere during the Amazonian wet season. Consequently, it is very uncertain how representative the observations in the free troposphere are of typical conditions in that region. When we switched on UT NPF in our model, particle concentrations increased significantly in the free troposphere and the boundary layer, leading to an overestimation compared to the observations. To better match the observations, we therefore disabled NPF above 1 km to achieve consistency between the model and observations in March 2014. This setup is not ideal but a compromise that likely still causes biases in the concentrations of particles greater than 100 nm in diameter and should be improved upon in future simulations.
Switching off anthropogenic emissions in the regional domain (CTL to offREG simulation) caused reductions in aerosol number concentrations along the flight tracks by around −70 % to −90 % for ND>3 nm, −50 % to −70 % for ND>10 nm, and up to −20 % for ND>100 nm particles along the flight tracks. The aerosol reductions resulted from decreases in both primary and nucleated particles, with the latter being the dominant factor. The overall positive correlation between particle number concentrations and anthropogenic emissions in Amazonia was also found in Shrivastava et al. (2019) and Zhao et al. (2021). Primary aerosol had a very small contribution to the smallest particles (ND>3 nm), and it contributed to around 10 % and less than 20 % of the ND>10 nm and ND>100 nm particles, respectively. Overall, the primary aerosol contributed to around 0.5 % of the height-mean total particle concentrations in the CTL simulation below 4 km in altitude in the high-sulfur regions in the regional domain (Fig. 4). In this study, both the pure biogenic nucleation mechanism from monoterpenes and the nucleation mechanism that uses H2SO4-Org to create new particles were used. The simulations showed that, after suppressing upper tropospheric nucleation, the H2SO4-Org nucleation rate was much more sensitive to changes in anthropogenic emissions (primarily SO2) than pure biogenic nucleation in the lowest 4 km in altitude. The H2SO4-Org nucleation mechanism in our study was therefore the more important factor in controlling the particle concentration variations along the flight tracks, though the contribution would be smaller if upper tropospheric nucleation was included. To quantify the effects of anthropogenic emissions on aerosol, cloud, and rain, we focused on the regions that are strongly affected by anthropogenic emissions in the regional domain (termed high-sulfur regions) defined by an instantaneous column-integrated gas-phase sulfur content (from H2SO4 and SO2) below 2 km in altitude that exceeds 6 × 10⁻⁵ g m−2 in the CTL simulation. We then compared the changes in aerosol, cloud, and rain properties among the simulations in the high-sulfur regions. The high-sulfur regions are dependent on the time and intensity of emissions as well as the wind fields. For each unit increase in anthropogenic emissions in the regional domain (e.g. from CTL to 2 × emis), the equivalent total aerosol number concentrations in the high-sulfur region increased by approximately 13 %, averaged over time. The positive relationship between aerosol and anthropogenic emissions was also found in some observational studies in which days of clean and polluted air in Amazonia were compared (Martin et al., 2016, 2017) and was found in modelling studies (Shrivastava et al., 2019; Zhao et al., 2021). In the high-sulfur regions, we then analysed the relationship between particle concentration, nucleation rate, condensation sink, and sulfuric acid with the column-integrated gas-phase sulfur content in the lowest 2 km in altitude. Similar to the domain- and time-mean profiles, anthropogenic emissions enhance the H2SO4-Org nucleation rates and particle concentrations for all size ranges, but they do not increase monotonically with increasing column-integrated gas-phase sulfur content. The nucleation mode aerosol, Aitken mode aerosol, H2SO4-Org nucleation rate, and sulfuric acid concentration reach a plateau and subsequently have a reduction of around a factor of 4 for gas-phase sulfur content ranging between 4 × 10⁻³ and 1 × 10⁻² g m−2. The reduction in nucleation rates between 4 × 10⁻³ and 1 × 10⁻² g m−2 is related to the increasing primary aerosol emission as it gradually becomes closer to the source of the pollution, but not where gas-phase sulfur content is very high. The extra primary aerosols can act as a sink for sulfuric acid and subsequently suppress nucleation and accelerate coagulation, resulting in lower nucleation and Aitken mode aerosol concentrations. Zhao et al. (2021) also showed that nucleation was suppressed near the pollution source in Manaus. In our model, all the variables significantly decrease when gas-phase sulfur content is greater than 1 × 10⁻² g m−2 in Figs. 5 and 6. The model grids with gas-phase sulfur content greater than 1 × 10⁻² g m−2 contain mainly SO2 and very few particles or little H2SO4, causing significant reductions in nucleation rates and the condensation sink. Figure A11 shows the ratio of soluble Aitken mode to insoluble Aitken mode aerosol concentrations as a function of distance from Manaus (the pollution source) at around 550 m in altitude for the six experiments with scaled emission loadings. The ratios are low within approximately 20 km downwind of Manaus, while the ratio increases significantly at distances of 100–200 km from Manaus. This finding suggests suppressed NPF in very-high-sulfur regions and enhanced NPF in moderate-sulfur regions, which is consistent with the results shown in Figs. 5 and 6. The biogenic nucleation rate exhibits a slight decreasing trend with gas-phase sulfur content and the level of anthropogenic emissions due to the corresponding increase in condensation sink. Additionally, the lack of upper tropospheric nucleation prevents the majority of biogenic nucleation, making it a less significant factor in influencing particle concentrations in Amazonia under this model setup (Merikanto et al., 2009; Kirkby et al., 2016; Gordon et al., 2016; Wang et al., 2023). However, it is important to take the upper-tropospheric biogenic nucleation into account in future studies to better understand the sources of aerosol particles in Amazonia. We also investigated the influences of anthropogenic emissions on clouds. In the lowest 4 km in altitude, the cloudy Nd increased by 9 % for each unit increase of anthropogenic emissions. Higher anthropogenic emissions resulted in more cloud droplets because greater aerosol concentrations can produce more CCN, which subsequently enhances cloud droplet concentrations (Cao et al., 2023). Reducing the aerosol concentration caused a reduction in Nd by a factor of 2 in the 0.25 × aero simulation compared to the CTL simulation, while increasing the aerosol concentration by a factor of 4 resulted in more than doubled Nd in the 4 × aero simulation. The variable we perturbed in these simulations (Ni in the Abdul-Razzak and Ghan (2000) droplet activation scheme, hereafter ARG2000) in the CASIM activation scheme is not directly equivalent to the model output Nd because ARG2000 is non-linear between Ni and Nd. The model output Nd depends strongly on updraught speeds via the activation parameterization and is also influenced by several dynamical and microphysical processes at each time step (e.g. advection, droplet freezing, riming, or warm rain formation), and Nd shown in Fig. 7 has been averaged over time and high-sulfur cloudy regions using the 3-hourly model output. Therefore, changes in Nd in these simulations do not scale directly with the aerosol perturbation relative to the CTL simulation. For ice particle number concentrations (Ni), we found reductions in the 0.25 × aero simulation and increases in the 4 × aero simulation that were caused by changes in Nd, while the rest of the simulations had similar Ni because of similar Nd. Although our model does not have aerosol-aware heterogeneous ice nucleation, aerosol number concentration may still influence ice indirectly through cloud droplet number concentration, which can affect the number concentration of ice crystals formed via homogeneous freezing. The correlation between Ni and Nd in the 0.25 × aero and 4 × aero simulations is consistent with previous studies that have shown that ice concentrations are affected by cloud droplet concentrations (Fan et al., 2013; Herbert et al., 2015; Grabowski and Morrison, 2020). Our simulations explored how changes in aerosol affected cloud and rain water mass mixing ratios. The responses of the total cloud water and rain mass mixing ratios were not statistically different among the various perturbation simulations. This absence of significant effects from aerosol may be explained by the multiple complex processes of aerosol–deep convection interactions that can buffer the effects of aerosol concentration perturbations. Connolly et al. (2013) stated that aerosols affected deep convective clouds in a non-linear way, which causes complex changes in cloud and rain. Similar non-linear relationships have been addressed by Ekman et al. (2007) and van den Heever and Cotton (2007). There is a possibility that using a more complex cloud microphysics scheme may contribute to different responses of cloud and rain. For example, the lack of prognostic supersaturation in this work may break the continuity of the evolution of the clouds, and consequently the results may be different compared to those with prognostic supersaturation (Fan and Khain, 2021). The 3 km resolution does not resolve all convection in the model, and the transport of heat and moisture may be limited at smaller scales. The current temperature-dependent ice formation scheme, which is not aware of aerosol particles, will limit the model’s ability to simulate cold rain. Additionally, Furtado and Field (2022) showed a surface rainfall frequency probability function based on the Met Office Unified Model, and this distribution was not altered by aerosol or cloud droplet number concentrations. Their results imply that even if aerosol may affect rainfall amounts in individual model grids, rainfall distribution is an invariant property of their model. In contrast, reducing and increasing the concentrations of aerosol by a factor of 4 in the activation process (0.25 × aero and 4 × aero simulations) produced changes in Nd and Ni (relative to the baseline CTL simulation) that were at least a factor of 2 greater than in the other simulations with scaled anthropogenic emissions. The mean rain rate in 0.25 × aero was then increased by around 4 % relative to the CTL simulation in the high-sulfur regions, but the histograms of rain rate did not show significant differences between the CTL and 0.25 × aero simulations. The much greater response of rain in the 0.25 × aero simulation implies that the perturbations to aerosol and Nd were not large enough in the six simulations with scaled anthropogenic emissions to have triggered significant changes. The 4 × aero simulation, even though it has significant increases in Nd compared to the CTL simulation, shows insignificant changes in rain, and the rain is suppressed in all the cloud droplet number concentration bins (Fig. 12). This pattern shows the non-linearity of rain as cloud droplet concentration increases: rain has already been suppressed as much as it can be at the aerosol concentrations of the offREG simulation, which may explain the lack of change in rain at higher aerosol concentrations. Analyses in regions with the column-integrated gas-phase sulfur content lower than 6 × 10⁻⁵ g m−2 are not included in this study. These regions generally exhibit minimal sensitivity to the perturbations in anthropogenic emissions (see Fig. A10) because all regions that are potentially affected by anthropogenic emissions are already included in the high-sulfur regions. As the high-sulfur regions vary with time, the remaining areas with gas-phase sulfur content lower than the threshold are usually not affected by the anthropogenic plume and therefore are not the focus of the analysis. Review studies (Rosenfeld et al., 2008; Tao et al., 2012; Fan et al., 2016) have highlighted the potentially complex relationships among aerosols, clouds, and precipitation, and similar messages have been conveyed by some modelling studies, although their focus was not on the environment in Amazonia (Seifert et al., 2012; Fan et al., 2016; Alizadeh-Choobari, 2018; Barthlott et al., 2022; Furtado and Field, 2022). For example, Alizadeh-Choobari (2018) investigated mid-latitude cloud systems and pointed out that aerosols could cause a redistribution of rain and that the response of rain to aerosol loadings depended on rain intensity. Barthlott et al. (2022) used the ICON model and found that the microphysical effects of higher CCN caused narrower cloud droplet distributions and reduced rain rates over Germany. However, using the COSMO weather forecast model, Seifert et al. (2012) found that aerosols had a negligible effect on surface precipitation over Germany. Evaporation was shown to be enhanced with more aerosols because of the formation of more smaller-sized cloud droplets, which may subsequently release aerosols into the atmosphere (Leung et al., 2023). Shallow cumulus clouds were found to be more sensitive to such enhanced evaporation than large congestus clouds because large congestus clouds are more likely to go through warm-phase invigoration rather than enhanced evaporation (Leung et al., 2023). Overall, the relationships between anthropogenic emissions, aerosols, clouds, and rain are complex, and the perturbations of anthropogenic emissions do not show systematic changes in cloud liquid water, cloud ice water, or rain. The insensitivity is potentially due to the environment (even when we switched off all anthropogenic emissions) already having a lot of background aerosols for cloud activation in the regional domain. Under this condition, the subsequent changes in Nd are small and eventually result in insignificant changes in other cloud properties. However, we found distinct responses of clouds when the number of aerosols was directly reduced by a factor of 4, with a subsequent reduction in Nd by a factor of 2. This indicates that local anthropogenic emissions do not exert a strong control over CCN and cloud droplet concentrations within convective clouds over the scale of the regional domain, although it is possible that the anthropogenic emissions might have more impact further downwind, as this would allow more time for growth of nucleated aerosols to CCN sizes (Wang et al., 2023). The limitations of this study lie in the absence of an upper-tropospheric NPF mechanism, simplified warm cloud microphysics, and missing aerosol-aware heterogeneous ice nucleation microphysics. We manually prevent NPF outside of the layer between 100 m and 1 km in altitude so that the regional model has a better representation of the observed aerosol particle concentrations. This compromise reduces the contribution of newly formed aerosols from the upper troposphere and their possible interactions with deep convection in the free and upper troposphere (Ekman et al., 2004; Yin et al., 2005; Fan et al., 2018). Not including isoprene and nitrates in NPF may introduce some inconsistencies between the simulations and the real world. Additionally, including extra primary aerosols (such as pollen, bacteria, and spores), as well as sulfate compounds in the flooded areas that may lead to secondary sulfate production, could improve the representation of ND>100 nm in the Amazon. However, these primary biological aerosol particles may have limited impact on the cloud droplet number concentration due to their low concentrations in this region and their role in activating aerosols to form cloud droplets (Heald and Spracklen, 2009; Pöschl et al., 2010). Andreae et al. (1990) has shown that, although the forest has high sulfur gas emission, the concentrations of aerosol are more mainly associated with marine and anthropogenic sulfate aerosol. Other relevant studies have not quantified the contribution of sulfur from floodplain to secondary aerosol formation (Brinkmann and Santos, 1974; Andreae and Andreae, 1988; Jardine et al., 2015). The simplified warm cloud microphysics and lack of aerosol-dependent heterogeneous ice nucleation might prevent liquid and ice water content changes in response to aerosol concentration changes. The study provides insights into the response of aerosols, cloud properties, and precipitation to changes in anthropogenic emissions in a small region, but it is limited by some simplified processes or processes that are not included in the model. Nevertheless, we do not expect these limitations to significantly affect our conclusions. We recommend future studies to investigate how the background aerosol particles affect the aerosol–cloud interaction in this region by removing anthropogenic emissions globally. It is also recommended that future studies focus on the response of a single cloud to anthropogenic emissions using a higher resolution (e.g. large-eddy simulation) in order to better understand the physical processes of the affected cloud, in a way similar to the study of Miltenberger et al. (2018b), which developed an ensemble to evaluate the response of cloud properties. Additionally, having a thorough investigation of the influences of cloud microphysical processes (e.g. ice formation, autoversion, and accretion) on cloud and rain properties will improve our understanding of the complex environment. Parameterizing isoprene nitrates nucleation based on the most recent results is recommended for future studies in this region. In conclusion, our study provides a more detailed understanding from a modelling perspective of the effects of anthropogenic emissions and NPF on CCN and cloud droplet concentrations in the Amazonian wet season.
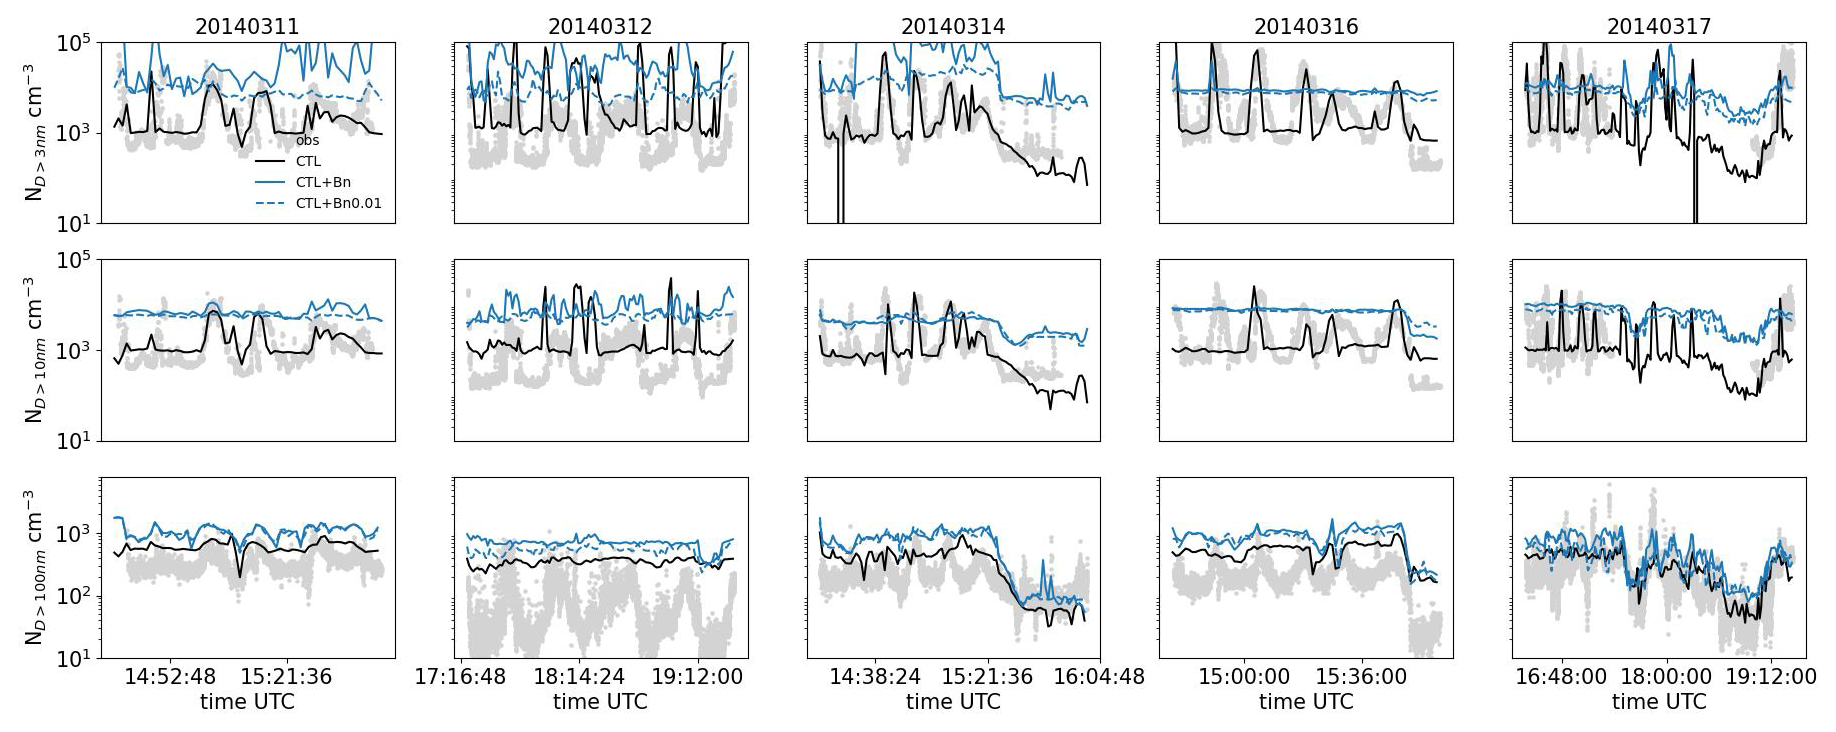
Figure A1Time series of observed (grey dots) and modelled (CTL, CTL + Bn, and CTL + Bn0.01; solid lines) particle number concentrations with diameters greater than 3 nm (upper row), 10 nm (middle row), and 100 nm (lower row) on 11, 12, 14, 16, and 17 March 2014. The observations were measured on board the G-1 aircraft during the GoAmazon2014/5 campaign, and model data were interpolated according to the G-1 flight tracks. Black solid lines are for the CTL simulation, blue solid lines are for the CTL + Bn simulation, where binary nucleation (H2SO4-H2O) is switched on above an altitude of 100 m, and blue dashed lines are for the CTL + Bn0.01 simulation, which is based on the CTL + Bn simulation, but the binary nucleation rate is reduced by a factor of 100.
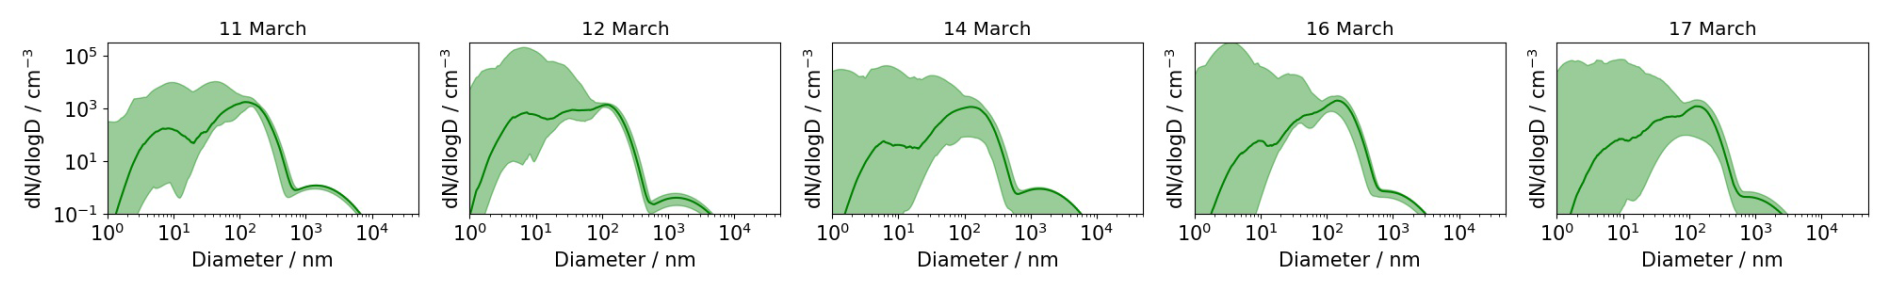
Figure A2The medians of the particle size distributions on 11, 12, 14, 16, and 17 March 2014 in the CTL simulation. The model data have been interpolated according to the time, coordinates, and altitudes of the G-1 flight tracks. Shaded regions represent 97.5 % and 2.5 % of the distributions at all the interpolated times.
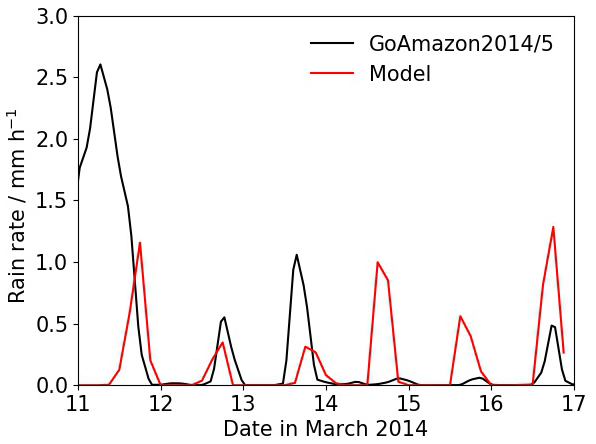
Figure A3Precipitation rate observed by S-band Amazon Protection National System radar at 3.2° S, 60.6° W during GoAmazon2014/5 from 11 to 17 March 2014 (black), and precipitation rate from the model in the CTL simulation (red) averaged over the radar domain (approximately 2°by 2° W domain centred at 3.2° S, 60.6° W).
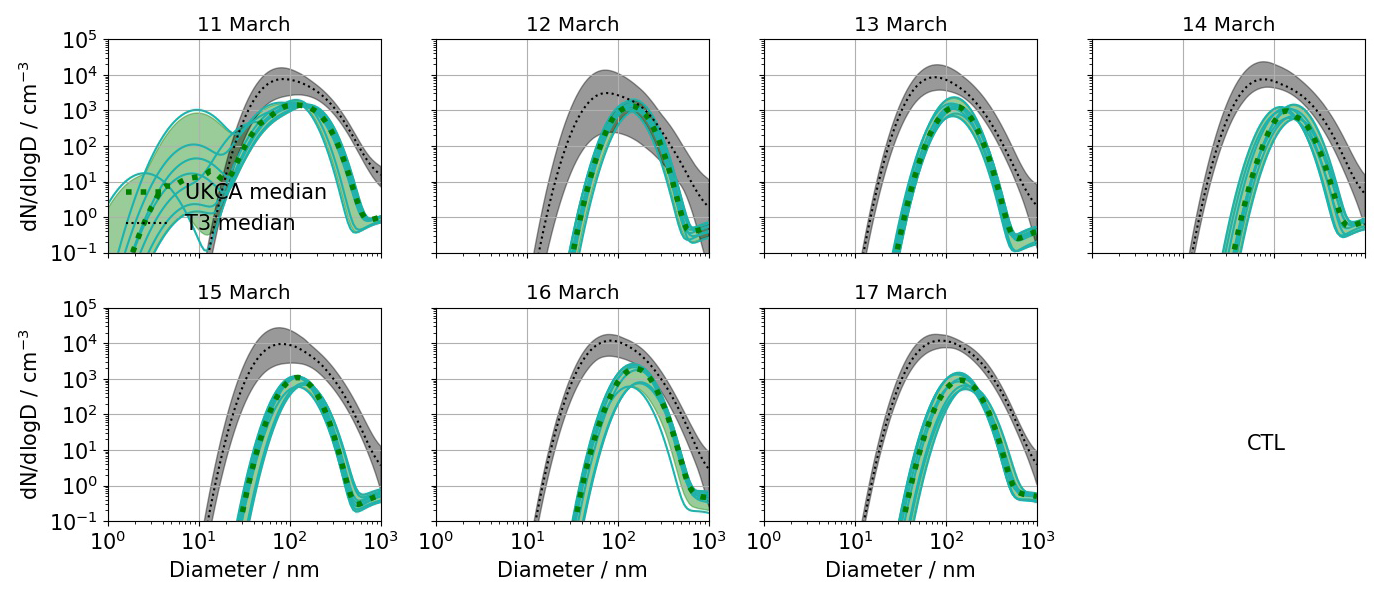
Figure A4Aerosol size distributions from 11 to 17 March in the CTL simulation (light-green lines and green dotted lines) and measured at the T3 research tower (black dotted lines; 3.2° S, 60.6° W) for the aerosols with diameters between 55 and 1000 nm. The light-green lines indicate individual 3-hourly instantaneous model output for each day, and the green dotted lines are the medians of the instantaneous result for each size bin. The observations have a time resolution of 10 s, and the black dotted lines are the medians of the observations for each size bin. The shaded grey and green regions are the 97.5th and 2.5th percentiles for the observations and the CTL simulation.
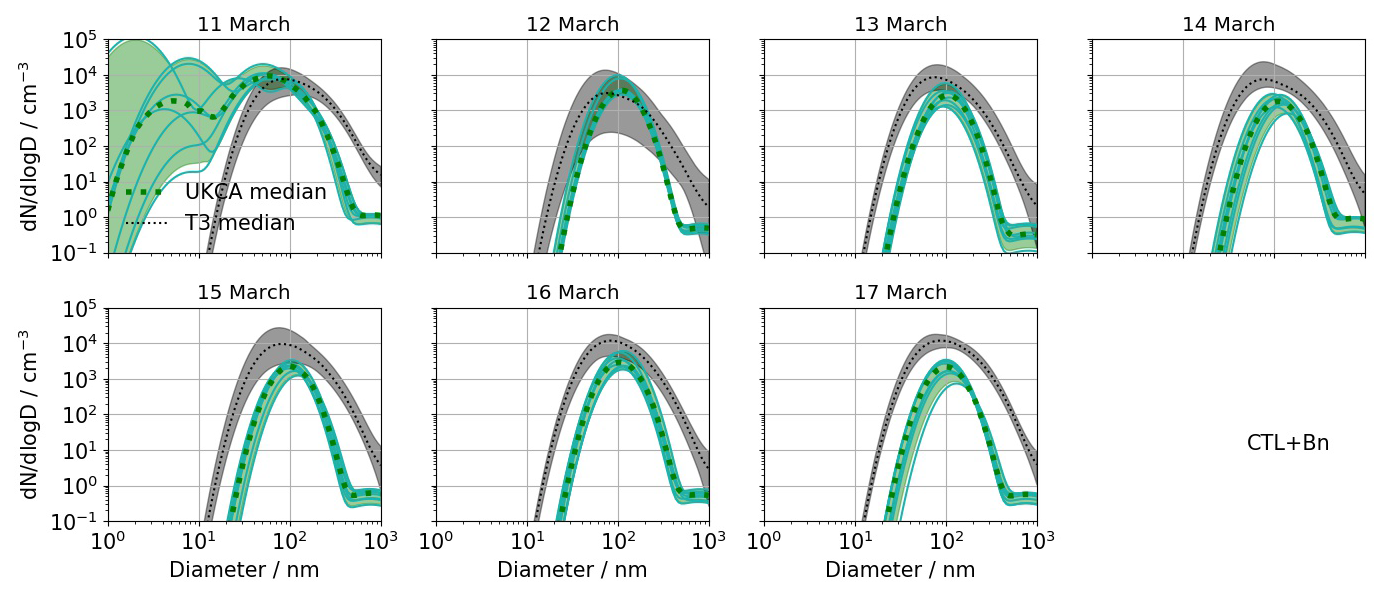
Figure A5Aerosol size distributions from 11 to 17 March in the CTL + Bn simulation (light-green lines and green dotted lines) and measured at the T3 research tower (black dotted lines; 3.2° S, 60.6° W) for the aerosols with diameters between 55 and 1000 nm. The light-green lines indicate individual 3-hourly instantaneous model output for each day, and the green dotted lines are the medians of the instantaneous result for each size bin. The observations have a time resolution of 10 seconds, and the black dotted lines are the medians of the observations for each size bin. The shaded grey and green regions are the 97.5th and 2.5th percentiles for the observations and the CTL + Bn simulation.
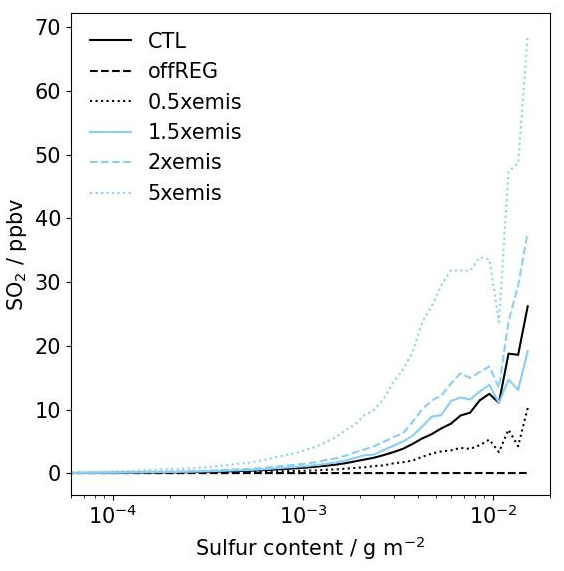
Figure A6Correlations of the SO2 concentration in the lowest 2 km in altitude with column-integrated gas-phase sulfur content. The mean rates and concentrations are presented for 100 gas-phase sulfur content bins. Results are shown for the CTL (black solid), offREG (black dashed), 0.5 × emis (black dotted), 1.5 × emis (light-blue solid), 2 × emis (light-blue dashed), and 5 × emis (light-blue dotted) simulations. The results are from the 3-hourly instantaneous model output.
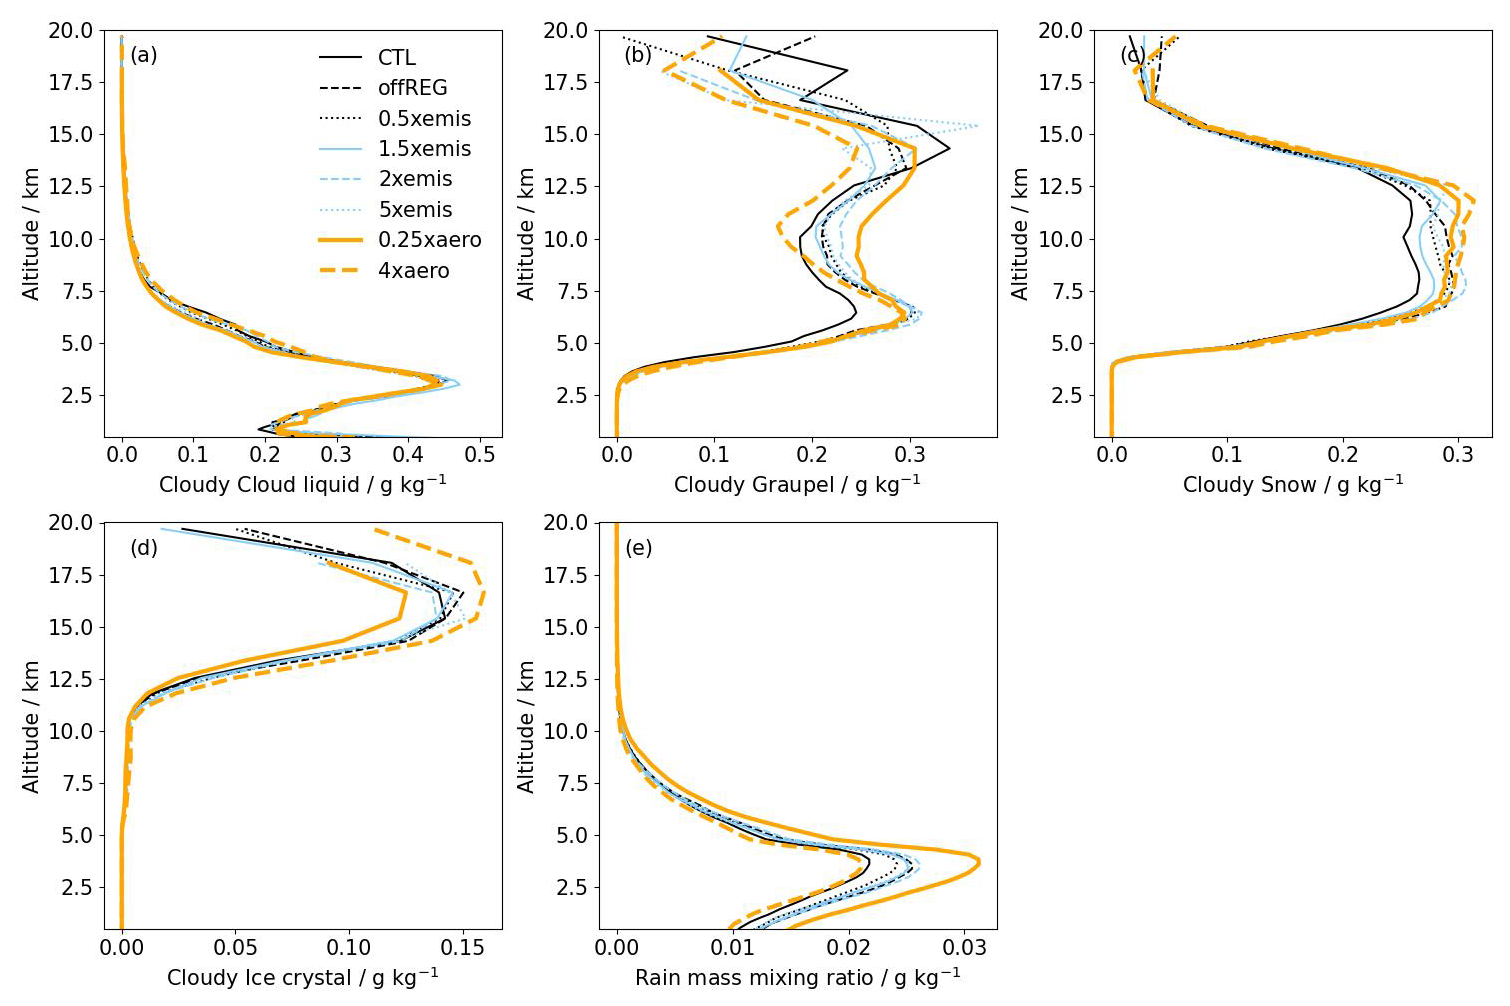
Figure A7Profiles of the (a) cloud liquid, (b) graupel, (c) snow, and (d) ice crystal mass mixing ratio, averaged over time and over the cloudy area of the high-sulfur region in the CTL (black solid), offREG (black dashed), 0.5 × emis (black dotted), 1.5 × emis (light-blue solid), 2 × emis (light-blue dashed), 5 × emis (light-blue dotted), 0.25 × aero (thick orange solid), and 4 × aero (thick orange dashed) simulations. Profiles of the (e) rain mass mixing ratio are averaged over time and the area of the high-sulfur region for the eight simulations.
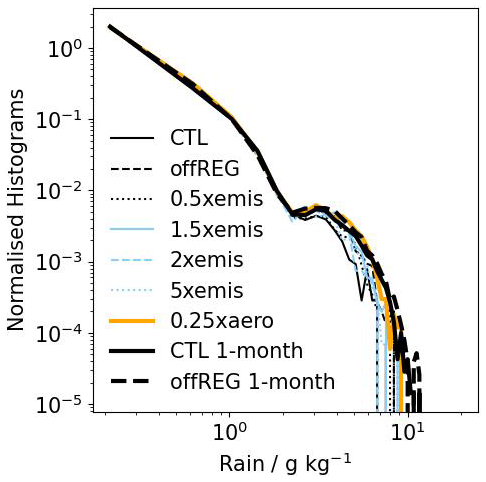
Figure A8Histograms of the surface rain mass mixing ratios in high-sulfur regions in the CTL (black solid), offREG (black dashed), 0.5 × emis (black dotted), 1.5 × emis (light-blue solid), 2 × emis (light-blue dashed), 5 × emis (light-blue dotted), 0.25 × aero (thick orange solid), and 4 × aero (thick orange dashed) simulations. The figure also includes the CTL (thick black solid) and offREG (thick black dashed) simulations that have been run for 1 month. The area under each line equals to 1.
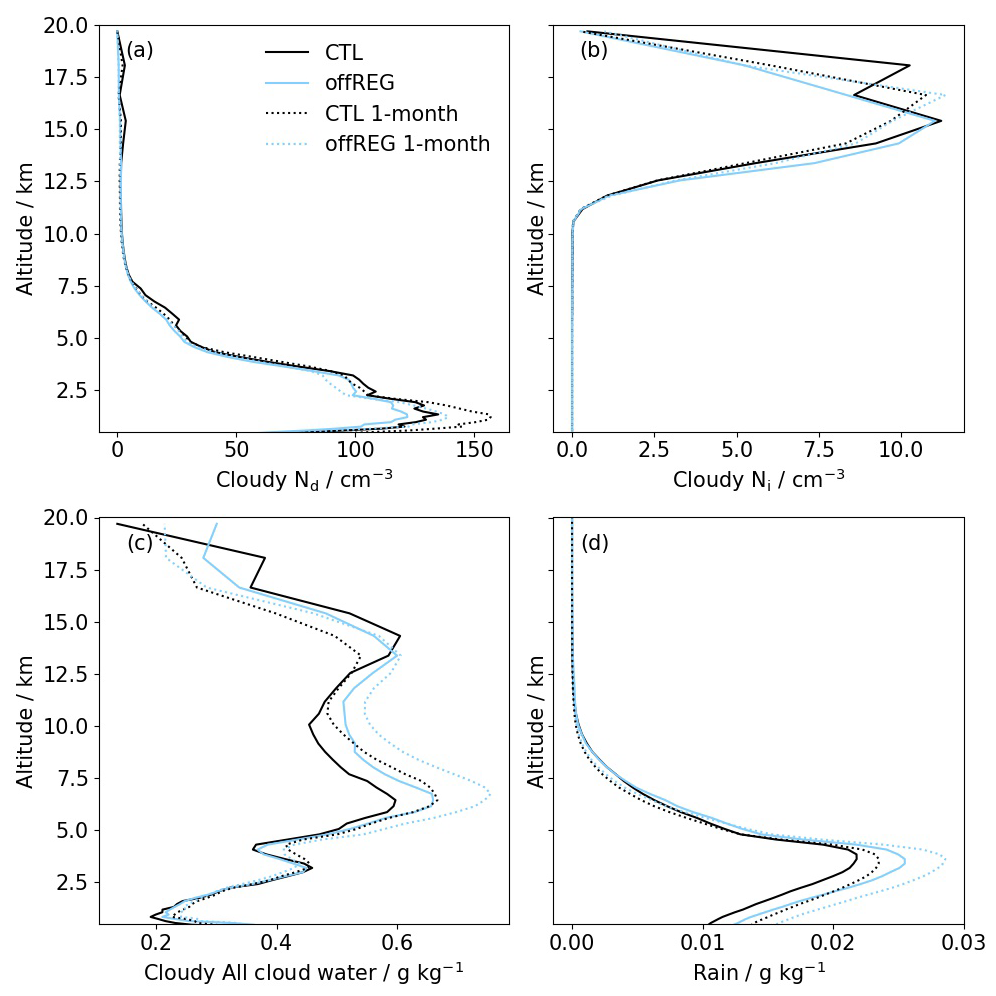
Figure A9Profiles of the (a) Nd, (b) Ni, and (c) total cloud water mass mixing ratio, averaged over time and over the cloudy area of the high-sulfur region in the CTL (solid black) and offREG (solid light blue) simulations that are run for 7 d (solid), and two additional simulations that are run for 1 month: CTL 1-month (dotted black) and offREG 1-month (dotted light blue). Profiles of the rain mass mixing ratio (d) are averaged over time and the area of the high-sulfur region for the four simulations.
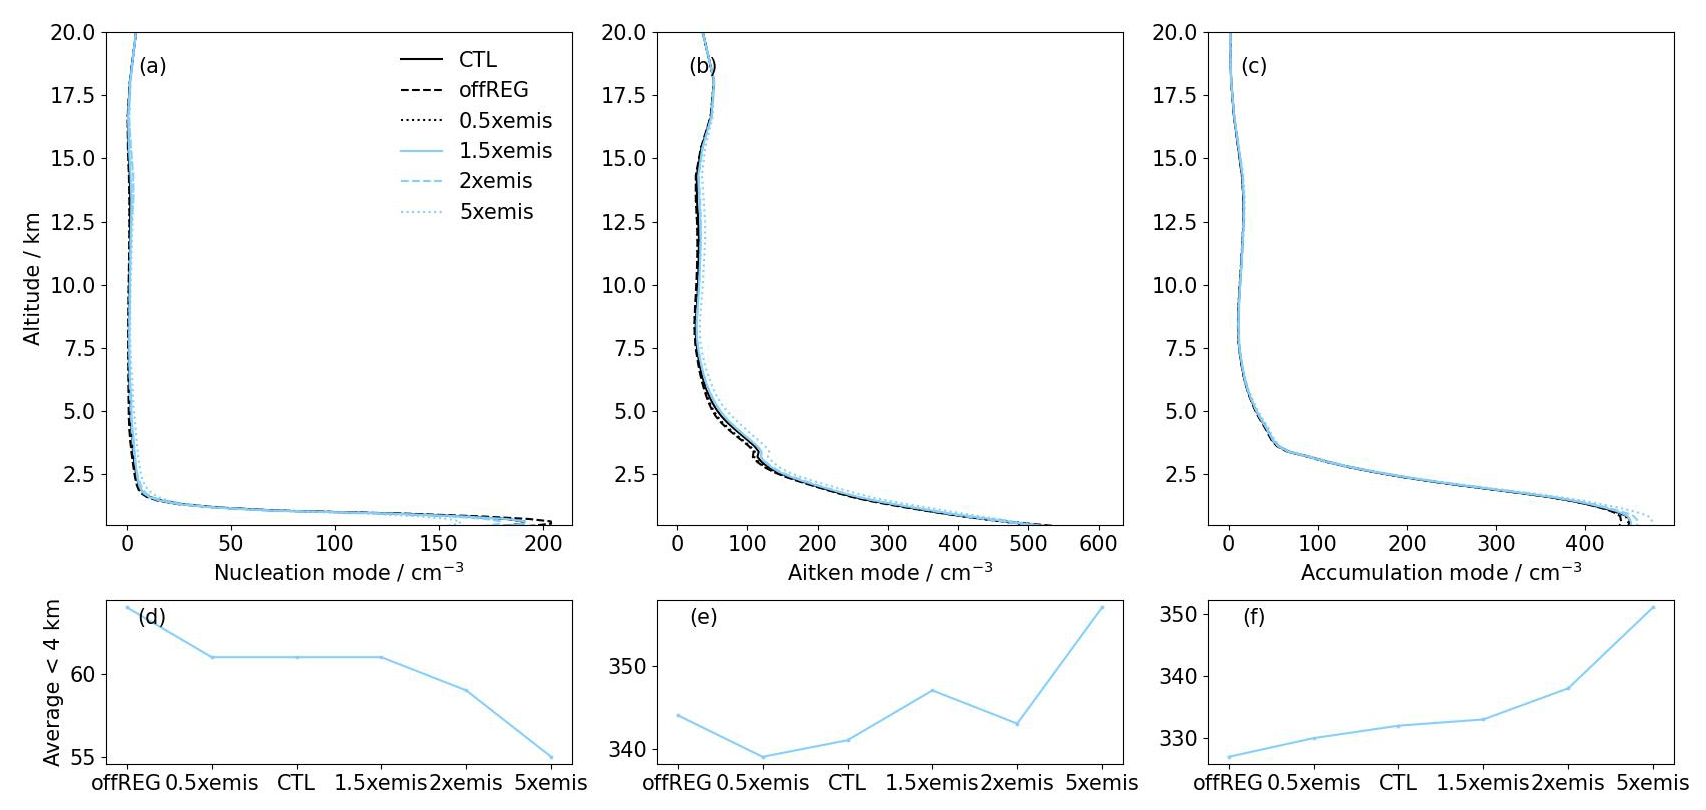
Figure A10Profiles of the (a) nucleation, (b) Aitken, and (c) accumulation mode aerosol number concentrations, averaged over time and the area where the gas-phase sulfur content is smaller than 6 × 10⁻⁵ g m−2 (a, b, c). Results are shown for the CTL (black solid), offREG (black dashed), 0.5 × emis (black dotted), 1.5 × emis (light-blue solid), 2 × emis (light-blue dashed), and 5 × emis (light-blue dotted) simulations. The results are from the 3-hourly instantaneous model output. The lower panel is the nucleation mode (d), Aitken mode (e), and (f) accumulation mode aerosol concentration averaged over the lowest 4 km in altitude of the profiles in the upper panel for the six simulations.
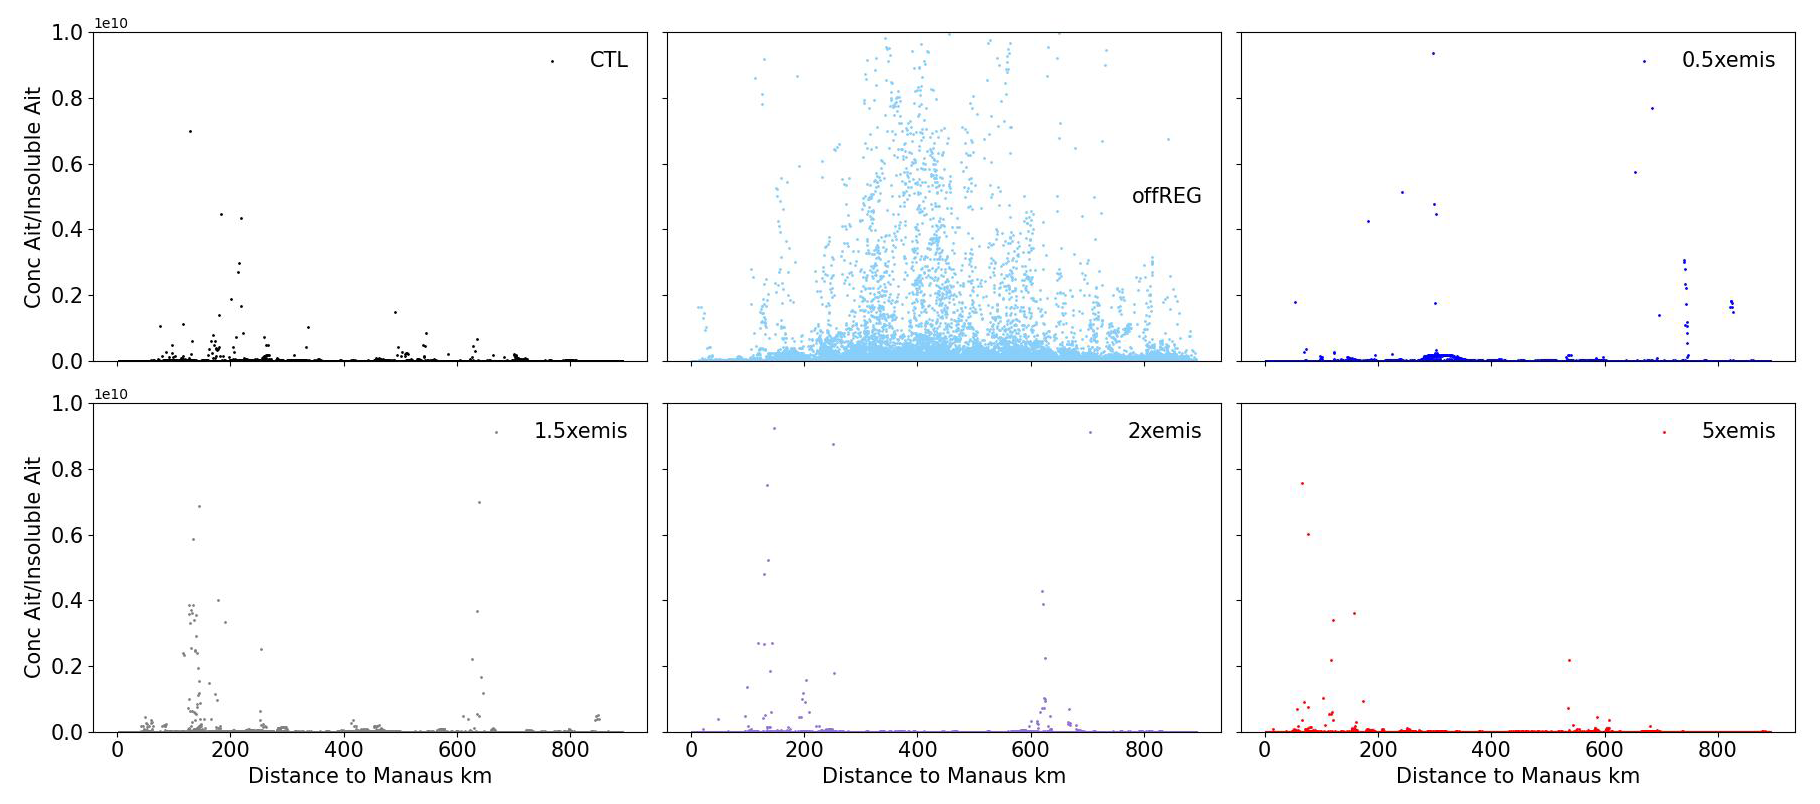
Figure A11The ratios of the soluble Aitken mode to insoluble Aitken mode aerosol number concentrations against distance from Manaus at 555 m in altitude in the CTL, offREG, 0.5 × emis, 1.5 × emis, 2 × emis, and 5 × emis simulations.
The observations have been obtained from the GoAmazon2014/5 campaign and can be accessed through this URL: https://www.arm.gov/research/campaigns/amf2014goamazon (GoAmazon2014/5, 2025). Model codes are available from the Met Office Science Repository Service (https://code.metoffice.gov.uk/trac/home, MOSRS, 2025) A MOSRS account is needed to access the code. Raw model data are available through the JASMIN service (https://help.jasmin.ac.uk/docs/mass/how-to-apply-for-mass-access/, Wang et al., 2025b). We have uploaded a subset of the simulation data that were used to produce the figures to Zenodo (https://doi.org/10.5281/zenodo.7213370, Wang et al., 2025a).
XW, KSC, DPG, and HG designed and led this research. The regional configuration of UM-UKCA was provided by HG and DPG. HG provided the codes for the inorganic-organic nucleation mechanism and helped produce the model–observation comparison (Fig. 2). XW ran the model simulations, analysed the model results, and wrote the paper with insights, comments, and edits from KSC, HG, and DPG.
At least one of the (co-)authors is a member of the editorial board of Atmospheric Chemistry and Physics. The peer-review process was guided by an independent editor, and the authors also have no other competing interests to declare.
Publisher's note: Copernicus Publications remains neutral with regard to jurisdictional claims made in the text, published maps, institutional affiliations, or any other geographical representation in this paper. While Copernicus Publications makes every effort to include appropriate place names, the final responsibility lies with the authors.
We acknowledge the UK Met Office for providing the support for UM-UKCA-CASIM and the Monsoon Superco(o)mputing Node to run the simulations, and we thank the JASMIN team, with whose platform we processed our modelled data. We also acknowledge the Atmospheric Radiation Measurement (ARM) database for providing the observations under the GoAmazon2014/5 campaign and thank Jennifer Comstock for advising on the observational data. We thank Ananth Ranjithkumar for helping identify the oxidant fields for the nucleation mechanism of the coupled chemistry.
The research was funded by Marie Skłodowska-Curie Actions and related to the CLOUD-MOTION project (grant no. 764991). Kenneth S. Carslaw acknowledges support from the Natural Environment Research Council (NERC) via the Aerosol-Cloud Uncertainty REduction project (A-CURE) under grant no. NE/P013406/1. Hamish Gordon acknowledges support from the U.S. Department of Energy's Atmospheric System Research Program under grant no. DE-SC0022227. This project has received funding from the Horizon Europe programme under grant no. 101137680 via project CERTAINTY (Cloud-aERosol inTeractions & their impActs IN The earth sYstem).
This paper was edited by Imre Salma and reviewed by two anonymous referees.
Abdul-Razzak, H. and Ghan, S. J.: A parameterization of aerosol activation: 2. Multiple aerosol types, J. Geophys. Res.-Atmos., 105, 6837–6844, https://doi.org/10.1029/1999JD901161, 2000. a, b, c
Albrecht, B. A.: Aerosols, cloud microphysics, and fractional cloudiness, Science, 245, 1227–1230, https://doi.org/10.1126/science.245.4923.1227, 1989. a
Alizadeh-Choobari, O.: Impact of aerosol number concentration on precipitation under different precipitation rates, Meteorol. Appl., 25, 596–605, https://doi.org/10.1002/met.1724, 2018. a, b
Andreae, M. O. and Andreae, T. W.: The cycle of biogenic sulfur compounds over the Amazon Basin: 1. Dry season, J. Geophys. Res.-Atmos., 93, 1487–1497, https://doi.org/10.1029/JD093iD02p01487, 1988. a
Andreae, M. O., Berresheim, H., Bingemer, H., Jacob, D. J., Lewis, B. L., Li, S.-M., and Talbot, R. W.: The atmospheric sulfur cycle over the Amazon Basin: 2. Wet season, J. Geophys. Res.-Atmos., 95, 16813–16824, https://doi.org/10.1029/JD095iD10p16813, 1990. a
Andreae, M. O., Rosenfeld, D., Artaxo, P., Costa, A. A., Frank, G. P., Longo, K. M., and Silva-Dias, M. A. F.: Smoking Rain Clouds over the Amazon, Science, 303, 1337–1342, https://doi.org/10.1126/science.1092779, 2004. a
Andreae, M. O., Afchine, A., Albrecht, R., Holanda, B. A., Artaxo, P., Barbosa, H. M. J., Borrmann, S., Cecchini, M. A., Costa, A., Dollner, M., Fütterer, D., Järvinen, E., Jurkat, T., Klimach, T., Konemann, T., Knote, C., Krämer, M., Krisna, T., Machado, L. A. T., Mertes, S., Minikin, A., Pöhlker, C., Pöhlker, M. L., Pöschl, U., Rosenfeld, D., Sauer, D., Schlager, H., Schnaiter, M., Schneider, J., Schulz, C., Spanu, A., Sperling, V. B., Voigt, C., Walser, A., Wang, J., Weinzierl, B., Wendisch, M., and Ziereis, H.: Aerosol characteristics and particle production in the upper troposphere over the Amazon Basin, Atmos. Chem. Phys., 18, 921–961, https://doi.org/10.5194/acp-18-921-2018, 2018. a, b, c
Archibald, A. T., O'Connor, F. M., Abraham, N. L., Archer-Nicholls, S., Chipperfield, M. P., Dalvi, M., Folberth, G. A., Dennison, F., Dhomse, S. S., Griffiths, P. T., Hardacre, C., Hewitt, A. J., Hill, R. S., Johnson, C. E., Keeble, J., Köhler, M. O., Morgenstern, O., Mulcahy, J. P., Ordóñez, C., Pope, R. J., Rumbold, S. T., Russo, M. R., Savage, N. H., Sellar, A., Stringer, M., Turnock, S. T., Wild, O., and Zeng, G.: Description and evaluation of the UKCA stratosphere–troposphere chemistry scheme (StratTrop vn 1.0) implemented in UKESM1, Geosci. Model Dev., 13, 1223–1266, https://doi.org/10.5194/gmd-13-1223-2020, 2020. a
Bardakov, R., Thornton, J. A., Ekman, A. M. L., Krejci, R., Pöhlker, M. L., Curtius, J., Williams, J., Lelieveld, J., and Riipinen, I.: High Concentrations of Nanoparticles From Isoprene Nitrates Predicted in Convective Outflow Over the Amazon, Geophys. Res. Lett., 51, e2024GL109919, https://doi.org/10.1029/2024GL109919, 2024. a, b
Barthlott, C., Zarboo, A., Matsunobu, T., and Keil, C.: Importance of aerosols and shape of the cloud droplet size distribution for convective clouds and precipitation, Atmos. Chem. Phys., 22, 2153–2172, https://doi.org/10.5194/acp-22-2153-2022, 2022. a, b
Beheng, K.: A parameterization of warm cloud microphysical conversion processes, Atmos. Res., 33, 193–206, https://doi.org/10.1016/0169-8095(94)90020-5, 1994. a
Bianchi, F., Kurtén, T., Riva, M., Mohr, C., Rissanen, M. P., Roldin, P., Berndt, T., Crounse, J. D., Wennberg, P. O., Mentel, T. F., Wildt, J., Junninen, H., Jokinen, T., Kulmala, M., Worsnop, D. R., Thornton, J. A., Donahue, N., Kjaergaard, H. G., and Ehn, M.: Highly Oxygenated Organic Molecules (HOM) from Gas-Phase Autoxidation Involving Peroxy Radicals: A Key Contributor to Atmospheric Aerosol, Chem. Rev., 119, 3472–3509, https://doi.org/10.1021/acs.chemrev.8b00395, 2019. a, b
Brinkmann, W. L. F. and Santos, U. D. M.: The emission of biogenic hydrogen sulfide from Amazonian floodplain lakes, Tellus, 26, 261–267, https://doi.org/10.1111/j.2153-3490.1974.tb01975.x, 1974. a
Cao, Y., Zhu, Y., Wang, M., Rosenfeld, D., Liang, Y., Liu, J., Liu, Z., and Bai, H.: Emission Reductions Significantly Reduce the Hemispheric Contrast in Cloud Droplet Number Concentration in Recent Two Decades, J. Geophys. Res.-Atmos., 128, e2022JD037417, https://doi.org/10.1029/2022JD037417, 2023. a
Cecchini, M. A., Machado, L. A. T., Comstock, J. M., Mei, F., Wang, J., Fan, J., Tomlinson, J. M., Schmid, B., Albrecht, R., Martin, S. T., and Artaxo, P.: Impacts of the Manaus pollution plume on the microphysical properties of Amazonian warm-phase clouds in the wet season, Atmos. Chem. Phys., 16, 7029–7041, https://doi.org/10.5194/acp-16-7029-2016, 2016. a, b
Cirino, G., Brito, J., Barbosa, H. M., Rizzo, L. V., Tunved, P., de Sá, S. S., Jimenez, J. L., Palm, B. B., Carbone, S., Lavric, J. V., Souza, R. A., Wolff, S., Walter, D., Tota, J., Oliveira, M. B., Martin, S. T., and Artaxo, P.: Observations of Manaus urban plume evolution and interaction with biogenic emissions in GoAmazon 2014/5, Atmos. Environ., 191, 513–524, https://doi.org/10.1016/j.atmosenv.2018.08.031, 2018. a
Clarke, A., Varner, J., Eisele, F., Mauldin, R., Tanner, D., and Litchy, M.: Particle production in the remote marine atmosphere: Cloud outflow and subsidence during ACE 1, J. Geophys. Res.-Atmos., 103, 16397–16409, https://doi.org/10.1029/97JD02987, 1998. a
Clarke, A., Eisele, F., Kapustin, V., Moore, K., Tanner, D., Mauldin, L., Litchy, M., Lienert, B., Carroll, M., and Albercook, G.: Nucleation in the equatorial free troposphere: Favorable environments during PEM-Tropics, J. Geophys. Res.-Atmos., 104, 5735–5744, https://doi.org/10.1029/98JD02303, 1999. a
Clarke, A. D. and Kapustin, V. N.: A Pacific aerosol survey. Part I: A decade of data on particle production, transport, evolution, and mixing in the troposphere, J. Atmos. Sci., 59, 363–382, https://doi.org/10.1175/1520-0469(2002)059<0363:APASPI>2.0.CO;2, 2002. a
Connolly, P., Vaughan, G., May, P., Chemel, C., Allen, G., Choularton, T., Gallagher, M., Bower, K., Crosier, J., and Dearden, C.: Can aerosols influence deep tropical convection? Aerosol indirect effects in the Hector island thunderstorm, Q. J. Roy. Meteor. Soc., 139, 2190–2208, https://doi.org/10.1002/qj.2083, 2013. a, b
Cooper, W. A.: Ice Initiation in Natural Clouds, American Meteorological Society, Boston, MA, 29–32, ISBN 978-1-935704-17-1, https://doi.org/10.1007/978-1-935704-17-1_4, 1986. a
Curtius, J., Heinritzi, M., Beck, L. J., Pöhlker, M. L., Tripathi, N., Krumm, B. E., Holzbeck, P., Nussbaumer, C. M., Hernández Pardo, L., Klimach, T., Barmpounis, K., Andersen, S. T., Bardakov, R., Bohn, B., Cecchini, M. A., Chaboureau, J.-P., Dauhut, T., Dienhart, D., Dörich, R., Edtbauer, A., Giez, A., Hartmann, A., Holanda, B. A., Joppe, P., Kaiser, K., Keber, T., Klebach, H., Krüger, O. O., Kürten, A., Mallaun, C., Marno, D., Martinez, M., Monteiro, C., Nelson, C., Ort, L., Raj, S. S., Richter, S., Ringsdorf, A., Rocha, F., Simon, M., Sreekumar, S., Tsokankunku, A., Unfer, G. R., Valenti, I. D., Wang, N., Zahn, A., Zauner-Wieczorek, M., Albrecht, R. I., Andreae, M. O., Artaxo, P., Crowley, J. N., Fischer, H., Harder, H., Herdies, D. L., Machado, L. A. T., Pöhlker, C., Pöschl, U., Possner, A., Pozzer, A., Schneider, J., Williams, J., and Lelieveld, J.: Isoprene nitrates drive new particle formation in Amazon's upper troposphere, Nature, 636, 124–130, https://doi.org/10.1038/s41586-024-08192-4, 2024. a, b, c
Dagan, G., Stier, P., Spill, G., Herbert, R., Heikenfeld, M., van den Heever, S. C., and Marinescu, P. J.: Boundary conditions representation can determine simulated aerosol effects on convective cloud fields, Communications Earth & Environment, 3, 71, https://doi.org/10.1038/s43247-022-00399-5, 2022. a
de Sá, S. S., Palm, B. B., Campuzano-Jost, P., Day, D. A., Hu, W., Isaacman-VanWertz, G., Yee, L. D., Brito, J., Carbone, S., Ribeiro, I. O., Cirino, G. G., Liu, Y., Thalman, R., Sedlacek, A., Funk, A., Schumacher, C., Shilling, J. E., Schneider, J., Artaxo, P., Goldstein, A. H., Souza, R. A. F., Wang, J., McKinney, K. A., Barbosa, H., Alexander, M. L., Jimenez, J. L., and Martin, S. T.: Urban influence on the concentration and composition of submicron particulate matter in central Amazonia, Atmos. Chem. Phys., 18, 12185–12206, https://doi.org/10.5194/acp-18-12185-2018, 2018. a
Derbyshire, S. H., Maidens, A. V., Milton, S. F., Stratton, R. A., and Willett, M. R.: Adaptive detrainment in a convective parametrization, Q. J. Roy. Meteor. Soc., 137, 1856–1871, https://doi.org/10.1002/qj.875, 2011. a
Diehl, T., Heil, A., Chin, M., Pan, X., Streets, D., Schultz, M., and Kinne, S.: Anthropogenic, biomass burning, and volcanic emissions of black carbon, organic carbon, and SO2 from 1980 to 2010 for hindcast model experiments, Atmos. Chem. Phys. Discuss., 12, 24895–24954, https://doi.org/10.5194/acpd-12-24895-2012, 2012. a
Douglas, A. and L'Ecuyer, T.: Global evidence of aerosol-induced invigoration in marine cumulus clouds, Atmos. Chem. Phys., 21, 15103–15114, https://doi.org/10.5194/acp-21-15103-2021, 2021. a
Ehn, M., Thornton, J. A., Kleist, E., Sipilä, M., Junninen, H., Pullinen, I., Springer, M., Rubach, F., Tillmann, R., Lee, B., Lopez-Hilfiker, F., Andres, S., Acir, I.-H., Rissanen, M., Jokinen, T., Schobesberger, S., Kangasluoma, J., Kontkanen, J., Nieminen, T., Kurtén, T., Nielsen, L. B., Jørgensen, S., Kjaergaard, H. G., Canagaratna, M., Maso, M. D., Berndt, T., Petäjä, T., Wahner, A., Kerminen, V.-M., Kulmala, M., Worsnop, D. R., Wildt, J., and Mentel, T. F.: A large source of low-volatility secondary organic aerosol, Nature, 506, 476–479, https://doi.org/10.1038/nature13032, 2014. a, b
Ekman, A. M. L., Wang, C., Wilson, J., and Ström, J.: Explicit simulations of aerosol physics in a cloud-resolving model: a sensitivity study based on an observed convective cloud, Atmos. Chem. Phys., 4, 773–791, https://doi.org/10.5194/acp-4-773-2004, 2004. a, b
Ekman, A. M. L., Engström, A., and Wang, C.: The effect of aerosol composition and concentration on the development and anvil properties of a continental deep convective cloud, Q. J. Roy. Meteor. Soc., 133, 1439–1452, https://doi.org/10.1002/qj.108, 2007. a
Fan, J. and Khain, A.: Comments on “Do Ultrafine Cloud Condensation Nuclei Invigorate Deep Convection?”, J. Atmos. Sci., 78, 329–339, https://doi.org/10.1175/JAS-D-20-0218.1, 2021. a
Fan, J., Zhang, R., Li, G., and Tao, W.-K.: Effects of aerosols and relative humidity on cumulus clouds, J. Geophys. Res.-Atmos., 112, D14204, https://doi.org/10.1029/2006JD008136, 2007. a
Fan, J., Yuan, T., Comstock, J. M., Ghan, S., Khain, A., Leung, L. R., Li, Z., Martins, V. J., and Ovchinnikov, M.: Dominant role by vertical wind shear in regulating aerosol effects on deep convective clouds, J. Geophys. Res.-Atmos., 114, D22206, https://doi.org/10.1029/2009JD012352, 2009. a
Fan, J., Comstock, J. M., and Ovchinnikov, M.: The cloud condensation nuclei and ice nuclei effects on tropical anvil characteristics and water vapor of the tropical tropopause layer, Environ. Res. Lett., 5, 044005, https://doi.org/10.1088/1748-9326/5/4/044005, 2010. a
Fan, J., Leung, L. R., Li, Z., Morrison, H., Chen, H., Zhou, Y., Qian, Y., and Wang, Y.: Aerosol impacts on clouds and precipitation in eastern China: Results from bin and bulk microphysics, J. Geophys. Res.-Atmos., 117, D00K36, https://doi.org/10.1029/2011JD016537, 2012. a
Fan, J., Leung, L. R., Rosenfeld, D., Chen, Q., Li, Z., Zhang, J., and Yan, H.: Microphysical effects determine macrophysical response for aerosol impacts on deep convective clouds, P. Natl. Acad. Sci. USA, 110, E4581–E4590, https://doi.org/10.1073/pnas.1316830110, 2013. a, b
Fan, J., Wang, Y., Rosenfeld, D., and Liu, X.: Review of aerosol–cloud interactions: mechanisms, significance, and challenges, J. Atmos. Sci., 73, 4221–4252, https://doi.org/10.1175/JAS-D-16-0037.1, 2016. a, b
Fan, J., Rosenfeld, D., Zhang, Y., Giangrande, S. E., Li, Z., Machado, L. A., Martin, S. T., Yang, Y., Wang, J., Artaxo, P., Barbosa, H. M. J., Braga, R. C., Comstock, J. M., Feng, Z., Gao, W., Gomes, H. B., Mei, F., Pöhlker, C., Pöhlker, M. L., Pöschl, U., and de Souza, R. A. F.: Substantial convection and precipitation enhancements by ultrafine aerosol particles, Science, 359, 411–418, https://doi.org/10.1126/science.aan8461, 2018. a, b, c, d
Feingold, G., Cotton, W. R., Kreidenweis, S. M., and Davis, J. T.: The Impact of Giant Cloud Condensation Nuclei on Drizzle Formation in Stratocumulus: Implications for Cloud Radiative Properties, J. Atmos. Sci., 56, 4100–4117, https://doi.org/10.1175/1520-0469(1999)056<4100:TIOGCC>2.0.CO;2, 1999. a
Field, P. R., Hill, A., Shipway, B., Furtado, K., Wilkinson, J., Miltenberger, A., Gordon, H., Grosvenor, D. P., Stevens, R., and Van Weverberg, K.: Implementation of a Double Moment Cloud Microphysics Scheme in the UK Met Office Regional Numerical Weather Prediction Model, Q. J. Roy. Meteor. Soc., 149, 703–739, https://doi.org/10.1002/qj.4414, 2023. a
Franchin, A., Downard, A., Kangasluoma, J., Nieminen, T., Lehtipalo, K., Steiner, G., Manninen, H. E., Petäjä, T., Flagan, R. C., and Kulmala, M.: A new high-transmission inlet for the Caltech nano-RDMA for size distribution measurements of sub-3 nm ions at ambient concentrations, Atmos. Meas. Tech., 9, 2709–2720, https://doi.org/10.5194/amt-9-2709-2016, 2016. a, b
Fritsch, J. M. and Chappell, C. F.: Numerical Prediction of Convectively Driven Mesoscale Pressure Systems. Part I: Convective Parameterization, J. Atmos. Sci., 37, 1722–1733, https://doi.org/10.1175/1520-0469(1980)037<1722:NPOCDM>2.0.CO;2, 1980. a
Fuchs, N. and Sutugin, A.: High-dispersed aerosols, in: Topics in Current Aerosol Research, edited by: Hidy, G. and Brock, J., International Reviews in Aerosol Physics and Chemistry, p. 1, Pergamon, https://doi.org/10.1016/B978-0-08-016674-2.50006-6, 1971. a
Furtado, K. and Field, P.: A strong statistical link between aerosol indirect effects and the self-similarity of rainfall distributions, Atmos. Chem. Phys., 22, 3391–3407, https://doi.org/10.5194/acp-22-3391-2022, 2022. a, b
Gantt, B., Johnson, M. S., Meskhidze, N., Sciare, J., Ovadnevaite, J., Ceburnis, D., and O'Dowd, C. D.: Model evaluation of marine primary organic aerosol emission schemes, Atmos. Chem. Phys., 12, 8553–8566, https://doi.org/10.5194/acp-12-8553-2012, 2012. a
Glicker, H. S., Lawler, M. J., Ortega, J., de Sá, S. S., Martin, S. T., Artaxo, P., Vega Bustillos, O., de Souza, R., Tota, J., Carlton, A., and Smith, J. N.: Chemical composition of ultrafine aerosol particles in central Amazonia during the wet season, Atmos. Chem. Phys., 19, 13053–13066, https://doi.org/10.5194/acp-19-13053-2019, 2019. a
GoAmazon2014/5: Green Ocean Amazon (GoAmazon2014/5), ARM [data set], https://www.arm.gov/research/campaigns/amf2014goamazon (last access: 21 August 2025), 2025. a
Gonçalves, W. A., Machado, L. A. T., and Kirstetter, P.-E.: Influence of biomass aerosol on precipitation over the Central Amazon: an observational study, Atmos. Chem. Phys., 15, 6789–6800, https://doi.org/10.5194/acp-15-6789-2015, 2015. a
Gong, S. L.: A parameterization of sea-salt aerosol source function for sub- and super-micron particles, Global Biogeochem. Cy., 17, 1097, https://doi.org/10.1029/2003GB002079, 2003. a
Gordon, H., Sengupta, K., Rap, A., Duplissy, J., Frege, C., Williamson, C., Heinritzi, M., Simon, M., Yan, C., Almeida, J., Tröstl, J., Nieminen, T., Ortega, I. K., Wagner, R., Dunne, E. M., Adamov, A., Amorim, A., Bernhammer, A.-K., Bianchi, F., Breitenlechner, M., Brilke, S., Chen, X., Craven, J. S., Dias, A., Ehrhart, S., Fischer, L., Flagan, R. C., Franchin, A., Fuchs, C., Guida, R., Hakala, J., Hoyle, C. R., Jokinen, T., Junninen, H., Kangasluoma, J., Kim, J., Kirkby, J., Krapf, M., Kürten, A., Laaksonen, A., Lehtipalo, K., Makhmutov, V., Mathot, S., Molteni, U., Monks, S. A., Onnela, A., Peräkylä, O., Piel, F., Petäjä, T., Praplan, A. P., Pringle, K. J., Richards, N. A. D., Rissanen, M. P., Rondo, L., Sarnela, N., Schobesberger, S., Scott, C. E., Seinfeld, J. H., Sharma, S., Sipilä, M., Steiner, G., Stozhkov, Y., Stratmann, F., Tomé, A., Virtanen, A., Vogel, A. L., Wagner, A. C., Wagner, P. E., Weingartner, E., Wimmer, D., Winkler, P. M., Ye, P., Zhang, X., Hansel, A., Dommen, J., Donahue, N. M., Worsnop, D. R., Baltensperger, U., Kulmala, M., Curtius, J., and Carslaw, K. S.: Reduced anthropogenic aerosol radiative forcing caused by biogenic new particle formation, P. Natl. Acad. Sci. USA, 113, 12053–12058, https://doi.org/10.1073/pnas.1602360113, 2016. a, b, c, d, e, f
Gordon, H., Field, P. R., Abel, S. J., Dalvi, M., Grosvenor, D. P., Hill, A. A., Johnson, B. T., Miltenberger, A. K., Yoshioka, M., and Carslaw, K. S.: Large simulated radiative effects of smoke in the south-east Atlantic, Atmos. Chem. Phys., 18, 15261–15289, https://doi.org/10.5194/acp-18-15261-2018, 2018. a
Gordon, H., Field, P. R., Abel, S. J., Barrett, P., Bower, K., Crawford, I., Cui, Z., Grosvenor, D. P., Hill, A. A., Taylor, J., Wilkinson, J., Wu, H., and Carslaw, K. S.: Development of aerosol activation in the double-moment Unified Model and evaluation with CLARIFY measurements, Atmos. Chem. Phys., 20, 10997–11024, https://doi.org/10.5194/acp-20-10997-2020, 2020. a
Gordon, H., Carslaw, K. S., Hill, A. A., Field, P. R., Abraham, N. L., Beyersdorf, A., Corr-Limoges, C., Ghosh, P., Hemmings, J., Jones, A. C., Sanchez, C., Wang, X., and Wilkinson, J.: NUMAC: Description of the Nested Unified Model With Aerosols and Chemistry, and Evaluation With KORUS-AQ Data, J. Adv. Model. Earth Sy., 15, e2022MS003457, https://doi.org/10.1029/2022MS003457, 2023. a, b
Grabowski, W. W.: Can the Impact of Aerosols on Deep Convection be Isolated from Meteorological Effects in Atmospheric Observations?, J. Atmos. Sci., 75, 3347–3363, https://doi.org/10.1175/JAS-D-18-0105.1, 2018. a
Grabowski, W. W. and Morrison, H.: Do Ultrafine Cloud Condensation Nuclei Invigorate Deep Convection?, J. Atmos. Sci., 77, 2567–2583, https://doi.org/10.1175/JAS-D-20-0012.1, 2020. a, b, c
Grabowski, W. W. and Morrison, H.: Reply to “Comments on `Do Ultrafine Cloud Condensation Nuclei Invigorate Deep Convection?”', J. Atmos. Sci., 78, 341–350, https://doi.org/10.1175/JAS-D-20-0315.1, 2021. a
Granier, C., Bessagnet, B., Bond, T., D'Angiola, A., Denier van der Gon, H., Frost, G. J., Heil, A., Kaiser, J. W., Kinne, S., Klimont, Z., Kloster, S., Lamarque, J.-F., Liousse, C., Masui, T., Meleux, F., Mieville, A., Ohara, T., Raut, J.-C., Riahi, K., Schultz, M. G., Smith, S. J., Thompson, A., van Aardenne, J., van der Werf, G. R., and van Vuuren, D. P.: Evolution of anthropogenic and biomass burning emissions of air pollutants at global and regional scales during the 1980–2010 period, Climatic Change, 109, 163, https://doi.org/10.1007/s10584-011-0154-1, 2011. a
Gregory, D. and Rowntree, P. R.: A Mass Flux Convection Scheme with Representation of Cloud Ensemble Characteristics and Stability-Dependent Closure, Mon. Weather Rev., 118, 1483–1506, https://doi.org/10.1175/1520-0493(1990)118<1483:AMFCSW>2.0.CO;2, 1990. a
Grosvenor, D. P., Field, P. R., Hill, A. A., and Shipway, B. J.: The relative importance of macrophysical and cloud albedo changes for aerosol-induced radiative effects in closed-cell stratocumulus: insight from the modelling of a case study, Atmos. Chem. Phys., 17, 5155–5183, https://doi.org/10.5194/acp-17-5155-2017, 2017. a
Heald, C. L. and Spracklen, D. V.: Atmospheric budget of primary biological aerosol particles from fungal spores, Geophys. Res. Lett., 36, L09806, https://doi.org/10.1029/2009GL037493, 2009. a
Herbert, R. J., Murray, B. J., Dobbie, S. J., and Koop, T.: Sensitivity of liquid clouds to homogenous freezing parameterizations, Geophys. Res. Lett., 42, 1599–1605, https://doi.org/10.1002/2014GL062729, 2015. a, b
Igel, A. L. and van den Heever, S. C.: Invigoration or Enervation of Convective Clouds by Aerosols?, Geophys. Res. Lett., 48, e2021GL093804, https://doi.org/10.1029/2021GL093804, 2021. a
Janssens-Maenhout, G., Crippa, M., Guizzardi, D., Dentener, F., Muntean, M., Pouliot, G., Keating, T., Zhang, Q., Kurokawa, J., Wankmüller, R., Denier van der Gon, H., Kuenen, J. J. P., Klimont, Z., Frost, G., Darras, S., Koffi, B., and Li, M.: HTAP_v2.2: a mosaic of regional and global emission grid maps for 2008 and 2010 to study hemispheric transport of air pollution, Atmos. Chem. Phys., 15, 11411–11432, https://doi.org/10.5194/acp-15-11411-2015, 2015. a
Jardine, K., Yañez-Serrano, A. M., Williams, J., Kunert, N., Jardine, A., Taylor, T., Abrell, L., Artaxo, P., Guenther, A., Hewitt, C. N., House, E., Florentino, A. P., Manzi, A., Higuchi, N., Kesselmeier, J., Behrendt, T., Veres, P. R., Derstroff, B., Fuentes, J. D., Martin, S. T., and Andreae, M. O.: Dimethyl sulfide in the Amazon rain forest, Global Biogeochem. Cy., 29, 19–32, https://doi.org/10.1002/2014GB004969, 2015. a
Jones, A., Roberts, D. L., and Slingo, A.: A climate model study of indirect radiative forcing by anthropogenic sulphate aerosols, Nature, 370, 450–453, https://doi.org/10.1038/370450a0, 1994. a
Kamae, Y., Watanabe, M., Ogura, T., Yoshimori, M., and Shiogama, H.: Rapid Adjustments of Cloud and Hydrological Cycle to Increasing CO2: a Review, Current Climate Change Reports, 1, 103–113, https://doi.org/10.1007/s40641-015-0007-5, 2015. a
Kawamoto, K.: Relationships between cloud properties and precipitation amount over the Amazon basin, Atmos. Res., 82, 239–247, https://doi.org/10.1016/j.atmosres.2005.10.007, 2006. a
Kazil, J., Wang, H., Feingold, G., Clarke, A. D., Snider, J. R., and Bandy, A. R.: Modeling chemical and aerosol processes in the transition from closed to open cells during VOCALS-REx, Atmos. Chem. Phys., 11, 7491–7514, https://doi.org/10.5194/acp-11-7491-2011, 2011. a
Kerminen, V.-M. and Kulmala, M.: Analytical formulae connecting the “real” and the “apparent” nucleation rate and the nuclei number concentration for atmospheric nucleation events, J. Aerosol Sci., 33, 609–622, https://doi.org/10.1016/S0021-8502(01)00194-X, 2002. a, b
Khain, A., Rosenfeld, D., Pokrovsky, A., Blahak, U., and Ryzhkov, A.: The role of CCN in precipitation and hail in a mid-latitude storm as seen in simulations using a spectral (bin) microphysics model in a 2D dynamic frame, Atmos. Res., 99, 129–146, https://doi.org/10.1016/j.atmosres.2010.09.015, 2011. a
Khain, A. P.: Notes on state-of-the-art investigations of aerosol effects on precipitation: a critical review, Environ. Res. Lett., 4, 015004, https://doi.org/10.1088/1748-9326/4/1/015004, 2009. a
Khain, A. P., BenMoshe, N., and Pokrovsky, A.: Factors Determining the Impact of Aerosols on Surface Precipitation from Clouds: An Attempt at Classification, J. Atmos. Sci., 65, 1721–1748, https://doi.org/10.1175/2007JAS2515.1, 2008. a
Khain, A. P., Phillips, V., Benmoshe, N., and Pokrovsky, A.: The Role of Small Soluble Aerosols in the Microphysics of Deep Maritime Clouds, J. Atmos. Sci., 69, 2787–2807, https://doi.org/10.1175/2011JAS3649.1, 2012. a
Khairoutdinov, M. and Kogan, Y.: A New Cloud Physics Parameterization in a Large-Eddy Simulation Model of Marine Stratocumulus, Mon. Weather Rev., 128, 229–243, https://doi.org/10.1175/1520-0493(2000)128<0229:ANCPPI>2.0.CO;2, 2000. a
Kipling, Z., Stier, P., Schwarz, J. P., Perring, A. E., Spackman, J. R., Mann, G. W., Johnson, C. E., and Telford, P. J.: Constraints on aerosol processes in climate models from vertically-resolved aircraft observations of black carbon, Atmos. Chem. Phys., 13, 5969–5986, https://doi.org/10.5194/acp-13-5969-2013, 2013. a
Kirkby, J., Duplissy, J., Sengupta, K., Frege, C., Gordon, H., Williamson, C., Heinritzi, M., Simon, M., Yan, C., Almeida, J., Tröstl, J., Nieminen, T., Ortega, I. K., Wagner, R., Adamov, A., Amorim, A., Bernhammer, A.-K., Bianchi, F., Breitenlechner, M., Brilke, S., Chen, X., Craven, J., Dias, A., Ehrhart, S., Flagan, R. C., Franchin, A., Fuchs, C., Guida, R., Hakala, J., Hoyle, C. R., Jokinen, T., Junninen, H., Kangasluoma, J., Kim, J., Krapf, M., Kürten, A., Laaksonen, A., Lehtipalo, K., Makhmutov, V., Mathot, S., Molteni, U., Onnela, A., Peräkylä, O., Piel, F., Petäjä, T., Praplan, A. P., Pringle, K., Rap, A., Richards, N. A. D., Riipinen, I., Rissanen, M. P., Rondo, L., Sarnela, N., Schobesberger, S., Scott, C. E., Seinfeld, J. H., Sipilä, M., Steiner, G., Stozhkov, Y., Stratmann, F., Tomé, A., Virtanen, A., Vogel, A. L., Wagner, A. C., Wagner, P. E., Weingartner, E., Wimmer, D., Winkler, P. M., Ye, P., Zhang, X., Hansel, A., Dommen, J., Donahue, N. M., Worsnop, D. R., Baltensperger, U., Kulmala, M., Carslaw, K. S., and Curtius, J.: Ion-induced nucleation of pure biogenic particles, Nature, 533, 521–526, https://doi.org/10.1038/nature17953, 2016. a, b, c, d, e
Koren, I., Kaufman, Y. J., Rosenfeld, D., Remer, L. A., and Rudich, Y.: Aerosol invigoration and restructuring of Atlantic convective clouds, Geophys. Res. Lett., 32, L14828, https://doi.org/10.1029/2005GL023187, 2005. a
Koren, I., Martins, J. V., Remer, L. A., and Afargan, H.: Smoke Invigoration Versus Inhibition of Clouds over the Amazon, Science, 321, 946–949, https://doi.org/10.1126/science.1159185, 2008. a
Koren, I., Remer, L. A., Altaratz, O., Martins, J. V., and Davidi, A.: Aerosol-induced changes of convective cloud anvils produce strong climate warming, Atmos. Chem. Phys., 10, 5001–5010, https://doi.org/10.5194/acp-10-5001-2010, 2010. a, b
Koren, I., Altaratz, O., Remer, L. A., Feingold, G., Martins, J. V., and Heiblum, R. H.: Aerosol-induced intensification of rain from the tropics to the mid-latitudes, Nat. Geosci., 5, 118–122, https://doi.org/10.1038/ngeo1364, 2012. a
Krejci, R., Ström, J., de Reus, M., Hoor, P., Williams, J., Fischer, H., and Hansson, H.-C.: Evolution of aerosol properties over the rain forest in Surinam, South America, observed from aircraft during the LBA-CLAIRE 98 experiment, J. Geophys. Res.-Atmos., 108, 4561, https://doi.org/10.1029/2001JD001375, 2003. a
Kuhn, U., Ganzeveld, L., Thielmann, A., Dindorf, T., Schebeske, G., Welling, M., Sciare, J., Roberts, G., Meixner, F. X., Kesselmeier, J., Lelieveld, J., Kolle, O., Ciccioli, P., Lloyd, J., Trentmann, J., Artaxo, P., and Andreae, M. O.: Impact of Manaus City on the Amazon Green Ocean atmosphere: ozone production, precursor sensitivity and aerosol load, Atmos. Chem. Phys., 10, 9251–9282, https://doi.org/10.5194/acp-10-9251-2010, 2010. a, b
Laakso, L., Merikanto, J., Vakkari, V., Laakso, H., Kulmala, M., Molefe, M., Kgabi, N., Mabaso, D., Carslaw, K. S., Spracklen, D. V., Lee, L. A., Reddington, C. L., and Kerminen, V.-M.: Boundary layer nucleation as a source of new CCN in savannah environment, Atmos. Chem. Phys., 13, 1957–1972, https://doi.org/10.5194/acp-13-1957-2013, 2013. a
Lamarque, J.-F., Bond, T. C., Eyring, V., Granier, C., Heil, A., Klimont, Z., Lee, D., Liousse, C., Mieville, A., Owen, B., Schultz, M. G., Shindell, D., Smith, S. J., Stehfest, E., Van Aardenne, J., Cooper, O. R., Kainuma, M., Mahowald, N., McConnell, J. R., Naik, V., Riahi, K., and van Vuuren, D. P.: Historical (1850–2000) gridded anthropogenic and biomass burning emissions of reactive gases and aerosols: methodology and application, Atmos. Chem. Phys., 10, 7017–7039, https://doi.org/10.5194/acp-10-7017-2010, 2010. a
Lana, A., Bell, T. G., Simó, R., Vallina, S. M., Ballabrera-Poy, J., Kettle, A. J., Dachs, J., Bopp, L., Saltzman, E. S., Stefels, J., Johnson, J. E., and Liss, P. S.: An updated climatology of surface dimethlysulfide concentrations and emission fluxes in the global ocean, Global Biogeochem. Cy., 25, GB1004, https://doi.org/10.1029/2010GB003850, 2011. a
Lebo, Z. J., Morrison, H., and Seinfeld, J. H.: Are simulated aerosol-induced effects on deep convective clouds strongly dependent on saturation adjustment?, Atmos. Chem. Phys., 12, 9941–9964, https://doi.org/10.5194/acp-12-9941-2012, 2012. a
Lee, S. S., Donner, L. J., Phillips, V. T. J., and Ming, Y.: The dependence of aerosol effects on clouds and precipitation on cloud-system organization, shear and stability, J. Geophys. Res.-Atmos., 113, D16202, https://doi.org/10.1029/2007JD009224, 2008. a
Leung, G. R., Saleeby, S. M., Sokolowsky, G. A., Freeman, S. W., and van den Heever, S. C.: Aerosol–cloud impacts on aerosol detrainment and rainout in shallow maritime tropical clouds, Atmos. Chem. Phys., 23, 5263–5278, https://doi.org/10.5194/acp-23-5263-2023, 2023. a, b
Li, X., Zhang, Q., Fan, J., and Zhang, F.: Notable Contributions of Aerosols to the Predictability of Hail Precipitation, Geophys. Res. Lett., 48, e2020GL091712, https://doi.org/10.1029/2020GL091712, 2021. a
Mangeon, S., Voulgarakis, A., Gilham, R., Harper, A., Sitch, S., and Folberth, G.: INFERNO: a fire and emissions scheme for the UK Met Office's Unified Model, Geosci. Model Dev., 9, 2685–2700, https://doi.org/10.5194/gmd-9-2685-2016, 2016. a
Manktelow, P. T., Carslaw, K. S., Mann, G. W., and Spracklen, D. V.: Variable CCN formation potential of regional sulfur emissions, Atmos. Chem. Phys., 9, 3253–3259, https://doi.org/10.5194/acp-9-3253-2009, 2009. a
Mann, G. W., Carslaw, K. S., Spracklen, D. V., Ridley, D. A., Manktelow, P. T., Chipperfield, M. P., Pickering, S. J., and Johnson, C. E.: Description and evaluation of GLOMAP-mode: a modal global aerosol microphysics model for the UKCA composition-climate model, Geosci. Model Dev., 3, 519–551, https://doi.org/10.5194/gmd-3-519-2010, 2010. a, b
Marinescu, P. J., van den Heever, S. C., Heikenfeld, M., Barrett, A. I., Barthlott, C., Hoose, C., Fan, J., Fridlind, A. M., Matsui, T., Miltenberger, A. K., Stier, P., Vie, B., White, B. A., and Zhang, Y.: Impacts of Varying Concentrations of Cloud Condensation Nuclei on Deep Convective Cloud Updrafts – A Multimodel Assessment, J. Atmos. Sci., 78, 1147–1172, https://doi.org/10.1175/JAS-D-20-0200.1, 2021. a
Marticorena, B. and Bergametti, G.: Modeling the atmospheric dust cycle: 1. Design of a soil-derived dust emission scheme, J. Geophys. Res.-Atmos., 100, 16415–16430, https://doi.org/10.1029/95JD00690, 1995. a
Martin, S. T., Artaxo, P., Machado, L. A. T., Manzi, A. O., Souza, R. A. F., Schumacher, C., Wang, J., Andreae, M. O., Barbosa, H. M. J., Fan, J., Fisch, G., Goldstein, A. H., Guenther, A., Jimenez, J. L., Pöschl, U., Silva Dias, M. A., Smith, J. N., and Wendisch, M.: Introduction: Observations and Modeling of the Green Ocean Amazon (GoAmazon2014/5), Atmos. Chem. Phys., 16, 4785–4797, https://doi.org/10.5194/acp-16-4785-2016, 2016. a, b, c, d, e
Martin, S. T., Artaxo, P., Machado, L., Manzi, A. O., Souza, R. A. F., Schumacher, C., Wang, J., Biscaro, T., Brito, J., Calheiros, A., Jardine, K., Medeiros, A., Portela, B., de Sá, S. S., Adachi, K., Aiken, A. C., Albrecht, R., Alexander, L., Andreae, M. O., Barbosa, H. M. J., Buseck, P., Chand, D., Comstock, J. M., Day, D. A., Dubey, M., Fan, J., Fast, J., Fisch, G., Fortner, E., Giangrande, S., Gilles, M., Goldstein, A. H., Guenther, A., Hubbe, J., Jensen, M., Jimenez, J. L., Keutsch, F. N., Kim, S., Kuang, C., Laskin, A., McKinney, K., Mei, F., Miller, M., Nascimento, R., Pauliquevis, T., Pekour, M., Peres, J., Petäjä, T., Pöhlker, C., Pöschl, U., Rizzo, L., Schmid, B., Shilling, J. E., Dias, M. A. S., Smith, J. N., Tomlinson, J. M., Tóta, J., and Wendisch, M.: The Green Ocean Amazon Experiment (GoAmazon2014/5) Observes Pollution Affecting Gases, Aerosols, Clouds, and Rainfall over the Rain Forest, B. Am. Meteorol. Soc., 98, 981–997, https://doi.org/10.1175/BAMS-D-15-00221.1, 2017. a, b, c, d, e
Merikanto, J., Spracklen, D. V., Mann, G. W., Pickering, S. J., and Carslaw, K. S.: Impact of nucleation on global CCN, Atmos. Chem. Phys., 9, 8601–8616, https://doi.org/10.5194/acp-9-8601-2009, 2009. a, b
Miltenberger, A. K., Field, P. R., Hill, A. A., Rosenberg, P., Shipway, B. J., Wilkinson, J. M., Scovell, R., and Blyth, A. M.: Aerosol–cloud interactions in mixed-phase convective clouds – Part 1: Aerosol perturbations, Atmos. Chem. Phys., 18, 3119–3145, https://doi.org/10.5194/acp-18-3119-2018, 2018a. a, b
Miltenberger, A. K., Field, P. R., Hill, A. A., Shipway, B. J., and Wilkinson, J. M.: Aerosol–cloud interactions in mixed-phase convective clouds – Part 2: Meteorological ensemble, Atmos. Chem. Phys., 18, 10593–10613, https://doi.org/10.5194/acp-18-10593-2018, 2018b. a
Morrison, H.: On the robustness of aerosol effects on an idealized supercell storm simulated with a cloud system-resolving model, Atmos. Chem. Phys., 12, 7689–7705, https://doi.org/10.5194/acp-12-7689-2012, 2012. a
Morrison, H. and Grabowski, W. W.: Cloud-system resolving model simulations of aerosol indirect effects on tropical deep convection and its thermodynamic environment, Atmos. Chem. Phys., 11, 10503–10523, https://doi.org/10.5194/acp-11-10503-2011, 2011. a
MOSRS: Met Office Science Repository Service (MOSRS), MetOffice [code], https://code.metoffice.gov.uk/trac/home (last access: 27 June 2025), 2025. a
Mulcahy, J. P., Johnson, C., Jones, C. G., Povey, A. C., Scott, C. E., Sellar, A., Turnock, S. T., Woodhouse, M. T., Abraham, N. L., Andrews, M. B., Bellouin, N., Browse, J., Carslaw, K. S., Dalvi, M., Folberth, G. A., Glover, M., Grosvenor, D. P., Hardacre, C., Hill, R., Johnson, B., Jones, A., Kipling, Z., Mann, G., Mollard, J., O'Connor, F. M., Palmiéri, J., Reddington, C., Rumbold, S. T., Richardson, M., Schutgens, N. A. J., Stier, P., Stringer, M., Tang, Y., Walton, J., Woodward, S., and Yool, A.: Description and evaluation of aerosol in UKESM1 and HadGEM3-GC3.1 CMIP6 historical simulations, Geosci. Model Dev., 13, 6383–6423, https://doi.org/10.5194/gmd-13-6383-2020, 2020. a
Pacifico, F., Folberth, G. A., Jones, C. D., Harrison, S. P., and Collins, W. J.: Sensitivity of biogenic isoprene emissions to past, present, and future environmental conditions and implications for atmospheric chemistry, J. Geophys. Res.-Atmos., 117, D22302, https://doi.org/10.1029/2012JD018276, 2012. a
Pan, Z., Mao, F., Rosenfeld, D., Zhu, Y., Zang, L., Lu, X., Thornton, J. A., Holzworth, R. H., Yin, J., Efraim, A., and Gong, W.: Coarse sea spray inhibits lightning, Nat. Commun., 13, 4289, https://doi.org/10.1038/s41467-022-31714-5, 2022. a
Planche, C., Mann, G. W., Carslaw, K. S., Dalvi, M., Marsham, J. H., and Field, P. R.: Spatial and temporal CCN variations in convection-permitting aerosol microphysics simulations in an idealised marine tropical domain, Atmos. Chem. Phys., 17, 3371–3384, https://doi.org/10.5194/acp-17-3371-2017, 2017. a
Pöschl, U., Martin, S., Sinha, B., Chen, Q., Gunthe, S., Huffman, J., Borrmann, S., Farmer, D., Garland, R., Helas, G., Jimenez, J. L., King, S. M., Manzi, A., Mikhailov, E., Pauliquevis, T., Petters, M. D., Prenni, A. J., Roldin, P., Rose, D., Schneider, J., Su, J., Zorn, S. R., Artaxo, P., and Andreae, M. O.: Rainforest Aerosols as Biogenic Nuclei of Clouds and Precipitation in the Amazon, Science, 329, 1513–1516, https://doi.org/10.1126/science.1191056, 2010. a
Riccobono, F., Schobesberger, S., Scott, C. E., Dommen, J., Ortega, I. K., Rondo, L., Almeida, J., Amorim, A., Bianchi, F., Breitenlechner, M., David, A., Downard, A., Dunne, E. M., Duplissy, J., Ehrhart, S., Flagan, R. C., Franchin, A., Hansel, A., Junninen, H., Kajos, M., Keskinen, H., Kupc, A., Kürten, A., Kvashin, A. N., Laaksonen, A., Lehtipalo, K., Makhmutov, V., Mathot, S., Nieminen, T., Onnela, A., Petäjä, T., Praplan, A. P., Santos, F. D., Schallhart, S., Seinfeld, J. H., Sipilä, M., Spracklen, D. V., Stozhkov, Y., Stratmann, F., Tomé, A., Tsagkogeorgas, G., Vaattovaara, P., Viisanen, Y., Vrtala, A., Wagner, P. E., Weingartner, E., Wex, H., Wimmer, D., Carslaw, K. S., Curtius, J., Donahue, N. M., Kirkby, J., Kulmala, M., Worsnop, D. R., and Baltensperger, U.: Oxidation Products of Biogenic Emissions Contribute to Nucleation of Atmospheric Particles, Science, 344, 717–721, https://doi.org/10.1126/science.1243527, 2014. a, b, c, d
Rizzo, L., Artaxo, P., Karl, T., Guenther, A., and Greenberg, J.: Aerosol properties, in-canopy gradients, turbulent fluxes and VOC concentrations at a pristine forest site in Amazonia, Atmos. Environ., 44, 503–511, https://doi.org/10.1016/j.atmosenv.2009.11.002, 2010. a
Rosenfeld, D., Lohmann, U., Raga, G. B., O'dowd, C. D., Kulmala, M., Fuzzi, S., Reissell, A., and Andreae, M. O.: Flood or drought: How do aerosols affect precipitation?, Science, 321, 1309–1313, https://doi.org/10.1126/science.1160606, 2008. a, b, c
Seifert, A., Köhler, C., and Beheng, K. D.: Aerosol-cloud-precipitation effects over Germany as simulated by a convective-scale numerical weather prediction model, Atmos. Chem. Phys., 12, 709-–725, https://doi.org/10.5194/acp-12-709-2012, 2012. a, b
Shen, J., Russell, D. M., DeVivo, J., Kunkler, F., Baalbaki, R., Mentler, B., Scholz, W., Yu, W., Caudillo-Plath, L., Sommer, E., Ahongshangbam, E., Alfaouri, D., Almeida, J., Amorim, A., Beck, L. J., Beckmann, H., Berntheusel, M., Bhattacharyya, N., Canagaratna, M. R., Chassaing, A., Cruz-Simbron, R., Dada, L., Duplissy, J., Gordon, H., Granzin, M., Große Schute, L., Heinritzi, M., Iyer, S., Klebach, H., Krüger, T., Kürten, A., Lampimäki, M., Liu, L., Lopez, B., Martinez, M., Morawiec, A., Onnela, A., Peltola, M., Rato, P., Reza, M., Richter, S., Rörup, B., Sebastian, M. K., Simon, M., Surdu, M., Tamme, K., Thakur, R. C., Tomé, A., Tong, Y., Top, J., Umo, N. S., Unfer, G., Vettikkat, L., Weissbacher, J., Xenofontos, C., Yang, B., Zauner-Wieczorek, M., Zhang, J., Zheng, Z., Baltensperger, U., Christoudias, T., Flagan, R. C., El Haddad, I., Junninen, H., Möhler, O., Riipinen, I., Rohner, U., Schobesberger, S., Volkamer, R., Winkler, P. M., Hansel, A., Lehtipalo, K., Donahue, N. M., Lelieveld, J., Harder, H., Kulmala, M., Worsnop, D. R., Kirkby, J., Curtius, J., and He, X.-C.: New particle formation from isoprene under upper-tropospheric conditions, Nature, 636, 115–123, https://doi.org/10.1038/s41586-024-08196-0, 2024. a, b, c
Shilling, J. E., Pekour, M. S., Fortner, E. C., Artaxo, P., de Sá, S., Hubbe, J. M., Longo, K. M., Machado, L. A. T., Martin, S. T., Springston, S. R., Tomlinson, J., and Wang, J.: Aircraft observations of the chemical composition and aging of aerosol in the Manaus urban plume during GoAmazon 2014/5, Atmos. Chem. Phys., 18, 10773-–10797, https://doi.org/10.5194/acp-18-10773-2018, 2018. a, b
Shrivastava, M., Andreae, M. O., Artaxo, P., Barbosa, H. M. J., Berg, L. K., Brito, J., Ching, J., Easter, R. C., Fan, J., Fast, J. D., Feng, Z., Fuentes, J. D., Glasius, M., Goldstein, A. H., Alves, E. G., Gomes, H., Gu, D., Guenther, A., Jathar, S. H., Kim, S., Liu, Y., Lou, S., Martin, S. T., McNeill, V. F., Medeiros, A., de Sá, S. S., Shilling, J. E., Springston, S. R., Souza, R. A. F., Thornton, J. A., Isaacman-VanWertz, G., Yee, L. D., Ynoue, R., Zaveri, R. A., Zelenyuk, A., and Zhao, C.: Urban pollution greatly enhances formation of natural aerosols over the Amazon rainforest, Nat. Commun., 10, 1046, https://doi.org/10.1038/s41467-019-08909-4, 2019. a, b, c, d
Simon, M., Dada, L., Heinritzi, M., Scholz, W., Stolzenburg, D., Fischer, L., Wagner, A. C., Kürten, A., Rörup, B., He, X.-C., Almeida, J., Baalbaki, R., Baccarini, A., Bauer, P. S., Beck, L., Bergen, A., Bianchi, F., Bräkling, S., Brilke, S., Caudillo, L., Chen, D., Chu, B., Dias, A., Draper, D. C., Duplissy, J., El-Haddad, I., Finkenzeller, H., Frege, C., Gonzalez-Carracedo, L., Gordon, H., Granzin, M., Hakala, J., Hofbauer, V., Hoyle, C. R., Kim, C., Kong, W., Lamkaddam, H., Lee, C. P., Lehtipalo, K., Leiminger, M., Mai, H., Manninen, H. E., Marie, G., Marten, R., Mentler, B., Molteni, U., Nichman, L., Nie, W., Ojdanic, A., Onnela, A., Partoll, E., Petäjä, T., Pfeifer, J., Philippov, M., Quéléver, L. L. J., Ranjithkumar, A., Rissanen, M. P., Schallhart, S., Schobesberger, S., Schuchmann, S., Shen, J., Sipilä, M., Steiner, G., Stozhkov, Y., Tauber, C., Tham, Y. J., Tomé, A. R., Vazquez-Pufleau, M., Vogel, A. L., Wagner, R., Wang, M., Wang, D. S., Wang, Y., Weber, S. K., Wu, Y., Xiao, M., Yan, C., Ye, P., Ye, Q., Zauner-Wieczorek, M., Zhou, X., Baltensperger, U., Dommen, J., Flagan, R. C., Hansel, A., Kulmala, M., Volkamer, R., Winkler, P. M., Worsnop, D. R., Donahue, N. M., Kirkby, J., and Curtius, J.: Molecular understanding of new-particle formation from α-pinene between −50 and +25 °C, Atmos. Chem. Phys., 20, 9183–9207, https://doi.org/10.5194/acp-20-9183-2020, 2020. a
Sporre, M. K., Glantz, P., Tunved, P., Swietlicki, E., Kulmala, M., and Lihavainen, H.: A study of the indirect aerosol effect on subarctic marine liquid low-level clouds using MODIS cloud data and ground-based aerosol measurements, Atmos. Res., 116, 56–66, https://doi.org/10.1016/j.atmosres.2011.09.014, 2012. a
Stier, P., Feichter, J., Kinne, S., Kloster, S., Vignati, E., Wilson, J., Ganzeveld, L., Tegen, I., Werner, M., Balkanski, Y., Schulz, M., Boucher, O., Minikin, A., and Petzold, A.: The aerosol-climate model ECHAM5-HAM, Atmos. Chem. Phys., 5, 1125–1156, https://doi.org/10.5194/acp-5-1125-2005, 2005. a
Stolzenburg, D., Fischer, L., Vogel, A. L., Heinritzi, M., Schervish, M., Simon, M., Wagner, A. C., Dada, L., Ahonen, L. R., Amorim, A., Baccarini, A., Bauer, P. S., Baumgartner, B., Bergen, A., Bianchi, F., Breitenlechner, M., Brilke, S., Mazon, S. B., Chen, D., Dias, A., Draper, D. C., Duplissy, J., Haddad, E. L., Finkenzeller, H., Frege, C., Fuchs, C., Garmash, O., Gordon, H., He, X., Helm, J., Hofbauer, V., R., H. C., Kim, C., Kirkby, J., Kontkanen, J., Kürten, A., Lampilahti, J., Lawler, M., Lehtipalo, K., Leiminger, M., Mai, H., Mathot, S., Mentler, B., Molteni, U., Nie, W., Nieminen, T., Nowak, J. B., Ojdanic, A., Onnela, A., Passananti, M., Petäjä, T., Quéléver, L. L. J., Rissanen, M. P., Sarnela, N., Schallhart, S., Tauber, C., Tomé, A., Wagner, R., Wang, M., Weitz, L., Wimmer, D., Xiao, M., Yan, C., Ye, P., Zha, Q., Baltensperger, U., Curtius, J., Dommen, J., Flagan, R. C., Kulmala, M., Smith, J. N., Worsnop, D. R., Hansel, A., Donahue, N. M., and Winkler, P. M.: Rapid growth of organic aerosol nanoparticles over a wide tropospheric temperature range, P. Natl. Acad. Sci. USA, 115, 9122–9127, https://doi.org/10.1073/pnas.1807604115, 2018. a, b
Stratton, R., Stirling, A., and Derbyshire, S.: Changes and developments to Convective Momentum Transport (CMT) parametrization based on analysis of CRM and SCM, Met Office R&D Tech. Rep, 530, https://library.metoffice.gov.uk/Portal/DownloadImageFile.ashx?objectId=1114&ownerType=0&ownerId=252363 (last access: 21 August 2025), 2009. a
Sullivan, R. C., Crippa, P., Matsui, H., Leung, L. R., Zhao, C., Thota, A., and Pryor, S. C.: New particle formation leads to cloud dimming, npj Climate and Atmospheric Science, 1, 1–9, https://doi.org/10.1038/s41612-018-0019-7, 2018. a
Tao, W.-K., Li, X., Khain, A., Matsui, T., Lang, S., and Simpson, J.: Role of atmospheric aerosol concentration on deep convective precipitation: Cloud-resolving model simulations, J. Geophys. Res.-Atmos., 112, D24S18, https://doi.org/10.1029/2007JD008728, 2007. a
Tao, W.-K., Chen, J.-P., Li, Z., Wang, C., and Zhang, C.: Impact of aerosols on convective clouds and precipitation, Rev. Geophys., 50, RG2001, https://doi.org/10.1029/2011RG000369, 2012. a, b
Tröstl, J., Chuang, W. K., Gordon, H., Heinritzi, M., Yan, C., Molteni, U., Ahlm, L., Frege, C., Bianchi, F., Wagner, R., Simon, M., Lehtipalo, K., Williamson, C., Craven, J. S., Duplissy, J., Adamov, A., Almeida, J., Bernhammer, A., Breitenlechner, M., Brilke, S., Dias, A., Ehrhart, S., Flagan, R. C., Franchin, A., Fuchs, C., Guida, R., Gysel, M., Hansel, A., Hoyle, C. R., Jokinen, T., Junninen, H., Kangasluoma, J., Keskinen, H., Kim, J., Krapf, M., Kürten, A., Laaksonen, A., Lawler, M., Leiminger, M., Mathot, S., Möhler, O., Nieminen, T., Onnela, A., Petäjä, T., Piel, F. M., Miettinen, P., Rissanen, M. P., Rondo, L., Sarnela, N., Schobesberger, S., Sengupta, K., Sipilä, M., Smith, J. N., Steiner, G., Tomè, A., Virtanen, A., Wagner, A. C., Weingartner, E., Wimmer, D., Winkler, P. M., Ye, P., Carslaw, K. S., Curtius, J., Dommen, J., Kirkby, J., Kulmala, M., Riipinen, I., Worsnop, D. R., Donahue, N. M., and Baltensperger, U.: The role of low-volatility organic compounds in initial particle growth in the atmosphere, Nature, 533, 527, https://doi.org/10.1038/nature18271, 2016. a, b
Twomey, S.: The Influence of Pollution on the Shortwave Albedo of Clouds, J. Atmos. Sci., 34, 1149–1152, https://doi.org/10.1175/1520-0469(1977)034<1149:TIOPOT>2.0.CO;2, 1977. a
van den Heever, S. C. and Cotton, W. R.: Urban Aerosol Impacts on Downwind Convective Storms, J. Appl. Meteorol. Clim., 46, 828–850, https://doi.org/10.1175/JAM2492.1, 2007. a, b
van den Heever, S. C., Carrió, G. G., Cotton, W. R., DeMott, P. J., and Prenni, A. J.: Impacts of Nucleating Aerosol on Florida Storms. Part I: Mesoscale Simulations, J. Atmos. Sci., 63, 1752–1775, https://doi.org/10.1175/JAS3713.1, 2006. a
van der Werf, G. R., Randerson, J. T., Giglio, L., Collatz, G. J., Kasibhatla, P. S., and Arellano Jr., A. F.: Interannual variability in global biomass burning emissions from 1997 to 2004, Atmos. Chem. Phys., 6, 3423–3441, https://doi.org/10.5194/acp-6-3423-2006, 2006. a
Varanda Rizzo, L., Roldin, P., Brito, J., Backman, J., Swietlicki, E., Krejci, R., Tunved, P., Petäjä, T., Kulmala, M., and Artaxo, P.: Multi-year statistical and modeling analysis of submicrometer aerosol number size distributions at a rain forest site in Amazonia, Atmos. Chem. Phys., 18, 10255–10274, https://doi.org/10.5194/acp-18-10255-2018, 2018. a
Varble, A. C., Igel, A. L., Morrison, H., Grabowski, W. W., and Lebo, Z. J.: Opinion: A critical evaluation of the evidence for aerosol invigoration of deep convection, Atmos. Chem. Phys., 23, 13791–13808, https://doi.org/10.5194/acp-23-13791-2023, 2023. a
Vehkamäki, H., Kulmala, M., Napari, I., Lehtinen, K. E., Timmreck, C., Noppel, M., and Laaksonen, A.: An improved parameterization for sulfuric acid–water nucleation rates for tropospheric and stratospheric conditions, J. Geophys. Res.-Atmos., 107, AAC 3-1–AAC 3-10, https://doi.org/10.1029/2002JD002184, 2002. a
Walters, D., Baran, A. J., Boutle, I., Brooks, M., Earnshaw, P., Edwards, J., Furtado, K., Hill, P., Lock, A., Manners, J., Morcrette, C., Mulcahy, J., Sanchez, C., Smith, C., Stratton, R., Tennant, W., Tomassini, L., Van Weverberg, K., Vosper, S., Willett, M., Browse, J., Bushell, A., Carslaw, K., Dalvi, M., Essery, R., Gedney, N., Hardiman, S., Johnson, B., Johnson, C., Jones, A., Jones, C., Mann, G., Milton, S., Rumbold, H., Sellar, A., Ujiie, M., Whitall, M., Williams, K., and Zerroukat, M.: The Met Office Unified Model Global Atmosphere 7.0/7.1 and JULES Global Land 7.0 configurations, Geosci. Model Dev., 12, 1909–1963, https://doi.org/10.5194/gmd-12-1909-2019, 2019. a, b
Wang, J., Krejci, R., Giangrande, S., Kuang, C., Barbosa, H. M. J., Brito, J., Carbone, S., Chi, X., Comstock, J., Ditas, F., Lavric, J., Manninen, H. E., Mei, F., Moran-Zuloaga, D., Pöhlker, C., Pöhlker, M. L., Saturno, J., Schmid, B., Souza, R. A. F., Springston, S. R., Tomlinson, J. M., Toto, T., Walter, D., Wimmer, D., Smith, J. N., Kulmala, M., Machado, L. A. T., Artaxo, P., Andreae, M. O., Petäjä, T., and Martin, S. T.: Amazon boundary layer aerosol concentration sustained by vertical transport during rainfall, Nature, 539, 416, https://doi.org/10.1038/nature19819, 2016. a
Wang, M. and Penner, J. E.: Aerosol indirect forcing in a global model with particle nucleation, Atmos. Chem. Phys., 9, 239–260, https://doi.org/10.5194/acp-9-239-2009, 2009. a
Wang, X., Gordon, H., Grosvenor, D. P., Andreae, M. O., and Carslaw, K. S.: Contribution of regional aerosol nucleation to low-level CCN in an Amazonian deep convective environment: results from a regionally nested global model, Atmos. Chem. Phys., 23, 4431-–4461, https://doi.org/10.5194/acp-23-4431-2023, 2023. a, b, c, d
Wang, X., Carslaw, K., Grosvenor, D. P., and Gordon, H.: Weak influence of anthropogenic emissions on aerosol, cloud, and rain in the wet season of the Amazon rainforest, Zenodo [data set], https://doi.org/10.5281/zenodo.7213370, 2025a. a
Wang, X., Carslaw, K. S., Grosvenor, D., and Gordon, H.: JASMIN: The UK's data analysis facility for environmental science, Managed Archive Storage System (MASS) [data set], https://help.jasmin.ac.uk/docs/mass/how-to-apply-for-mass-access/ (last access: 27 June 2025), 2025b. a
Wang, Y., Wan, Q., Meng, W., Liao, F., Tan, H., and Zhang, R.: Long-term impacts of aerosols on precipitation and lightning over the Pearl River Delta megacity area in China, Atmos. Chem. Phys., 11, 12421-–12436, https://doi.org/10.5194/acp-11-12421-2011, 2011. a
Williamson, C. J., Kupc, A., Axisa, D., Bilsback, K. R., Bui, T., Campuzano-Jost, P., Dollner, M., Froyd, K. D., Hodshire, A. L., Jimenez, J. L., Kodros, J. K., Luo, G., Murphy, D. M., Nault, B. A., Ray, E. A., Weinzierl, B., Wilson, J. C., Yu, F., Yu, P., Pierce, J. R., and Brock, C. A.: A large source of cloud condensation nuclei from new particle formation in the tropics, Nature, 574, 399–403, https://doi.org/10.1038/s41586-019-1638-9, 2019. a
Wimmer, D., Buenrostro Mazon, S., Manninen, H. E., Kangasluoma, J., Franchin, A., Nieminen, T., Backman, J., Wang, J., Kuang, C., Krejci, R., Brito, J., Goncalves Morais, F., Martin, S. T., Artaxo, P., Kulmala, M., Kerminen, V.-M., and Petäjä, T.: Ground-based observation of clusters and nucleation-mode particles in the Amazon, Atmos. Chem. Phys., 18, 13245–13264, https://doi.org/10.5194/acp-18-13245-2018, 2018. a
Wood, N., Staniforth, A., White, A., Allen, T., Diamantakis, M., Gross, M., Melvin, T., Smith, C., Vosper, S., Zerroukat, M., and Thuburn, J.: An inherently mass-conserving semi-implicit semi-Lagrangian discretization of the deep-atmosphere global non-hydrostatic equations, Q. J. Roy. Meteor. Soc., 140, 1505–1520, https://doi.org/10.1002/qj.2235, 2014. a
Yan, H., Li, Z., Huang, J., Cribb, M., and Liu, J.: Long-term aerosol-mediated changes in cloud radiative forcing of deep clouds at the top and bottom of the atmosphere over the Southern Great Plains, Atmos. Chem. Phys., 14, 7113–7124, https://doi.org/10.5194/acp-14-7113-2014, 2014. a
Yin, Y., Levin, Z., Reisin, T. G., and Tzivion, S.: The effects of giant cloud condensation nuclei on the development of precipitation in convective clouds – a numerical study, Atmos. Res., 53, 91–116, https://doi.org/10.1016/S0169-8095(99)00046-0, 2000. a
Yin, Y., Carslaw, K., and Feingold, G.: Vertical transport and processing of aerosols in a mixed-phase convective cloud and the feedback on cloud development, Q. J. Roy. Meteor. Soc., 131, 221–245, https://doi.org/10.1256/qj.03.186, 2005. a
Yu, F., Ma, X., and Luo, G.: Anthropogenic contribution to cloud condensation nuclei and the first aerosol indirect climate effect, Environ. Res. Lett., 8, 024029, https://doi.org/10.1088/1748-9326/8/2/024029, 2013. a
Zaveri, R. A., Wang, J., Fan, J., Zhang, Y., Shilling, J. E., Zelenyuk, A., Mei, F., Newsom, R., Pekour, M., Tomlinson, J., Comstock, J. M., Shrivastava, M., Fortner, E., Machado, L. A. T., Artaxo, P., and Martin, S. T.: Rapid growth of anthropogenic organic nanoparticles greatly alters cloud life cycle in the Amazon rainforest, Science Advances, 8, eabj0329, https://doi.org/10.1126/sciadv.abj0329, 2022. a
Zhao, B., Fast, J. D., Donahue, N. M., Shrivastava, M., Schervish, M., Shilling, J. E., Gordon, H., Wang, J., Gao, Y., Zaveri, R. A., Liu, Y., and Gaudet, B.: Impact of Urban Pollution on Organic-Mediated New-Particle Formation and Particle Number Concentration in the Amazon Rainforest, Environ. Sci. Technol., 55, 4357–4367, https://doi.org/10.1021/acs.est.0c07465, 2021. a, b, c, d, e