the Creative Commons Attribution 4.0 License.
the Creative Commons Attribution 4.0 License.
 | 23 Jul 2025
Measurement report: Diurnal variability in NO2 and HCHO lower-tropospheric vertical profiles in southeastern Los Angeles
Lisa F. Hernandez
Leslie Tanaka
Alejandro Dunnick
Ground-level ozone in excess of the United States National Ambient Air Quality Standards remains a prevalent issue across Southern California, particularly in the summer months. To improve our understanding of the vertical distribution of ozone precursors in Southern California, we used ground-based multi-axis differential absorption spectroscopy (MAX-DOAS) measurements in Whittier, California, to simultaneously retrieve both near-surface mole fractions and vertical column densities (VCDs) of both NO2 and HCHO. Ratios of HCHO to NO2, commonly referred to as FNR, derived from satellite-based measurements are used to diagnose ozone production chemistry over regions without consistent surface-based measurements. While VCDs of NO2 are well correlated with TROPOMI observations over the study period (R=0.73), HCHO VCDs and FNRs derived from MAX-DOAS observations are less well correlated (R=0.48 and 0.59, respectively). These observations also showed differing diurnal cycles between near-surface mixing ratios and VCDs due to variability in the vertical profile; this diurnal behavior will be increasingly critical to understand given the ongoing shift from Sun-synchronous to geostationary satellite observations. Using ground-based measurements, we determined FNRs using both surface mole fractions and VCDs, finding that FNRs derived from surface mole fractions are generally lower than those derived from column-based measurements. Evaluating the ozone exceedance probability as a function of FNR for both quantities suggests that the transition from volatile organic compound (VOC)-limited to NOx-limited regimes may begin at lower FNR values than those derived from satellite-based measurements in East Los Angeles. We find that these differences in FNRs derived from ground-based and satellite-based measurements are driven by variability in the vertical distribution of HCHO. These impacts are most pronounced in late afternoon, when ozone exceedances are most prevalent.
- Article
(3686 KB) - Full-text XML
- BibTeX
- EndNote


While the atmospheric chemistry over Los Angeles has been extensively studied via both long-term measurements and dedicated intensive field campaigns (e.g., Hering and Blumenthal, 1989; Jacob et al., 2010; Ryerson et al., 2013; Nussbaumer et al., 2023), ozone mole fractions in excess of the United States National Ambient Air Quality Standards (NAAQS) value of 70 nmol mol−1 remain a frequent issue across the region, particularly at warmer temperatures (Pusede et al., 2015), pointing to a continued need for measurements of ozone and its precursors in Southern California.
Ozone production is dependent, in a nonlinear fashion, on both nitrogen oxides () and volatile organic compounds (VOCs) (Haagen-Smit, 1952; Sillman et al., 1990). NOx species are emitted via both natural sources (e.g., wildfires and lightning) and anthropogenic sources (primarily via combustion). VOCs have a variety of sources including biogenic emissions, wildfires, and anthropogenic emissions. Formaldehyde is often used in studies as a proxy for VOCs, as it is a common product of VOC oxidation reactions (Millet et al., 2006) and has the ability to be detected via spectroscopic and remote-sensing techniques (e.g., Duncan et al., 2010).
Satellite-based measurements of ozone precursors that absorb strongly in the ultraviolet, such as NO2 and HCHO, have been used to understand ozone production chemistry over wide regions, particularly those without robust surface monitoring networks (e.g., Martin et al., 2004; Duncan et al., 2010; Jin et al., 2017, 2020; Souri et al., 2020). However, the relationship between the retrieved vertical column densities (VCDs) and near-surface mixing ratios (which are more relevant to human health) is not straightforward and complicates the use of these data to inform interventions to improve regional air quality (e.g., Schroeder et al., 2017). In addition to direct measurements of NO2 and HCHO, ratios of HCHO to NO2 (FNRs) obtained via remote sensing have been explored as a potential tool to diagnose whether ozone formation chemistry is in a NOx-limited or NOx-saturated regime (e.g., Martin et al., 2004; Duncan et al., 2010; Jin et al., 2017, 2020; Souri et al., 2020). The use of these column measurements and derived ratios to examine near-surface ozone formation chemistry is complicated by variations in the trace gas vertical profile that confound the relationship between the satellite-observed VCDs and ground-level pollutant concentrations, the latter of which are the target of policy efforts to improve air quality. In particular, results from the DISCOVER-AQ campaign showed that variations in the HCHO and NO2 vertical profiles lead to ratios of columns that do not reflect ozone production conditions at ground level (Schroeder et al., 2017). To date, intercomparisons with ground-based measurements to try and improve our understanding of these impacts have only been undertaken at times centered around a once-daily satellite overpass. The ongoing shift from Sun-synchronous to geostationary satellite observations will require a better understanding of the diurnal behavior of vertical profiles of these trace gases to interpret satellite-based column measurements.
Multi-axis differential absorption spectroscopy (MAX-DOAS) is frequently used to provide information on both near-surface and total column amounts of HCHO and NO2 concurrently with high temporal resolution during daylight hours, and this measurement method is able to provide observational data on how the relationship between these two quantities varies throughout the day. In this work, we present 2 years of vertically resolved measurements of NO2 and HCHO in southeastern Los Angeles County and their relationship with local ozone conditions. These measurements are the first vertically resolved characterization of these two ozone precursors in southeastern Los Angeles County, improving our understanding of the diurnal variation in ozone precursors and resulting ozone pollution in this part of Southern California.
2.1 MAX-DOAS measurements
MAX-DOAS (Hönninger et al., 2004) measurements were made using an Airyx SkySpec-Compact-150 system on the Whittier College campus from 26 March 2020 to 26 May 2022. Whittier College is located approximately 15 km southeast of Downtown Los Angeles and directly west of the Puente Hills (Fig. 1). The view azimuth of the instrument was 180° east of north and is shown in Fig. 1 with a black line. Solar spectra were obtained at and 90° elevation angles, with one elevation scan taking place over approximately 10 min.
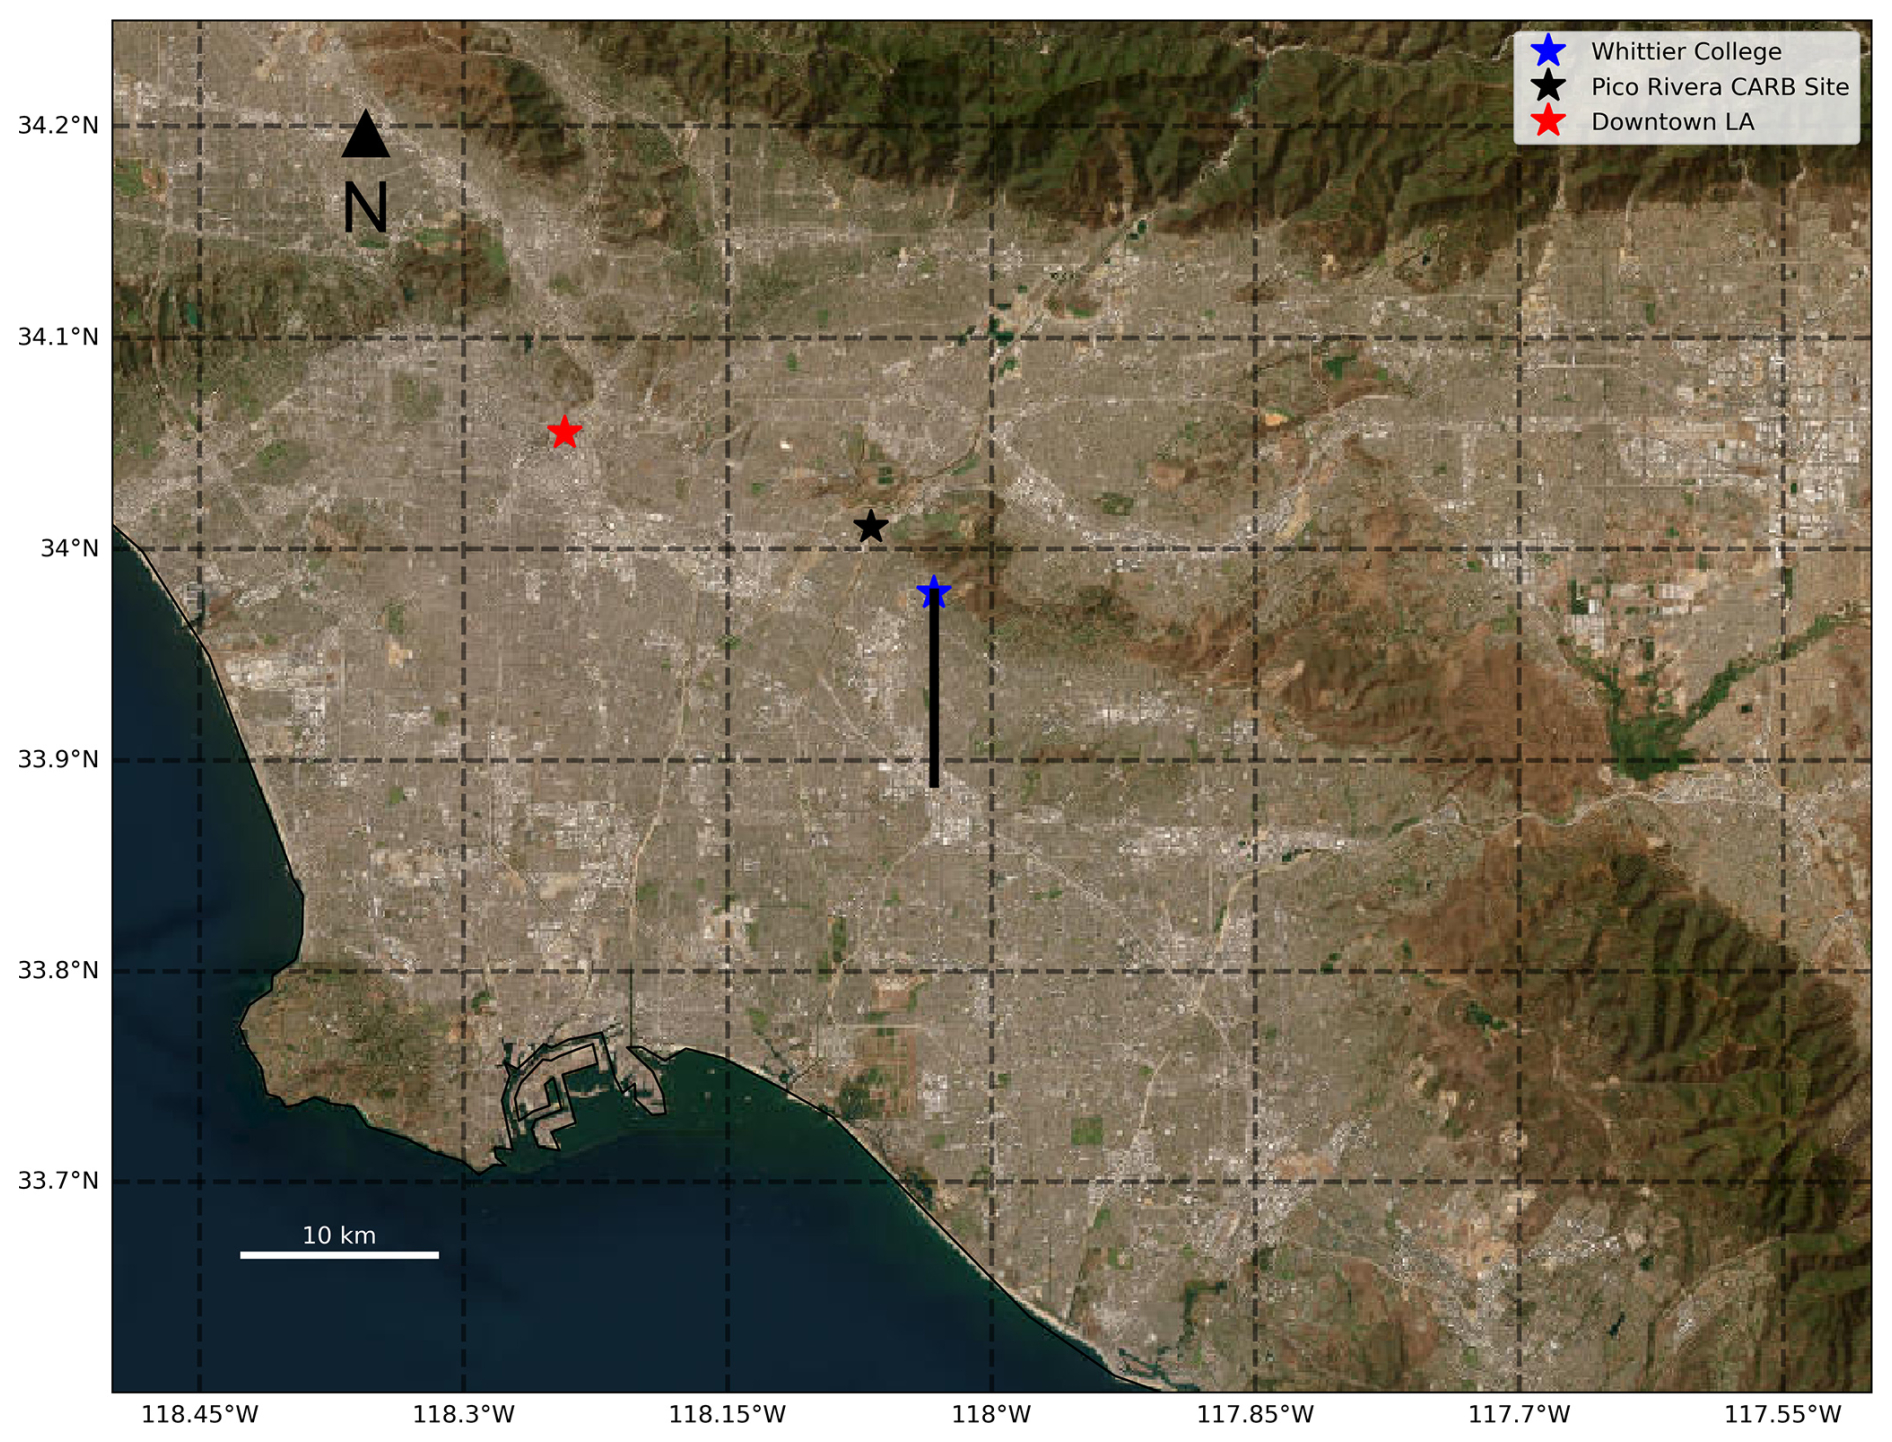
Figure 1 Map of the area surrounding Whittier College (Esri, 2024). The location of Whittier College, where the MAX-DOAS measurements took place, is indicated with a blue star. The black line extending from the blue star indicates the view azimuth and approximate horizontal path length of the DOAS observations. The California Air Resources Board site with in situ measurements used in this study is indicated with a black star.
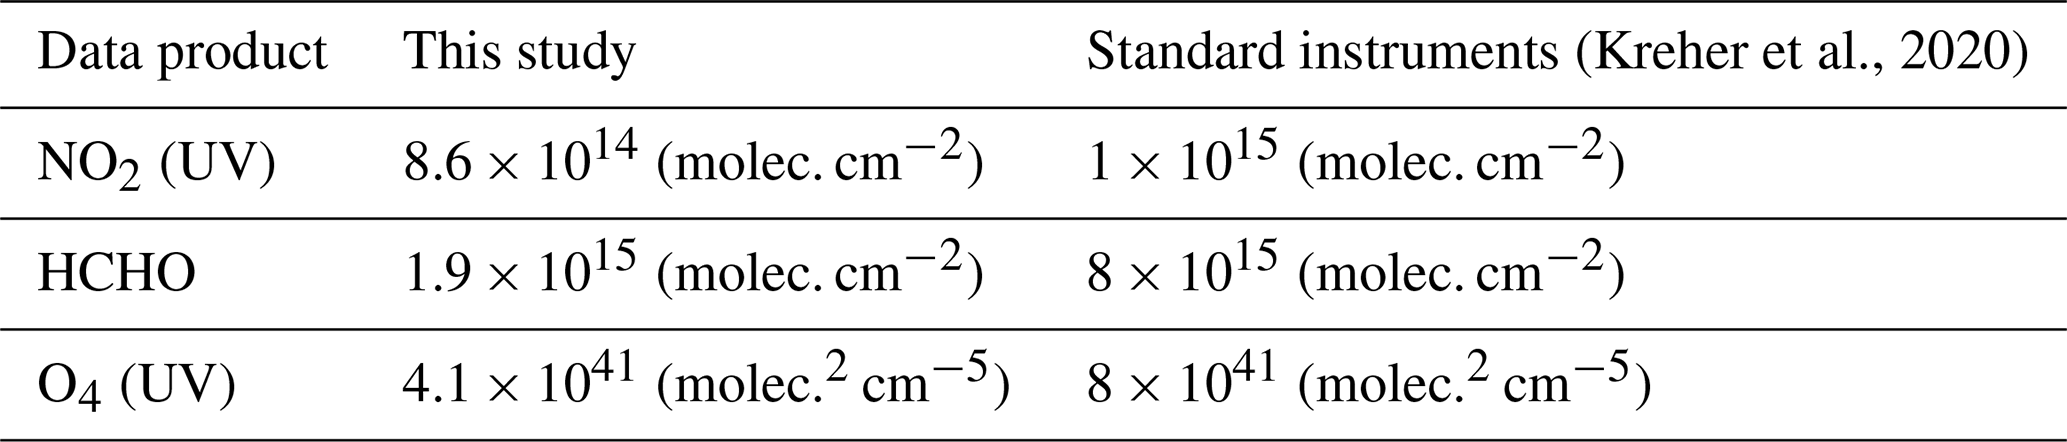
DOAS fitting for O4, NO2, and HCHO was undertaken using QDOAS (Fayt et al., 2011) following the recommendations of the CINDI-2 intercomparison campaign outlined in Kreher et al. (2020) (fit windows: NO2 and O4, 338–370 nm; HCHO, 324.5–359 nm), with the exception of the use of a zenith reference spectrum for each elevation scan to minimize the influence of stratospheric trace gases on the spectral fitting. Fits with a root-mean-square value of less than 0.001 were not included in further analysis. Typical differential slant column uncertainties, characterized by median fitting errors, are shown in Table 1. Cloud screening of these data was done based on the measured color index (), using the methods detailed in Wagner et al. (2016). This cloud screening removed 8.1 % of the dataset overall and had a distinct seasonal cycle, as shown in Fig. 2, resulting in a dataset that is overly weighted toward spring and summer observations when clear skies were more prevalent. The remaining cloud-screened measurements were then used to retrieve vertical profiles of NO2 and HCHO concentrations averaged over 100 m layers up to an altitude of 4 km, providing vertical profile information for NO2 and HCHO with a 30 min temporal resolution.
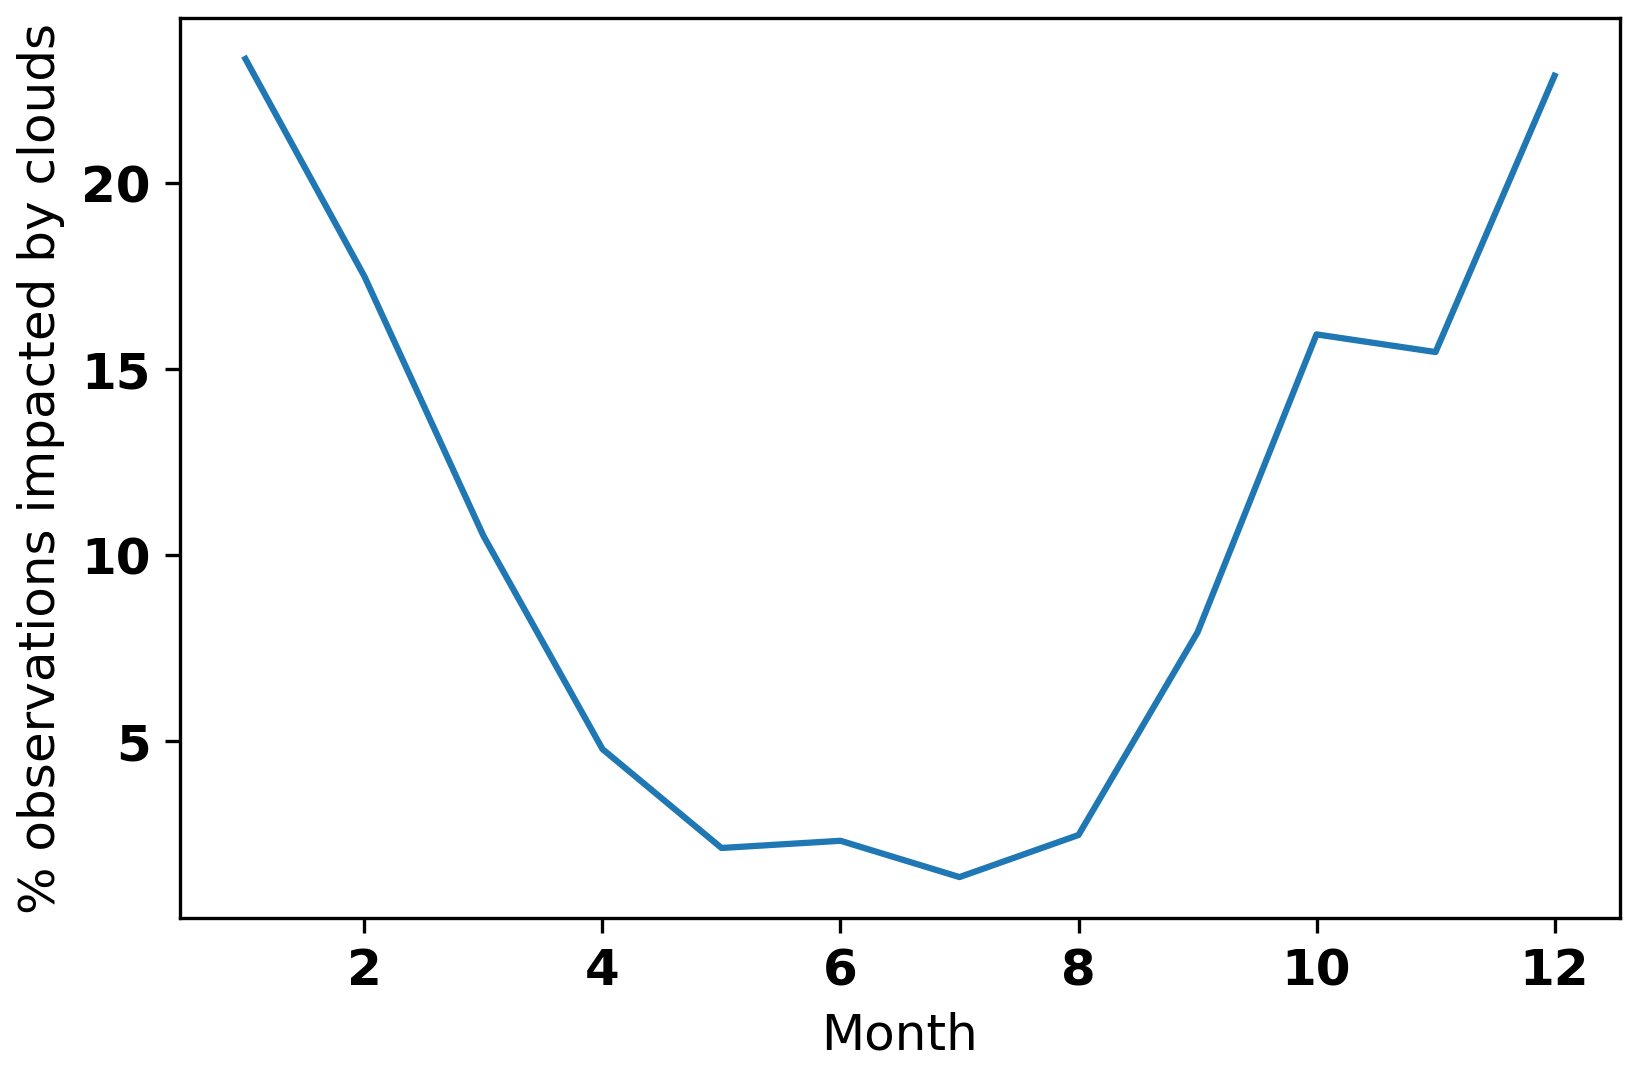
Figure 2 The percentage of data removed by cloud screening as a function of month. This figure illustrates the larger impact of cloud screening on observations during the winter months.
Table 1Median differential slant column density (dSCD) fitting errors compared to data from standard instruments deployed during the CINDI-2 campaign (Kreher et al., 2020).
The retrieval of trace gas vertical profiles from MAX-DOAS slant column densities was performed using the University of Heidelberg Profile (HEIPRO) (Yilmaz, 2012). The retrieval is a two-step process completed using optimal estimation (Rodgers, 2000; Wagner et al., 2004; Frieß et al., 2006). First, the aerosol particle extinction profile is retrieved using slant column density measurements of O4, which has a known vertical profile dependent only on temperature and pressure, with the radiative transfer model SCIATRAN (Rozanov et al., 2005) serving as the forward model. For the aerosol extinction profile retrieval, the a priori information consisted of an exponentially decaying profile with a scale height of 0.5 km and an aerosol optical depth (AOD) determined by the median measured AOD at the California Institute of Technology (CalTech) Aerosol Robotic Network (AERONET) site over the measurement period. Similarly, the Ångström exponent (1.23) and phase function (0.70) were also determined using median measured values from the CalTech AERONET site. The surface albedo and the aerosol single-scattering albedo were assumed to be 0.1 and 0.92, respectively, based on measurements during CalNex (Thompson et al., 2012).
The trace gas retrieval was done similarly using the retrieved aerosol extinction profile as input for the forward model. For NO2, the a priori information was an exponentially decaying profile with a 0.5 km scale height and a value in the lowest layer of 14 nmol mol−1. This value was based on the median of in situ NO2 measurements during this time period at the California Air Resources Board (CARB) site in Pico Rivera, 5 km north of the college. For CH2O, the a priori information was an exponentially decaying profile with a 500 m scale height and a value in the lowest layer of 6 nmol mol−1 based on measurements during the 2010 CalNex campaign (Warneke et al., 2011).
While the trace gas profiles are typically retrieved on a high-vertical-resolution altitude grid, in this case every 100 m up to 4 km, this is an overrepresentation of the actual information content of the original measurements, with 40 parameters being retrieved from 7 measurements. Thus, it is desirable to reduce the retrieved profiles to more robust quantities that accurately reflect the information content of the measurements and that facilitate the analysis of long-term measurements (Payne et al., 2009; Peterson et al., 2015). With ground-based MAX-DOAS, which is most sensitive near the surface, we reduced the retrieved profiles to near-surface mole fractions and a lower-tropospheric vertical column density (LT-VCD) to emphasize that the retrieved columns do not necessarily reflect the full tropospheric column (Peterson et al., 2015). Over the course of the study, 93 % of NO2 measurements and 94 % of HCHO measurements had more than 2 degrees of freedom, as determined from the retrieval averaging kernel matrix, indicating that both of these quantities could be reliably retrieved from the differential slant column density (dSCD) measurements. To characterize variability in the vertical distribution of the trace gas of interest, we also calculated the fraction of the retrieved column in the lowest 200 m, which we refer to as the f200 (Peterson et al., 2015). The cloud-screened dataset consists of 5790 observations, each consisting of 30 min, of near-surface mole fractions, LT-VCDs, and f200 values for both NO2 and HCHO.
2.2 Complementary data
Hourly O3, NO2, and temperature measurements were obtained from the Pico Rivera # 2 South Coast Air Quality Measurement District (SCAQMD) site 5 km northeast of the college (Fig. 1). SCAQMD utilizes Model T400 monitoring instruments (Teledyne Advance Pollution Instrumentation, Inc) to measure hourly ozone at a variety of sites across Southern California and makes the data publicly available (http://www.arb.ca.gov/aqmis2/aqmis2. php, last access: 7 April 2025). NO2 measurements are made using a Model T200 instrument (Teledyne Advance Pollution Instrumentation, Inc), and these data are also publicly available. Meteorological measurements at SCAQMD sites are made using Model 81000 sonic anemometers (RM Young Co). TROPOMI Level 2 tropospheric NO2 (Copernicus Sentinel-5P (processed by ESA), 2021) columns and HCHO (European Space Agency, 2020) columns were obtained from the Goddard Earth Sciences Data and Information Services Center (GES DISC). The Level 2 TROPOMI swath data were utilized at their native spatial resolution of 5.5×3.5 km without regridding for both species. For both species, only TROPOMI data with a quality assurance value greater than 0.75 were used in this analysis.
3.1 Comparisons with in situ data
To evaluate the effectiveness of the MAX-DOAS NO2 retrievals, the mole fractions retrieved for the lowest 100 m were correlated with in situ measurements made by CARB approximately 5 km from the MAX-DOAS. Given the spatial heterogeneity of NO2, the comparison of in situ data to MAX-DOAS-retrieved values, which are both horizontally and vertically averaged, should be interpreted with caution. Nevertheless, Fig. 3 shows that the two measurements are generally well correlated (R=0.68) with the MAX-DOAS retrievals, which are averaged over 100 m vertically and on the order of 10 km horizontally, usually being lower than the in situ measurements at the surface.
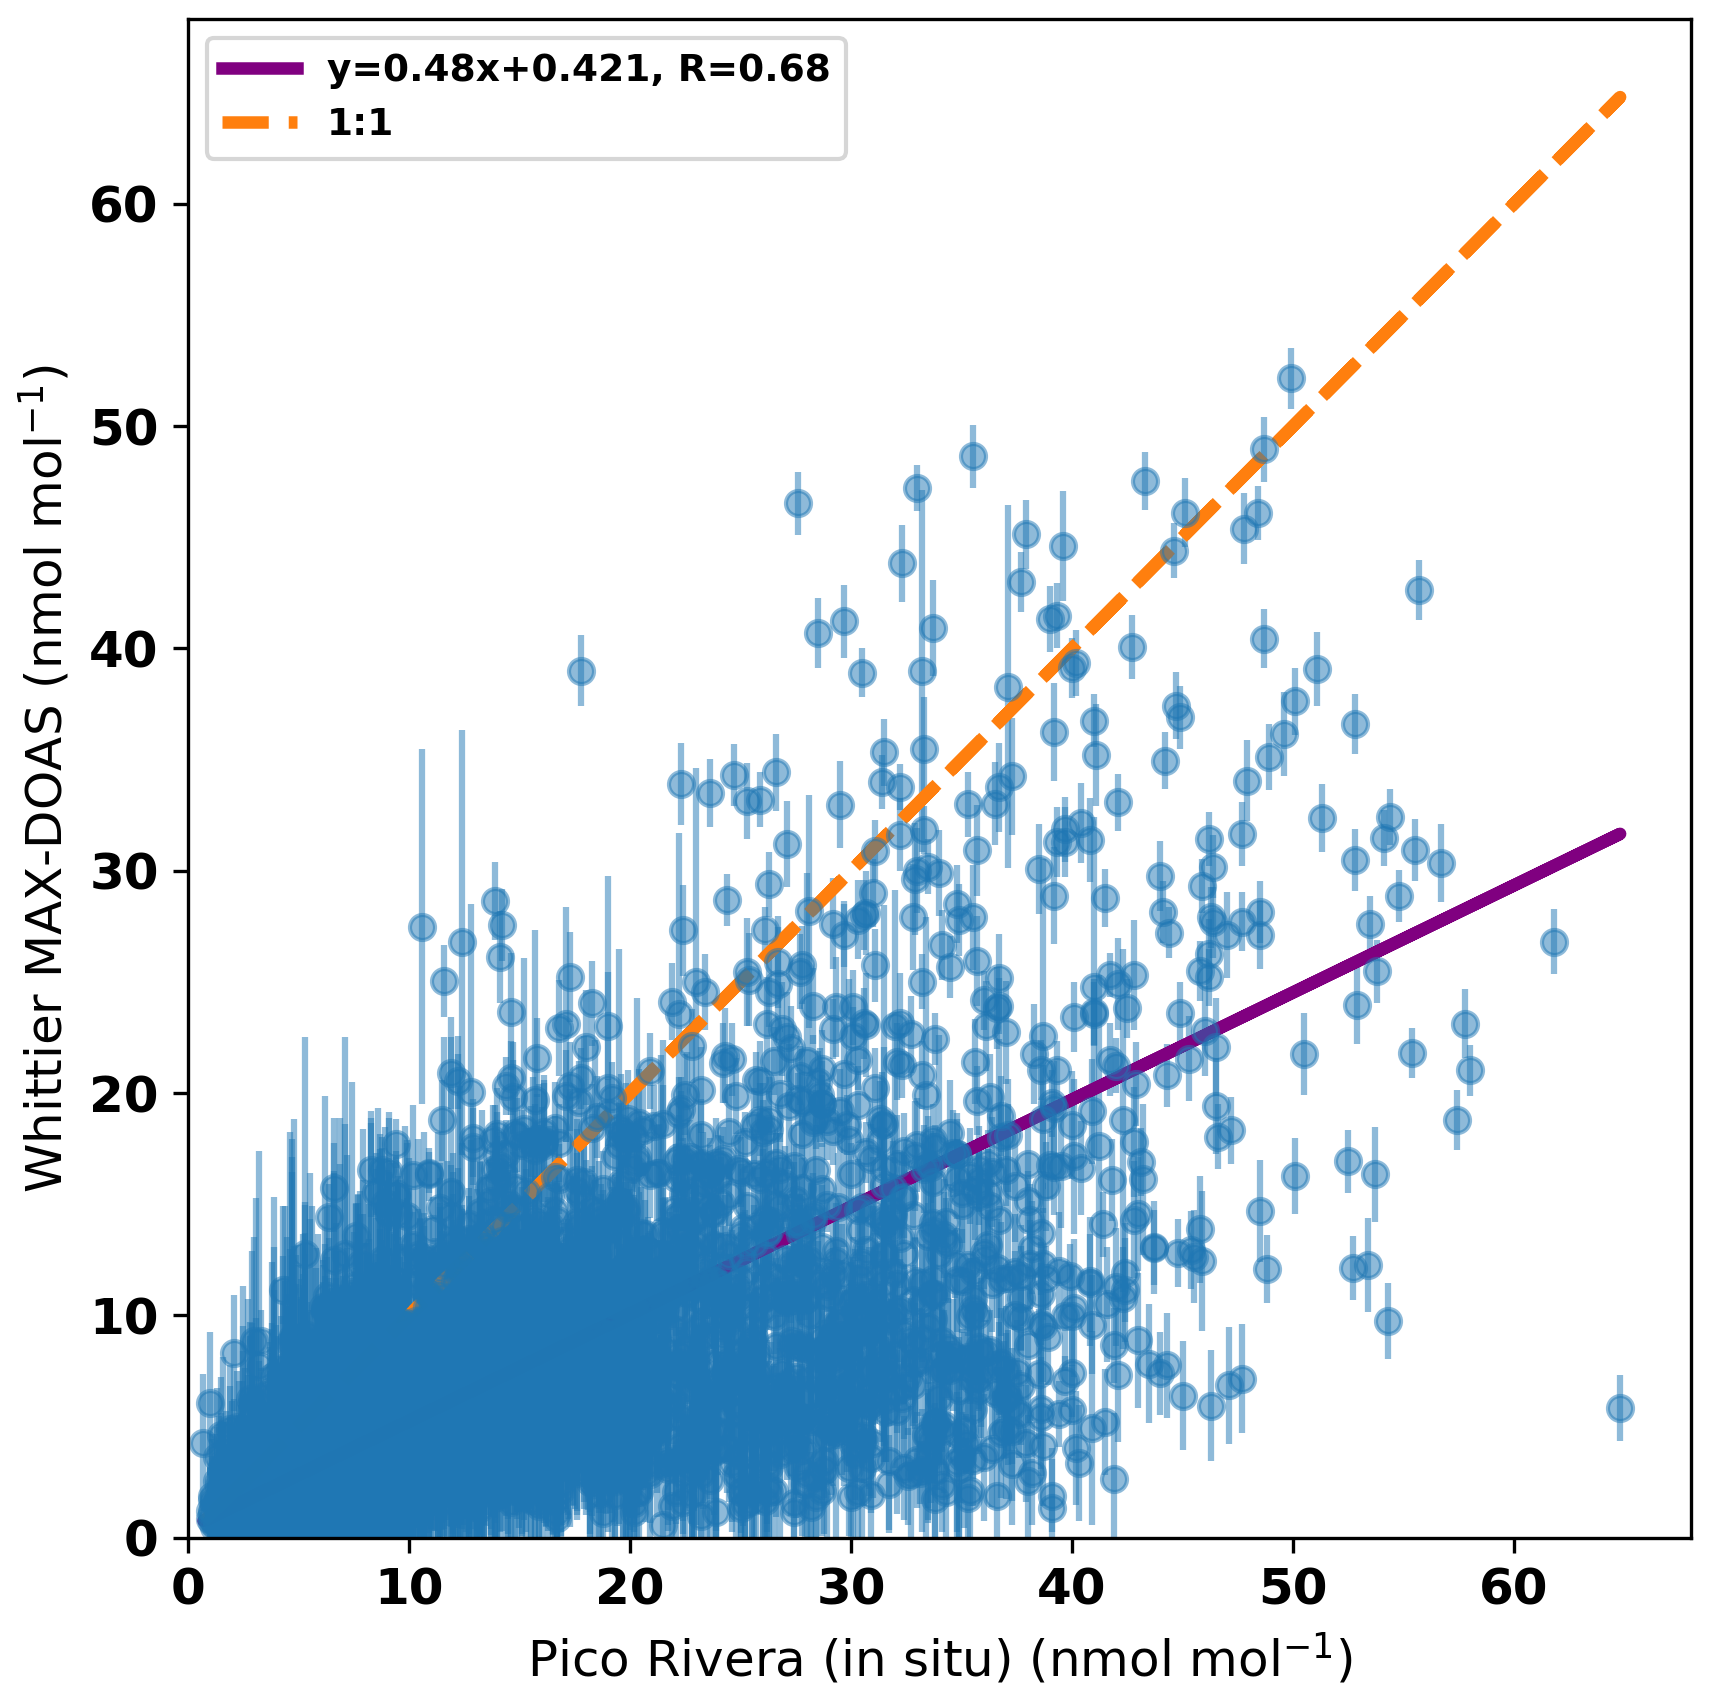
Figure 3Correlation of hourly averaged MAX-DOAS measurements with in situ NO2 data from the CARB site in Pico Rivera, 5 km north of the college. The purple line shows the linear regression, while the orange line shows the 1:1 relationship. Error bars for the MAX-DOAS retrievals reflect propagated dSCD measurement errors and a priori error calculated using HEIPRO.
3.2 Comparisons with TROPOMI
To facilitate comparisons of the ground- and satellite-based measurements, MAX-DOAS measurements were averaged over the hour surrounding the local overpass time (∼ 13:30 LT, local time). To compensate for the MAX-DOAS measurements being path-averaged over multiple TROPOMI pixels, the TROPOMI pixel over Whittier and the eight directly adjacent pixels (nearest neighbors) were averaged. The horizontal averaging of the MAX-DOAS varies over the study period due to its dependence on aerosol particle extinction in the lower troposphere. For this work, we assume a horizontal path length of ∼ 10 km based on work by Irie et al. (2011). Error bars for the MAX-DOAS retrievals reflect propagated dSCD measurement errors and a priori error calculated using HEIPRO. Error bars for the TROPOMI observations reflect the spatial variability over the nearest-neighbor pixels, as calculated using the standard error of the mean. The resulting comparisons for both NO2 and HCHO over the study period are shown in Fig. 4. The daily NO2 measurements are generally well correlated (R=0.73), and monthly averages are even more well correlated (R=0.89), although the TROPOMI tropospheric column measurements are generally 16 % lower than the ground-based NO2 column measurements over this study. These results are consistent with other intercomparisons of satellite- and ground-based measurements (e.g., Jin et al., 2016; Wang et al., 2017; Pinardi et al., 2020; Chan et al., 2020; Ryan et al., 2023).
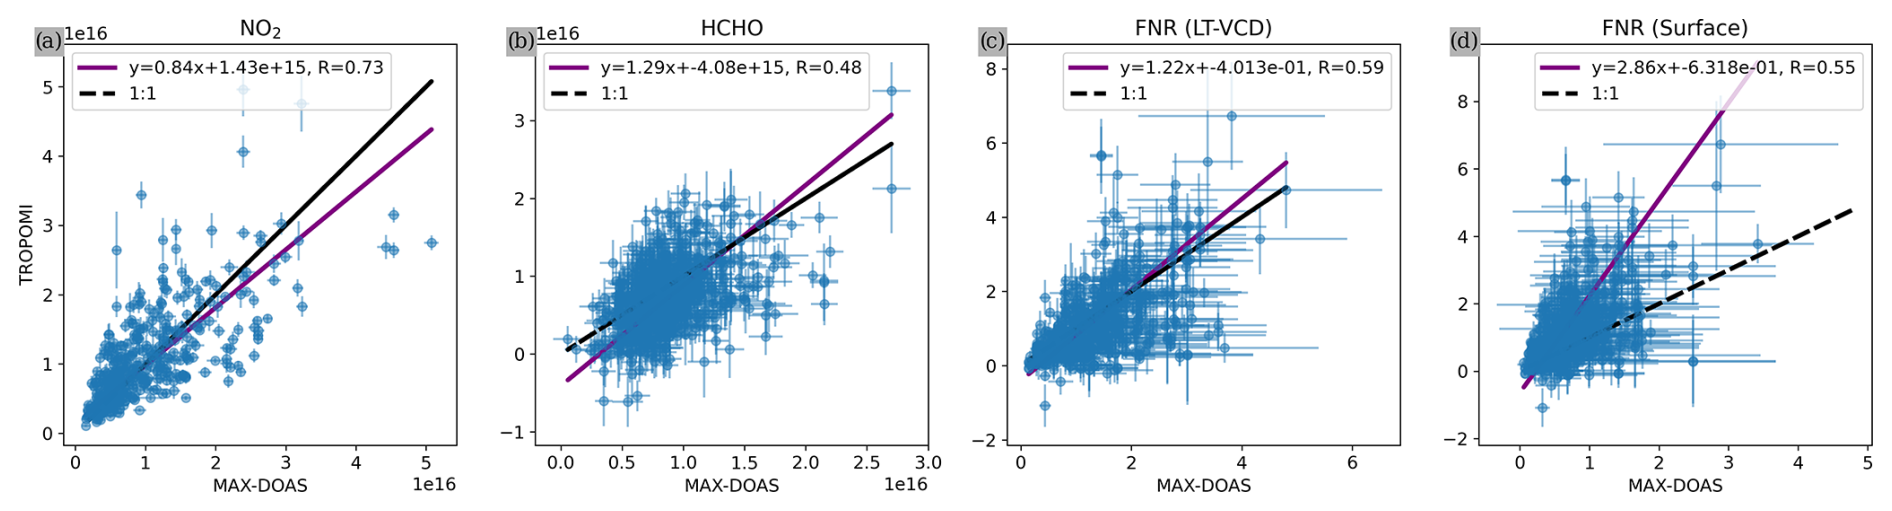
Figure 4(a) Correlation of hourly averaged MAX-DOAS NO2 retrievals with tropospheric columns retrieved from TROPOMI. (b) Correlation of hourly averaged MAX-DOAS HCHO retrievals with tropospheric columns retrieved from TROPOMI. (c) Correlation of hourly averaged MAX-DOAS LT-VCD-based FNRs with those calculated using tropospheric columns retrieved from TROPOMI. (d) Correlation of hourly averaged MAX-DOAS surface-based FNRs with those calculated using tropospheric columns retrieved from TROPOMI. The purple lines show the orthogonal distance regression, while the dashed black lines shows the 1:1 relationship. Uncertainties for both retrievals are shown in blue. Error bars for the MAX-DOAS retrievals reflect propagated dSCD measurement errors and a priori error calculated using HEIPRO. Error bars for the TROPOMI observations reflect the spatial variability over the nearest-neighbor pixels, as calculated using the standard error of the mean.
Formaldehyde measurements are less well correlated (R=0.48), although monthly averages are still well correlated (R=0.82). The comparison of this finding with prior comparisons is more muddled than that of NO2. Retrieved TROPOMI HCHO columns are generally higher than those retrieved via MAX-DOAS over the course of the study. This discrepancy is in contrast to findings from some prior global studies (e.g., Chan et al., 2020; De Smedt et al., 2021) but consistent with intercomparisons done in polluted urban areas like London (Ryan et al., 2023) and Kinshasa (Yombo Phaka et al., 2023). Additionally, Whittier is impacted by a sea breeze circulation that can introduce errors on the order of 20 %–30 % in the air mass factors used to retrieve HCHO VCDs (Souri et al., 2023b). There are times when TROPOMI retrieves large column densities that are not supported by ground-based measurements. These events typically occur in the summer months and are potentially due to the impacts of the long-range transport of wildfire plumes further aloft, which can complicate the retrieval of HCHO from satellite-based measurements (Zhao et al., 2022). It is also important to note that ground-based MAX-DOAS retrievals, which are most sensitive in the lowest 1–2 km of the atmosphere, do not represent the full tropospheric column that would be retrieved from a satellite-based measurement. This distinction is more relevant in the measurement of a chemical species produced throughout the troposphere (like HCHO) than a chemical species primarily emitted near the surface (like NO2).
3.3 Diurnal variations
Figure 6 shows the diurnal cycles in the vertical distribution of both NO2 and HCHO retrieved from MAX-DOAS observations. NO2 vertical columns ranged between 1.2×10¹⁵ and 2.9×10¹⁷ molec. cm−2, with a median LT-VCD of 7.9×10¹⁵. Near-surface mole fractions ranged from near 0 to 52 nmol mol−1, with a median value of 4.8 nmol mol−1. NO2 vertical distributions tend to have more of the column in the lowest 200 m of the atmosphere in the morning, with peak near-surface mole fractions occurring between 06:00 and 08:00 LT (Fig. 6b) and peak LT-VCDs occurring closer to noon (Fig. 6a). The observed peak near-surface mole fractions and LT-VCDs are generally lower than those seen in Kim et al. (2016) during the 2010 CalNex campaign at all times of day. This discrepancy could also reflect the fact that our observations include weekend observations, which have lower NO2 throughout the study period (Fig. 5); seasonal differences, as CalNex took place during the summer and our observations encompass all seasons; ongoing local NOx emission reductions (Duncan et al., 2016); or the impacts of path averaging on MAX-DOAS retrievals. Although CalNex took place in the summer and our dataset spans all seasons, this is not a likely explanation for the aforementioned discrepancy, as summer NO2 LT-VCDs were typically lower than other months over the course of this study (Fig. 5). It should also be noted that our study period includes a time period encompassing COVID-19-related lockdowns that likely altered local NOx emissions. While our dataset does not include observations prior to the lockdown period, work by Goldberg et al. (2020) shows that TROPOMI NO2 columns decreased by 32.6 % in the Los Angeles area from 15 March to 30 April 2020 after accounting for differences in meteorology and solar geometry. Our observed diurnal cycle shows NO2 peaking for both quantities earlier in the day than observed by Kim et al. (2016), potentially due to differing local sources and traffic patterns in Whittier compared to Pasadena. The fraction of NO2 retrieved in the lowest 200 m peaks at approximately 40 % in the early morning before decreasing to around 20 % in the late morning and staying there through the afternoon (Fig. 6c). The median retrieved f200 was 26 %. These dynamics are consistent with the boundary layer dynamics typically observed in Southern California (Rahn and Mitchell, 2016).
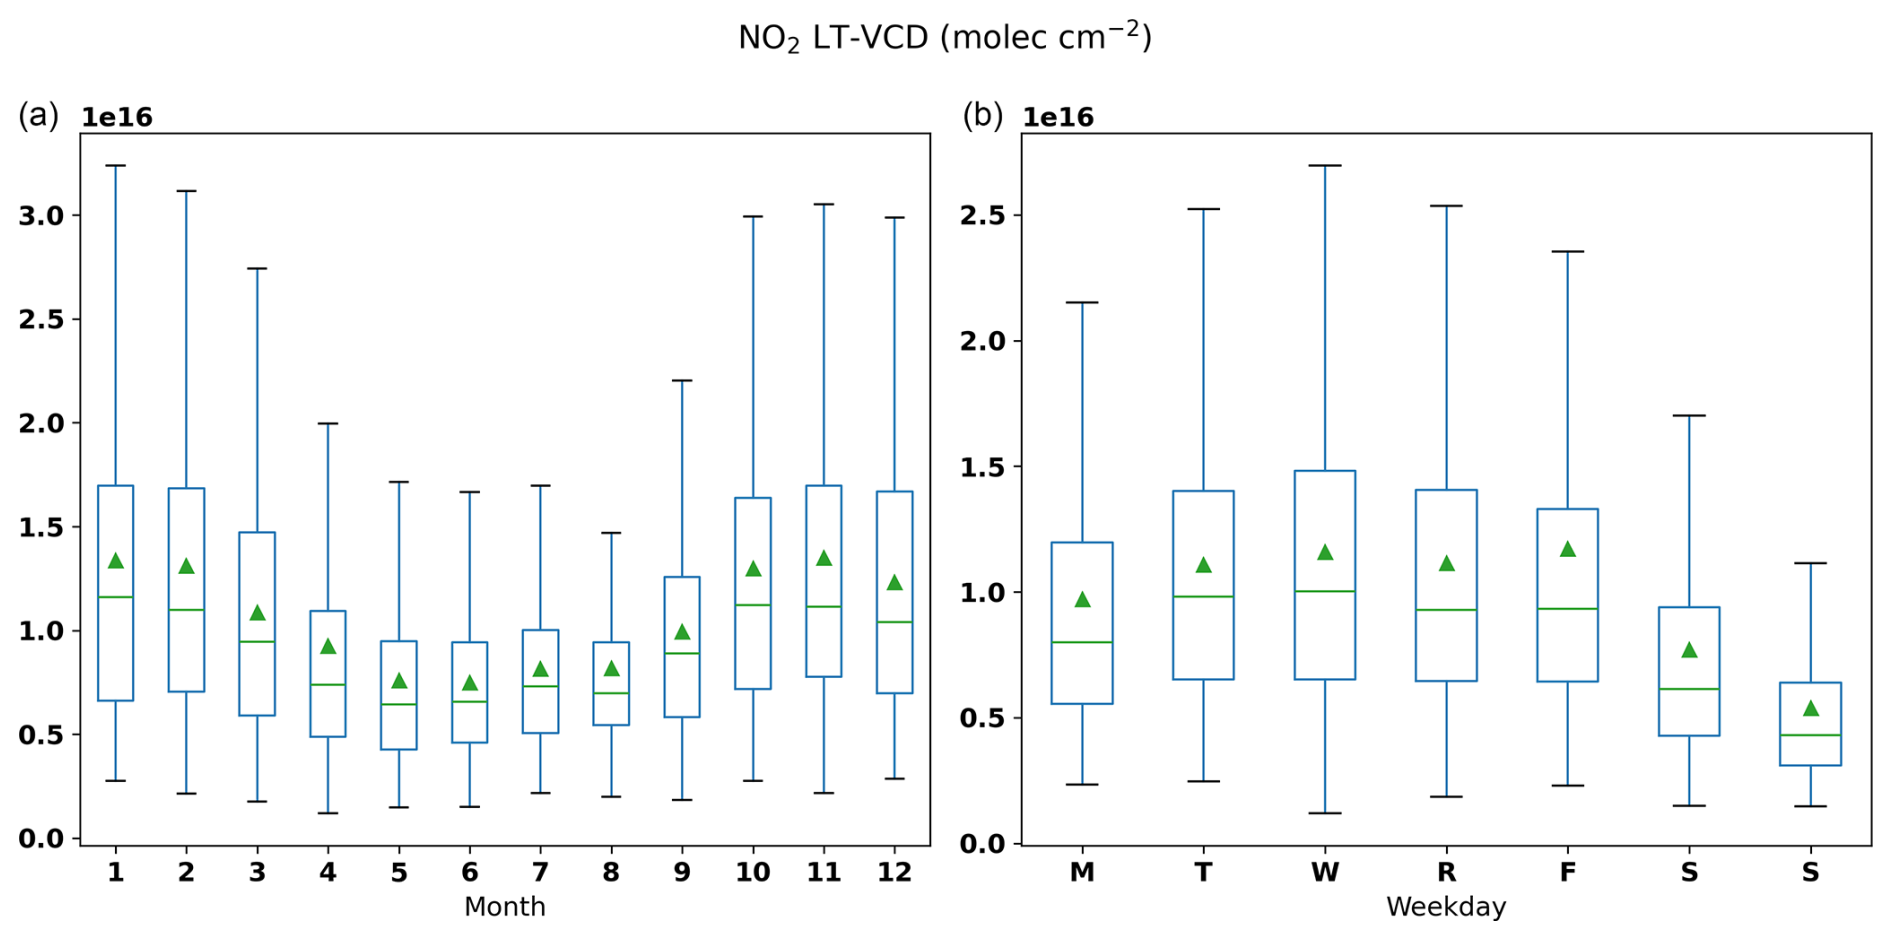
Figure 5Box-and-whisker plots show the seasonal cycle for NO2 LT-VCDs (a) and a clear weekend effect (b). For both plots, the box encompasses the inner quartiles, the green line shows the median, the green triangle shows the mean, and the whiskers show the 5th to 95th percentile range.
In contrast, HCHO columns are consistently more vertically distributed, with the fraction of HCHO at the surface being between 10 % and 20 % (Fig. 6c) and with a median of 15 %. This finding likely reflects the production of HCHO throughout the boundary layer, rather than just near the surface (Schroeder et al., 2017). The sea breeze circulation, which does impact Whittier, could also explain the vertical distribution of HCHO aloft (Souri et al., 2023b). HCHO LT-VCDs ranged between 1.6×10¹⁵ and 9.7×10¹⁶ molec. cm−2, with a median LT-VCD of 6.4×10¹⁵. Near-surface mole fractions ranged from near 0 to 14.9 nmol mol−1, with a median value of 1.9 nmol mol−1. Retrieved near-surface mole fractions also did not show any diurnal variability, with the median observations consistently being 2 nmol mol−1 (Fig. 6b) throughout the day. In contrast, median formaldehyde LT-VCDs increased throughout the day, peaking in the early afternoon (Fig. 6c), which has been seen in other HCHO column measurements with biogenic VOC sources (e.g., Ryan et al., 2020). Given the high temperatures and large amount of vegetation around the measurement site, it is likely that this peak in HCHO can be at least partially attributed to biogenic sources (e.g., Kaiser et al., 2015; Zhao et al., 2022; Chen et al., 2023). This peak in HCHO also coincides with the daily peak in median ozone mole fractions measured at the nearby CARB site in Pico Rivera.
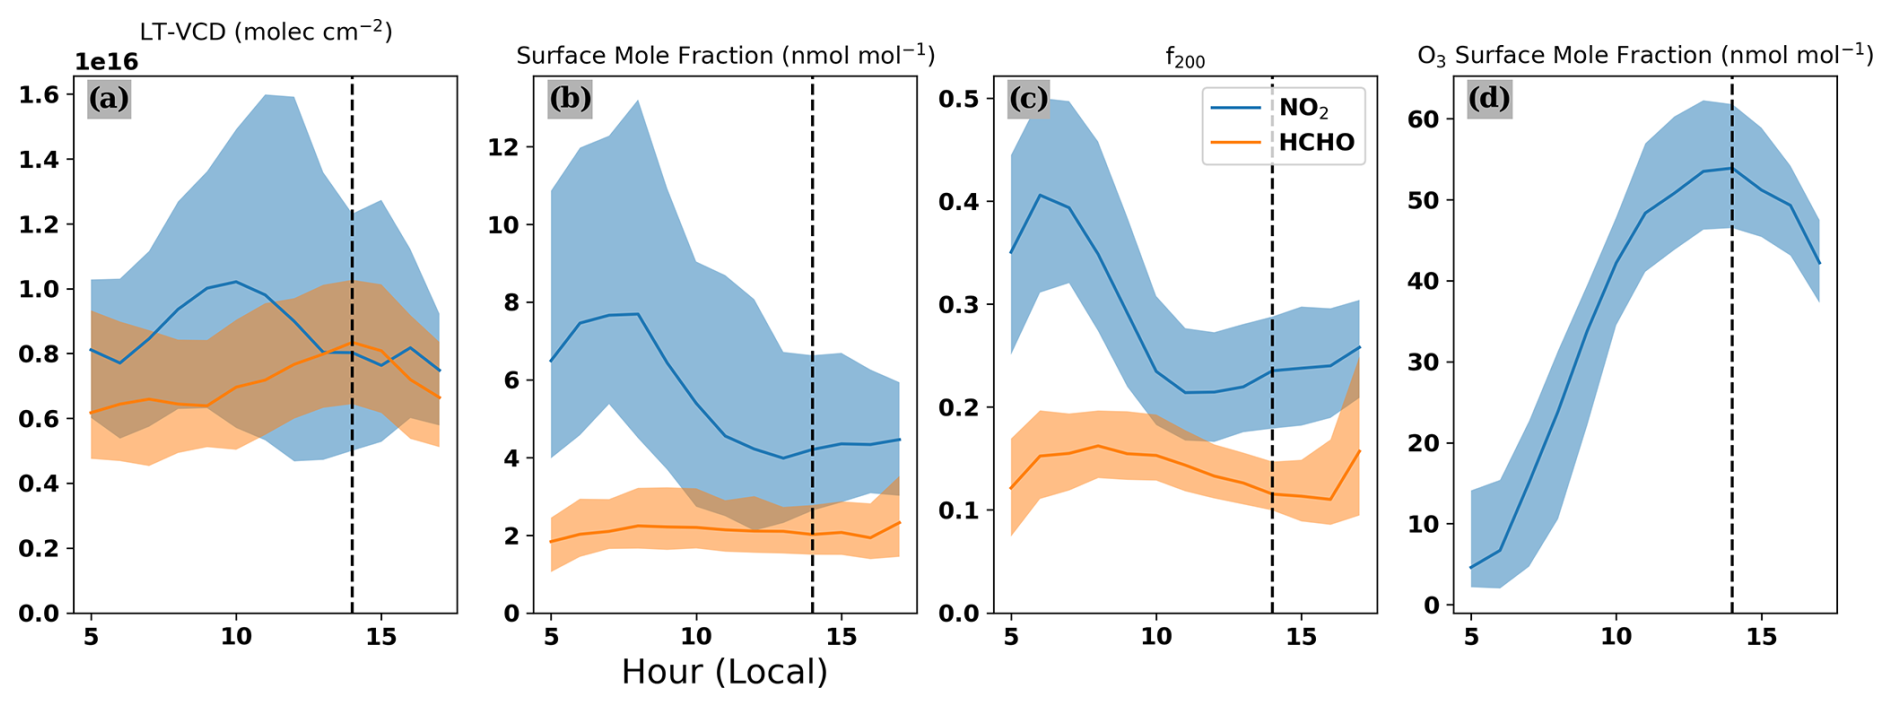
Figure 6Plots show the median observed values (solid line) as well as the inner quartile range (shaded regions) for NO2 (blue) and HCHO (orange) binned by the hour of the observation. From left to right, the plots show the lower-tropospheric vertical column density (a), the near-surface mole fraction (b), and the fraction of the retrieved column in the lowest 200 m of the atmosphere (f200) (c). The median time of peak ozone mole fractions observed at the Pico Rivera CARB site is denoted with a vertical dashed line. Panel (d) shows the average diurnal ozone cycle over the study period.
3.4 Examining ozone production chemistry with MAX-DOAS
Ozone formation is dependent on both VOCs and NOx (Sillman et al., 1990). Depending on the relative abundance of both quantities, ozone production can be characterized as being limited by NOx, where reductions in NOx emissions will be more effective at limiting ozone formation, or saturated with respect to NOx, where VOC emission reductions will be more effective at limiting ozone formation. Diagnosis of the ozone formation regime requires insights into the relative abundance of both VOCs and NOx. To obtain this information from remote-sensing measurements, formaldehyde and NO2 retrievals can be used (e.g., Martin et al., 2004).
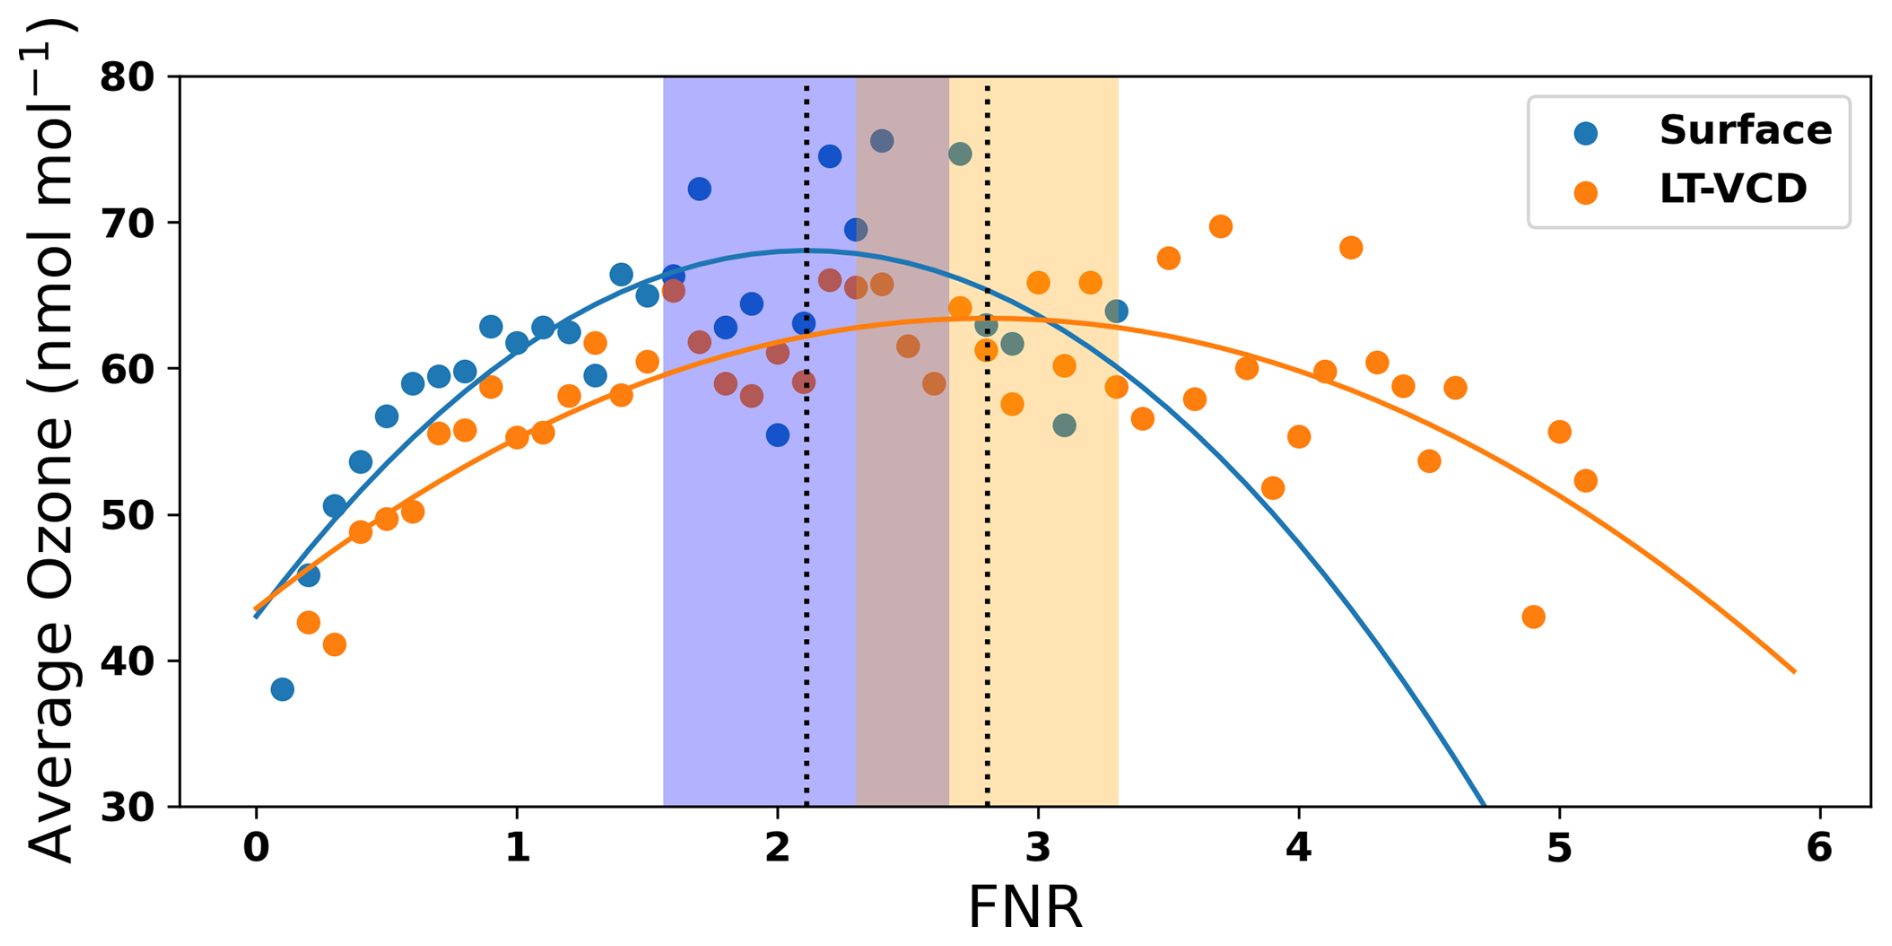
Figure 7Determination of ozone formation regimes from ground-based MAX-DOAS data. Ozone values binned by the surface FNR are shown in blue, while those binned by the LT-VCD FNR are shown in orange. Second-order polynomial fits are shown using solid lines, with the shaded region representing the uncertainty in the maximum value. Dashed vertical lines represent the maximum probability of an ozone exceedance as a function of FNR for both methods.
FNRs are commonly derived from satellite-based remote-sensing measurements to provide insights into regional-scale ozone production chemistry (e.g., Martin et al., 2004; Duncan et al., 2010; Jin et al., 2017, 2020; Souri et al., 2020). Comparisons of satellite-based FNRs with surface ozone mole fraction measurements during summer months (May–October) have been used to determine FNR values indicating a transition between NOx-limited and NOx-saturated ozone production (e.g., Jin et al., 2020).
To estimate threshold FNR values from MAX-DOAS measurements, we paired hourly averaged MAX-DOAS observations during all times that the temperature exceeded 25°C with ozone measurement data from the Pico Rivera CARB site. We then calculated the probability of the observed ozone exceeding the United States National Ambient Air Quality Standards value of 70 nmol mol−1 as a function of the FNR using both near-surface mole fractions and LT-VCDs, both of which are retrieved concurrently. For each method, the maximum probability of an ozone exceedance as a function of the FNR and its associated uncertainty was determined using a second-order polynomial fit, following the methods described in Jin et al. (2020). Figure 7 shows that FNR values derived from retrieved surface mole fractions are generally lower than those derived from LT-VCD measurements. This decrease in FNR values near the surface was also observed in an analysis of MAX-DOAS measurements in three Chinese cities (Hu et al., 2024), which also utilized vertically resolved ozone measurements to show an increasing frequency of NOx-limited ozone production as altitudes increased up to 1 km. The transition ranges in this work, determined from near-surface FNRs and LT-VCDs, have less spread than those observed in Hu et al. (2024), suggesting that there is less variation in ozone production with altitude in Whittier over this time period. The combination of ranges suggests that the range of FNR values indicating a transition between NOx-limited and NOx-saturated ozone production in Whittier is between 1.6 and 3.3 (Fig. 7). Restricting this analysis to the TROPOMI overpass time to facilitate comparisons with other satellite-based FNR measurements showed this transition to occur between FNR values of 0.7 and 3.4. Satellite-based estimates of threshold values of this ratio that would indicate a transition in the ozone formation chemistry regimes vary regionally, but they were found to be between 4 and 5 over the Los Angeles metropolitan area based on a study of 20 years of satellite-based FNR observations (Jin et al., 2020). The MAX-DOAS measurements in this study suggest that this transition between production regimes occurs at lower FNR values in Whittier than observed over Los Angeles generally.
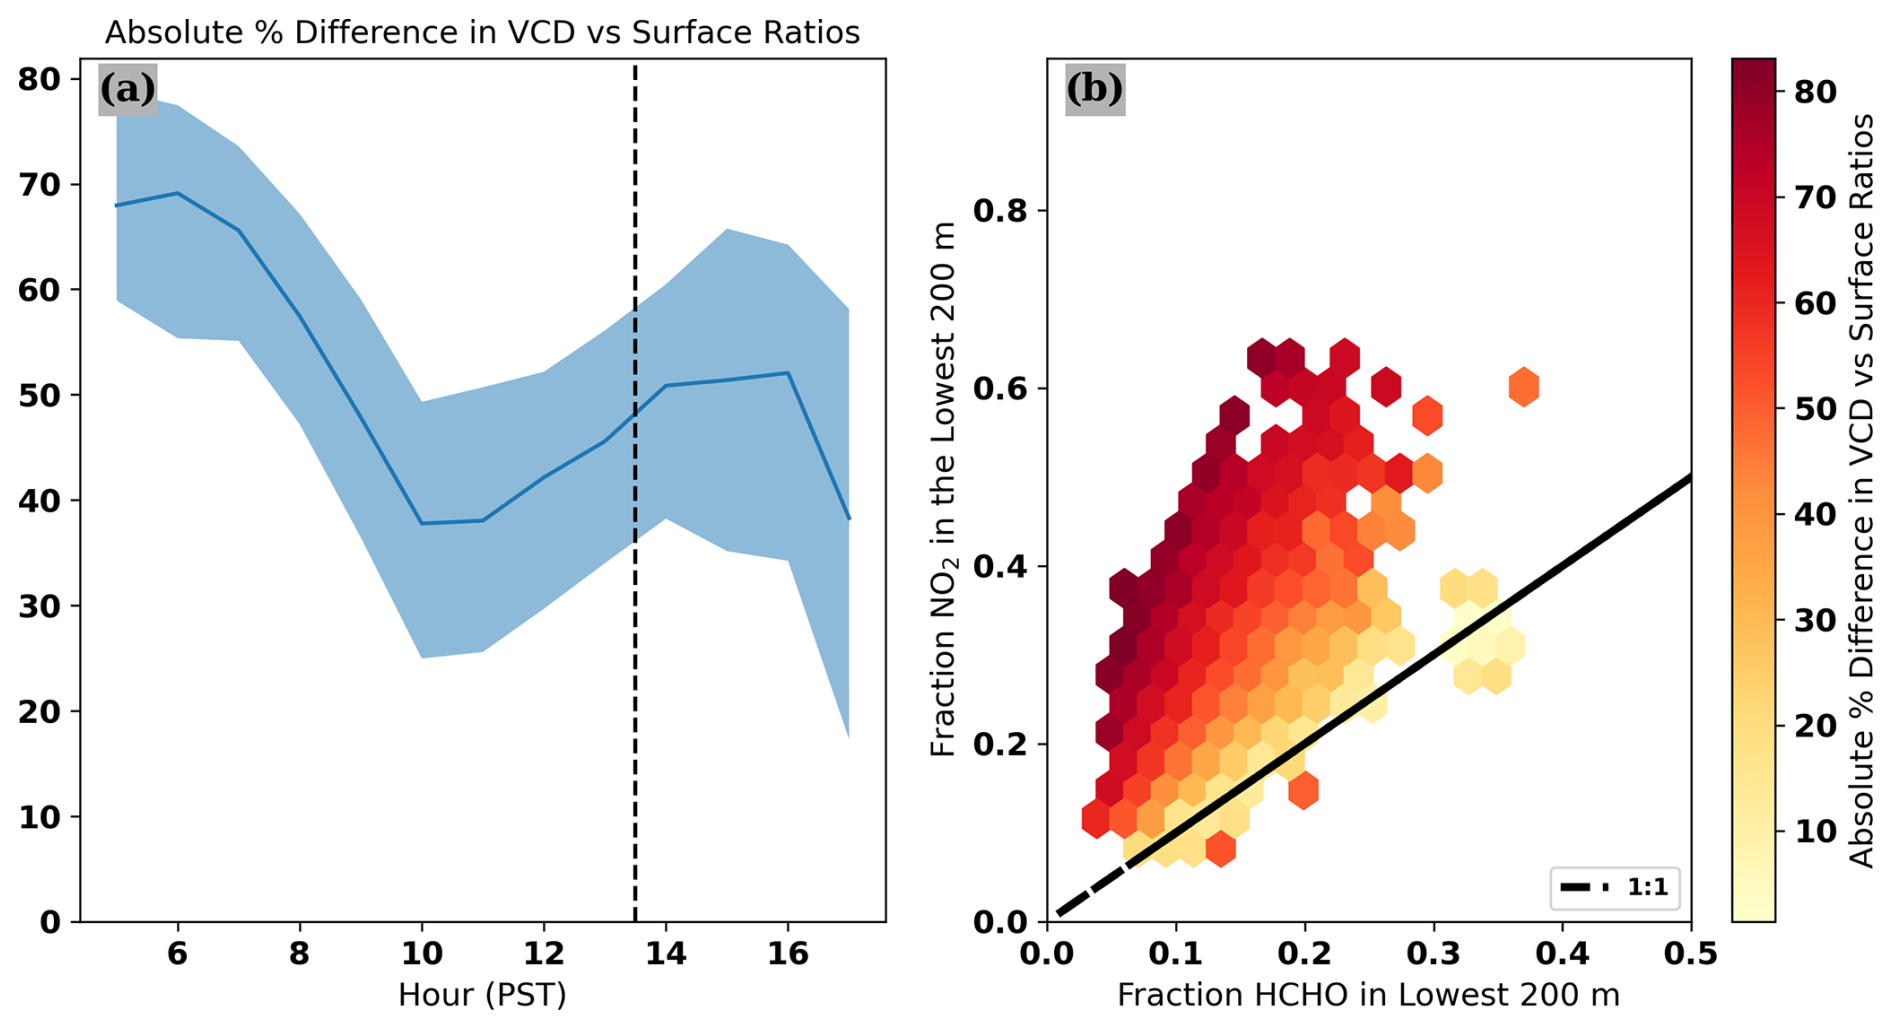
Figure 8Panel (a) shows the diurnal variation in the FNR difference expressed as a percentage calculated using surface-based quantities vs. column-based quantities. The solid line represents the median hourly observation, while the shaded region represents the inner quartiles. The TROPOMI overpass time is denoted with a vertical dashed line. Panel (b) shows a hexagonally binned scatterplot of the distribution of FNR differences as a function of the vertical distribution of the ozone precursor. Each hexagon represents a bin, with the color intensity indicating the average difference between the FNR near the surface and throughout the column within that region.
The differences between surface- and column-based FNR retrievals is most pronounced in the early morning and mid-afternoon, reflecting the diurnal variability in the vertical profiles of NO2 and HCHO (Fig. 8). Near-surface ozone exceedances are more likely when HCHO is enhanced (Fig. 9), and this leads to a disconnect between satellite-based observations, as HCHO profiles tend to have the bulk of the HCHO present aloft, away from the surface (Fig. 6). This variability in the HCHO vertical distribution drives the deviation between surface-based and column-based FNRs, potentially indicating a misdiagnosis of ozone production regimes based on satellite-based observations over Whittier, as suggested in Schroeder et al. (2017) and reflected in the relatively poor agreement of FNRs between satellite- and ground-based observations seen in this study (Fig. 4c). Large uncertainties in HCHO columns retrieved from TROPOMI (Fig. 4) likely also contribute to the poor agreement between TROPOMI and ground-based ratios, as seen in Souri et al. (2023a). The interpretations of these ratios is also complicated by the impacts of NOx on VOC oxidation, which impacts the formation of HCHO and complicates the use of HCHO as a VOC proxy (Chan Miller et al., 2017). During the study period, we observed that increases in ozone exceedance probability were driven by enhancements in HCHO regardless of the NO2 amount (Fig. 9).
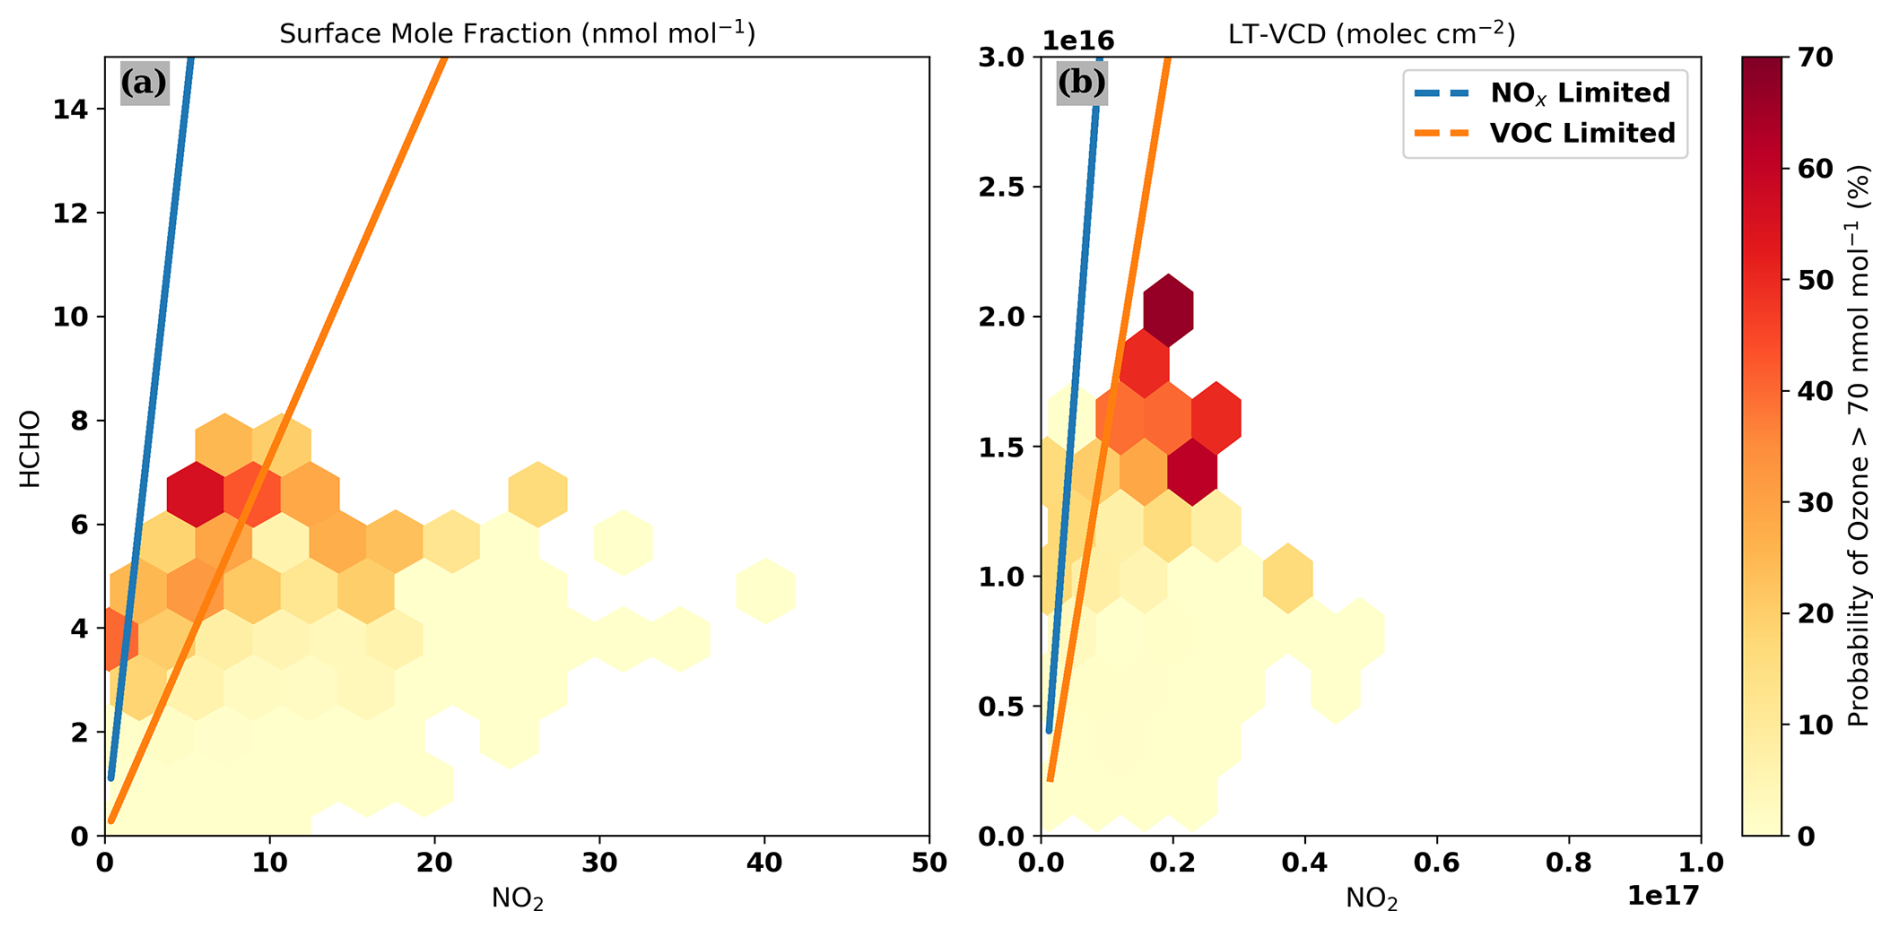
Figure 9Panel (a) shows a hexagonally binned scatterplot of the probability of an ozone observation exceeding 70 nmol mol−1 as a function of NO2 and HCHO near-surface mixing ratios. The blue and orange lines delineate the NOx-limited and NOx-saturated regimes derived in Fig. 7. Panel (b) shows a hexagonally binned scatterplot of the probability of an ozone observation exceeding 70 nmol mol−1 as a function of NO2 and HCHO LT-VCDs. The blue and orange lines delineate the NOx-limited and NOx-saturated regimes derived in Fig. 7.
For the first time, MAX-DOAS was used to retrieve the vertical distribution of the ozone precursors NO2 and HCHO over eastern Los Angeles. The retrieved LT-VCDs for NO2 are well correlated with satellite-based measurements from TROPOMI. Retrieved LT-VCDs for HCHO, while less well correlated than NO2, are consistent with prior comparisons and reinforce the need to improve HCHO retrievals from satellite-based measurements. While the vertical distribution of NO2 reflects increasing boundary layer height throughout the day, HCHO has a much more consistent vertical distribution, with 80 % of the column being present outside the lowest 200 m regardless of the amount. These diurnal variations in both column and vertical profiles complicate the interpretation of columns retrieved from geostationary satellite-based observations. As an example, the observed variability in vertical profiles can lead to differing diagnostics of ozone production via formaldehyde-to-NO2 ratios. Using MAX-DOAS retrievals, FNRs can be derived from both near-surface and column-based quantities. Comparison of both methods to observed ozone yields similar transition values from NOx-limited to NOx-saturated regimes, but the agreement between the two FNRs varies considerably throughout the day, reflecting diurnal variations in both the column and vertical distribution of both precursor species. These findings point to the need to consider the vertical distribution of NO2 and HCHO when interpreting FNRs derived from satellite-based measurements to accurately diagnose ozone production chemistry using geostationary satellite observations, particularly in the late afternoon, which has larger differences between surface- and column-based FNR and coincides with times when enhanced near-surface ozone mole fractions associated with adverse impacts on human health are most prevalent.
MAX-DOAS retrievals of NO2 and HCHO lower-tropospheric column densities and near-surface mole fractions are available at https://doi.org/10.5281/zenodo.11117573 (Peterson, 2024). Data from the Pico Rivera #2 surface monitoring station used in this paper are available from the CARB Air Quality and Meteorological Information System (http://www.arb.ca.gov/aqmis2/aqmis2. php, California Air Resources Board, 2025). Differential slant column densities are available from the corresponding author upon request.
PKP led data analysis, drafted the manuscript, and supervised all work done on the manuscript. EH and LT participated in data analysis. AD maintained the MAX-DOAS instrument during this study. All authors reviewed and contributed to the submitted manuscript.
The contact author has declared that none of the authors has any competing interests.
Publisher’s note: Copernicus Publications remains neutral with regard to jurisdictional claims made in the text, published maps, institutional affiliations, or any other geographical representation in this paper. While Copernicus Publications makes every effort to include appropriate place names, the final responsibility lies with the authors.
The authors gratefully acknowledge Jochen Stutz, for their efforts in establishing and maintaining the CalTech AERONET site, and Alexei Rozanov (from IUP Bremen), for providing the SCIATRAN radiative transfer code that serves as the forward model for the HEIPRO retrieval code. The authors thank the three anonymous reviewers, whose feedback at various stages greatly improved the resulting manuscript.
This research has been supported by the National Aeronautics and Space Administration Earth Sciences Division (grant no. 80NSSC22K1790). Lisa F. Hernandez was partially supported by a Whittier College Don '50 and Virginia Baudrand Fellowship in Chemistry.
This paper was edited by Jeffrey Geddes and reviewed by three anonymous referees.
California Air Resources Board: Air Quality and Meteorological Information System (AQMIS), California Air Resources Board [dataset], https://www.arb.ca.gov/aqmis2/aqmis2.php, last access: 7 April 2025. a
Chan, K. L., Wiegner, M., van Geffen, J., De Smedt, I., Alberti, C., Cheng, Z., Ye, S., and Wenig, M.: MAX-DOAS measurements of tropospheric NO2 and HCHO in Munich and the comparison to OMI and TROPOMI satellite observations, Atmos. Meas. Tech., 13, 4499–4520, https://doi.org/10.5194/amt-13-4499-2020, 2020. a, b
Chan Miller, C., Jacob, D. J., Marais, E. A., Yu, K., Travis, K. R., Kim, P. S., Fisher, J. A., Zhu, L., Wolfe, G. M., Hanisco, T. F., Keutsch, F. N., Kaiser, J., Min, K.-E., Brown, S. S., Washenfelder, R. A., González Abad, G., and Chance, K.: Glyoxal yield from isoprene oxidation and relation to formaldehyde: chemical mechanism, constraints from SENEX aircraft observations, and interpretation of OMI satellite data, Atmos. Chem. Phys., 17, 8725–8738, https://doi.org/10.5194/acp-17-8725-2017, 2017. a
Chen, Y., Liu, C., Su, W., Hu, Q., Zhang, C., Liu, H., and Yin, H.: Identification of Volatile Organic Compound Emissions from Anthropogenic and Biogenic Sources Based on Satellite Observation of Formaldehyde and Glyoxal, Sci. Total Environ., 859, 159997, https://doi.org/10.1016/j.scitotenv.2022.159997, 2023. a
Copernicus Sentinel-5P (processed by ESA): Copernicus Sentinel Data Processed by ESA, Koninklijk Nederlands Meteorologisch Instituut (KNMI) (2021), GES DISC Dataset: Sentinel-5P TROPOMI Tropospheric NO2 1-Orbit L2 5.5km x 3.5km (S5P_L2__NO2____HiR 2), Goddard Earth Sciences Data and Information Services Center (GES DISC) [data set], https://doi.org/10.5270/S5P-9bnp8q8, 2021. a
De Smedt, I., Pinardi, G., Vigouroux, C., Compernolle, S., Bais, A., Benavent, N., Boersma, F., Chan, K.-L., Donner, S., Eichmann, K.-U., Hedelt, P., Hendrick, F., Irie, H., Kumar, V., Lambert, J.-C., Langerock, B., Lerot, C., Liu, C., Loyola, D., Piters, A., Richter, A., Rivera Cárdenas, C., Romahn, F., Ryan, R. G., Sinha, V., Theys, N., Vlietinck, J., Wagner, T., Wang, T., Yu, H., and Van Roozendael, M.: Comparative assessment of TROPOMI and OMI formaldehyde observations and validation against MAX-DOAS network column measurements, Atmos. Chem. Phys., 21, 12561–12593, https://doi.org/10.5194/acp-21-12561-2021, 2021. a
Duncan, B. N., Yoshida, Y., Olson, J. R., Sillman, S., Martin, R. V., Lamsal, L., Hu, Y., Pickering, K. E., Retscher, C., Allen, D. J., and Crawford, J. H.: Application of OMI Observations to a Space-Based Indicator of NOx and VOC Controls on Surface Ozone Formation, Atmos. Environ., 44, 2213–2223, https://doi.org/10.1016/j.atmosenv.2010.03.010, 2010. a, b, c, d
Duncan, B. N., Lamsal, L. N., Thompson, A. M., Yoshida, Y., Lu, Z., Streets, D. G., Hurwitz, M. M., and Pickering, K. E.: A Space-Based, High-Resolution View of Notable Changes in Urban NOx Pollution around the World (2005–2014), J. Geophys. Res.-Atmos., 121, 976–996, https://doi.org/10.1002/2015JD024121, 2016. a
Esri: World Imagery – Overview, https://www.arcgis.com/home/item.html?id=10df2279f9684e4a9f6a7f08febac2a9 (last access: 7 April 2025), 2024. a
European Space Agency: TROPOMI Level 2 Formaldehyde, https://doi.org/10.5270/S5P-vg1i7t0, 2020. a
Fayt, C., De Smedt, I., Letocart, V., Merlaud, A., Pinardi, G., Van Roozendael, M., and Roozendael, M. V. A. N.: QDOAS Software User Manual, Belgian Institute for Space Aeronomy, 2011. a
Frieß, U., Monks, P. S., Remedios, J. J., Rozanov, A., Sinreich, R., Wagner, T., and Platt, U.: MAX-DOAS O 4 Measurements: A New Technique to Derive Information on Atmospheric Aerosols: 2. Modeling Studies, J. Geophys. Res., 111, D14203, https://doi.org/10.1029/2005JD006618, 2006. a
Goldberg, D. L., Anenberg, S. C., Griffin, D., McLinden, C. A., Lu, Z., and Streets, D. G.: Disentangling the Impact of the COVID-19 Lockdowns on Urban NO2 from Natural Variability, Geophys. Res. Lett., 47, e2020GL089269, https://doi.org/10.1029/2020GL089269, 2020. a
Haagen-Smit, A. J.: Chemistry and Physiology of Los Angeles Smog, Indust. Eng. Chem., 44, 1342–1346, https://doi.org/10.1021/ie50510a045, 1952. a
Hering, S. V. and Blumenthal, D. L.: Southern California Air Quality Study (SCAQS) Description of Measurement Activities, Final Report, https://www.osti.gov/biblio/6971422 (last access: 16 May 2024), 1989. a
Hönninger, G., von Friedeburg, C., and Platt, U.: Multi axis differential optical absorption spectroscopy (MAX-DOAS), Atmos. Chem. Phys., 4, 231–254, https://doi.org/10.5194/acp-4-231-2004, 2004. a
Hu, Q., Ji, X., Hong, Q., Li, J., Li, Q., Ou, J., Liu, H., Xing, C., Tan, W., Chen, J., Chang, B., and Liu, C.: Vertical Evolution of Ozone Formation Sensitivity Based on Synchronous Vertical Observations of Ozone and Proxies for Its Precursors: Implications for Ozone Pollution Prevention Strategies, Environ. Sci. Technol., 58, 4291–4301, https://doi.org/10.1021/acs.est.4c00637, 2024. a, b
Irie, H., Takashima, H., Kanaya, Y., Boersma, K. F., Gast, L., Wittrock, F., Brunner, D., Zhou, Y., and Van Roozendael, M.: Eight-component retrievals from ground-based MAX-DOAS observations, Atmos. Meas. Tech., 4, 1027–1044, https://doi.org/10.5194/amt-4-1027-2011, 2011. a
Jacob, D. J., Crawford, J. H., Maring, H., Clarke, A. D., Dibb, J. E., Emmons, L. K., Ferrare, R. A., Hostetler, C. A., Russell, P. B., Singh, H. B., Thompson, A. M., Shaw, G. E., McCauley, E., Pederson, J. R., and Fisher, J. A.: The Arctic Research of the Composition of the Troposphere from Aircraft and Satellites (ARCTAS) mission: design, execution, and first results, Atmos. Chem. Phys., 10, 5191–5212, https://doi.org/10.5194/acp-10-5191-2010, 2010. a
Jin, J., Ma, J., Lin, W., Zhao, H., Shaiganfar, R., Beirle, S., and Wagner, T.: MAX-DOAS Measurements and Satellite Validation of Tropospheric NO2 and SO2 Vertical Column Densities at a Rural Site of North China, Atmos. Environ., 133, 12–25, https://doi.org/10.1016/j.atmosenv.2016.03.031, 2016. a
Jin, X., Fiore, A. M., Murray, L. T., Valin, L. C., Lamsal, L. N., Duncan, B., Folkert Boersma, K., De Smedt, I., Abad, G. G., Chance, K., and Tonnesen, G. S.: Evaluating a Space-Based Indicator of Surface Ozone-NOx-VOC Sensitivity Over Midlatitude Source Regions and Application to Decadal Trends, J. Geophys. Res.-Atmos., 122, 10439–10461, https://doi.org/10.1002/2017JD026720, 2017. a, b, c
Jin, X., Fiore, A., Boersma, K. F., De Smedt, I., and Valin, L.: Inferring Changes in Summertime Surface Ozone-NOx-VOC Chemistry over U.S. Urban Areas from Two Decades of Satellite and Ground-Based Observations, Environ. Sci. Technol., 54, 6518–6529, https://doi.org/10.1021/acs.est.9b07785, 2020. a, b, c, d, e, f
Kaiser, J., Wolfe, G. M., Min, K. E., Brown, S. S., Miller, C. C., Jacob, D. J., deGouw, J. A., Graus, M., Hanisco, T. F., Holloway, J., Peischl, J., Pollack, I. B., Ryerson, T. B., Warneke, C., Washenfelder, R. A., and Keutsch, F. N.: Reassessing the ratio of glyoxal to formaldehyde as an indicator of hydrocarbon precursor speciation, Atmos. Chem. Phys., 15, 7571–7583, https://doi.org/10.5194/acp-15-7571-2015, 2015. a
Kim, S.-W., McDonald, B. C., Baidar, S., Brown, S. S., Dube, B., Ferrare, R. A., Frost, G. J., Harley, R. A., Holloway, J. S., Lee, H.-J., McKeen, S. A., Neuman, J. A., Nowak, J. B., Oetjen, H., Ortega, I., Pollack, I. B., Roberts, J. M., Ryerson, T. B., Scarino, A. J., Senff, C. J., Thalman, R., Trainer, M., Volkamer, R., Wagner, N., Washenfelder, R. A., Waxman, E., and Young, C. J.: Modeling the Weekly Cycle of NOx and CO Emissions and Their Impacts on O3 in the Los Angeles-South Coast Air Basin during the CalNex 2010 Field Campaign, J. Geophys. Res.-Atmos., 121, 1340–1360, https://doi.org/10.1002/2015JD024292, 2016. a, b
Kreher, K., Van Roozendael, M., Hendrick, F., Apituley, A., Dimitropoulou, E., Frieß, U., Richter, A., Wagner, T., Lampel, J., Abuhassan, N., Ang, L., Anguas, M., Bais, A., Benavent, N., Bösch, T., Bognar, K., Borovski, A., Bruchkouski, I., Cede, A., Chan, K. L., Donner, S., Drosoglou, T., Fayt, C., Finkenzeller, H., Garcia-Nieto, D., Gielen, C., Gómez-Martín, L., Hao, N., Henzing, B., Herman, J. R., Hermans, C., Hoque, S., Irie, H., Jin, J., Johnston, P., Khayyam Butt, J., Khokhar, F., Koenig, T. K., Kuhn, J., Kumar, V., Liu, C., Ma, J., Merlaud, A., Mishra, A. K., Müller, M., Navarro-Comas, M., Ostendorf, M., Pazmino, A., Peters, E., Pinardi, G., Pinharanda, M., Piters, A., Platt, U., Postylyakov, O., Prados-Roman, C., Puentedura, O., Querel, R., Saiz-Lopez, A., Schönhardt, A., Schreier, S. F., Seyler, A., Sinha, V., Spinei, E., Strong, K., Tack, F., Tian, X., Tiefengraber, M., Tirpitz, J.-L., van Gent, J., Volkamer, R., Vrekoussis, M., Wang, S., Wang, Z., Wenig, M., Wittrock, F., Xie, P. H., Xu, J., Yela, M., Zhang, C., and Zhao, X.: Intercomparison of NO2, O4, O3 and HCHO slant column measurements by MAX-DOAS and zenith-sky UV–visible spectrometers during CINDI-2, Atmos. Meas. Tech., 13, 2169–2208, https://doi.org/10.5194/amt-13-2169-2020, 2020. a, b, c
Martin, R. V., Fiore, A. M., and Van Donkelaar, A.: Space-Based Diagnosis of Surface Ozone Sensitivity to Anthropogenic Emissions, Geophys. Res. Lett., 31, L06120, https://doi.org/10.1029/2004GL019416, 2004. a, b, c, d
Millet, D. B., Jacob, D. J., Turquety, S., Hudman, R. C., Wu, S., Fried, A., Walega, J., Heikes, B. G., Blake, D. R., Singh, H. B., Anderson, B. E., and Clarke, A. D.: Formaldehyde Distribution over North America: Implications for Satellite Retrievals of Formaldehyde Columns and Isoprene Emission, J. Geophys. Res.-Atmos., 111, D24S02, https://doi.org/10.1029/2005JD006853, 2006. a
Nussbaumer, C. M., Place, B. K., Zhu, Q., Pfannerstill, E. Y., Wooldridge, P., Schulze, B. C., Arata, C., Ward, R., Bucholtz, A., Seinfeld, J. H., Goldstein, A. H., and Cohen, R. C.: Measurement report: Airborne measurements of NOx fluxes over Los Angeles during the RECAP-CA 2021 campaign, Atmos. Chem. Phys., 23, 13015–13028, https://doi.org/10.5194/acp-23-13015-2023, 2023. a
Payne, V. H., Clough, S. A., Shephard, M. W., Nassar, R., and Logan, J. A.: Information-Centered Representation of Retrievals with Limited Degrees of Freedom for Signal: Application to Methane from the Tropospheric Emission Spectrometer, J. Geophys. Res., 114, D10307, https://doi.org/10.1029/2008JD010155, 2009. a
Peterson, P. K.: Whittier_CH2O_NO2_MAXDOAS_20200326, Zenodo [data set], https://doi.org/10.5281/zenodo.11117573, 2024. a
Peterson, P. K., Simpson, W. R., Pratt, K. A., Shepson, P. B., Frieß, U., Zielcke, J., Platt, U., Walsh, S. J., and Nghiem, S. V.: Dependence of the vertical distribution of bromine monoxide in the lower troposphere on meteorological factors such as wind speed and stability, Atmos. Chem. Phys., 15, 2119–2137, https://doi.org/10.5194/acp-15-2119-2015, 2015. a, b, c
Pinardi, G., Van Roozendael, M., Hendrick, F., Theys, N., Abuhassan, N., Bais, A., Boersma, F., Cede, A., Chong, J., Donner, S., Drosoglou, T., Dzhola, A., Eskes, H., Frieß, U., Granville, J., Herman, J. R., Holla, R., Hovila, J., Irie, H., Kanaya, Y., Karagkiozidis, D., Kouremeti, N., Lambert, J.-C., Ma, J., Peters, E., Piters, A., Postylyakov, O., Richter, A., Remmers, J., Takashima, H., Tiefengraber, M., Valks, P., Vlemmix, T., Wagner, T., and Wittrock, F.: Validation of tropospheric NO2 column measurements of GOME-2A and OMI using MAX-DOAS and direct sun network observations, Atmos. Meas. Tech., 13, 6141–6174, https://doi.org/10.5194/amt-13-6141-2020, 2020. a
Pusede, S. E., Steiner, A. L., and Cohen, R. C.: Temperature and Recent Trends in the Chemistry of Continental Surface Ozone, Chem. Rev., 115, 3898–3918, https://doi.org/10.1021/cr5006815, 2015. a
Rahn, D. A. and Mitchell, C. J.: Diurnal Climatology of the Boundary Layer in Southern California Using AMDAR Temperature and Wind Profiles, J. Appl. Meteorol. Clim., 55, 1123–1137, https://doi.org/10.1175/JAMC-D-15-0234.1, 2016. a
Rodgers, C. D.: Inverse Methods For Atmospheric Sounding: Theory and Practice, World Scientific, Singapore, ISBN 978-9810227401, 2000. a
Rozanov, a., Rozanov, V., Buchwitz, M., Kokhanovsky, A., and Burrows, J. P.: SCIATRAN 2.0 – A New Radiative Transfer Model for Geophysical Applications in the 175–2400 Nm Spectral Region, Adv. Space Res., 36, 1015–1019, https://doi.org/10.1016/j.asr.2005.03.012, 2005. a
Ryan, R. G., Rhodes, S., Tully, M., and Schofield, R.: Surface Ozone Exceedances in Melbourne, Australia Are Shown to Be under NOx Control, as Demonstrated Using Formaldehyde:NO2 and Glyoxal:Formaldehyde Ratios, Sci. Total Environ., 749, 141460, https://doi.org/10.1016/j.scitotenv.2020.141460, 2020. a
Ryan, R. G., Marais, E. A., Gershenson-Smith, E., Ramsay, R., Muller, J.-P., Tirpitz, J.-L., and Frieß, U.: Measurement report: MAX-DOAS measurements characterise Central London ozone pollution episodes during 2022 heatwaves, Atmos. Chem. Phys., 23, 7121–7139, https://doi.org/10.5194/acp-23-7121-2023, 2023. a, b
Ryerson, T. B., Andrews, A. E., Angevine, W. M., Bates, T. S., Brock, C. A., Cairns, B., Cohen, R. C., Cooper, O. R., De Gouw, J. A., Fehsenfeld, F. C., Ferrare, R. A., Fischer, M. L., Flagan, R. C., Goldstein, A. H., Hair, J. W., Hardesty, R. M., Hostetler, C. A., Jimenez, J. L., Langford, A. O., McCauley, E., McKeen, S. A., Molina, L. T., Nenes, A., Oltmans, S. J., Parrish, D. D., Pederson, J. R., Pierce, R. B., Prather, K., Quinn, P. K., Seinfeld, J. H., Senff, C. J., Sorooshian, A., Stutz, J., Surratt, J. D., Trainer, M., Volkamer, R., Williams, E. J., and Wofsy, S. C.: The 2010 California Research at the Nexus of Air Quality and Climate Change (CalNex) Field Study, J. Geophys. Res.-Atmos., 118, 5830–5866, https://doi.org/10.1002/jgrd.50331, 2013. a
Schroeder, J. R., Crawford, J. H., Fried, A., Walega, J., Weinheimer, A., Wisthaler, A., Müller, M., Mikoviny, T., Chen, G., Shook, M., Blake, D. R., and Tonnesen, G. S.: New Insights into the Column CH2 O/NO2 Ratio as an Indicator of near-Surface Ozone Sensitivity, J. Geophys. Res.-Atmos., 122, 8885–8907, https://doi.org/10.1002/2017JD026781, 2017. a, b, c, d
Sillman, S., Logan, J. A., and Wofsy, S. C.: The Sensitivity of Ozone to Nitrogen Oxides and Hydrocarbons in Regional Ozone Episodes, J. Geophys. Res., 95, 1837, https://doi.org/10.1029/JD095iD02p01837, 1990. a, b
Souri, A. H., Nowlan, C. R., Wolfe, G. M., Lamsal, L. N., Chan Miller, C. E., Abad, G. G., Janz, S. J., Fried, A., Blake, D. R., Weinheimer, A. J., Diskin, G. S., Liu, X., and Chance, K.: Revisiting the Effectiveness of HCHO/NO2 Ratios for Inferring Ozone Sensitivity to Its Precursors Using High Resolution Airborne Remote Sensing Observations in a High Ozone Episode during the KORUS-AQ Campaign, Atmos. Environ., 224, 117341, https://doi.org/10.1016/j.atmosenv.2020.117341, 2020. a, b, c
Souri, A. H., Johnson, M. S., Wolfe, G. M., Crawford, J. H., Fried, A., Wisthaler, A., Brune, W. H., Blake, D. R., Weinheimer, A. J., Verhoelst, T., Compernolle, S., Pinardi, G., Vigouroux, C., Langerock, B., Choi, S., Lamsal, L., Zhu, L., Sun, S., Cohen, R. C., Min, K.-E., Cho, C., Philip, S., Liu, X., and Chance, K.: Characterization of errors in satellite-based HCHO/NO2 tropospheric column ratios with respect to chemistry, column-to-PBL translation, spatial representation, and retrieval uncertainties, Atmos. Chem. Phys., 23, 1963–1986, https://doi.org/10.5194/acp-23-1963-2023, 2023a. a
Souri, A. H., Kumar, R., Chong, H., Golbazi, M., Knowland, K. E., Geddes, J., and Johnson, M. S.: Decoupling in the Vertical Shape of HCHO during a Sea Breeze Event: The Effect on Trace Gas Satellite Retrievals and Column-to-Surface Translation, Atmos. Environ., 309, 119929, https://doi.org/10.1016/j.atmosenv.2023.119929, 2023b. a, b
Thompson, J. E., Hayes, P. L., Jimenez, J. L., Adachi, K., Zhang, X., Liu, J., Weber, R. J., and Buseck, P. R.: Aerosol Optical Properties at Pasadena, CA during CalNex 2010, Atmos. Environ., 55, 190–200, https://doi.org/10.1016/j.atmosenv.2012.03.011, 2012. a
Wagner, T., Dix, B., Friedeburg, C. V., Frieß, U., Sanghavi, S., Sinreich, R., and Platt, U.: MAX-DOAS O4 Measurements: A New Technique to Derive Information on Atmospheric Aerosols-Principles and Information Content, J. Geophys. Res.-Atmos., 109, D22205, https://doi.org/10.1029/2004JD004904, 2004. a
Wagner, T., Beirle, S., Remmers, J., Shaiganfar, R., and Wang, Y.: Absolute calibration of the colour index and O4 absorption derived from Multi AXis (MAX-)DOAS measurements and their application to a standardised cloud classification algorithm, Atmos. Meas. Tech., 9, 4803–4823, https://doi.org/10.5194/amt-9-4803-2016, 2016. a
Wang, Y., Lampel, J., Xie, P., Beirle, S., Li, A., Wu, D., and Wagner, T.: Ground-based MAX-DOAS observations of tropospheric aerosols, NO2, SO2 and HCHO in Wuxi, China, from 2011 to 2014, Atmos. Chem. Phys., 17, 2189–2215, https://doi.org/10.5194/acp-17-2189-2017, 2017. a
Warneke, C., Veres, P., Holloway, J. S., Stutz, J., Tsai, C., Alvarez, S., Rappenglueck, B., Fehsenfeld, F. C., Graus, M., Gilman, J. B., and de Gouw, J. A.: Airborne formaldehyde measurements using PTR-MS: calibration, humidity dependence, inter-comparison and initial results, Atmos. Meas. Tech., 4, 2345–2358, https://doi.org/10.5194/amt-4-2345-2011, 2011. a
Yilmaz, S.: Retrieval of Atmospheric Aerosol and Trace Gas Vertical Profiles Using Multi-Axis Differential Optical Absorption Spectroscopy, Ph.D. thesis, University of Heidelberg, https://doi.org/10.11588/heidok.00013128, 2012. a
Yombo Phaka, R., Merlaud, A., Pinardi, G., Friedrich, M. M., Van Roozendael, M., Müller, J.-F., Stavrakou, T., De Smedt, I., Hendrick, F., Dimitropoulou, E., Bopili Mbotia Lepiba, R., Phuku Phuati, E., Djibi, B. L., Jacobs, L., Fayt, C., Mbungu Tsumbu, J.-P., and Mahieu, E.: Ground-based Multi-AXis Differential Optical Absorption Spectroscopy (MAX-DOAS) observations of NO2 and H2CO at Kinshasa and comparisons with TROPOMI observations, Atmos. Meas. Tech., 16, 5029–5050, https://doi.org/10.5194/amt-16-5029-2023, 2023. a
Zhao, T., Mao, J., Simpson, W. R., De Smedt, I., Zhu, L., Hanisco, T. F., Wolfe, G. M., St. Clair, J. M., González Abad, G., Nowlan, C. R., Barletta, B., Meinardi, S., Blake, D. R., Apel, E. C., and Hornbrook, R. S.: Source and variability of formaldehyde (HCHO) at northern high latitudes: an integrated satellite, aircraft, and model study, Atmos. Chem. Phys., 22, 7163–7178, https://doi.org/10.5194/acp-22-7163-2022, 2022. a, b