the Creative Commons Attribution 4.0 License.
the Creative Commons Attribution 4.0 License.
 | 22 Jul 2025
Multi-year black carbon observations and modeling close to the largest gas flaring and wildfire regions in the Western Siberian Arctic
Olga B. Popovicheva
Marina A. Chichaeva
Nikolaos Evangeliou
Sabine Eckhardt
Evangelia Diapouli
Nikolay S. Kasimov
The influence of aerosols on the Arctic system remains associated with significant uncertainties, particularly concerning black carbon (BC). The polar aerosol station “Island Bely” (IBS), located in the Western Siberian Arctic, was established to enhance aerosol monitoring. Continuous measurements from 2019 to 2022 revealed the long-term effects of light-absorbing carbon. During the cold period, the annual average light-absorption coefficient was 0.7 ± 0.7 Mm−1, decreasing by 2–3 times during the warm period. The interannual mean showed a peak in February (0.9 ± 0.8 Mm−1) then 10 times the lower minimum in June and exhibited high variability in August (0.7 ± 2.2 Mm−1). An increase of up to 1.5 at shorter wavelengths from April to September suggests contribution from brown carbon (BrC). The annual mean equivalent black carbon (eBC) demonstrated considerable interannual variability, with the lowest in 2020 (24 ± 29 ng m−3). Significant difference was observed between Arctic haze and Siberian wildfire periods, with record-high pollution levels in February 2022 (110 ± 70 ng m−3) and August 2021 (83 ± 249 ng m−3). Anthropogenic BC contributed 83 % to the total for the entire study period, and gas flaring, domestic combustion, transportation, and industrial emissions dominated. During the cold season, > 90 % of surface BC was attributed to anthropogenic sources, mainly gas flaring. In contrast, during the warm period, Siberian wildfires contributed to BC concentrations by 48 %. In August 2021, intense smoke from Yakutian wildfires was transported at high altitudes during the region's worst fire season in 40 years.
- Article
(5581 KB) - Full-text XML
-
Supplement
(2627 KB) - BibTeX
- EndNote


Multiple socio-economic drivers and feedbacks, including air pollution (Arnold et al., 2016), influence the natural and human environment of the Arctic. Over the last few decades, the Arctic warmed more than 3 times faster than the global average (AMAP, 2021). The pronounced rapid changes affect atmospheric transport and aerosol relative source contributions (Heslin-Rees et al., 2020). Drier conditions and warmer temperatures are main causes of enhanced fire activity. Boreal forest fires have become more frequent and severe (Rogers et al., 2020), especially in central Siberia and North America (Kasischke and Turetsky, 2006; Kharuk and Ponomarev, 2017; Veraverbeke et al., 2017). Widespread smoke plumes, particularly in Siberia, lead to substantial deterioration of air quality increasing fine particulate matter (Silver et al., 2024).
Interactions between aerosol and different cloud types, available solar radiation, sea ice, surface albedo, Arctic and lower-latitude removal processes, and atmospheric transport patterns affect Arctic pollution and its climate impacts (Willis et al., 2018), such as Arctic haze (namely the persistent Arctic air pollution during late winter and early spring). To understand such phenomena and thus reduce their impact, there is a clear need for comprehensive studies of the climate-relevant aerosol processes that occur in the Arctic. A species of major concern is black carbon (BC), a short-lived climate forcer (Schmale et al., 2021). BC is emitted from the incomplete combustion of fossil fuel and biomass; it is defined as the portion of carbonaceous aerosols which absorb strongly across the entire climate-relevant wavelength region of the solar spectrum (i.e., IR–VIS–UV). BC contributes to Arctic warming in multiple ways (e.g., Lee et al., 2013), including the darkening effect of BC deposited on snow and ice (Flanner, 2013). The Arctic Monitoring and Assessment Progamme (AMAP) (2015) reports that the Arctic equilibrium temperature responses are (+0.4 °C) due to forcing from atmospheric BC and (+0.22 °C) due to snow BC.
At present, the largest uncertainties when assessing aerosol impact on the climate are attributed to BC (AMAP, 2021). To follow up on this, BC measurements are taken at various polar regions in the European, Siberian, and Canadian Arctic (Stone et al., 2014; Yttri et al., 2014; Popovicheva et al., 2019a; Winiger et al., 2019; Manousakas et al., 2020; Gilardoni et al., 2023). For instance, Stathopoulos et al. (2021) reported on the long-term impact of light-absorbing carbon in the high Arctic by analyzing 15 years of data from the Zeppelin station (Svalbard), while Schmale et al. (2022) studied the status of the Arctic haze peak concentrations at 10 Arctic observatories.
There is a large diversity in the magnitude and variability of aerosol optical properties, reflecting differences in sources throughout the Arctic (Schmeisser et al., 2018). BC measurements are based on various instrumentations and methods that increase uncertainty (Sharma et al., 2017; Asmi et al., 2021; Ohata et al., 2021). The optical properties of BC have been previously evaluated against direct mass measurement techniques (Sharma et al., 2004; Eleftheriadis et al., 2009; Yttri et al., 2024). The conversion of light attenuation to absorbing carbon mass concentration is performed by the mass-specific absorption coefficient (MAC) (Petzold et al., 2013), which is highly influenced by the aerosol mixing state and non-BC light-absorbing species such as organic matter and mineral dust (Zanatta et al., 2018). The MAC varies in time and space depending on sources and transformations during transport (Bond et al., 2013; Chen et al., 2023). Therefore, it is crucial to quantify the contributions of non-BC components and aging processes in order to determine the actual MAC value experimentally at each site (Singh et al., 2024).
The absorption Ångström exponent (AAE), defined as the relative wavelength dependence of light absorption by BC versus other light-absorbing constituents, also differs from site to site (Schmeisser et al., 2018). A fraction of organic aerosol, the brown carbon (BrC), increases the aerosol-absorbing properties at short UV–VIS wavelengths (Sandradewi et al., 2008; Grange et al., 2020; Helin et al., 2021) and dominates absorption during wildfire seasons (Bali et al., 2024). BrC originates mainly from biomass burning (BB) and can impose a strong warming effect in the Arctic, especially in the summertime (Yue et al., 2022).
Despite its remoteness, the Arctic is one of the main receptors of anthropogenic air pollutant emissions from the Northern Hemisphere (Stohl et al., 2013). BC trends and seasonality at three Arctic sites, Alert (Canadian Arctic); Barrow/Utqiaġvik (American Arctic); and Zeppelin, Ny-Ålesund (European Arctic), reveal a negative trend of 40 % over 16 years, due to anthropogenic emission reductions (Sharma et al., 2013). The recent increase in fires and their earlier starts, due to the ongoing warming, have made wildfires in northern Eurasia a significant source of Arctic BC (Evangeliou et al., 2016). Fossil fuel combustion is the major source of BC in the Arctic troposphere (50 %–94 %) (55 %–68 % at the surface and 58 %–69 % in the snow), and BB dominates at certain altitudes (600–800 hPa) between April and September (Qi and Wang, 2019). This agrees with Matsui et al. (2022), who reported that the largest contribution to Arctic BC is from BB sources in Siberia traveling at high altitudes.
Northern Eurasia, particularly Siberia, is a key source region of pollution in the Arctic. Source quantification (Zhu et al., 2020) shows that surface Arctic BC originates mainly from anthropogenic emissions in Russia (56 %). The reason for this is that the largest oil- and gas-producing facilities in Western Siberia are located along the main pathway of air masses that enter the Arctic and thus have a disproportionally large contribution to the Arctic lower troposphere (Stohl, 2006; Stohl et al., 2013). Eleftheriadis Tunved et al. (2013) identified this regions as a key source for the highest measured levels of BC in the European Arctic. The impact of long-range transport from these regions has been previously reported in the Ice Cape Baranova station (Manousakas et al., 2020) and Tiksi (Northeastern Siberia) (Winiger et al., 2017; Popovicheva et al., 2019a). Airborne observations over the coast of the Arctic Sea have identified the long-term transport of industrial pollution (Zenkova et al., 2022). Furthermore, efforts have sought to develop BC emission inventories for the Siberian Arctic, based on activity data from local information, improved gas flaring emissions, and satellite data (Huang et al., 2015; Böttcher et al., 2021; Kostrykin et al., 2021; Vinogradova and Ivanova, 2023). To better quantify the source contribution to the Arctic environment, targeted aerosol measurements close to the flaring facilities are needed. The present operating Eurasian Arctic stations are all too far away to allow the assessment of how air masses are affected by different source categories (Stohl et al., 2013). However, ship campaigns focusing on BC close to main source regions (e.g., gas flaring facilities of Western Siberia) have provided a better constraint of how anthropogenic and BB sources influence Arctic pollution (Popovicheva et al., 2017b).
Another major source of the Arctic BC is wildfires in Siberia and Far East regions, which have grown in recent summers (Bondur et al., 2020). Airborne observations of BC in Siberia have confirmed the impact of forest fires (Paris et al., 2009). Eastern Siberia (Yakutia) has been prone to large wildfires due to a combination of hot summers (> 40 °C) and low humidity (Tomshin and Solovyev, 2022). For instance, wildfires in summer 2019 in Eastern Siberia occurred along the trans-Arctic transport pathway, resulting in enhanced aerosol load observed in Western Canada (Johnson et al., 2021). BB emissions occurring at midlatitudes reached the European Arctic in 2020, influencing aerosol composition (Gramlich et al., 2024).
Despite the necessity for detailed observations in Northwestern Siberia, a dense observational network is still absent. Toward this, the polar aerosol station on the Bely Island (Kara Sea, Western Siberia) started to operate in August 2019 (Popovicheva et al., 2022, 2023). The significance of high-quality measurements at the IBS is documented, as the station is located along the main pathway of large-scale emission plumes from industrial regions and Siberian wildfires entering the Arctic (Popovicheva et al., 2022). Further investigation performed at IBS in August 2021 showed impact from a long-range transport event with unprecedentedly high concentrations of carbonaceous aerosol (Schneider et al., 2024).
In this paper, we show improved light absorption long-term measurements and BC seasonal and interannual variability in the Western Siberian Arctic from 3.5 years (2019–2022) of observations at IBS. BC was calculated in two ways: as equivalent black carbon (eBC) by an aethalometer and as elemental carbon (EC) by thermo-optical analysis. We further evaluate the seasonal changes in the observed absorption coefficients. Seasonal difference in intensive optical properties is shown by the wavelength-dependent AAE, which acts as an indication of the BrC impact. The estimated site-specific absorption coefficient (SAC) considered the specific seasonal effects of mixing and aging of aerosols at IBS. We further assess the interannual variability in origin, transport, and main BC sources using modeling tools coupled with the most recent anthropogenic and BB emission datasets.
2.1 Polar aerosol – Island Bely station, location, and meteorology
The location where the aerosol measurements for the IBS of Moscow State University (73020′7.57′′ N, 70040′49.05′′ E) were taken is shown in Fig. 1a together with other Polar Arctic observatories. Western Siberia is the world's largest gas flaring region with a leading oil and gas production industry (Fig. 1b). It is also an area under intensive exposure to Siberian wildfires (Tomshin and Solovyev, 2022; Voronova et al., 2022). A satellite image of smoke plume for 5 August 2021 was obtained from https://worldview.earthdata.nasa.gov (last access: 6 October 2024). Fires are shown from the Fire Information for Resource Management System (FIRMS) (https://firms.modaps.eosdis.nasa.gov/map, last access: 6 October 2024) 10 d back in time.
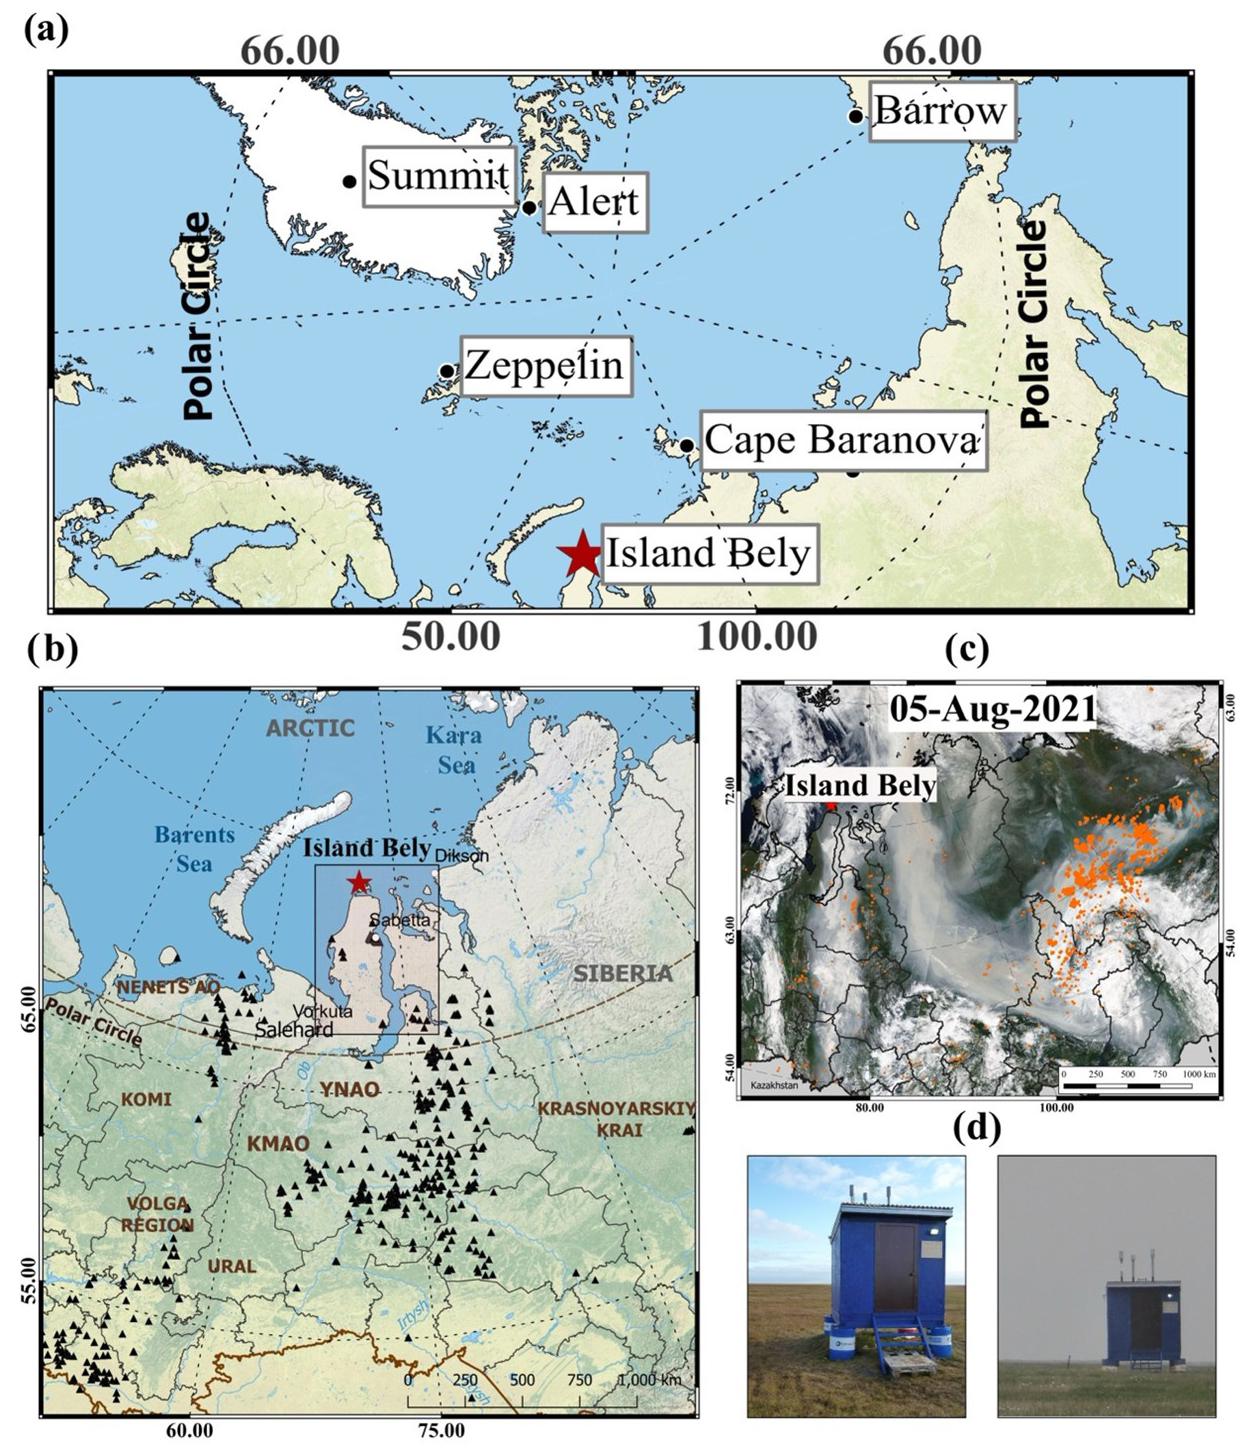
Figure 1(a) The IBS among other polar aerosol stations. (b) A map showing IBS in Western Siberia along with oil and gas fields (adopted from https://skytruth.org/, last access: 7 November 2024). Flares from oil and gas fields in 2020 are indicated by black triangles (https://skytruth.org/, last access: 7 November 2024). (c) Satellite image of a strong plume from the area of the Yakutian wildfires, which brought dense smoke to Bely Island. (d) View of the IBS pavilion under clear conditions on 25 July 2021 and during the unprecedented smoke event on 5 August 2021. Maps were created using the open-source Geographic Information System QGIS (https://qgis.org/en/site, last access: 7 November 2024), with ESRI physical imagery (https://server.arcgisonline.com/arcgis/rest/services/World_Physical_Map/MapServer, last access: 7 November 2024) as the base layer, with MODIS Reflectance true color imagery (MODIS Science Team). Satellite imagery from 5 August 2021 (https://worldview.earthdata.nasa.gov, last access: 7 November 2024), with the TERRA MODIS fire anomaly layer. The open-source natural Earth quick start (NEQS) package was used to add layers of natural and cultural boundaries and polygons from ESRI Shapefile storage.
The climate at IBS is characterized by a large annual variability determined by alternating periods of the polar night and midnight sun. Basic meteorological parameters, such as temperature, wind speed, and direction, were obtained every 3 h from a meteorological station located 500 m away from the IBS. The cycles of temperature, precipitation, snow coverage, wind speed, and relative humidity are shown in Fig. S1 of the Supplement. Annual temperature varied from −39 to 23 °C (mean: °C) (Supplement Table S1). For further analysis, we have split the annual cycle into two periods based on the prevailing temperatures, November–April (“cold period”, ) and May–October (“warm period”, 2.8±5.8). A high relative humidity of 87±8 % was typical of the study period, with less than 80 % observed in winter 2020. Precipitation was maximum in summer (22 mm), with constant snow coverage from October to May. Wind was relatively stable, with a mean speed of 6±3 m s−1, which increased in winter up to 17 m s−1 (Fig. S1).
Wind patterns for the cold period in Fig. S1 show prevailing wind directions from the south, southwest, and southeast. Winds were predominantly continental, rarely occurring from the ocean; significant emission sources from the continent were downwind. In the warm period, the wind patterns were more spatially homogeneous with a northeastern direction. The period from June to September was characterized by a frequent occurrence of oceanic air masses and constant wind speeds.
2.2 Aerosol optical and chemical characterization
The aerosol pavilion is situated approximately 0.5 km to the southeast of the meteorological station. An aerosol sampling system composed of three total suspended particle inlets has been installed approximately 1.5 m above the roof and 4 m above the ground. Each inlet is equipped with an electric heating wire to prevent rimming and ice blocking of the system. One inlet was used for the real-time light-absorption measurements with airflow 5 L min−1. Two other inlets' low-volume samplers (Derenda, Germany) were used for sampling of total suspended particles (TSP) operating at 2.3 m3 h−1 flow (0 °C, 1013.25 hPa).
An Aethalometer model AE33 (Magee Scientific, Aerosol d.o.o.) was used to measure the light attenuation caused by particles deposited on two filter spots at different flow rates (Drinovec et al., 2015) and at 7 wavelengths from ultraviolet (370 nm) to infrared (950 nm). The “dual spot” technique is applied for real-time loading effect compensation. Optical absorption of aerosols on the filter is influenced by the scattering of light within the filter; the enhancement of optical absorption is described by the factor C, which depends on the filter material. The producer recommends an enhancement factor of 1.57 for TFE-coated glass fiber filters. The light-absorbing content of carbonaceous aerosol is reported as eBC concentration by aethalometer (eBCAET) for the given wavelength λ, which is determined for each time interval from the change in the light absorption using the MAC. The aerosol optical absorption coefficient (babs) is as follows:
where eBCAET at 880 nm is determined using the MAC of 7.7 m2 g−1. The aerosol optical absorption coefficient for different wavelengths is determined with their MAC values equal to 11.58 and 13.14 m2 g−1 at 590 and 520 nm, respectively.
To represent the spectral dependence of the light absorption, the AAE was derived using a fitted power law relationship:
where babs(λo) is the absorption coefficient at the reference wavelength λo and AAE is a measure of strength of the spectral variation in aerosol light absorption.
BC absorbs strongly in the NIR–VIS (near-infrared and visible) range, with only a moderate increase toward shorter wavelengths. Light-absorbing organic components related to BrC absorb light at shorter wavelengths more effectively than at 880 nm, which is observed as an increased AAE (Sandradewi et al., 2008; Grange et al., 2020; Helin et al., 2021). The total light absorption is assumed to include the contribution of both BC and BrC (Ivančič et al., 2022):
Using Eq. (1), the BrC absorption is as follows:
Light-absorption measurements were performed for 3.5 years, from 10 August 2019 to 31 December 2022, with a time resolution of 1 min. Data were cleaned based on analysis of meteorological parameters by examining whether the wind originated from the direction of the meteorological station where diesel generators were operating. In such cases, strong peaks of BC were removed from further analysis. Around 6.4 % of the hourly average data were cleaned from the dataset due to local pollution impact. To avoid the instrumental noise when calculating the AAE, the z score was used, which calculates the ratio of difference between a single raw data value and the data mean to the data standard deviation. Outliers (<−3 and >3 of each observation's z score) were removed from the dataset.
A thermal EC analysis was conducted for the samples in parallel with the AE33. Sampling was performed on 47 mm quartz fiber (Pallflex) filters preheated at 600 °C for 5 h. The low concentrations of ambient aerosols necessitate that the sampling times reach up to 1 week in order to allow the filter loading to exceed the detection limit for relevant aerosol chemistry analyses. The total number of samples limited by the low detection limit of the thermo-optical instrument was 180.
Organic carbon (OC) and EC were measured by thermo-optical transmittance (TOT) analysis (Lab OC-EC Aerosol Analyzer, Sunset Laboratory, Inc.) using the methodology reported in Popovicheva et al. (2019a) and Manousakas et al. (2020). Quartz filter samples were first heated up to 650 °C in He atmosphere and then up to 850 °C in a mixture of 2 % O2 in He, using the controlled heating ramps of the EUSAAR_2 thermal protocol. OC evolves in the inert atmosphere, while the thermal refractory fraction EC is oxidized in the He–O2 atmosphere. Charring correction due to pyrolytic carbon was applied by monitoring the sample transmittance throughout the heating process. The limit of detection (LOD) for the EC analysis was 0.05 µg C cm−2. QA/QC procedures of EN 16909:2017 were also applied during TOT analysis. Laboratory and field blanks were prepared and ran following the same analytical procedures as those for the samples.
Both methods have important uncertainties (10 %–80 %, Sharma et al., 2017; Ohata et al., 2021). The determination of EC by therm0-optical analysis may be impacted by the presence of carbonate carbon (CC), which is quantified during analysis as OC and/or EC. The contribution of CC in fine aerosol is generally considered negligible, but its interference may be significant for coarse aerosol and samples heavily impacted by resuspended soil. The split between EC and OC may also be affected by the presence of light-absorbing species other than EC, such as light-absorbing organic carbon. In addition, the presence of mineral oxides, such as iron oxide, might provide oxygen during analysis and lead to pre-oxidation of EC in an inert atmosphere. eBC might overestimate BC if there are coexisting components such as BrC (Chakrabarty et al., 2010) and dust (Petzold et al., 2009). In addition, the aethalometer response depends on filter loading and multiple scattering by the filter medium and sampled aerosol particles (Backman et al., 2017).
Validations of eBC retrievals were performed against results from thermo-optical analysis of EC, according to an approach used previously by Sharma et al. (2004), Eleftheriadis et al. (2009), and Yttri et al. (2014). To convert optical absorption at 880 nm to BC mass, the SAC was estimated as follows:
Data processing was performed using Deming's total least-squares regression to compare measurements from different methods and modeling, estimate the MAC, and evaluate correlations among variables (R package “Deming”; Therneau, (2024)). Deming regression fits a couple of variables while considering independent errors in both. The errors are assumed to be normally distributed; the error ratio is 1, and the regression results are equivalent to orthogonal regression with the intercept forced through zero.
2.3 Atmospheric dispersion modeling and emission inventories
To investigate the air mass transport and possible origin of BC during the study period (2019–2023), the Lagrangian particle dispersion model FLEXPART version 10.4 was used (Pisso et al., 2019), driven by hourly reanalysis meteorological fields (ERA5) from the European Centre for Medium-Range Weather Forecasts (ECMWF), with 137 vertical levels (up to approximately 80 km) and a horizontal resolution of 0.5° × 0.5° (Hersbach et al., 2020). In FLEXPART, computational particles were released at heights 0–100 m from the receptor (IBS) and tracked backward in time in FLEXPART's “retroplume” mode. Simulations extended over 30 d backward in time, sufficient to include most BC emissions arriving at the station, given a typical BC lifetime of 1 week (Bond et al., 2013). The tracking includes gravitational settling for spherical particles, dry and wet deposition of aerosols (Grythe et al., 2017), turbulence (Cassiani et al., 2015), unresolved mesoscale motions (Stohl et al., 2005), and deep convection (Forster et al., 2007). The FLEXPART output consists of a footprint emission sensitivity that expresses the probability of any emission occurring in each grid cell to reach the receptor. The footprint can be converted to a modeled concentration at the receptor, when coupled with gridded emissions from an emission inventory. Modeled concentrations can be calculated as a function of the time elapsed since the emission has occurred (i.e., “age”), which can be shown as “age spectrum”, while masks of specific regions/continents can give the continental contribution for the simulated concentration (i.e., “continent spectrum”).
The source contribution to receptor BC is calculated by combining each gridded emission sector (e.g., gas flaring, transportation, and waste management) from an emission inventory with the footprint emission sensitivity (as described in the previous paragraph). Calculations for anthropogenic sources (emission sectors are described below) and open BB were performed separately. This enabled identification of the exact origin of BC and allowed for quantification of its source contribution. Anthropogenic emissions were adopted from the latest version (v6b) of the ECLIPSEv6b (Evaluating the Climate and Air Quality Impacts of Shortlived Pollutants) dataset, an upgraded version of the previous version (Klimont et al., 2017). The inventory includes emissions from industrial combustion (IND), the energy production sector (ENE), residential and commercial emissions (DOM), emissions from the waste treatment and disposal sector (WST), transportation (TRA), shipping activities (SHP), and gas flaring emissions (FLR). The methodology for obtaining emissions from FLR specifically over the Russian territories has been improved in ECLIPSEv6b (Böttcher et al., 2021). Annual total and monthly anthropogenic emissions are shown in Fig. S2. BB was adopted from the Copernicus Global Fire Assimilated System (CAMS GFAS) (Kaiser et al., 2012) because this product provides an estimation of the injection altitude of the fire emissions, which is crucial for accurate simulation of the BB dispersion. Annual total and daily fire emissions from CAMS GFAS are shown in Fig. S3.
3.1 Aerosol light absorption
Light-absorption coefficients at 880 nm, babs(880) were used to infer eBC mass concentrations. The data points for babs(880) were plotted as hourly and monthly means during the entire study period (2019–2022) (Fig. 2). Table 1 presents the data statistical summary. The mean ± sigma (median) value of babs(880) was 0.5±0.9 (0.27) Mm−1 for the entire study period. In the cold period, the annual average mean (median) of babs(880) was 0.7±0.7 Mm−1 (0.5); during the warm period, it was 1.9 (2.5) times less. There is a clear seasonality consistent with the Arctic aerosol light absorption from other studies (Stathopoulos et al., 2021; Schmale et al., 2022; Pulimeno et al., 2024) due to the formation of the polar dome and the slow removal processes in the Arctic in winter (Law and Stohl, 2007). The 15-year (2001–2015) record at Zeppelin demonstrated that the long-term seasonality of light-absorbing carbon (Stathopoulos et al., 2021) babs(880) was 0.112 Mm−1 (median) in the cold period and 0.035 Mm−1 in the warm period; both values are approximately 5 times less than those observed at IBS.
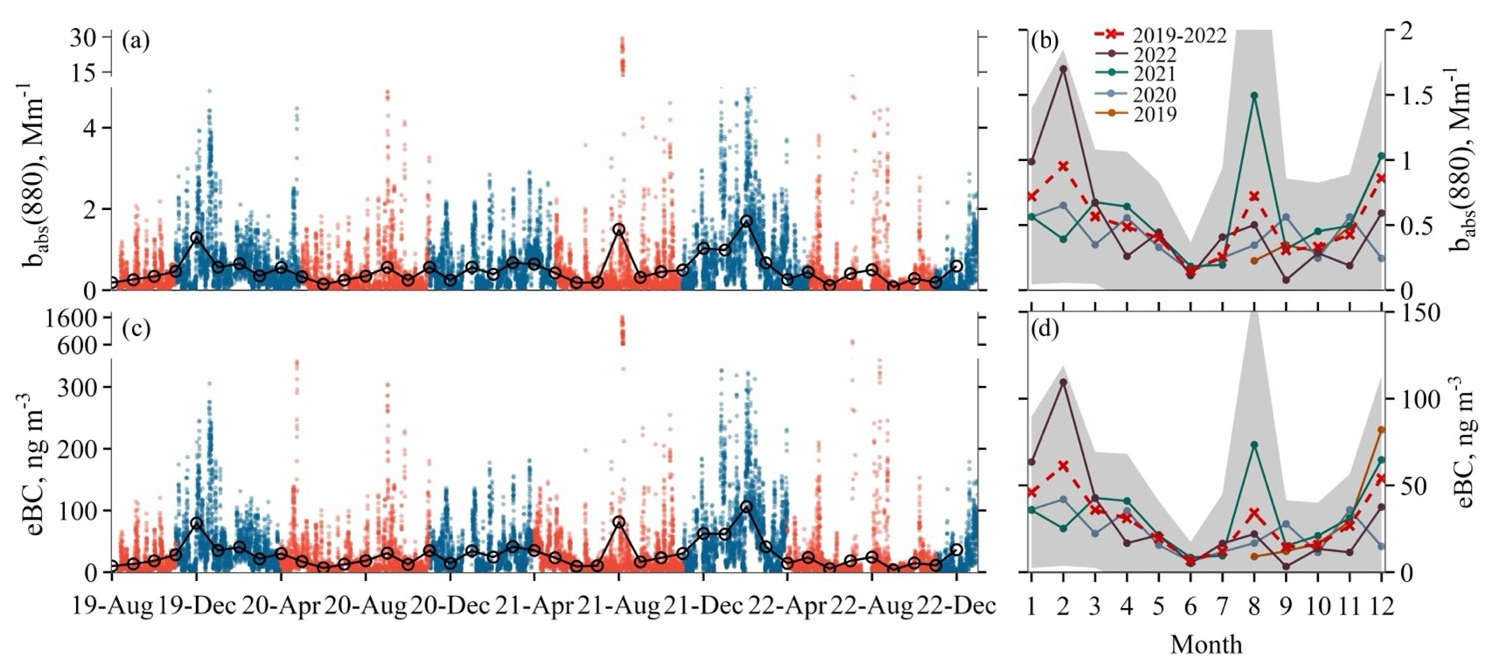
Figure 2Hourly time series and monthly means of (a) babs(880) and (c) eBC for cold (blue) and warm (red) periods; monthly climatology of (b) babs(880) and (d) eBC for 6 months of 2019 and whole-year periods of 2020, 2021, and 2022. Cross marks (x), joined by lines, show the interannual mean; the standard deviation is plotted by shaded area.
Table 1Statistics of light-absorption coefficients; EC, OC, eBCAET, and eBC mass concentration; and absorption Ångström exponents (AAEs) for the study period, cold, and warm periods. Mean ± standard deviation (1σ) for the first and third quartiles (25th and 75th percentiles).
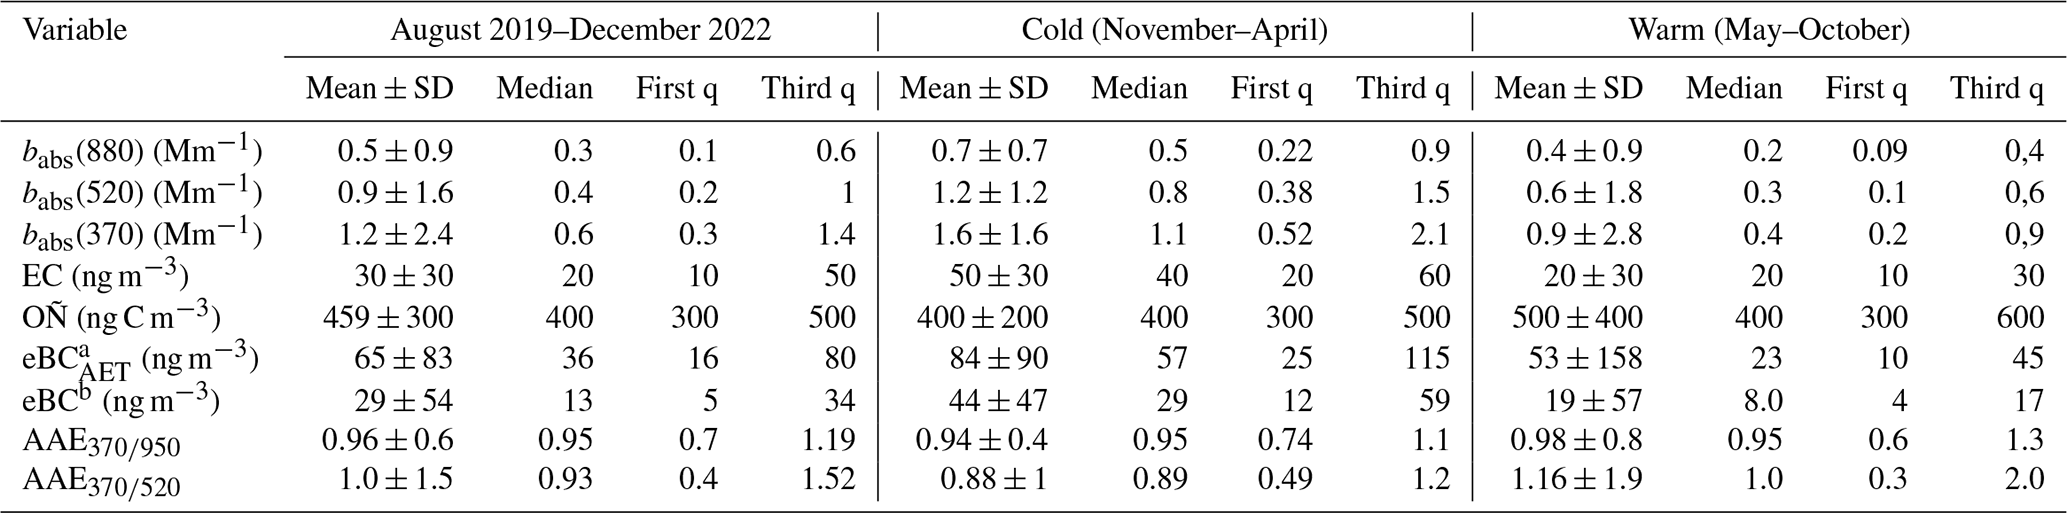
The variable a eBCAET is defined in Sect. 2.2. The variable b eBC is defined in Sect. 3.2.
Monthly means of babs(880) for each year together with intra-annual means for IBS are shown in Fig. 2. Specifically, annual average babs(880) exhibits a significant peak during winter and summer for any year. The examination of the overall changes by the interannual mean reveals a gradual increase from November (0.4±0.5 Mm−1) to February (0.9±0.8 Mm−1); the latter represents the maximum light absorption observed at IBS. In February, the monthly mean of babs(880) ranged from 0.4 to 1.7 Mm−1, reaching the maximum (1.7 Mm−1) in 2022. Thus, Arctic haze is present at IBS in winter months, from December to February. Starting from March (0.6±0.5 Mm−1), the interannual mean decreased down to a minimum in June (0.1±0.2 Mm−1) that was 9 times less than that of February. August had the highest light absorption (mean: 0.7 ± 2.2 Mm−1) within the summer months, ranging from 0.2 to 1.5 Mm−1 and showing a maximum of 1.5 in 2021. September and October demonstrated a similar level of variability with June. At Zeppelin, the maximum of the intra-annual (2001–2015) mean was seen in March–April (0.3 Mm−1) (Stathopoulos et al., 2021), coinciding with the Arctic haze phenomenon in late winter–spring that has been widely observed in the European Arctic and the Canadian Arctic (Sharma et al., 2004; Schmale et al., 2022).
In order to relate the light absorption in visible spectrum to the variability at other locations (Schmeisser et al., 2018; Pulimeno et al., 2024), we calculate babs at 520 and 590 mn. The mean (median) value of babs(520) was 0.9±1.6(0.5) Mm−1 for the entire study period (Table 1). At Ny-Ålesund (Svalbard), the annual mean (median) babs(530) averaged from 2018 to 2022 was 0.22 (0.13) Mm−1 (Pulimeno et al., 2024), approximately 4 times less. Moreover, the absorption coefficient babs(550) of 0.18 (0.09) Mm−1 recorded for 2012–2014 again in Svalbard (Schmeisser et al., 2018) was 4 times less compared to annual average light absorption at IBS.
We present multi-annual box-and-whisker plots of babs at 590 nm in Fig. 3. The wavelength of 590 nm was chosen as the closest to the 550 nm wavelength reported for the polar station Tiksi (Schmeisser et al., 2018; Schmale et al., 2022). The monthly medians of babs(590) in February ranged from 0.3 to 2.3 Mm−1, representing the highest values observed in 2022. The highest extended interquartile range (up to 1 Mm−1) was observed in the cold period. Conversely, the summer months exhibited a minimum of approximately 0.1 Mm−1 for babs(590) with smaller variation in data characterized by the low interquartile range of 0.4 Mm−1.
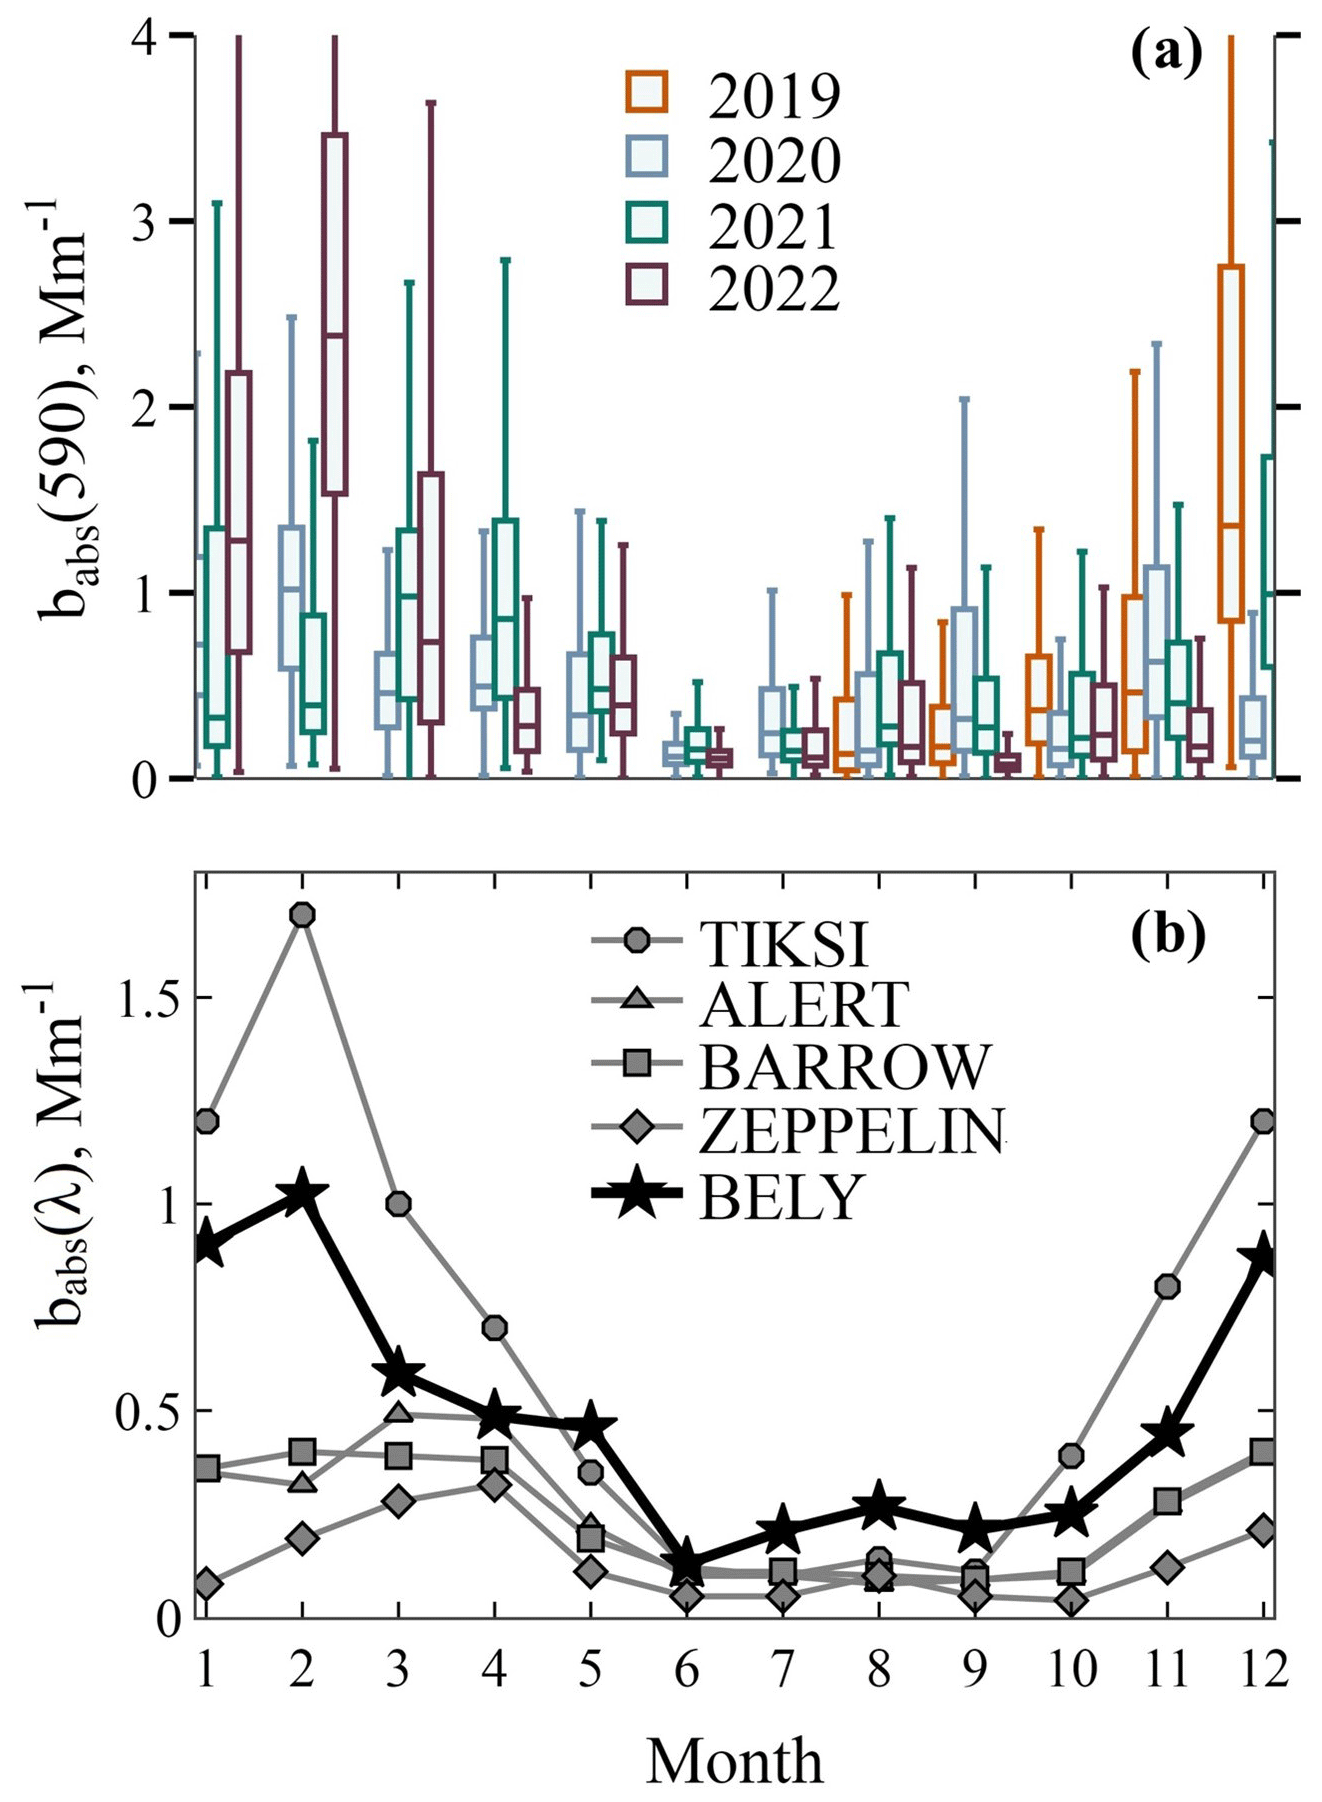
Figure 3(a) Monthly box–whisker plots for babs(590) at IBS for 6 months of 2019 and whole-year periods of 2020, 2021, and 2022. The 25th, 50th, and 75th percentiles are shown with boxes, while whiskers extend ± 1.5 times the interquartile range. (b) Seasonality of monthly median of babs at 550 nm at Tiksi, Alert, Barrow/Utqiaġvik, and Zeppelin for 2012–2014 (Schmeisser et al., 2018) and babs at 590 nm at IBS for 2019–2022 (this work).
The annual cycle of babs(590) reflects the higher aerosol burden during the haze season and the low concentrations during summer at Alert, Barrow/Utqiaġvik, Zeppelin, Gruvebadet, and Tiksi (Schmale et al., 2022). Seasonality of babs medians at 550 nm for polar stations (Alert, Barrow/Utqiaġvik, Tiksi, and Zeppelin) from Schmeisser et al., (2018) and babs(590) for IBS are presented in Fig. 3. All sites demonstrate similar seasonal variations, albeit with different magnitudes of light absorption. In February, the maximum babs(590) (1.1 Mm−1) was observed at IBS; a higher value has been only observed at Tiksi, which is explained by the influence from local sources (Popovicheva et al., 2019a). Other stations show the Arctic haze maximum later (in March or April); a sharp decline in babs(590) was observed during those months at IBS. Values similar to other Arctic stations were recorded at IBS in June, with an annual minimum of around 0.1 Mm−1. From July, babs(590) at IBS was higher than at other stations except Tiksi and peaked at 0.8 Mm−1 in December. The polar station Pallas exhibits the opposite behavior, peaking in spring and summer (Schmeisser et al., 2018). Pallas is located relatively south as compared to the rest of the polar stations, and, hence, it is influenced by anthropogenic and biogenic emissions from surrounding boreal forests (Asmi et al., 2011). Aerosol optical properties in the IR and visible solar spectrum at IBS are different from those observed at European, Canadian, and western high-latitude polar locations due to different source origins, but light-absorption coefficients are higher during the haze period (December–February).
3.2 Black carbon and site-specific mass absorption cross-section
EC collocated with light absorption observations is widely used to infer BC (Grange et al., 2020). Figure 4a shows concentrations of EC determined for samples collected in parallel with the aethalometer measurements from 10 August 2019 to 31 December 2022, with eBCAET concentrations averaged over the sampling period. Both weekly EC and eBCAET concentrations show the same seasonal variations with a maximum in winter and minimum in summer. EC concentrations are generally smaller than eBCAET. The annual EC mean concentrations ranged from 6.5 to 16.3 ng C m−3. The highest EC (0.2 µg C m−3) was recorded in December 2019, and the highest eBCAET (0.4 µg m−3) was recorded in December 2019 and January 2022. EC was higher (0.05±0.03 µg C m−3) in the cold period and decreased (0.02±0.03 µg C m−3) in the warm period (Table 1). Annual average mean EC during the entire study period was 0.03±0.03 µg C m−3. For comparison, at Zeppelin and Villum the annual mean EC concentrations were 0.012 ± 0.04 µg C m−3 (2017–2020) (Yttri et al., 2024) and 0.029 ± 0.03 µg C m−3 (2011–2013) (Massling et al., 2015), respectively.
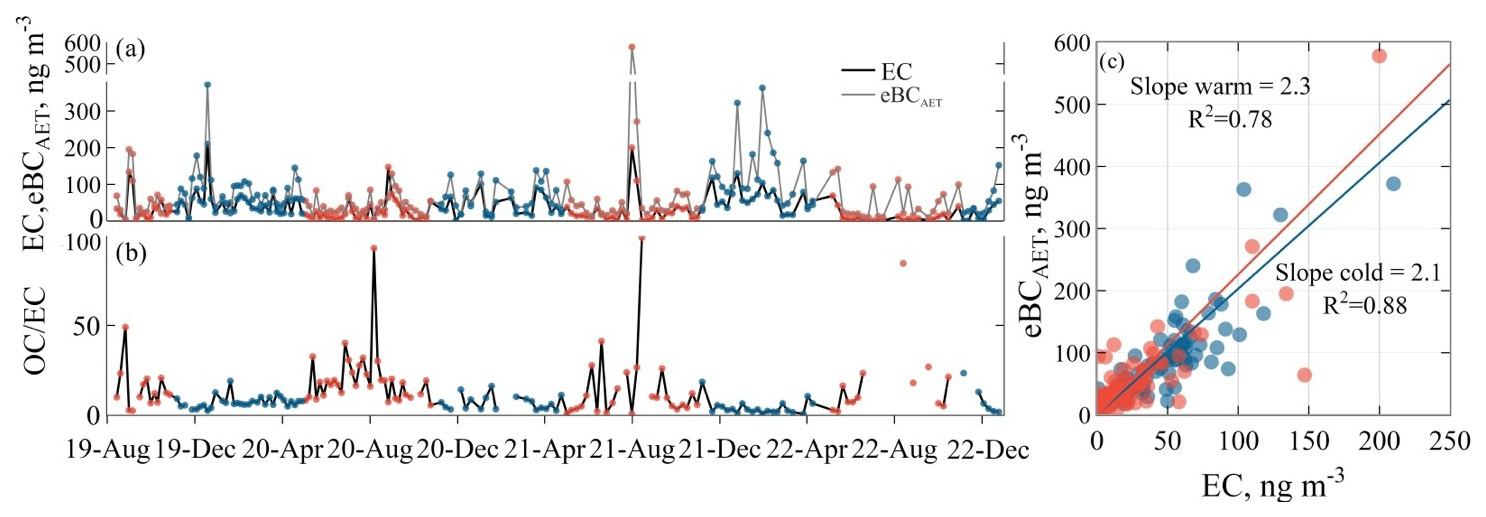
Figure 4Temporal variation in (a) weekly EC and eBCAET averaged over the whole sampling period and (b) the OC EC ratio. (c) Scatter plot points and orthogonal regressions (solid lines) for measured eBCAET and EC concentrations in the cold (blue) and warm (red) periods. The figure includes the regression slope and the coefficient of determination (R2).
Annual mean OC concentrations during the entire study period were estimated as 0.45±0.3 µg C m−3. At Zeppelin, annual OC (2017–2020) concentrations were 3.5 times smaller (0.13±0.1 µg C m−3) (Yttri et al., 2024). Notably, the multi-year average EC and OC levels at IBS are approximately 3 times higher than at Zeppelin, which correlates well with increased light absorption, as described previously. At IBS, OC was 0.4±0.2 µg C m−3 in the cold period and increased to 0.5±0.4 µg C m−3 in warm period, opposite to EC (Table 1). The ratio OC EC shows increased OC and decreased EC in the warm period and an opposite trend in the cold period (Fig. 4b). Figure 4c depicts the relationship between eBCAET and EC in cold and warm periods. We note the high R2 values for the cold period (0.88) and slightly lower ones for the warm period (0.78). During the warm period, seasonal mean values reveal an overestimation of eBCAET, which is more pronounced during the warm period, with a slope equal to 2.3. The R2 values were lower because many EC values were close to the LOD. Seasonal differences are attributed to pollutant sources altering the chemical composition of aerosol at IBS. A positive correlation was observed between eBCAET EC and OC EC indicating that BC at IBS is coated with OC leading to the lens effect (Kanaya et al., 2008) and the overestimation of eBC.
A similar seasonal variation for eBC and EC – with highest concentrations in winter and lower concentrations in summer – had been observed previously at Villum, with a regression slope of 2 and a R2 of 0.64 (Massling et al., 2015). At Alert, the median SAC during the Arctic haze season (November to April) was 19.8 m2 g−1 (Sharma et al., 2004). However, during the non-Arctic haze period from May to October the SAC was significantly higher 28.8 m2 g−1 and much more variable. This is explained by the aged, internally mixed, and anthropogenic origin of winter and spring arctic aerosols, while summer aerosols were affected by local sources.
Following the definition in Eq. (5), we calculate the SAC from the slope of BC light absorption at 880 nm, , and EC concentrations. SACBC,cold (for the cold period) was estimated to be 15.9 m2 g−1, while SACBC,warm was higher (18.1 m2 g−1) (Fig. 5). SAC values at Alert have been reported to be even higher (Sharma et al., 2004), showing that Western Arctic aerosols differ by composition and aging. Recalculations of BC mass with SAC values for cold and warm periods (eBC), separately, were performed according to Eq. (1).
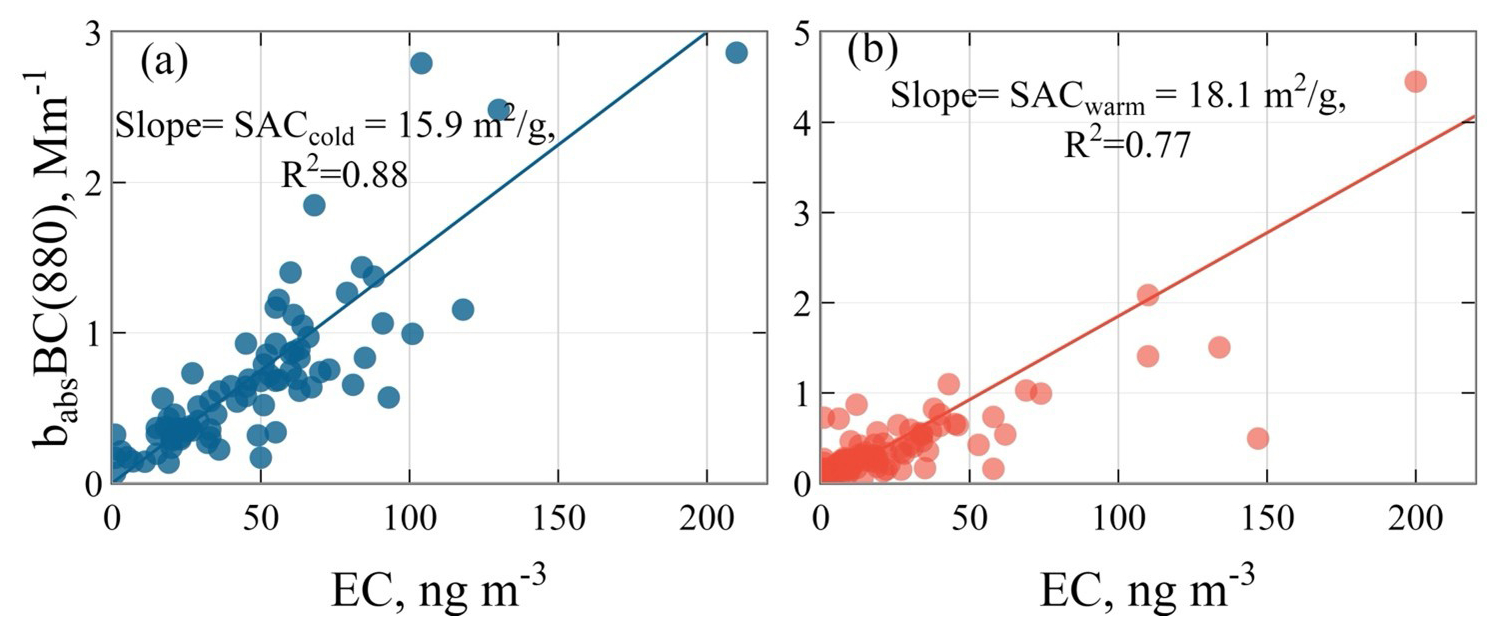
Figure 5Scatter plot points and orthogonal regressions (solid line) for and EC concentrations for the (a) cold (blue) and (b) warm (red) periods. The regression slope defines SACBC,cold and SACBC,warm.
Time series of daily and monthly mean eBC concentrations from August 2019 to 31 December 2022 are shown in Fig. 2. Annual mean and median eBC for the entire period were 28.7 ± 54.1 and 12.5 ng m−3, respectively (Table 1); they exhibit a strong year-by-year variability. We note that the eBC values are approximately half of the eBCAET value. Previous studies have evaluated the optical properties of BC against direct mass measurement techniques and also obtained MAC values depending on locations that differ from those recommended by the aethalometer (Sharma et al., 2004; Eleftheriadis et al., 2009; Yttri et al., 2024). For example, the relationship between BCAET and EC obtained by the thermal techniques at the Alert station (Canada) during 3-year measurements was 0.85 (Sharma et al., 2004). Studies at Villum Research Station (Greenland) showed good agreement between measured EC and eBCAET concentrations (Massling et al., 2015), similar to our study. eBC climatology and the statistics for each month and year of study are presented in Fig. 2 and Table S2, respectively. The annual mean eBC in 2019, 2021, and 2022 was 33±44, 33±85, and 32±48 ng m−3, respectively, for the entire study period. A statistically significant difference at the 95 % confidence level (p value < 0.05, t test) was observed for the cold and warm periods, with means of 44±47 and 19±57 ng m−3, respectively. The smallest mean eBC of 24±29 ng m−3 occurred in 2020. The latter is likely attributed to the impact of COVID-19 restriction measures to the emissions of BC (Evangeliou et al., 2021).
The general trend of the maximum in winter and minimum in summer reproduces the typical eBC seasonality reported in polar observatories well (Stone et al., 2014; Schmale et al., 2022). Figure 2 shows monthly mean eBC concentrations for 6 months of 2019 and whole-year periods of 2020, 2021, and 2022 as well as annual average monthly mean eBC climatology for the entire study period. The highest concentrations in the cold period were observed in December 2019 (81±64 ng m−3), January 2022 (61 ± 49 ng m−3), February 2022 (106±67 ng m−3), and March 2021 (42±33 ng m−3) (Table S2). In warm periods, we recorded the highest concentrations in September 2020 (31±48 ng m−3), August 2021 (83±249 ng m−3), April 2021 (35±26 ng m−3), and August 2022 (28±54 ng m−3).
3.3 Multi-wavelength absorption Ångström exponent
As shown by Virkkula (2021), pure BC particles surrounded by non-absorbing coatings can have AAEs ranging from < 1 to 1.7. A compendium of values from different emissions shows AAE variation from 0.2 to 3.0 for transport, power plants, and domestic wood burning (Helin et al., 2021). Primary emissions from residential heating (Cuesta-Mosquera et al., 2024) and BB (Popovicheva et al., 2017a, 2019b) have been associated with high AAEs of around 3–4. Due to mixing with background aerosol, coating, and aging processes, a large change in the light absorption has been reported at receptors of long-range-transported pollution (Cappa et al., 2016). For highly aged aerosols, AAE has been found lower than 1.0 due to large and internally mixed particles (Popovicheva et al., 2022). Spectral absorption was obtained at IBS in the UV to IR spectral region emphasized by the value of AAE equal to 0.96 for the entire study period (Fig. 6a). Power law fittings of spectral dependence for both warm and cold periods show similar values, indicating highly mixed and aged BC.
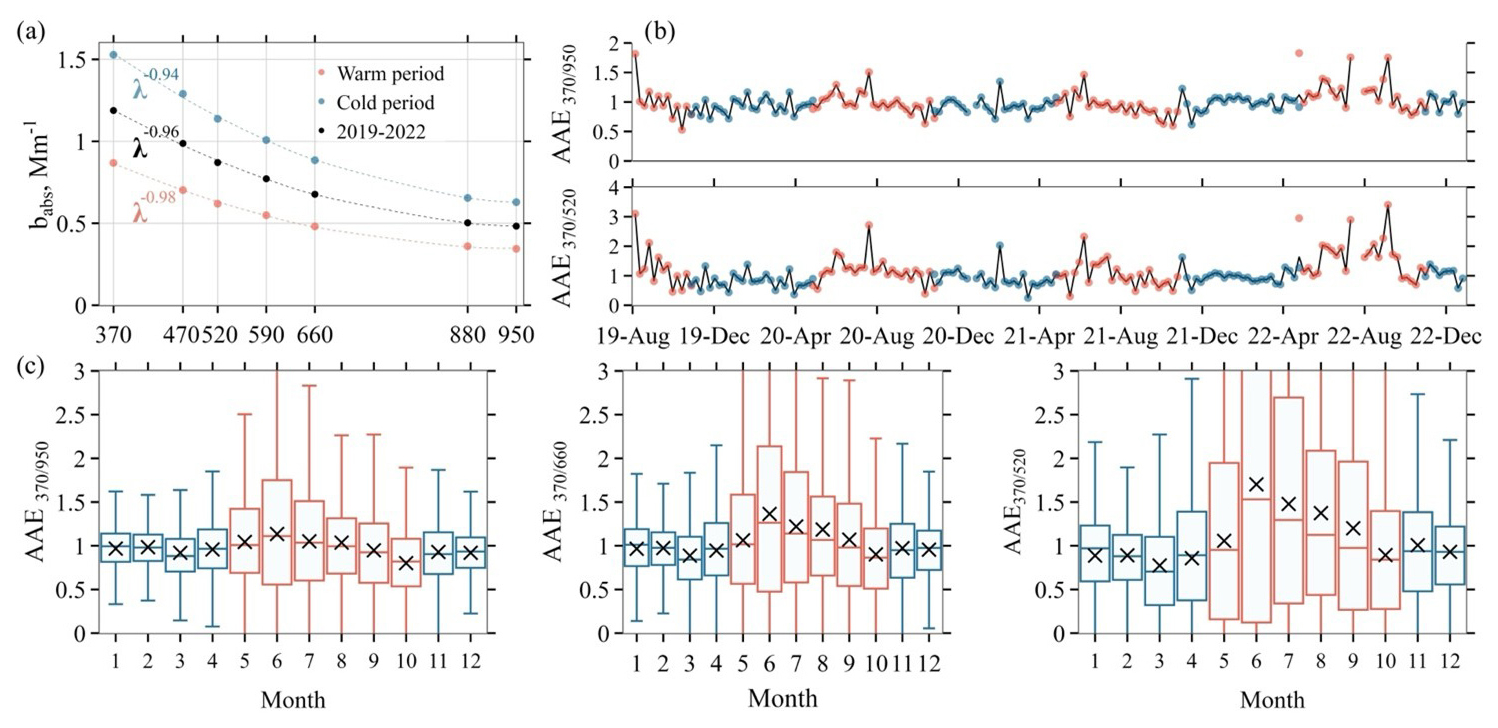
Figure 6(a) Spectral dependence of light-absorption coefficient for 2019–2022, during warm (red) and cold (blue) periods. AAE is the slope of the linear regression in logarithmic scale of a power law regression as described in Eq. (2). (b) Time series of AAE and AAE. (c) Box–whisker plots and monthly means of AAEs at 370 and 950 nm, 370 and 660 nm, and 370 and 520 nm for the entire period.
Multiple studies have addressed the sensitivity of the AAE to the range of wavelengths selected for its calculation (Cuesta-Mosquera et al., 2024); the extent of this sensitivity is higher for aerosols containing a substantial contribution of organic species such as BrC. Events affected by regional fire emissions were evident by the light-absorption coefficient AAE in the short wavelength range (Ulevicius et al., 2010). In remote Arctic environments, cases with values that exceeded AAE have been identified to be influenced by BB (Pulimeno et al., 2024). The impact of intensive wildfires in North America on aerosol optical properties measured at the European Arctic has been associated with increased daily AAE of up to 1.4 (Markowicz et al., 2016). Strong UV absorption has led to an increase of up to 1.8, clearly indicating the importance of non-BC light-absorbing components (Ran et al., 2016).
To apportion the wavelength-dependent light absorption, we used a pair of wavelengths (350 and 950 nm) in the whole spectrum and in shorter wavelengths (370 and 660 nm and 370 and 520 nm). Time series of weekly average AAE showed a similar seasonality but wider variation (0.2–3.1) than (0.5–1.7) for AAE (Fig. 6b). The mean values increased from 0.97 ± 0.23 for AAE to 1.17 ± 0.5 for AAE for the entire study period (Table 1). Box–whisker plots and annual average means of AAE showed no prominent monthly dependence (Fig. 4c). However, increased AAE above 1.1 was observed in summer months for several years, in July 2020, in June 2021, and from May to September 2022 (Table S2). The shorter the wavelength pair, the higher the annual average AAE above 1.0. The largest values of monthly mean (median) AAE were found for April to September with a maximum in June. Such considerable deviation during warm months implies the importance of BrC light-absorbing components within highly mixed Arctic aerosols at IBS.
Light absorption at 370 nm, babs(370), was used to estimate the BrC mass concentrations. The mean (median) value of babs(370) was 2.4 times higher than babs(880) for the entire study period as well as for cold and warm ones (Table 1). The monthly means and box–whisker plots of babs(370) showed trends similar to babs(880) (Fig. S4). Assuming the wavelength pair λ and λ0 in Eq. (3) being 370 and 950 nm, respectively, the absorption coefficient for BrC at 370 nm, , is determined by subtracting BC absorption from the total absorption at the same wavelength using the AAE value for entire period (Table 1). Monthly and as well as the percentage contribution to total babs(370) are shown in Table S3 for those years when the contribution of BrC absorption was higher than 1 %. We note 13 % for August 2021 for the warm period and 5 % for February 2022 and December 2021 for the cold period.
3.4 Modeled concentrations of BC
Figure 7a shows the monthly mean eBC and surface BC (BCFLEXPART) concentrations simulated with FLEXPART and coupled to ECLIPSEv6b-GFAS emissions for the entire study period. The FLEXPART model performs well in capturing the seasonality of observed features with both high and low concentrations. Annual mean modeled BCFLEXPART (88.4 ng m−3) is 37 % higher than eBCAET (64.3 ng m−3) and 3 times higher than eBC (29.5 ng m−3). Annual and monthly means of eBCAET show values closer to BCFLEXPART than to eBC. This is a reasonable finding because the global emission datasets could not consider local pollution. Almost all simulated BC concentrations, except those in February 2020 and 2021, were found within the standard deviation range of measured eBCAET. A good correlation between measurements and simulations, with Pearson coefficients of 0.72 and 0.82 and root-mean-square errors (RMSEs) of 15 and 0.14 ng m−3 and a normalized bias of 0.39 and 0.27, was obtained for the cold and warm periods, respectively (Fig. 7b, c).
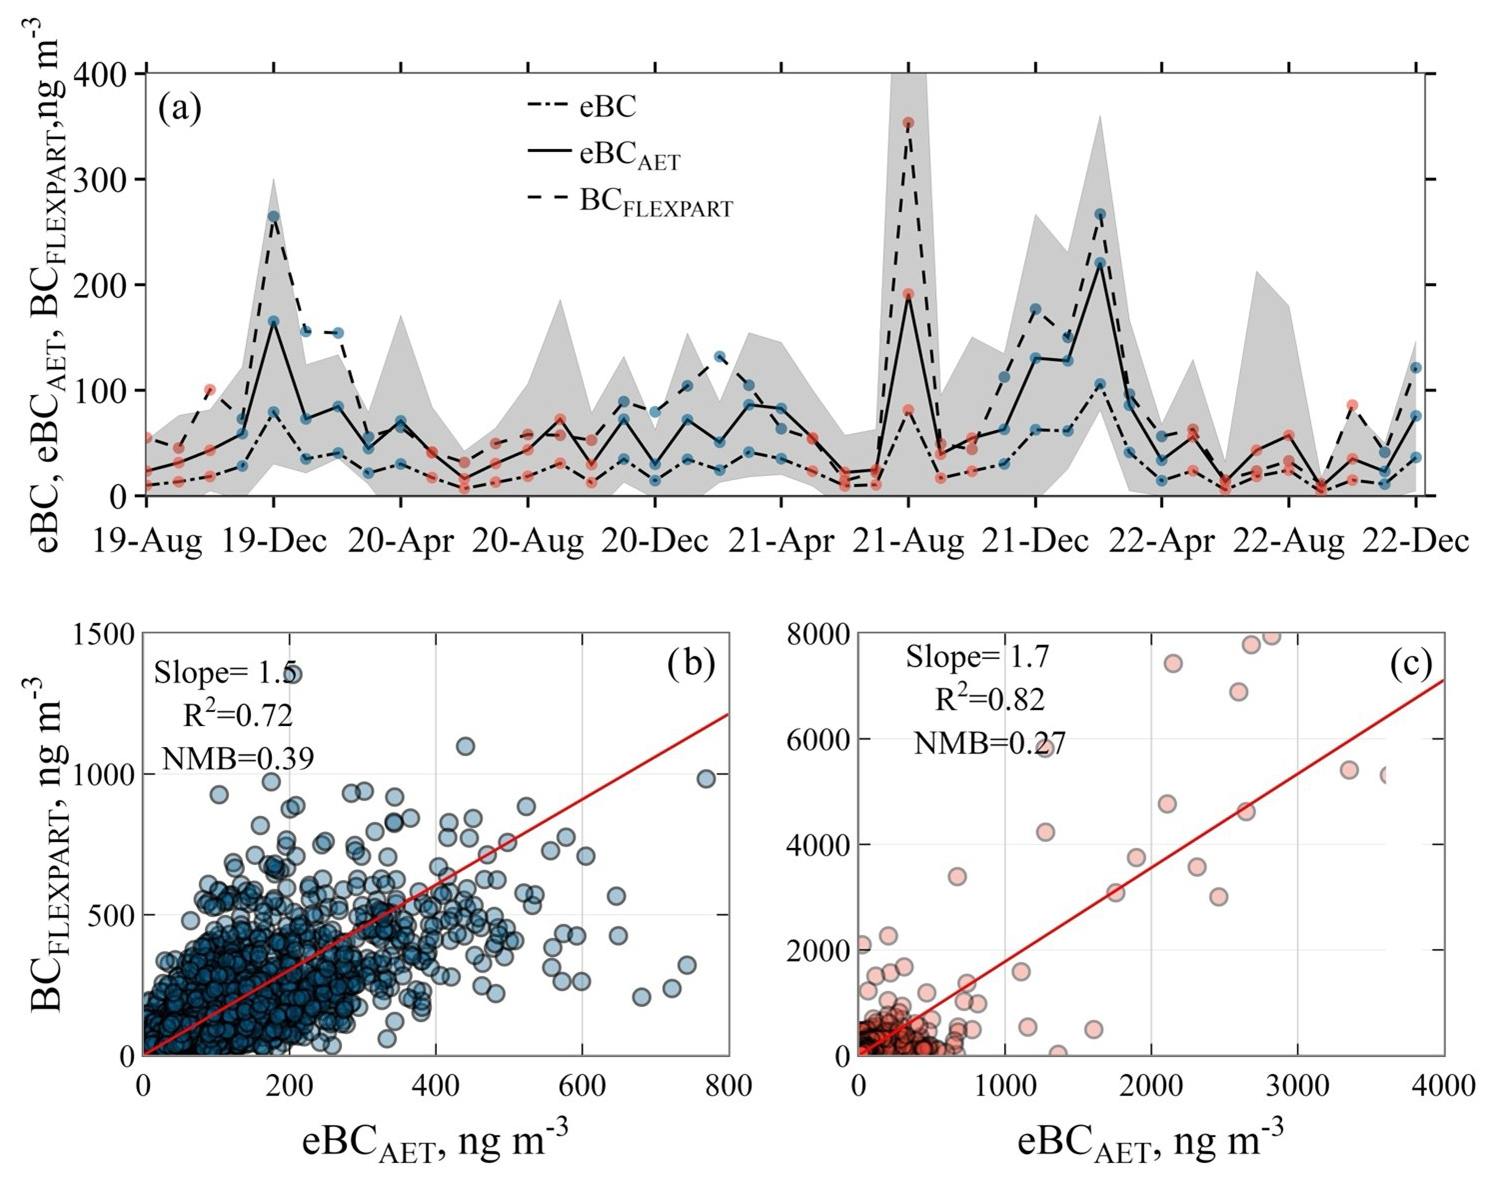
Figure 7(a) Monthly mean eBC and modeled surface BC concentrations from 10 August 2019 to 31 December 2022. Monthly mean eBCAET (line with crosses) is shown with the standard deviation range as a shaded area. Scatter plot points and orthogonal regressions (solid lines) for BCFLEXPART calculated over measured eBCAET concentrations for (b) cold and (c) warm periods. The figure includes the regression slope and the coefficient of determination (R2).
FLEXPART does not reproduce seasonal variations in BC everywhere over the Arctic. R2 and RMSE varied between 0.53–0.80 and 15.1–56.8 ng m−3, respectively, depending on the location (Zhu et al., 2020). At Zeppelin, modeled BC (annual mean of 39.1 ng m−3) was reported to be 85 % higher than the measured value (21.1 ng m−3 for annual mean). At Tiksi, modeled BC was underestimated (74.4 ng m−3 for annual mean) by 40 % compared with observations (104.2 ng m−3 for annual mean) (Zhu et al., 2020). Such a good result for IBS is due to its closer location to the biggest emission sources.
Figure 8 shows the vertical distribution of simulated BC as a function of time for the years 2019–2020 (vertical cross-section). Consistently high vertical BC profiles up to 2 km were observed in the cold period, except in April 2022. In February 2020, a smoke layer of BC concentrations of up to 100 ng m−3 was prominent at up to 4 km. On the contrary, in the warm period the smoke resides near the surface, despite a few events of extremely high vertical BC at altitudes up to 8 and 10 km, which occurred in July 2020 and August 2021, respectively. Nevertheless, the evidence of atmospheric transport from high altitudes during summer months is evident by the elevated modeled BC (>100 ng m−3) at high model layers (e.g., July 2019, June–August 2020, June–July 2021, and May–June 2022). In all these periods, BCFLEXPART (fuchsia line in Fig. 8) was under 40 ng m−3, showing that the emission sources are probably far away and that long-range transport occurred. The low injection altitude of anthropogenic emissions in the winter months causes emitted substances to remain close to the emission sources. BC climatology at IBS indicates that the long-range-transported anthropogenic emissions in the cold period reside at altitudes up to 2 km and compose a persistent layer (Fig. 8). This is further explained by the rapid (about 4 d or less) low-level transport of air masses to the Arctic troposphere, as described in Stohl (2006). However, this cannot be confirmed without targeted high-altitude observations.
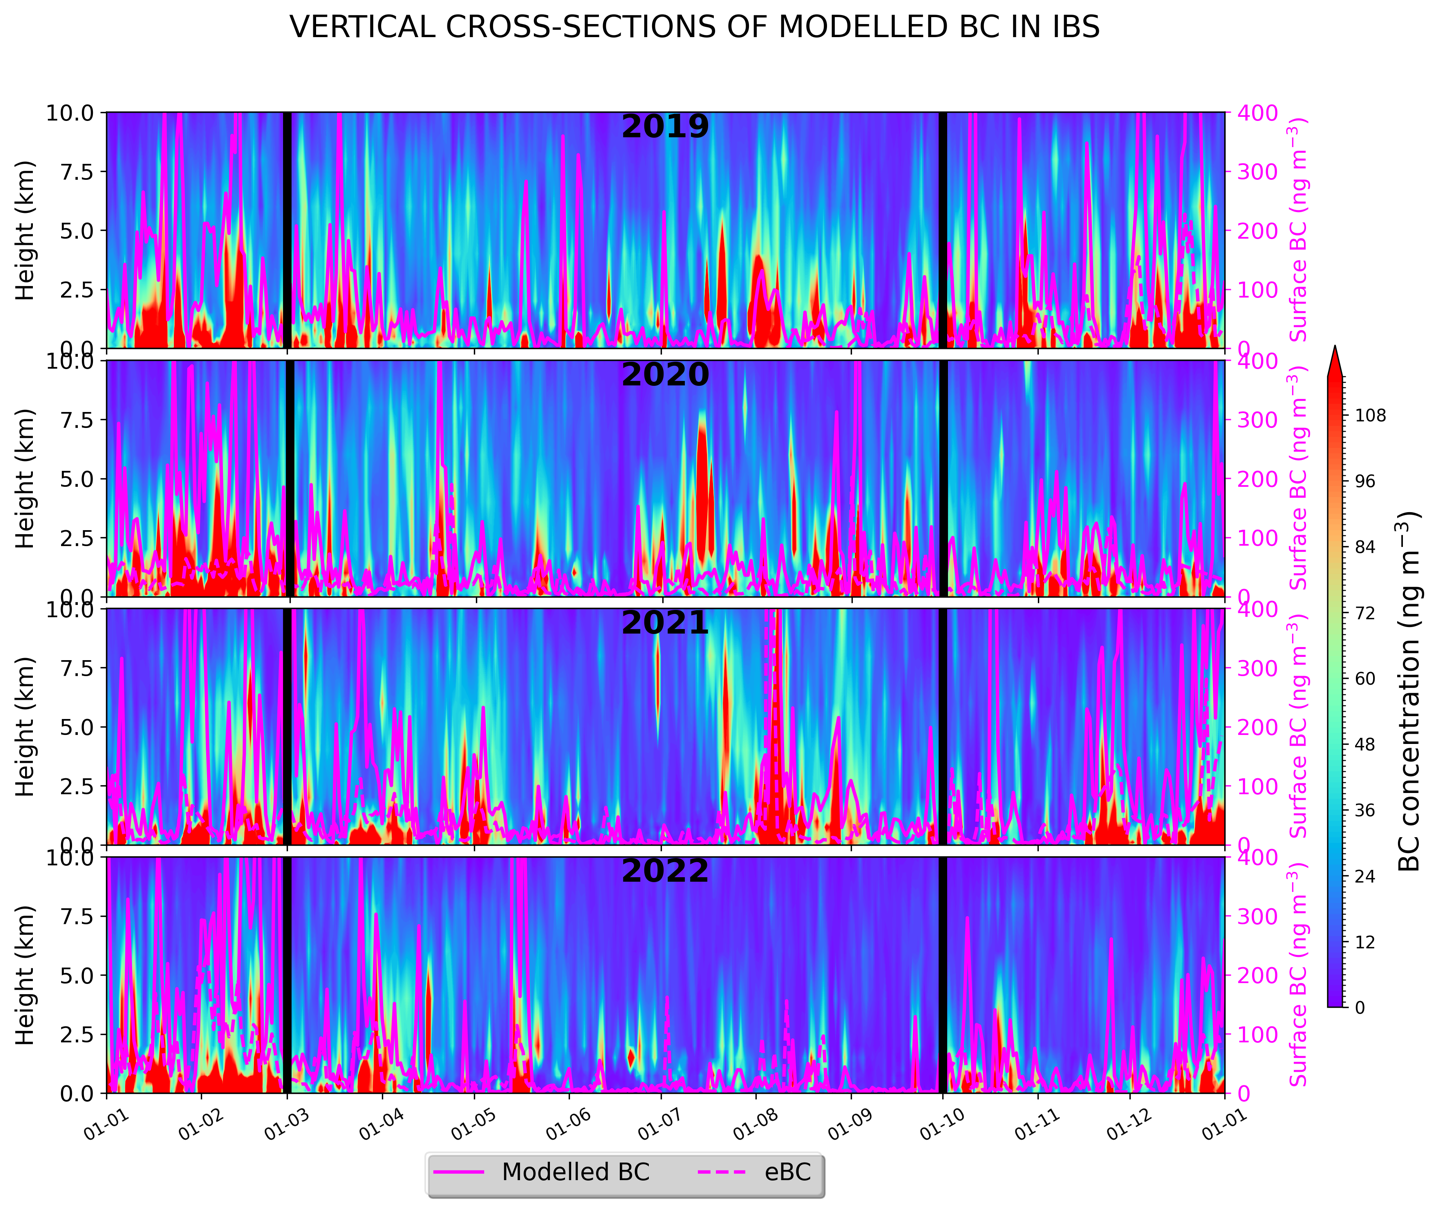
Figure 8Vertical cross-sections of modeled BC for 2019–2022. Solid and dotted fuchsia lines represent modeled daily surface BC and eBC, respectively. Their levels correspond to the right (secondary) axis (also in fuchsia). Boundaries between the cold (November–April) and warm (May–October) seasons are indicated by thick vertical black lines.
4.1 Long-range transport, age, and region contributions
Transport mechanisms from the source regions affect the Arctic BC variability and burden (Chen et al., 2023; Zhou et al., 2012). Transport of aerosols to the Arctic leads to high concentrations of BC in winter and spring (Arctic haze) and low values in summer (Law and Stohl, 2007) when the removal processes in the dry and stable Arctic atmosphere are very slow. Synoptic-scale circulation effects promote the effective transport from lower latitudes, namely diabatic cooling of air masses moving over snow-covered ground, high continental pressure in winter, and the intrusion of warm air from lower latitudes (Gilardoni et al., 2023). Seasonal trends of footprint emission sensitivity demonstrate the transport mechanisms from the source regions to the European Arctic (Platt et al., 2022). BC at Zeppelin is affected by significantly different source regions during the warm and cold seasons, while large-scale circulation patterns that affect the pollutant transport from lower latitudes show the opposite behavior during these two periods (Stathopoulos et al., 2021).
Figure 9 shows a 3.5-year climatology of the surface footprint emission sensitivities at IBS. From December to February, anthropogenic polluted air mass transportation takes place from Eurasia (territories above 40° N), as illustrated by the elevated footprints there. The extension of the Arctic front toward lower latitudes during the cold period facilitates such transport (Stohl, 2006). The warmer it gets in spring, the narrower the area of emission transport. In the transition from spring to summer, transport patterns and meteorological conditions change – for example, the advection of the particulate pollution to the Arctic boundary layer from lower latitudes becomes limited (Bozem et al., 2019). In JJA (June, July, and August), the footprint is mostly restricted to coastal regions of Eurasia, Greenland, and North America and does not extend deeply into the continents. This is a consequence of the so-called “polar dome” that prevents warm continental air masses from entering the Arctic lower troposphere (Stohl, 2006). As a result, anthropogenic pollution becomes less significant, and natural aerosol sources prevail (Moschos et al., 2022b, a). The autumn (September, October, and November) footprint is similar to the MAM (March, April, and May) one, completing the annual cycle.
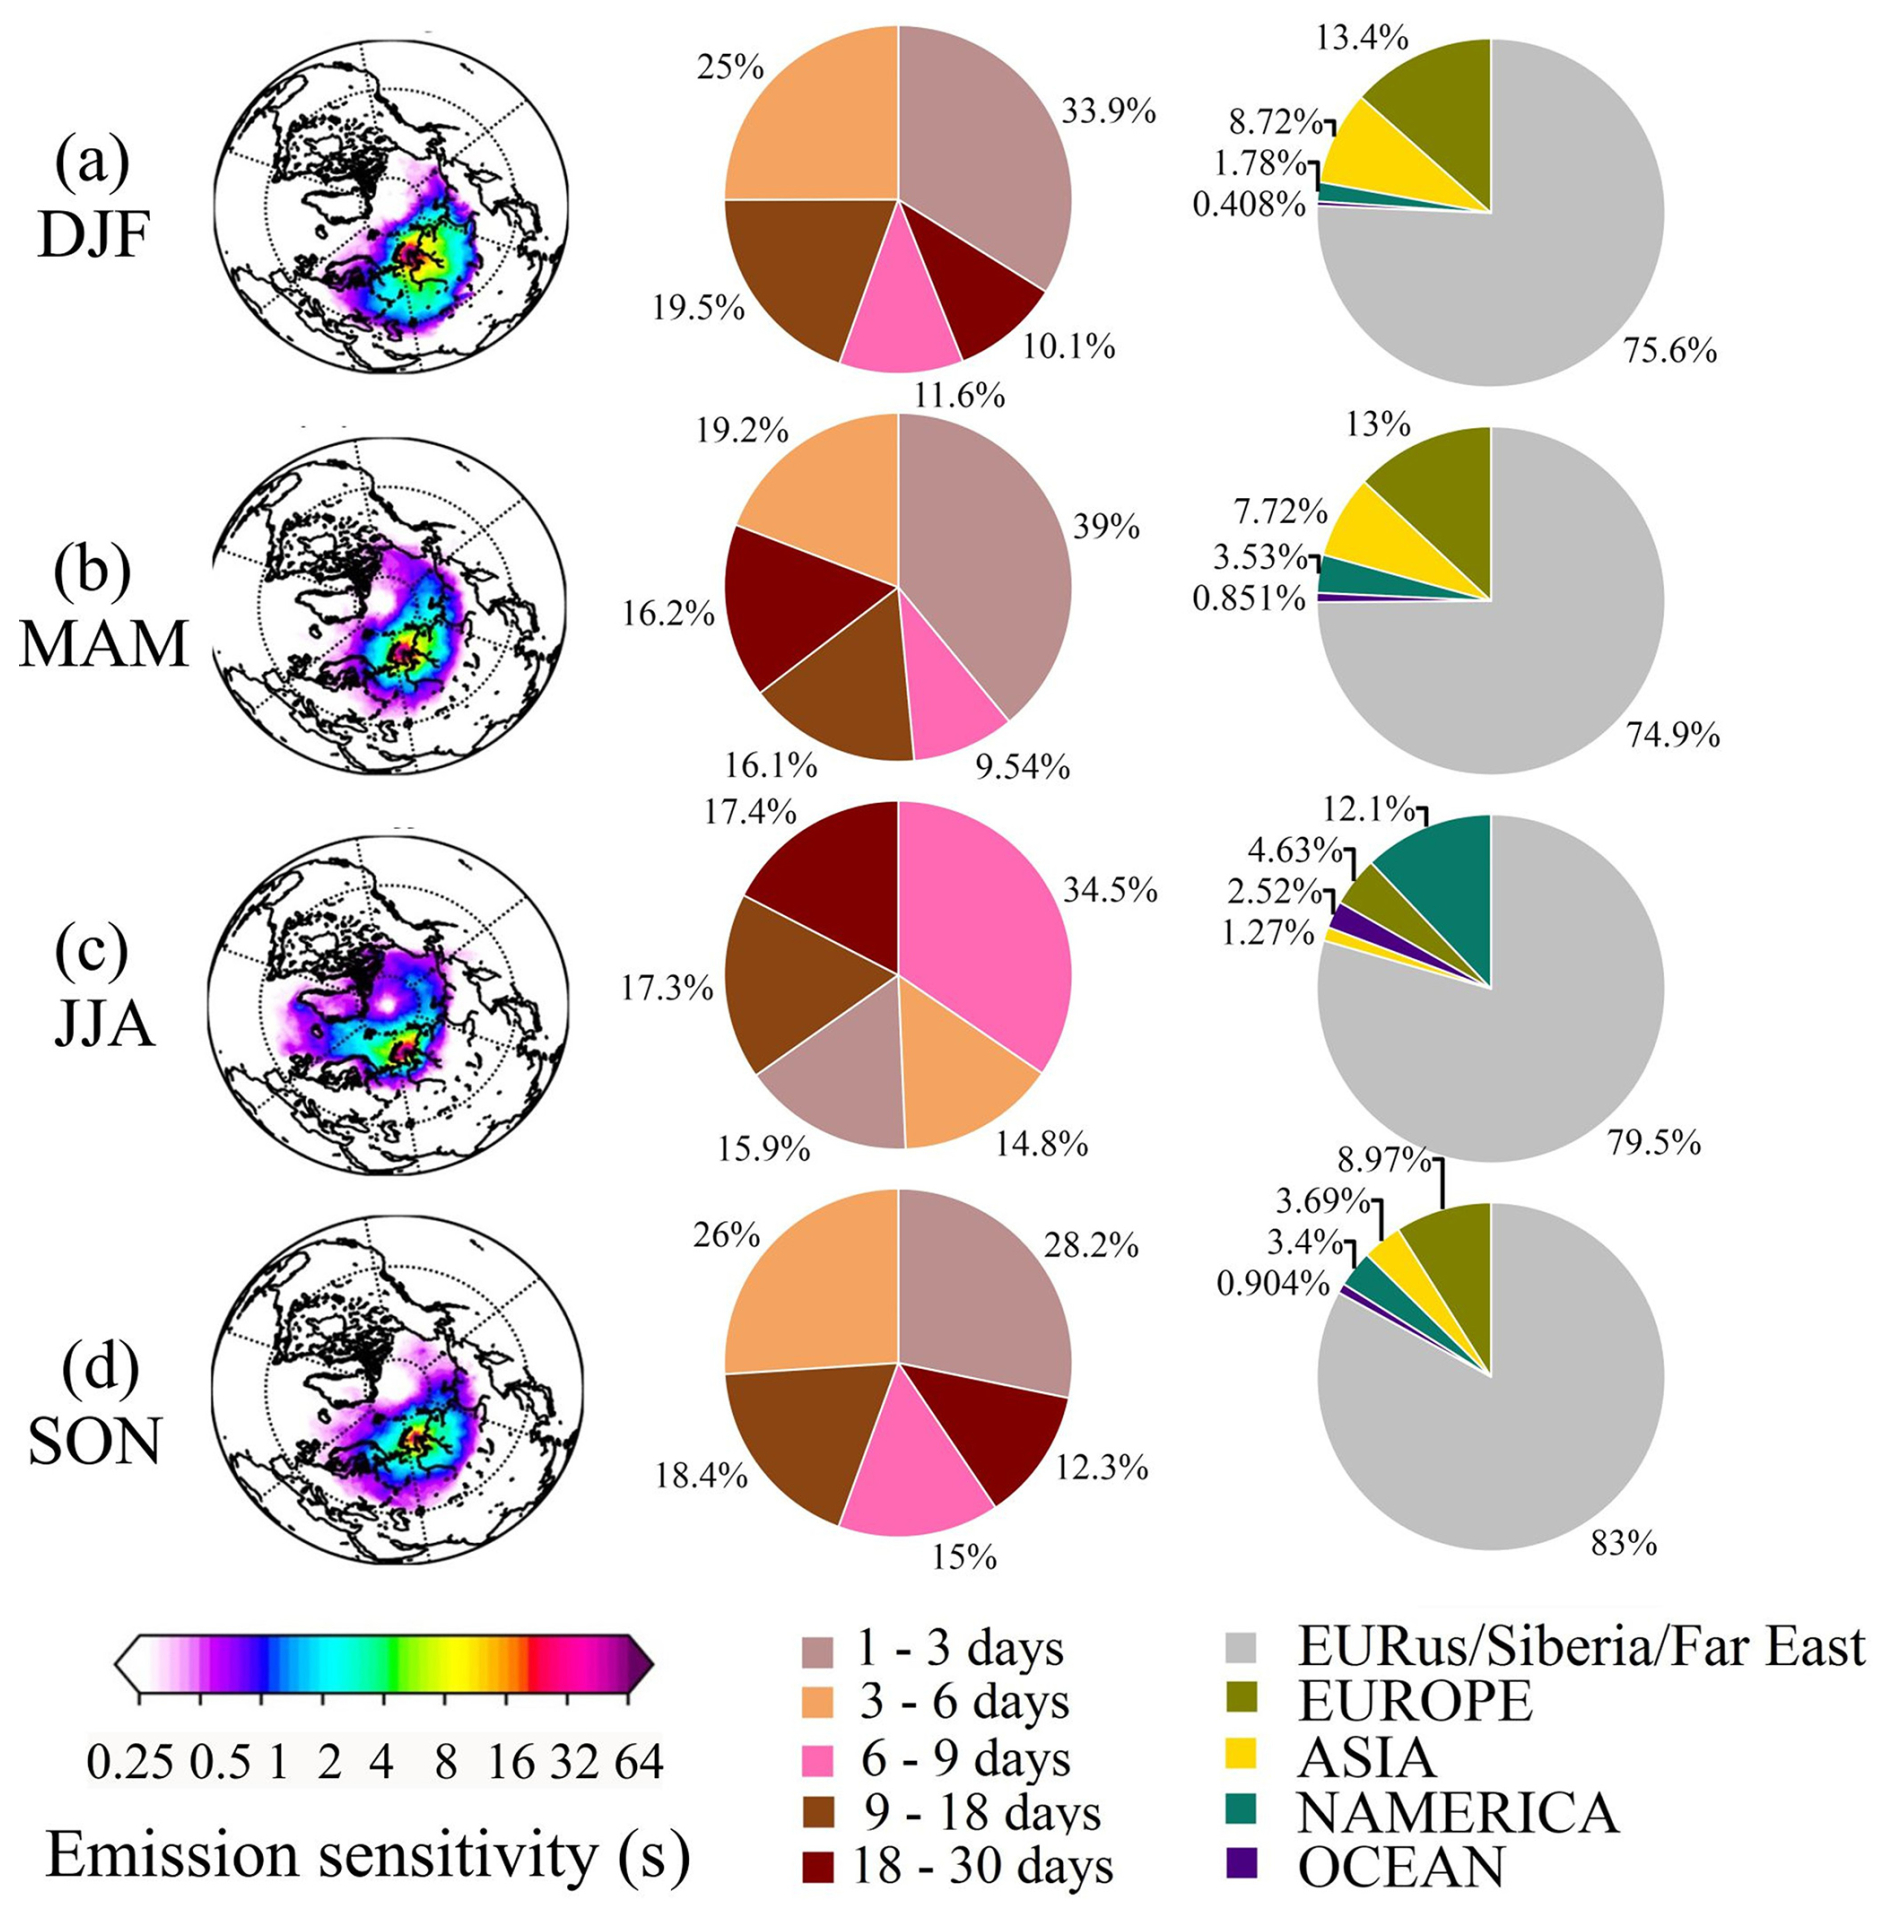
Figure 9(a–d) Seasonal average footprint emission sensitivity (FES), mean age contribution of emissions from different numbers of days back in time, and each region's contribution to surface concentration of BC.
For the entire study period, the monthly mean contribution to surface BC for all years was from air masses with 1–3 d (31 %) and 3–6 d (22 %) aging (Table S4). The highest BC contributions (34 %) and (39 %) were observed for the shortest age of 1–3 d in DJF (December, January, and February) and MAM, respectively (Fig. 8). In summer, the highest BC contribution (35 %) came from air masses with the longer age of 6–9 d.
Footprint emission sensitivities of Arctic air masses also constrain the region contributions. The major source regions contributing BC to IBS are the territory of the Russian Federation (including the European part of Russia (EURus); Siberia; and the Russian Far East – referred to hereafter as the Far East), Asia, Europe, North America, and all oceans. Due to geographical proximity, the EURus/Siberia/Far East contribution (77 %) dominated throughout the entire study period based on the annual average monthly means (Table S4), with a maximum of 83 % in SON (Fig. 9). Its monthly maximum (88 %) was recorded in September 2021 and the minimum (60 %) in June 2022. Europe was the second highest regional contributor (11 %) followed by Asia. The monthly mean contribution of North America was up to 12 % in JJA, the largest was observed in July 2022 (62 %).
4.2 Anthropogenic and biomass burning sources
The time series of monthly mean and annual average monthly mean source contributions to surface BC at IBS are shown in Fig. 10a. Anthropogenic sources (DOM, TRA, IND, FLR, and all others) contribute 97 % of the total for the entire study period (Table S4). A decrease from winter to July and an increase from August to winter were seen. In the cold period, air masses arrived at IBS through the populated regions of Western Europe, EURus, Siberia, and Asia, crossing the biggest oil and gas extraction regions of Kazakhstan, Volga-Ural, Komi, Nenets, and Western Siberia (Fig. 1). Because IBS is located north of the largest oil- and gas-producing regions of Western Siberia, high FLR contributions of 59 % and 32 % were observed both in the cold and warm periods (Table S4). Annual mean contributions to modeled surface BC from FLR, DOM, TRA, and IND sectors dominated in January and December (60 %, 22 %, 12 %, and 9 %, respectively). All other sources were around 2 % at that time. BB played the biggest role between April (8 %) and October (17 %), with a maximum in August (80 %).
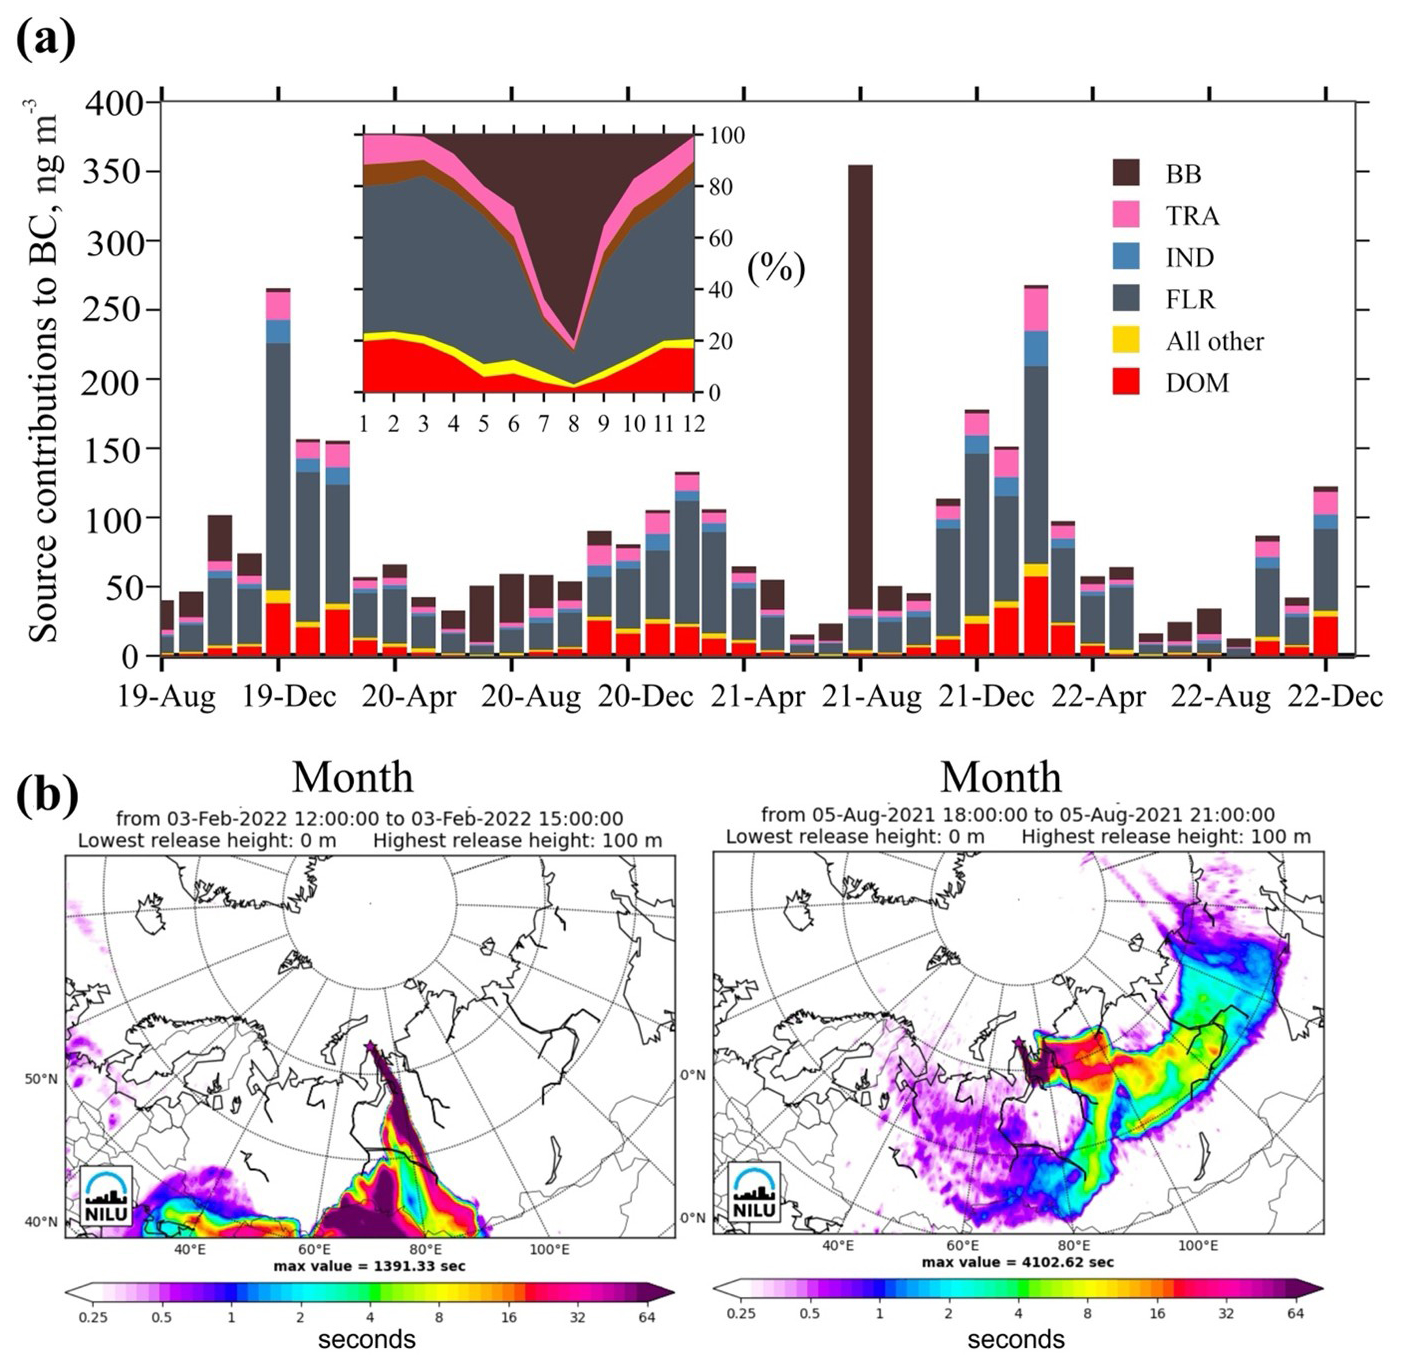
Figure 10(a) Time series of monthly mean contribution from different emission source types to surface BC concentrations for the study period. DOM, BB, TRA, IND, and FLR sectors as well as all others sources were adopted from ECLIPSEv6b and CAMS GFAS. (b) FES maps for 3 February 2022 and 5 August 2021 showing areas with the highest probability of emission origin.
Figure S5 shows the percentage of sectoral contributions to monthly mean BC concentrations for 2021 and 2022, and data for 2019 and 2020 were shown in Fig. 10a. February 2021 and December 2021 were the leaders of FLR impact with 67.2 % and 67.4 %, respectively. During February 2022, of the record-high BC pollution level observed at IBS, air masses arrived at IBS throughout Western Europe, EURus, and Siberia, passing through the flaring facilities of Kazakhstan, Volga-Ural, Komi, Nenets, and Western Siberia. They caused 50 %, 26 %, 15 %, 8 %, 0.2 %, and 3.3 % monthly average contribution to surface BC from FLR, DOM, TRA, IND, BB, and all other sources, respectively. Footprint emission sensitivities on 3 February 2022 at 12:00–15:00 UTC when eBC reached 310 ng m−3 (Fig. S5) showed air mass transport to IBS straight through the Western Siberian gas flaring region (Fig. 10b).
The contribution of FLR dropped significantly from April to a minimum of 18 % in June and rose in September. In the winter months when the overestimation of modeled BC concentrations was recorded (see Sect. 3.4), the highest FLR impact was seen. DOM showed the biggest contribution (18 %) from November to February, exactly during the heating season. The light absorption of BrC was significant mostly in wintertime (Table S3). The latter indicates the significant impact of biomass used for domestic heating, in accordance with the wood burning contribution of 61 % of the total residential emissions in forest regions (Huang et al., 2015).
According to CAMS GFAS (Fig. S3), significant global fire emissions started from June and lasted until the middle of November in 2020 and 2022; the period of fire emissions was shorter but more intensive from July to September 2021. At IBS, the annual mean BB contribution approached 48 % of the total contribution in the warm season (Table S4). It started increasing from April and approached a maximum of 80 % in August, whereas TRA, DOM, IND, and all other sources were minimum. From mid-June to September, the average monthly BB contribution was larger than all anthropogenic sources. Notably, from April to September, the high mean BB contribution was related to the excess of AAE over 1.0 (maximum: 1.7 in July) (Fig. 6). At that time, the air masses transported to IBS were aged (> 6 d), dominating the age spectrum (57 %) (Table S4).
In 2019, 72 400 km2 was burned in Siberia or 42 % of the total burned area that occurred in Russia (Voronova et al., 2020). A significant relationship between the burned areas and associated pyrogenic emissions with atmospheric blocking events was reported (Mokhov et al., 2020). August and September showed 50 % and 35 %, respectively, for monthly mean BB contributions, while October and November showed lower contributions, 30 % and 20 %, respectively (Fig. S4).
In spring 2020, BB and BC concentrations simulated with the WRF-Chem model were distributed in areas between 40 and 60° N in Europe, central Siberia, and East Asia and indicated intensive seasonal agriculture fires in Europe and Siberia (Chen et al., 2023). Spring fires contributed about 12 % BB BC to IBS (April and May). The period that included the end of June and the beginning of July of 2020 was characterized by high-altitude BC, (Fig. 8) indicating high-altitude long-range transport. High BrC content was also observed in July and September 2020 (Table S3).
In 2021, the monthly mean spring BB contribution approached a maximum of 36 % in May. Yakutia (Eastern Siberia) experienced the worst fire season over the last 4 decades (Tomshin and Solovyev, 2022). Around 150 000 fires occurred, almost twice as much as the previous year (Voronova et al., 2022). August 2021 received 90 % contribution from BB, as compared to all the other sources. At that time, unprecedentedly high smoke levels were recorded over Western Siberia (Schneider et al., 2024). A satellite image reveals the strong plume from the area of the Yakutian wildfires, which brought deep smoke to IBS, located roughly 2000 km far away (Fig. 1c). The highest eBC level of 1800 ng m−3 on 5 August 2021 exceeded the 75th percentile of the entire period 53 times (Table 1). The measured concentrations were 180 times higher than the Arctic background (Fig. S6). Severe smoke affected the visibility near IBS (Fig. 1d). Footprint emission sensitivity on 5 August 2021 (from 18:00 to 21:00 UTC) at the time when eBC peaked (1540 ng m−3) confirms that air masses originated from Yakutia and arrived to IBS from the northeast direction (Fig. 10b). BC for these wildfires was transported at altitudes as high as 10 km (Fig. 8). Finally, in summer 2022, wildfires took place in Western Siberia and the EURus (Popovicheva et al., 2023); BB contributions in June, July, and August 2022 were around 65 %, whereas light absorption of BrC was important in May and August 2022 (Table S3).
At the aerosol station, we presented 4 years (2019–2022) of observations IBS with respect to light-absorption characteristics of Western Siberian polar aerosols and their basic cycles, such as seasonality, annual means, and interannual variability. The annual cycle of multi-wavelength light absorption demonstrates higher levels during the Arctic haze season and lower levels in the summer, similar to other Arctic observations. The light-absorption coefficient revealed several unique features as follows.
Higher values of the light-absorption coefficient (around 4–5 times) were observed in comparison with multi-year observations at high-latitude polar stations in the European Arctic (annual mean of 0.7±0.7 M m−1 in the cold season and 2 times lower in warm). The wintertime maximum was observed in February (0.9±0.8 M m−1), which coincides with the Arctic haze peak; this is different from the European and Canadian Arctic where the maximum is usually observed in early spring. The interannual minimum was observed in June, whereas August was highly variable with respect to light absorption due to the Siberian wildfires. Multi-annual monthly means for babs(880) in the visible spectrum at IBS were found higher than at European, Canadian, and western high-latitude polar locations, due to the fact that IBS is closer to the main northern Eurasian source regions.
Wildfires caused increased concentrations, usually in August. The increase in the AAE in the UV spectrum between April and September implies coexistence of highly mixed/aged BC and light-absorbing BrC components. Specifically, monthly BrC contribution to total light absorption was 5 % in February 2022 and 13 % in August 2021 likely due to wildfire impact. BrC light-absorption coefficient in the UV spectrum showed similar trends as BC, although it exceeded BC by 2.4 times during both cold and warm periods. The AAE was equal to 0.96, indicating highly mixed and aged aerosols. The AAE in the UV spectrum increase of up to 1.17±0.5 implies coexistence of light-absorbing BrC components in BB aerosols, with the biggest impact between April and September.
We calculated SAC for the first time at IBS by combining multi-year optical absorption and EC data. Higher SAC of 18.1 m2 g−1 in the warm period than in the cold one (15.9 m2 g−1) revealed influence from non-BC light-absorbing species, such as organic matter and mineral dust; SAC values were lower than those observed in the Canadian Arctic indicating different aerosol composition and aging. Mean eBC in the cold and mean eBC in the warm periods were equal to 44±47 and 19±57 ng m−3, respectively. Record-high eBC was found in February 2022 (106±67 ng m−3) and August 2021 (83±249 ng m−3) during the years of study.
Observations at the IBS station evaluated the relationship between eBCAET and EC under specific atmospheric conditions. eBC, recalculated using site-specific absorption coefficients, reflects seasonal variations and provides insights into aerosol composition. Annual cycles follow typical Arctic trends, with higher eBC concentrations in winter when air masses primarily originate from Russia, Siberia, the Far East, Europe, and Asia. During this period, black carbon from gas flaring dominates, particularly in January, when air masses pass over oil and gas facilities in Kazakhstan, Volga-Ural, Komi, Nenets, and Western Siberia. In summer, contribution from biomass burning (BB) from Siberian wildfires surpasses contribution from anthropogenic sources, peaking in August 2021, which saw the worst fire season in 4 decades, bringing heavy smoke to IBS. February 2022 also recorded extreme BC pollution levels.
Modeling analyses indicate that 77 % of BC transport originated from Russia, Siberia, and the Far East, followed by Europe (11 %), Asia (7 %), and North America (4 %). In winter, air masses traveled 1–3 d from Eurasia (north of 40° N) to IBS, whereas in summer, transport took 6–9 d. The low-injection-altitude anthropogenic emissions created a persistent BC layer at altitudes up to 2 km in the cold season, reaching 4 km in February 2020, with record concentrations of 100 ng m−3. In contrast, wildfire smoke in summer elevated BC layers to higher altitudes.
Anthropogenic emissions accounted for 83 % of BC during the study period, dominated by gas flaring (FLR, 59 %), domestic heating (DOM, 18 %), traffic (TRA, 10 %), and industry (IND, 7 %) during the Arctic haze period. Gas flaring remained the primary contributor year-round (59 % in winter, 32 % in summer), given IBS's proximity to major oil and gas regions. Residential heating peaked in winter (18 %), aligning with enhanced brown carbon (BrC) absorption from wood burning. In February 2022, modeled BC concentrations reached 310 ng m−3 as air masses passed through major flaring regions, though overestimation suggests miscalculated source intensities.
BB contributions peaked at 48 % in the warm season, surpassing anthropogenic sources from mid-June to September, with a maximum of 80 % in August. Extreme vertical BC events reached 8 km in July 2020 and 10 km in August 2021 due to wildfires. In May 2021, BB contributions reached 36 % due to strong agricultural fires in Siberia, while in August 2021, 90 % of BC at IBS originated from Yakutia's wildfires, 2000 km away.
The increasing intensity and frequency of wildfires at high latitudes highlight the importance of carbonaceous aerosol measurements. These observations provide critical insights into Arctic aerosol radiative properties, particularly in the UV–VIS spectrum, where enhanced light absorption contributes to amplified Arctic warming, especially in summer.
All modeling data from this study are available for download from https://atmo-access.nilu.no/BELY2_MSU.py (Evangeliou and Eckhardt, 2024). The FLEXPART version 10.4 model can be downloaded from https://www.flexpart.eu (Pisso et al., 2019). Black carbon observations are available upon request from Olga B. Popovicheva.
The supplement related to this article is available online at https://doi.org/10.5194/acp-25-7719-2025-supplement.
OBP supervised the station operation, interpreted data, and wrote the paper. NE performed all the FLEXPART simulations and analyses and wrote and coordinated the paper. MAC analyzed the data, prepared the figures, and assisted in the interpretation of the results. ED provided supporting AAE calculations and evaluation of data quality. NSK supported the research. All authors contributed to the final version of the paper.
The contact author has declared that none of the authors has any competing interests.
Publisher's note: Copernicus Publications remains neutral with regard to jurisdictional claims made in the text, published maps, institutional affiliations, or any other geographical representation in this paper. While Copernicus Publications makes every effort to include appropriate place names, the final responsibility lies with the authors.
This research was performed within the framework of the development program “Future Planet and Global Environmental Change” of the Interdisciplinary Scientific and Educational School of M. V. Lomonosov Moscow State University (MSU). For instrument calibration, the equipment of the MSU Shared Research Equipment Center, “Technologies for obtaining new nanostructured materials and their complex study”, was used. This equipment was purchased by MSU within the framework of the Equipment Renovation Program (National Project “Science”). The authors thank Magee Scientific for AE33 instrumentation support and Asta Gregorič for data examination. Vasily Olegovich Kobelev is thanked for handling data analyses over all study years.
The article processing charges for this publication were paid for by NILU. The authors thank the Russian Geographical Society for data-treatment support and the Institute of Environmental Survey, Planning, and Assessment (IESPA), which partly supported the instrumentation and power supply of IBS.
The developed methodology of the aethalometric measurements was implemented within the framework of the Russian Science Foundation project no. 19-77-3004. Publisher’s note: the article processing charges for this publication were not paid by a Russian or Belarusian institution.
This paper was edited by Andreas Petzold and reviewed by two anonymous referees.
AMAP: AMAP assessment 2015: Black carbon and ozone as Arctic climate forcers, Arctic Monitoring and Assessment Programme (AMAP), Oslo, Norway, 128 pp., ISBN 978-82-7971-092-9, 2015.
AMAP: AMAP Arctic Climate Change Update 2021: Key Trends and Impacts, https://www.amap.no/documents/download/6759/inline (last access: 6 October 2024), 2021.
Arnold, S. R., Law, K. S., Brock, C. A., Thomas, J. L., Starkweather, S. M., Von Salzen, K., Stohl, A., Sharma, S., Lund, M. T., Flanner, M. G., Petäjä, T., Tanimoto, H., Gamble, J., Dibb, J. E., Melamed, M., Johnson, N., Fidel, M., Tynkkynen, V. P., Baklanov, A., Eckhardt, S., Monks, S. A., Browse, J., and Bozem, H.: Arctic air pollution: Challenges and opportunities for the next decade, Elementa, 2016, 1–17, 2016.
Asmi, E., Kivekäs, N., Kerminen, V.-M., Komppula, M., Hyvärinen, A.-P., Hatakka, J., Viisanen, Y., and Lihavainen, H.: Secondary new particle formation in Northern Finland Pallas site between the years 2000 and 2010, Atmos. Chem. Phys., 11, 12959–12972, https://doi.org/10.5194/acp-11-12959-2011, 2011.
Asmi, E., Backman, J., Servomaa, H., Virkkula, A., Gini, M. I., Eleftheriadis, K., Müller, T., Ohata, S., Kondo, Y., and Hyvärinen, A.: Absorption instruments inter-comparison campaign at the Arctic Pallas station, Atmos. Meas. Tech., 14, 5397–5413, https://doi.org/10.5194/amt-14-5397-2021, 2021.
Backman, J., Schmeisser, L., Virkkula, A., Ogren, J. A., Asmi, E., Starkweather, S., Sharma, S., Eleftheriadis, K., Uttal, T., Jefferson, A., Bergin, M., Makshtas, A., Tunved, P., and Fiebig, M.: On Aethalometer measurement uncertainties and an instrument correction factor for the Arctic, Atmos. Meas. Tech., 10, 5039–5062, https://doi.org/10.5194/amt-10-5039-2017, 2017.
Bali, K., Banerji, S., Campbell, J. R., Bhakta, A. V., Chen, L. W. A., Holmes, C. D., and Mao, J.: Measurements of brown carbon and its optical properties from boreal forest fires in Alaska summer, Atmos. Environ., 324, 120436, https://doi.org/10.1016/j.atmosenv.2024.120436, 2024.
Bond, T. C., Doherty, S. J., Fahey, D. W., Forster, P. M., Berntsen, T., Deangelo, B. J., Flanner, M. G., Ghan, S., Kärcher, B., Koch, D., Kinne, S., Kondo, Y., Quinn, P. K., Sarofim, M. C., Schultz, M. G., Schulz, M., Venkataraman, C., Zhang, H., Zhang, S., Bellouin, N., Guttikunda, S. K., Hopke, P. K., Jacobson, M. Z., Kaiser, J. W., Klimont, Z., Lohmann, U., Schwarz, J. P., Shindell, D., Storelvmo, T., Warren, S. G., and Zender, C. S.: Bounding the role of black carbon in the climate system: A scientific assessment, J. Geophys. Res.-Atmos., 118, 5380–5552, https://doi.org/10.1002/jgrd.50171, 2013.
Bondur, V. G., Voronova, O. S., Cherepanova, E. V., Tsidilina, M. N., and Zima, A. L.: Spatiotemporal Analysis of Multi-Year Wildfires and Emissions of Trace Gases and Aerosols in Russia Based on Satellite Data, Izv.-Atmos. Ocean Phy., 56, 1457–1469, https://doi.org/10.1134/S0001433820120348, 2020.
Böttcher, K., Paunu, V.-V., Kupiainen, K., Zhizhin, M., Matveev, A., Savolahti, M., Klimont, Z., Väätäinen, S., Lamberg, H., and Karvosenoja, N.: Black carbon emissions from flaring in Russia in the period 2012–2017, Atmos. Environ., 254, 118390, https://doi.org/10.1016/j.atmosenv.2021.118390, 2021.
Bozem, H., Hoor, P., Kunkel, D., Köllner, F., Schneider, J., Herber, A., Schulz, H., Leaitch, W. R., Aliabadi, A. A., Willis, M. D., Burkart, J., and Abbatt, J. P. D.: Characterization of transport regimes and the polar dome during Arctic spring and summer using in situ aircraft measurements, Atmos. Chem. Phys., 19, 15049–15071, https://doi.org/10.5194/acp-19-15049-2019, 2019.
Cappa, C. D., Kolesar, K. R., Zhang, X., Atkinson, D. B., Pekour, M. S., Zaveri, R. A., Zelenyuk, A., and Zhang, Q.: Understanding the optical properties of ambient sub- and supermicron particulate matter: results from the CARES 2010 field study in northern California, Atmos. Chem. Phys., 16, 6511–6535, https://doi.org/10.5194/acp-16-6511-2016, 2016.
Cassiani, M., Stohl, A., and Brioude, J.: Lagrangian Stochastic Modelling of Dispersion in the Convective Boundary Layer with Skewed Turbulence Conditions and a Vertical Density Gradient: Formulation and Implementation in the FLEXPART Model, Bound.-Lay. Meteorol., 154, 367–390, https://doi.org/10.1007/s10546-014-9976-5, 2015.
Chakrabarty, R. K., Moosmüller, H., Chen, L.-W. A., Lewis, K., Arnott, W. P., Mazzoleni, C., Dubey, M. K., Wold, C. E., Hao, W. M., and Kreidenweis, S. M.: Brown carbon in tar balls from smoldering biomass combustion, Atmos. Chem. Phys., 10, 6363–6370, https://doi.org/10.5194/acp-10-6363-2010, 2010.
Chen, X., Kang, S., Yang, J., and Hu, Y.: Contributions of biomass burning in 2019 and 2020 to Arctic black carbon and its transport pathways, Atmos. Res., 296, 107069, https://doi.org/10.1016/j.atmosres.2023.107069, 2023.
Cuesta-Mosquera, A., Glojek, K., Močnik, G., Drinovec, L., Gregorič, A., Rigler, M., Ogrin, M., Romshoo, B., Weinhold, K., Merkel, M., van Pinxteren, D., Herrmann, H., Wiedensohler, A., Pöhlker, M., and Müller, T.: Optical properties and simple forcing efficiency of the organic aerosols and black carbon emitted by residential wood burning in rural central Europe, Atmos. Chem. Phys., 24, 2583–2605, https://doi.org/10.5194/acp-24-2583-2024, 2024.
Drinovec, L., Močnik, G., Zotter, P., Prévôt, A. S. H., Ruckstuhl, C., Coz, E., Rupakheti, M., Sciare, J., Müller, T., Wiedensohler, A., and Hansen, A. D. A.: The ”dual-spot” Aethalometer: an improved measurement of aerosol black carbon with real-time loading compensation, Atmos. Meas. Tech., 8, 1965–1979, https://doi.org/10.5194/amt-8-1965-2015, 2015.
Eleftheriadis, K., Vratolis, S., and Nyeki, S.: Aerosol black carbon in the European Arctic: Measurements at Zeppelin station, Ny-Ålesund, Svalbard from 1998–2007, Geophys. Res. Lett., 36, L02809, https://doi.org/10.1029/2008GL035741, 2009.
Evangeliou, N. and Eckhardt, S.: FLEXPART products for BC measurements, https://atmo-access.nilu.no/BELY2_MSU.py, last access: 6 October 2024.
Evangeliou, N., Balkanski, Y., Hao, W. M., Petkov, A., Silverstein, R. P., Corley, R., Nordgren, B. L., Urbanski, S. P., Eckhardt, S., Stohl, A., Tunved, P., Crepinsek, S., Jefferson, A., Sharma, S., Nøjgaard, J. K., and Skov, H.: Wildfires in northern Eurasia affect the budget of black carbon in the Arctic – a 12-year retrospective synopsis (2002–2013), Atmos. Chem. Phys., 16, 7587–7604, https://doi.org/10.5194/acp-16-7587-2016, 2016.
Evangeliou, N., Platt, S. M., Eckhardt, S., Lund Myhre, C., Laj, P., Alados-Arboledas, L., Backman, J., Brem, B. T., Fiebig, M., Flentje, H., Marinoni, A., Pandolfi, M., Yus-Dìez, J., Prats, N., Putaud, J. P., Sellegri, K., Sorribas, M., Eleftheriadis, K., Vratolis, S., Wiedensohler, A., and Stohl, A.: Changes in black carbon emissions over Europe due to COVID-19 lockdowns, Atmos. Chem. Phys., 21, 2675–2692, https://doi.org/10.5194/acp-21-2675-2021, 2021.
Flanner, M. G.: Arctic climate sensitivity to local black carbon, J. Geophys. Res.-Atmos., 118, 1840–1851, https://doi.org/10.1002/jgrd.50176, 2013.
Forster, C., Stohl, A., and Seibert, P.: Parameterization of convective transport in a Lagrangian particle dispersion model and its evaluation, J. Appl. Meteorol. Clim., 46, 403–422, https://doi.org/10.1175/JAM2470.1, 2007.
Gilardoni, S., Heslin-Rees, D., Mazzola, M., Vitale, V., Sprenger, M., and Krejci, R.: Drivers controlling black carbon temporal variability in the lower troposphere of the European Arctic, Atmos. Chem. Phys., 23, 15589–15607, https://doi.org/10.5194/acp-23-15589-2023, 2023.
Gramlich, Y., Siegel, K., Haslett, S. L., Cremer, R. S., Lunder, C., Kommula, S. M., Buchholz, A., Yttri, K. E., Chen, G., Krejci, R., Zieger, P., Virtanen, A., Riipinen, I., and Mohr, C.: Impact of Biomass Burning on Arctic Aerosol Composition, ACS Earth and Space Chemistry, 8, 5, 920–936, https://doi.org/10.1021/acsearthspacechem.3c00187, 2024.
Grange, S. K., Lötscher, H., Fischer, A., Emmenegger, L., and Hueglin, C.: Evaluation of equivalent black carbon source apportionment using observations from Switzerland between 2008 and 2018, Atmos. Meas. Tech., 13, 1867–1885, https://doi.org/10.5194/amt-13-1867-2020, 2020.
Grythe, H., Kristiansen, N. I., Groot Zwaaftink, C. D., Eckhardt, S., Ström, J., Tunved, P., Krejci, R., and Stohl, A.: A new aerosol wet removal scheme for the Lagrangian particle model FLEXPART v10, Geosci. Model Dev., 10, 1447–1466, https://doi.org/10.5194/gmd-10-1447-2017, 2017.
Helin, A., Virkkula, A., Backman, J., Pirjola, L., Sippula, O., Aakko-Saksa, P., Väätäinen, S., Mylläri, F., Järvinen, A., Bloss, M., Aurela, M., Jakobi, G., Karjalainen, P., Zimmermann, R., Jokiniemi, J., Saarikoski, S., Tissari, J., Rönkkö, T., Niemi, J. V., and Timonen, H.: Variation of Absorption Ångström Exponent in Aerosols From Different Emission Sources, J. Geophys. Res.-Atmos., 126, e2020JD034094, https://doi.org/10.1029/2020JD034094, 2021.
Hersbach, H., Bell, B., Berrisford, P., Hirahara, S., Horányi, A., Muñoz-Sabater, J., Nicolas, J., Peubey, C., Radu, R., Schepers, D., Simmons, A., Soci, C., Abdalla, S., Abellan, X., Balsamo, G., Bechtold, P., Biavati, G., Bidlot, J., Bonavita, M., De Chiara, G., Dahlgren, P., Dee, D., Diamantakis, M., Dragani, R., Flemming, J., Forbes, R., Fuentes, M., Geer, A., Haimberger, L., Healy, S., Hogan, R. J., Hólm, E., Janisková, M., Keeley, S., Laloyaux, P., Lopez, P., Lupu, C., Radnoti, G., de Rosnay, P., Rozum, I., Vamborg, F., Villaume, S., and Thépaut, J. N.: The ERA5 global reanalysis, Q. J. Roy. Meteor. Soc., 146, 1999–2049, https://doi.org/10.1002/qj.3803, 2020.
Heslin-Rees, D., Burgos, M., Hansson, H.-C., Krejci, R., Ström, J., Tunved, P., and Zieger, P.: From a polar to a marine environment: has the changing Arctic led to a shift in aerosol light scattering properties?, Atmos. Chem. Phys., 20, 13671–13686, https://doi.org/10.5194/acp-20-13671-2020, 2020.
Huang, K., Fu, J. S., Prikhodko, V. Y., Storey, J. M., Romanov, A., Hodson, E. L., Cresko, J., Morozova, I., Ignatieva, Y., and Cabaniss, J.: Russian anthropogenic black carbon: Emission reconstruction and Arctic black carbon simulation, J. Geophys. Res.-Atmos., 120, 11306–11333, https://doi.org/10.1002/2015JD023358, 2015.
Ivančič, M., Gregorič, A., Lavrič, G., Alföldy, B., Ježek, I., Hasheminassab, S., Pakbin, P., Ahangar, F., Sowlat, M., Boddeker, S., and Rigler, M.: Two-year-long high-time-resolution apportionment of primary and secondary carbonaceous aerosols in the Los Angeles Basin using an advanced total carbon–black carbon (TC-BC(λ)) method, Sci. Total Environ., 848, 157606, https://doi.org/10.1016/j.scitotenv.2022.157606, 2022.
Johnson, M. S., Strawbridge, K., Knowland, K. E., Keller, C., and Travis, M.: Long-range transport of Siberian biomass burning emissions to North America during FIREX-AQ, Atmos. Environ., 252, 118241, https://doi.org/10.1016/j.atmosenv.2021.118241, 2021.
Kaiser, J. W., Heil, A., Andreae, M. O., Benedetti, A., Chubarova, N., Jones, L., Morcrette, J.-J., Razinger, M., Schultz, M. G., Suttie, M., and van der Werf, G. R.: Biomass burning emissions estimated with a global fire assimilation system based on observed fire radiative power, Biogeosciences, 9, 527–554, https://doi.org/10.5194/bg-9-527-2012, 2012.
Kanaya, Y., Komazaki, Y., Pochanart, P., Liu, Y., Akimoto, H., Gao, J., Wang, T., and Wang, Z.: Mass concentrations of black carbon measured by four instruments in the middle of Central East China in June 2006, Atmos. Chem. Phys., 8, 7637–7649, https://doi.org/10.5194/acp-8-7637-2008, 2008.
Kasischke, E. S. and Turetsky, M. R.: Recent changes in the fire regime across the North American boreal region – Spatial and temporal patterns of burning across Canada and Alaska, Geophys. Res. Lett., 33, L09703, https://doi.org/10.1029/2006GL025677, 2006.
Kharuk, V. I. and Ponomarev, E. I.: Spatiotemporal characteristics of wildfire frequency and relative area burned in larch-dominated forests of Central Siberia, Russ. J. Ecol., 48, 507–512, https://doi.org/10.1134/S1067413617060042, 2017.
Klimont, Z., Kupiainen, K., Heyes, C., Purohit, P., Cofala, J., Rafaj, P., Borken-Kleefeld, J., and Schöpp, W.: Global anthropogenic emissions of particulate matter including black carbon, Atmos. Chem. Phys., 17, 8681–8723, https://doi.org/10.5194/acp-17-8681-2017, 2017.
Kostrykin, S., Revokatova, A., Chernenkov, A., Ginzburg, V., Polumieva, P., and Zelenova, M.: Black carbon emissions from the siberian fires 2019: Modelling of the atmospheric transport and possible impact on the radiation balance in the arctic region, Atmos.-Basel, 12, 814, https://doi.org/10.3390/atmos12070814, 2021.
Law, K. S. and Stohl, A.: Arctic Air Pollution: Origins and Impacts, Science, 315, 1537–1540, https://doi.org/10.1126/science.1137695, 2007.
Lee, Y. H., Lamarque, J.-F., Flanner, M. G., Jiao, C., Shindell, D. T., Berntsen, T., Bisiaux, M. M., Cao, J., Collins, W. J., Curran, M., Edwards, R., Faluvegi, G., Ghan, S., Horowitz, L. W., McConnell, J. R., Ming, J., Myhre, G., Nagashima, T., Naik, V., Rumbold, S. T., Skeie, R. B., Sudo, K., Takemura, T., Thevenon, F., Xu, B., and Yoon, J.-H.: Evaluation of preindustrial to present-day black carbon and its albedo forcing from Atmospheric Chemistry and Climate Model Intercomparison Project (ACCMIP), Atmos. Chem. Phys., 13, 2607–2634, https://doi.org/10.5194/acp-13-2607-2013, 2013.
Manousakas, M., Popovicheva, O., Evangeliou, N., Diapouli, E., Sitnikov, N., Shonija, N., and Eleftheriadis, K.: Aerosol carbonaceous, elemental and ionic composition variability and origin at the Siberian High Arctic, Cape Baranova, Tellus B, 72, 1803708, https://doi.org/10.1080/16000889.2020.1803708, 2020.
Markowicz, K. M., Pakszys, P., Ritter, C., Zielinski, T., Udisti, R., Cappelletti, D., Mazzola, M., Shiobara, M., Xian, P., Zawadzka, O., Lisok, J., Petelski, T., Makuch, P., and Karasinski, G.: Impact of North American intense fires on aerosol optical properties measured over the European Arctic in July 2015, J. Geophys. Res., 121, 14487–14512, https://doi.org/10.1002/2016JD025310, 2016.
Massling, A., Nielsen, I. E., Kristensen, D., Christensen, J. H., Sørensen, L. L., Jensen, B., Nguyen, Q. T., Nøjgaard, J. K., Glasius, M., and Skov, H.: Atmospheric black carbon and sulfate concentrations in Northeast Greenland, Atmos. Chem. Phys., 15, 9681–9692, https://doi.org/10.5194/acp-15-9681-2015, 2015.
Matsui, H., Mori, T., Ohata, S., Moteki, N., Oshima, N., Goto-Azuma, K., Koike, M., and Kondo, Y.: Contrasting source contributions of Arctic black carbon to atmospheric concentrations, deposition flux, and atmospheric and snow radiative effects, Atmos. Chem. Phys., 22, 8989–9009, https://doi.org/10.5194/acp-22-8989-2022, 2022.
Mokhov, I. I., Bondur, V. G., Sitnov, S. A., and Voronova, O. S.: Satellite Monitoring of Wildfires and Emissions into the Atmosphere of Combustion Products in Russia: Relation to Atmospheric Blockings, Dokl. Earth Sci., 495, 921–924, https://doi.org/10.1134/S1028334X20120089, 2020.
Moschos, V., Schmale, J., Aas, W., Becagli, S., Calzolai, G., Eleftheriadis, K., Moffett, C. E., Schnelle-Kreis, J., Severi, M., Sharma, S., Skov, H., Vestenius, M., Zhang, W., Hakola, H., Hellén, H., Huang, L., Jaffrezo, J. L., Massling, A., Nøjgaard, J. K., Petäjä, T., Popovicheva, O., Sheesley, R. J., Traversi, R., Yttri, K. E., Prévôt, A. S. H., Baltensperger, U., and El Haddad, I.: Elucidating the present-day chemical composition, seasonality and source regions of climate-relevant aerosols across the Arctic land surface, Environ. Res. Lett., 17, 034032, https://doi.org/10.1088/1748-9326/ac444b, 2022a.
Moschos, V., Dzepina, K., Bhattu, D., Lamkaddam, H., Casotto, R., Daellenbach, K. R., Canonaco, F., Rai, P., Aas, W., Becagli, S., Calzolai, G., Eleftheriadis, K., Moffett, C. E., Schnelle-Kreis, J., Severi, M., Sharma, S., Skov, H., Vestenius, M., Zhang, W., Hakola, H., Hellén, H., Huang, L., Jaffrezo, J. L., Massling, A., Nøjgaard, J. K., Petäjä, T., Popovicheva, O., Sheesley, R. J., Traversi, R., Yttri, K. E., Schmale, J., Prévôt, A. S. H., Baltensperger, U., and El Haddad, I.: Equal abundance of summertime natural and wintertime anthropogenic Arctic organic aerosols, Nat. Geosci., 15, 196–202, https://doi.org/10.1038/s41561-021-00891-1, 2022b.
Ohata, S., Mori, T., Kondo, Y., Sharma, S., Hyvärinen, A., Andrews, E., Tunved, P., Asmi, E., Backman, J., Servomaa, H., Veber, D., Eleftheriadis, K., Vratolis, S., Krejci, R., Zieger, P., Koike, M., Kanaya, Y., Yoshida, A., Moteki, N., Zhao, Y., Tobo, Y., Matsushita, J., and Oshima, N.: Estimates of mass absorption cross sections of black carbon for filter-based absorption photometers in the Arctic, Atmos. Meas. Tech., 14, 6723–6748, https://doi.org/10.5194/amt-14-6723-2021, 2021.
Paris, J.-D., Stohl, A., Nédélec, P., Arshinov, M. Yu., Panchenko, M. V., Shmargunov, V. P., Law, K. S., Belan, B. D., and Ciais, P.: Wildfire smoke in the Siberian Arctic in summer: source characterization and plume evolution from airborne measurements, Atmos. Chem. Phys., 9, 9315–9327, https://doi.org/10.5194/acp-9-9315-2009, 2009.
Petzold, A., Rasp, K., Weinzierl, B., Esselborn, M., Hamburger, T., Dörnbrack, A., Kandler, K., Schütz, L., Knippertz, P., Fiebig, M., and Virkkula, A.: Saharan dust absorption and refractive index from aircraft-based observations during SAMUM 2006, Tellus B, 61, 118–130, https://doi.org/10.1111/j.1600-0889.2008.00383.x, 2009.
Petzold, A., Ogren, J. A., Fiebig, M., Laj, P., Li, S.-M., Baltensperger, U., Holzer-Popp, T., Kinne, S., Pappalardo, G., Sugimoto, N., Wehrli, C., Wiedensohler, A., and Zhang, X.-Y.: Recommendations for reporting ”black carbon” measurements, Atmos. Chem. Phys., 13, 8365–8379, https://doi.org/10.5194/acp-13-8365-2013, 2013.
Pisso, I., Sollum, E., Grythe, H., Kristiansen, N. I., Cassiani, M., Eckhardt, S., Arnold, D., Morton, D., Thompson, R. L., Groot Zwaaftink, C. D., Evangeliou, N., Sodemann, H., Haimberger, L., Henne, S., Brunner, D., Burkhart, J. F., Fouilloux, A., Brioude, J., Philipp, A., Seibert, P., and Stohl, A.: The Lagrangian particle dispersion model FLEXPART version 10.4, Geosci. Model Dev., 12, 4955–4997, https://doi.org/10.5194/gmd-12-4955-2019, 2019 (data available at: https://www.flexpart.eu, last access: 6 October 2024).
Platt, S. M., Hov, Ø., Berg, T., Breivik, K., Eckhardt, S., Eleftheriadis, K., Evangeliou, N., Fiebig, M., Fisher, R., Hansen, G., Hansson, H.-C., Heintzenberg, J., Hermansen, O., Heslin-Rees, D., Holmén, K., Hudson, S., Kallenborn, R., Krejci, R., Krognes, T., Larssen, S., Lowry, D., Lund Myhre, C., Lunder, C., Nisbet, E., Nizzetto, P. B., Park, K.-T., Pedersen, C. A., Aspmo Pfaffhuber, K., Röckmann, T., Schmidbauer, N., Solberg, S., Stohl, A., Ström, J., Svendby, T., Tunved, P., Tørnkvist, K., van der Veen, C., Vratolis, S., Yoon, Y. J., Yttri, K. E., Zieger, P., Aas, W., and Tørseth, K.: Atmospheric composition in the European Arctic and 30 years of the Zeppelin Observatory, Ny-Ålesund, Atmos. Chem. Phys., 22, 3321–3369, https://doi.org/10.5194/acp-22-3321-2022, 2022.
Popovicheva, O., Diapouli, E., Makshtas, A., Shonija, N., Manousakas, M., Saraga, D., Uttal, T., and Eleftheriadis, K.: East Siberian Arctic background and black carbon polluted aerosols at HMO Tiksi, Sci. Total Environ., 655, 924–938, https://doi.org/10.1016/j.scitotenv.2018.11.165, 2019a.
Popovicheva, O. B., Shonija, N. K., Persiantseva, N., Timofeev, M., Diapouli, E., Eleftheriadis, K., Borgese, L., and Nguyen, X. A.: Aerosol pollutants during agricultural biomass burning: A case study in Ba Vi Region in Hanoi, Vietnam, Aerosol Air Qual. Res., 17, 2762–2779, https://doi.org/10.4209/aaqr.2017.03.0111, 2017a.
Popovicheva, O. B., Evangeliou, N., Eleftheriadis, K., Kalogridis, A. C., Sitnikov, N., Eckhardt, S., and Stohl, A.: Black Carbon Sources Constrained by Observations in the Russian High Arctic, Environ. Sci. Technol., 51, 3871–3879, https://doi.org/10.1021/acs.est.6b05832, 2017b.
Popovicheva, O. B., Engling, G., Ku, I. T., Timofeev, M. A., and Shonija, N. K.: Aerosol emissions from long-lasting smoldering of boreal peatlands: Chemical composition, markers, and microstructure, Aerosol Air Qual. Res., 19, 484–503, https://doi.org/10.4209/aaqr.2018.08.0302, 2019b.
Popovicheva, O. B., Evangeliou, N., Kobelev, V. O., Chichaeva, M. A., Eleftheriadis, K., Gregorič, A., and Kasimov, N. S.: Siberian Arctic black carbon: gas flaring and wildfire impact, Atmos. Chem. Phys., 22, 5983–6000, https://doi.org/10.5194/acp-22-5983-2022, 2022.
Popovicheva, O. B., Chichaeva, M. A., Kobelev, V. O., and Kasimov, N. S.: Black Carbon Seasonal Trends and Regional Sources on Bely Island (Arctic), Atmos. Ocean. Opt., 36, 176–184, https://doi.org/10.1134/S1024856023030090, 2023.
Pulimeno, S., Bruschi, F., Feltracco, M., Mazzola, M., Gilardoni, S., Crocchianti, S., Cappelletti, D., Gambaro, A., and Barbaro, E.: Investigating the Presence of Biomass Burning Events at Ny-Å Lesund: Optical and Chemical Insights from Summer-Fall 2019, Atmos. Environ., 320, 120336, https://doi.org/10.1016/j.atmosenv.2024.120336, 2024.
Qi, L. and Wang, S.: Sources of black carbon in the atmosphere and in snow in the Arctic, Sci. Total Environ., 691, 442–454, https://doi.org/10.1016/j.scitotenv.2019.07.073, 2019.
Ran, L., Deng, Z. Z., Wang, P. C., and Xia, X. A.: Black carbon and wavelength-dependent aerosol absorption in the North China Plain based on two-year aethalometer measurements, Atmos. Environ., 142, 132–144, https://doi.org/10.1016/j.atmosenv.2016.07.014, 2016.
Rogers, B. M., Balch, J. K., Goetz, S. J., Lehmann, C. E. R., and Turetsky, M.: Focus on changing fire regimes: interactions with climate, ecosystems, and society, Environ. Res. Lett., 15, 030201, https://doi.org/10.1088/1748-9326/ab6d3a, 2020.
Sandradewi, J., Prévôt, A. S. H., Szidat, S., Perron, N., Alfarra, M. R., Lanz, V. A., Weingartner, E., and Baltensperger, U. R. S.: Using aerosol light abosrption measurements for the quantitative determination of wood burning and traffic emission contribution to particulate matter, Environ. Sci. Technol., 42, 3316–3323, https://doi.org/10.1021/es702253m, 2008.
Schmale, J., Zieger, P., and Ekman, A. M. L.: Aerosols in current and future Arctic climate, Nat. Clim. Change, 11, 95–105, https://doi.org/10.1038/s41558-020-00969-5, 2021.
Schmale, J., Sharma, S., Decesari, S., Pernov, J., Massling, A., Hansson, H.-C., von Salzen, K., Skov, H., Andrews, E., Quinn, P. K., Upchurch, L. M., Eleftheriadis, K., Traversi, R., Gilardoni, S., Mazzola, M., Laing, J., and Hopke, P.: Pan-Arctic seasonal cycles and long-term trends of aerosol properties from 10 observatories, Atmos. Chem. Phys., 22, 3067–3096, https://doi.org/10.5194/acp-22-3067-2022, 2022.
Schmeisser, L., Backman, J., Ogren, J. A., Andrews, E., Asmi, E., Starkweather, S., Uttal, T., Fiebig, M., Sharma, S., Eleftheriadis, K., Vratolis, S., Bergin, M., Tunved, P., and Jefferson, A.: Seasonality of aerosol optical properties in the Arctic, Atmos. Chem. Phys., 18, 11599–11622, https://doi.org/10.5194/acp-18-11599-2018, 2018.
Schneider, E., Czech, H., Popovicheva, O., Chichaeva, M., Kobelev, V., Kasimov, N., Minkina, T., Rüger, C. P., and Zimmermann, R.: Mass spectrometric analysis of unprecedented high levels of carbonaceous aerosol particles long-range transported from wildfires in the Siberian Arctic, Atmos. Chem. Phys., 24, 553–576, https://doi.org/10.5194/acp-24-553-2024, 2024.
Sharma, S., Lavoué, D., Chachier, H., Barrie, L. A., and Gong, S. L.: Long-term trends of the black carbon concentrations in the Canadian Arctic, J. Geophys. Res.-Atmos., 109, D15203, https://doi.org/10.1029/2003JD004331, 2004.
Sharma, S., Ishizawa, M., Chan, D., Lavoué, D., Andrews, E., Eleftheriadis, K., and Maksyutov, S.: 16-year simulation of arctic black carbon: Transport, source contribution, and sensitivity analysis on deposition, J. Geophys. Res.-Atmos., 118, 943–964, https://doi.org/10.1029/2012JD017774, 2013.
Sharma, S., Leaitch, W. R., Huang, L., Veber, D., Kolonjari, F., Zhang, W., Hanna, S. J., Bertram, A. K., and Ogren, J. A.: An evaluation of three methods for measuring black carbon in Alert, Canada, Atmos. Chem. Phys., 17, 15225–15243, https://doi.org/10.5194/acp-17-15225-2017, 2017.
Silver, B., Arnold, S. R., Reddington, C. L., Emmons, L. K., and Conibear, L.: Large transboundary health impact of Arctic wildfire smoke, Commun. Earth Environ., 5, 199, https://doi.org/10.1038/s43247-024-01361-3, 2024.
Singh, M., Kondo, Y., Ohata, S., Mori, T., Oshima, N., Hyvärinen, A., Backman, J., Asmi, E., Servomaa, H., Schnaiter, F. M., Andrews, E., Sharma, S., Eleftheriadis, K., Vratolis, S., Zhao, Y., Koike, M., Moteki, N., and Sinha, P. R.: Mass absorption cross section of black carbon for Aethalometer in the Arctic, Aerosol Sci. Tech., 58, 536–553, https://doi.org/10.1080/02786826.2024.2316173, 2024.
Stathopoulos, V. K., Evangeliou, N., Stohl, A., Vratolis, S., Matsoukas, C., and Eleftheriadis, K.: Large Circulation Patterns Strongly Modulate Long-Term Variability of Arctic Black Carbon Levels and Areas of Origin, Geophys. Res. Lett., 48, e2021GL092876, https://doi.org/10.1029/2021GL092876, 2021.
Stohl, A.: Characteristics of atmospheric transport into the Arctic troposphere, J. Geophys. Res.-Atmos., 111, D11306, https://doi.org/10.1029/2005JD006888, 2006.
Stohl, A., Forster, C., Frank, A., Seibert, P., and Wotawa, G.: Technical note: The Lagrangian particle dispersion model FLEXPART version 6.2, Atmos. Chem. Phys., 5, 2461–2474, https://doi.org/10.5194/acp-5-2461-2005, 2005.
Stohl, A., Klimont, Z., Eckhardt, S., Kupiainen, K., Shevchenko, V. P., Kopeikin, V. M., and Novigatsky, A. N.: Black carbon in the Arctic: the underestimated role of gas flaring and residential combustion emissions, Atmos. Chem. Phys., 13, 8833–8855, https://doi.org/10.5194/acp-13-8833-2013, 2013.
Stone, R. S., Sharma, S., Herber, A., Eleftheriadis, K., and Nelson, D. W.: A characterization of Arctic aerosols on the basis of aerosol optical depth and black carbon measurements, Elem. Sci. Anthr., 2, 1–22, https://doi.org/10.12952/journal.elementa.000027, 2014.
Therneau, T.: Deming, Theil-Sen, Passing-Bablock and Total Least Squares Regression, https://cran.r-project.org/web/packages/deming/vignettes/deming.pdf (last access: 6 October 2024), 2024.
Tomshin, O. and Solovyev, V.: Features of the Extreme Fire Season of 2021 in Yakutia (Eastern Siberia) and Heavy Air Pollution Caused by Biomass Burning, Remote Sens., 14, 4980, https://doi.org/10.3390/rs14194980, 2022.
Tunved, P., Ström, J., and Krejci, R.: Arctic aerosol life cycle: linking aerosol size distributions observed between 2000 and 2010 with air mass transport and precipitation at Zeppelin station, Ny-Ålesund, Svalbard, Atmos. Chem. Phys., 13, 3643–3660, https://doi.org/10.5194/acp-13-3643-2013, 2013.
Ulevicius, V., Byčenkienë, S., Remeikis, V., Garbaras, A., Kecorius, S., Andriejauskienë, J., Jasinevičienë, D., and Mocnik, G.: Characterization of pollution events in the East Baltic region affected by regional biomass fire emissions, Atmos. Res., 98, 190–200, https://doi.org/10.1016/j.atmosres.2010.03.021, 2010.
Veraverbeke, S., Rogers, B. M., Goulden, M. L., Jandt, R. R., Miller, C. E., Wiggins, E. B., and Randerson, J. T.: Lightning as a major driver of recent large fire years in North American boreal forests, Nat. Clim. Change, 7, 529–534, https://doi.org/10.1038/nclimate3329, 2017.
Vinogradova, A. A. and Ivanova, Y. A.: Atmospheric Transport of Black Carbon to the Russian Arctic from Different Sources: Winter and Summer 2000–2016, Atmos. Ocean. Opt., 36, 758–766, https://doi.org/10.1134/S1024856023060222, 2023.
Virkkula, A.: Modeled source apportionment of black carbon particles coated with a light-scattering shell, Atmos. Meas. Tech., 14, 3707–3719, https://doi.org/10.5194/amt-14-3707-2021, 2021.
Voronova, O. S., Zima, A. L., Kladov, V. L., and Cherepanova, E. V.: Anomalous Wildfires in Siberia in Summer 2019, Izv.-Atmos. Ocean Phy., 56, 1042–1052, https://doi.org/10.1134/S000143382009025X, 2020.
Voronova, O. S., Gordo, K. A., Zima, A. L., and Feoktistova, N. V.: Strong Wildfires in the Russian Federation in 2021 Detected Using Satellite Data, Izv.-Atmos. Ocean Phy., 58, 1065–1076, https://doi.org/10.1134/S0001433822090225, 2022.
Willis, M. D., Leaitch, W. R., and Abbatt, J. P. D.: Processes Controlling the Composition and Abundance of Arctic Aerosol, Rev. Geophys., 56, 621–671, https://doi.org/10.1029/2018RG000602, 2018.
Winiger, P., Andersson, A., Eckhardt, S., Stohl, A., Semiletov, I. P., Dudarev, O. V., Charkin, A., Shakhova, N., Klimont, Z., Heyes, C., and Gustafsson, Ö.: Siberian Arctic black carbon sources constrained by model and observation, P. Natl. Acad. Sci. USA, 114, E1054–E1061, https://doi.org/10.1073/pnas.1613401114, 2017.
Winiger, P., Barrett, T. E., Sheesley, R. J., Huang, L., Sharma, S., Barrie, L. A., and Yttri, K. E.: Source apportionment of circum-Arctic atmospheric black carbon from isotopes and modeling, Sci. Adv., 5, eaau8052, https://doi.org/10.1126/sciadv.aau8052, 2019.
Yttri, K. E., Lund Myhre, C., Eckhardt, S., Fiebig, M., Dye, C., Hirdman, D., Ström, J., Klimont, Z., and Stohl, A.: Quantifying black carbon from biomass burning by means of levoglucosan – a one-year time series at the Arctic observatory Zeppelin, Atmos. Chem. Phys., 14, 6427–6442, https://doi.org/10.5194/acp-14-6427-2014, 2014.
Yttri, K. E., Bäcklund, A., Conen, F., Eckhardt, S., Evangeliou, N., Fiebig, M., Kasper-Giebl, A., Gold, A., Gundersen, H., Myhre, C. L., Platt, S. M., Simpson, D., Surratt, J. D., Szidat, S., Rauber, M., Tørseth, K., Ytre-Eide, M. A., Zhang, Z., and Aas, W.: Composition and sources of carbonaceous aerosol in the European Arctic at Zeppelin Observatory, Svalbard (2017 to 2020), Atmos. Chem. Phys., 24, 2731–2758, https://doi.org/10.5194/acp-24-2731-2024, 2024.
Yue, S., Zhu, J., Chen, S., Xie, Q., Li, W., Li, L., Ren, H., Su, S., Li, P., Ma, H., Fan, Y., Cheng, B., Wu, L., Deng, J., Hu, W., Ren, L., Wei, L., Zhao, W., Tian, Y., Pan, X., Sun, Y., Wang, Z., Wu, F., Liu, C. Q., Su, H., Penner, J. E., Pöschl, U., Andreae, M. O., Cheng, Y., and Fu, P.: Brown carbon from biomass burning imposes strong circum-Arctic warming, One Earth, 5, 293–304, https://doi.org/10.1016/j.oneear.2022.02.006, 2022.
Zanatta, M., Laj, P., Gysel, M., Baltensperger, U., Vratolis, S., Eleftheriadis, K., Kondo, Y., Dubuisson, P., Winiarek, V., Kazadzis, S., Tunved, P., and Jacobi, H.-W.: Effects of mixing state on optical and radiative properties of black carbon in the European Arctic, Atmos. Chem. Phys., 18, 14037–14057, https://doi.org/10.5194/acp-18-14037-2018, 2018.
Zenkova, P. N., Chernov, D. G., Shmargunov, V. P., Panchenko, M. V., and Belan, B. D.: Submicron Aerosol and Absorbing Substance in the Troposphere of the Russian Sector of the Arctic According to Measurements Onboard the Tu-134 Optik Aircraft Laboratory in 2020, Atmos. Ocean. Opt., 35, 43–51, https://doi.org/10.1134/S1024856022010146, 2022.
Zhou, C., Penner, J. E., Flanner, M. G., Bisiaux, M. M., Edwards, R., and McConnell, J. R.: Transport of black carbon to polar regions: Sensitivity and forcing by black carbon, Geophys. Res. Lett., 39, L22804, https://doi.org/10.1029/2012GL053388, 2012.
Zhu, C., Kanaya, Y., Takigawa, M., Ikeda, K., Tanimoto, H., Taketani, F., Miyakawa, T., Kobayashi, H., and Pisso, I.: FLEXPART v10.1 simulation of source contributions to Arctic black carbon, Atmos. Chem. Phys., 20, 1641–1656, https://doi.org/10.5194/acp-20-1641-2020, 2020.