the Creative Commons Attribution 4.0 License.
the Creative Commons Attribution 4.0 License.
 | 22 Jul 2025
Asian dust transport of proteinaceous matter from the Gobi Desert to northern China
Ren-Guo Zhu
Hua-Yun Xiao
Meiju Yin
Hao Xiao
Zhongkui Zhou
Yuanyuan Pan
Guo Wei
Cheng Liu
Asian dust can greatly influence the ecosystem's productivity and biogeochemical cycles by providing new nutrients. However, the transport of proteinaceous matter (combined amino acids, CAAs) by Asian dust to downwind ecosystems remains unclear. Here, the concentrations and δ15N values of individual CAAs in Gobi surface soil and vegetation and in PM2.5 samples from four cities in northern China were characterized. Proline dominated the total pool of CAAs in urban PM2.5 during non-dust periods, whereas CAAs transported by Gobi dust were rich in alanine, glycine and glutamic acid. The concentrations and percentages of these three CAAs in PM2.5 from northern China notably increased during dust periods. During non-dust periods, the δ15N values of individual CAAs in urban PM2.5 fell within their respective ranges in local urban sources, suggesting CAAs in PM2.5 were primarily influenced by local urban sources during non-dust periods. Compared to their values in urban PM2.5 during non-dust periods, glycine and leucine in Gobi Desert sources exhibited δ15N depletion by more than 6 ‰. During dust periods, glycine and leucine in urban PM2.5 all exhibited negative shifts in their δ15N values, confirming that Gobi dust is a significant source of CAAs in PM2.5 in northern China. The dry deposition of protein N from Gobi dust was calculated using nitrogen isotopic mass balance based on the δ15N values of glycine and leucine, yielding a value of up to 0.36 . The rapid accumulation of such considerable protein N quantities may profoundly affect oligotrophic ecosystem productivity.
- Article
(3585 KB) - Full-text XML
-
Supplement
(810 KB) - BibTeX
- EndNote


Asian dust, originating from the desert and Gobi regions of Inner Mongolia in China and southern Mongolia are a significant source of atmospheric particulate matter, annually emitting approximately 1000–3000 Tg (Tegen and Schepanski, 2009). Recent studies indicate that, in addition to mineral dust, these storms can transport substantial amounts of water-soluble organic nitrogen (WSON) to urban aerosols and even distant oceans (Liu et al., 2021; Mochizuki et al., 2016; Tsagkaraki et al., 2021). Importantly, primary biological particles present in desert soils can be lifted by dust particles into the stratosphere and transported over long distances (Favet et al., 2013).
Combined amino acids (CAAs), including proteins and peptides, are important constituents of atmospheric organic nitrogen (Jaenicke, 2005; Zhang and Anastasio, 2003). Recent studies reveal that they are ubiquitous in aerosols across various environments such as urban, suburban, rural and remote areas (Li et al., 2022a, b). Protein-containing particles are expected to influence particle hygroscopicity, atmospheric chemistry, cloud formation processes, and new particle formation and growth (Chan et al., 2005; Elbert et al., 2007; Haan et al., 2009; Jaber et al., 2021; Violaki and Mihalopoulos, 2010). Moreover, they serve as bioavailable nitrogen sources and greatly contribute to the biogeochemical nitrogen cycles (Matsumoto et al., 2017; Neff et al., 2002). Therefore, the nutrient enrichment resulting from dry deposition of proteinaceous matter attracts attention in aerosol studies (Samy et al., 2013; Xu et al., 2020; Zhang and Anastasio, 2003).
However, the sources of CAAs in aerosols remain insufficiently elucidated. Generally, the suspension process of biological particles, including fungi, spores, bacteria, molds, animal dander, pollen, and fragments of plants and animals, along with soil particles, has been identified as primary sources of CAA in aerosols (Filippo et al., 2014; Matos et al., 2016; Samy et al., 2013). Besides that, atmospheric proteins are also suggested to originate from biomass burning (Kang et al., 2012; Song et al., 2017; Zhu et al., 2020a) and marine sources, such as bursting sea bubbles and suspended algae (Feltracco et al., 2019; Li et al., 2022a; Triesch et al., 2021). However, Matsumoto et al. (2021) found a significant correlation between the total CAA concentration in fine particles at an urban site in Japan and the concentration of non-sea-salt calcium (nss-Ca2+), suggesting an influence of Asian dust particles on airborne CAAs. To date, no studies have directly compared the protein characteristics in PM2.5 from urban environments with those in dust sources to conclusively determine the contribution of dust sources to proteinaceous materials in downwind urban PM2.5 during dust events.
Composition profiles of CAAs have been utilized to identify emission sources of primary biological aerosol particles (Abe et al., 2016; Matsumoto et al., 2021). Zhang and Anastasio (2003) noted a significant contribution of serine to the total CAA pool in the PM2.5, highlighting the direct emissions from biological sources such as plants and animals. Matsumoto et al. (2021) identified glutamic acid, glycine acid and aspartic acid as the dominant amino acids in the total CAA pool in fine aerosols, indicating that regional and locally derived biomass burning and fossil fuel combustion are the sources of CAAs in fine atmospheric particles. Moreover, our previous study suggested distinct differences between the CAA composition profiles in surface soil and plant sources; hydrophobic species (alanine, valine, leucine and isoleucine) and neutral proline were the major CAA species in soil sources, while hydrophilic CAA species (glutamic acid, lysine and aspartic acid) represented major fractions in plant sources (Zhu et al., 2020b). Unfortunately, the composition profiles of CAAs in distant dust sources and local urban aerosols remain inadequately characterized.
With the development of stable N isotope technology, compound-specific isotope analysis of amino acids has become an effective tool to trace the sources and cycling of dissolved organic nitrogen in the marine environment (Batista et al., 2014; Ianiri and McCarthy, 2023; Yamaguchi and McCarthy, 2018). In atmospheric studies, δ15N values of glycine have been employed as a novel method to identify the sources of proteinaceous matter in aerosols (Zhu et al., 2021). Our previous study suggested that the δ15N values of Gly (glycine) in aerosol particles from biomass burning sources (averaged +22.4 ± 4.4 ‰) were more positive than those of soil (averaged +5.2 ± 3.5 ‰) and plant sources (averaged −13.4 ‰) (Zhu et al., 2020b). Therefore, according to the δ15N inventories of specific CAAs in potential emission sources, the main sources of CAAs in atmospheric particles could be identified. Changes in δ15N values of specific CAAs in the aerosols could be closely related to the variation in the primary emission sources of atmospheric proteinaceous matter (Zhu et al., 2020b). However, limited knowledge on the δ15N inventories of individual CAAs in dust sources and local urban sources complicates the elucidation of CAA origins in urban PM2.5 on dusty days.
East Asia is the second-largest dust source region worldwide, with annual dust emissions estimated at 214 Tg yr−1 (Tian et al., 2020). Furthermore, the westerlies in the Northern Hemisphere's middle latitudes can transport Asian dust from upwind areas to distant downwind regions, potentially completing a global cycle and exerting far-reaching impacts (Xie et al., 2023; Zhou et al., 2019). Asian dust particles primarily originate from the arid and semi-arid areas of northwestern China and Mongolia, including the Taklamakan Desert, the Gobi Desert, the Badain Jaran Desert, the Tengger Desert and others (Shao and Dong, 2006). Recent research indicates that the Gobi Desert, rather than the Taklamakan Desert, is the primary contributor to dust concentrations in East Asia in spring (Chen et al., 2017; Tang et al., 2018). Spring is considered the peak season for sand and Asian dust events in northeast Asia, as positive surface pressure anomalies over the Tamil Peninsula intensify cold air outbreaks across the desert regions of northwestern China and Mongolia (Yang et al., 2008). A particularly intense and widespread dust event occurred between 26 and 29 March 2018 in the North China Plain, which was the most significant Asian dust event in recent years in China (Zhou et al., 2019). This dust event affected nearly two-thirds of China and parts of the northwest Pacific (Tian et al., 2020). Therefore, PM2.5 sampling at four representative sites (Beijing, Tianjin, Shijiazhuang and Taiyuan) located in the downwind areas of the Gobi Desert during the 26–29 March 2018 dust event provides a typical representation of Asian dust activity in northern China.
The overall goal of this present study was to evaluate the contribution of the Gobi dust sources to the proteinaceous matter (CAAs) in PM2.5 from four representative urban centres in northern China on dusty days. Firstly, we analysed the concentrations and δ15N values of individual CAAs in the surface soil and prevalent plants in the Gobi Desert, along with surface soil and the predominant plant species in Beijing, Tianjin, Shijiazhuang and Taiyuan. The objective was to examine the composition characteristics and nitrogen isotope signature of individual CAAs from both Gobi dust sources and local urban sources; Secondly, variations in the concentrations and δ15N values of CAAs in PM2.5 samples from these four cities during non-dust and dust periods were analysed to confirm whether Gobi dust sources contribute to CAAs in PM2.5 in northern China and to quantify the extent of this contribution for each city. Finally, we quantified the dry deposition of protein N transported by the Asian dust. This work could potentially improve current knowledge on the influence of Asian dust on productivity and biogeochemical nitrogen cycles in downwind ecosystems.
2.1 Sample collection
An intensive ground monitoring network consisting of four sites (Beijing, Tianjin, Shijiazhuang and Taiyuan) in northern China was set up to monitor the dust episodes (Fig. S1 in the Supplement). The MODIS satellite image (https://worldview.earthdata.nasa.gov/, last access: 7 February 2025), as shown in Fig. S2, shows a dust episode with brown dust plumes clearly visible over these four sampling sites.
The PM2.5 samples on quartz fibre filters were simultaneously collected at Beijing, Tianjin, Shijiazhuang and Taiyuan by a high-volume air sampler (KC-1000, Qingdao Laoshan Electronic Instrument company, China) at a flow rate of 1.05 ± 0.03 m3 min−1. The high-volume air sampler was set on the rooftop of a building (approximately 12 m above ground) at each site. Quartz filters were pre-combusted at 450 °C for 10 h and then wrapped in pre-combusted (450 °C, 10 h) aluminium foil envelopes and placed in separate plastic bags. Daily PM2.5 samples were collected from 24 to 31 March 2018 at the four cities. The sampling duration time for each sample was generally 23.5 h from 09:00 to 08:30 local time (LT; all times are local time, UTC+8) of the next day. All sample filters were sealed individually in an aluminium foil bag and stored at −20 °C prior to analysis. Field blank samples were also collected and analysed as the control.
Surface soil samples (n = 5) and leaves from three common plants (n = 12), chenopodium ambrosioides, Tripogon chinensis and Tamarix chinensis, were collected in the Gobi area (Table S1 in the Supplement), ranging between 43.46 to 43.60° N and 112.00 to 112.05° E, covering approximately 45 km2, as shown in Fig. S1. The Gobi Desert is the major source of sand for Asian dust events in Asia during the spring (An et al., 2013). Therefore, five sampling sites along the transport pathway of the dust event that occurred from 26 to 29 March 2018 (Fig. 2) were selected to represent the Gobi Desert. Each site was free of anthropogenic interference. Surface sand samples, which are most likely to be aerosolized, were collected from the tops of dunes using a plastic spatula and stored in sealed plastic bags until transport to the laboratory. At each location, surface soil was collected from five randomly selected sampling points within a radius of approximately 20 cm. These five sub-samples were then combined to create one representative sample. Additionally, to examine the local sources of combined amino acids (CAAs) in PM2.5, surface soil samples and leaves from the predominant plant Platanus orientalis were collected in Beijing, Tianjin, Shijiazhuang and Taiyuan.
2.2 Analyses of the concentration and δ15N value of CAAs
Extraction methods for combined amino acids (CAAs) in PM2.5 were detailed in our previous study (Zhu et al., 2020b). To convert all amino acids to free amino acids, a hydrolysis method was employed. The CAA concentrations were determined by subtracting free amino acid concentrations from total amino acid concentrations. Briefly, 1/16 of each filter sample (∼80 m3 of air) was cut into small pieces and hydrolyzed using 10 mL of 6 M hydrochloric acid at 110 °C for 24 h. α-Aminobutyric acid was added as an internal reference. To prevent oxidation, 25 µL of 20 µg µL−1 ascorbic acid (500 µg absolute) was added to each filter sample, and each hydrolysis tube was flushed with nitrogen and tightly sealed before hydrolysis. The hydrolyzed solution was cooled, dried under a stream of nitrogen and then redissolved in 0.1 N HCl (). The extracts of total amino acids were then purified using a cation exchange column (Dowex 50W X 8H+, 200–400 mesh; Sigma-Aldrich, St Louis, MO, USA), eluted with 10 mL of 10 % aqueous ammonia and dried under nitrogen. Finally, tert-butyldimethylsilyl derivatives of total amino acids were prepared as described in Zhu et al. (2018).
Free amino acids were extracted following the procedure outlined in Zhu et al. (2020b), where one-quarter of each filter sample (∼300 m3 of air) was processed in a Nalgene tube with α-aminobutyric acid as the internal standard and ultrasonically extracted in ice-cold Milli-Q water. The extract underwent ultrasonication, shaking, centrifugation and filtration through a 0.22 µm cellulose acetate membrane, followed by lyophilization and resuspension in 1 mL of 0.1 N HCl (). The samples were then processed using the same purification and derivatization steps as the total amino acids. Field blank filters were also taken and treated using the same procedure, and all reported values were corrected for blanks.
Plant and soil samples were ground separately in liquid nitrogen into fine powders using a mortar and pestle. Then, the well-ground and homogenized soil and plant powders were hydrolyzed, the purification and derivatization being done in the same way as for the aerosol samples. For more details refer to our previous publication (Zhu et al., 2021).
The concentrations of CAAs were analysed using a gas chromatograph–mass spectrometer (GC-MS). The GC-MS instrument was composed of a Thermo Scientific TRACE GC (Thermo Scientific, Bremen, Germany) connected to a Thermo Scientific ISQ QD single quadrupole MS. More details on instrument conditions, quality assurance and quality control (including recoveries, linearity, detection limits and quantitation limits) of CAAs are provided in our previous publications (Zhu et al., 2018, 2020b). To evaluate the extraction efficiency, an analytical method was applied to the samples which were spiked with the amino acid standard mixtures (100 µL 1 nmol µL−1). The average recovery ratios of the individual amino acids are shown in Table S2. The recoveries for the majority of CAAs ranged from 80.7 % (tyrosine) to 106.5 % (glycine). The precisions of the investigated AAs were better than 10 %.
The δ15N values of AA–tert-butyldimethylsilyl derivatives were analysed using a Thermo Trace GC (Thermo Scientific, Bremen, Germany) and a ConFlo IV interface (Thermo Scientific, Bremen, Germany) interfaced with an isotope ratio mass spectrometer (IRMS, Thermo Delta V IRMS, Thermo Scientific, Bremen, Germany). The internal standard with a known δ15N value (α-aminobutyric acid, −8.17 ± 0.03 ‰) in each sample was checked to determine the reproducibility of the isotope measurements. The analytical run was accepted when the differences between the δ15N values of α-aminobutyric acid measured by GC-IRMS and its true values were at most 1.5 ‰. The analytical precisions (SD, n = 9) of the δ15N measurements for derivatized amino acid standards ranged from 0.5 ‰ to 1.4 ‰. The difference between amino acid δ15N values measured using an elemental analysis IRMS (EA-IRMS) and GC-MS-IRMS after empirical correction ranged from 0.1 ‰ to 1.3 ‰. Each reported value is the mean of at least three δ15N determinations. The detailed instrument conditions and method validation were described in our previous study (Zhu et al., 2018, 2020b). Since asparagine and glutamine are converted to aspartic acid and glutamic acid in the hydrolysis process, respectively, the concentration and δ15N value of combined aspartic acid represents the sum of aspartic acid and asparagine. The concentration and δ15N value of combined glutamic acid represent the sum of glutamic acid and glutamine.
2.3 Analysis of the dry deposition fluxes
In this study, the atmospheric deposition fluxes of CAAs () at the four sampling sites are estimated from Eq. (1):
where C is the atmospheric concentration (nmol N m−3) and Vd is the dry deposition velocity (m s−1). Vd is controlled by the aerosol size, wind speed, aerosol hygroscopicity, relative humidity and underlying surface.
Primary biological aerosols have been found to be distributed from nanometres up to about a 10th of a millimetre, with their size distribution influenced by their sources (Fröhlich-Nowoisky et al., 2016). However, we did not obtain data on the size distribution of CAAs. In this study, the deposition velocities of protein N were assumed to be the same as those used to estimate water-soluble nitrogen (WSON) dry deposition (0.012 m s−1), given that protein N is a significant component of WSON in aerosols and WSON has also been detected in both coarse and fine fractions (Zamora et al., 2011; Zhang and Anastasio, 2003). The uncertainty in the value for the dry deposition velocity can lead to the uncertainty in dry flux estimates. For particles in the size range where the gravitational setting is the controlling factor, Vd values obtained by model and field experiment were consistent (Spokes et al., 2000). Duce et al. (1991) reported that under wind speeds ranging from 0 to 13 m s−1 and relative humidity between 0 % and 100 %, the deposition velocity for submicrometer aerosol particles is 0.1 cm s−1 ± a factor of 3, while the deposition velocity for supermicrometer crustal particles is 1 cm s−1, also with an uncertainty factor of 3. During the dust period, the wind speeds in Beijing, Tianjin, Shijiazhuang and Taiyuan were 2.0–2.4, 4.1–6.1, 1.7–2.6 and 4.6–7.0 m s−1, respectively, and the relative humidities were 25.8 %–28.4 %, 24.3 %–28.0 %, 24.3 %–29.1 % and 37.0 %–38.5 %, respectively. The variations in wind speed and relative humidity across the four sampling cities were relative minor, and their ranges fell within those reported by Duce et al. (1991). Based on this, the uncertainty for the deposition velocity of aerosol protein N in this study was set to a factor of 3. The detailed calculation method for the uncertainty range of protein N deposition fluxes is provided in Sect. S1 in the Supplement.
A “new” input of CAA N (protein-N) supplied by the Gobi Desert for the ecosystems in the downwind region (Input Fdry) can be calculated from Eq. (2):
where Fdry is the atmospheric deposition fluxes of protein N, which is calculated from Eq. (1). f is the contribution of the Gobi dust source at each sampling site, which is obtained from the nitrogen isotopic mass balance (Eq. 3). Uncertainties associated with f were derived from the δ15N variabilities in combined Gly and leucine (Leu) in the Gobi dust source (mean ± SD).
where is the δ15N value of the specific amino acid measured during the dust period, is the δ15N value of the specific amino acid measured during the non-dust period and is the δ15N value of the specific amino acid measured in the Gobi dust source. f is the contribution of the Gobi dust source at each sampling site.
2.4 Auxiliary data
The meteorological data during the sampling period were collected from the Global Weather and Climate Information Network (https://www.weatherandclimate.info/, last access: 15 July 2025). The MODIS satellite images were available at the following website: https://worldview.earthdata.nasa.gov/.
2.5 Statistics
Statistical analysis was conducted by Origin 2018 (OriginLab Corporation, USA). We performed a one-way analysis of variance (ANOVA) for the concentrations of PM10; the ratios of Ala%Pro%, Gly%Pro% and Glu%Pro% (Ala signifies alanine, Glu glutamic acid and Pro proline); and δ15N values of glycine and leucine, testing the effect of Asian dust events. Tukey's honestly significant difference (Tukey-HSD) test was used to compare the significant difference. Further, the differences in the δ15N values of combined glycine leucine, isoleucine, alanine and valine in PM2.5 at the four cities during the non-dust period and their corresponding values in the surface soil in the Gobi Desert were examined using the one-way ANOVA procedure and compared using the Tukey-HSD test. For all tests, statistically significant differences were considered at p<0.05.
3.1 Concentrations of PM2.5 and PM10 in northern China
Figure 1 illustrated the variations in atmospheric PM2.5 and PM10 concentrations across Beijing (BJ), Tianjin (TJ), Shijiazhuang (SJZ) and Taiyuan (TY) throughout the sampling period. Periods when mass concentrations of PM10 exceeded 500 µg m−3 were as follows: in Beijing from 06:00 to 19:00 on 28 March; in Tianjin from 09:00 to 13:00 on the same day; in Shijiazhuang from 11:00 to 18:00; and in Taiyuan from 21:00 on 28 March to 03:00 on 29 March, as indicated by a yellow shadow in Fig. 1. A MODIS satellite image from NASA (https://worldview.earthdata.nasa.gov/) revealed a dust episode on 28 March 2018, with brown dust plumes visibly overlaying the North China Plain, and significant dust presence persisting on 29 March, suggesting that the dust particles did not settle. Consequently, the filter samples from 28 and 29 March were categorized as the dust period, highlighted in yellow in Fig. 1. The remaining days of the sampling period were classified as the non-dust period.
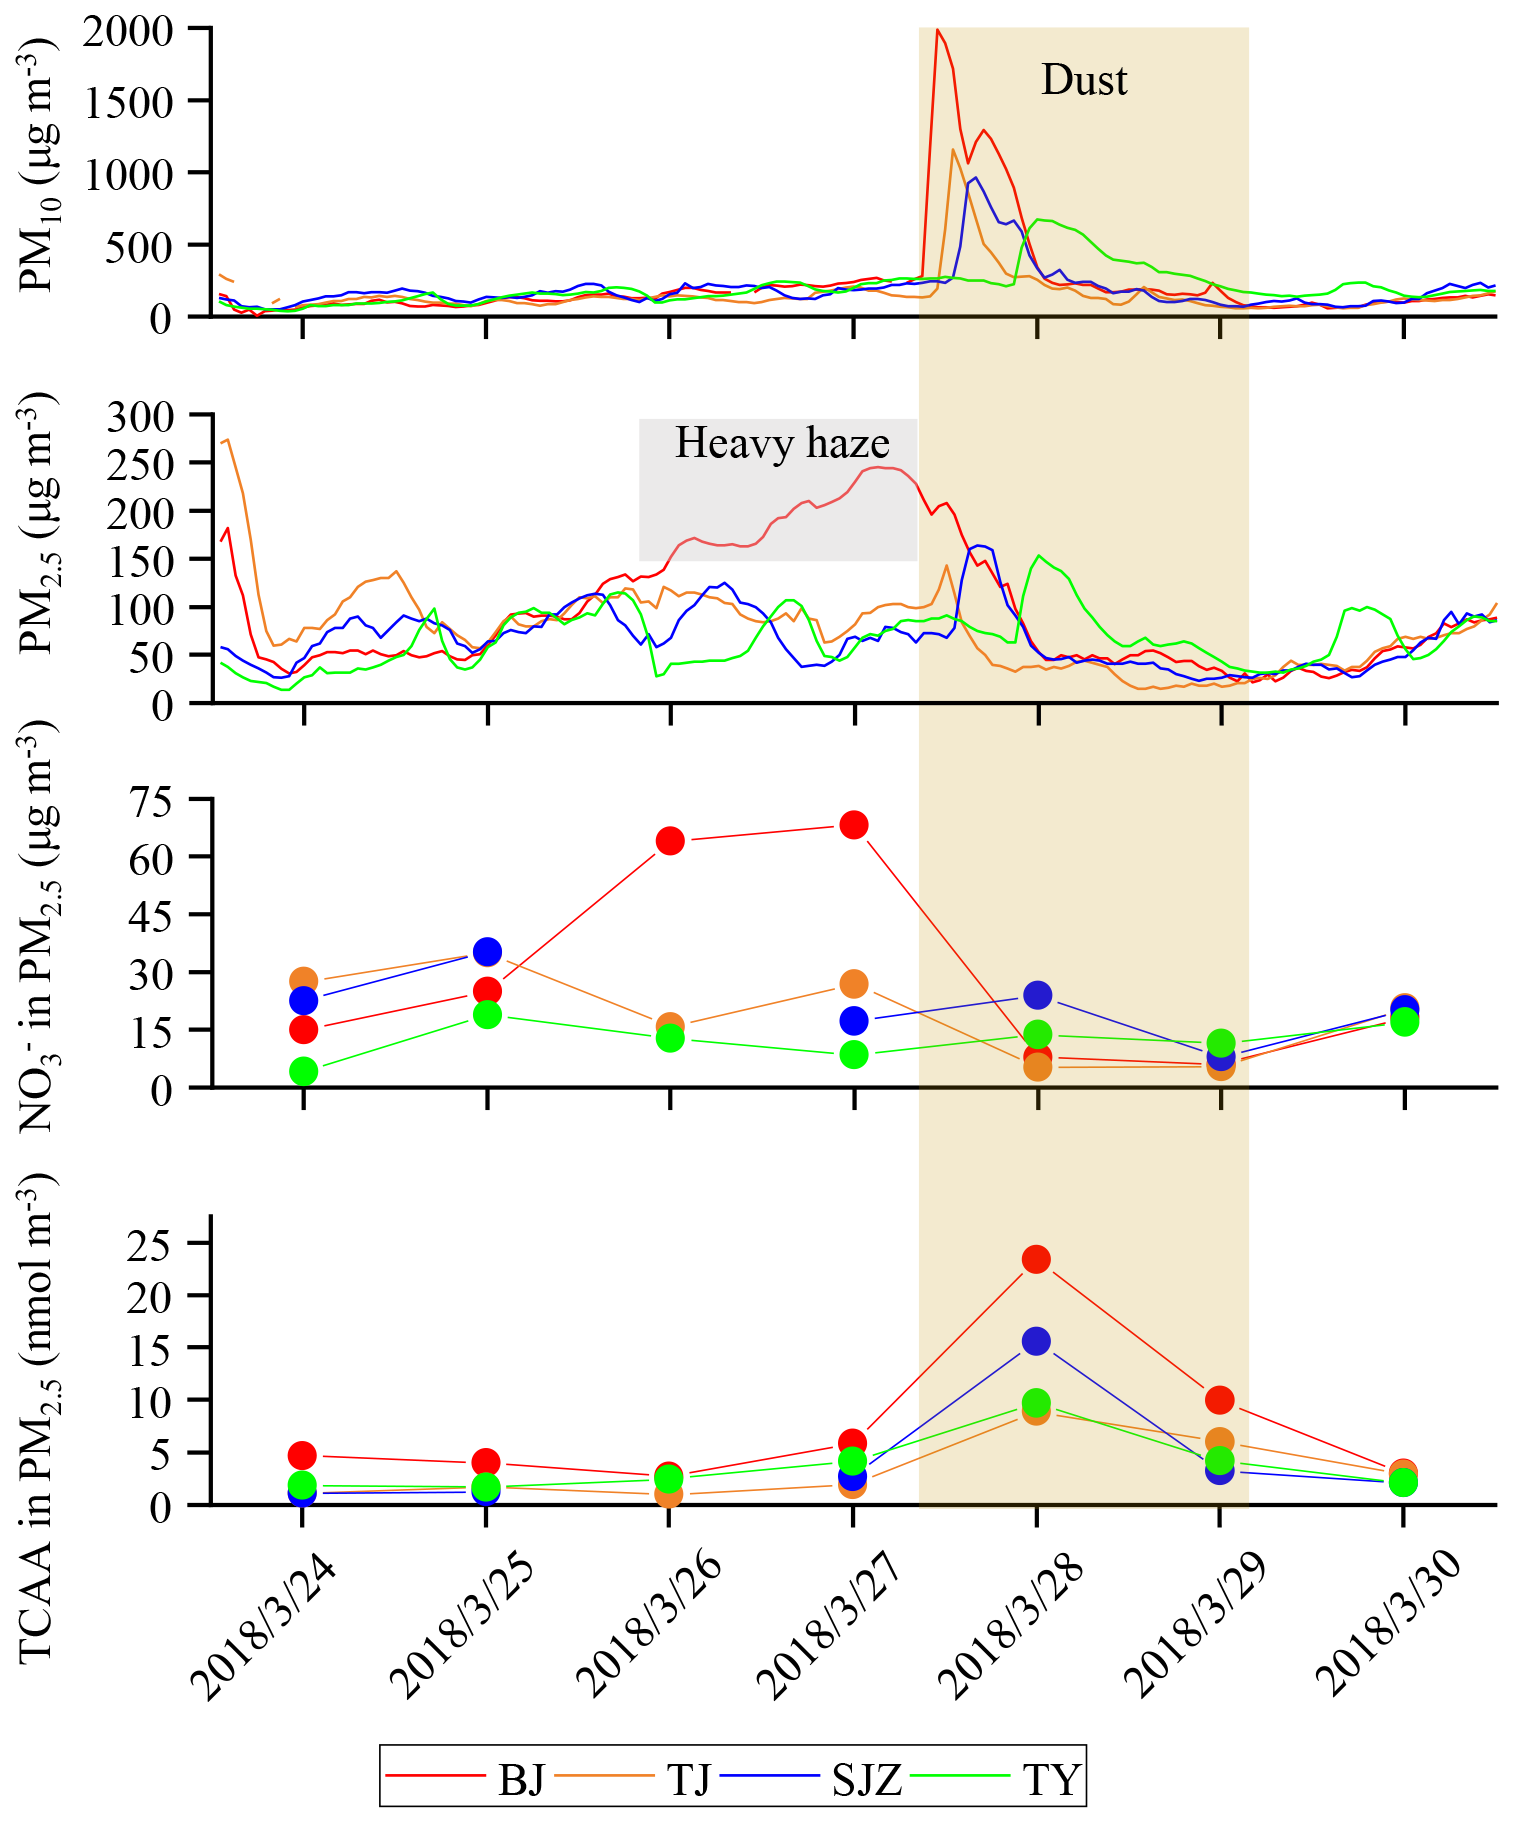
Figure 1Time series of PM2.5 and PM10 concentration, as well as and total combined amino acids (TCAAs) in PM2.5, at Beijing (BJ), Tianjin (TJ), Shijiazhuang (SJZ) and Taiyuan (TY) from 24 to 30 March 2018. The timestamps indicate 21:00 LT. The yellow shadow indicates the dust period. The grey shadow denotes a heavy haze period in BJ.
As shown in Fig. 1, compared to the non-dust period, the concentrations of PM10 during the dust period exhibited a significant increase at the four sampling sites by factors of 8.7 in Beijing, 6.3 in Tianjin, 4.8 in Shijiazhuang and 3.2 in Taiyuan (p<0.01). Among the four sampling sites, Beijing recorded the highest increase in PM10 concentration with the peak value of 1989 µg m−3 on 28 March (Fig. 1). In comparison to PM10, the increase in PM2.5 concentration during the dust period was less pronounced. Beijing experienced a severe haze event 2 d before the dust invasion (26 and 27 March), with PM2.5 concentrations surpassing 150 µg m−3. Following the dust invasion, Beijing's PM2.5 rapidly dropped to 50 µg m−3 by 23:00 on 28 March. In Tianjin, the PM2.5 concentration first increased and peaked at 143 µg m−3 at 08:00 on 28 March (dusty day). Subsequently, similar to Beijing, Tianjin's PM2.5 rapidly decreased to 36 µg m−3. In contrast to Beijing and Tianjin, PM2.5 in Shijiazhuang and Taiyuan showed an upward trend following the dust invasion, with daily averages rising from 62 and 78 µg m−3 on 27 March to 79 and 94 µg m−3 on 28 March, respectively. Overall, there was a decrease in the PMPM10 ratio at all locations. This ratio declined from 0.7 to 0.1 in Beijing, 0.6 to 0.1 in Tianjin, 0.4 to 0.2 in Shijiazhuang and 0.4 to 0.2 in Taiyuan (Table S3), further indicating a significant increase in coarse particulate matter due to the Asian dust. The 48 h backward trajectories and clusters of air mass trajectories at the four sampling sites on 28 March 2018 are displayed in Fig. 2. The air masses arriving at the four sampling sites during the dust period primarily originated from the Gobi Desert. Observations from the MODIS satellite also confirmed that the occurrences of Asian dust events across the four sampling sites originated from the Gobi Desert (Fig. S1). Tian et al. (2020) also confirmed that an intensive dust event occurred in the North China Plain from 26–29 March 2018 originating from western Inner Mongolia.
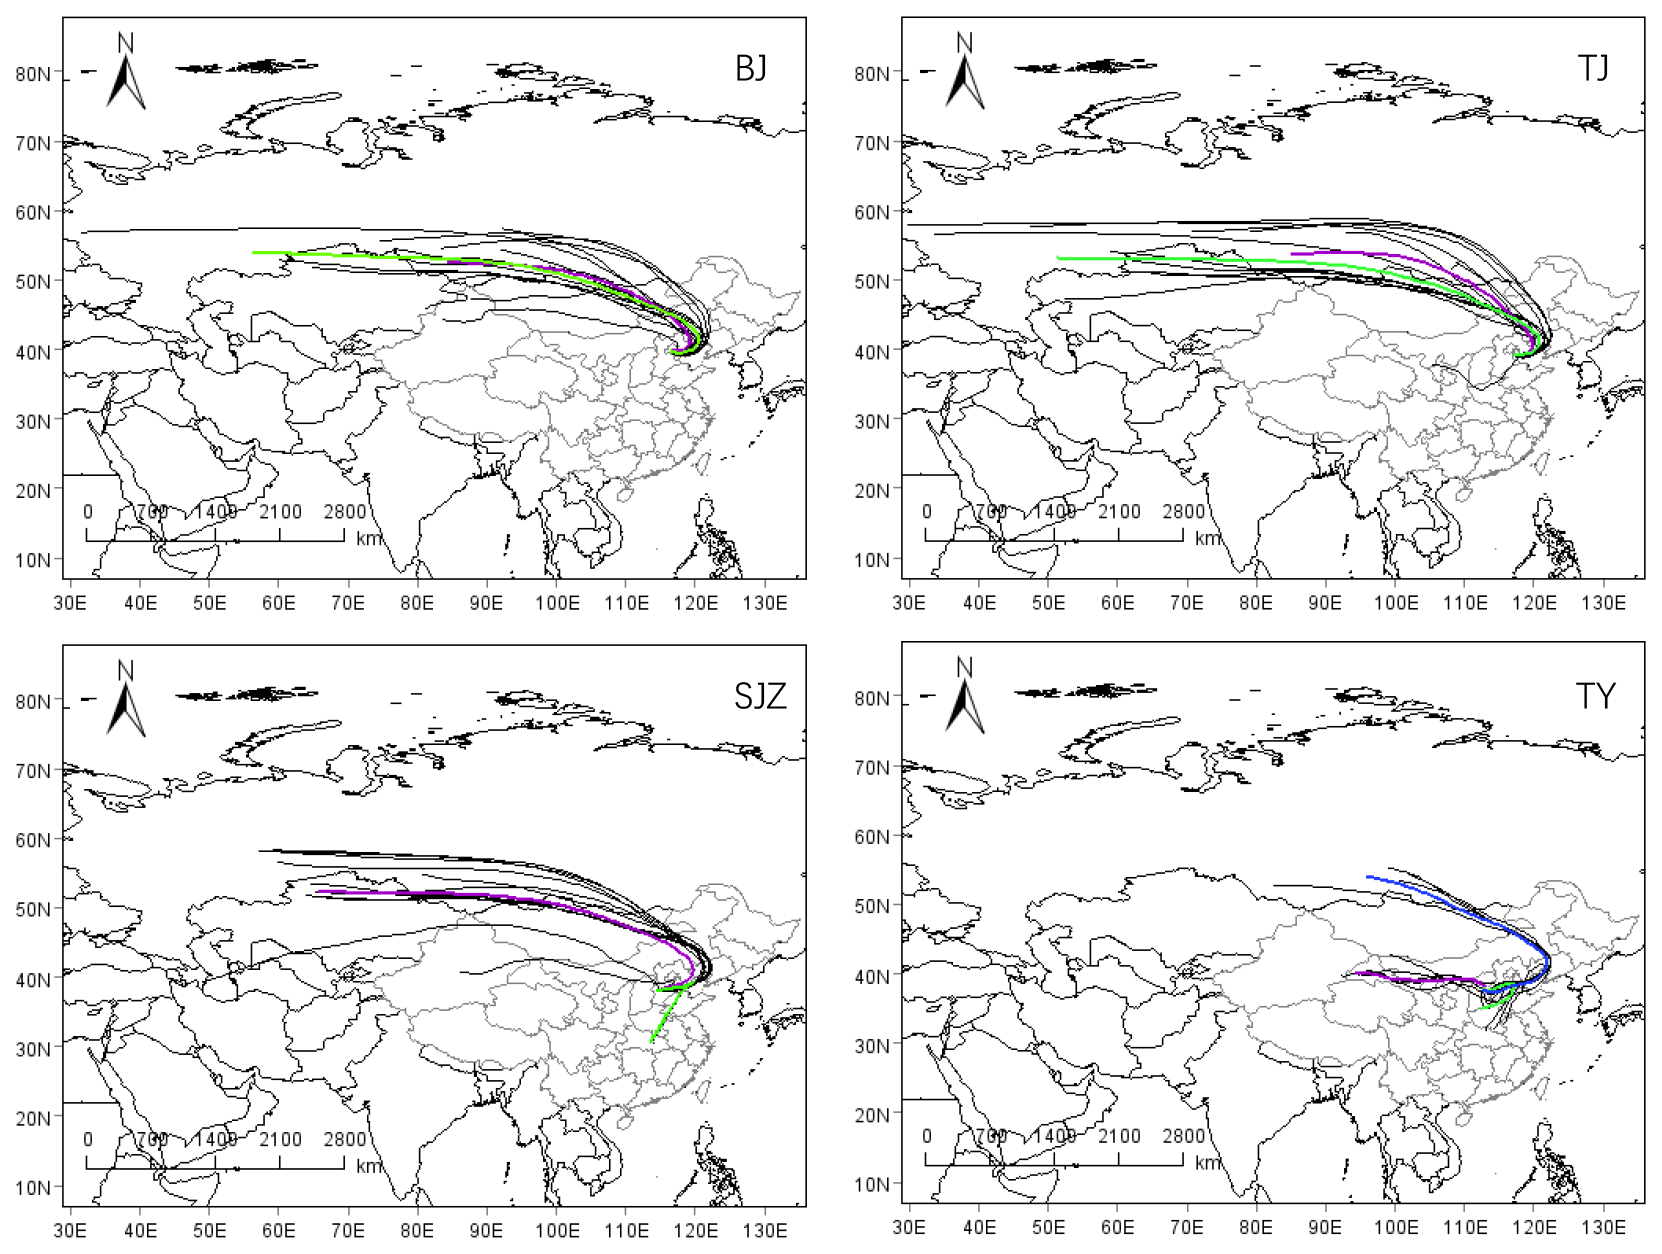
Figure 2The 48 h backward trajectories of air masses reaching Beijing, Tianjin, Shijiazhuang and Taiyuan at 500 m above ground level during the dust period. Colour lines show the cluster results of air mass trajectories. Trajectories were divided into two or three clusters in four cities. The main contribution clusters in these cities were found to be primarily originating from the Gobi Desert.
3.2 Concentrations and distribution of CAAs
3.2.1 CAAs in the Gobi Desert sources
Given that this Asian dust event originated from the Gobi Desert (Fig. 2), we investigated the molar composition of CAAs in both the surface soils and dominant plants of the region to determine the characteristic molar percentages of proteins transported from the Gobi Desert. In the surface soil of the Gobi Desert, glycine and alanine were the most abundant combined amino acids, each contributing approximately 20.4 ± 5.6 % and 20.7 ± 2.9 %, respectively, to the total CAA pool (Fig. 3a). Glutamic acid was the predominant CAA species in typical Gobi plants, accounting for 21.0 %, 22.5 % and 69.3 % of the total CAA pool in chenopodium ambrosioides, Tripogon chinensis and Tamarix chinensis, respectively (Fig. 3a).
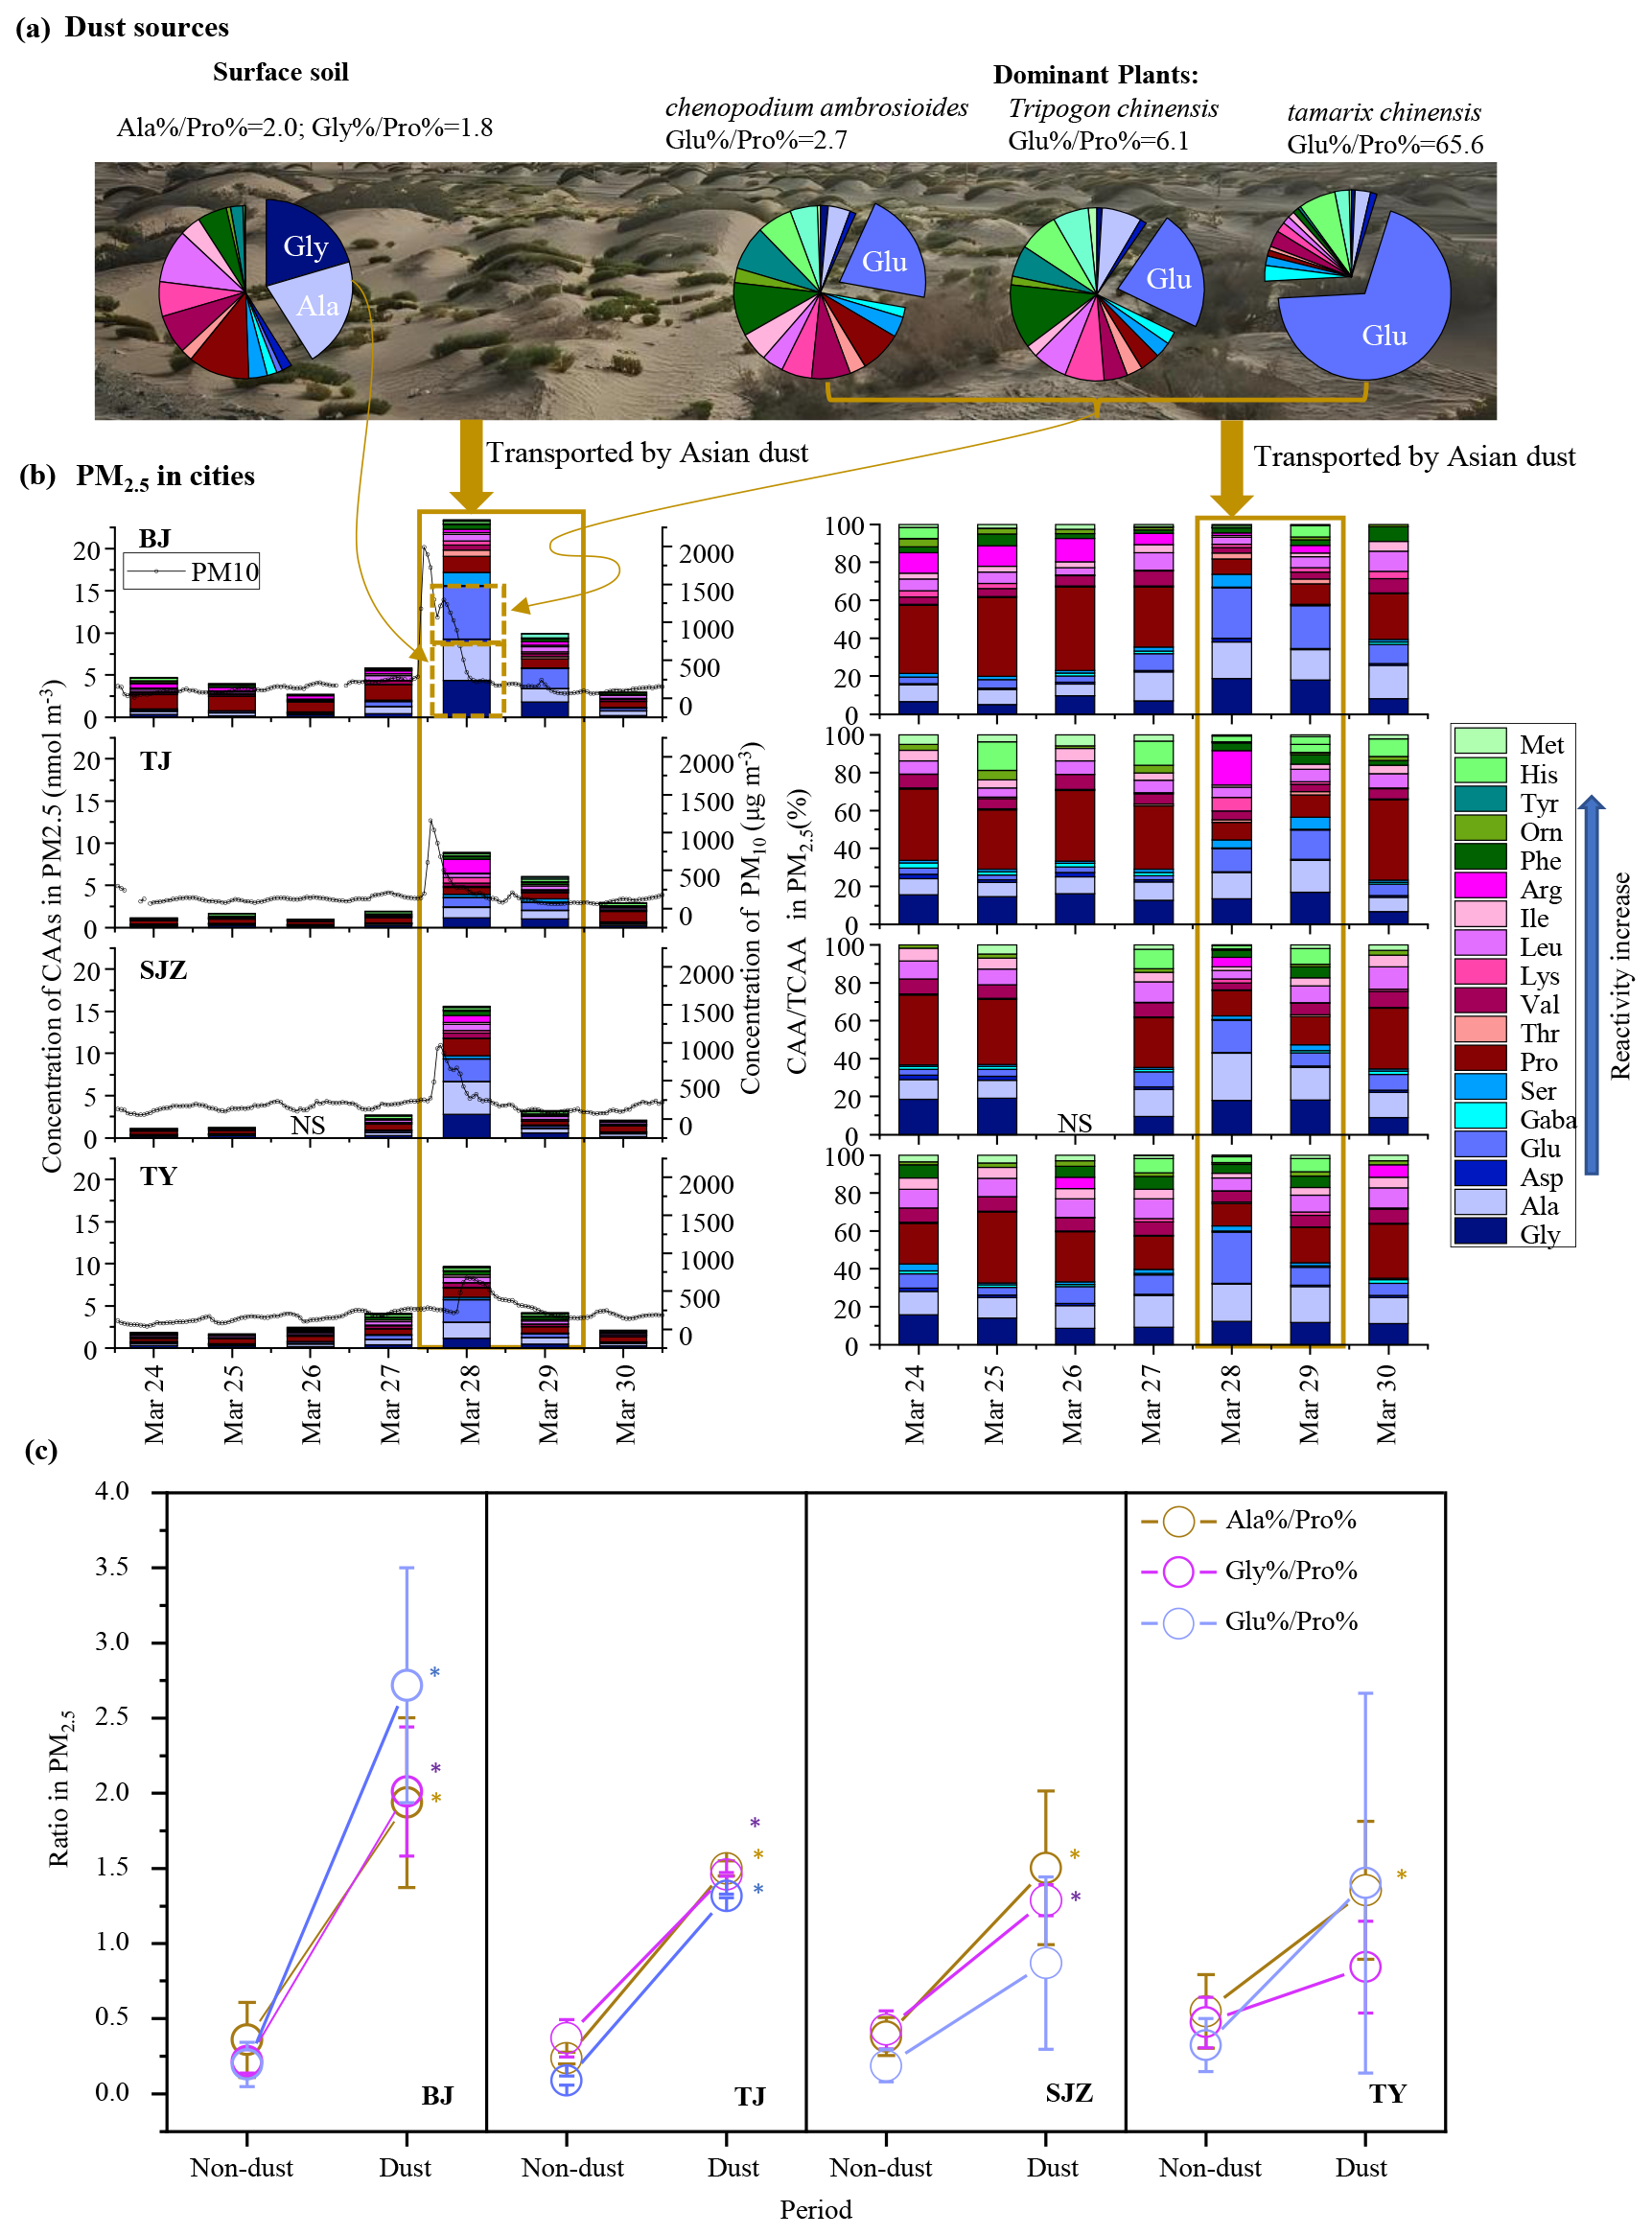
Figure 3(a) The percent distributions of each individual CAA (% of total CAAs) in the surface soils and three dominant plants (chenopodium ambrosioides, Tripogon chinensis and Tamarix chinensis) in the Gobi Desert. (b) Concentrations and distribution of individual CAAs at BJ, TJ, SJZ and TY. (c) The average ratios of the percentage of alanine, glycine and glutamic acid to proline (Ala%Pro%, Gly%Pro%, Glu%Pro%) in PM2.5 on dusty and non-dust days at the four cities. Asterisks indicate a significant difference in the average ratio between dust and non-dust periods (one-way ANOVA, p<0.05).
In both the surface soil and common plants of the Gobi Desert, the molar percentage of combined proline was lower than those of the amino acids mentioned earlier, contributing only 11.4 ± 3.3 % to the total CAA pool of the Gobi surface soil. Among the three common plants, the molar percentage of proline did not exceed 8 %. Therefore, the proteins transported from the Gobi Desert are predominantly composed of alanine, glycine and glutamic acid (Fig. 3a).
3.2.2 Total CAA concentration in PM2.5 in northern China
The temporal variations in total CAAs in PM2.5 measured at all sites during the sampling period are shown in Fig. 1. A marked increase in the total CAAs in fine particles was observed at all sampling locations. The average concentrations of total CAAs in PM2.5 in Beijing, Tianjin, Shijiazhuang and Taiyuan increased from the non-dust period of 4.0, 1.7, 1.8 and 2.5 nmol m−3 to 16.7, 7.5, 9.4 and 6.9 nmol m−3 during the dust period, respectively (p<0.01). The temporal variation in the total CAA concentration was consistent with that of PM10 at the four cities (Fig. 1). The highest concentrations of total CAAs at the four sites occurred on 28 March 2018 and coincided with peaks in the enrichment of PM10 concentrations.
As exhibited in Fig. 1, the temporal variation pattern of concentration in PM2.5 was similar to that of PM2.5, which was quite different from that of total CAA concentrations in PM2.5 at Beijing and Tianjin. At Beijing and Tianjin, the highest concentration of in PM2.5 occurred on 27 March (non-dust day) but decreased on 28 and 29 March (dust day). The difference in the temporal variations in total CAAs and in PM2.5 may point to the contribution of different sources during the sampling period.
3.2.3 Individual CAAs in PM2.5 in northern China
For individual amino acid species in PM2.5, the concentrations of alanine and glycine, which predominate in the surface soil of the Gobi Desert, increased markedly during the dust period (Fig. 3b). Specifically, alanine concentrations in PM2.5 during the dust period were 3.0 ± 2.0, 1.1 ± 0.2, 2.2 ± 2.3 and 1.3 ± 0.8 nmol m−3 at Beijing, Tianjin, Shijiazhuang and Taiyuan, being 7, 8, 10 and 4 times more than that during the non-dust period, respectively. Glycine concentrations in PM2.5 rose from 0.3 ± 0.1, 0.2 ± 0.04, 0.2 ± 0.03 and 0.3 ± 0.07 nmol m−3 during the non-dust period to 3.1 ± 1.8, 1.1 ± 0.1, 1.7 ± 1.6 and 0.8 ± 0.5 nmol m−3 during the dust period at Beijing, Tianjin, Shijiazhuang and Taiyuan, respectively. Similarly, the concentrations of glutamic acid, which predominate in common plants of the Gobi Desert, increased markedly during the dust period, with concentrations 17, 15, 12 and 8 times higher than those of the non-dust period at Beijing, Tianjin, Shijiazhuang and Taiyuan, respectively (Fig. 3b). In contrast, the concentrations of other CAAs displayed no significant variation between the dust and non-dust periods.
During the dust period, the molar composition of CAAs in PM2.5 shifted significantly at all sampling locations, compared to the non-dust period (Fig. 3b). In the non-dust period, combined proline dominated the total CAA pool in PM2.5, contributing to 35.4 %, 36.3 %, 32.3 % and 26.0 % in Beijing, Tianjin, Shijiazhuang and Taiyuan, respectively, as illustrated by the dark red shadow in Fig. 2b. This prevalence diminished across all sites during the dust period, with molar percentages of combined proline dropping to 9.4 %, 10.3 %, 13.9 % and 14.9 %, correspondingly. Concurrently, there was a marked increase in the molar percentages of combined alanine, glycine and glutamic acid (blue shadow in Fig. 3b). The average molar percentages of these three CAAs in fine particulates increased from 24.4 %, 24.9 %, 31.6 % and 31.9 %, respectively, during the non-dust period to 61.1 %, 44.2 %, 50.4 % and 48.8 % during the dust period, thus emerging as the dominant CAA species at these locations. Notably, in Beijing, the molar percentage of combined proline exhibited the largest decrease, while the sum of the molar percentage of combined alanine, glycine and glutamic acid, which is abundant in soil and plants of the Gobi Desert, showed the greatest increase.
Based on the variation trends in the percentage composition of CAAs in PM2.5 across the four cities during the dust and non-dust periods, the ratios of the percentage of alanine, glycine and glutamic acid to proline (Ala%Pro%, Gly%Pro%, Glu%Pro%) in PM2.5 on dusty days were compared to those on non-dust days across the four cities. The results showed that in Beijing and Tianjin, the ratios of Ala%Pro%, Gly%Pro% and Glu%Pro% increased significantly on dusty days compared to non-dust days (p<0.05) (Fig. 3c). In Shijiazhuang, during the dust period, the ratios of Ala%Pro% and Gly%Pro% also showed significant increases relative to non-dust days (p<0.05), whereas in Taiyuan, only the Ala%Pro% ratio increased significantly during the dust period (p<0.05) (Fig. 3c).
3.3 Compound-specific nitrogen isotopes of CAAs (δ15N–CAAs)
3.3.1 δ15N–CAAs in the Gobi Desert
δ15N–CAAs of individual CAAs in the surface soil and predominant plants in the Gobi Desert were compared with those in PM2.5 at the four urban sites during non-dust period (Fig. 4, right side). Glycine, leucine, isoleucine, alanine and valine were 15N-depleted in the Gobi Desert surface soil compared to those in PM2.5 at the urban sites during the non-dust period, whereas δ15N values of other individual CAA species were close between these two sources (Fig. 4, right side). Among these four CAA species, the most significant δ15N depletion was observed for glycine and leucine. The mean δ15N values of glycine and leucine showed statistically significant differences between the Gobi Desert surface soil and urban PM2.5 during the non-dust period (one-way ANOVA, p<0.01) (Fig. 5). Specifically, glycine and leucine in Gobi Desert surface soil were depleted in 15N by 12 ‰–14 ‰ and 6 ‰–11 ‰, respectively, relative to their corresponding values in urban PM2.5 during the non-dust period (Fig. 4, right side, yellow box).
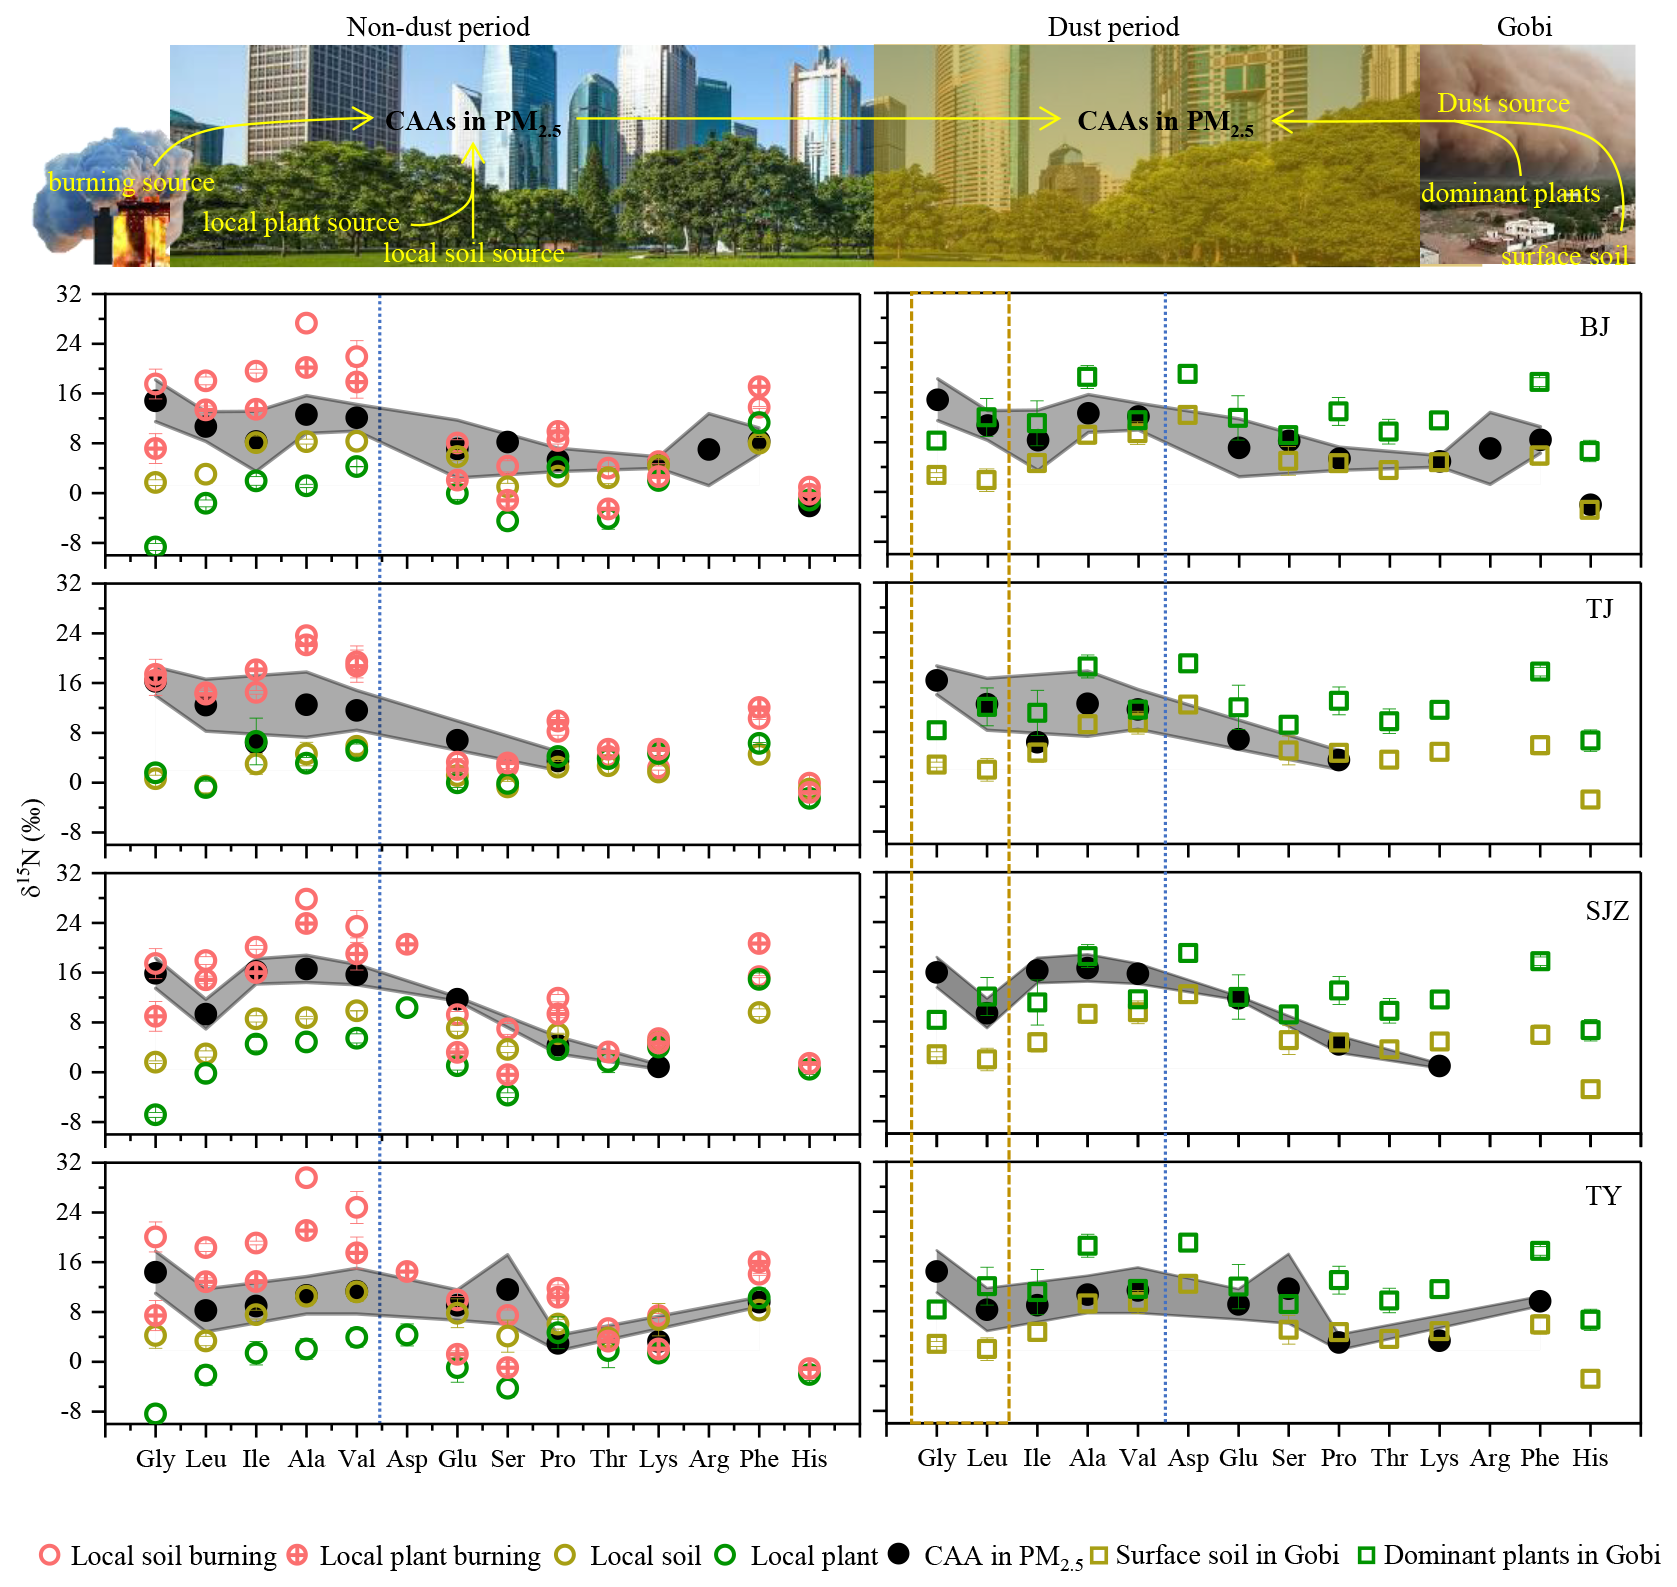
Figure 4Comparison of δ15N–CAA patterns in PM2.5 at BJ, TJ, SJZ and TY with those in potential local sources and Gobi dust sources. CAA species on the left side of dotted blue line were 15N-depleted in the Gobi Desert surface soil compared to those in PM2.5 at the urban sites during the non-dust period. CAA species in the dotted yellow box exhibited the most significant δ15N depletion compared to those in PM2.5 at the urban sites during the non-dust period.
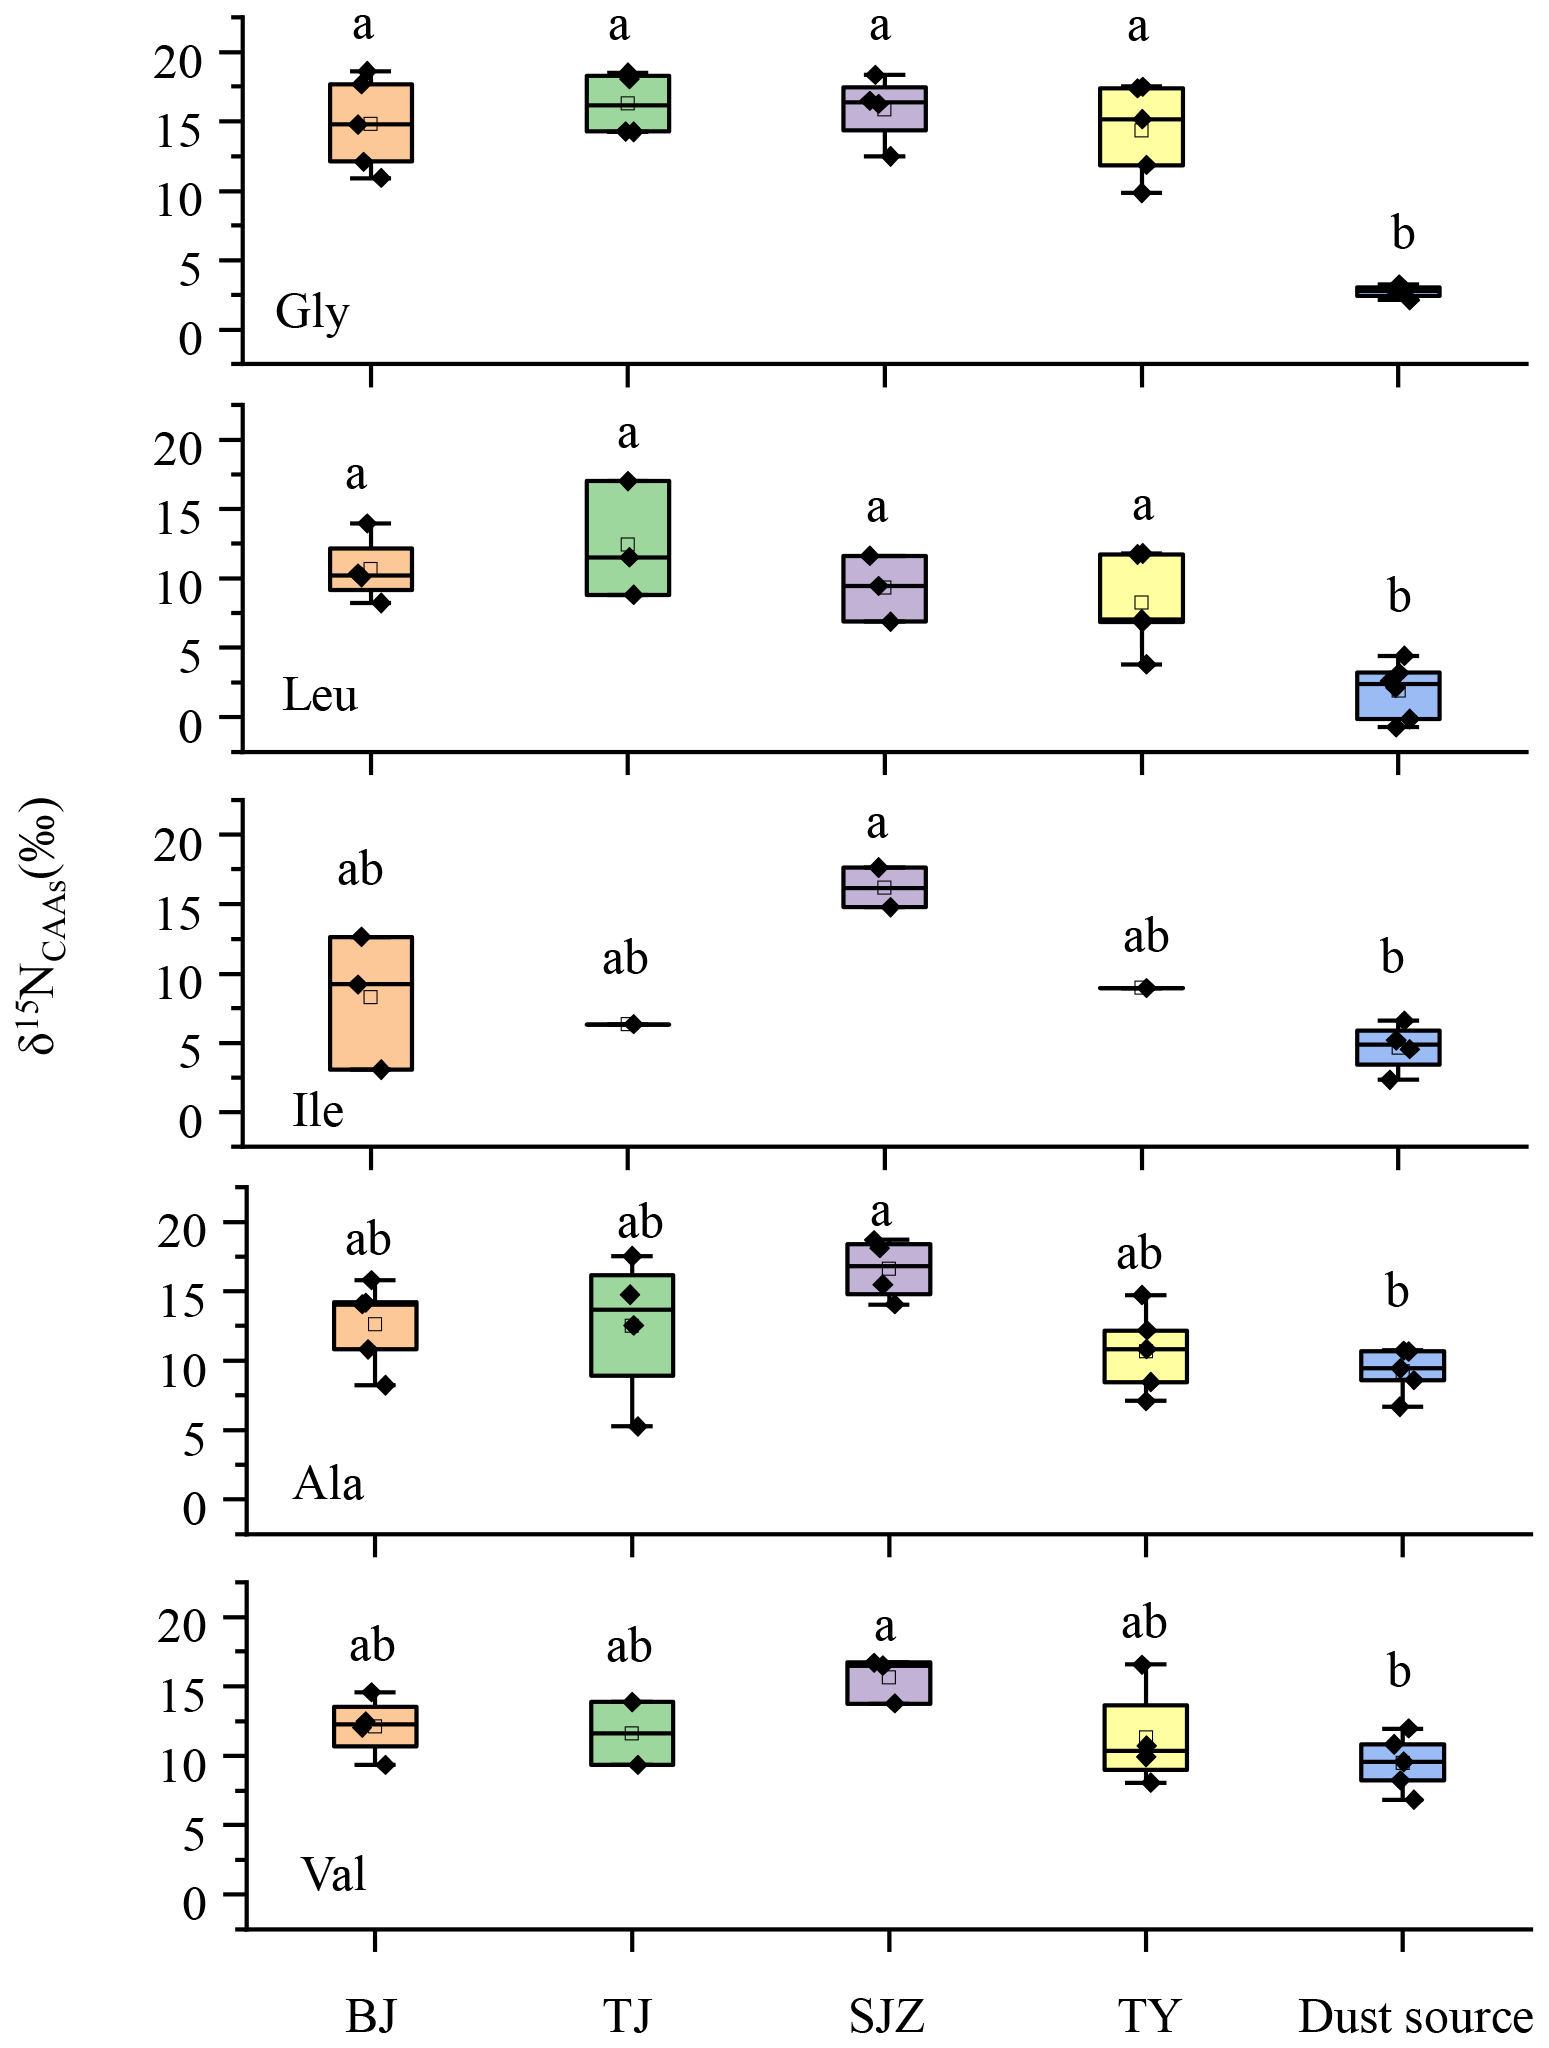
Figure 5The δ15N values of combined glycine (Gly), leucine (Leu), isoleucine (Ile), alanine (Ala) and valine (Val) in PM2.5 at Beijing (BJ), Tianjin (TJ), Shijiazhuang (SJZ) and Taiyuan (TY) during the non-dust period and their corresponding values in the surface soil in the Gobi Desert. Different lower-case letters denote means found to be statistically different (one-way ANOVA, p<0.05).
Compared to the surface soil of the Gobi Desert, predominant plants in the region exhibited significant 15N enrichments of 2 ‰–12 ‰ for all CAA species (Fig. 4, right side, green box). It is noteworthy that the average δ15N value of combined glutamic acid (11.9 ± 3.6 ‰), the predominant amino acid in these plants, was close to its values in urban PM2.5 during the non-dust period at the four cities (one-way ANOVA, p>0.05).
3.3.2 δ15N–CAAs in PM2.5 in northern China
Figure 4 shows the δ15N patterns of individual CAAs in PM2.5 (dark circle), local common plants (green circle) and local soil (yellow circle) as well as local burning sources (pink circle) from four urban sites. During the non-dust period, δ15N–CAAs patterns in PM2.5 at the four urban sites were generally consistent, with glycine, leucine, isoleucine, alanine and valine exhibiting relatively higher δ15N values than other CAA species (Fig. 4, left side). Besides that, δ15N values of individual CAAs in PM2.5 all fell within their respective ranges observed in local dominant plants, soil and burning sources at the four cities (Fig. 4, left side).
During the dust period, glycine, alanine, valine, leucine and isoleucine showed negative shifts in δ15N values compared to those observed during the non-dust periods (Fig. 6). In contrast, the δ15N shifts in other CAA species between the dust and non-dust periods were either relatively minimal or displayed δ15N enrichments (Fig. 6). A spatial variation in δ15N depletions for these five amino acids was observed, with the largest depletions occurring in Beijing. The degree of δ15N–CAA shifts decreased in the order of Beijing, Tianjin, Shijiazhuang and Taiyuan. In Taiyuan, the δ15N shifts in all five amino acids during the dust period were not observed.
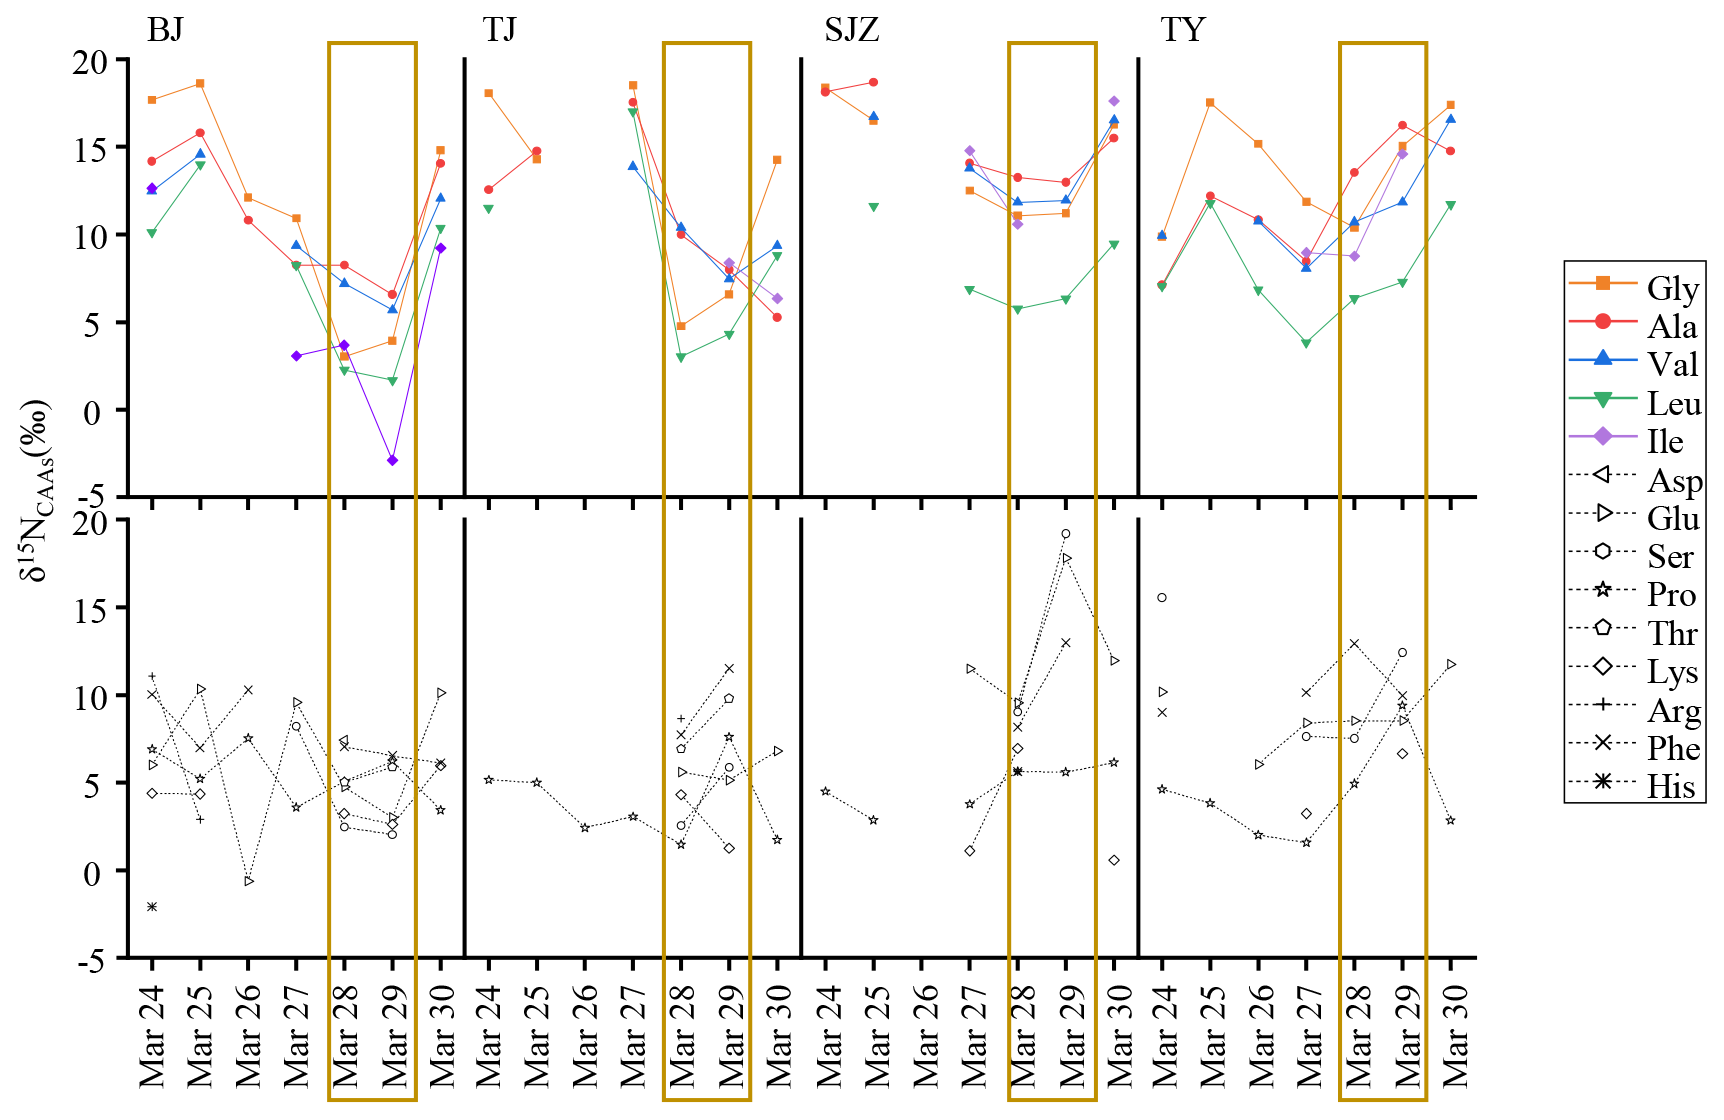
Figure 6Time series of δ15N of individual CAAs in PM2.5 at BJ, TJ, SJZ and TY. The yellow box represents the dust period.
Among these five amino acids, glycine and leucine in PM2.5 exhibited the most significant δ15N depletion during the dust period at the four sampling sites (Fig. 6). The δ15N values of combined glycine in PM2.5 significantly decreased from 14.8 ‰, 16.3 ‰ and 15.9 ‰ during the non-dust period to 3.5 ‰, 5.7 ‰ and 11.1 ‰, respectively, during the dust period at Beijing, Tianjin and Shijiazhuang (one-way ANOVA, p<0.05) (Fig. 7a). At Taiyuan, the average δ15N values of combined glycine in PM2.5 during the non-dust (14.4 ‰) and dust periods (12.7 ‰) were not significantly different (p>0.05). Remarkably, the δ15N values of combined glycine in Beijing's PM2.5 during the dust period ranged from 3.0 ‰ to 3.9 ‰, closely aligning with those found in surface soils of the Gobi Desert, which ranged from +2.1 ‰ to +3.2 ‰ (Fig. 7a). Similarly, the δ15N values of combined leucine in PM2.5 from Beijing and Tianjin sharply decreased from +10.7 ‰ and +12.4 ‰ during the non-dust period to +2.0 ‰ and +3.7 ‰, respectively, during the dust period (one-way ANOVA, p<0.05) (Fig. 7b). At Shijiazhuang and Taiyuan, there was no significant variation in the mean δ15N values of leucine between the non-dust and dust periods (p>0.05) (Fig. 7b).
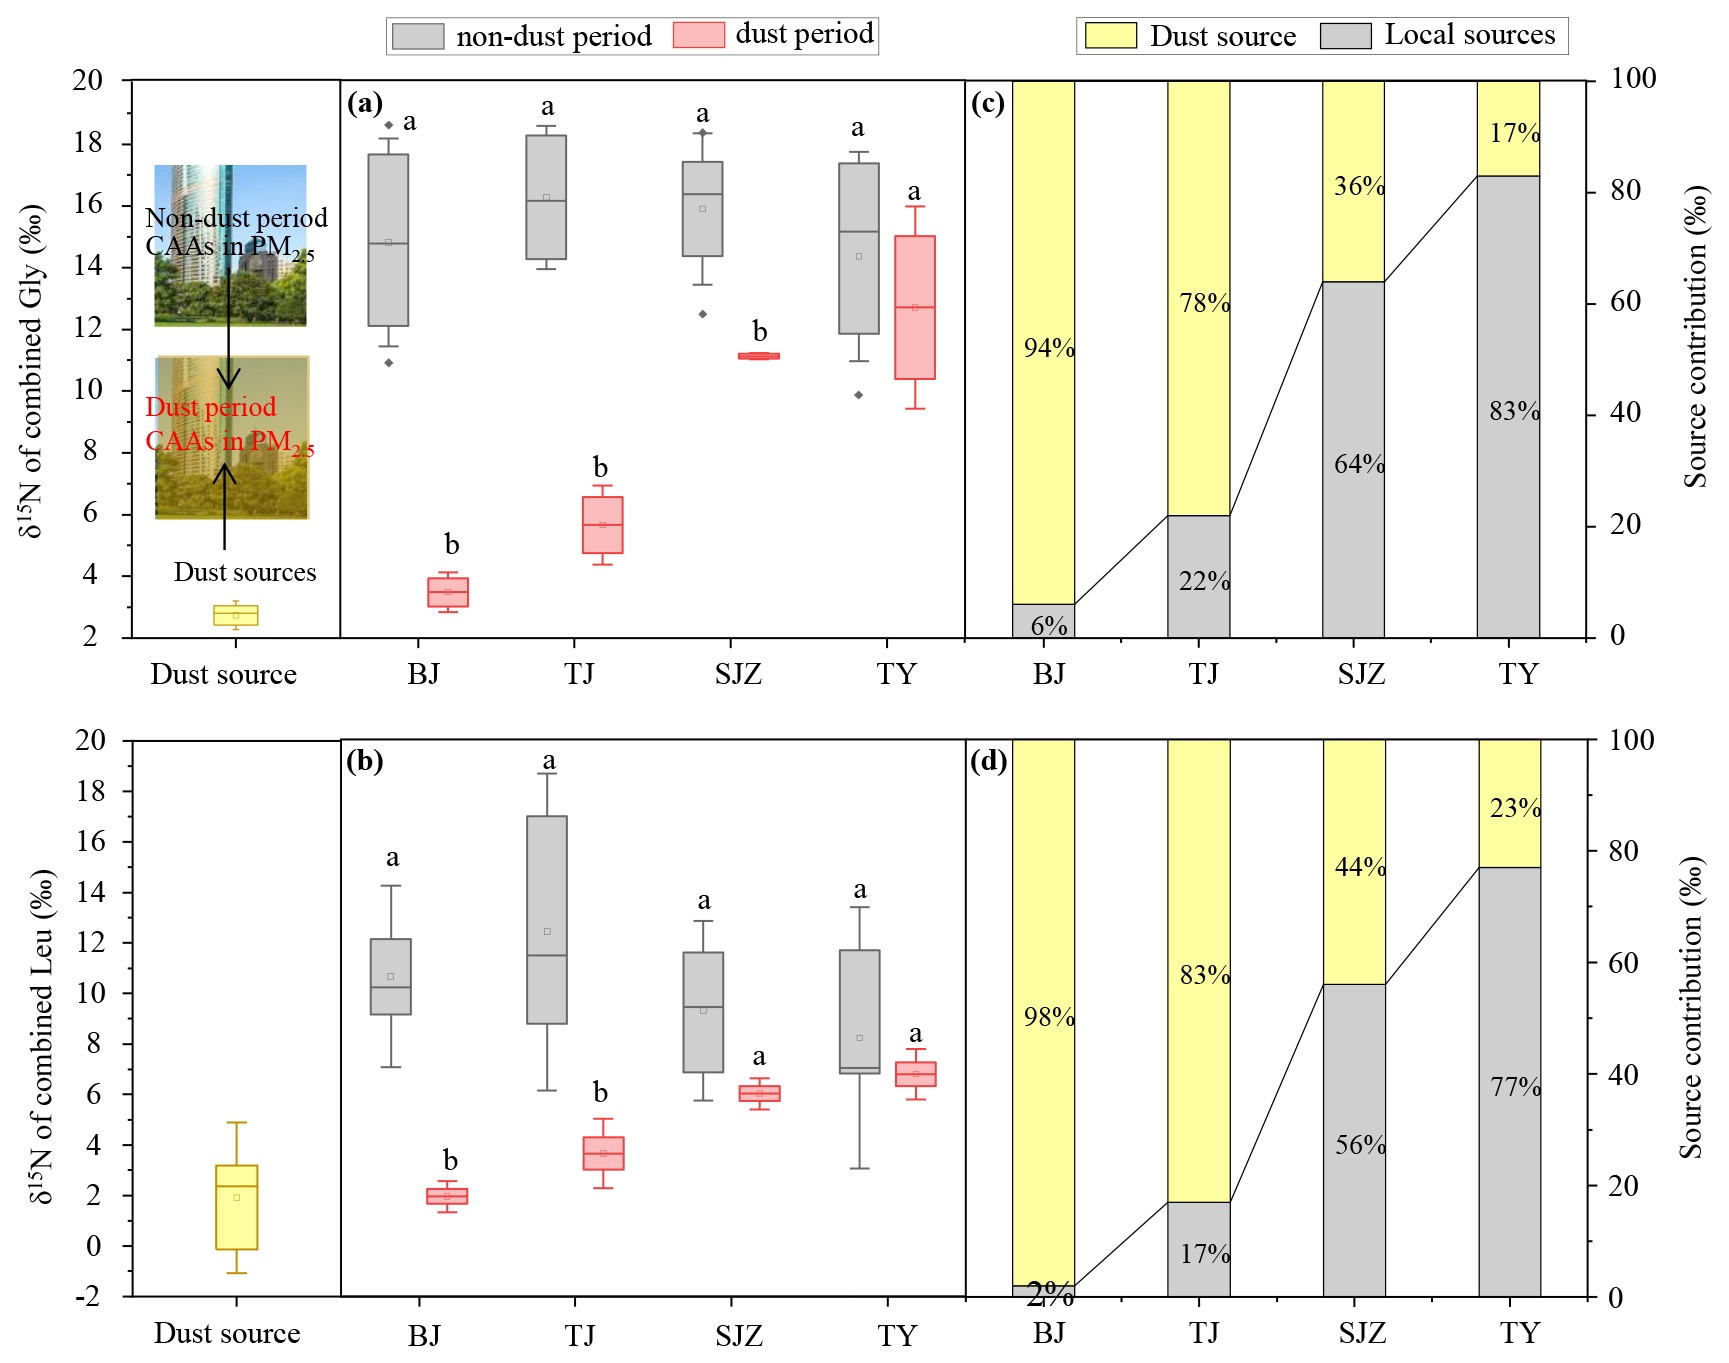
Figure 7(a) δ15N values of combined glycine in surface soil from the Gobi Desert (yellow box) and in PM2.5 during the non-dust (grey box) and dust (red box) periods at Beijing, Tianjin, Shijiazhuang and Taiyuan; (b) δ15N values of combined leucine in surface soil from the Gobi Desert (yellow box) and in PM2.5 during the non-dust (grey box) and dust (red box) periods; (c) the contribution of Gobi dust sources and local urban sources to the CAAs in PM2.5 calculated by the nitrogen isotopic mass balance for glycine; (d) the contribution of Gobi dust sources and local urban sources to the CAAs in PM2.5 calculated by the nitrogen isotopic mass balance for leucine. Different lower-case letters denote means found to be statistically different (one-way ANOVA, p < 0.05) between the non-dust and dust periods.
Moreover, as mentioned above, one-way ANOVA revealed significant differences in the δ15N values of glycine and leucine between Gobi Desert surface soil and urban PM2.5 during the non-dust period (p<0.01; Fig. 5). Therefore, a simple nitrogen isotopic mass balance was employed to estimate the contribution of long-range-transported Gobi dust sources to proteinaceous matter in PM2.5 at the four cities. The results of the nitrogen isotopic mass balance for both glycine and leucine were consistent. During the dust period, long-range-transported Gobi dust sources contributed 94 ± 17 % to 98 ± 23 %, 78 ± 7 % to 83 ± 11 %, 36 ± 1 % to 44 ± 12 % and 17 ± 25 % to 23 ± 10 % to proteinaceous matter in PM2.5 at Beijing, Tianjin, Shijiazhuang and Taiyuan, respectively (Fig. 7c and d).
3.4 Dry deposition fluxes of protein N
A “new” input of CAA N (protein N) supplied by the Gobi Desert for the ecosystems in the downwind region was calculated from Eq. (2). The contribution of the Gobi dust source at each sampling site (f) was obtained from the nitrogen isotopic mass balance (Fig. 7c and d). The average dry deposition of protein N collected at each site during the non-dust period served as the background levels. The dry deposition flux of protein N in PM2.5 sharply increased from the non-dust to the dust period at all four sampling sites. During the dust period, the dry deposition of protein N (Fdry) in PM2.5 was 0.37, 0.22, 0.28 and 0.15 in Beijing, Tianjin, Shijiazhuang and Taiyuan, respectively. The input of protein N from the Gobi dust (Input Fdry) was approximately 4.5, 6.3, 3.3 and 1.3 times higher than the background levels in Beijing, Tianjin, Shijiazhuang and Taiyuan, respectively (Fig. 8).
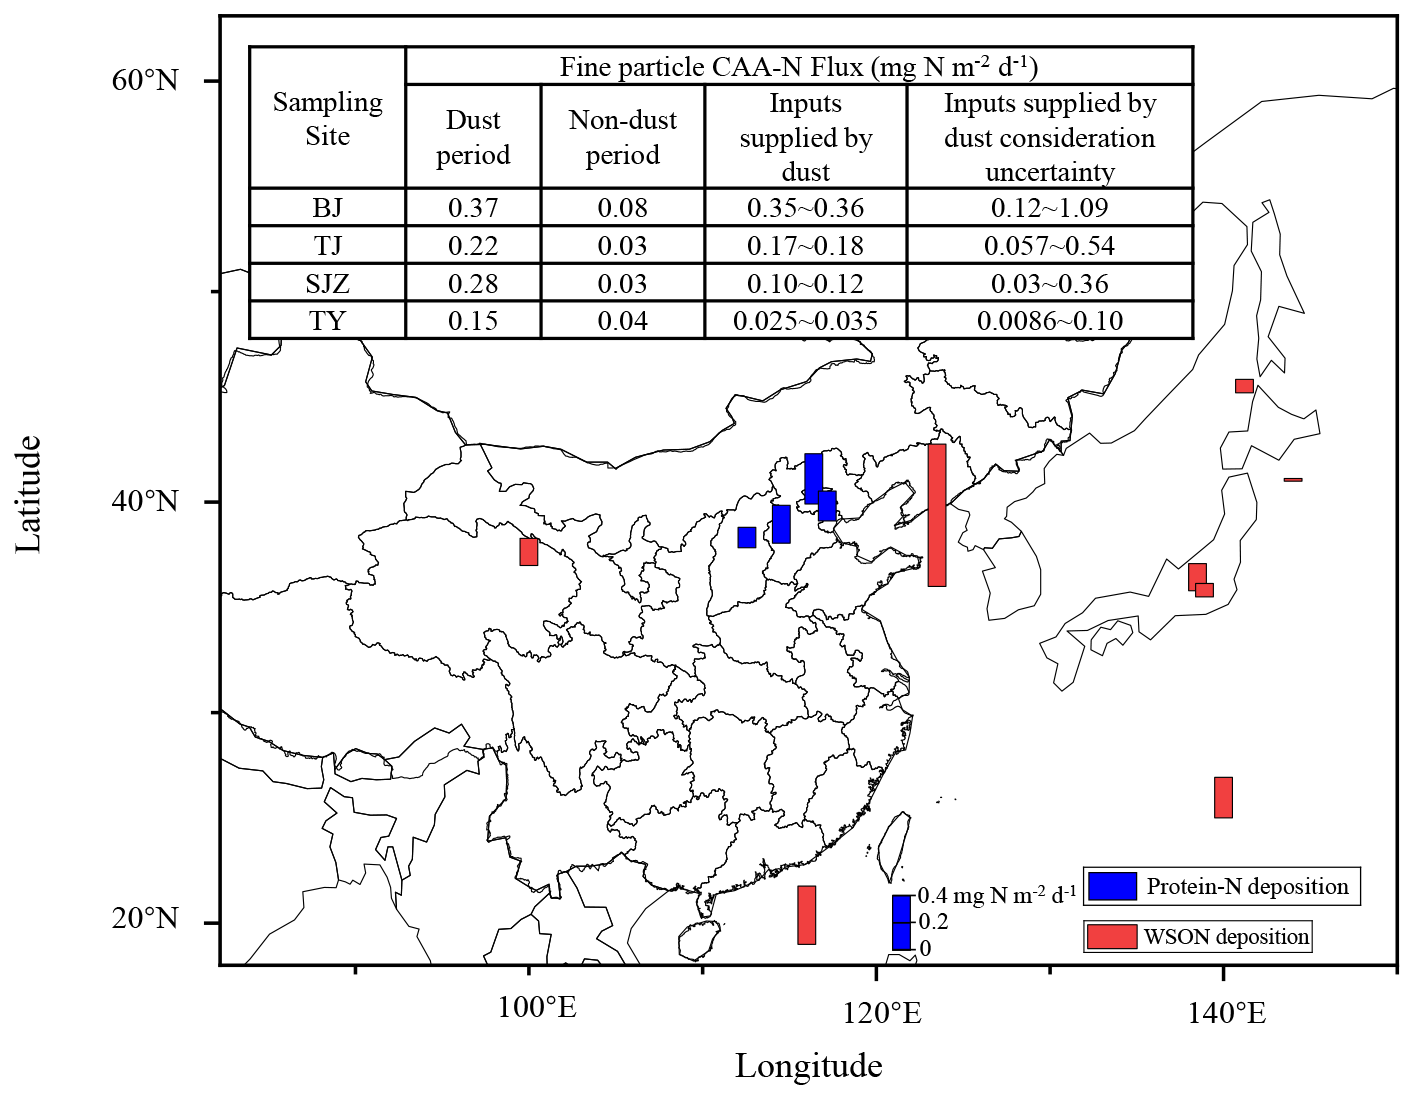
Figure 8The dry deposition flux of protein N at BJ, TJ, SJZ and TY during the dust period (blue bar) and published reports of the dry deposition flux of WSON measured in different atmospheric scenarios (red bar). The length of the bars represents the dry deposition flux of WSON and protein N. The WSON deposition data were sourced from previous studies (Shi et al., 2010; Ho et al., 2015; Matsumoto et al., 2014; Tsagkaraki et al., 2021; Nakamura et al., 2006; Zhang et al., 2011). The method of calculating deposition fluxes of protein N with the uncertainty range at the four sampling sites is provided in the Supplement (Sect. S1).
4.1 Local urban sources of CAAs in PM2.5
Amino acids constitute a major component of water-soluble organic nitrogen and play significant roles in biological activities. Previous studies focused on the levels and distribution of free amino acids (FAAs) in urban aerosols during the dust period (Mace et al., 2003; Shi et al., 2010), revealing that free amino acids typically represent a minor portion of the organic nitrogen, accounting for approximately 1 % of the total organic nitrogen, with no significant increase in their average concentrations during dust periods. However, CAAs are the predominant form of the amino acid compounds in aerosols, with concentrations approximately 5 times higher than those of FAAs (Matsumoto et al., 2021; Wedyan and Preston, 2008). Few studies have investigated the variation in the sources of CAAs in urban aerosols from the non-dust to dust period.
Primary biological aerosol particles including bacteria, fungal spores, viruses, algae, pollen, biological crusts, and plant or animal fragments and detritus are considered the major sources of CAAs in aerosols (Després et al., 2012; Matos et al., 2016; Xie et al., 2024). They are not only emitted from natural sources but also associated with anthropogenic activities such as soil resuspension from traffic and construction, industry, agricultural practices, wastewater treatment, and biomass burning (Kang et al., 2012; Matos et al., 2016; Song et al., 2017). During the non-dust period, CAAs in aerosols at the four urban sites were mainly influenced by the local sources. The average concentrations of total CAAs in PM2.5 in Beijing, Tianjin, Shijiazhuang and Taiyuan during the non-dust period were 4.0, 1.7, 1.8 and 2.5 nmol m−3, respectively. Based on the molecular weight of amino acids, the molar concentrations were converted to mass concentrations, which were 0.5, 0.2, 0.2 and 0.3 µg m−3, respectively. These results are similar to levels previously measured in urban Beijing (average: 0.65 ± 0.55 µg m−3) (Wang et al., 2019) and urban Nanchang, China (average: 0.3 ± 0.3 µg m−3) (Zhu et al., 2020b), but higher than that observed in rural Guangzhou, southern China (average: 0.13 ± 0.05 µg m−3; Song et al., 2017), and a coastal site of Okinawa, Japan (average: 0.16 ± 0.10 µg m−3) (Li et al., 2022a). However, significantly higher average protein concentrations were observed in PM2.5 in Xi'an during haze pollution periods (average: 5.46 ± 3.32 µg m−3) (Li et al., 2022b) and in PM10 in Hefei (average: 11.42 g m−3) (Kang et al., 2012). Clearly, cities with heavy traffic, agricultural production activities, construction activities, and various industries including machinery, electronics, chemistry, steel, textile and cigarette manufacturing have higher atmospheric protein concentrations. Local road dust resuspension and anthropogenic activities in urban areas are important contributors to proteins in aerosols. Besides that, this study found a prevalent concentration of combined proline in the total CAA pool of PM2.5 across all sampling sites during the non-dust period. The compositional profiles of CAAs in aerosols have been utilized to identify the sources of primary aerosol particles (Abe et al., 2016; Matsumoto et al., 2021). The sampling occurred in spring, a period marked by rapid growth of plants and spore emissions. Proline has previously been reported as the major CAA species in urban plants and spores (Barbaro et al., 2015; Matsumoto et al., 2021; Zhu et al., 2020b). Therefore, the predominance of Pro among CAAs observed at these four representative urban sites in North China Plain points to the significant contribution of local plants and spores during spring.
As discussed above, local vegetation, road dust resuspension (traffic and construction activities) and anthropogenic industrial activities may be the major local sources of atmospheric CAAs. Therefore, we determined the nitrogen isotope values of individual CAAs in Platanus orientalis, the most typical plant of the North China Plain and commonly used for urban greening, to serve as the endpoint value for plant-emitted bioaerosols (green circle, Fig. 4 left). The δ15N values of individual CAAs measured in road dust sampled from each city (yellow circle, Fig. 4 left) were used as the endpoint value for road dust resuspension. However, the δ15N values of individual CAAs in PM2.5 were more positive than those measured in local representative plant and road dust during the non-dust period, further confirming protein in PM2.5 was significantly impacted by sources with δ15N values of individual CAAs more positive than those of local plant and soil sources, particularly for glycine, leucine, isoleucine, alanine and valine (Fig. 4). Previous studies have suggested that anthropogenic industrial activities, such as the combustion of coal, biomass or organic materials, contribute significantly to urban aerosol proteins, as indicated by the correlations between aerosol proteins and water-soluble ions (Khan et al., 2019; Li et al., 2022b). Thus, these sources with 15N enrichment are likely anthropogenic industrial activities. Since CAAs are exposed to burning processes during these industrial activities, δ15N values of CAAs emitted from these processes are influenced by nitrogen isotopic fractionation of each CAA during the burning processes. Our earlier research showed that during combustion, the nitrogen isotope values of glycine, leucine, isoleucine, alanine and valine increased by 15.8 ‰, 15.0 ‰, 11.5 ‰, 19.0 ‰ and 13.6 ‰, respectively, compared to their initial values, while other amino acids showed an isotopic increase of less than 5.8 ‰ (Zhu et al., 2024). Clearly, the combustion process led to significant enrichment of nitrogen isotopes in specific amino acids, with the most substantial 15N enrichment observed in glycine, leucine, isoleucine, alanine and valine. We used δ15N values of individual CAAs in local plant and road dust as initial values and the nitrogen isotopic fractionation of each CAA during the combustion process to calculate the δ15N values of individual CAAs in local biological materials after undergoing combustion (pink circle, Fig. 4 left). As shown in Fig. 4, during the non-dust period, the δ15N values of individual CAA in PM2.5 from four cities all fell within their respective ranges in local common plants, soil and burning sources across the four urban sites. This further supported the conclusion that local dominant plants, surface road dust and anthropogenic industrial activities were the major sources of CAAs in PM2.5 across Beijing, Tianjin, Shijiazhuang and Taiyuan during the non-dust period.
4.2 Identification of long-range-transported dust source to the CAAs in PM2.5
Asian dust particles carry substantial microorganisms in desert soils and travel over long distances, leading to an increase in airborne microorganisms in remote downstream areas (Maki et al., 2017; Tang et al., 2018; Tong et al., 2023). Microbial particle concentrations in the atmosphere are proved to be positively related to coarse particles during the dust period (Hara and Zhang, 2012; Maki et al., 2019; Puspitasari et al., 2016). The content of protein in the atmosphere is proved to be the combination of pollen; spores; bacteria; viruses; debris from humans, animals and plants; and fecal matter as well as nucleated combinations of these particles, which can serve as an indicator of all biological matter in the air (Boreson et al., 2004; Menetrez et al., 2007; Staton et al., 2015). It is reasonable to hypothesize that during the dust period, the proteinaceous matter in the desert could be one of the potential sources of CAAs in aerosols in downwind cities.
This study presents the first simultaneous measurements of the levels and distribution of CAAs in PM2.5 across the four urban areas during a dust event. The concentrations of total CAAs in PM2.5 increased sharply at all sampling sites during the dust period (p<0.01) (Fig. 1). Furthermore, the temporal variation pattern of total CAAs in PM2.5 was consistent with that of PM10 (Fig. 1). An increase in PM10 indicates a rise in dust coarse particle levels (Wu et al., 2019). Similarly, Xie et al. (2024) reported that the concentration of aerosol proteins strongly correlated with the mass concentration of particles larger than 2.5 µm during the dust periods, indicating a close dependence of aerosol proteins on dust particles. Furthermore, the total CAA concentrations in PM2.5 were not correlated with the local meteorological conditions (including temperature, humidity or wind speed) but were positively correlated with the PM10 concentration during the dust period (Table S4), suggesting the increase concentration of CAAs in PM2.5 during the dust period was not influenced by local meteorological conditions but was directly linked to the long-range-transported Gobi dust source. Conversely, the concentration of total CAAs displayed an inverse temporal variation pattern with nitrate () concentration (Fig. 1). is a key component of secondary inorganic aerosols in PM2.5, which formed via photochemical oxidation reactions of NOx (Song et al., 2021). Previous studies demonstrated that local urban coal combustion, vehicle exhausts, biomass burning and microbial N cycle were the major contributors to the atmospheric in Beijing (Song et al., 2019; Zhang et al., 2021). Therefore, the decreasing trend of concentration in Beijing and Tianjin during the dust period suggested the lower contribution of local urban sources to CAAs in PM2.5 at these cities during the dust period. During the dust period, the distribution profiles of CAAs in PM2.5 at all observation sites changed, exhibiting consistent variation patterns. Notably, there was a significant increase in the proportions of combined glycine, alanine and glutamic acid, the most abundant amino acids in surface soil and predominant plants from the Gobi Desert (Fig. 3). Moreover, substantial amounts of alanine, glycine and glutamic acid from Gobi Desert surface soil and plants into PM2.5 in downwind areas led to increased ratios of Ala%Pro%, Gly%Pro% and Glu%Pro% in PM2.5 at the four cities on dusty days (Fig. 3). These findings further support the hypothesis that long-range-transported surface soil and plants from the Gobi Desert significantly contribute to the proteinaceous matter in PM2.5 in downwind areas during the dust period. These newly transported proteins from the Gobi Desert area have high proportions of combined glycine, alanine and glutamic acid, which is abundant in surface soil and predominant in plants in the Gobi Desert.
The δ15N values of specific amino acid have been utilized as a novel method to identify the sources of amino acids (Batista et al., 2014; Mccarthy et al., 2013; Zhu et al., 2021). The shift in δ15N values of specific CAAs in urban PM2.5 during the dust period may be attributed to the inputs from long-range-transported amino acid sources. Combined glycine constitutes a high proportion of the total CAA pool in the surface soil of the Gobi Desert (averaging 20.4 %), while its content is extremely low in common Gobi plants (averaging 1.1 %) (Fig. 3). Therefore, during dust periods, the δ15N values of glycine in PM2.5 in downwind cities are primarily influenced by the δ15N values of glycine in the surface soil of the Gobi Desert rather than by those in Gobi plants. Since the mean δ15N values of glycine in Gobi Desert surface soil were more negative than that of urban PM2.5 during the non-dust period, the mean δ15N values of glycine in PM2.5 from cities impacted by Gobi dust sources would be more negative. Leucine is present in roughly equal amounts in both the surface soil and the common plants of the Gobi Desert (averaging about 5.5 % each) (Fig. 3). The δ15N values of leucine in predominant plants do not significantly differ from those in PM2.5 during the non-dust period, while δ15N values of leucine in surface soil were significantly lower (Fig. 4). Similar to glycine, during dust periods, the δ15N values of leucine in PM2.5 in downwind cities are also primarily influenced by the δ15N values of leucine in the surface soil of the Gobi Desert. Therefore, the 15N depletion of glycine and leucine in urban PM2.5 indicated the contribution of Gobi dust source (Figs. 5 and 7).
Combining the correlation between combined amino acids and PM10, the variation in the distribution of the CAAs, and the shift in the δ15N values of individual amino acids in PM2.5 during the dust period, we can conclude that CAAs in surface soil and predominant plants in the Gobi Desert are substantial contributors of combined amino acids in fine particles in northern China during the dust period.
4.3 Contribution of dust sources to the CAAs in PM2.5 at each city
It is crucial to quantifying the contribution of dust sources to the CAAs in atmospheric PM2.5 in different downwind regions. Although all four cities were affected by the same dust source (the Gobi Desert) during this dust event, the extent of increase in CAA concentrations, the percentage increase in CAA species that are abundant in the Gobi Desert source (Ala%, Gly% and Glu%), and the degree of δ15N depletion in glycine and leucine varied among the four sampling sites (Figs. 3 and 5). Notably, in Beijing, the increase in concentration and percentage of alanine, glycine and leucine, as well as the degree of δ15N depletion in glycine and leucine, were the most significant. These results suggest that the contribution of dust sources to the CAAs in atmospheric PM2.5 varies across the four sites, with Beijing, being closest to the dust source, most strongly affected by the Gobi dust sources. This result was consistent with the results of Xie et al. (2023). They examined the dissemination of bioaerosols in the westerly wind from the Asian continent to the northwestern Pacific. The concentration of bioaerosol increased significantly in all sites, which are located on the pathway of the Northern Hemisphere middle-latitude westerly wind, during the dust period. However, the increase rate of bioaerosols decreased with the distance from the Asian continent, suggesting the influence of dust on bioaerosol concentrations along the transport pathway was in the decreasing order. They suggested that this decreasing trend was very likely dominated by the dry deposition of dust particles (Xie et al., 2023, 2024). Dry deposition flux refers to the mass of particles in the atmosphere that settle to the surface by non-precipitation events (Xie et al., 2023). However, it is challenging to accurately estimate the contribution of protein originating from the dust sources and its dry deposition flux. Compound-specific nitrogen isotope analyses of individual amino acids may offer a new approach to solving this problem.
This study represents the isotopic interpretation of individual CAAs in PM2.5 during the dust period to estimate the contribution of dust sources to CAAs in PM2.5 in northern China. As discussed in Sect. 4.2, significant quantities of proteinaceous matter transported by Asian dust are expected to increase the concentrations of combined glycine and leucine in urban PM2.5 and decrease their δ15N values. Greater inputs of proteinaceous matter from Asian dust typically result in more negative δ15N values of combined glycine and leucine in urban PM2.5. Particularly in Beijing, δ15N values of combined glycine and leucine in PM2.5 during the dust period were close to those in the surface soil of the Gobi Desert (Fig. 7). Therefore, with known concentrations and isotopic values of specific amino acid in PM2.5 during the non-dust periods and during the dust period in downwind regions, as well as the isotopic values of these amino acids from the dust source area, it is possible to calculate the contribution of dust sources to the protein in PM2.5 in these downwind regions using nitrogen isotope mass balance for the specific amino acid. Using this approach, the contributions of dust sources to Beijing, Tianjin, Shijiazhuang and Taiyuan during this dust event were calculated for glycine as 94 ± 17 %, 78 ± 7 %, 36 ± 1 % and 17 ± 25 %, respectively. For leucine, the contributions were 98 ± 23 %, 83 ± 11 %, 44 ± 12 % and 23 ± 10 %, respectively. The contributions estimated through nitrogen isotope mass balance for glycine align with those derived from leucine (Fig. 7). This demonstrates that isotopic mass balance based on the δ15N values of glycine and leucine in PM2.5 is an effective tool for assessing the contribution of dust sources to proteinaceous material in downwind regions.
It should be noted that we applied a two-endmember mixing model comparing compound-specific nitrogen isotopic values of CAAs from Gobi dust sources with those in urban aerosols during non-dust periods (representing the atmospheric background values) rather than those in local dominant plants, road dust and anthropogenic activity sources. Our methodology relies on the fundamental assumption that the nitrogen isotopic composition of CAAs in urban aerosols during the dust period, which derived from local dominant plants, road dust and anthropogenic activities, does not significantly differ from background atmospheric values.
For the Beijing, Tianjin and Shijiazhuang sampling sites, meteorological conditions (wind speed, relative humidity and temperature) did not differ significantly (p>0.05) between dust and non-dust periods (Figs. S3 and S4). Under these stable conditions, local urban emission sources remained consistent, maintaining unchanged atmospheric background values. Therefore, the application of a two-endmember mixing model – utilizing isotopic values of compound-specific CAAs from Gobi dust sources and urban aerosols during non-dust periods – provides a scientifically robust approach for quantifying Gobi dust contributions in Beijing, Tianjin and Shijiazhuang.
At the Taiyuan sampling site, wind speeds during dust events were significantly higher than during non-dust periods (p<0.05; Figs. S3 and S4). These strong winds may enhance entrainment of local plant debris and road dust into aerosols, potentially modifying baseline δ15N signatures of CAAs. This suggests CAA δ15N values during the non-dust period (atmospheric background values) may not fully represent local signatures during the dust event in Taiyuan, potentially affecting source apportionment. To evaluate this effect, we applied the MIXSIAR model (Stock and Semmens, 2016; Song et al., 2021) with δ15N values of both glycine and leucine from local and Gobi dust sources (Table S1, details are provided in Sect. S2). The MIXSIAR model showed that in Taiyuan, the relative contributions of local dominant plants, road dust and anthropogenic activities sources to aerosol CAAs averaged 1.6 ± 2.6 %, 46.2 ± 20.9 % and 45.8 ± 12.2 %, respectively, during the non-dust period (Table S5). The dust period exhibited modified contribution profiles: local plants (12.6 ± 10.3 %), road dust (32.7 ± 19.8 %) and anthropogenic emissions (35.9 ± 10.0 %), along with an external contribution from Gobi dust sources (18.7 ± 14.1 %) (Table S5). The Gobi dust contribution estimated by MIXSIAR showed agreement with our two-endmember model estimates (17 ± 25 % to 23 ± 10 %). After normalizing MIXSIAR results to exclude Gobi dust contributions, natural sources (local plant plus road dust) showed only a modest increase from 47.8 % (non-dust) to 55.8 % (dust periods), representing an 8 % enhancement. Future research should incorporate more extended observational periods of dust events, with particular emphasis on downwind areas experiencing significant meteorological changes. Such extended investigations will enable a more accurate assessment of how long-range-transported dust sources influence biogeochemical cycles in downwind ecosystems.
Using this two-endmember mixing model, the calculated dry deposition of protein N in PM2.5 was 0.12–1.09, 0.057–0.54, 0.03–0.36 and 0.0086–0.10 in Beijing, Tianjin, Shijiazhuang and Taiyuan, respectively, which displays a decreasing trend along the transport pathway (Fig. 2). A consistent trend was also found in the dry deposition flux of Asian dust, which decreased exponentially along its transport pathway (Lyu et al., 2017; Park et al., 2010). This result confirmed that the increase in airborne protein concentration in downwind areas during the dust period may be controlled by dry deposition of dust particles with protein coagulated or condensed.
4.4 Implications of the Gobi Desert-supplied protein N inputs
Proteinaceous matter in the atmosphere has been studied extensively because it can be a utilizable source of nitrogen for plants and microorganisms (Ho et al., 2015; Samy et al., 2013; Zhang and Anastasio, 2003). Nutrients (e.g. protein N) whipped up from deserts by strong winds can travel long distances, including over remote oceans (Favet et al., 2013; Yang et al., 2021). Previous studies have shown that dust inputs can stimulate phytoplankton metabolism and thereby enhance new production in the ocean (Duarte et al., 2006; Gazeau et al., 2021). The positive correlation of dust events with chlorophyll a concentrations, primary production and spring algae blooms in the south Yellow Sea and East China Sea has been well characterized (Tan et al., 2011). Due to the high bioavailability of amino acid N, it can serve as a source of nutrients for marine ecosystems and greatly contribute to ecological processes in the marginal seas of China via processes such as fertilization of phytoplankton and stimulation of nitrogen fixation (Duarte et al., 2006; Ho et al., 2015).
In this study, the Gobi Desert-supplied protein N input (0.12–1.09, 0.057–0.54, 0.03–0.36 and 0.0086–0.10 in Beijing, Taiyuan, Shijiazhuang and Taiyuan, respectively) (Fig. 8) was compared with published reports of the dry deposition flux of WSON measured in different atmospheric scenarios. Gobi Desert-supplied protein N input was higher than that observed in a suburban site in northern California, USA (0.04 ) (Zhang et al., 2002). Although the Gobi Desert-supplied protein N input was lower than the dry deposition of WSON measured in urban sites in China and a coastal site in Qingdao, China, it was markedly higher than those previously measured in the remote Pacific Ocean and Atlantic Ocean areas, consistent with or even higher than those observed at the marginal seas of China (e.g. Yellow Sea and South China Sea) and forested, coastal and rural sites of Japan. Nakamura et al. (2006) suggested that WSON transported from East Asia is an important nitrogen component over the East China Sea. Our results showed that Gobi Desert-supplied protein N inputs were comparable to or even higher than the dry deposition of WSON in the marginal seas of China (Fig. 8). According to East Asian winter monsoon (from October to April) dynamics, a large quantity of protein N supplied by Gobi dust found in this study can be deposited in a short period of the year. Although dust events happened within a few days, continuously occurring dust events and enhanced Asian-dust-supplied protein N during the spring, coinciding with the algae bloom season, may exert widespread effects on the productivity of downwind ecosystems under the influence of the East Asian dust belt, including China, Korea, Japan and the North Pacific. Additionally, during long-range transport, hydrophilic protein particles mix with mineral particles to form various internal mixtures. These mixed particles can absorb water efficiently, thereby increasing CCN activity and altering optical properties, which is important for understanding global climate and hydrological cycles (Adachi et al., 2020). Furthermore, Li et al. (2022b) suggest that aerosol proteins might affect the generation of secondary aerosols. Under high relative humidity condition, water might condense onto protein aerosols due to their good hygroscopicity, resulting in the formation of a film of water on the aerosol surface. This water film easily adsorbs gaseous pollutants in the atmosphere, including SO2, NOx, O3 and volatile organic compounds (VOCs). The oxidation rate of these gaseous pollutants in the liquid–solid heterogeneous system is much faster than that in gaseous phase. Thus, water film on the protein surface may accelerate the oxidation of the absorbed gaseous pollutants in the atmosphere.
In this study, the composition profiles of combined amino acids in both the surface soils and dominant plants in the Gobi Desert were characterized. Results indicated that the proteins transported with Gobi Desert dust contain large amounts of alanine, glycine and glutamic acid. Therefore, the concentration of these three CAAs significantly increased and ratios of Ala%Pro%, Gly%Pro% and Glu%Pro% in PM2.5 elevated at the four cities on dusty days.
Moreover, δ15N patterns of CAAs of the surface soil and predominant plants in the Gobi Desert were demonstrated, which were further used to interpret the source variation in proteinaceous matter in PM2.5 at the four cities from the non-dust to dust period. The mean δ15N values of glycine and leucine in the Gobi Desert surface soil were significantly lower than those in urban PM2.5 during the non-dust period, which can be used to trace Gobi dust sources. According to the δ15N inventories of individual CAAs in potential emission sources, local plants, surface soil and burning sources were the major sources of CAAs in PM2.5 at Beijing, Tianjin, Shijiazhuang and Taiyuan during the non-dust period. During the dust period, more negative δ15N values of combined glycine and leucine were observed in PM2.5 in northern China, also suggesting inputs of proteinaceous matter from the Gobi Desert.
The contribution of dust sources to the protein in PM2.5 in these downwind regions estimated through nitrogen isotope mass balance for glycine aligns with those derived from leucine, indicating that isotopic mass balance based on the δ15N values of glycine and leucine is an effective tool for assessing the contribution of dust sources to proteinaceous material in PM2.5. The results showed that protein N supplied by Gobi dust can reach 0.36 . This large quantity of protein N is deposited in a short period of the year and has important effects on the productivity of oligotrophic ecosystems under the influence of the East Asian dust belt.
Meteorological parameters, including temperature (T), relative humidity (RH) and windspeed (WD), during the sampling period are available at the following website: https://www.weatherandclimate.info/ (Weather and climate, 2025). Air quality data, including PM2.5 and PM10 concentrations, are available at the following website: https://www.aqistudy.cn/ (China Air Quality Index data and analysis platform, 2025).
The supplement related to this article is available online at https://doi.org/10.5194/acp-25-7699-2025-supplement.
RGZ and HYX designed the study, and MY and HX carried it out. ZZ, YP and GW performed the data analysis. CL performed the model simulations. RGZ prepared the manuscript with contributions from all co-authors.
The contact author has declared that none of the authors has any competing interests.
Publisher's note: Copernicus Publications remains neutral with regard to jurisdictional claims made in the text, published maps, institutional affiliations, or any other geographical representation in this paper. While Copernicus Publications makes every effort to include appropriate place names, the final responsibility lies with the authors.
We would like to thank the Global Weather and Climate Information Network (https://www.weatherandclimate.info/) for providing meteorological parameters, including temperature (T), relative humidity (RH) and precipitation, during the sampling period. We would also like to thank the China Air Quality Online Monitoring and Analysis Platform for providing air quality data (https://www.aqistudy.cn/, last access: 15 July 2025) and NASA's EOSDIS Worldview for providing MODIS satellite images (https://worldview.earthdata.nasa.gov/).
This research has been supported by the National Natural Science Foundation of China (grant no. 42363011).
This paper was edited by Roya Bahreini and reviewed by two anonymous referees.
Abe, R. Y., Akutsu, Y., and Kagemoto, H.: Protein amino acids as markers for biological sources in urban aerosols, Environ. Chem. Lett., 14, 155–161, https://doi.org/10.1007/s10311-015-0536-0, 2016.
Adachi, K., Oshima, N., Gong, Z., de Sá, S., Bateman, A. P., Martin, S. T., de Brito, J. F., Artaxo, P., Cirino, G. G., Sedlacek III, A. J., and Buseck, P. R.: Mixing states of Amazon basin aerosol particles transported over long distances using transmission electron microscopy, Atmos. Chem. Phys., 20, 11923–11939, https://doi.org/10.5194/acp-20-11923-2020, 2020.
An, S., Couteau, C., Luo, F., Neveu, J., and DuBow, M. S.: Bacterial Diversity of Surface Sand Samples from the Gobi and Taklamaken Deserts, Microb. Ecol., 66, 850–860, https://doi.org/10.1007/s00248-013-0276-2, 2013.
Barbaro, E., Zangrando, R., Vecchiato, M., Piazza, R., Cairns, W. R. L., Capodaglio, G., Barbante, C., and Gambaro, A.: Free amino acids in Antarctic aerosol: potential markers for the evolution and fate of marine aerosol, Atmos. Chem. Phys., 15, 5457–5469, https://doi.org/10.5194/acp-15-5457-2015, 2015.
Batista, F. C., Ravelo, A. C., Crusius, J., Casso, M. A., and McCarthy, M. D.: Compound specific amino acid δ15N in marine sediments: A new approach for studies of the marine nitrogen cycle, Geochim. Cosmochim. Ac., 142, 553–569, https://doi.org/10.1016/j.gca.2014.08.002, 2014.
Boreson, J., Dillner, A. M., and Peccia, J.: Correlating bioaerosol load with PM2.5 and PM10cf concentrations: a comparison between natural desert and urban-fringe aerosols, Atmos. Environ., 38, 6029–6041, https://doi.org/10.1016/j.atmosenv.2004.06.040, 2004.
Chan, M. N., Choi, M. Y., Ng, N. L., and Chan, C. K.: Hygroscopicity of Water-Soluble Organic Compounds in Atmospheric Aerosols: Amino Acids and Biomass Burning Derived Organic Species, Environ. Sci. Technol., 39, 1555–1562, https://doi.org/10.1021/es049584l, 2005.
Chen, S., Huang, J., Li, J., Jia, R., Jiang, N., Kang, L., Ma, X., and Xie, T.: Comparison of dust emissions, transport, and deposition between the Taklimakan Desert and Gobi Desert from 2007 to 2011, Sci. China Earth Sci., 60, 1338–1355, https://doi.org/10.1007/s11430-016-9051-0, 2017.
China Air Quality Index data and analysis platform: https://www.aqistudy.cn/, last access: 15 July 2025.
Després, V., Huffman, J. A., Burrows, S. M., Hoose, C., Safatov, A., Buryak, G., Fröhlich-Nowoisky, J., Elbert, W., Andreae, M., Pöschl, U., and Jaenicke, R.: Primary biological aerosol particles in the atmosphere: a review, Tellus B, 64, 15598, https://doi.org/10.3402/tellusb.v64i0.15598, 2012.
Duarte, C. M., Dachs, J., Llabrés, M., Alonso-Laita, P., Gasol, J. M., Tovar-Sánchez, A., Sañudo-Wilhemy, S., and Agustí, S.: Aerosol inputs enhance new production in the subtropical northeast Atlantic, J. Geophys. Res.-Biogeo., 111, 2005JG000140, https://doi.org/10.1029/2005JG000140, 2006.
Duce, R. A., Liss, P. S., Merrill, J. T., Atlas, E. L., Buat-Menard, P., Hicks, B. B., Miller, J. M., Prospero, J. M., Arimoto, R., Church, T. M., Ellis, W., Galloway, J. N., Hansen, L., Jickells, T. D., Knap, A. H., Reinhardt, K. H., Schneider, B., Soudine, A., Tokos, J. J., Tsunogai, S., Wollast, R., and Zhou, M.: The atmospheric input of trace species to the world ocean, Global Biogeochem. Cy., 5, 193–259, https://doi.org/10.1029/91GB01778, 1991.
Elbert, W., Taylor, P. E., Andreae, M. O., and Pöschl, U.: Contribution of fungi to primary biogenic aerosols in the atmosphere: wet and dry discharged spores, carbohydrates, and inorganic ions, Atmos. Chem. Phys., 7, 4569–4588, https://doi.org/10.5194/acp-7-4569-2007, 2007.
Favet, J., Lapanje, A., Giongo, A., Kennedy, S., Aung, Y.-Y., Cattaneo, A., Davis-Richardson, A. G., Brown, C. T., Kort, R., Brumsack, H.-J., Schnetger, B., Chappell, A., Kroijenga, J., Beck, A., Schwibbert, K., Mohamed, A. H., Kirchner, T., De Quadros, P. D., Triplett, E. W., Broughton, W. J., and Gorbushina, A. A.: Microbial hitchhikers on intercontinental dust: catching a lift in Chad, ISME J., 7, 850–867, https://doi.org/10.1038/ismej.2012.152, 2013.
Feltracco, M., Barbaro, E., Kirchgeorg, T., Spolaor, A., Turetta, C., Zangrando, R., Barbante, C., and Gambaro, A.: Free and combined L-and D-amino acids in Arctic aerosol, Chemosphere, 220, 412–421, https://doi.org/10.1016/j.chemosphere.2018.12.147, 2019.
Filippo, P. D., Pomata, D., Riccardi, C., Buiarelli, F., Gallo, V., and Quaranta, A.: Free and combined amino acids in size-segregated atmospheric aerosol samples, Atmos. Environ., 98, 179–189, https://doi.org/10.1016/j.atmosenv.2014.08.069, 2014.
Fröhlich-Nowoisky, J., Kampf, C. J., Weber, B., Huffman, J. A., Pöhlker, C., Andreae, M. O., Lang-Yona, N., Burrows, S. M., Gunthe, S. S., Elbert, W., Su, H., Hoor, P., Thines, E., Hoffmann, T., Després, V. R., and Pöschl, U.: Bioaerosols in the Earth system: Climate, health, and ecosystem interactions, Atmos. Res., 182, 346–376, https://doi.org/10.1016/j.atmosres.2016.07.018, 2016.
Gazeau, F., Van Wambeke, F., Marañón, E., Pérez-Lorenzo, M., Alliouane, S., Stolpe, C., Blasco, T., Leblond, N., Zäncker, B., Engel, A., Marie, B., Dinasquet, J., and Guieu, C.: Impact of dust addition on the metabolism of Mediterranean plankton communities and carbon export under present and future conditions of pH and temperature, Biogeosciences, 18, 5423–5446, https://doi.org/10.5194/bg-18-5423-2021, 2021.
Haan, D. O. D., Corrigan, A. L., Smith, K. W., Stroik, D. R., Turley, J. J., Lee, F. E., Tolbert, M. A., Jimenez, J. L., Cordova, K. E., and Ferrell, G. R.: Secondary Organic Aerosol-Forming Reactions of Glyoxal with Amino Acids, Environ. Sci. Technol., 43, 2818–2824, https://doi.org/10.1021/es803534f, 2009.
Hara, K. and Zhang, D.: Bacterial abundance and viability in long-range transported dust, Atmos. Environ., 47, 20–25, https://doi.org/10.1016/j.atmosenv.2011.11.050, 2012.
Ho, K. F., Ho, S. S. H., Huang, R.-J., Liu, S. X., Cao, J.-J., Zhang, T., Chuang, H.-C., Chan, C. S., Hu, D., and Tian, L.: Characteristics of water-soluble organic nitrogen in fine particulate matter in the continental area of China, Atmos. Environ., 106, 252–261, https://doi.org/10.1016/j.atmosenv.2015.02.010, 2015.
Ianiri, H. L. and McCarthy, M. D.: Compound specific δ15N analysis of amino acids reveals unique sources and differential cycling of high and low molecular weight marine dissolved organic nitrogen, Geochim. Cosmochim. Ac., 344, 24–39, https://doi.org/10.1016/j.gca.2023.01.008, 2023.
Jaber, S., Joly, M., Brissy, M., Leremboure, M., Khaled, A., Ervens, B., and Delort, A.-M.: Biotic and abiotic transformation of amino acids in cloud water: experimental studies and atmospheric implications, Biogeosciences, 18, 1067–1080, https://doi.org/10.5194/bg-18-1067-2021, 2021.
Jaenicke, R.: Abundance of Cellular Material and Proteins in the Atmosphere, Science, 308, 73–73, https://doi.org/10.1126/science.1106335, 2005.
Kang, H., Xie, Z., and Hu, Q.: Ambient protein concentration in PM10 in Hefei, central China, Atmos. Environ., 54, 73–79, https://doi.org/10.1016/j.atmosenv.2012.03.003, 2012.
Khan, M. S., Deguchi, Y., Matsumoto, T., Nagaoka, H., Yamagishi, N., Wakabayashi, K., and Watanabe, T.: Relationship of Asian Dust Events with Atmospheric Endotoxin and Protein Levels in Sasebo and Kyoto, Japan, in Spring, Biol. Pharm. Bull., 42, 1713–1719, https://doi.org/10.1248/bpb.b19-00383, 2019.
Li, X., Zhang, Y., Shi, L., Kawamura, K., Kunwar, B., Takami, A., Arakaki, T., and Lai, S.: Aerosol Proteinaceous Matter in Coastal Okinawa, Japan: Influence of Long-Range Transport and Photochemical Degradation, Environ. Sci. Technol., 56, 5256–5265, https://doi.org/10.1021/acs.est.1c08658, 2022a.
Li, Y., Haoyue, Z., Aotang, L., Jiali, Z., and Shengli, D.: High time-resolved variations of proteins in PM2.5 during haze pollution periods in Xi'an, China, Environ. Pollut., 305, 119212, https://doi.org/10.1016/j.envpol.2022.119212, 2022b.
Liu, Q., Liu, Y., Zhao, Q., Zhang, T., and Schauer, J. J.: Increases in the formation of water soluble organic nitrogen during Asian dust storm episodes, Atmos. Res., 253, 105486, https://doi.org/10.1016/j.atmosres.2021.105486, 2021.
Lyu, Y., Qu, Z., Liu, L., Guo, L., Yang, Y., Hu, X., Xiong, Y., Zhang, G., Zhao, M., Liang, B., Dai, J., Zuo, X., Jia, Q., Zheng, H., Han, X., Zhao, S., and Liu, Q.: Characterization of dustfall in rural and urban sites during three dust storms in northern China, 2010, Aeolian Res., 28, 29–37, https://doi.org/10.1016/j.aeolia.2017.06.004, 2017.
Mace, K. A., Kubilay, N., and Duce, R. A.: Organic nitrogen in rain and aerosol in the eastern Mediterranean atmosphere: An association with atmospheric dust, J. Geophys. Res.-Atmos., 108, 2002JD002997, https://doi.org/10.1029/2002JD002997, 2003.
Maki, T., Hara, K., Iwata, A., Lee, K. C., Kawai, K., Kai, K., Kobayashi, F., Pointing, S. B., Archer, S., Hasegawa, H., and Iwasaka, Y.: Variations in airborne bacterial communities at high altitudes over the Noto Peninsula (Japan) in response to Asian dust events, Atmos. Chem. Phys., 17, 11877–11897, https://doi.org/10.5194/acp-17-11877-2017, 2017.
Maki, T., Bin, C., Kai, K., Kawai, K., Fujita, K., Ohara, K., Kobayashi, F., Davaanyam, E., Noda, J., Minamoto, Y., Shi, G., Hasegawa, H., and Iwasaka, Y.: Vertical distributions of airborne microorganisms over Asian dust source region of Taklimakan and Gobi Desert, Atmos. Environ., 214, 116848, https://doi.org/10.1016/j.atmosenv.2019.116848, 2019.
Matos, J. T. V., Duarte, R. M. B. O., and Duarte, A. C.: Challenges in the identification and characterization of free amino acids and proteinaceous compounds in atmospheric aerosols: A critical review, TRAC-Trend. Anal. Chem., 75, 97–107, https://doi.org/10.1016/j.trac.2015.08.004, 2016.
Matsumoto, K., Yamamoto, Y., Kobayashi, H., Kaneyasu, N., and Nakano, T.: Water-soluble organic nitrogen in the ambient aerosols and its contribution to the dry deposition of fixed nitrogen species in Japan, Atmos. Environ., 95, 334-343, https://doi.org/10.1016/j.atmosenv.2014.06.037, 2014.
Matsumoto, K., Yamamoto, Y., Nishizawa, K., Kaneyasu, N., Irino, T., and Yoshikawa-Inoue, H.: Origin of the water-soluble organic nitrogen in the maritime aerosol, Atmos. Environ., 167, 97–103, https://doi.org/10.1016/j.atmosenv.2017.07.050, 2017.
Matsumoto, K., Kim, S., and Hirai, A.: Origins of free and combined amino acids in the aerosols at an inland urban site in Japan, Atmos. Environ., 259, 118543, https://doi.org/10.1016/j.atmosenv.2021.118543, 2021.
Mccarthy, M. D., Lehman, J., and Kudela, R.: Compound-specific amino acid δ15N patterns in marine algae: Tracer potential for cyanobacterial vs. eukaryotic organic nitrogen sources in the ocean, Geochim. Cosmochim. Ac., 103, 104–120, https://doi.org/10.1016/j.gca.2012.10.037, 2013.
Menetrez, M. Y., Foarde, K. K., Dean, T. R., Betancourt, D. A., and Moore, S. A.: An evaluation of the protein mass of particulate matter, Atmos. Environ., 41, 8264–8274, https://doi.org/10.1016/j.atmosenv.2007.06.021, 2007.
Mochizuki, T., Kawamura, K., and Aoki, K.: Water-Soluble Organic Nitrogen in High Mountain Snow Samples from Central Japan, Aerosol Air Qual. Res., 16, 632–639, https://doi.org/10.4209/aaqr.2015.04.0256, 2016.
Nakamura, T., Ogawa, H., Maripi, D., and Uematsu, M.: Contribution of water soluble organic nitrogen to total nitrogen in marine aerosols over the East China Sea and western North Pacific, Atmos. Environ., 40, 7259–7264, https://doi.org/10.1016/j.atmosenv.2006.06.026, 2006.
Neff, J. C., Holland, E. A., Dentener, F. J., McDowell, W. H., and Russell, K. M.: The origin, composition and rates of organic nitrogen deposition: A missing piece of the nitrogen cycle?, Biogeochemistry, 57, 99–136, https://doi.org/10.1023/A:1015791622742, 2002.
Park, S.-U., Choe, A., and Park, M.-S.: Estimates of Asian dust deposition over the Asian region by using ADAM2 in 2007, Sci. Total Environ., 408, 2347–2356, https://doi.org/10.1016/j.scitotenv.2010.02.001, 2010.
Puspitasari, F., Maki, T., Shi, G., Bin, C., Kobayashi, F., Hasegawa, H., and Iwasaka, Y.: Phylogenetic analysis of bacterial species compositions in sand dunes and dust aerosol in an Asian dust source area, the Taklimakan Desert, Air Qual. Atmos. Hlth., 9, 631–644, https://doi.org/10.1007/s11869-015-0367-y, 2016.
Samy, S., Robinson, J., Rumsey, I. C., Walker, J. T., Hays, M. D., Robinson, J., Rumsey, I. C., and Hays, M. D.: Speciation and trends of organic nitrogen in southeastern U. S. fine particulate matter (PM2.5), J. Geophys. Res.-Atmos., 118, 1996–2006, https://doi.org/10.1029/2012JD017868, 2013.
Shao, Y. and Dong, C. H.: A review on East Asian dust storm climate, modelling and monitoring, Global Planet. Change, 52, 1–22, https://doi.org/10.1016/j.gloplacha.2006.02.011, 2006.
Shi, J., Gao, H., Qi, J., Zhang, J., and Yao, X.: Sources, compositions, and distributions of water-soluble organic nitrogen in aerosols over the China Sea, J. Geophys. Res.-Atmos., 115, 2009JD013238, https://doi.org/10.1029/2009JD013238, 2010.
Song, T., Wang, S., Zhang, Y., Song, J., Liu, F., Fu, P., Shiraiwa, M., Xie, Z., Yue, D., Zhong, L., Zheng, J., and Lai, S.: Proteins and Amino Acids in Fine Particulate Matter in Rural Guangzhou, Southern China: Seasonal Cycles, Sources, and Atmospheric Processes, Environ. Sci. Technol., 51, 6773–6781, https://doi.org/10.1021/acs.est.7b00987, 2017.
Song, W., Wang, Y.-L., Yang, W., Sun, X.-C., Tong, Y.-D., Wang, X.-M., Liu, C.-Q., Bai, Z.-P., and Liu, X.-Y.: Isotopic evaluation on relative contributions of major NOx sources to nitrate of PM2.5 in Beijing, Environ. Pollut., 248, 183–190, https://doi.org/10.1016/j.envpol.2019.01.081, 2019.
Song, W., Liu, X.-Y., Hu, C.-C., Chen, G.-Y., Liu, X.-J., Walters, W. W., Michalski, G., and Liu, C.-Q.: Important contributions of non-fossil fuel nitrogen oxides emissions, Nat. Commun., 12, 243, https://doi.org/10.1038/s41467-020-20356-0, 2021.
Spokes, L. J., Yeatman, S. G., Cornell, S. E., and Jickells, T. D.: Nitrogen deposition to the eastern Atlantic Ocean. The importance of south-easterly flow, Tellus B, 52, 37–49, https://doi.org/10.1034/j.1600-0889.2000.00062.x, 2000.
Staton, S. J. R., Woodward, A., Castillo, J. A., Swing, K., and Hayes, M. A.: Ground level environmental protein concentrations in various ecuadorian environments: Potential uses of aerosolized protein for ecological research, Ecol. Indic., 48, 389–395, https://doi.org/10.1016/j.ecolind.2014.08.036, 2015.
Stock, B. C. and Semmens, B. X.: MixSIAR GUI User Manual, Version 3.1, https://doi.org/10.5281/zenodo.47719, 2016.
Tan, S.-C., Shi, G.-Y., Shi, J.-H., Gao, H.-W., and Yao, X.: Correlation of Asian dust with chlorophyll and primary productivity in the coastal seas of China during the period from 1998 to 2008, J. Geophys. Res.-Biogeo., 116, G02029, https://doi.org/10.1029/2010JG001456, 2011.
Tang, K., Huang, Z., Huang, J., Maki, T., Zhang, S., Shimizu, A., Ma, X., Shi, J., Bi, J., Zhou, T., Wang, G., and Zhang, L.: Characterization of atmospheric bioaerosols along the transport pathway of Asian dust during the Dust-Bioaerosol 2016 Campaign, Atmos. Chem. Phys., 18, 7131–7148, https://doi.org/10.5194/acp-18-7131-2018, 2018.
Tegen, I. and Schepanski, K.: The global distribution of mineral dust, IOP C. Ser. Earth Env., 7, 012001, https://doi.org/10.1088/1755-1307/7/1/012001, 2009.
Tian, Y., Pan, X., Wang, Z., Wang, D., Ge, B., Liu, X., Zhang, Y., Liu, H., Lei, S., Yang, T., Fu, P., Sun, Y., and Wang, Z.: Transport Patterns, Size Distributions, and Depolarization Characteristics of Dust Particles in East Asia in Spring 2018, J. Geophys. Res.-Atmos., 125, e2019JD031752, https://doi.org/10.1029/2019JD031752, 2020.
Tong, D. Q., Gill, T. E., Sprigg, W. A., Van Pelt, R. S., Baklanov, A. A., Barker, B. M., Bell, J. E., Castillo, J., Gassó, S., Gaston, C. J., Griffin, D. W., Huneeus, N., Kahn, R. A., Kuciauskas, A. P., Ladino, L. A., Li, J., Mayol-Bracero, O. L., McCotter, O. Z., Méndez-Lázaro, P. A., Mudu, P., Nickovic, S., Oyarzun, D., Prospero, J., Raga, G. B., Raysoni, A. U., Ren, L., Sarafoglou, N., Sealy, A., Sun, Z., and Vimic, A. V.: Health and Safety Effects of Airborne Soil Dust in the Americas and Beyond, Rev. Geophys., 61, e2021RG000763, https://doi.org/10.1029/2021RG000763, 2023.
Triesch, N., van Pinxteren, M., Engel, A., and Herrmann, H.: Concerted measurements of free amino acids at the Cabo Verde islands: high enrichments in submicron sea spray aerosol particles and cloud droplets, Atmos. Chem. Phys., 21, 163–181, https://doi.org/10.5194/acp-21-163-2021, 2021.
Tsagkaraki, M., Theodosi, C., Grivas, G., Vargiakaki, E., Sciare, J., Savvides, C., and Mihalopoulos, N.: Spatiotemporal variability and sources of aerosol water-soluble organic nitrogen (WSON), in the Eastern Mediterranean, Atmos. Environ., 246, 118144, https://doi.org/10.1016/j.atmosenv.2020.118144, 2021.
Violaki, K. and Mihalopoulos, N.: Water-soluble organic nitrogen (WSON) in size-segregated atmospheric particles over the Eastern Mediterranean, Atmos. Environ., 44, 4339–4345, https://doi.org/10.1016/j.atmosenv.2010.07.056, 2010.
Wang, S., Song, T., Shiraiwa, M., Song, J., Ren, H., Ren, L., Wei, L., Sun, Y., Zhang, Y., Fu, P., and Lai, S.: Occurrence of Aerosol Proteinaceous Matter in Urban Beijing: An Investigation on Composition, Sources, and Atmospheric Processes During the “APEC Blue” Period, Environ. Sci. Technol., 53, 7380–7390, https://doi.org/10.1021/acs.est.9b00726, 2019.
Weather and climate: https://www.weatherandclimate.info/, last access: 15 July 2025.
Wedyan, M. A. and Preston, M. R.: The coupling of surface seawater organic nitrogen and the marine aerosol as inferred from enantiomer-specific amino acid analysis, Atmos. Environ., 42, 8698–8705, https://doi.org/10.1016/j.atmosenv.2008.04.038, 2008.
Wu, C., Wang, G., Cao, C., Li, J., Li, J., Wu, F., Huang, R., Cao, J., Han, Y., Ge, S., Xie, Y., Xue, G., and Wang, X.: Chemical characteristics of airborne particles in Xi'an, inland China during dust storm episodes: Implications for heterogeneous formation of ammonium nitrate and enhancement of N-deposition, Environ. Pollut., 244, 877–884, https://doi.org/10.1016/j.envpol.2018.10.019, 2019.
Xie, W., Fan, C., Qi, J., Li, H., Dong, L., Hu, W., Kojima, T., and Zhang, D.: Decrease of bioaerosols in westerlies from Chinese coast to the northwestern Pacific: Case data comparisons, Sci. Total Environ., 864, 161040, https://doi.org/10.1016/j.scitotenv.2022.161040, 2023.
Xie, W., Kojima, T., Matsusaki, H., and Zhang, D.: Aerosol soluble proteins in Asian dust in southwestern Japan, Sci. Total Environ., 945, 174086, https://doi.org/10.1016/j.scitotenv.2024.174086, 2024.
Xu, Y., Xiao, H. Y., Wu, D. S., and Long, C. J.: Abiotic and Biological Degradation of Atmospheric Proteinaceous Matter Can Contribute Significantly to Dissolved Amino Acids in Wet Deposition, Environ. Sci. Technol., 54, 6551–6561, https://doi.org/10.1021/acs.est.0c00421, 2020.
Yamaguchi, Y. T. and McCarthy, M. D.: Sources and transformation of dissolved and particulate organic nitrogen in the North Pacific Subtropical Gyre indicated by compound-specific δ15N analysis of amino acids, Geochim. Cosmochim. Ac., 220, 329–347, https://doi.org/10.1016/j.gca.2017.07.036, 2018.
Yang, Y., Bendle, J. A., Pancost, R. D., Yan, Y., Ruan, X., Warren, B., Lü, X., Li, X., Yao, Y., Huang, X., Yang, H., and Xie, S.: Leaf Wax and Sr-Nd Isotope Evidence for High-Latitude Dust Input to the Central South China Sea and Its Implication for Fertilization, Geophys. Res. Lett., 48, e2020GL091853, https://doi.org/10.1029/2020GL091853, 2021.
Yang, Y. Q., Hou, Q., Zhou, C. H., Liu, H. L., Wang, Y. Q., and Niu, T.: Sand/dust storm processes in Northeast Asia and associated large-scale circulations, Atmos. Chem. Phys., 8, 25–33, https://doi.org/10.5194/acp-8-25-2008, 2008.
Zamora, L. M., Prospero, J. M., and Hansell, D. A.: Organic nitrogen in aerosols and precipitation at Barbados and Miami: Implications regarding sources, transport and deposition to the western subtropical North Atlantic, J. Geophys. Res., 116, D20309, https://doi.org/10.1029/2011JD015660, 2011.
Zhang, J., Zhang, G. S., Bi, Y. F., and Liu, S. M.: Nitrogen species in rainwater and aerosols of the Yellow and East China seas: Effects of the East Asian monsoon and anthropogenic emissions and relevance for the NW Pacific Ocean, Global Biogeochem. Cy., 25, GB3020, https://doi.org/10.1029/2010GB003896, 2011.
Zhang, Q. and Anastasio, C.: Free and combined amino compounds in atmospheric fine particles (PM2.5) and fog waters from Northern California, Atmos. Environ., 37, 2247–2258, https://doi.org/10.1016/S1352-2310(03)00127-4, 2003.
Zhang, Q., Anastasio, C., and Jimenez-Cruz, M.: Water-soluble organic nitrogen in atmospheric fine particles (PM2.5) from northern California, J. Geophys. Res., 107, AAC 3-1–AAC 3-9, https://doi.org/10.1029/2001JD000870, 2002.
Zhang, Z., Guan, H., Xiao, H., Liang, Y., Zheng, N., Luo, L., Liu, C., Fang, X., and Xiao, H.: Oxidation and sources of atmospheric NOx during winter in Beijing based on δ18O-δ15N space of particulate nitrate, Environ. Pollut., 276, 116708, https://doi.org/10.1016/j.envpol.2021.116708, 2021.
Zhou, C., Gui, H., Hu, J., Ke, H., Wang, Y., and Zhang, X.: Detection of New Dust Sources in Central/East Asia and Their Impact on Simulations of a Severe Sand and Dust Storm, J. Geophys. Res.-Atmos., 124, 10232–10247, https://doi.org/10.1029/2019JD030753, 2019.
Zhu, R., Xiao, H.-Y., Zhang, Z., and Lai, Y.: Compound-specific δ15N composition of free amino acids in moss as indicators of atmospheric nitrogen sources, Sci. Rep.-UK, 8, 14347, https://doi.org/10.1038/s41598-018-32531-x, 2018.
Zhu, R., Xiao, H.-Y., Lv, Z., Xiao, H., Zhang, Z., Zheng, N., and Xiao, H.: Nitrogen isotopic composition of free Gly in aerosols at a forest site, Atmos. Environ., 222, 117179, https://doi.org/10.1016/j.atmosenv.2019.117179, 2020a.
Zhu, R., Xiao, H., Zhu, Y., Wen, Z., Fang, X., and Pan, Y.: Sources and Transformation Processes of Proteinaceous Matter and Free Amino Acids in PM2.5, J. Geophys. Res.-Atmos., 125, e2020JD032375, https://doi.org/10.1029/2020JD032375, 2020b.
Zhu, R.-G., Xiao, H.-Y., Luo, L., Xiao, H., Wen, Z., Zhu, Y., Fang, X., Pan, Y., and Chen, Z.: Measurement report: Hydrolyzed amino acids in fine and coarse atmospheric aerosol in Nanchang, China: concentrations, compositions, sources and possible bacterial degradation state, Atmos. Chem. Phys., 21, 2585–2600, https://doi.org/10.5194/acp-21-2585-2021, 2021.
Zhu, R.-G., Xiao, H.-Y., Yin, M., Xiao, H., Zhou, Z., Wei, G., Liu, C., and Hu, C.: Kinetic nitrogen isotope effects of 18 amino acids degradation during burning processes, Sci. Rep.-UK, 14, 14559, https://doi.org/10.1038/s41598-024-65544-w, 2024.