the Creative Commons Attribution 4.0 License.
the Creative Commons Attribution 4.0 License.
 | 14 Jul 2025
Modeling CMAQ dry deposition treatment over the western Pacific: a distinct characteristic of mineral dust and anthropogenic aerosols
Steven Soon-Kai Kong
Joshua S. Fu
Neng-Huei Lin
Wei-Syun Huang
Dry deposition plays a vital role in the aerosol removal process from the atmosphere. However, the chemical transport model (CTM) is sensitive to the dry deposition parameterization but remains uncertain due to limited measurements of particle deposition. By utilizing the Community Multiscale Air Quality (CMAQ) version 5.4 with the refined dust emission treatment, the East Asian dust (EAD) simulation during January 2023 and spring 2021 was constructed to evaluate the performance of dry deposition parameterizations, namely S22, E20, and P22. The results showed that the dry deposition parameterization could significantly impact the CMAQ dust concentration in the air. By implementing the E20 dry deposition scheme, the CMAQ simulation performance of the surface PM10 has been considerably improved, with a normalized mean bias (NMB) of −41.9 %, as compared to that from S22 (−47.01 %) and P22 (−53.90 %). The modeled PM10 pattern by E20 at the upper level (700 hPa) was mostly consistent with the observed PM10 at the Lulin Atmospheric Background Station (LABS; 23.47° N, 120.87° E; 2862 m a.s.l.), which is a typical background site in the western Pacific, particularly in capturing the peak value. The correlations (R) at high altitudes were well represented for E20 by 0.55, as compared to S22 (0.54) and P22 (0.46). Moreover, E20 improved the simulated PM10 concentrations and aerosol optical depth (AOD) values over the Asian continent during the multiple dust episodes in spring 2021, by an NMB of −25.43 % and −26.19 %, respectively. The noticeable reduction of the coarse-mode particle deposition velocity (Vd) was responsible for reducing the PM10 simulation underestimation. On 22–31 January 2023, the in situ measurement of the upper level observed the possibility of natural dust and anthropogenic aerosol. This is consistent with the CMAQ, which shows that both aerosol types displayed a clear “long dust–black carbon belt” along 15° N. It is revealed that an increase in surface resistivity (Rb) leads to a significant increase in dust mass concentration but a minor increase in black carbon (BC). We propose implementing the E20 dry deposition approach, particularly in PM10 simulation, to narrow the uncertainty of the CMAQ dust emission treatment.
- Article
(16248 KB) - Full-text XML
-
Supplement
(1261 KB) - BibTeX
- EndNote


The chemical transport model (CTM) is a powerful tool for comprehending air pollution, encompassing emission, transport, radiative impact, and removal mechanisms at various grid scales. Among these, particle dry deposition is a crucial aerosol removal process and an important sink for particles in the model. The derivation of dry deposition is based on the resistance framework and electrical analogue, but its implementation can vary across models (Wesley, 1989; Giardina and Buffa, 2018; Gaydos et al., 2007; Khan and Perlinger, 2017; Shu et al., 2017). A key challenge in dry deposition simulation is the scarcity of measurement data for model verification, underscoring the necessity for further research to enhance the accuracy of air quality modeling.
An immense range of dry deposition parameterization has been implemented in the model. The deposition mechanism by Slinn (1982) includes processes such as turbulent transfer, Brownian diffusion, impaction, interception, gravitational settling, and particle rebound, where the particle grows under humid conditions. Zhang et al. (2001) suggested that the dry deposition scheme is sensitive to land-use category and several parameters. For instance, due to particle growth, the deposition velocity (Vd) over the ocean is much higher than over other land surfaces, as the Vd increases rapidly with increasing particle size. Some CTMs that applied the Zhang et al. (2001) parameterization still underestimated the global PM2.5 concentration. The latest dry deposition scheme revision by Emerson et al. (2020), based on the flux measurement of grassland and pine forest, has reduced the uncertainty, marking a significant step forward in our quest for more accurate air quality modeling.
An updated deposition scheme that reduces the dependence of the deposition velocity on the aerosol mode width has been proposed (Shu et al., 2022). Indeed, the approach suggested that vegetation dependence increased the Vd for submicrons and decreased it for large particles by 37 % and −66 %, respectively. It also reduced the functional biases by 56 %–97 % for vegetated land-use types and equivalence performance over the water. Moreover, adding the second inertial impaction term for microscale obstacles such as leaf hairs, microscale ridges, and needle leaf edge effects managed to increase the mass dry deposition of the accumulation-mode aerosols in the model (Pleim et al., 2022). These modifications reduced the average PM2.5 in the atmosphere during July 2018 over the contiguous United States.
With a plethora of deposition approaches in use, it becomes paramount to comprehend their impact on model performance in predicting aerosol behavior. The surface fine particle concentrations can vary from 5 %–15 %, and the particle dry deposition has more than 200 % discrepancy due to the different dry deposition schemes (Saylor et al., 2019). A comprehensive evaluation of five different parameterizations has been conducted, with the simplest and most effective deposition mechanism suggested for the CTM (Khan and Perlinger, 2017). However, the model's reliance on meteorological factors such as frictional velocity, relative humidity, rainfall, or wind speed, which can significantly influence the model's accuracy, remains a challenge (Kong et al., 2021).
Besides the model bias on PM2.5, the simulation of PM10 has been underestimated due to the uncertainty of the deposition mechanism, particularly over the western Pacific (Kong et al., 2021). The Vd is overestimated for coarse particles, where the dry deposition velocity is too high for coarse particles when the frictional velocity is large, which is why the surface PM10 concentration is underestimated (Ryu and Min, 2022). The model performance of PM10 simulation, which is widely influenced by the dust treatment embedded within the CMAQ, has been revised (Dong et al., 2016; Liu et al., 2021; Kong et al., 2021, 2024) and is found to effectively simulate the PM10 over the western Pacific region, such as Taiwan. However, the issue regarding the deposition algorithm's impact on the model performance at the corresponding region needs to be discussed. The present research intends to evaluate the CMAQ model performance due to the different deposition schemes on aerosols in the Taiwan region.
The model performance in Taiwan is paramount in our study, as the area is equipped with a substantial number of well-maintained surface observation sites, providing comprehensive coverage. The LABS station in the high-altitude subtropical western North Pacific region serves as the sole background station for monitoring transboundary pollutants. This station is crucial in our research, as it provides unique data on the long-range transport of pollutants, further underscoring the relevance of our study.
The transboundary pollutant mechanisms have been widely discussed through LABS measurements, in cooperation with the backward trajectory, reanalysis dataset, and modeling approach. Previous research reveals that LABS pollutants could be associated with severe fire emissions from northern peninsular Southeast Asia (Huang et al., 2020; Ooi et al., 2021) and Indonesia (Ravindra Babu et al., 2023). Moreover, the intense wind speed in northwest China could transport mineral dust through the surface and high-altitude layers detected at LABS (Kong et al., 2021, 2022). Additionally, the transport process of East Asian haze due to the cold surge from the Asian industrial region of continental Asia towards Taiwan has been widely discussed (Chuang et al., 2020). Instead of pure aerosols, the coexistence of dust and biomass burning over Taiwan, a condition discovered in previous research, has significant implications for the regional climate (Dong et al., 2018, 2019). However, the high-altitude synoptic pattern associated with the coexistence between natural dust and anthropogenic pollutants remains unknown due to a lack of observations at the upper layers.
This study used the chemical transport model to investigate the long-range transport of East Asian dust (EAD) that occurred on 22–31 January 2023 and 12 March–20 April 2021. Due to the limitations of the dust model, the CMAQ version 5.4 (CMAQ v5.4), embedded with three types of dry deposition schemes, was implemented to justify the effectiveness of improving our latest refined dust model (Kong et al., 2024). The dry deposition scheme proposed by Shu et al. (2022) has reduced certain model biases compared to the base scheme. However, the revised scheme's response to natural phenomena such as windblown dust has not been tested. Alternatively, the number and concentrations of the large-sized particles have been decreased over land and increased over the ocean area globally by the adjusted collective coefficient proposed by Emerson et al. (2020). Pleim et al. (2022) have included the consideration of the white-cap effect, which depends on wind speed and sea surface temperature, into the dry deposition scheme. Hence, the response of the CMAQ dust model under the newly developed dry deposition schemes is worth investigating in reducing the model uncertainty.
LABS detected the recent transboundary episode in January 2023 as a mixing aerosol type (see Sect. 3.1), which has not been widely discussed, and the multiple dust storm episodes mentioned by Kong et al. (2024) provide an opportunity to model the EAD over the downwind region. Recognizing the significant transboundary events detected through Taiwan's observations, the improvement of the CMAQ dust model by the dry deposition schemes, and its application in characterizing the transport mechanism can be vital. The paper is organized as follows. The model setup and ancillary datasets are discussed in Sect. 2. The results and discussion are presented in Sect. 3, followed by the conclusions in Sect. 4.
2.1 Dust emission treatment
Before delving into the details, it is important to understand the process of dust transport. Dust is primarily transported by wind through a process known as sandblasting (Kok et al., 2012). For dust to be uplifted, the horizontal wind speed must exceed a certain threshold frictional velocity (), which is estimated by the model as follows:
here is the ideal threshold friction velocity, while fm and fr are the correction factors for soil moisture and surface roughness, respectively.
Through a collaborative effort, the wind speed, soil texture, soil moisture, and surface roughness length derived from field and laboratory studies have been integrated into the windblown dust treatment, which is now a part of the Community Multiscale Air Quality (CMAQ) modeling system (Foroutan et al., 2017). This model, developed and evaluated over the continental United States, has also been extended to the East Asian region (Dong et al., 2016; Liu et al., 2021; Kong et al., 2021, 2024). Kong et al. (2024) have proposed further improvements, including the integration of the revised soil moisture fraction, dust emission speciation profile, and bulk soil density, to enhance the representation of the Asian dust simulation. This ongoing collaboration is crucial for the continuous improvement of our understanding and management of dust emissions.
2.2 Particle dry deposition schemes
Particle dry deposition is a complex process related to the deposition velocity, particle size, source and composition, land-use surface, and meteorological conditions. Generally, the flux of the particle mass through the surface boundary layer is estimated as
where F is the deposition flux, C is the particle concentration at the surface layer, and Vd is the deposition velocity.
The difference in the particle concentration and deposition predictions among the various atmospheric chemistry models was probably due to the particle dry deposition algorithm. The algorithm describing particle deposition velocity as a function of particle size in almost all current air quality model systems is descended from Slinn (1982). Particle deposition over vegetated canopies is formulated as
where Vg is the gravitational settling velocity, Ra is the aerodynamic resistivity, and Rb is the surface resistivity, also known as quasi-laminar sub-layer resistivity in Surface Tiled Aerosol and Gaseous Exchange (STAGE). The Vg is calculated according to Stokes's law as
where ρp is the density of the particle, Dp is the diameter of the particle, g is gravitational acceleration, Cc is the Cunningham correction factor for small particles, and η is the dynamic viscosity of air.
The CMAQ is embedded with the model-3 dry deposition (M3Dry) calculation that implements the scheme of Pleim and Ran (2011), which is based on Slinn (1982). As noted by Pleim and Ran (2011), chemical surface flux modeling has become an essential process in the air quality model. For instance, ambient concentration levels are linked to the deposition of SOx and NOx. Moreover, STAGE deposition has been implemented within the CMAQ v5.3, where estimated fluxes from sub-grid-cell fractional land-use values are aggregated to the model grid cell and unify the bidirectional and unidirectional deposition schemes using the resistance framework (Massad et al., 2010; Nemitz et al., 2001). The updated STAGE version in CMAQ v5.4 could aggregate the grid-scale values that match the grid-scale values from most kinds of land surface models of Weather Research and Forecasting (WRF) (Hogrefe et al., 2023). Since the present study is primarily focused on the impact of the dry deposition scheme on the CMAQ dust modeling, the simulations with the STAGE module are the mandatory concern (Table 1).
Table 1Detailed mechanism expression relating the three dry deposition schemes.
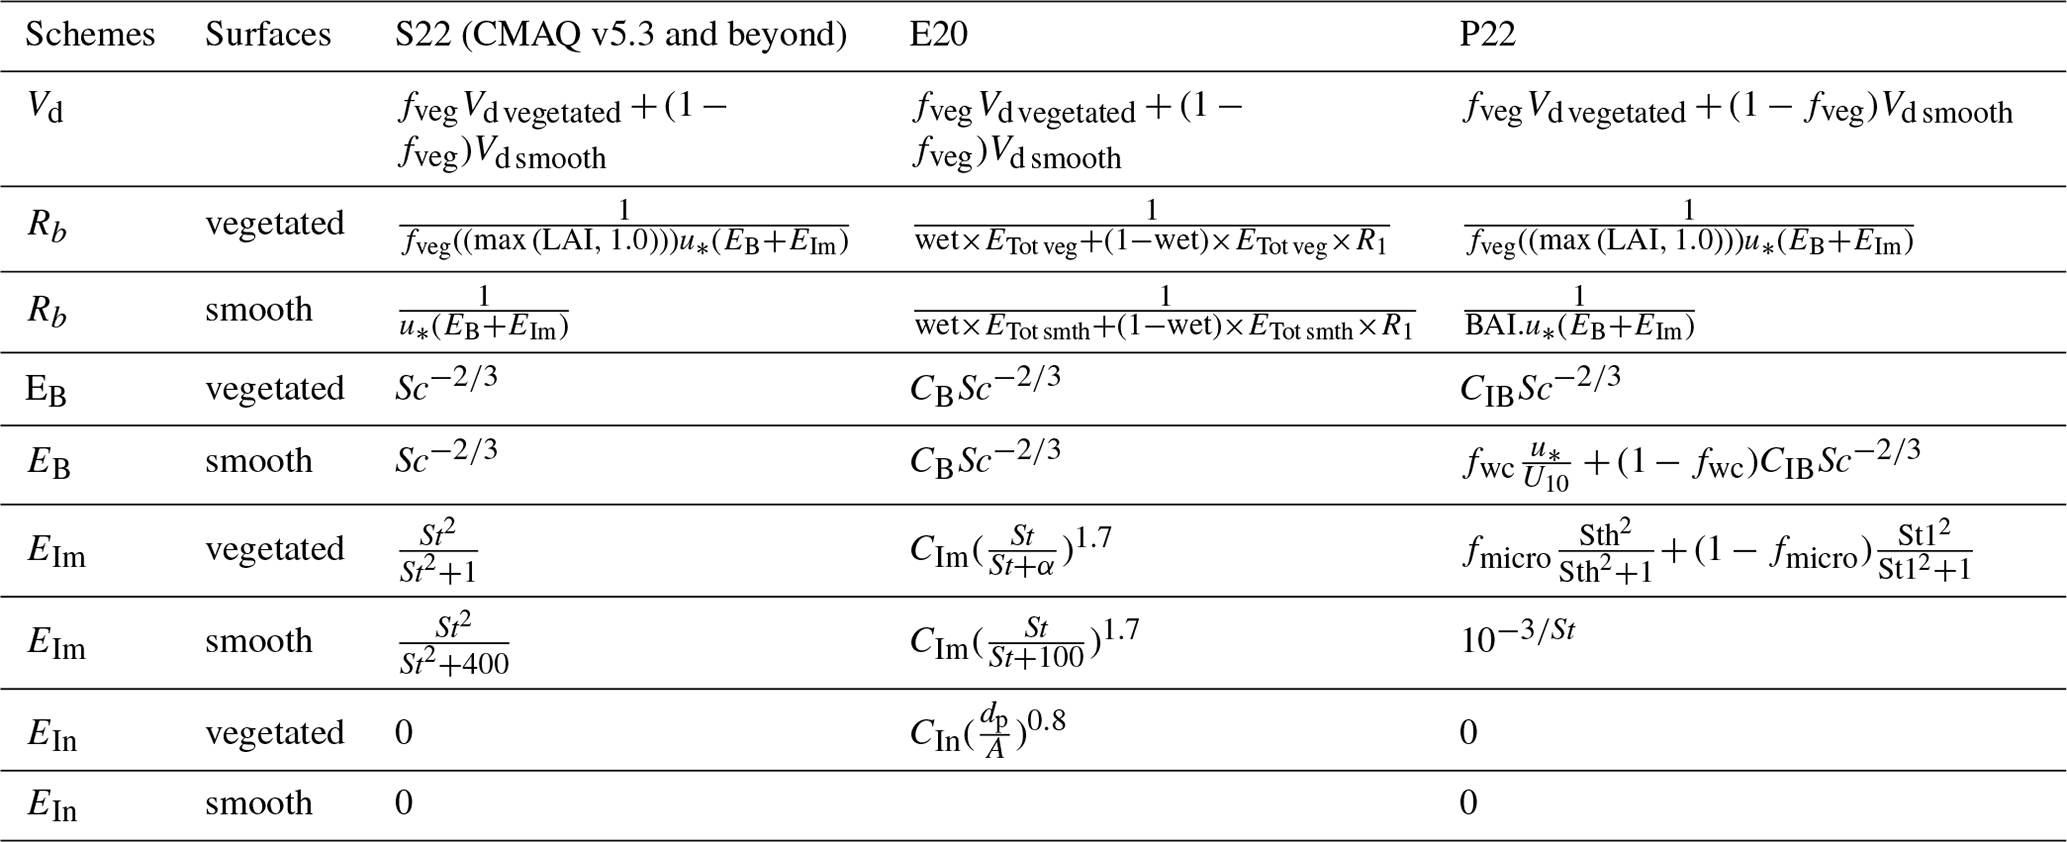
Vd vegetated: deposition velocity over the vegetative surface. . Vd smooth: deposition velocity over the smooth surface. . fveg: grid-scale vegetation coverage fraction. EB: Brownian diffusion efficiency. EIm: impaction efficiency. EIn: interception efficiency. Sc: Schmidt number. St: Stokes number. Wet: wet surface. ETot veg= veg_ustar × (). ustg × (EB+EIm). R1: bounce correction term by Slinn (1982). CB: Brownian collection coefficient: 0.2. CIm: impaction collection coefficient: 0.4. CIn: interception collection coefficient: 2.5. α: empirical constant. LAI: leaf area index. BAI: building area index. CIB: 1.0/3.0. fwc: whitecap surface fraction. fmicro: total impaction fraction from the microscale features. u∗ and U10: frictional velocity and wind speed at 10 m (m s−1). St1 and Sth: obstacle characteristic dimensions for the leaf hairs and microscale roughness on leaves.
2.3 The CMAQ model design
This study applied WRF v4.0 for the meteorological field parameters and CMAQ v5.4 to simulate the transboundary East Asian dust episodes on 22–31 January 2023 and the multiple dust storm episodes during 12 March–20 April 2021. The modeling domain was set up to cover the Taklamakan and Gobi Desert, with a resolution of 45 km and nested towards Taiwan at a resolution of 15 km (d02) and 5 km (d03) (Fig. 1, Table 2). Also, as Taiwan is influenced by biomass burning, the domain covers up to peninsular Southeast Asia (PSEA), which is planned to be carried out in the future (Ooi et al., 2021). The model consisted of 40 vertical layers, with eight layers below ∼ 1 km altitude, 13 layers below ∼ 3 km altitude, and 27 layers covering the upper layer to ∼ 21 km. The model's initial and lateral boundary conditions were constructed using the National Centers for Environmental Prediction (NCEP) Final Analyses (FNL) reanalysis dataset on a 0.5° × 0.5° grid. The data assimilation was conducted by grid nudging in all the domains. The CB06 gas-phase chemical mechanism and the AERO7 aerosol module were implemented in the CMAQ for the present study.
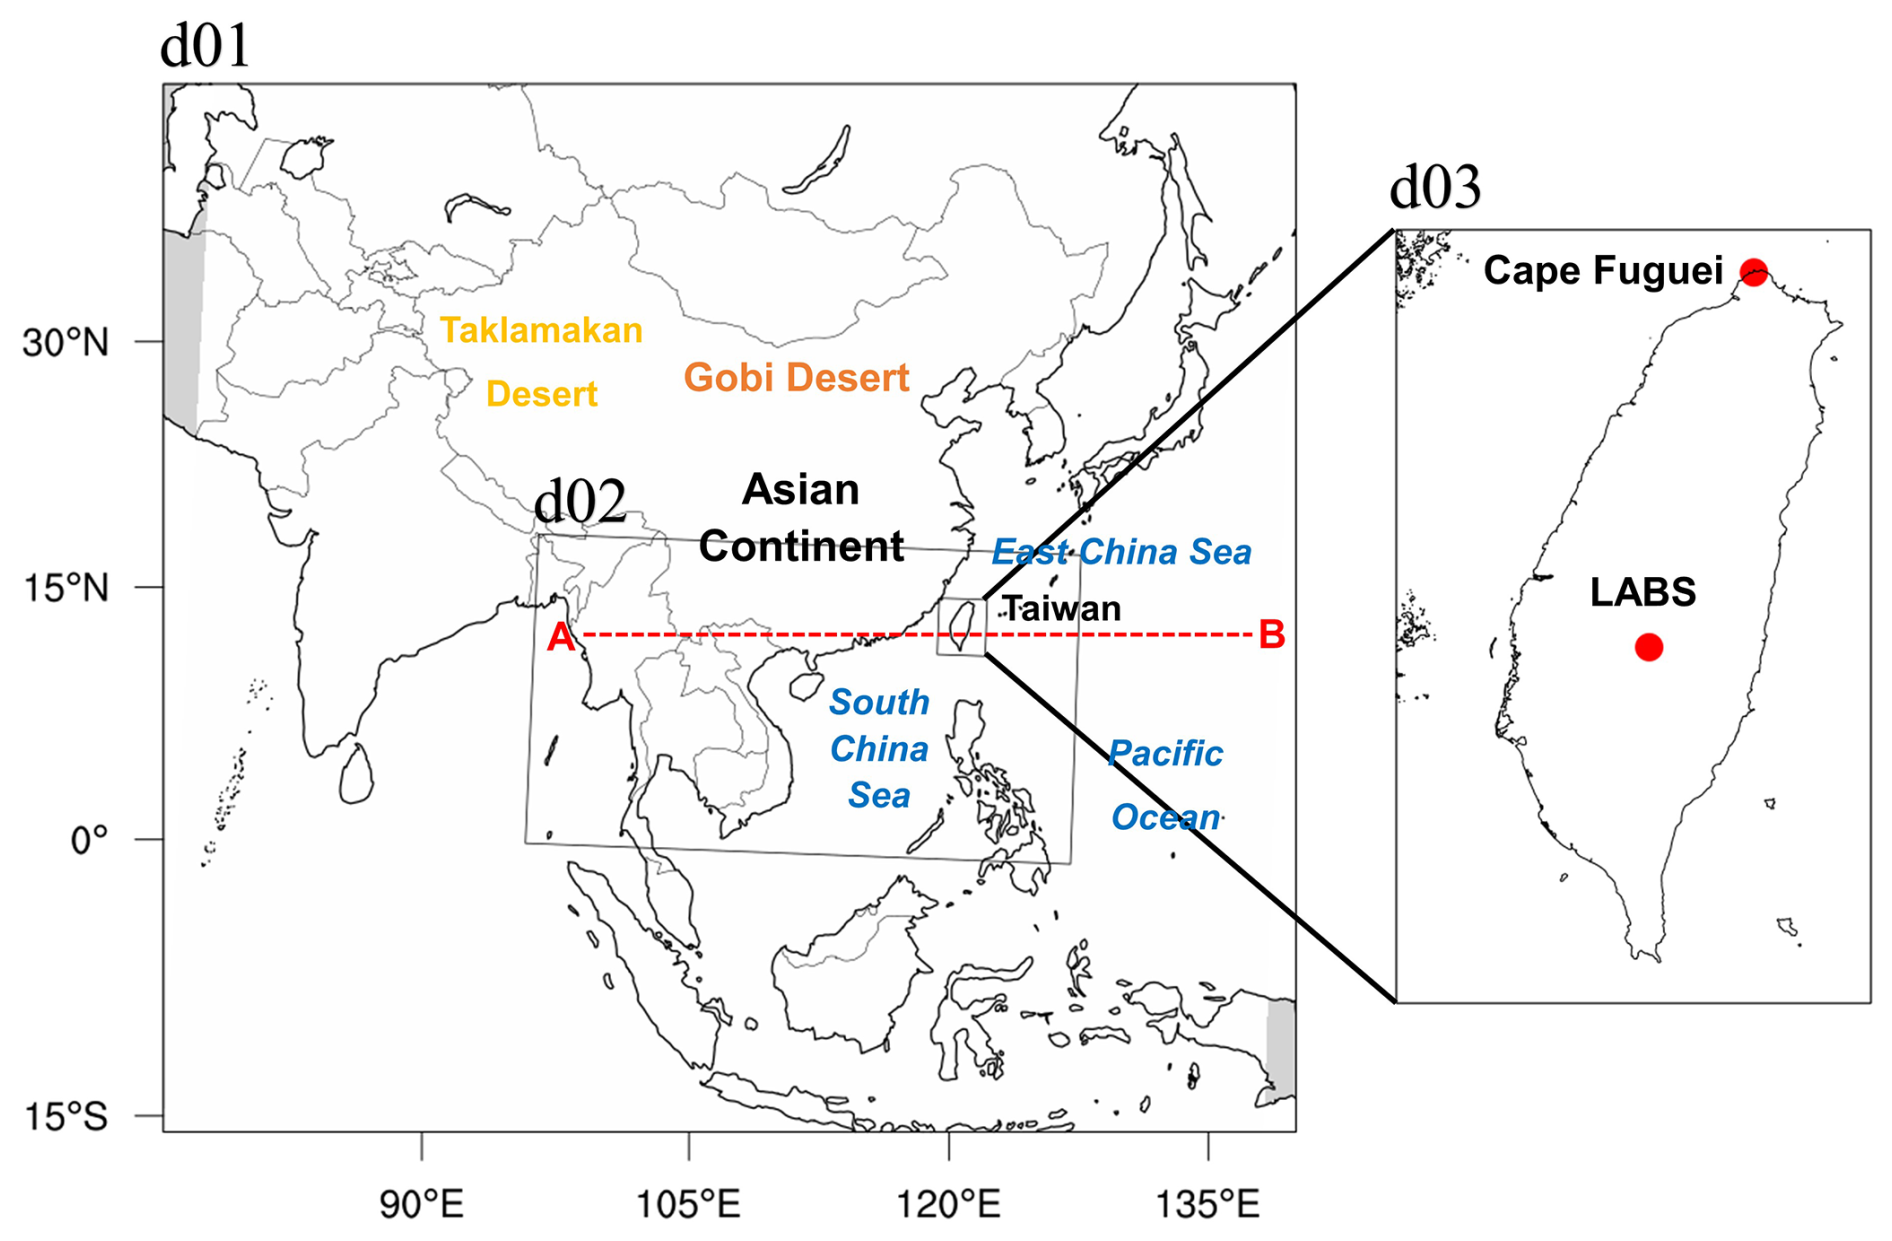
Figure 1Modeling domain configuration in East Asia. Ground-based air quality stations in Taiwan at Cape Fuguei and Lulin Atmospheric Background Station (LABS) are shown in the zoomed-in panel. The dashed red lines (A → B) represent the transects that the aerosol plumes traveled along in this study and that are discussed in Sect. 3.4.
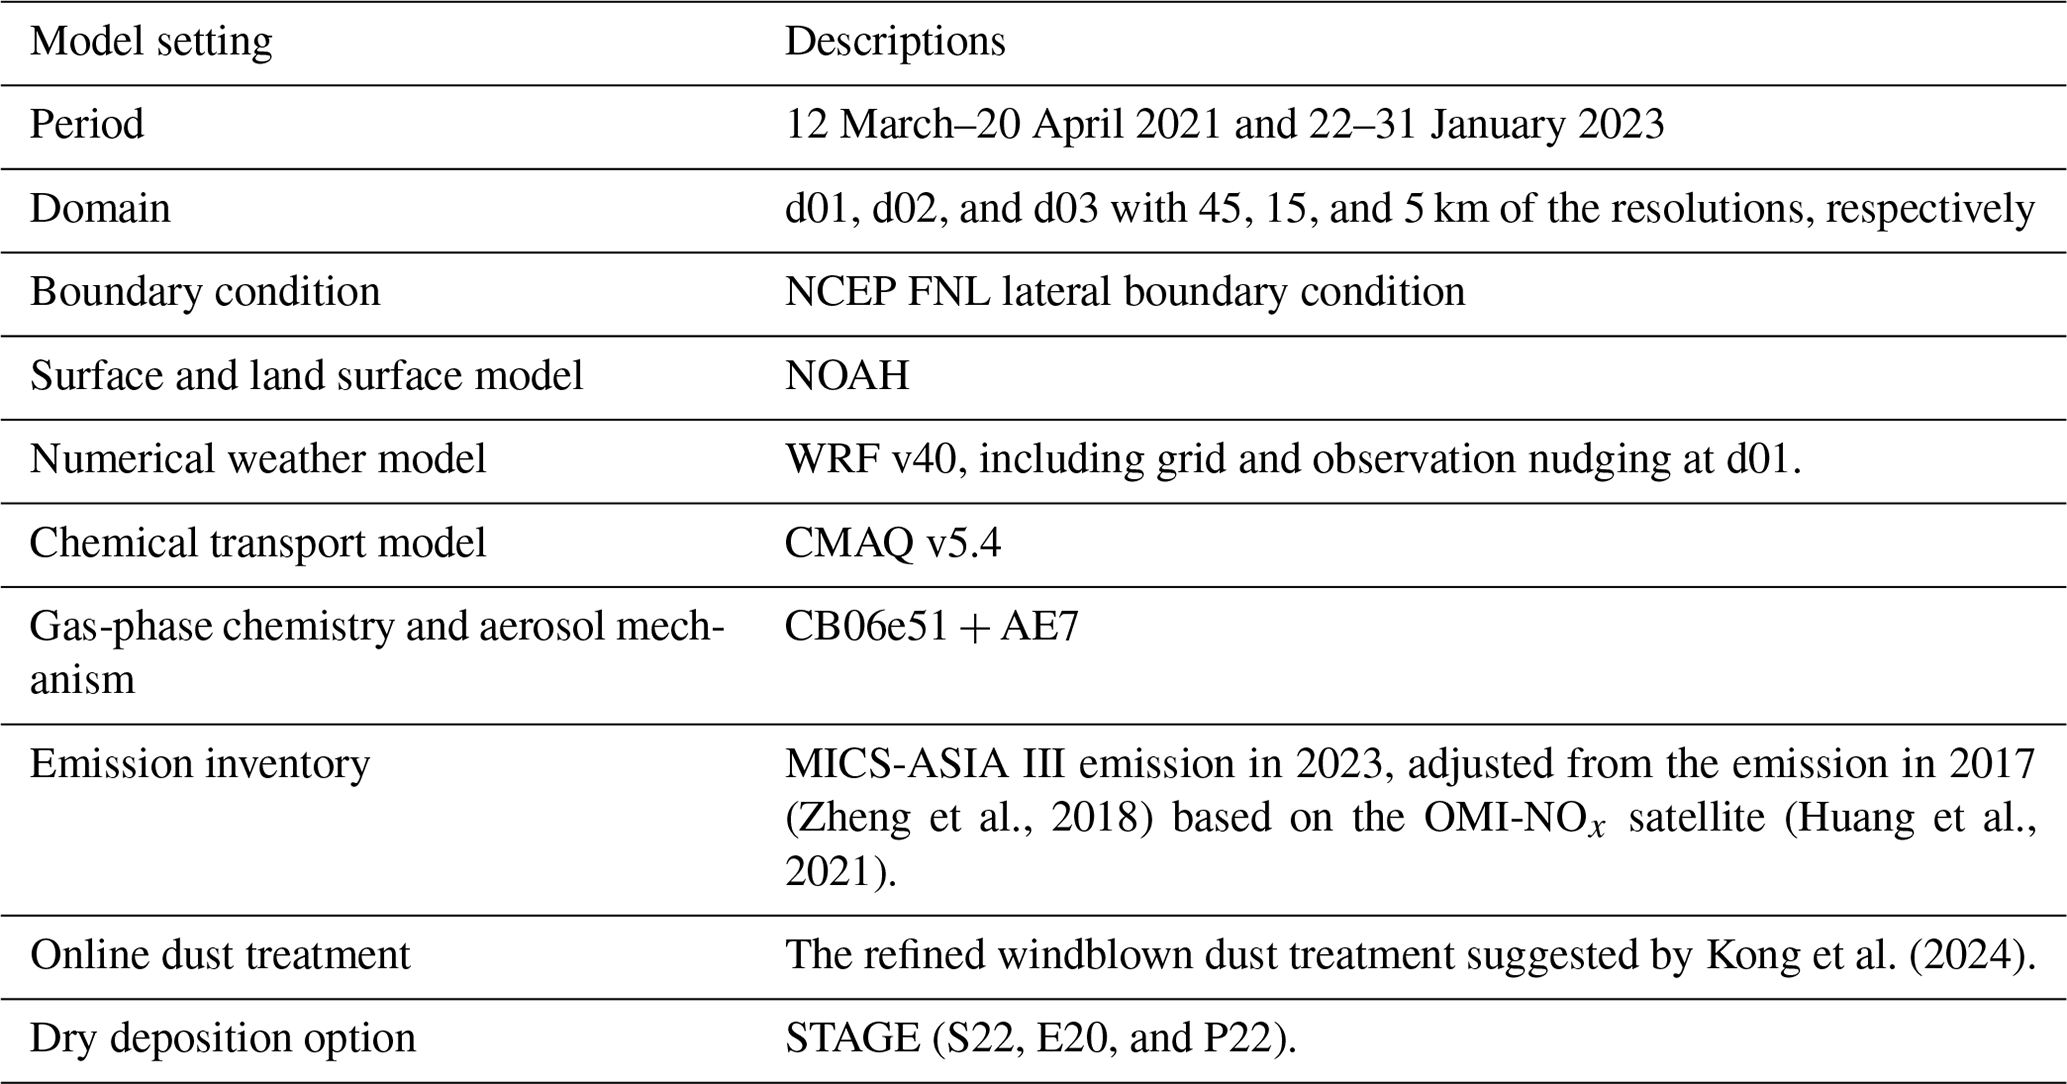
The anthropogenic emission inventories in East Asia, crucial for our research, were obtained from the Model Inter-Comparison Study for Asia (MICS-Asia) phase III emission inventory (Li et al., 2017). The emissions of SO2, NOx, NMVOC, NH3, CO, PM10, PM2.5, BC, OC, and CO2 have been meticulously modified, taking into account the relative changes in China's anthropogenic emissions between 2010 and 2017 (Zheng et al., 2018). Additionally, the modified emission of NO2 was adjusted further by the satellite imagery OMI-NO2 in January 2023 (Huang et al., 2021). Biogenic emissions for Taiwan were prepared by the Biogenic Emission Inventory System version 3.09 (BEIS3, Vukovich and Pierce, 2002) and, for regions outside Taiwan, by the Model of Emissions of Gases and Aerosols from Nature (MEGAN) version 2.1 (Guenther et al., 2012). The Taiwan Emission Database System version 10 (Taiwan Environmental Protection Agency, 2017) was used for domain 3 (d03). To ensure the precision of the multiple dry deposition parameterizations, the present research conducted four simulation scenarios, namely CMAQ_off_S22, CMAQ_dust_S22, CMAQ_dust_E20, and CMAQ_dust_P22. The CMAQ_off_S22 scenario did not include the inline dust calculation (Table 3). Meanwhile, the latest refined integrated dust treatment was implemented in the CMAQ_dust_S22 scenario (Kong et al., 2024). Indeed, both CMAQ_off_S22 and CMAQ_dust_S22 used the dry deposition mechanism by Shu et al. (2022). The dry deposition mechanism of Emerson et al. (2020) and Pleim et al. (2022) was implemented in CMAQ_dust_E20 and CMAQ_dust_P22 scenarios, respectively.
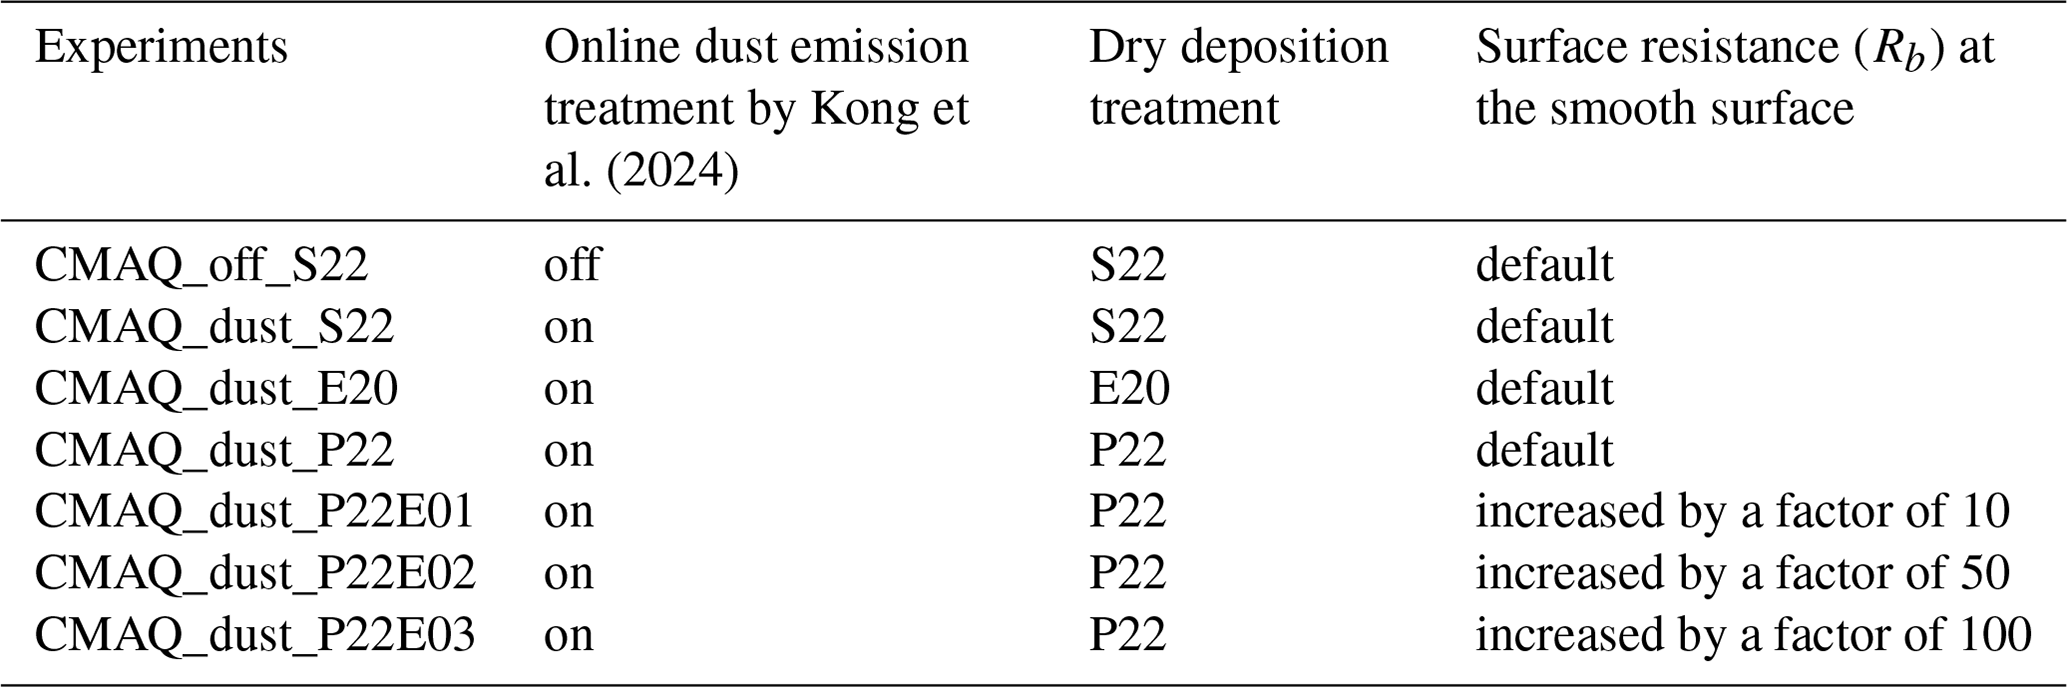
Vd over the ocean surface has been shown to influence the CTMs in simulating aerosols, particularly PM10. The modeled PM10 can be increased by reducing Vd by a factor of 10 based on the bare soil measurement (Tav et al., 2018; Ryu and Min, 2022). However, the adjusted Vd in estimating the aerosols was too coarse. In Eq. (3), the parameterizations of Ra and Rb determined the magnitude of Vd. The P22 dry deposition scheme in CMAQ v5.4 includes the white-cap effect over the ocean surface, which is related to the particle collection efficiency by impaction, as a function of Rb (Pleim et al., 2022). The impact of the white cap can increase as the wind speed increases, which can be an essential parameterization in simulating transboundary events (Albert et al., 2016). Our findings on dust transport, which were highly related to turbulence, have significant implications for future research and modeling, inspiring further exploration and innovation (Zhang et al., 2022). In CMAQ v5.4, Rb is estimated separately by vegetation and non-vegetation type. Rb at the smooth surface (non-vegetation) is related to the surface resistivity of the bare soil and the water layer. Since EAD aerosol particles are mostly uplifted from the bare soil surface layer and the aerosol deposition at the marine boundary layer (Kong et al., 2021), the sensitivity of Rb at the smooth surface to its impact on the CMAQ dust model simulation can be vital. By assuming , Vd is inversely dependent on Rb. We increased Rb to a factor of 10 as P22E01. To further carry out the sensitivity test, we scaled Rb by 50 and 100 for P22E02 and P22E03, respectively (Table 3).
2.4 Ancillary dataset
PM10 (particulate matter ≤10 µm in aerodynamic diameter) and PM2.5 (particulate matter ≤2.5 µm in aerodynamic diameter) concentrations during the dust events in January 2023 were obtained from Lulin Atmospheric Background Station (LABS; 23.47° N, 120.87° E, 2862 m m.s.l.) and Cape Fuguei (25.30° N, 121.54° E, 10 m m.s.l.). In addition, the hourly PM10 and PM2.5 of nearly 100 sites distributed over mainland China (Fig. S1), covering the period of 12 March–20 April 2021, were obtained from the Chinese air quality online monitoring analysis platform's website (https://www.aqistudy.cn/, last access: 4 July 2025). The Modern Era Retrospective-analysis for Research and Application version 2 (MERRA-2) reanalysis data were used to demonstrate the spatiotemporal distribution of dust and to compare it with the air quality model, irrespective of the influence of clouds. MERRA-2 (Gelaro et al., 2017) is a NASA reanalysis utilizing Goddard Earth Observing System Data Assimilation System version 5 (GEOS-5) and covering the data assimilated system at a native spatial resolution of 0.5° × 0.625°. Also, Moderate Resolution Imaging Spectroradiometer (MODIS) Terra satellite images and the level-3 MODIS AOD at 550 nm (MYD08) were obtained from the US National Aeronautics and Space Administration (Platnick et al., 2015).
3.1 Observed air quality and weather conditions
Figure 2 shows the dust outbreak over East Asia, displayed by the MODIS Terra sensor and MODIS AOD at 550 nm from 22–31 January 2023. The satellite image showed dust induced by a high-pressure system on 24–25 January (Fig. 2a3, 2a4). The next day, the same region was covered by a thick cloud, and dust was again widely distributed from 27–30 January 2023. Using MODIS AOD to verify the dust plume (Han et al., 2012; Kong et al., 2021), the dust plume was distributed in Central China and northern Taiwan on 24 January 2023. Moreover, the most intense dust plume in eastern China and the East China Sea region was observed on 27 January. Figure S2 shows the synoptic weather map across the study domain. On 22–23 January, the southward high-pressure system was responsible for pushing the pollutant across the Asian continent, which is consistent with Chuang et al. (2008) and Kong et al. (2021, 2022, 2024) (Fig. S2a–b). The high-pressure system that moved southward then moved eastward toward the western Pacific Ocean (Fig. S2c–d). Meanwhile, the high-pressure system on the northwest side again expanded in the southeast direction. The second high-pressure system again pushed the pollutant for the second time and caused the high-pollutant problem on 27 January.
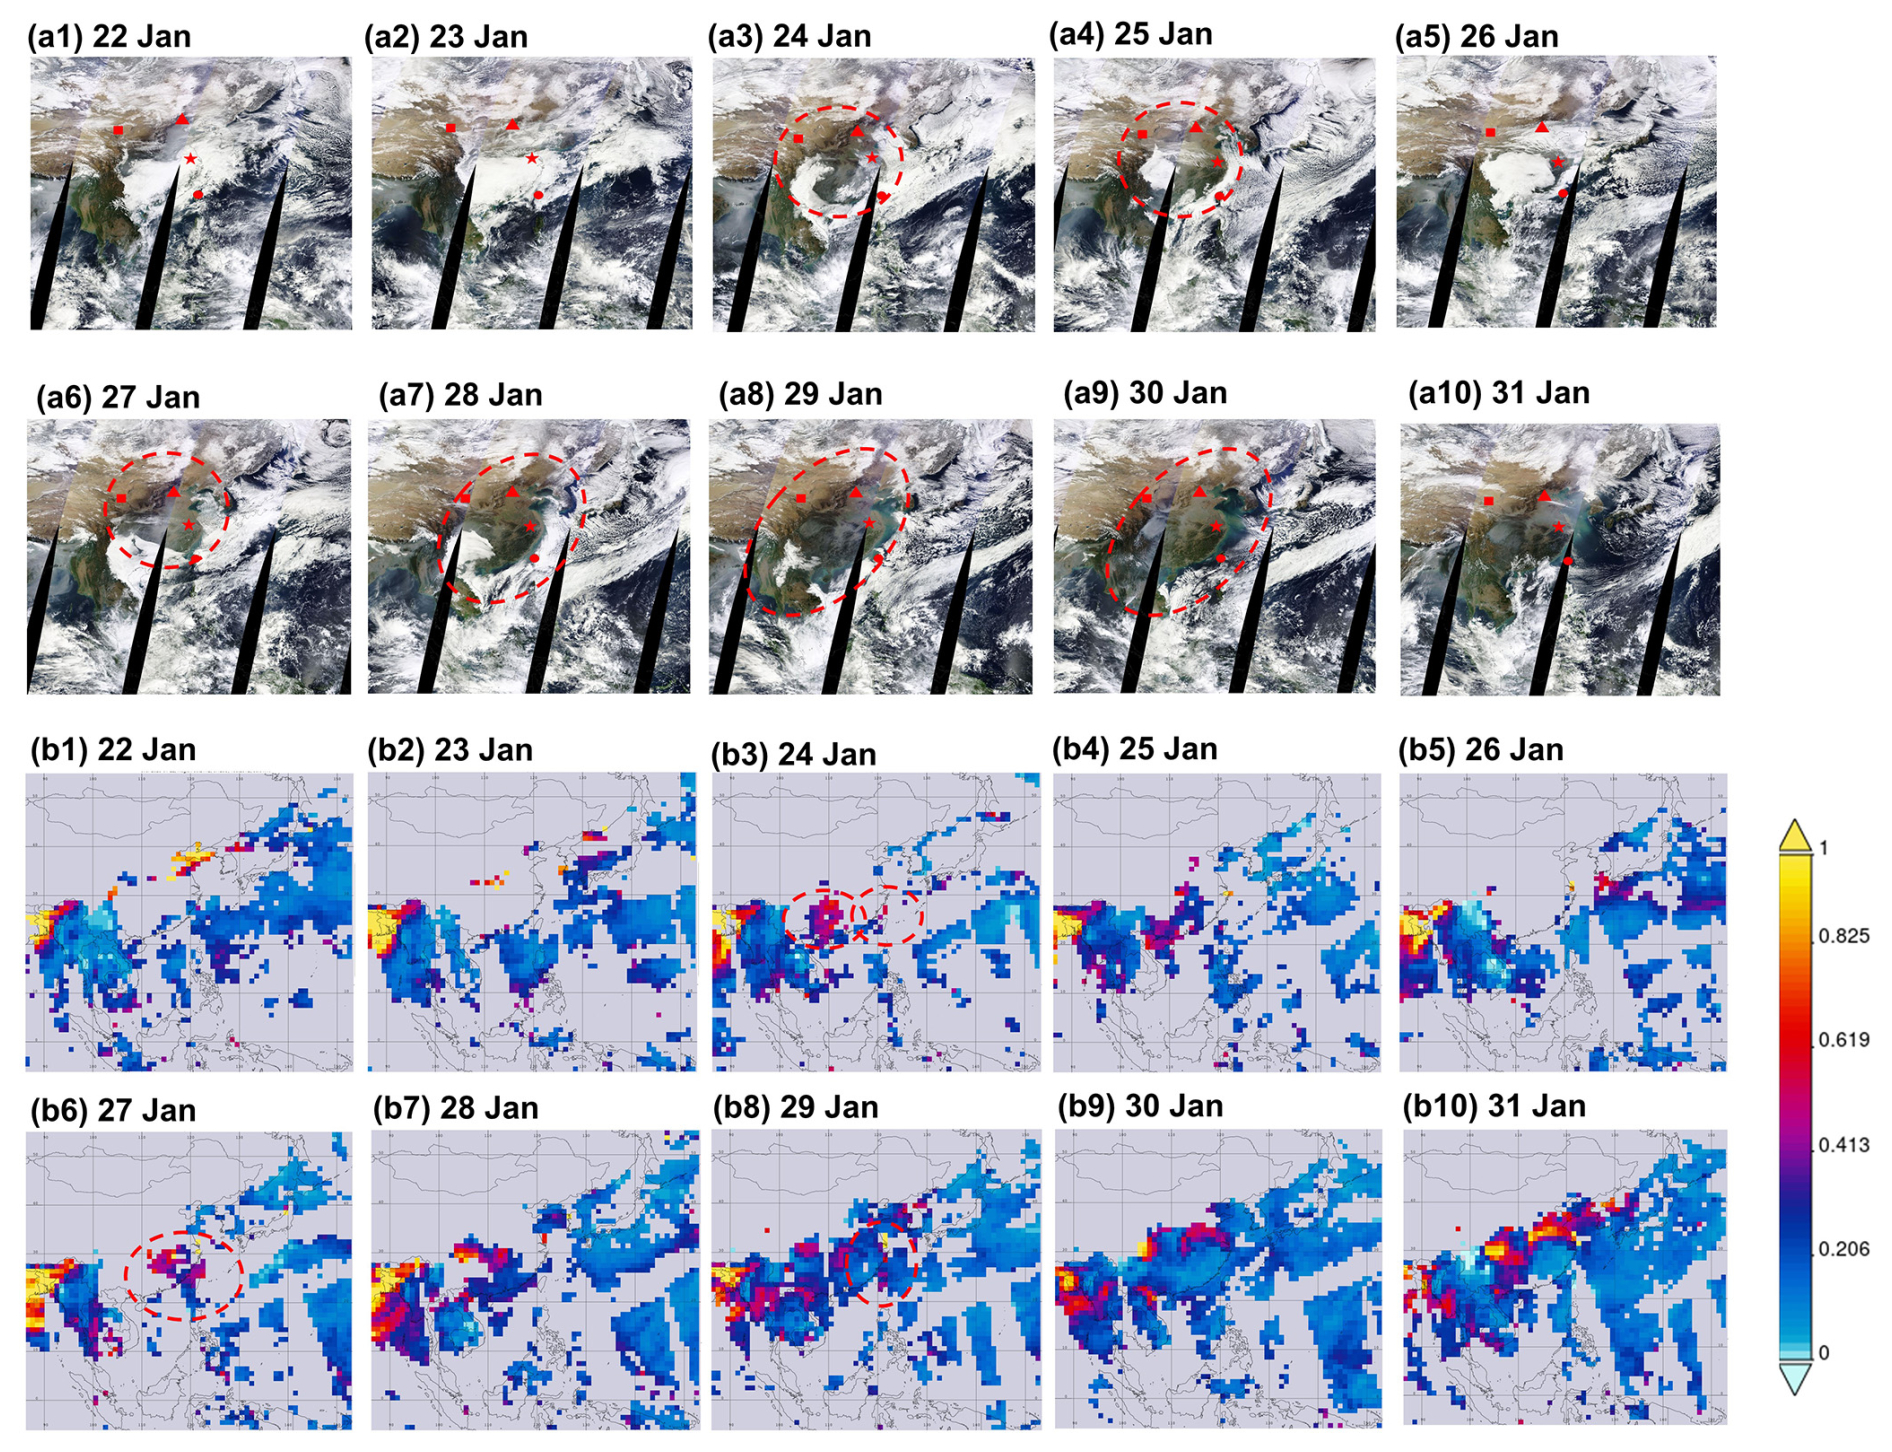
Figure 2MODIS Terra images (a1–a10) and MODIS aerosol optical depth (AOD) at 550 nm (b1–b10) showing dust outbreak across East Asia during 22–31 January 2023. Rectangular, triangular, star-shaped, and circular red markers indicate Lanzhou, Beijing, Shanghai, and Taiwan, respectively. The dashed circular red lines indicate the dust plume.
The impact of East Asian dust on air quality over the high-altitude western Pacific region was widely discussed (Kong et al., 2022). Two interesting high-pollution events at Mt. Lulin (2862 m a.s.l.) during 24–26 and 27–30 January 2023, are shown in Fig. 3. The latter event was more intense compared to the earlier one, and during it, the maximum PM10 concentration could reach up to 35 µg m−3. Moreover, it was observed that the BC concentrations could reach up to a maximum of 400 ng m−3. Based on the in situ measurement, it was interesting to find the mixing state between dust, BC, and brown carbon (Fig. 3c). Different from what has been discussed by Kong et al. (2022), the long-range-transport air pollution at high altitude included not only EAD but also the anthropogenic pollutant from mainland China.
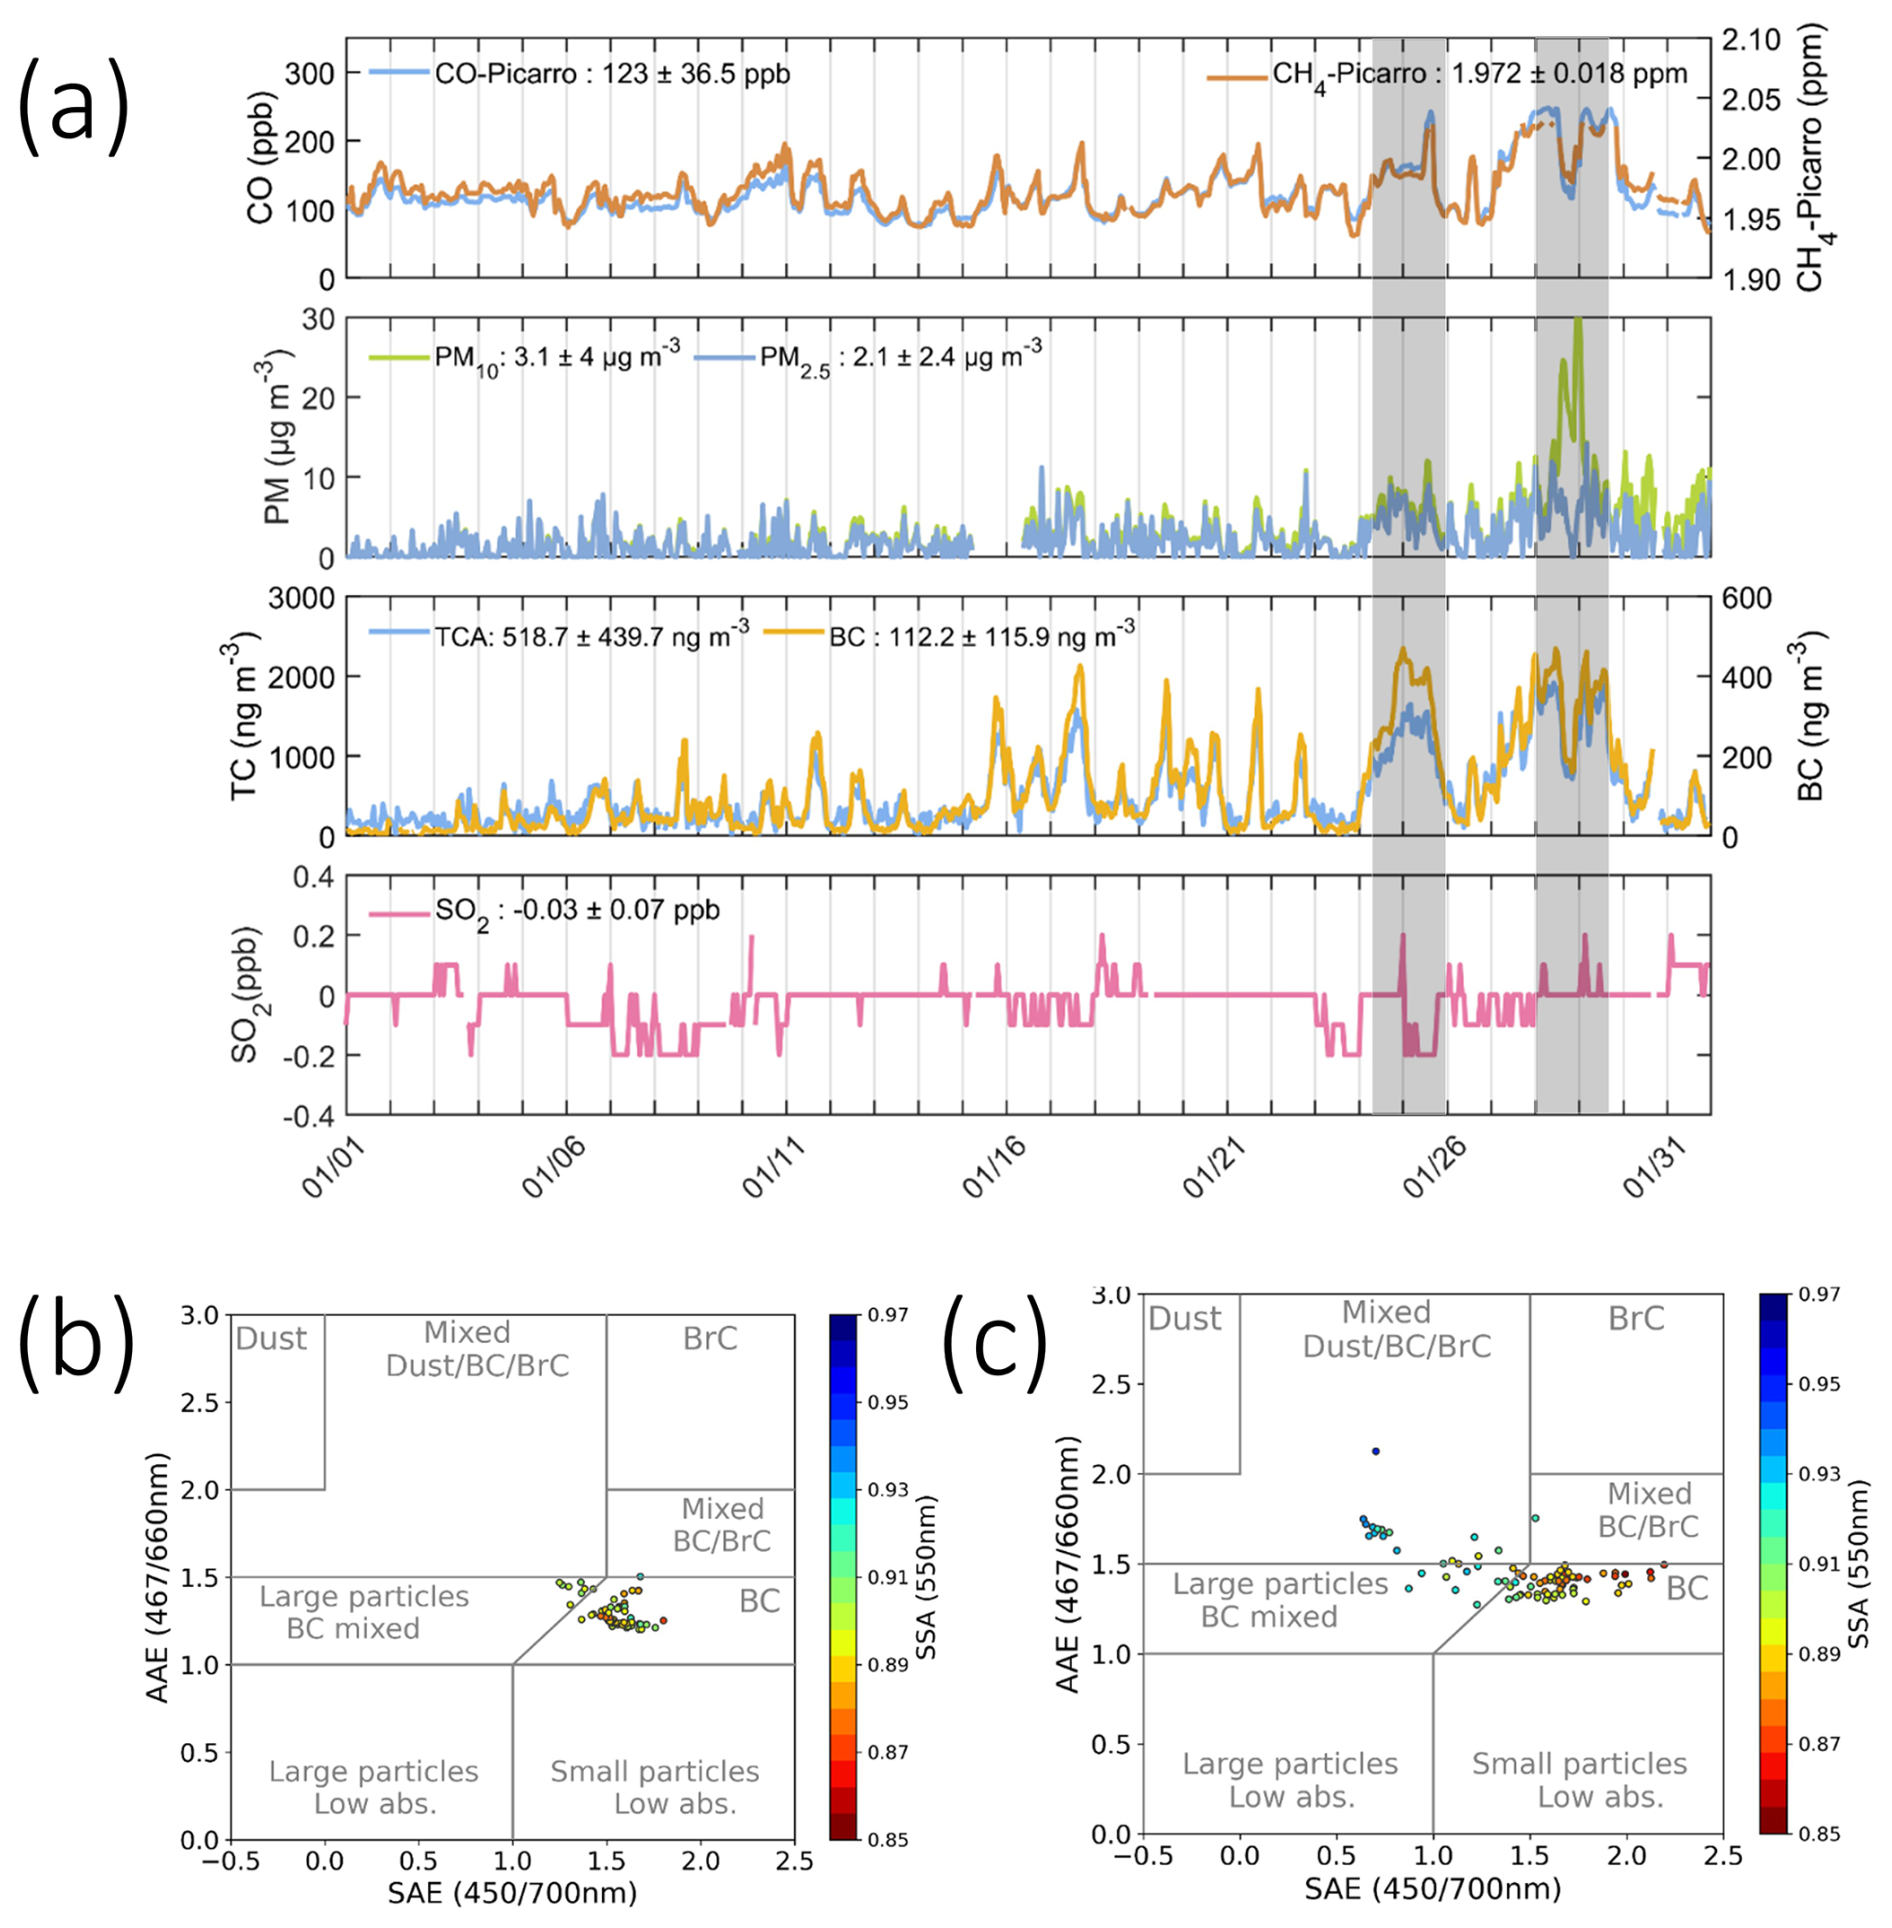
Figure 3(a) Time series of observed pollutants over LABS during January 2023. The aerosol radiation properties during (b) 24–26 January and (c) 27–30 January 2023.
3.2 Evaluation of the CMAQ dust emission and dry deposition parameterizations
Table 4 shows the statistical analysis of PM10 and PM2.5 concentrations over Cape Fuguei (northern Taiwan) from 22–31 January under the multiple deposition mechanisms. The threshold of the statistical index is based on Emery et al. (2001). CMAQ_off_S22, the PM10 simulation presented without the inline dust calculation, recorded the normalized mean bias (NMB) of −52.81 %. CMAQ_dust_S22 improved the simulation over Cape Fuguei (northern Taiwan) by −47.01 % as we included the refined dust treatment (Kong et al., 2024). However, the improvement is insignificant due to the weak-intensity dust episodes and the limitation caused by the excessive deposition mechanism within the model (Kong et al., 2021). Hence, we expanded the sensitivity simulation to examine the impact of the deposition algorithm on the aerosol prediction. CMAQ_dust_E20 simulations utilizing the Emerson et al. (2020) approach increased the modeled PM10 simulation by NMB of −41.9 %.
Table 4Statistical evaluation for PM10 and PM2.5 concentrations during 22–31 January 2023 for Cape Fuguei under the multiple simulation scenarios.
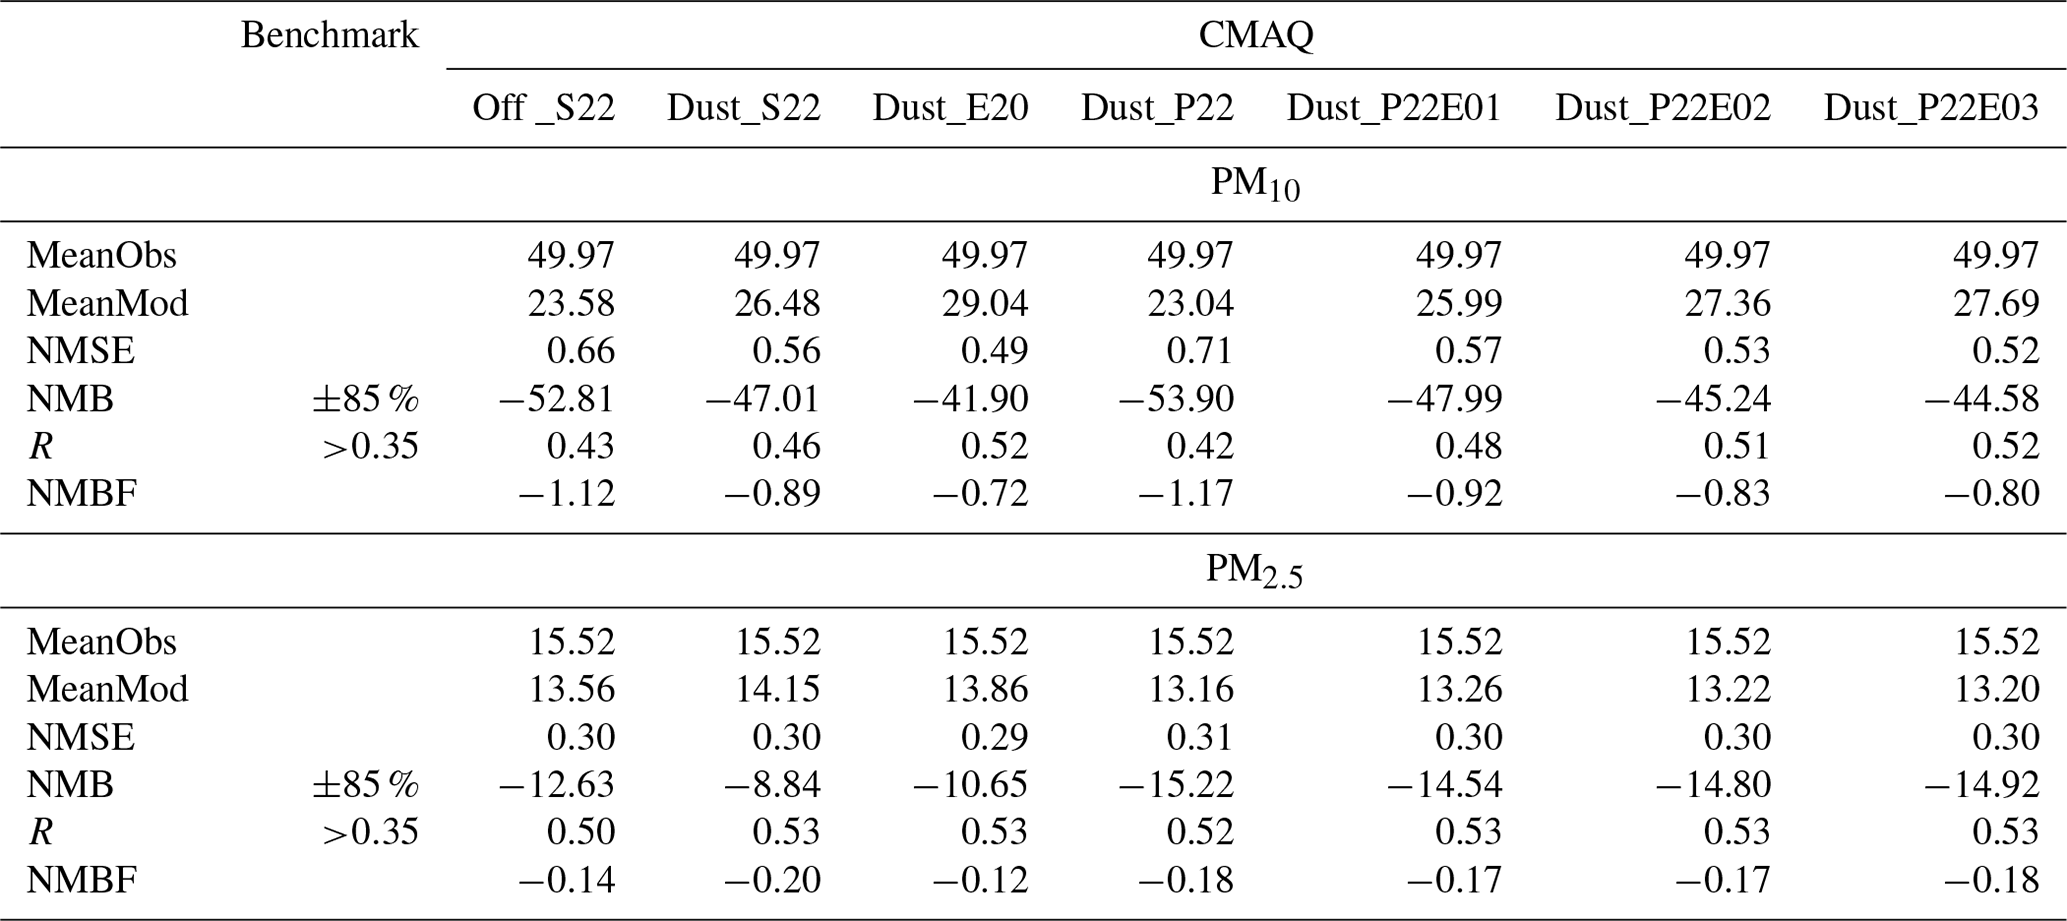
The definitions of the statistical formulas. NMSE: normalized mean square error. NMB: normalized mean bias. R: correlation coefficient. NMBF: normalized mean bias factor.
Instead of PM10 simulation, the present study found that the inline dust treatment and deposition algorithms could influence PM2.5 simulation performances. For instance, the modeled PM2.5 improved from −12.63 % (CMAQ_off_S22) to −8.84 % (CMAQ_dust_S22). Meanwhile, the deposition algorithm embedded in CMAQ v5.4 recorded modeled PM2.5 concentrations of −10.65 % and −15.22 % under CMAQ_dust_E20 and CMAQ_dust_P22, respectively. This finding suggested that East Asian dust from northwest China transported to the western Pacific Ocean could also carry the anthropogenic emissions of East China.
Figure 4 shows the time series of hourly PM10 and PM2.5 concentrations over Cape Fuguei (northern Taiwan) and LABS (high-altitude region) from 22–31 January 2023 under the multiple deposition mechanisms. Generally, all the patterns of PM10 simulations were consistent with the observed PM10, especially in capturing the peak value. For instance, the maximum observed (CMAQ_dust_E20) PM10 concentrations at the surface during 24 and 27 January were 141 (102.6) µg m−3 and 114 (163.2) µg m−3, respectively. A similar time-series pattern was found for the PM2.5 simulation (Fig. 4b).
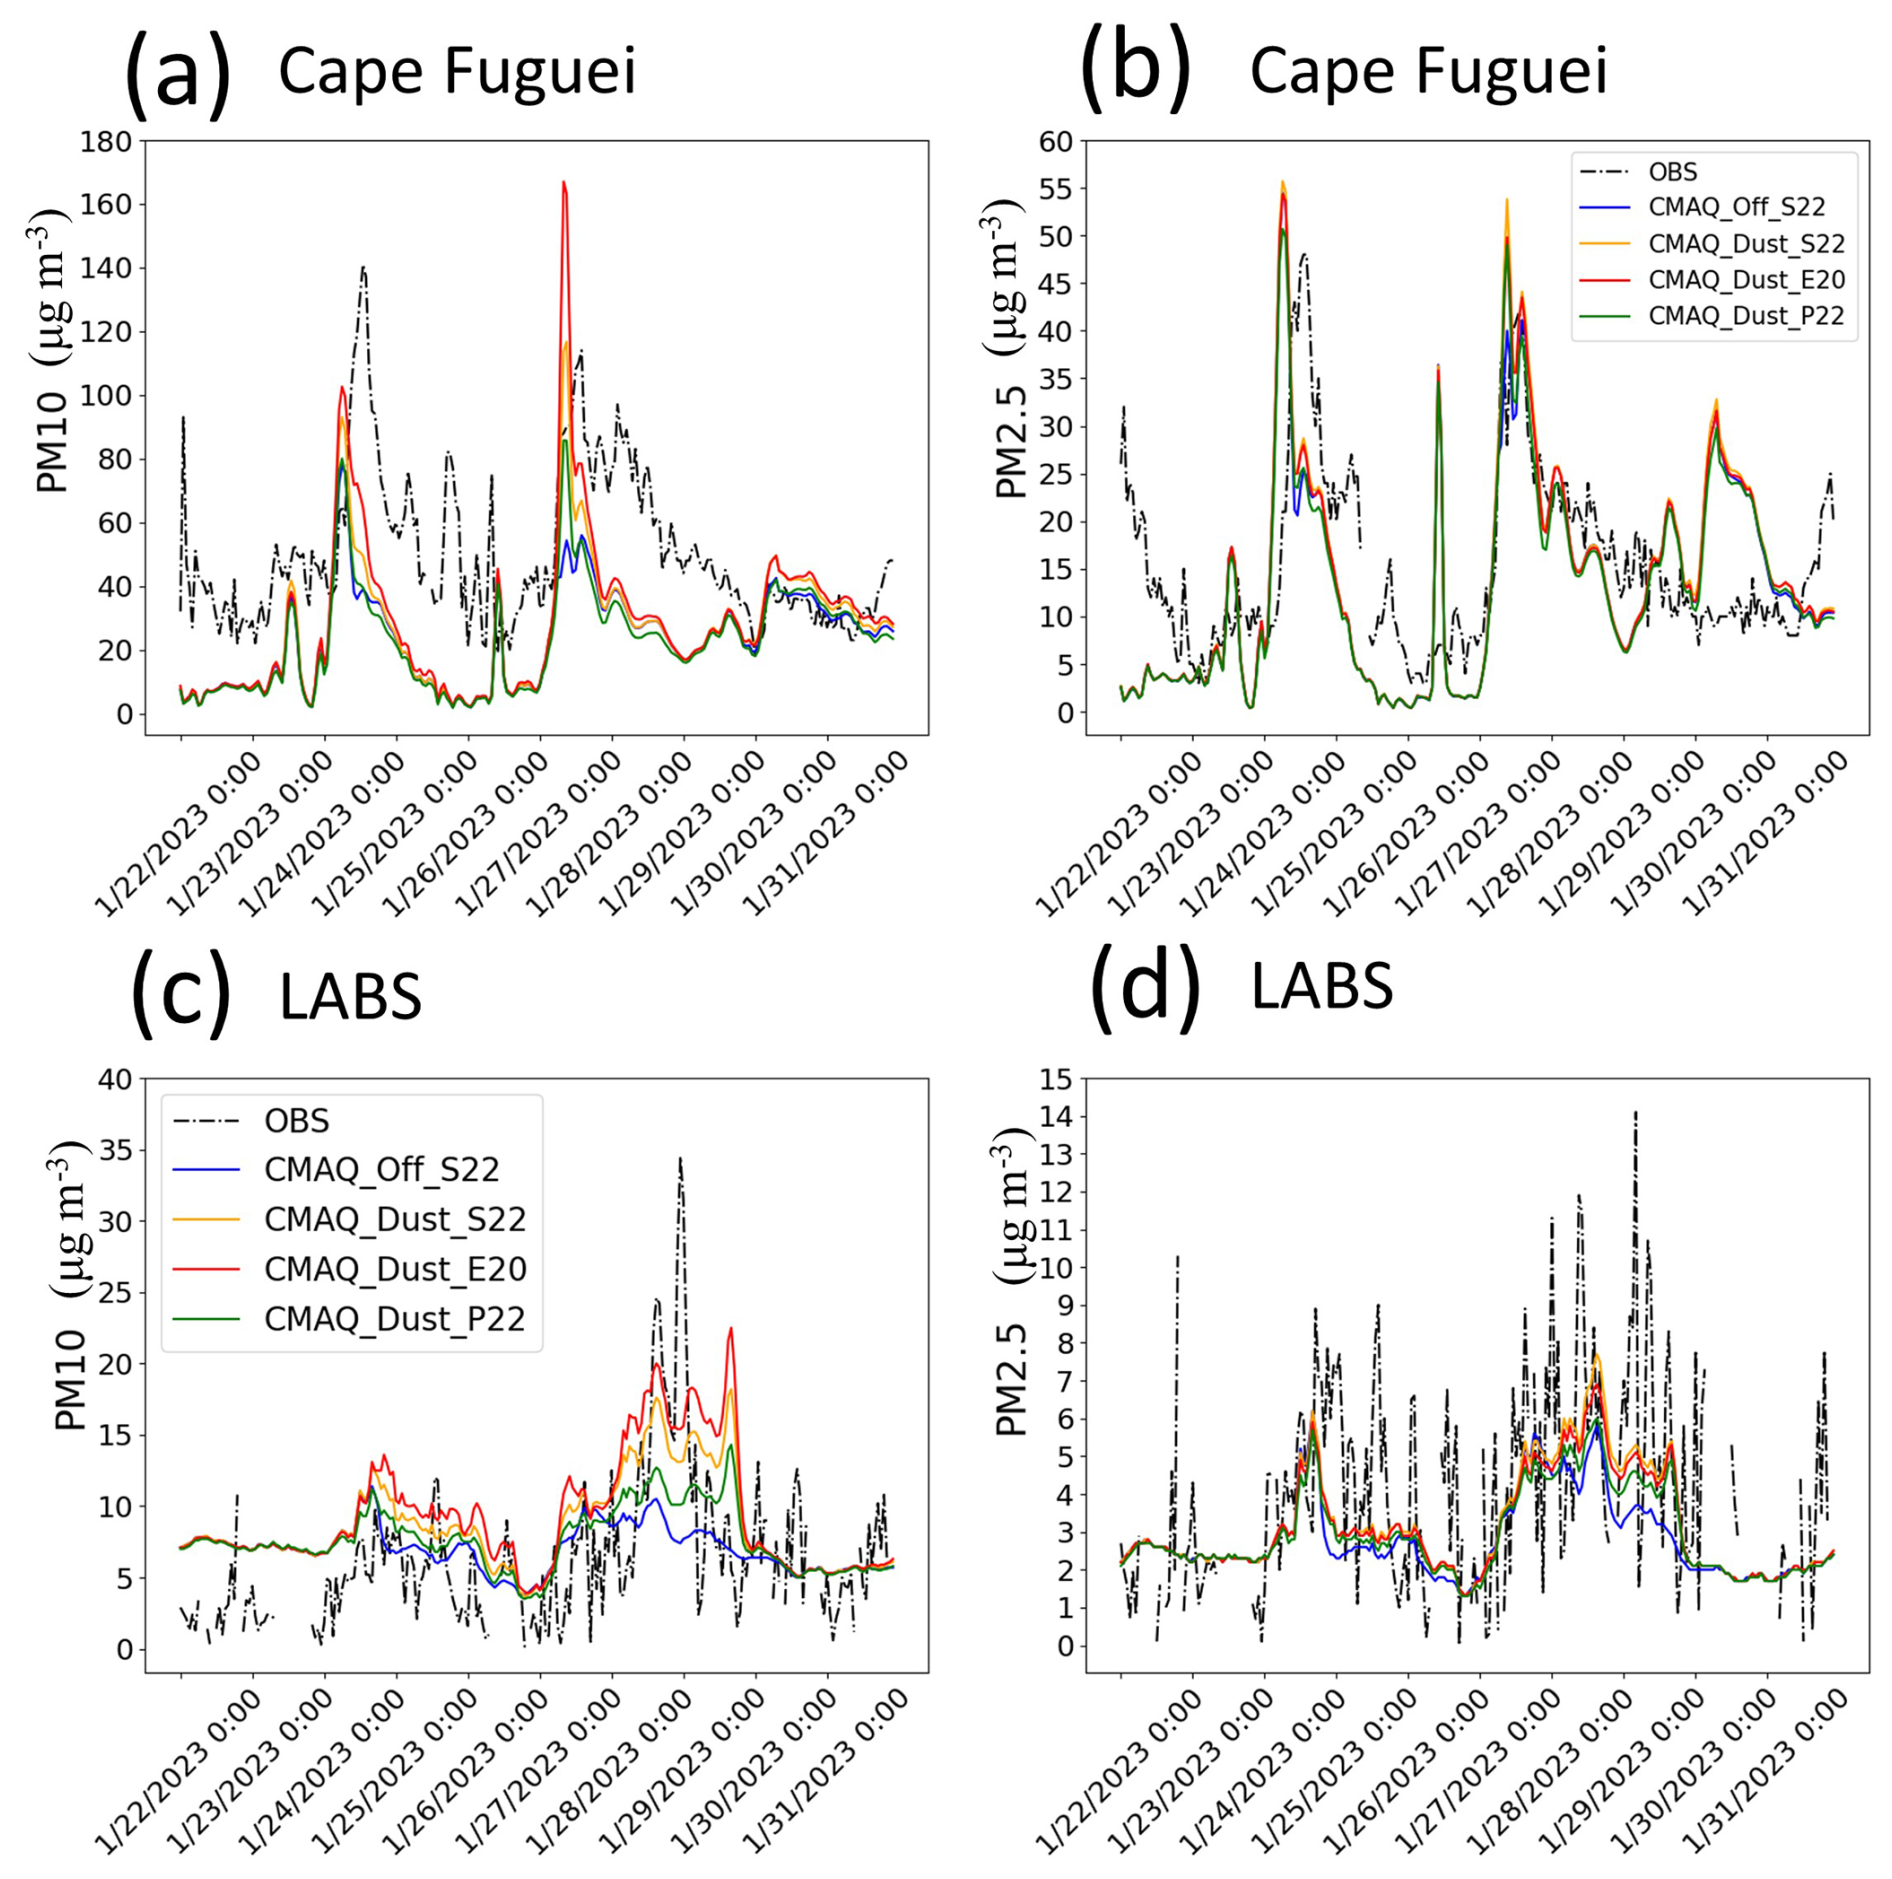
Figure 4Time series of PM10 (a, c) and PM2.5 (b, d) concentrations during 22–31 January 2023 under multiple deposition schemes over Cape Fuguei (a, b) and LABS (c, d), representing the surface and high altitude, respectively.
More importantly, the CMAQ model performance over the high-altitude region needed to be evaluated and discussed. The biomass burning episode of the northern PSEA over Mt. Lulin has been finely correlated by plume rise injection (Chuang et al., 2016; Ooi et al., 2021). From Fig. 4c, the modeled PM10 pattern for CMAQ_off_S22 could not correlate well with observed PM10 over Mt. Lulin, with a poor correlation of 0.30. The correlation was increased for CMAQ_dust_S22 (0.54) and CMAQ_dust_P22 (0.46), and it primarily performed well for CMAQ_dust_E20 (0.55). The modeled result was somehow consistent with the surface PM10 simulation at Cape Fuguei. The high observed PM10 episodes during 27–28 January with a maximum of 34.5 µg m−3 were only 53.3 % higher than CMAQ_dust_E20 of 22.5 µg m−3. For the CMAQ PM2.5, the simulation generally underestimated the observed PM2.5. It is worth noting that E20, in particular, showed exceptional performance in the PM10 simulation compared to other dry deposition schemes under the refined dust scheme. This underscores the potential effectiveness of E20 in managing PM10 particulate matter. However, the PM2.5 simulations showed only marginal changes, regardless of whether it was a surface or high-altitude simulation.
During the spring of 2021, a series of dust storms (15, 27 March, and 18 April) occurred over the Gobi area, with one of the most significant dust storms in the past decade (15 March, the “3.15” dust storm hereafter), causing an environmental impact over the continent (Jin et al., 2022; Gui et al., 2022; He et al., 2022; Liang et al., 2022; Tang et al., 2022). More interestingly, one of the multiple dust storm episodes reached the western Pacific Ocean due to the extreme typhoon episode (Kong et al., 2024). Hence, we intend to re-emphasize the importance of accurately representing deposition schemes in CMAQ for simulating the recent dust storm episodes over the Asian continent (Kong et al., 2024). We evaluated the CMAQ simulations with the different dry deposition schemes for the 40 d sensitivity test on 12 March–20 April 2021 against measured PM10 and PM2.5 concentrations across the observation sites in mainland China (Table 5). The observation sites used for the model comparison are marked in Fig. S1. Generally, the evaluation results for Taiwan and mainland China were consistent. During the 40 d of spring 2021, the CMAQ PM10 NMB was the highest for off_S22 (NMB = −75.00 %), followed by dust_S22 (−45.97 %). The latest inline dust emission scheme embedded with the E20 dry deposition scheme for PM10 was well performed by NMB of −25.43 %, compared to the dust_P22 (−59.82 %). For the PM2.5 simulation, dust_S22 has been improved from off_S22, and dust_S22 was slightly better than dust_E20 and dust_P22.
Table 5The CMAQ evaluation for PM10 and PM2.5 against the average 100 observation sites across mainland China (Fig. S1) and AOD against MODIS daily observation near the dust source region (above 30° N) with normalized mean bias (NMB) under multiple simulation scenarios (Fig. S3) is presented. Spring 2021 (3.15, 3.27, and 4.18) represents the evaluation periods as 12 March–20 April 2021, 14–16 March 2021, 26–28 March 2021, and 17–19 April 2021, respectively.
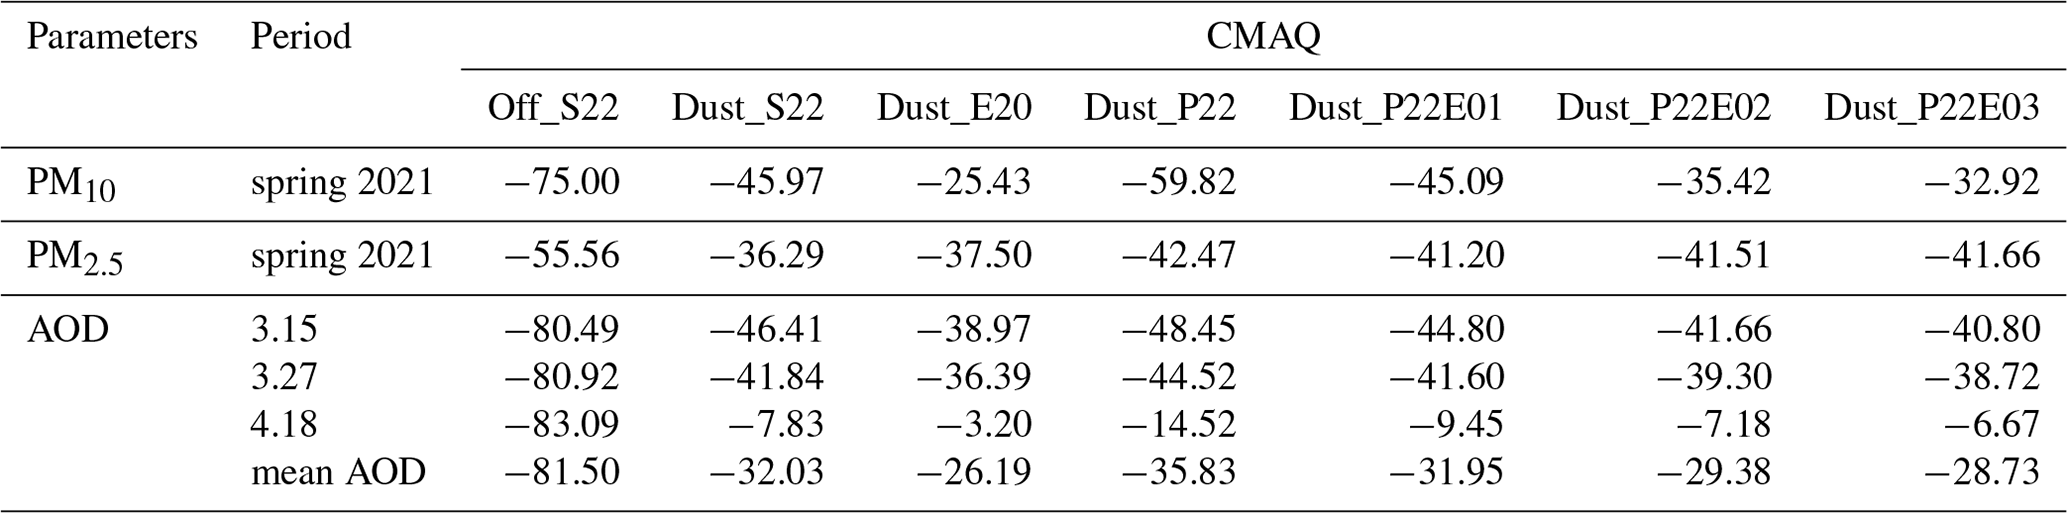
Figure 5 shows the scatter plot of simulated and observed PM over mainland China. The correlation coefficient (R), a factor of 2 (FAC2), and the mean observed and simulated PM are shown in Fig. 5. The modeled PM10 without the dust scheme had the lowest correlation. Among all of these simulations, dust_E20 showed the best correlation (R>0.3) compared to dust_S22 and dust_P22. However, for PM2.5, the correlation between the model and measured values was similar for all the dry deposition schemes. The statistical index of FAC2 was used in the present work since either low or high outliers have less influence on it (Chang and Hanna, 2004). The dataset is reliable for FAC2 values between 0.5 and 2.0, with the ideal model value of 1.0. The simulated PM10 by dust_E20 performed well, with a nearly perfect value of 1.1. Meanwhile, the PM2.5 by dust_S22 simulation was slightly better than dust_E20 but much better than the other experiments.
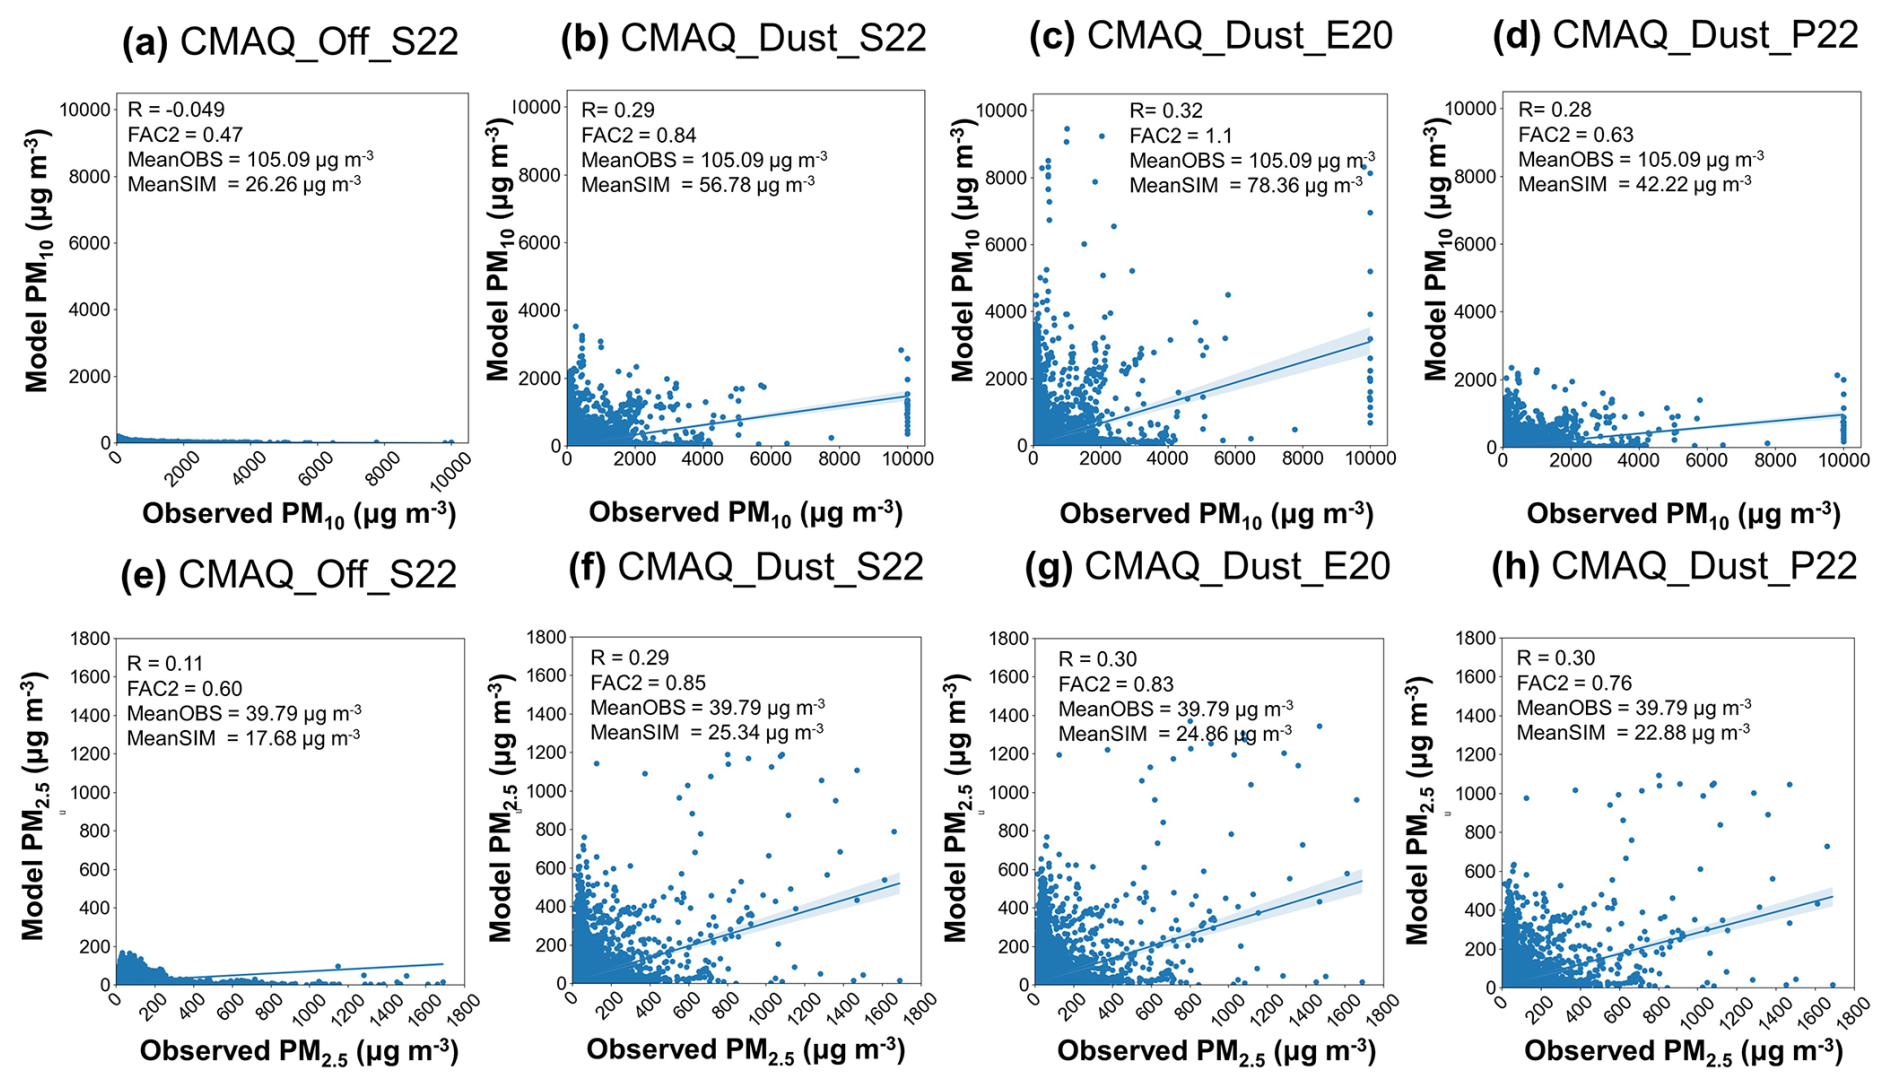
Figure 5The scatter plot of the observed against modeled PM10 (a–d) and PM2.5 (e–h) for CMAQ_off_S22 (a, e), CMAQ_dust_S22 (b, f), CMAQ_dust_E20 (c, g), and CMAQ_dust_P22 (d, h) at the 100 sites of mainland China on 12 March–20 April 2021 (https://air.cnemc.cn:18007/, last access: 4 July 2025). R is the correlation coefficient between the observation and model, FAC2 is the factor of 2, and MeanOBS and MeanSIM are the mean of PM from the observation and model, respectively.
The comparison of AOD between CMAQ and MODIS for the three dust storm episodes is as follows: 14–16 March 2021 (“3.15” dust storm), 26–28 March 2021 (“3.27” dust storm), and 17–19 April 2021 (“4.18” dust storm) (shown in Table 5). Overall, CMAQ dust_E20 above 30° N has been evaluated well against the MODIS AOD with an NMB of −26.2 %, as compared to S22 (−32.0 %) and P22 (−35.8 %). The CMAQ AOD by E20 during the most intense super dust storm in 3.15 has significantly improved over northern China, the dust source region, as shown in the dashed rectangular red box (Fig. S3). Additionally, the modeled AOD by E20 over the western Pacific Ocean (shown in the dashed rectangular red box) increased in episode 4.18, reporting a value of 0.7 compared to 0.5 by S22. Significantly, the E20 deposition scheme has primarily enhanced PM10 prediction over the marine boundary layer, addressing the model uncertainty due to the typhoon mentioned by Kong et al. (2024) and demonstrating the practical implications of our research.
The present work is consistent with the dust scheme in the Weather Research and Forecasting model coupled with Chemistry (WRF-Chem), where the dust loading is very sensitive to the dry deposition schemes and dust emission schemes, especially over the downwind region (Zeng et al., 2020). Figure 6 shows the CMAQ-estimated mean PM10 and PM2.5 in January 2023 and spring 2021 for the off_S22 and its corresponding change by dust_S22, dust_E20, and dust_P22. Generally, the spatial distribution of the high PM10 concentrations by >50 µg m−3 was distributed over northwest China, which is the location of the dust source region, consistent with the simulation suggested by Kong et al. (2021, 2022, 2024). Such high particulate matter dissipated to East China, indicating the transport pathway in the southeastern direction towards the western Pacific (Fig. 6a, h). The larger PM10 distribution by E20 than S22 and P22 over northwest China means E20 successfully increased the PM10 concentrations. Another fascinating fact about E20 was that the PM10 increased over the southern South China Sea (Fig. 6b). For the modeled PM2.5 concentrations, the high concentration was distributed over the Asian continent under all dry deposition mechanisms. Similar to the trend of PM2.5 simulations in Taiwan (as shown in Fig. 4), the spatial distribution of the modeled PM2.5 was identical to that of all dry deposition schemes. The result implies the significant impact of dry deposition on the EAD simulation's dust model, displaying a positive relationship between dust deposition and PM10 concentrations (Zhang et al., 2017).
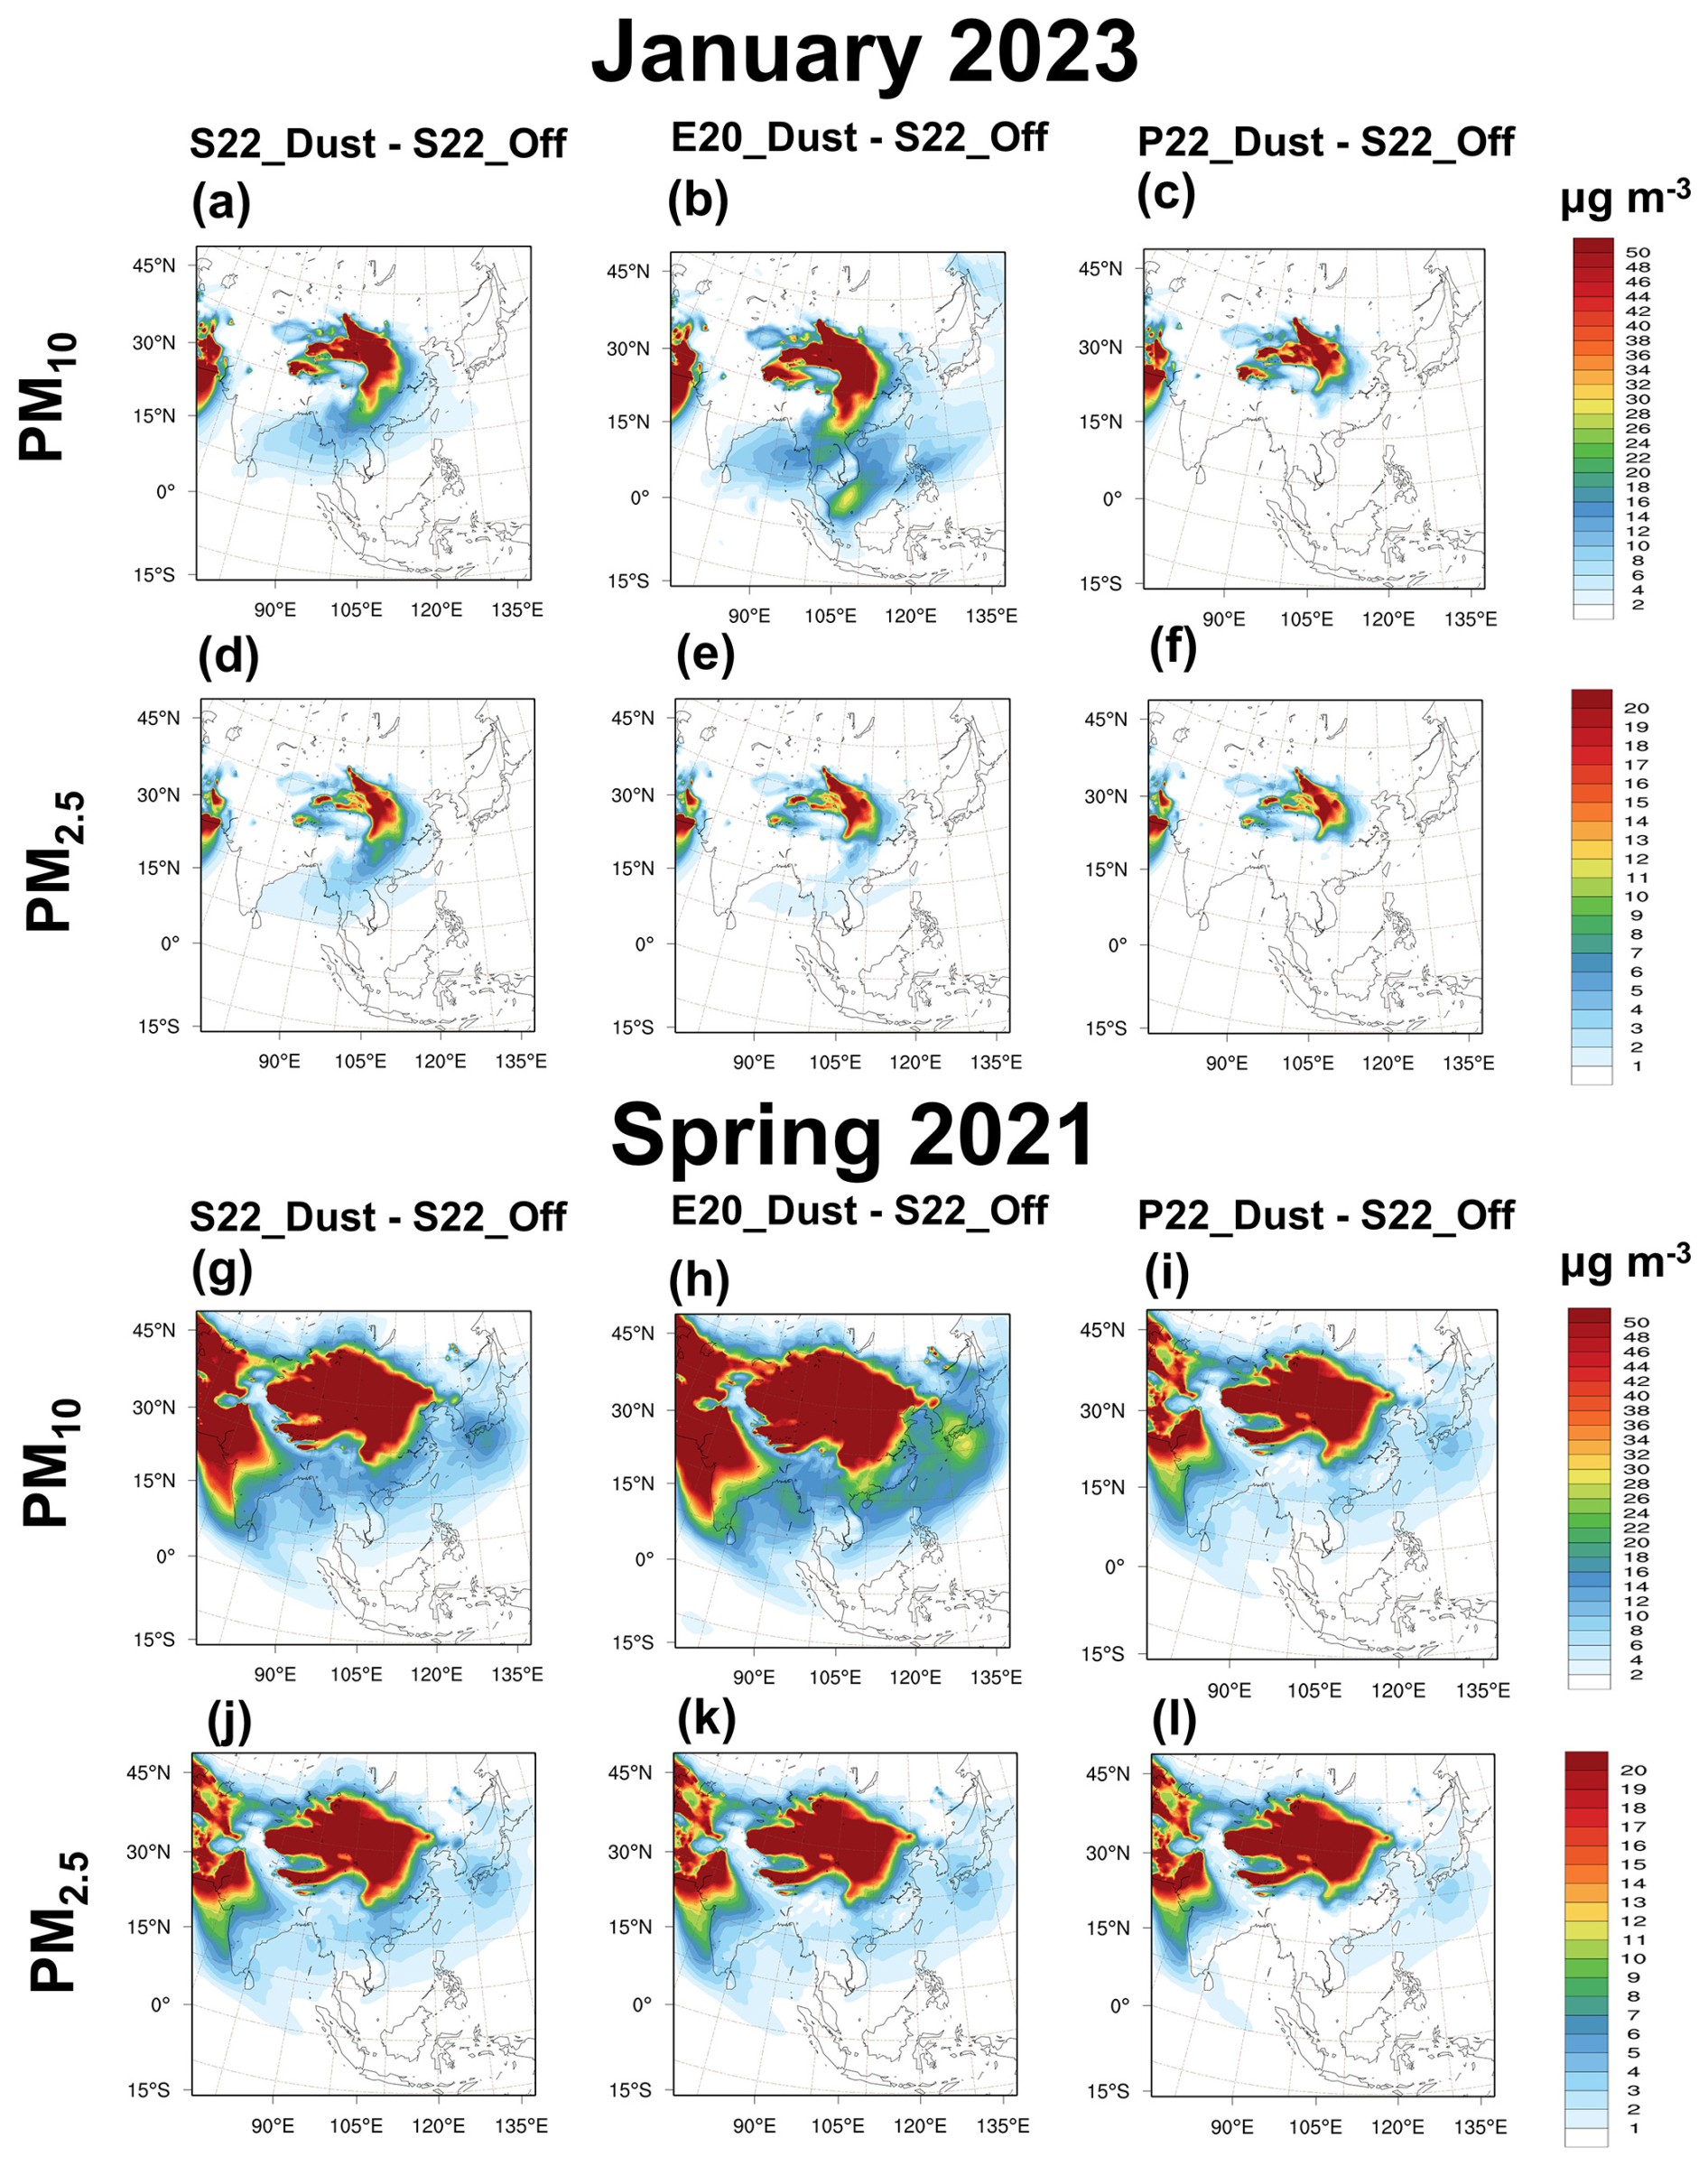
Figure 6The CMAQ-estimated 10 d (January 2023) (a–f) and 40 d (spring 2021) (g–l) averaged mean (a, b, c, g, h, i) PM10 and (d, e, f, j, k, l) PM2.5, for the concentration changes using (a, d, g, j) S22, (b, e, h, k) E20, and (c, f, i, l) P22 schemes, as relative to the CMAQ_off_S22 scenarios.
3.3 Impact on the ambient particle concentrations in the CMAQ
Figure 7a shows the boxplot of the averaged simulated Vd for the Aitken, accumulation, and coarse particle modes under multiple deposition schemes in January 2023 (S22_2023, E20_2023, and P22_2023) and in spring 2021 (S22_2021, E20_2021, and P22_2021). These different dry deposition treatments have a substantial impact on the aerosol profile, altering the ambient total dry deposition regionally. For instance, the median deposition velocity of S22_2023, E20_2023, and P22_2023 of the Aitken (accumulation) particle modes was 0.069 (0.020) cm s−1, 0.039 (0.014) cm s−1, and 0.034 (0.029) cm s−1, respectively. The E20 simulation median Vd decreased by −12.65 % for coarse-mode particles compared to S22. Also, the 75th percentile Vd of the coarse mode was significantly reduced by −32.13 %. On the other hand, P22 showed a different simulation by the median Vd increment of 71.38 %. These findings suggest that the choice of dry deposition treatment can significantly influence the distribution and concentration of aerosols in the atmosphere, with potential implications for air quality and climate.
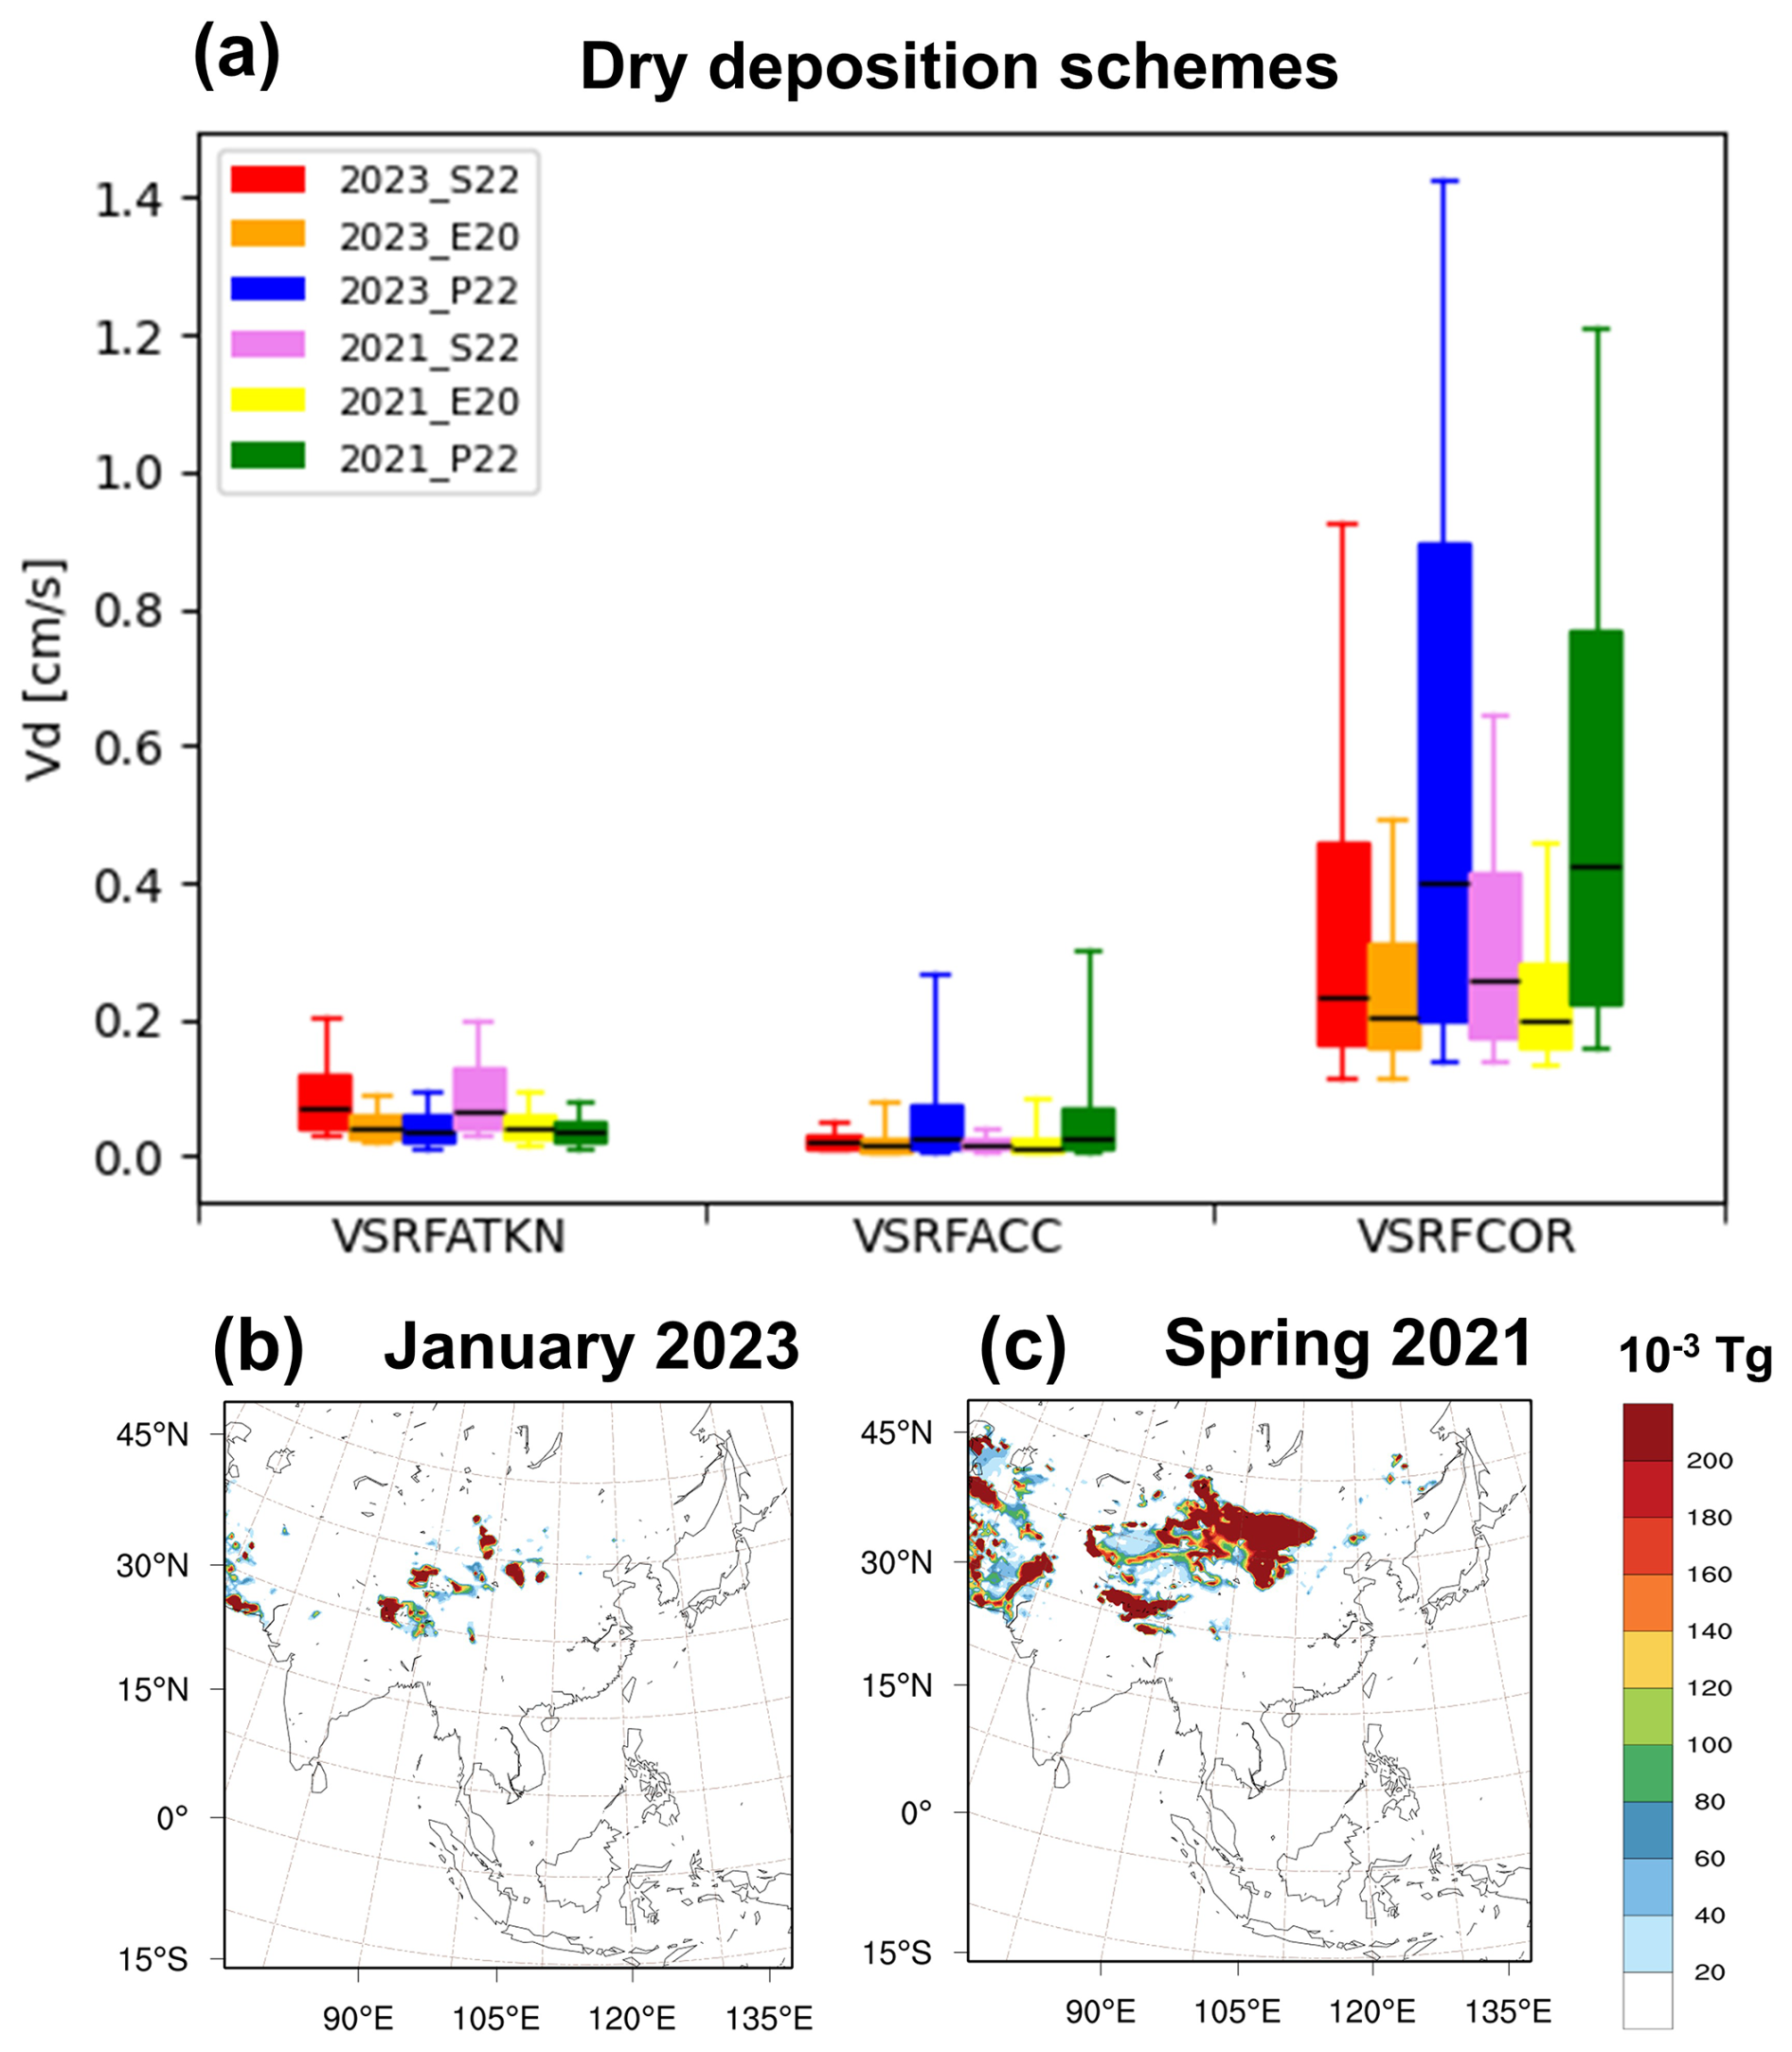
Figure 7(a) 10 d (2023) and 40 d (2021) averaged dry Vd predicted by the CMAQ for the Aitken, accumulation, and coarse particle modes using the 2023_S22 (red), 2023_E20 (orange), 2023_P22 (blue), 2021_S22 (violet), 2021_E20 (yellow), and 2021_P22 (green) particle dry deposition schemes. The variability illustrated by these boxes and whiskers corresponds to spatial variability in annually averaged values throughout the CMAQ domain. The simulated total dust emission from CMAQ_dust_E20 in (b) January 2023 and (c) spring 2021.
As shown in Fig. 7a, the results during the spring of 2021 are similar to those for January 2023 in comparing the dry deposition schemes. Notably, the Vd of the coarse mode for E20_2023 and E20_2021 was the lowest compared to the other dry deposition schemes. In contrast, the accumulation- and coarse-mode values by P22 were the highest. The result was consistent with the best simulated PM10 by E20 in 2023 and 2021 displayed in Tables 4 and 5, respectively. The lowest Vd of the coarse mode particle was responsible for reducing the PM10 simulation underestimation, consistent with the simulation by Ryu and Min (2022). The slow Vd means the total loss of aerosols to the surface has been minimized, leading to increased aerosol concentration. In addition, the spatial distribution of dust emissions could significantly influence the aerosol deposition velocity. The total dust emission in spring 2021 was of a much higher magnitude and wider spatial distribution than in January 2023 (Fig. 7b, c). This led to a slow Vd in the coarse mode, particularly causing more dust loading during the multiple dust storms in spring 2021 than the regular dust episode recorded in January 2023. This finding is consistent with Zeng et al. (2020), which emphasized the sensitivity of different dust emissions on dry deposition schemes. However, it is important to note that the research was only conducted in one particular short period. On the other hand, this work has highlighted the distinct dust emissions according to EAD intensity impacting the various dry deposition schemes. These implications are crucial for understanding the behavior of aerosols in the atmosphere and their significant impact on air quality.
We estimated the CMAQ averaged particle modes for the S22_2023, E20_2023, and P22_2023 dry deposition scheme (Fig. 8). For S22_2023, we found that high Vd corresponding to the Aitken and accumulation modes was distributed mainly over most of the CMAQ domain, which was most evident over the Asian continent (Fig. 8a, d). Meanwhile, the magnitude of Vd distribution was the most significant over the western Pacific Ocean by S22_2023 and the least for E20_2023 (dashed rectangular box in Fig. 8d, e, and f). For the coarse-mode particles, the Vd was the lowest for E20_2023 compared to S22_2023 and P22_2023, particularly over the ocean area near northeast China, Japan, and Korea (dashed rectangular white box in Fig. 8d, e, and f). This led to a significant deposition over the downwind region, causing less PM10 simulated by P22_2023 and S22_2023 than E20_2023. A previous study proposed the Vd for the aerosols at the water surface was associated with the CTM uncertainty at the downwind region (Kong et al., 2021, 2024; Ryu and Min, 2022). The Vd at the land surface was generally higher than at water surfaces. Interestingly, the coarse-mode Vd at the water surface for E20_2023 (0.060 cm s−1) was lower than S22_2023 (0.085 cm s−1) and P22_2023 (0.116 cm s−1), suggesting that E20_2023 deposition schemes could minimize the excessive deposition over the marine boundary layer (Table 6). Such minimal deposition velocity distributed over a large part of the western Pacific Ocean, including the Sea of Japan, Yellow Sea, East China Sea, and South China Sea, might be responsible for reducing the modeled PM10 underestimation over Taiwan (Fig. 8h), as mentioned by Kong et al. (2021).
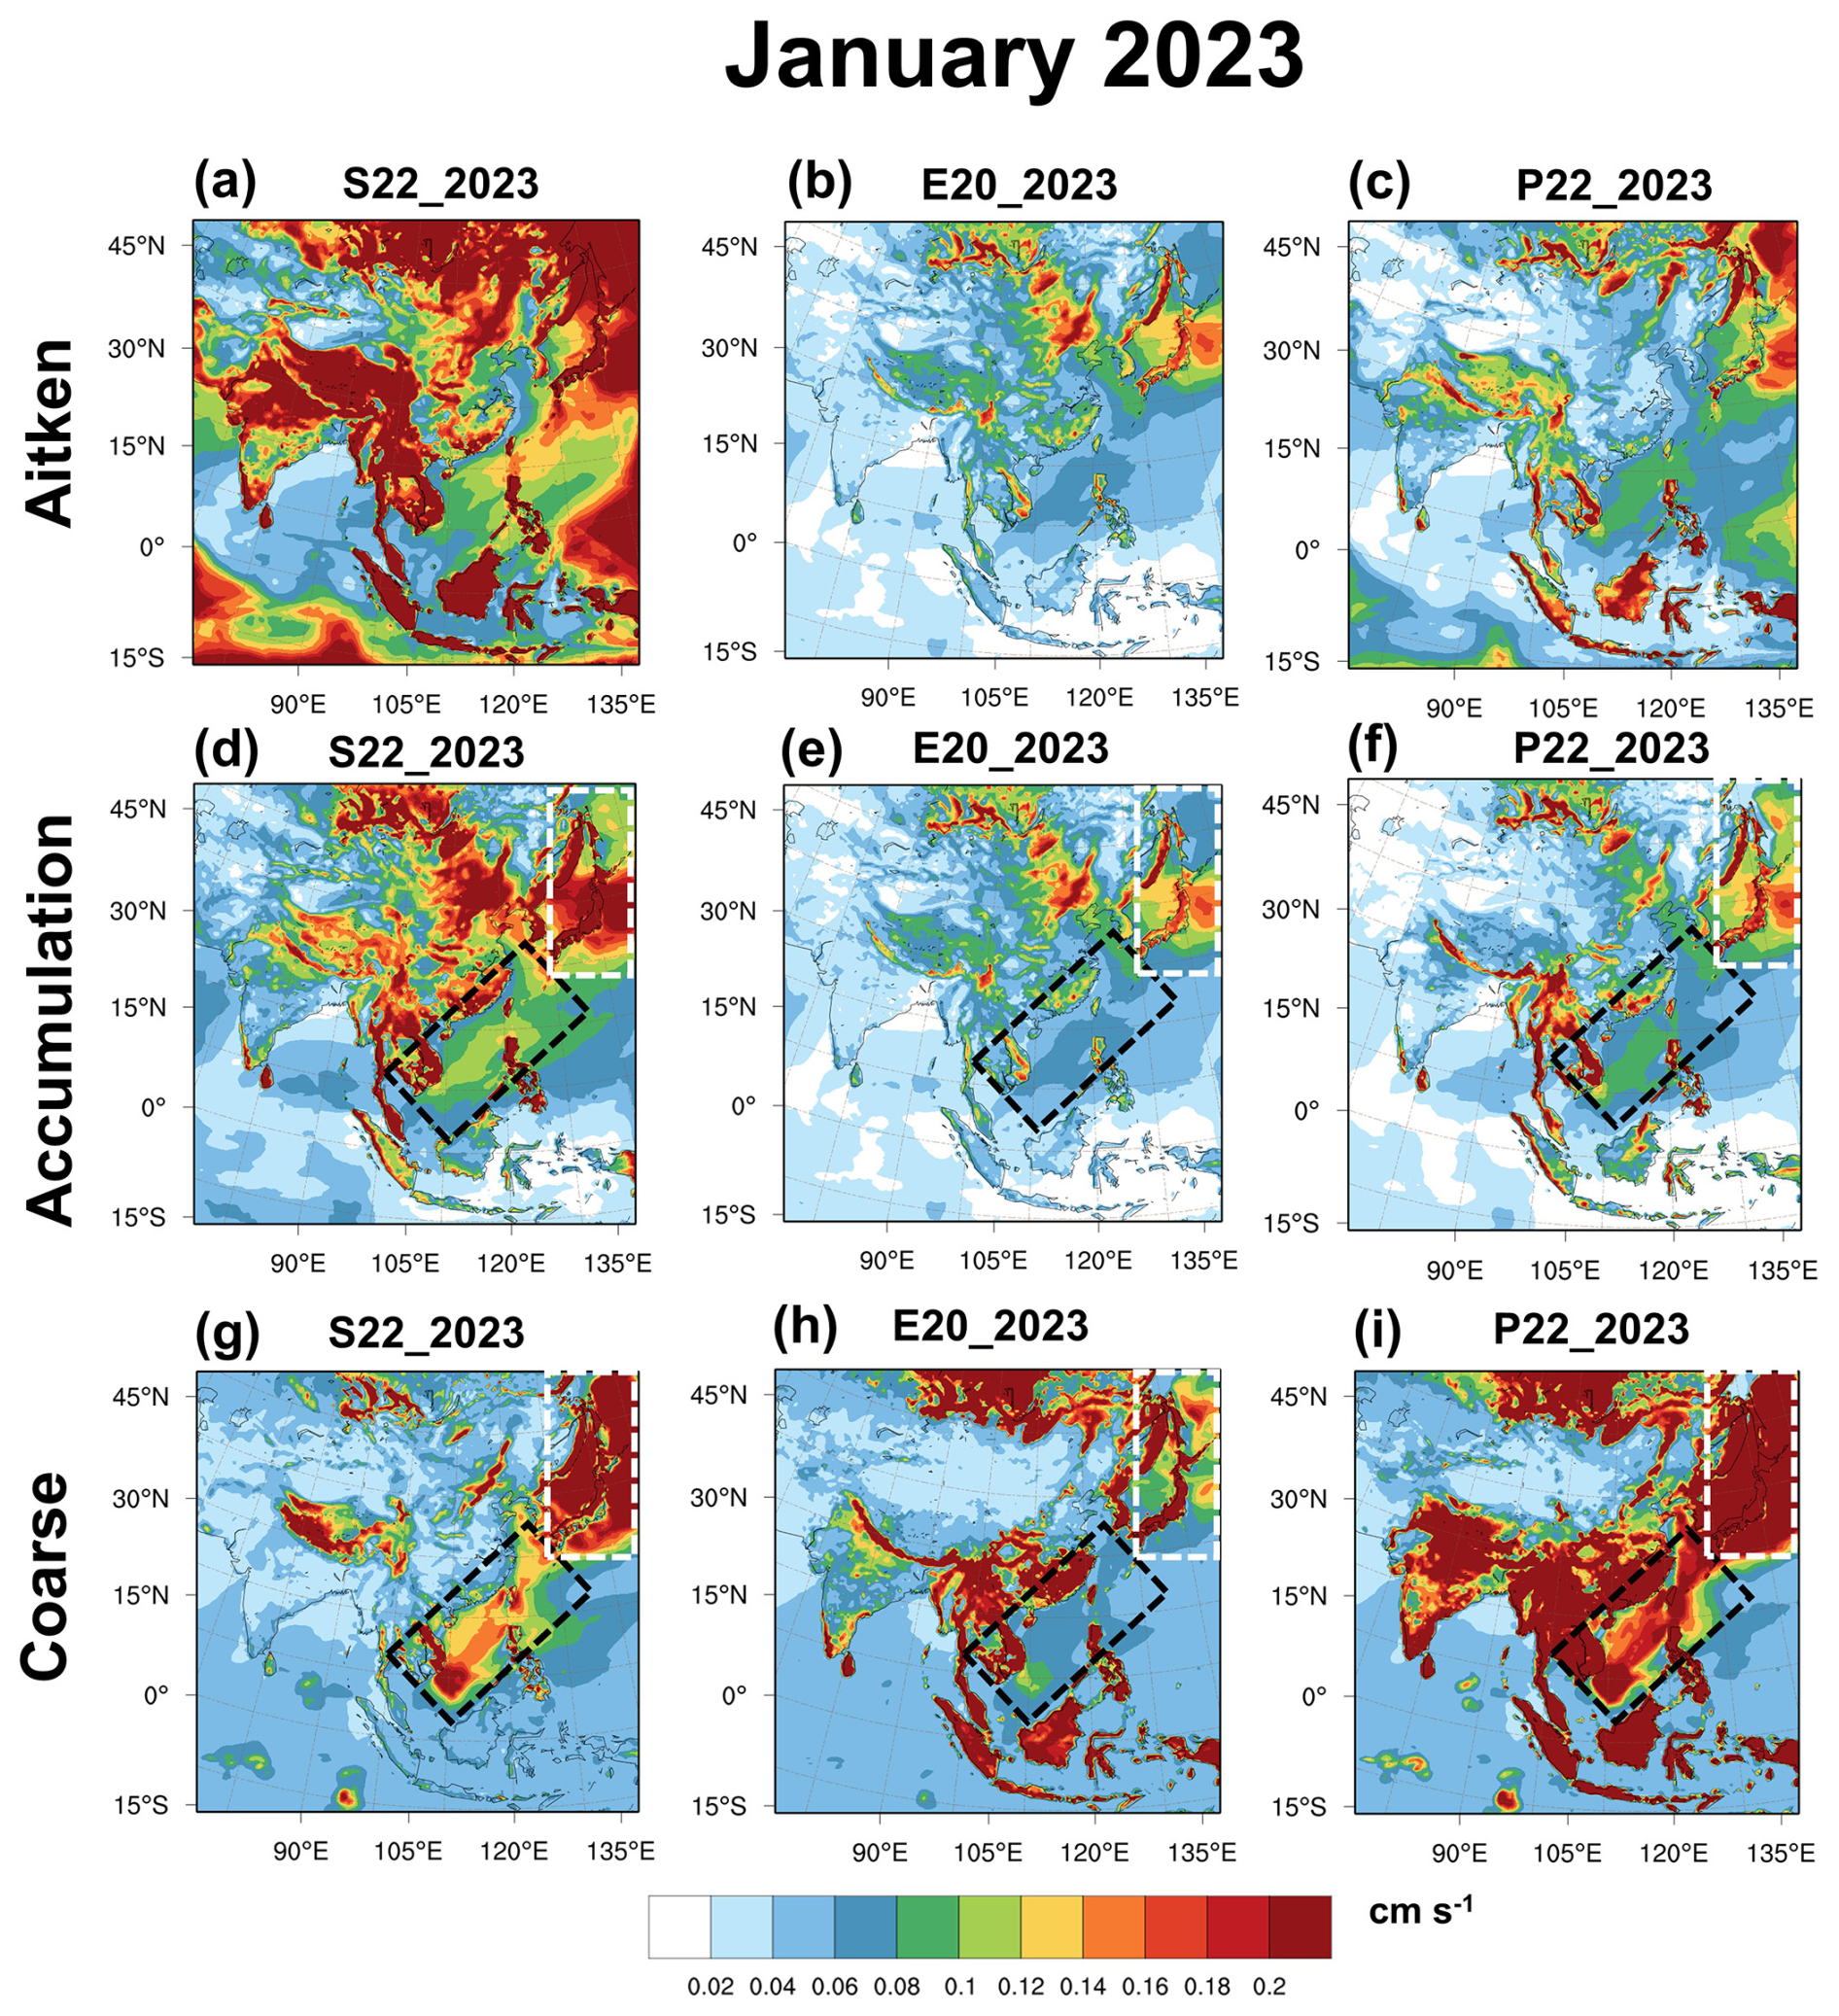
Figure 8The CMAQ-estimated 10 d averages (22–31 January 2023) for the (a–c) Aitken, (d–f) accumulation, and (g–i) coarse particle modes for (a, d, g) S22, (b, e, h) E20, and (c, f, i) P22 dry deposition schemes. The dashed rectangular white lines indicate the region across northwest China, while the dashed rectangular black lines indicate the marine boundary layer over the western Pacific.
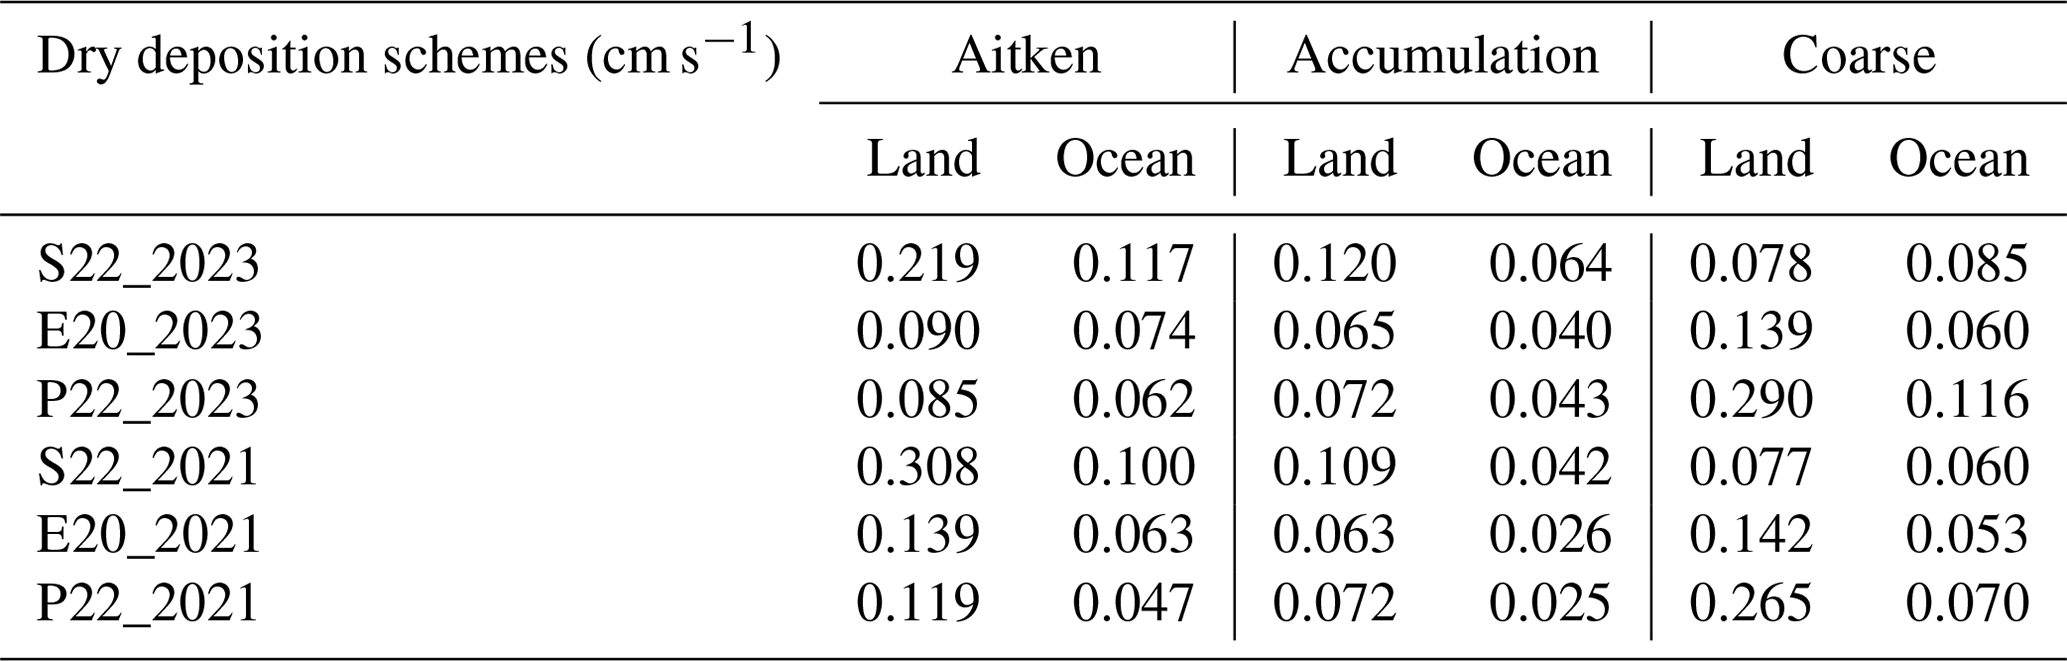
Table 6Average deposition velocity in January 2023 (S22_2023, E20_2023, and P22_2023) and spring 2021 (S22_2021, E20_2021, and P22_2021) for Aitken, accumulation, and coarse modes over land and the ocean boundary layer, respectively.
To better understand the behavior of the Vd during the 40 d simulation of spring 2021 corresponding to the aerosol simulation, we visualized the CMAQ averaged particle modes for the S22_2023, E20_2023, and P22_2023 dry deposition schemes (Fig. 9). The Vd of the coarse-mode particles for E20_2021 was the lowest among the others over the ocean area, which shows similarity to E20_2023 (Fig. 9g, h, i). As mentioned by Kong et al. (2024), one of the continuous EAD episodes was related to the typhoon. The strong wind speed and extreme precipitation due to the intense anticyclonic system caused nearly zero dust simulation. In S22_2021 (0.060 cm s−1) and P22_2021 (0.070 cm s−1), the model suggested high coarse-mode Vd at the western Pacific Ocean. In E20_2021, the Vd (0.053 cm s−1) was lower than the rest of the dry deposition mechanisms, particularly in the area affected by the typhoon (dashed rectangular black box). This means that the E20 dry deposition has reduced the uncertainty of the excessive dust loss at the marine boundary layer. Figure 6g, h, and i show more simulated mineral dust over the western Pacific for E20 than S22 and P22 during the spring of 2021.
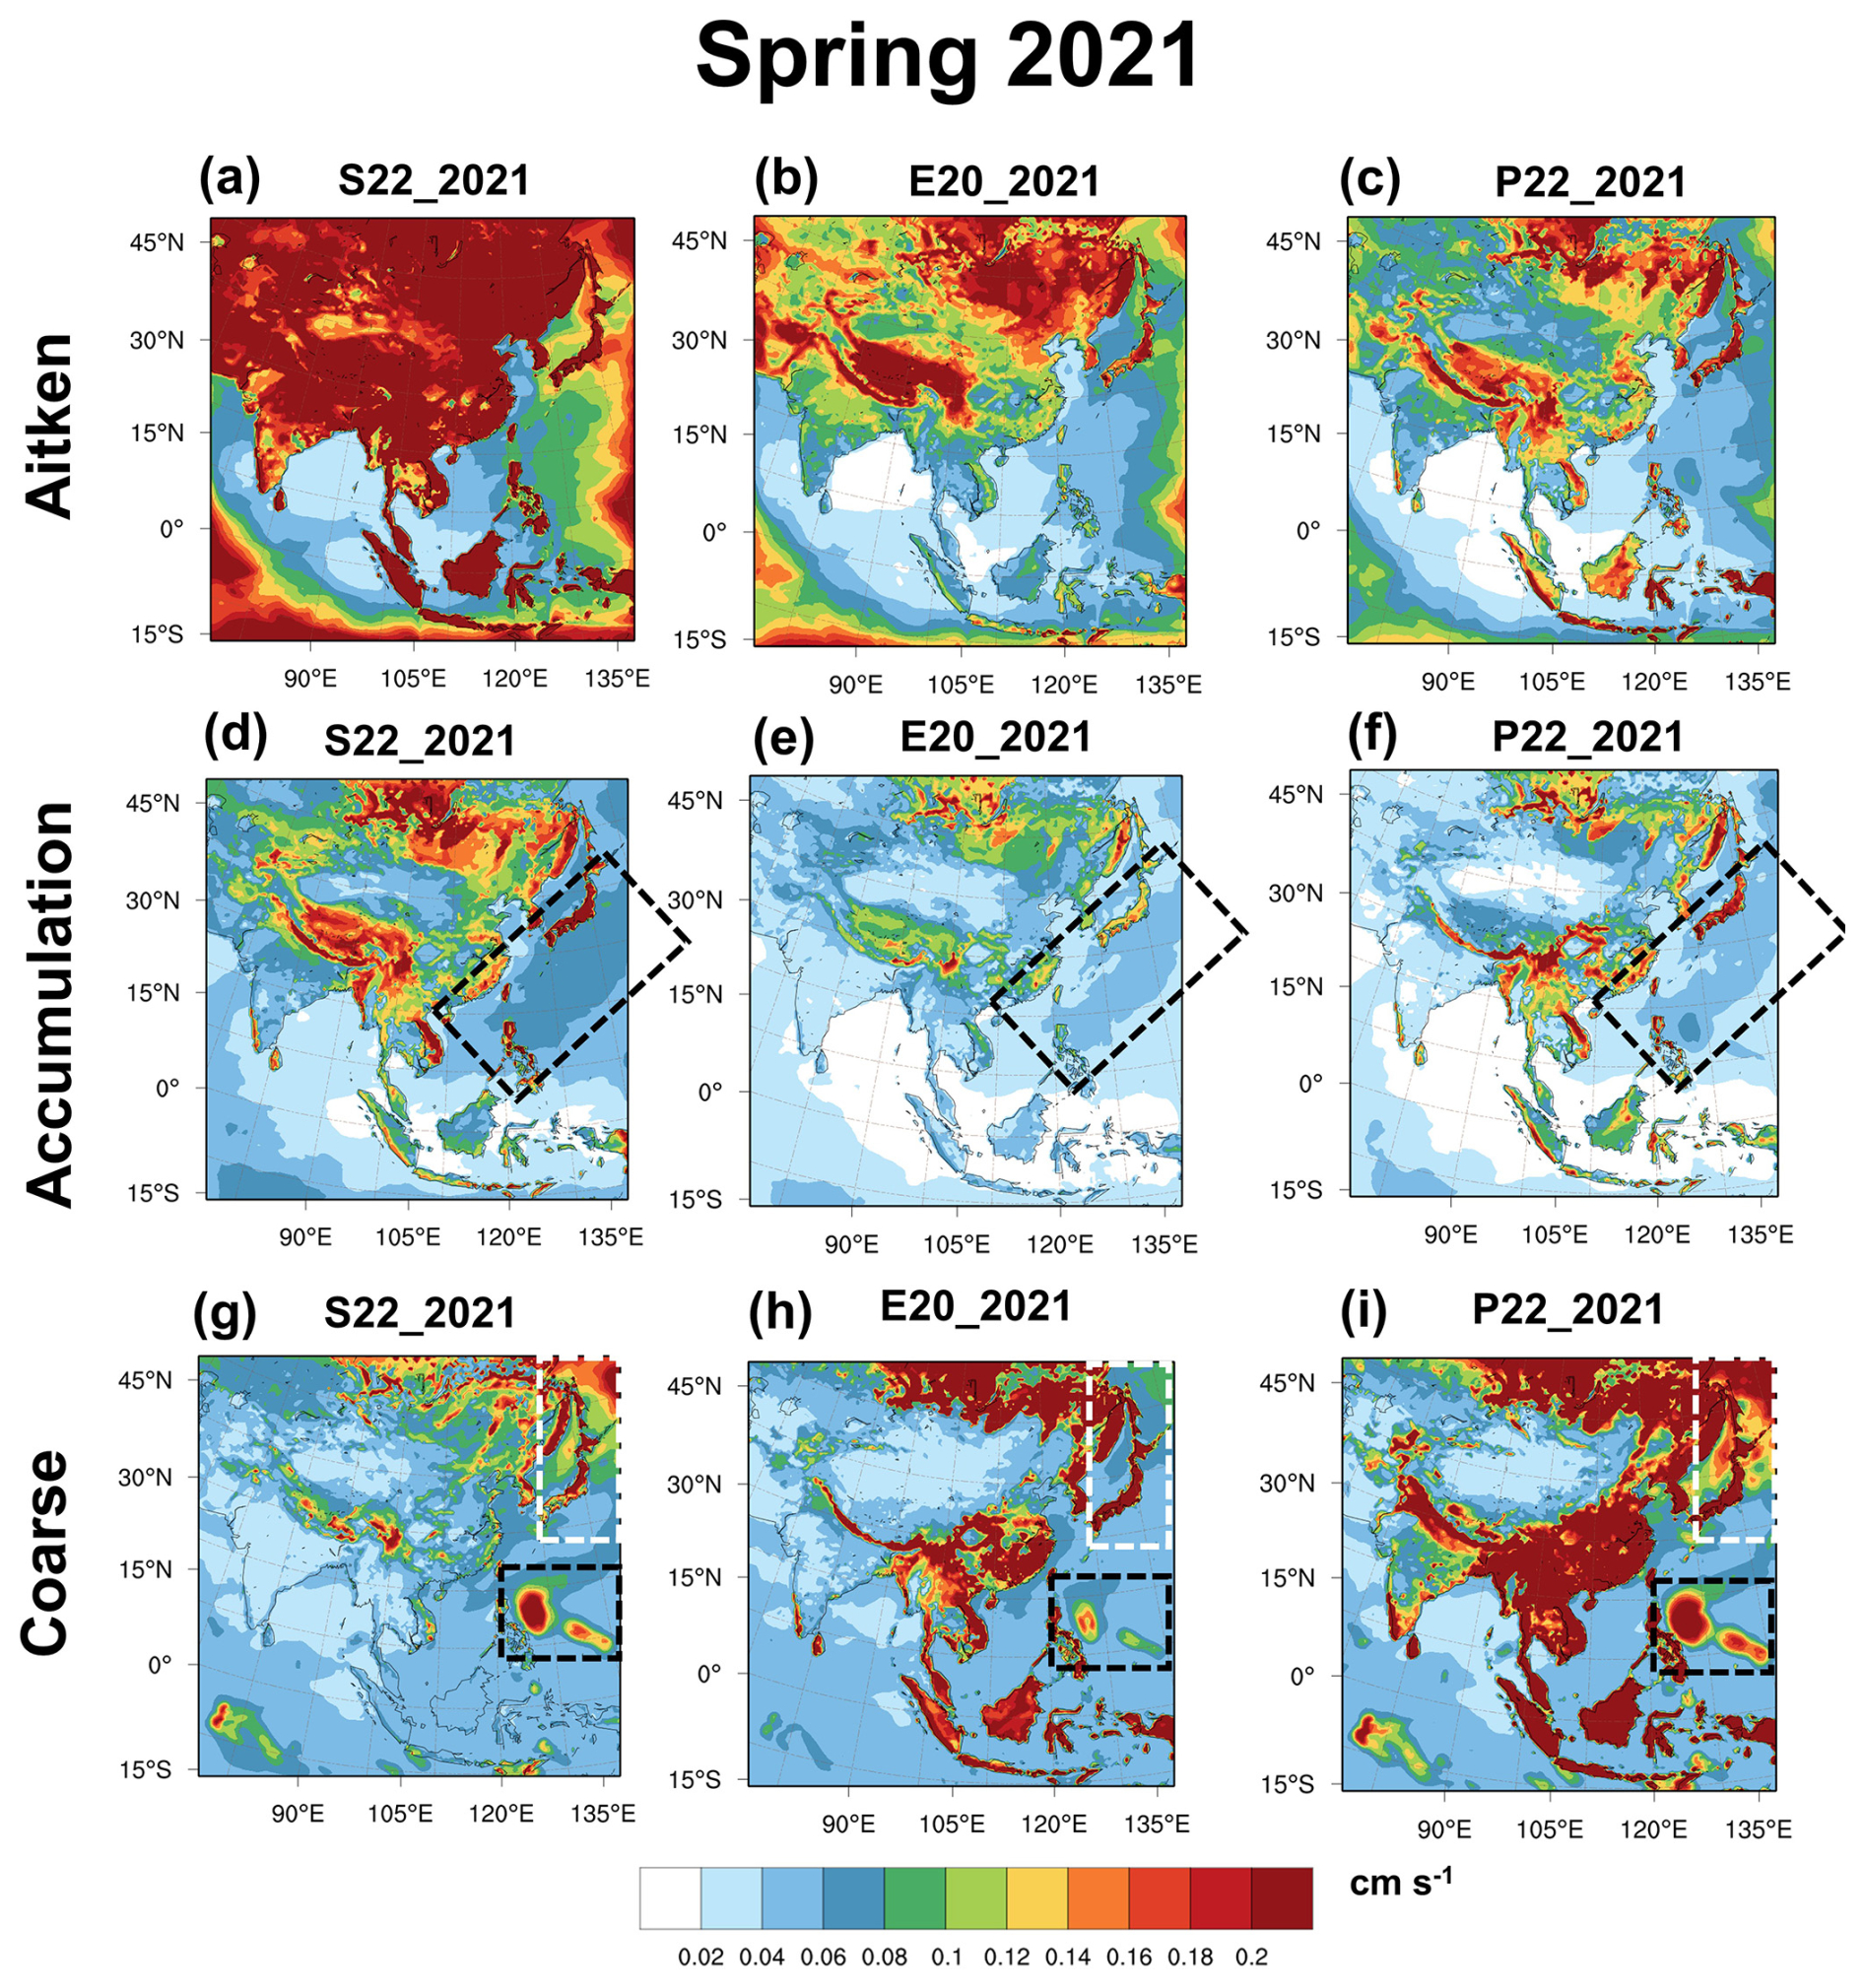
Figure 9The CMAQ-estimated 40 d averages (12 March–20 April 2021) for the (a–c) Aitken, (d–f) accumulation, and (g–i) coarse particle modes for (a, d, g) S22, (b, e, h) E20, and (c, f, i) P22 dry deposition schemes. The dashed rectangular white lines indicate the region across northwest China, while the dashed rectangular black lines indicate the marine boundary layer over the western Pacific.
3.4 The CMAQ synoptic pattern of dust and black carbon at the upper level
Black carbon (BC), often known as elemental carbon, released from biofuels, fossil fuels, and biomass burning, has been proven to impact the radiative budget and regional climate (Ramanthan and Carmicheal, 2008; Pani et al., 2016, 2020). In the meantime, China has been a significant contributor to global anthropogenic BC emissions, particularly in the cities of the northern part (Xiao et al., 2023; Wang et al., 2024). During the severe dust episodes in the spring of 2023, the contribution of black carbon brought by EAD was captured in North China (Wang et al., 2024). As depicted in Fig. 2, the transboundary episode observed in the upper level of Taiwan during this event could be the mixing of natural dust and anthropogenic haze episodes, which demonstrates this consistency. Additionally, blending mineral dust with anthropogenic transport due to the northeasterly wind, a wind that blows from the northeast, has been a subject of extensive discussion (Lin et al., 2007, 2012). During the EAD, the dust from the Gobi Desert that was transported towards the western Pacific region could also carry anthropogenic aerosols, contributing to different levels of pollutant concentration. However, the distinct transport pathway at high altitude between both aerosol types is a topic that has received less attention, despite its significant importance to our understanding of atmospheric dynamics.
Figure 10 illustrates mineral dust and BC concentrations' spatial and temporal distribution under the CMAQ_dust_E20 scenario at 700 hPa from 24–31 January. The model reveals a high proportion of modeled dust aerosols (dashed red circle) at the source region, indicating an uplift from the surface to 700 hPa (Fig. 10a). This uplift, driven by the strong pressure gradient at the surface and the eastward-moving trough system at the upper level (700 hPa), is a key factor in the eastward and southward transfer of the dust (Fig. 10b). The high dust fraction reappears at the source region (Fig. 10c) and is transported eastwardly by the same upper-level trough (Fig. 10d), causing a long dust belt at 15° N, distributing over the Central Asian continent, Taiwan Straits, Taiwan, and a large part of the western Pacific Ocean. (Fig. 10e). On 29 January, the model of E20 clearly predicted that the dust plume moved in the southward direction toward the South China Sea (Fig. 10f). The dust aerosols were left distributed at a certain part of the northern South China Sea and the Philippine Sea until they totally dissipated (Fig. 10g, h). This interesting result suggests the possible EAD at a longer distance at the upper level, which is a topic for further investigation.
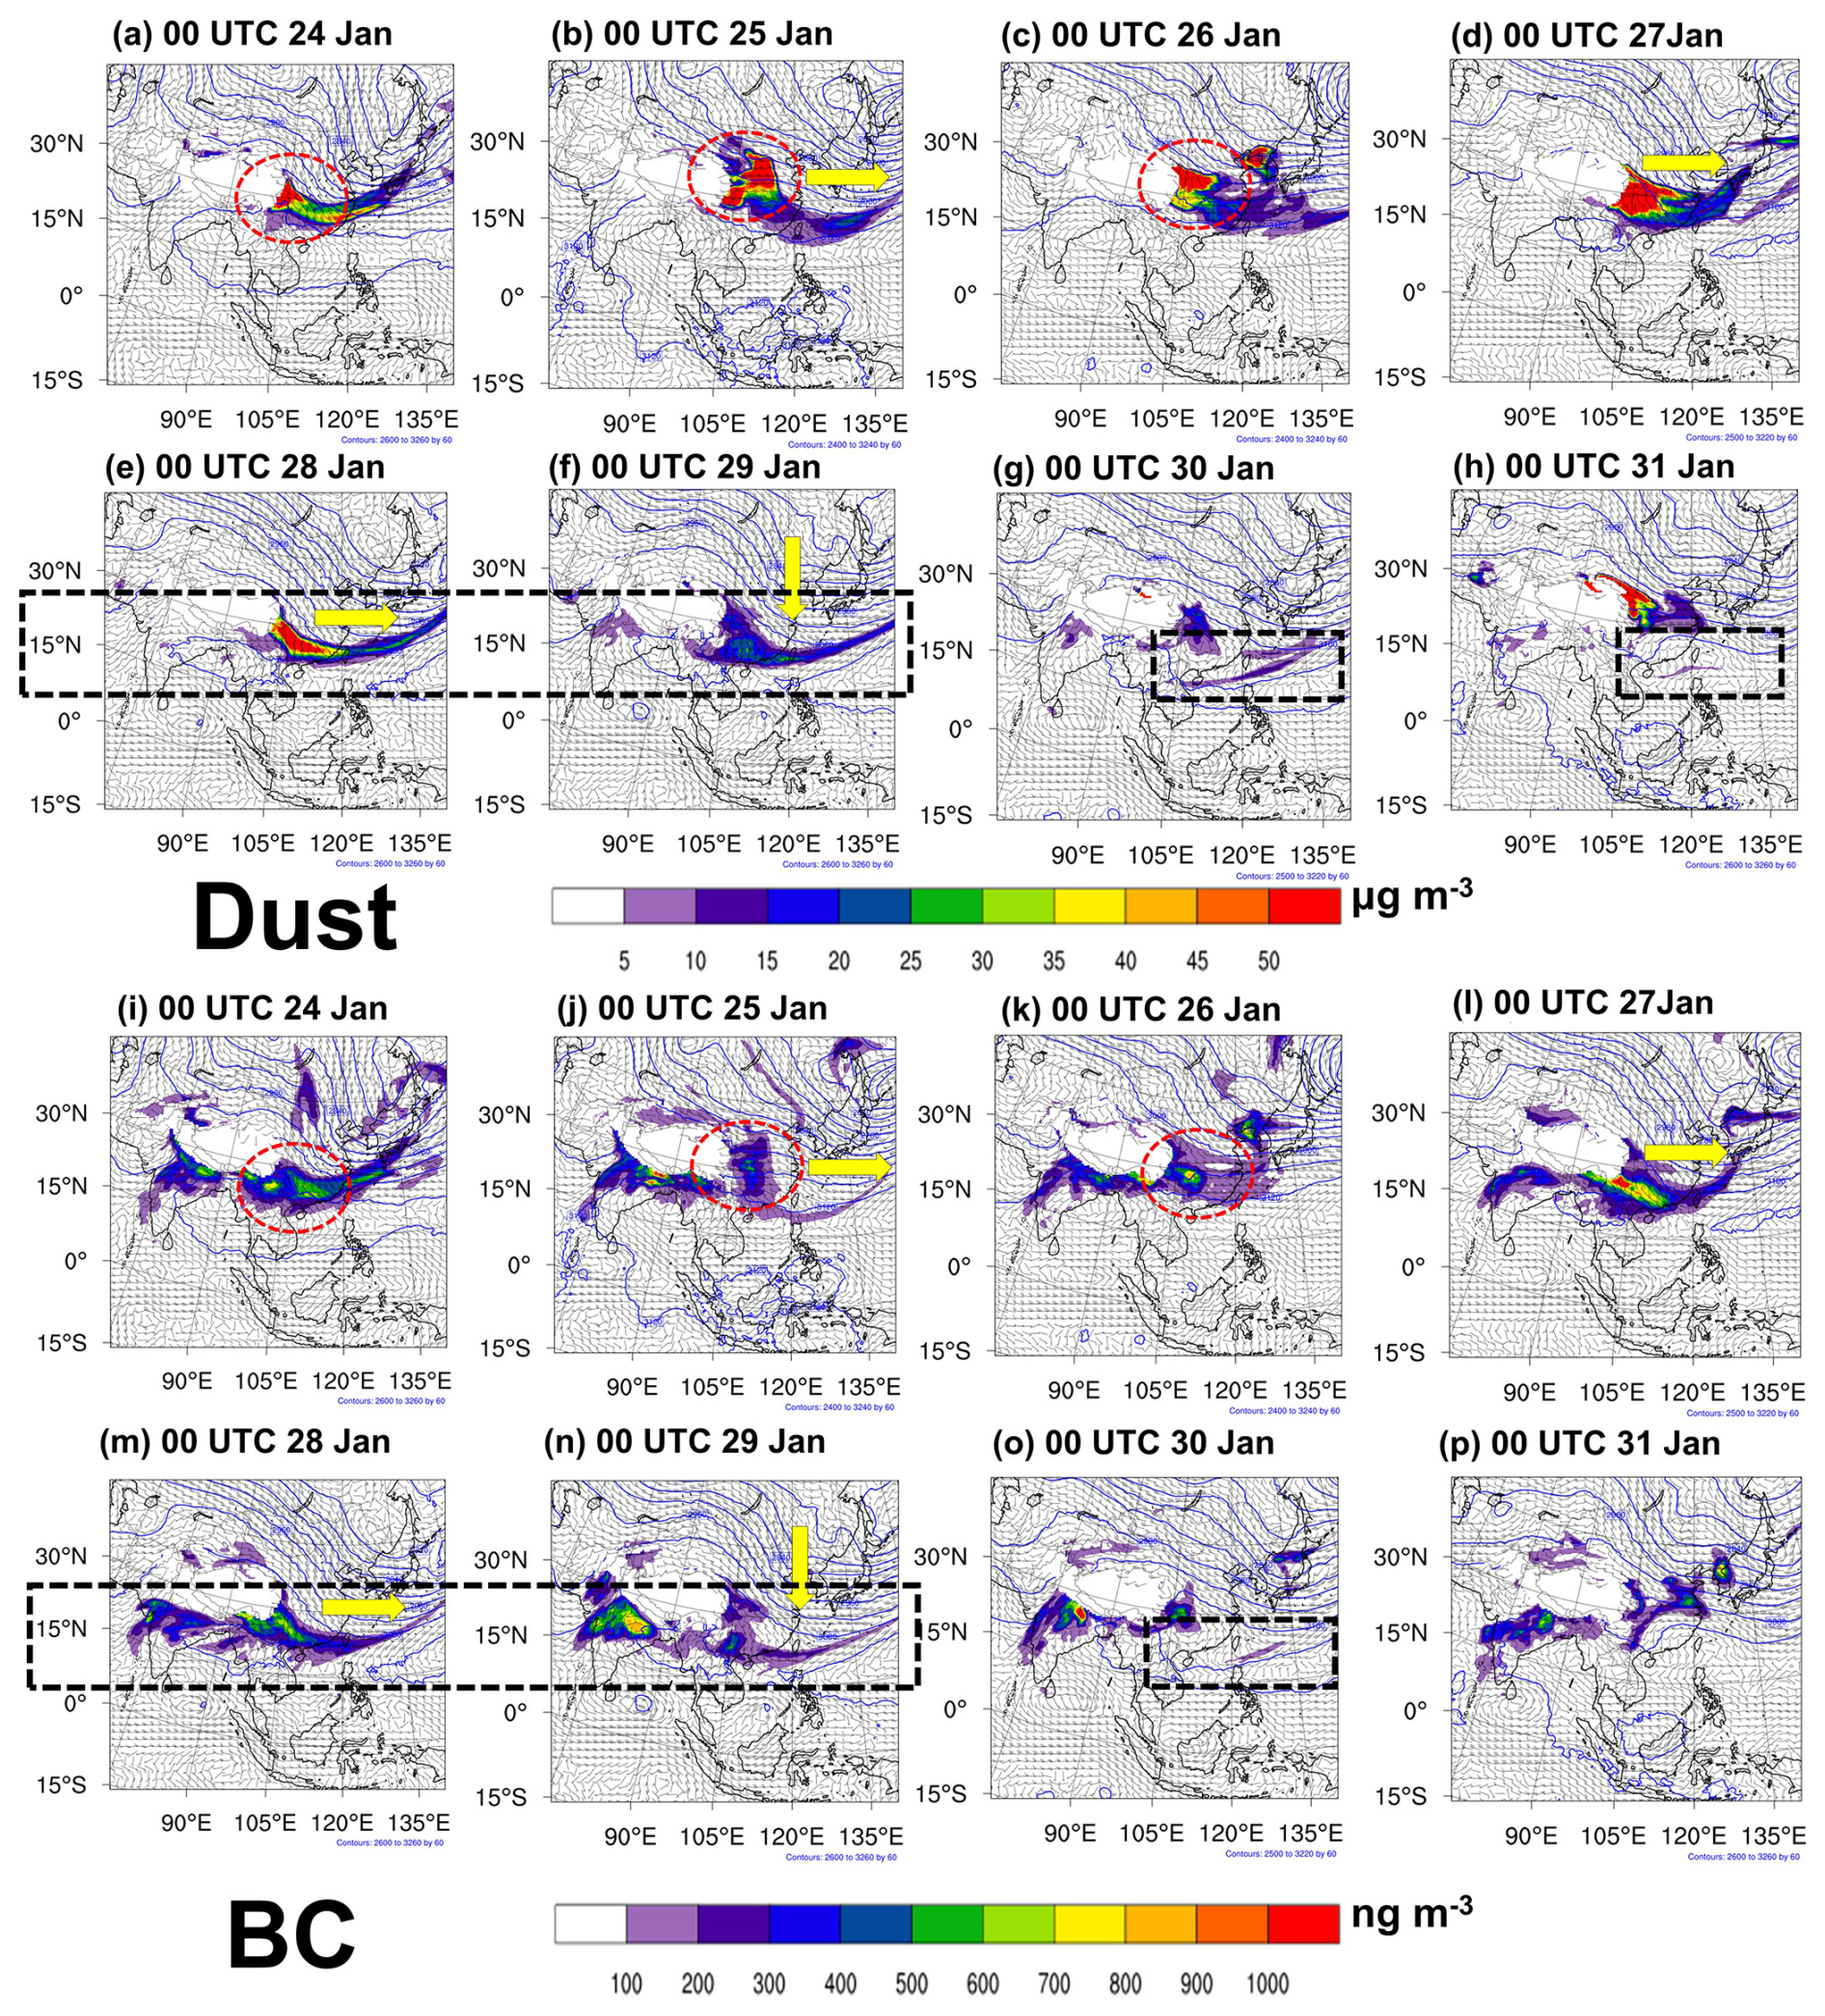
Figure 10CMAQ_dust_E20 simulated mineral dust (a–h) and BC aerosol concentrations (i–p) at 700 hPa at 12:00 UTC during 24–31 January 2023. The yellow arrows highlight the trough moving direction. The dashed rectangular black box highlights the aerosol belt.
The southward high-pressure system responsible for the long-range-transport haze episode has been widely discussed (Chuang et al., 2008; Kong et al., 2021); however, the upper-level transboundary transport needs to be addressed further. While focusing on CMAQ_dust_E20, we attempted to characterize the long-range transport of modeled black carbon at the upper level (700 hPa) (Fig. 10i–p). As shown in Fig. 10i, the modeled black carbon concentration was significantly concentrated over central China. The black carbon transport pattern followed the eastward-moving trough system as the plume moved eastward and southward (Fig. 10m, n). Interestingly, the long black carbon belt is consistent with the long dust belt, as shown in Fig. 10e and f. For instance, both modeled dust and BC were distributed over the western Pacific Ocean (Fig. 10e, f, m, n) and South China Sea (Fig. 10g, o). This means that the BC from anthropogenic emissions and the natural EAD shared a similar transport pattern at the upper level, driven by the trough system. Such consistency has been verified by the MERRA-2 dust and BC mass column over the region (dashed rectangular red lines in Fig. S4).
The dust aerosol vertical profiles (Fig. 11) show a significant distribution of the large dust fraction over the Asian continent under all simulation scenarios (Fig. 11a1–e1), as indicated by the transect drawn in Fig. 1. The westerly winds, depicted in Fig. 10, facilitated the eastward transport of the aerosol plume towards the western Pacific Ocean, where it accumulated along the 700 hPa altitude. Another plume was observed across the ocean on the east side of Taiwan Island (Fig. 11b1). On 27 January, there was another substantial fraction of dust covering the Asian continent and the western Pacific Ocean, with significantly higher dust concentrations compared to Fig. 11a1. The plume that was distributed eastward exhibited a clear dust dome (Fig. 11a5–e5). These findings have important implications for understanding and predicting dust aerosol transport patterns and their potential environmental impact.
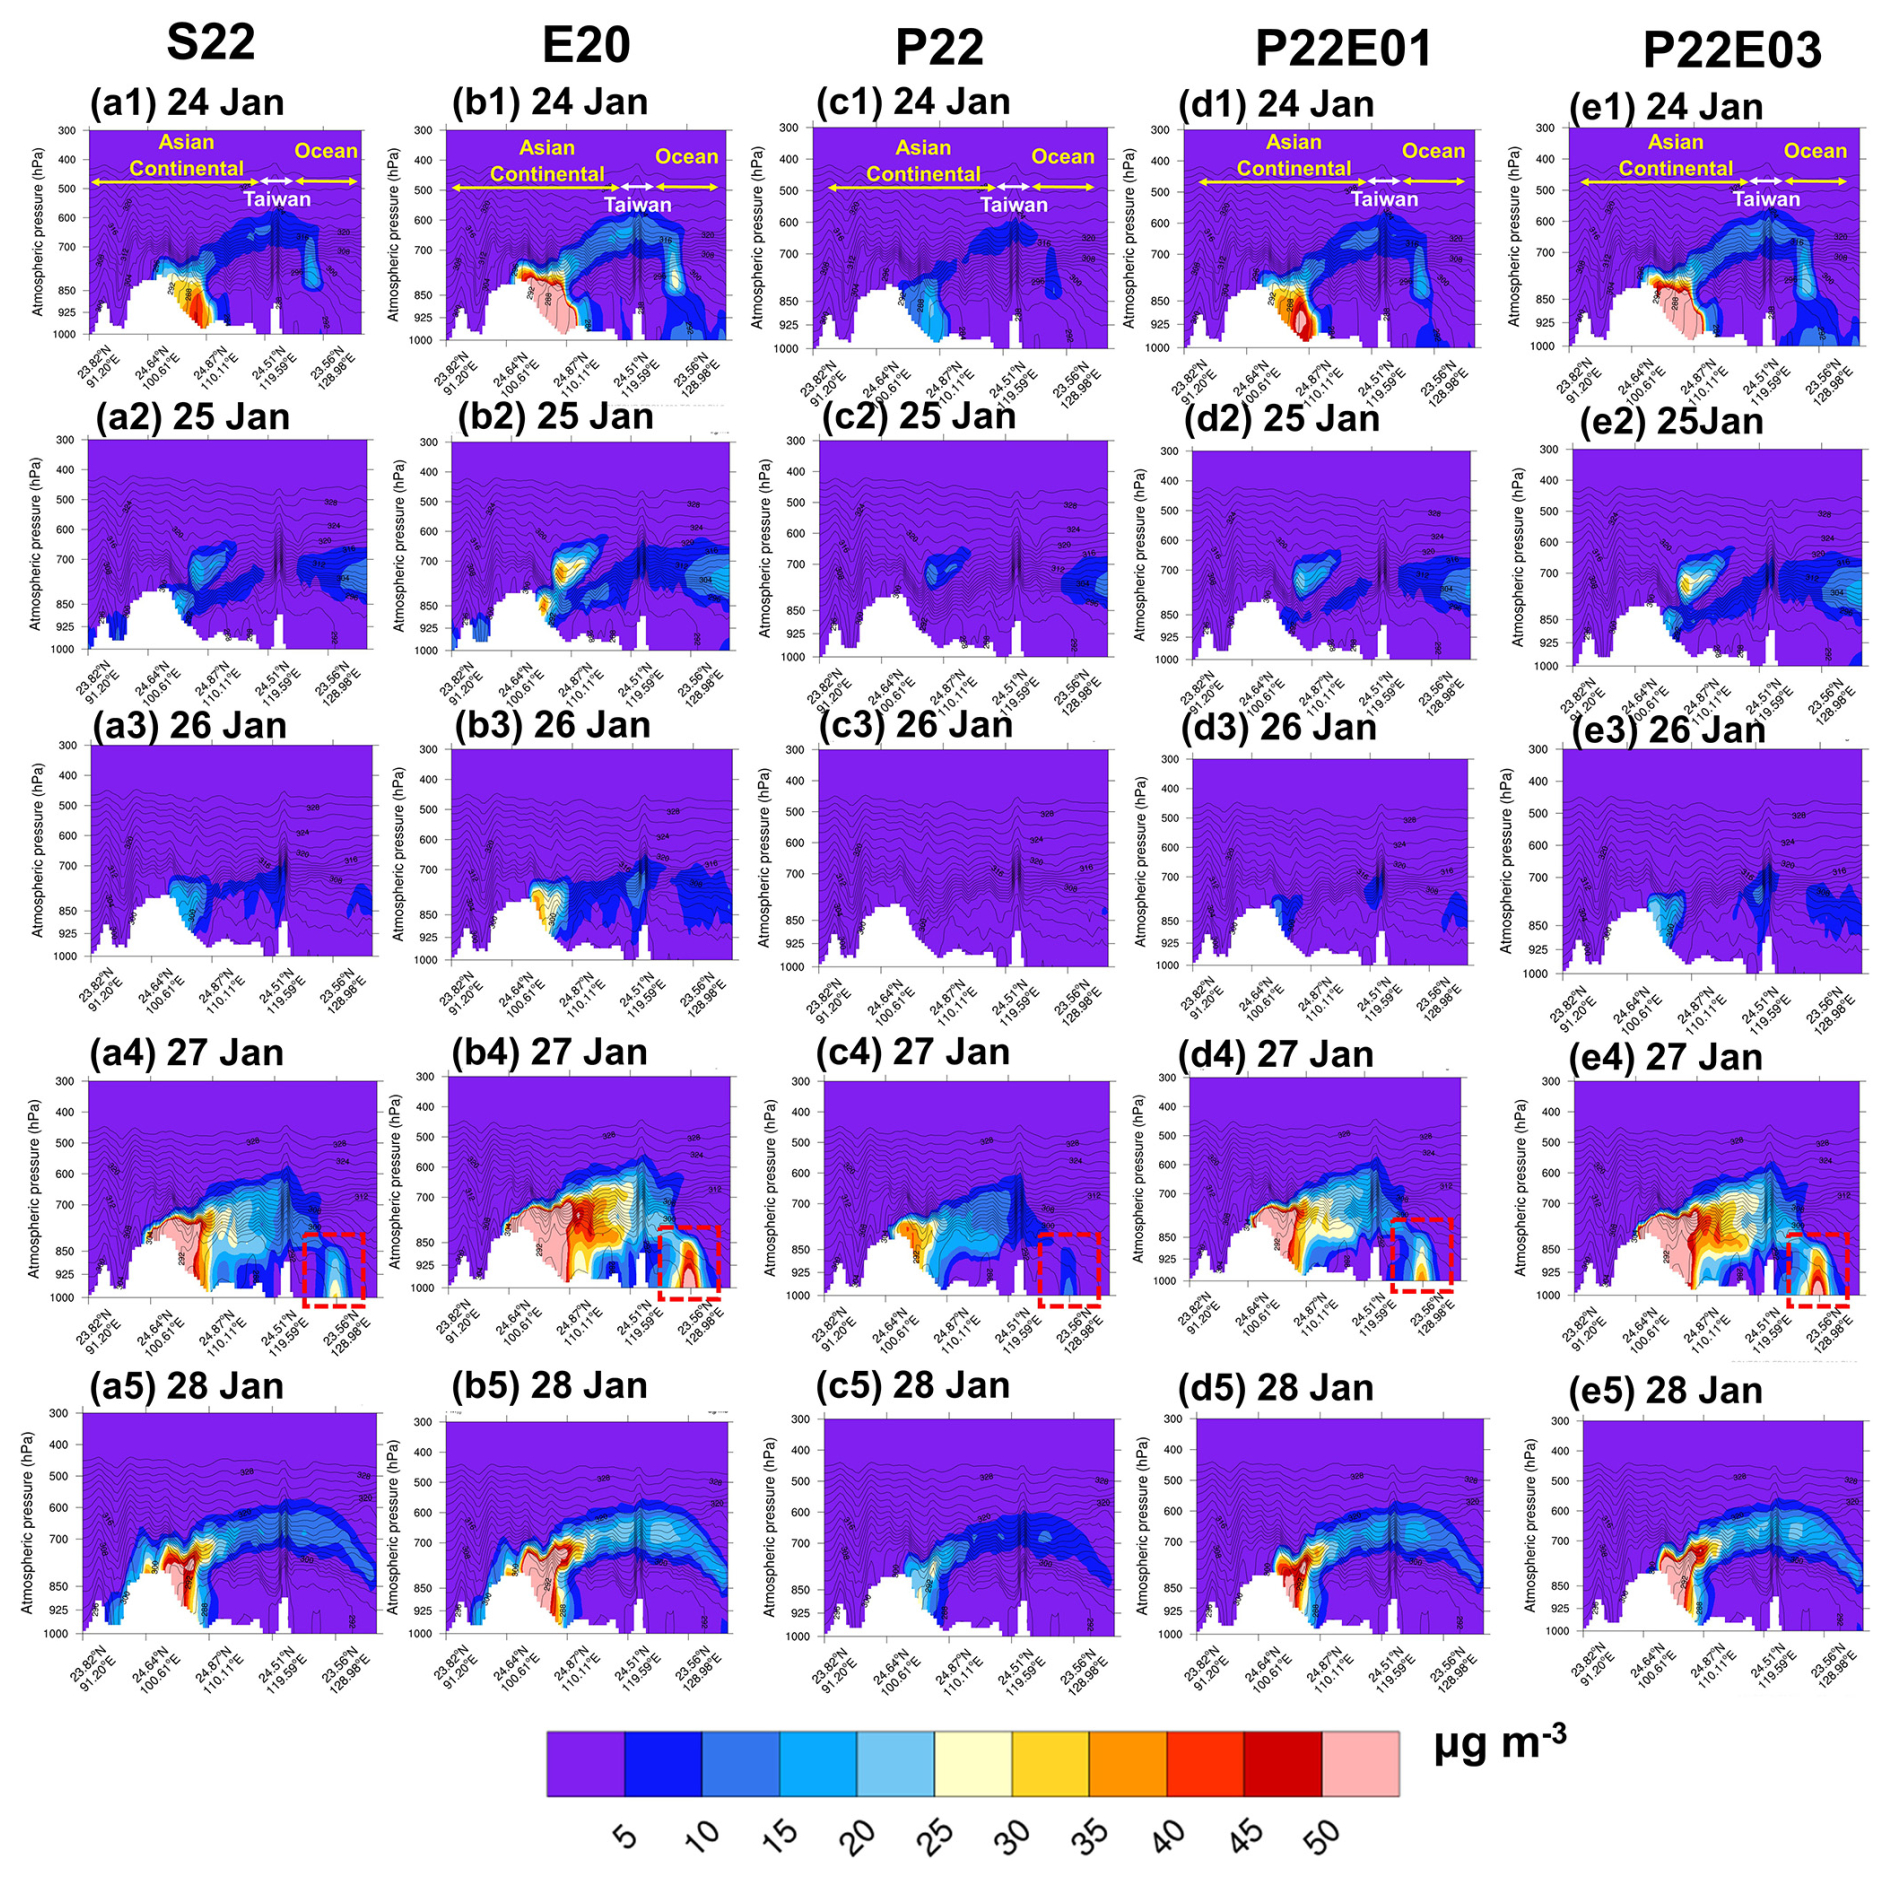
Figure 11Vertical cross section of the simulated dust aerosol for the CMAQ_DUST (S22, E20, P22, P22E01, and P22E03) at 12:00 UTC during 24–28 January 2023.
The vertical profile of the modeled BC mirrors the transport pattern of mineral dust, as shown in Fig. 12. A transparent BC dome was distributed along 700 hPa, echoing the pattern observed for dust. This simulation suggests the consistency of the “double dome” mechanism of Asian dust and biomass burning episodes (Dong et al., 2018; Huang et al., 2019). The potential warming effect of such a mechanism is a topic ripe for future studies. However, it is important to note that the dust dome contains a higher concentration fraction than the black carbon dome. The present simulation suggests that dust aerosols can reach up to 500 hPa, which is consistent with Kong et al. (2021). On the other hand, the black carbon plume was slightly lower, with approximately 600 hPa as the maximum height under the same meteorological conditions. This section, which discusses the similarity and distinctiveness of natural dust and anthropogenic aerosols at the upper level, highlights the need for further study. The present simulation did not consider the two-way coupling model, which is strongly suggested for future research.
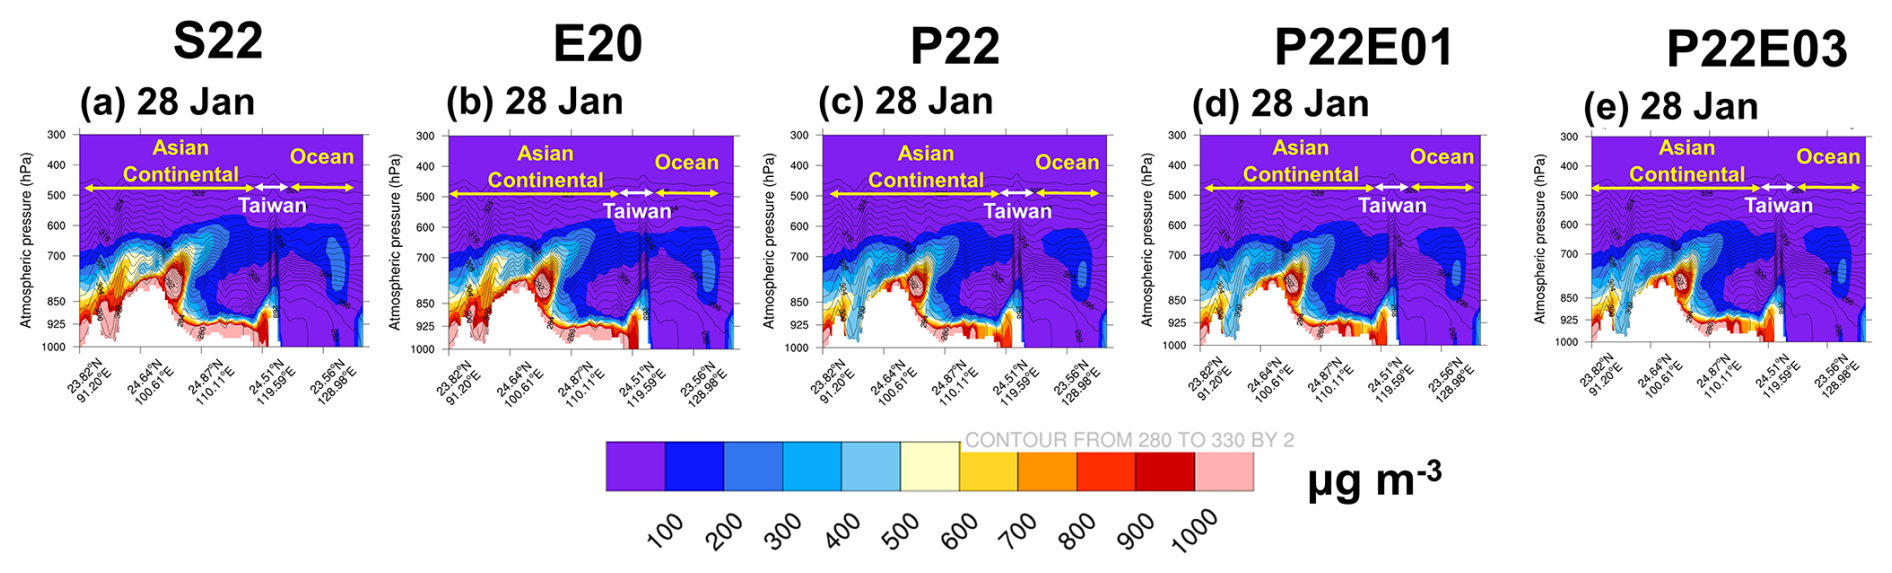
Figure 12Vertical cross section of the simulated BC aerosol for the CMAQ_DUST (S22, E20, P22, P22E01, and P22E03) at 00:00 UTC during 28 January 2023.
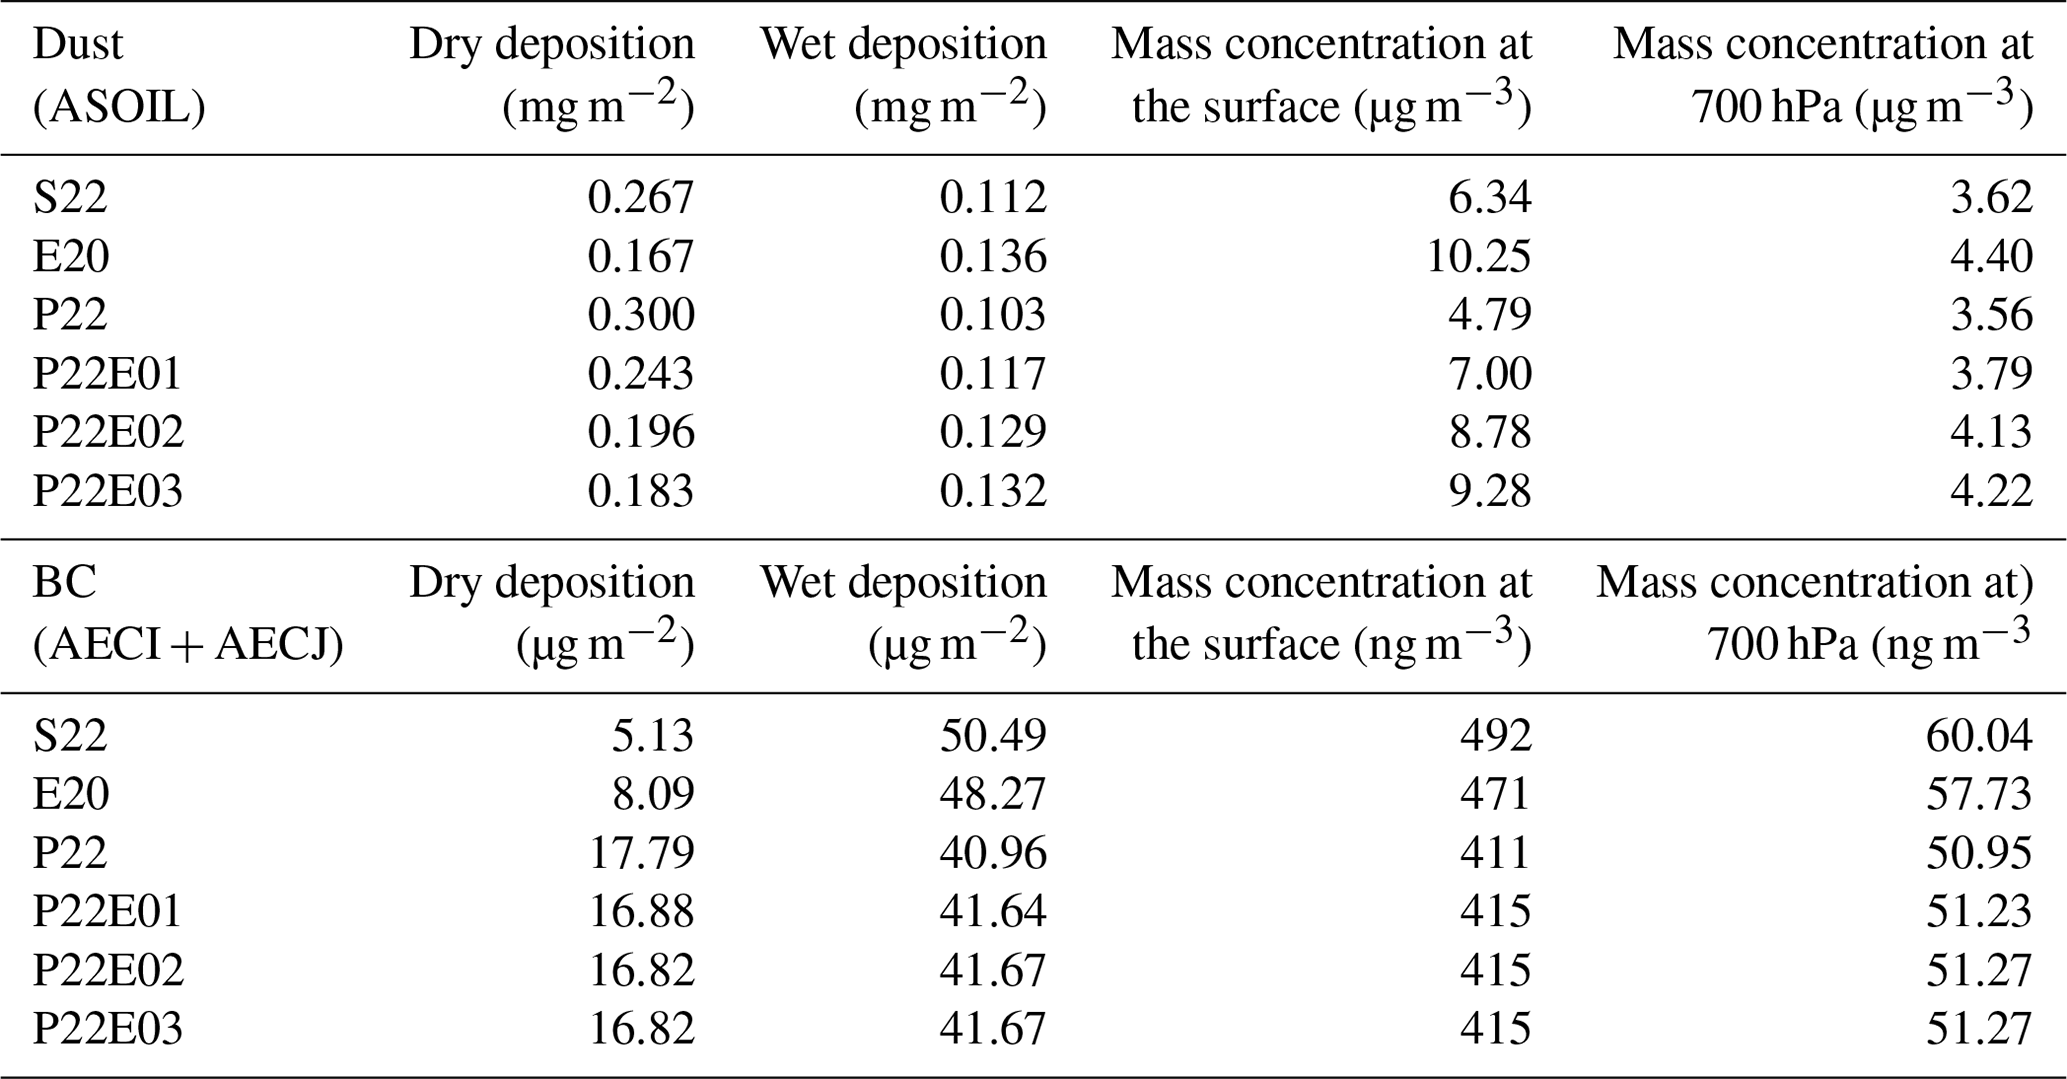
Table 7 shows the modeled deposition and mass concentration for different simulation scenarios in January 2023. The simulation of the wet deposition and mass concentration for dust aerosols was the highest by E20. This is consistent with the globally averaged aerosol number concentrations over the ocean for the large-sized particles (Emerson et al., 2020). By contrast, P22 was the lowest in simulated wet deposition and mass concentration. P22 could increase the accumulation mode's Vd and reduce the PM2.5 over CONUS, which is similar to the present result (Pleim et al., 2022). Moreover, the present simulation by P22 showed the highest Vd of the coarse mode, which leads to less simulated PM10. P22 revised the impaction collection efficiency, which is the parameterization of Rb. In order to understand the sensitivity of Rb on the CMAQ simulation, Rb has been scaled up, as shown in Table 3. Generally, the increment of Rb has gradually increased the wet deposition (surface mass concentration) by 13.6 (45.8) %, 25.2 (83.3) %, and 28.2 (93.7) % under P22E01, P22E02, and P22E03, respectively. In addition, the increment intensity at the surface was higher than at the upper level. The simulated dust at the western Pacific Ocean responding to the different dry deposition schemes is shown during 27 January in Fig. 11 (dashed rectangular red box). As Rb increased by P22E01 and P22E03, the simulated PM10 by base scheme P22 (∼ 30 µg m−3) increased to ∼ 40 and ∼ 50 µg m−3, respectively. It is worth noting that P22E03 simulated a similar dust concentration as E20, indicating the importance of revising the Rb. On the contrary, the wet deposition and mass concentration were most significant for modeled BC under the S22 dry deposition scheme (Table 7). P22E01 only showed a minor increment, but it was nearly identical for P22E02 and P22E03 compared to P22.
Table 7Model-averaged dry and wet deposition as well as mass concentration for dust and BC aerosols in January 2023 (10 d averaged) for different simulation scenarios.
The chemical transport model is considered sensitive to the dry deposition parameterization in addition to the dust emission treatment. The present study demonstrates the impact of the dry deposition parameterizations (S22, E20, and P22) on aerosol performance in East Asia. It provides a significant analysis of the transboundary transport of East Asian dust to Taiwan from a 22–31 January 2023 case study and multiple heavy dust storm episodes from 12 March–20 April 2021. Incorporating the latest dust emission treatment (Kong et al., 2024) into the CMAQ slightly improved the model performance to −47.01 % from −52.81 %. By implementing the E20 dry deposition scheme, characterized by calibrating the collection efficiency by Brownian diffusion and interception, the CMAQ simulation of the surface PM10 has been improved by an NMB of −41.9 %, as compared to the dry deposition proposed by P22 (−53.90 %). Moreover, the modeled PM10 pattern by E20 at the upper level (700 hPa) was mainly consistent with the observed PM10, especially in capturing the peak value. The dry deposition of E20 correlated well with the high-altitude in situ observations by 0.55, as compared to S22 (0.54) and P22 (0.46). By contrast, simulated surface PM2.5 by S22 has been improved to −8.84 % from −12.63 % after using the latest dust treatment and showed slightly better performance than E20 (−10.65 %) and P22 (−15.22 %). Additionally, the simulations of the multiple dust episodes in spring 2021 were re-constructed to evaluate the CMAQ performance over the Asian continent. The E20 dry deposition scheme outperformed the others, with the lowest NMB value in simulating PM10 (−25.4 %) and AOD (−26.2 %). For the modeled PM2.5, S22 performed slightly better than E20, with an NMB of −36.29 % and −37.5 %, respectively.
The previous version of the CMAQ model, modulated by Kong et al. (2021, 2024), showed excessive deposition at the marine boundary layer, leading to an underestimation of the modeled surface PM10. However, using the E20 scheme over the entire model domain, our updated model has the lowest Vd. This precise reduction of Vd of the coarse-mode particle, responsible for reducing the PM10 simulation underestimation, has not just minimized but has effectively minimized the total loss of aerosols to the surface, leading to a concentration increment. Furthermore, the low-lying modeled Vd across the water surface by E20 could be crucial in reducing the excessive aerosol deposition over the ocean layer.
It is worth revealing that the transboundary transport of EAD from the Asian continent towards the western Pacific Ocean at the upper level was associated with the eastward-moving trough system. Such transport mechanisms have been found to bring along black carbon aerosols, which are primarily the main element of China's human-made emissions. More interestingly, both aerosol profiles created a “long dust–black carbon belt” along the 15° N. The “double dome mechanism”, a concept proposed by Huang et al. (2019) that depicts the superposition of the two aerosol types, was also simulated in the present study. Besides the similarity of both, the discrepancy in the case of the aerosol deposition and mass concentration was shown. By comparing the base P22 scheme to the revised scheme (P22E01–P22E03), the dust aerosols increased significantly but marginally for black carbon. This study highlights the importance of dry deposition schemes for the modeled dust and black carbon concentration and provides a reference for better dry deposition schemes in CTMs over East Asia.
We noted that the improved model simulation for EAD relies on dust emission, dust deposition, and transport processes. The dust emission treatment proven to be sensitive to the CMAQ model performance in East Asia (Dong et al., 2018; Liu et al., 2021; Kong et al., 2024). In addition, the CTM performance can be attributed to the dust emission schemes and the dry deposition schemes (Zeng et al., 2020). In other words, different dust emission schemes may impact the Vd and dust loading, which react differently to model performance. The present research, which is a complex examination, is of significant importance, as it primarily focuses on determining which dry deposition scheme best improves the most recent updated dust emission model. Therefore, the sensitivity of the dust emission parameterizations or approaches, including surface roughness, land surface, soil texture, and types, to the dry deposition scheme underscores the need for a comprehensive understanding and is proposed for future studies.
Finally, it is necessary to point out that the dry deposition on the EAD is closely associated with the PM10 concentration (Zhang et al., 2017). Nevertheless, it has been shown that there are other atmospheric processes related to the air quality over the western Pacific, including transboundary haze, biomass burning, and local emissions (Chuang et al., 2020; Ooi et al., 2021; Chang et al., 2023). These complex phenomena could cause variations in PM2.5, ozone, and the corresponding primary pollutants. Hence, the role and response of the dry deposition scheme in the CMAQ should be given attention in the future for a comprehensive understanding and model improvement. This research enhances our understanding of dust emission and dry deposition models and provides valuable insights for improving air quality models, which are crucial for environmental and public health management.
MERRA-2 data are available online through the NASA Goddard Earth Sciences Data Information Services Center (GES DISC; https://disc.gsfc.nasa.gov; Gelaro et al., 2017). MODIS data used in this study are available at http://doi.org/10.5067/MODIS/MOD08_M3.006 (Platnick et al., 2015). The observational data at LABS can be ordered by contacting the corresponding authors.
The supplement related to this article is available online at https://doi.org/10.5194/acp-25-7245-2025-supplement.
SSKK: conceptualization, data curation, formal analysis, investigation, methodology, software, validation, visualization, writing, reviewing, and editing of the paper. JSF: conceptualization, investigation, methodology, formal analysis, writing, reviewing, and editing of the paper. NHL: conceptualization, visualization, supervision, funding acquisition, resources, writing, reviewing, and editing of the paper. GRS: funding acquisition and resources. WSH: data curation and software.
At least one of the (co-)authors is a member of the editorial board of Atmospheric Chemistry and Physics. The peer-review process was guided by an independent editor, and the authors also have no other competing interests to declare.
Publisher’s note: Copernicus Publications remains neutral with regard to jurisdictional claims made in the text, published maps, institutional affiliations, or any other geographical representation in this paper. While Copernicus Publications makes every effort to include appropriate place names, the final responsibility lies with the authors. Regarding the maps used in this paper, please note that Figs. 1, 2, and 6–12 contain disputed territories.
We acknowledge the National Science and Technology Council of Taiwan for supporting the research. We also acknowledge the staff at LABS and Taiwan EPA for the provision of the ground-based measurement datasets. We are also thankful to MERRA-2 and MODIS for the satellite products.
This research has been supported by the National Science and Technology Council (grant no. NSTC113-2811-M-008-045).
This paper was edited by Leiming Zhang and reviewed by four anonymous referees.
Albert, M. F. M. A., Anguelova, M. D., Manders, A. M. M., Schaap, M., and de Leeuw, G.: Parameterization of oceanic whitecap fraction based on satellite observations, Atmos. Chem. Phys., 16, 13725–13751, https://doi.org/10.5194/acp-16-13725-2016, 2016.
Chang, J. and Hanna, S.: Air quality model performance evaluation, Meteorol. Atmos. Phys., 87, 167–196, https://doi.org/10.1007/s00703-003-0070-7, 2004.
Chang, J. H.-W., Griffith, S. M., Kong, S. S.-K., Chuang, M.-T., and Lin, N.-H.: Development of a CMAQ–PMF-based composite index for prescribing an effective ozone abatement strategy: a case study of sensitivity of surface ozone to precursor volatile organic compound species in southern Taiwan, Atmos. Chem. Phys., 23, 6357–6382, https://doi.org/10.5194/acp-23-6357-2023, 2023.
Chuang, M. T., Fu, J. S., Jang, C. J., Chan, C. C., Ni, P. C., and Lee, C. Te: Simulation of long-range transport aerosols from the Asian Continent to Taiwan by a Southward Asian high-pressure system, Sci. Total Environ., 406, 168–179, https://doi.org/10.1016/j.scitotenv.2008.07.003, 2008.
Chuang, M. T., Fu, J. S., Lee, C., Lin, N., Gao, Y., Wang, S., Sheu, G., Hsiao, T., Wang, J., Yen, M., Lin, T., and Thongboonchoo, N.: The Simulation of Long-Range Transport of Biomass Burning Plume and Short-Range Transport of Anthropogenic Pollutants to a Mountain Observatory in East Asia during the 7-SEAS/2010 Dongsha Experiment, Aerosol Air Qual. Res., 16, 2933–2949, https://doi.org/10.4209/aaqr.2015.07.0440, 2016.
Chuang, M.-T., Ooi, M. C. G., Lin, N.-H., Fu, J. S., Lee, C.-T., Wang, S.-H., Yen, M.-C., Kong, S. S.-K., and Huang, W.-S.: Study on the impact of three Asian industrial regions on PM2.5 in Taiwan and the process analysis during transport, Atmos. Chem. Phys., 20, 14947–14967, https://doi.org/10.5194/acp-20-14947-2020, 2020.
Dong, X., Fu, J. S., Huang, K., Tong, D., and Zhuang, G.: Model development of dust emission and heterogeneous chemistry within the Community Multiscale Air Quality modeling system and its application over East Asia, Atmos. Chem. Phys., 16, 8157–8180, https://doi.org/10.5194/acp-16-8157-2016, 2016.
Dong, X., Fu, J. S., Huang, K., Lin, N., Wang, S., and Yang, C.: Analysis of the Co-existence of Long-range Transport Biomass Burning and Dust in the Subtropical West Pacific Region, Sci. Rep., 8, 8962, https://doi.org/10.1038/s41598-018-27129-2, 2018.
Dong, X., Fu, J. S., Huang, K., Zhu, Q., and Tipton, M.: Regional climate effects of biomass burning and dust in East Asia: Evidence from modeling and observation, Geophys. Res. Lett., 46, 11490–11499, https://doi.org/10.1029/2019GL083894, 2019.
Emerson, E. W., Hodshire, A. L., DeBolt, H. M., Bilsback, K. R., Pierce, J. R., McMeeking, G. R., and Farmer, D. K.: Revisiting particle dry deposition and its role in radiative effect estimates, P. Natl. Acad. Sci. USA, 117, 26076–26082, https://doi.org/10.1073/pnas.2014761117, 2020.
Emery, C., Tai, E., and Yarwood, G.: Enhanced meteorological modeling and performance evaluation for two Texas ozone episodes, Prepared for the Texas Natural Resource Conservation Commission, Prepared by ENVIRON International Corp, Novato, CA, https://wayback.archive-it.org/414/20210529064218/https://www.tceq.texas.gov/assets/public/implementation/air/am/contracts/reports/mm/EnhancedMetModelingAndPerformanceEvaluation.pdf (last access: 8 July 2025), 2001.
Foroutan, H., Young, J., Napelenok, S., Ran, L., Appel, K. W., Gilliam, R. C., and Pleim, J. E.: Development and evaluation of a physics-based wind blown dust emission scheme implemented in the CMAQ modelling system, J. Adv. Model. Earth Sy., 9, 585–608, https://doi.org/10.1002/2016MS000823, 2017.
Gaydos, T. M., Pinder, R., Koo, B., Fahey, K. M., Yarwood, G., and Pandis, S. N.: Development and application of a three-dimensional aerosol chemical transport model, PMCAMx, Atmos. Environ., 41, 2594–2611, https://doi.org/10.1016/j.atmosenv.2006.11.034, 2007.
Gelaro, R., McCarty, W., Suárez, M. J., Todling, R., Molod, A., Takacs, L., Randles, C. A., Darmenov, A., Bosilovich, M. G., Reichle, R., Wargan, K., Coy, L., Cullather, R., Draper, C., Akella, S., Buchard, V., Conaty, A., da Silva, A. M., Gu, W., Kim, G. K., Koster, R., Lucchesi, R., Merkova, D., Nielsen, J. E., Partyka, G., Pawson, S., Putman, W., Rienecker, M., Schubert, S. D., Sienkiewicz, M., and Zhao, B.: The modern-era retrospective analysis for research and applications, version 2 (MERRA-2), J. Climate, 30, 5419–5454, https://doi.org/10.1175/JCLI-D-16-0758.1, 2017 (data available at: https://disc.gsfc.nasa.gov, last access: 1 August 2024).
Giardina, M. and Buffa, P.: A new approach for modeling dry deposition velocity of particles, Atmos. Environ., 180, 11–22, https://doi.org/10.1016/j.atmosenv.2018.02.038, 2018.
Guenther, A. B., Jiang, X., Heald, C. L., Sakulyanontvittaya, T., Duhl, T., Emmons, L. K., and Wang, X.: The Model of Emissions of Gases and Aerosols from Nature version 2.1 (MEGAN2.1): an extended and updated framework for modeling biogenic emissions, Geosci. Model Dev., 5, 1471–1492, https://doi.org/10.5194/gmd-5-1471-2012, 2012.
Gui, K., Yao, W., Che, H., An, L., Zheng, Y., Li, L., Zhao, H., Zhang, L., Zhong, J., Wang, Y., and Zhang, X.: Record-breaking dust loading during two mega dust storm events over northern China in March 2021: aerosol optical and radiative properties and meteorological drivers, Atmos. Chem. Phys., 22, 7905–7932, https://doi.org/10.5194/acp-22-7905-2022, 2022.
Han, X., Ge, C., Tao, J., Zhang, M., and Zhang, R.: Air quality modeling for a strong dust event in East Asia in March 2010, Aerosol Air Qual. Res., 12, 615–628, https://doi.org/10.4209/aaqr.2011.11.0191, 2012.
He, Y., Yi, F., Yin, Z., Liu, F., Yi, Y., and Zhou, J.: Mega Asian dust event over China on 27–31 March 2021 observed with space-borne instruments and ground-based polarization lidar, Atmos. Environ., 285, 119238, https://doi.org/10.1016/j.atmosenv.2022.119238, 2022.
Hogrefe, C., Bash, J. O., Pleim, J. E., Schwede, D. B., Gilliam, R. C., Foley, K. M., Appel, K. W., and Mathur, R.: An analysis of CMAQ gas-phase dry deposition over North America through grid-scale and land-use-specific diagnostics in the context of AQMEII4, Atmos. Chem. Phys., 23, 8119–8147, https://doi.org/10.5194/acp-23-8119-2023, 2023.
Huang, H.-Y., Wang, S.-H., Huang, W.-X., Lin, N.-H., Chuang, M.-T., da Silva, A. M., and Peng, C.-M.: Influence of synoptic-dynamic meteorology on the long-range transport of Indochina biomass burning aerosols, J. Geophys. Res., 111, e2019JD031260, https://doi.org/10.1029/2019JD031260, 2020.
Huang, K., Fu, J. S., Lin, N.-H., Wang, S.-H., Dong, X., and Wang, G.: Superposition of Gobi Dust and Southeast Asian Biomass Burning: The Effect of Multisource Long – Range Transport on Aerosol Optical Properties and Regional Meteorology Modification, J. Geophys. Res., 124, 16, 9464-9483, https://doi.org/10.1029/2018JD030241, 2019.
Huang, W. S., Griffith, S. M., Lin, Y. C., Chen, Y. C., Lee, C. Te, Chou, C. C. K., Chuang, M. T., Wang, S. H., and Lin, N. H.: Satellite-based emission inventory adjustments improve simulations of long-range-transport events, Aerosol Air Qual. Res., 21, 210121, https://doi.org/10.4209/AAQR.210121, 2021.
Jin, J., Pang, M., Segers, A., Han, W., Fang, L., Li, B., Feng, H., Lin, H. X., and Liao, H.: Inverse modeling of the 2021 spring super dust storms in East Asia, Atmos. Chem. Phys., 22, 6393–6410, https://doi.org/10.5194/acp-22-6393-2022, 2022.
Khan, T. R. and Perlinger, J. A.: Evaluation of five dry particle deposition parameterizations for incorporation into atmospheric transport models, Geosci. Model Dev., 10, 3861–3888, https://doi.org/10.5194/gmd-10-3861-2017, 2017.
Kok, J. F., Parteli, E. J. R., Michaels, T. I., and Karam, D. B.: The physics of wind-blown sand and dust, Rep. Prog. Phys., 75, 106901, https://doi.org/10.1088/0034-4885/75/10/106901, 2012.
Kong, S. S.-K., Fu, J. S., Dong, X., Chuang, M., Chel, M., Ooi, G., Huang, W., Griffith, S. M., Kumar, S., and Lin, N.: Sensitivity analysis of the dust emission treatment in CMAQv5.2.1 and its application to long-range transport over East Asia, Atmos. Environ., 257, 118441, https://doi.org/10.1016/j.atmosenv.2021.118441, 2021.
Kong, S. S.-K., Pani, S. K., Griffith, S. M., Ou-Yang, C.-F., Babu, S. R., Chuang, M.-T., Ooi, M. C. G., Huang, W.-S., Sheu, G.-R., and Lin, N.-H.: Distinct transport mechanisms of East Asian dust and the impact on downwind marine and atmospheric environments, Sci. Total Environ., 827, 154255, https://doi.org/10.1016/j.scitotenv.2022.154255, 2022.
Kong, S. S.-K., Ravindra Babu, S., Wang, S.-H., Griffith, S. M., Chang, J. H.-W., Chuang, M.-T., Sheu, G.-R., and Lin, N.-H.: Expanding the simulation of East Asian super dust storms: physical transport mechanisms impacting the western Pacific, Atmos. Chem. Phys., 24, 1041–1058, https://doi.org/10.5194/acp-24-1041-2024, 2024.
Li, M., Zhang, Q., Kurokawa, J.-I., Woo, J.-H., He, K., Lu, Z., Ohara, T., Song, Y., Streets, D. G., Carmichael, G. R., Cheng, Y., Hong, C., Huo, H., Jiang, X., Kang, S., Liu, F., Su, H., and Zheng, B.: MIX: a mosaic Asian anthropogenic emission inventory under the international collaboration framework of the MICS-Asia and HTAP, Atmos. Chem. Phys., 17, 935–963, https://doi.org/10.5194/acp-17-935-2017, 2017.
Liang, L., Han, Z., Li, J., Xia, X., Sun, Y., Liao, H., Liu, R., and Liang, M.: Science of the Total Environment Emission, transport, deposition, chemical and radiative impacts of mineral dust during severe dust storm periods in March 2021 over East Asia, Sci. Total Environ., 852, 158459, https://doi.org/10.1016/j.scitotenv.2022.158459, 2022.
Lin, C.-Y., Wang, Z., Chen, W.-N., Chang, S.-Y., Chou, C. C. K., Sugimoto, N., and Zhao, X.: Long-range transport of Asian dust and air pollutants to Taiwan: observed evidence and model simulation, Atmos. Chem. Phys., 7, 423–434, https://doi.org/10.5194/acp-7-423-2007, 2007.
Lin, C.-Y., Sheng, Y.-F., Chen, W.-N., Wang, Z., Kuo, C.-H., Chen, W.-C., and Yang, T.: The impact of channel effect on Asian dust transport dynamics: a case in southeastern Asia, Atmos. Chem. Phys., 12, 271–285, https://doi.org/10.5194/acp-12-271-2012, 2012.
Liu, S., Xing, J., Sahu, S. K., Liu, X., Liu, S., Jiang, Y., Zhang, H., Li, S., Ding, D., Chang, X., and Wang, S.: Wind-blown dust and its impacts on particulate matter pollution in Northern China: Current and future scenarios, Environ. Res. Lett., 16, 114041, https://doi.org/10.1088/1748-9326/ac31ec, 2021.
Massad, R.-S., Nemitz, E., and Sutton, M. A.: Review and parameterisation of bi-directional ammonia exchange between vegetation and the atmosphere, Atmos. Chem. Phys., 10, 10359–10386, https://doi.org/10.5194/acp-10-10359-2010, 2010.
Nemitz, E., Milford, C., and Sutton, M. A.: A two-layer canopy compensation point model for describing bi-directional biosphere-atmosphere exchange of ammonia, Q. J. Roy. Meteor. Soc., 127, 815–833, https://doi.org/10.1002/qj.49712757306, 2001.
Ooi, M. C.-G., Chuang, M.-T., Fu, J. S., Kong, S. S., Huang, W.-S., Wang, S.-H., Pimonsree, S., Chan, A., Pani, S. K., and Lin, N.-H.: Improving prediction of trans-boundary biomass burning plume dispersion: from northern peninsular Southeast Asia to downwind western North Pacific Ocean, Atmos. Chem. Phys., 21, 12521–12541, https://doi.org/10.5194/acp-21-12521-2021, 2021.
Pani, S. K., Wang, S. H., Lin, N. H., Lee, C. Te, Tsay, S. C., Holben, B. N., Janjai, S., Hsiao, T. C., Chuang, M. T., and Chantara, S.: Radiative effect of springtime biomass burning aerosols over northern indochina during 7-SEAS/BASELInE 2013 campaign, Aerosol Air Qual. Res., 16, 2802–2817, https://doi.org/10.4209/aaqr.2016.03.0130, 2016.
Pani, S. K., Wang, S. H., Lin, N. H., Chantara, S., Lee, C. Te, and Thepnuan, D.: Black carbon over an urban atmosphere in northern peninsular Southeast Asia: Characteristics, source apportionment, and associated health risks, Environ. Pollut., 259, 113871, https://doi.org/10.1016/j.envpol.2019.113871, 2020.
Platnick, S., Hubanks, P., Meyer, K., and King, M. D.: MODIS Atmosphere L3 Monthly Product (08_L3), NASA MODIS Adaptive Processing System, Goddard Space Flight Center, USA [data set], https://doi.org/10.5067/MODIS/MOD08_M3.006, 2015.
Pleim, J. and Ran, L.: Surface Flux Modeling for Air Quality Applications, Atmosphere., 2, 271–302, https://doi.org/10.3390/atmos2030271, 2011.
Pleim, J. E., Ran, L., Saylor, R. D., Willison, J., and Binkowski, F. S.: A New Aerosol Dry Deposition Model for Air Quality and Climate Modeling, J. Adv. Model. Earth Sy., 14, 1–21, https://doi.org/10.1029/2022MS003050, 2022.
Ramanthan, V. and Carmicheal, G.: Climate change due to BC, Nat. Geosci., 1, 221–227, 2008.
Ravindra Babu, S., Ou-Yang, C.-F., Griffith, S. M., Pani, S. K., Kong, S. S.-K., and Lin, N.-H.: Transport pathways of carbon monoxide from Indonesian fire pollution to a subtropical high-altitude mountain site in the western North Pacific, Atmos. Chem. Phys., 23, 4727–4740, https://doi.org/10.5194/acp-23-4727-2023, 2023.
Ryu, Y. H. and Min, S. K.: Improving Wet and Dry Deposition of Aerosols in WRF-Chem: Updates to Below-Cloud Scavenging and Coarse-Particle Dry Deposition, J. Adv. Model. Earth Syst., 14, e2021MS002792, https://doi.org/10.1029/2021MS002792, 2022.
Saylor, R. D., Baker, B. D., Lee, P., Tong, D., Pan, L., and Hicks, B. B.: The particle dry deposition component of total deposition from air quality models: right, wrong or uncertain?, Tellus B, 71, 1550324, https://doi.org/10.1080/16000889.2018.1550324, 2019.
Shu, Q., Koo, B., Yarwood, G., and Henderson, B. H.: Strong influence of deposition and vertical mixing on secondary organic aerosol concentrations in CMAQ and CAMx, Atmos. Environ., 171, 317–329, https://doi.org/10.1016/j.atmosenv.2017.10.035, 2017.
Shu, Q., Murphy, B., Schwede, D., Henderson, B. H., Pye, H. O. T., Appel, K. W., Khan, T. R., and Perlinger, J. A.: Improving the particle dry deposition scheme in the CMAQ photochemical modeling system, Atmos. Environ., 289, 119343, https://doi.org/10.1016/j.atmosenv.2022.119343, 2022.
Slinn, W. G. N.: Predictions for particle deposition to vegetative canopies, Atmos. Environ., 16, 1785–1794, https://doi.org/10.1016/0004-6981(82)90271-2, 1982.
Taiwan Environmental Protection Agency: TEPA [data set], https://www.epa.gov.tw (last access: 18 January 2024), 2017.
Tang, W., Dai, T., Cheng, Y., Wang, S., and Liu, Y.: A Study of a Severe Spring Dust Event in 2021 over East Asia with WRF-Chem and Multiple Platforms of Observations, Remote Sens., 14, 3795, https://doi.org/10.3390/rs14153795, 2022.
Tav, J., Masson, O., Burnet, F., Paulat, P., Bourrianne, T., Conil, S., and Pourcelot, L.: Determination of Fog-Droplet Deposition Velocity from a Simple Weighing Method, Aerosol Air Qual. Res., 18, 103–113, https://doi.org/10.4209/aaqr.2016.11.0519, 2018.
Vukovich, J. and Pierce, T.: The Implementation of BEIS3 within the SMOKE modeling framework, in: Proc. 11th International Emission Inventory Conference: Emission Inventories – Partnering for the Future, Atlanta, GA, US EPA, CD-ROM, 10.7, https://www3.epa.gov/ttnchie1/conference/ei11/modeling/vukovich.pdf (last access: 8 July 2025), 2002.
Wang, W., Zhou, H., Lyu, R., Shao, L., Li, W., Xing, J., Zhao, Z., Li, X., Zhou, X., and Zhang, D.: Organic Carbon and Elemental Carbon in Two Dust Plumes at a Coastal City in North China, Aerosol Air Qual. Res., 24, 240002, https://doi.org/10.4209/aaqr.240002, 2024.
Wesley, M. L.: Parameterization of Surface Resistances to Gaseous Dry Deposition in Regional-Scale Numerical Models, Atmos. Environ., 23, 1293–1304, 1989.
Xiao, H. W., Xu, Y., and Xiao, H. Y.: Source apportionment of black carbon aerosols in winter across China, Atmos. Environ., 298, 119622, https://doi.org/10.1016/j.atmosenv.2023.119622, 2023.
Zeng, Y., Wang, M., Zhao, C., Chen, S., Liu, Z., Huang, X., and Gao, Y.: WRF-Chem v3.9 simulations of the East Asian dust storm in May 2017: modeling sensitivities to dust emission and dry deposition schemes, Geosci. Model Dev., 13, 2125–2147, https://doi.org/10.5194/gmd-13-2125-2020, 2020.
Zhang, L., Gong, S., Padro, J., and Barrie, L.: A size-segregated particle dry deposition scheme for an atmospheric aerosol module, Atmos. Environ., 35, 549–560, https://doi.org/10.1016/S1352-2310(00)00326-5, 2001.
Zhang, L., Zhang, H., Li, Q., Cai, X., and Song, Y.: Vertical dispersion mechanism of long-range transported dust in Beijing: Effects of atmospheric turbulence, Atmos. Res., 269, 106033, https://doi.org/10.1016/j.atmosres.2022.106033, 2022.
Zhang, X.-X., Sharratt, B., Chen, X., Wang, Z.-F., Liu, L.-Y., Guo, Y.-H., Li, J., Chen, H.-S., and Yang, W.-Y.: Dust deposition and ambient PM10 concentration in northwest China: spatial and temporal variability, Atmos. Chem. Phys., 17, 1699–1711, https://doi.org/10.5194/acp-17-1699-2017, 2017.
Zheng, B., Tong, D., Li, M., Liu, F., Hong, C., Geng, G., Li, H., Li, X., Peng, L., Qi, J., Yan, L., Zhang, Y., Zhao, H., Zheng, Y., He, K., and Zhang, Q.: Trends in China's anthropogenic emissions since 2010 as the consequence of clean air actions, Atmos. Chem. Phys., 18, 14095–14111, https://doi.org/10.5194/acp-18-14095-2018, 2018.