the Creative Commons Attribution 4.0 License.
the Creative Commons Attribution 4.0 License.
 | 08 Jul 2025
Understanding summertime H2O2 chemistry in the North China Plain through observations and modeling studies
Chenglong Zhang
Zhuobiao Ma
Chengtang Liu
Junfeng Liu
Keding Lu
Yuanhang Zhang
Hydrogen peroxide (H2O2) is a key atmospheric oxidant, crucial for oxidation capacity and sulfate production. However, its chemistry remains understudied compared to ozone (O3), limiting our understanding of photochemical pollution. In summer 2016, atmospheric peroxides and trace gases were measured at a rural site in the North China Plain. H2O2 was the dominant peroxide (0.62 ± 0.80 ppb), constituting 69 % of total peroxides. It exhibited diurnal variation similar to peroxyacetyl nitrate (PAN) and O3, indicating photochemical production. The ratio was higher on high-particle days, suggesting that H2O2 uptake by particles reduces its concentration. A box model with default gas-phase chemistry overestimated H2O2 by a factor of 2.7, and including particle uptake of H2O2 (uptake coefficient of 6 × 10⁻⁴) improved agreement with observations, although we note that this value carries some uncertainty related to the assumed HO2 uptake coefficient.
HO2 recombination contributed 91 % of H2O2 production, with a peak rate of 1 ppb h−1. Major removal pathways included particle uptake (69 %), dry deposition (25 %), OH reaction (4 %), and photolysis (2 %). Relative incremental reactivity (RIR) analysis showed that reducing NOx, PM2.5, and alkanes increased H2O2, while reducing alkenes, aromatics, CO, and HONO decreased it, with alkenes having the strongest effect. ratios (>0.15 in 82 % of cases) indicated that O3 formation was in a transition and NOx-sensitive regime, emphasizing the need for further volatile organic compound (VOC) and NOx reductions to mitigate both H2O2 and O3 pollution. These findings improve our understanding of H2O2 chemistry and provide insights into the mitigation of photochemical pollution in rural North China.
- Article
(2748 KB) - Full-text XML
-
Supplement
(640 KB) - BibTeX
- EndNote


The atmospheric oxidation capacity is a critical determinant of atmospheric self-cleaning, influencing the residence time and persistence of pollutant gases. Quantifying this capacity is essential for elucidating the lifetimes of pollutants, the formation of aerosols, and their subsequent radiative forcing effects. Hydrogen peroxide (H2O2) serves as a significant atmospheric oxidant, primarily generated through the recombination of hydroperoxyl radicals (HO2), which are themselves derived from reactions involving hydroxyl radicals (OH), volatile organic compounds (VOCs), and carbon monoxide (CO). Consequently, the formation of H2O2 is intrinsically linked to atmospheric oxidation capacity, with its concentration serving as a direct indicator of the intensity of this capacity. Furthermore, as H2O2 represents a terminal product in the ozone (O3) formation chain reaction, its concentration can be utilized to assess the sensitivity of O3 production to precursors (Sillman, 1995; Reeves and Penkett, 2003; Nunnermacker et al., 2008; He et al., 2010). Owing to its strong oxidative potential and high Henry's law constant, H2O2 readily dissolves in cloud droplets, where it oxidizes sulfur dioxide (SO2) to form sulfuric acid (H2SO4), thereby contributing to sulfate aerosol formation and acid rain deposition (Calvert et al., 1985). Research indicated that H2O2-mediated oxidation of SO2 in cloud water accounts for 60 %–80 % of global SO2 oxidation (Penkett et al., 1979; Calvert et al., 1985; Sofen et al., 2011). Additionally, recent studies have highlighted the significant role of particle-phase H2O2 oxidation in sulfate formation during winter (Ye et al., 2018, 2021b; Gao et al., 2024). Given its potent oxidative properties, H2O2 also poses substantial risks to human health and vegetation (Chen et al., 2010). Thus, a precise understanding of H2O2 chemistry is imperative to advance the knowledge of atmospheric oxidation processes and to diagnose underlying secondary pollution formation mechanisms.
Atmospheric H2O2 concentrations are currently reported to range from 0.1 to 13 ppb (Balasubramanian and Husain, 1997; Walker et al., 2006; Ren et al., 2009; Guo et al., 2014; He et al., 2010; Qin et al., 2018; Fischer et al., 2015, 2019; Ye et al., 2022; Allen et al., 2022; Zhang et al., 2018), with their spatial and temporal variability governed by a balance between production sources and removal pathways. H2O2 is generated through both primary and secondary sources. Primary sources of H2O2 include biomass burning, which can contribute substantially under specific conditions. For instance, Ye et al. (2022) reported elevated H2O2 concentrations during biomass combustion events, which promote secondary sulfate formation and thereby increase fine particulate matter (PM2.5) concentrations. The dominant secondary source is the recombination of HO2 radicals, a process enhanced during summer months due to increased solar radiation, which elevates HO2 concentrations and consequently leads to higher H2O2 levels. However, under elevated nitrogen oxide (NOx) conditions, nitric oxide (NO) reacts competitively with HO2, suppressing H2O2 formation and resulting in reduced atmospheric concentrations. Another secondary source involves the ozonolysis of alkenes, which produces Criegee intermediates that can decompose to form H2O2 (Becker et al., 1990). This pathway is particularly relevant during nighttime and potentially in winter, when photochemical activity is diminished (Lee et al., 2008b). For example, alkene ozonolysis was found to dominate wintertime H2O2 levels (>70 %) (Qin et al., 2018), although the yields are generally low, often below 10 %. Additionally, the release of H2O2 from the particle phase has been proposed as a potential source, although its contribution is considered negligible compared to gas-phase production. Recent studies, however, have highlighted that under polluted conditions, high concentrations of humic-like substances and transition metals can facilitate particle-phase H2O2 formation, which subsequently partitions into the gas phase, significantly enhancing gas-phase H2O2 levels (Ye et al., 2021b; Liu et al., 2021).
H2O2 can be removed by photolysis, which not only depletes H2O2 but also serves as a source of hydroperoxyl radicals (HOx). However, due to lower photolysis frequency, the contribution of H2O2 photolysis to atmospheric HOx production is generally much smaller compared to the photolysis of O3, nitrous acid (HONO), and formaldehyde (HCHO). Notably, particle-phase H2O2 photolysis has been identified as a critical source of free radicals within aerosols, accelerating aerosol aging and promoting the formation of secondary pollutants. Rao et al. (2023) further emphasized a significantly accelerated rate for the air–water interface H2O2 photolysis, underscoring its importance as a source of particle-phase OH. Dry deposition is another key removal mechanism, leading to a vertical gradient in H2O2 concentrations, with peak levels observed at approximately 2 km above the surface (Watanabe et al., 2016; Klippel et al., 2011). Due to its high solubility, wet deposition through rainwater scavenging also effectively removes H2O2 from the atmosphere. Moreover, laboratory and field studies have demonstrated that heterogeneous uptake by particles can significantly contribute to H2O2 removal under polluted conditions. Qin et al. (2022) reported a maximum uptake coefficient of 2.49 × 10⁻³ for H2O2 by ambient particles, with the uptake coefficient influenced by the concentration of transition metals within the particles.
In addition to H2O2, the atmosphere contains a variety of organic peroxides, such as methyl hydroperoxide (CH3OOH), formed through reactions between HO2 and organic peroxy (RO2) radicals. While H2O2 is the most abundant peroxide in the atmosphere, organic peroxides are recognized as a significant component of secondary organic aerosol (SOA), contributing to aerosol composition and properties. However, due to analytical challenges associated with measuring organic peroxides, most studies on atmospheric peroxides have only focused on H2O2 (Zhang et al., 2012).
Photochemical pollution has emerged as a critical air quality issue in China, impacting both urban and rural regions. H2O2 and O3 are key products of photochemical pollution, and elucidating their chemical behavior is essential for developing effective strategies to mitigate photochemical pollution. However, compared to the extensive research on O3, studies on H2O2 remain limited due to the technical challenges and complexities associated with its measurement. In recent years, O3 concentrations in the North China Plain have exhibited a significant upward trend (Li et al., 2019; Wang et al., 2020; Lu et al., 2020), yet the characteristics of H2O2 in this region remain poorly understood. Furthermore, the implementation of national emission reduction policies has led to a substantial decline in NOx, while VOCs persist at elevated levels (Liu et al., 2023). This shift toward low-NOx and high-VOC conditions is more conducive to H2O2 formation. Although photochemical pollution is traditionally considered an urban phenomenon, recent studies have highlighted its increasing prevalence in rural areas, where pollution levels are gradually approaching those observed in urban areas (Ma et al., 2016). Rural regions typically exhibit lower NOx concentrations than urban areas, creating conditions more favorable for H2O2 production. Despite this, research on H2O2 in rural areas of the heavily polluted North China Plain remains scarce. Consequently, there is an urgent need to investigate H2O2 chemistry in rural environments to inform targeted control strategies for photochemical pollution.
This study is based on a field campaign conducted in a rural area of the North China Plain, during which a comprehensive suite of gaseous (including H2O2), particulate matter, and meteorological parameters were measured. Here we investigate the temporal variations in H2O2 and its relationships with other oxidants (e.g., O3 and peroxyacetyl nitrate, PAN) and preliminarily estimate organic peroxide concentrations. A zero-dimensional box model was employed to examine the influence of particles on the H2O2 budget and the sensitivity of H2O2 production to various chemical species. Finally, we explore the potential of H2O2 as an indicator for determining O3 sensitivity and discuss the control strategy for alleviating photochemical pollution.
2.1 Measurement site
The observational experiment was conducted at the Station of Rural Environment, Research Center for Eco-Environmental Sciences (SRE-RCEES; 38°42′ N, 115°15′ E), located in Dongbaituo village, Wangdu county, Hebei province. Situated approximately 180 km southwest of Beijing, the station is surrounded primarily by farmland with no nearby industrial facilities, making it an ideal site for studying typical rural atmospheric conditions. This location has historically served as a key site for numerous large-scale observational campaigns (Tan et al., 2017; Peng et al., 2021). The experiment took place from 6 July to 12 August 2016, with the primary objective of investigating the underlying causes of photochemical pollution in the rural North China Plain.
2.2 H2O2 measurements
H2O2 concentrations were measured using the AL-2021 H2O2 monitor (Aero-Laser) (Lazrus et al., 1986). The instrument operates on the following principle: gas-phase peroxides in ambient air are collected by the buffered solution in a glass stripping coil. The trapped peroxides then react with p-hydroxyphenyl acetic acid (POPHA) under the catalysis of peroxidase, producing a fluorescent dimer. This dimer exhibits maximal light absorption at a characteristic wavelength of 320 nm and emits fluorescence with a central wavelength of 400 nm. By continuously monitoring the intensity of this fluorescence signal, the instrument enables online quantitative detection of atmospheric peroxides. To differentiate between H2O2 and organic peroxides, a dual-channel measurement approach was employed. Channel A measures the total peroxide content, while channel B incorporates catalase into the absorbent solution to selectively decompose H2O2, thereby measuring only organic peroxides. The H2O2 concentration is determined by the difference in signals between the two channels. Although channel B provides an approximation of organic peroxides, it is important to note that the percentage of organic peroxides reported in this study represents a lower limit, as the collection efficiency of the stripping coil technique varies significantly among different organic peroxide species. While H2O2 is efficiently trapped due to its high solubility (Henry's law constant of ∼ 105 M atm−1), many organic peroxides such as methyl hydroperoxide (MHP) have substantially lower solubilities (Henry's law constant of 3 × 10² M atm−1), resulting in lower collection efficiencies. Additionally, the catalase used to differentiate between H2O2 and organic peroxides may not completely discriminate between certain hydroperoxide species, further contributing to uncertainty in organic peroxide quantification. The detection limit of the H2O2 measurement instrument is 50 ppt, with an uncertainty of 10 %. To ensure the stability of the instrument's operation, regular calibrations are performed at fixed intervals. In several previous field experiments (Ye et al., 2018, 2021b, a; Liu et al., 2021), this instrument has been successfully utilized to measure atmospheric H2O2, demonstrating high reliability and consistent operational stability.
2.3 Other species
NOx, O3, SO2, PM2.5, CO, and total reactive nitrogen (NOy) were measured using commercial instruments from Thermo Electron. Volatile organic compounds (VOCs) were quantified by gas chromatography with a flame ionization detector (GC-FID), while nitrous acid (HONO) was measured using a long-path absorption photometer (LOPAP) from QUMA. The aerosol surface area density was calculated by combining data from a scanning mobility particle sizer (SMPS) and an aerodynamic particle sizer (APS). PAN was analyzed using gas chromatography with electron capture detection (GC-ECD). Gas-phase meteorological data were collected using a portable meteorological station (Model WXT520, Vaisala, Finland). The photolysis rate constant of NO2 (j(NO2)) was measured directly, and other photolysis rate constants were derived using the tropospheric ultraviolet and visible (TUV) radiation model, scaled based on j(NO2) measurements. Detailed information on the experimental instruments is provided in Table S1 in the Supplement.
2.4 Box model descriptions
A zero-dimensional box model based on the RACM2-LIM1 mechanism was employed to investigate the sources and removal mechanisms of H2O2. This model is widely recognized for its ability to accurately model HOx radicals (Tan et al., 2017; Ma et al., 2022). Given that the HO2 is a critical precursor for H2O2 formation, the model's strong performance in simulating free radicals provides confidence in its ability to reliably simulate H2O2 concentrations. The model was constrained using input parameters including photolysis rate constants (j(NO2), j(O1D), j(HONO), j(H2O2), j(HCHO)), VOCs, NO, NO2, O3, HONO, methane (CH4), CO, and meteorological data (temperature, relative humidity, and pressure). VOCs were categorized into different reactivity-based groups according to their reaction rates with OH, as detailed in Table S2. The dry deposition rate constant for H2O2 was set to 3 × 10⁻⁵ s−1, and boundary layer heights were derived from the hybrid single-particle Lagrangian integrated trajectory (HYSPLIT) model.
The simulation focused on the period from 24 July to 3 August, selected for its stable meteorological conditions that were characterized by low wind speeds and predominantly static weather. During this period, the observed trends in H2O2 concentrations exhibited consistent patterns, suggesting that local photochemical processes were the primary source of H2O2. This makes the selected time frame ideal for exploring H2O2 sources using the box model. Additionally, elevated PM2.5 concentrations during this period provided an opportunity to investigate the potential influence of particle uptake on H2O2 removal. The rate coefficient of H2O2 uptake by particles was parameterized as Eq. (1):
Here c is mean molecular speed of H2O2, γ is the H2O2 uptake coefficient, and Sa is aerosol surface area density.
To assess the contributions of different precursors to H2O2 production, a relative incremental reactivity (RIR) analysis was conducted. RIR was calculated using the following equation:
In Eq. (2), X represents the primary pollutants that may influence H2O2 concentrations. H2O2 represents modeled H2O2 in the base case. represents the relative change in primary pollutants. ΔH2OH2O2 represents the relative change in modeled H2O2 concentrations induced by the reduction in X. Considering the variations in simulated radical concentrations and the deviations in the RIR, a 20 % reduction scenario was selected for further analysis. This approach allowed for the quantification of the sensitivity of H2O2 production to variations in precursor concentrations, providing insights into the key drivers of H2O2 formation in the rural North China Plain.
3.1 Time series overview
Figure 1 depicts H2O2, other related chemical species, and meteorological parameters during the observation period. Throughout the observation period, meteorological conditions were characterized by high temperature and relative humidity. High temperature generally increased the rate constants of photochemical reactions, while abundant water vapor enhanced the recombination rate of HO2 and the reaction rate between O(1D) and water vapor (H2O). The maximum O3 concentration reached 120 ppb, with the maximum daily 8 h average (MDA8) frequently exceeding the National Ambient Air Quality Standard (NAAQS) class-II standard of 82 ppb (25°, 1013 kPa). High-O3-pollution events often coincided with elevated H2O2 concentrations (>2 ppb), suggesting that O3 production at this site may be sensitive to NOx. This hypothesis will be further investigated using the and ratios in Sect. 3.6 on O3 sensitivity. NOx concentrations peaked in the morning, driven by factors such as traffic emissions and lower boundary layer height. Daytime NO concentrations were generally below 1 ppb, while daily peak H2O2 concentrations exhibited significant day-to-day variability, ranging from approximately 0.2 ppb to 4 ppb. Higher H2O2 concentrations were observed during periods of intense solar radiation, indicating that local photochemical reactions play a significant role in H2O2 production. Notably, elevated H2O2 levels were only observed when NO concentrations were low, consistent with the known mechanism of H2O2 formation under low-NOx conditions.
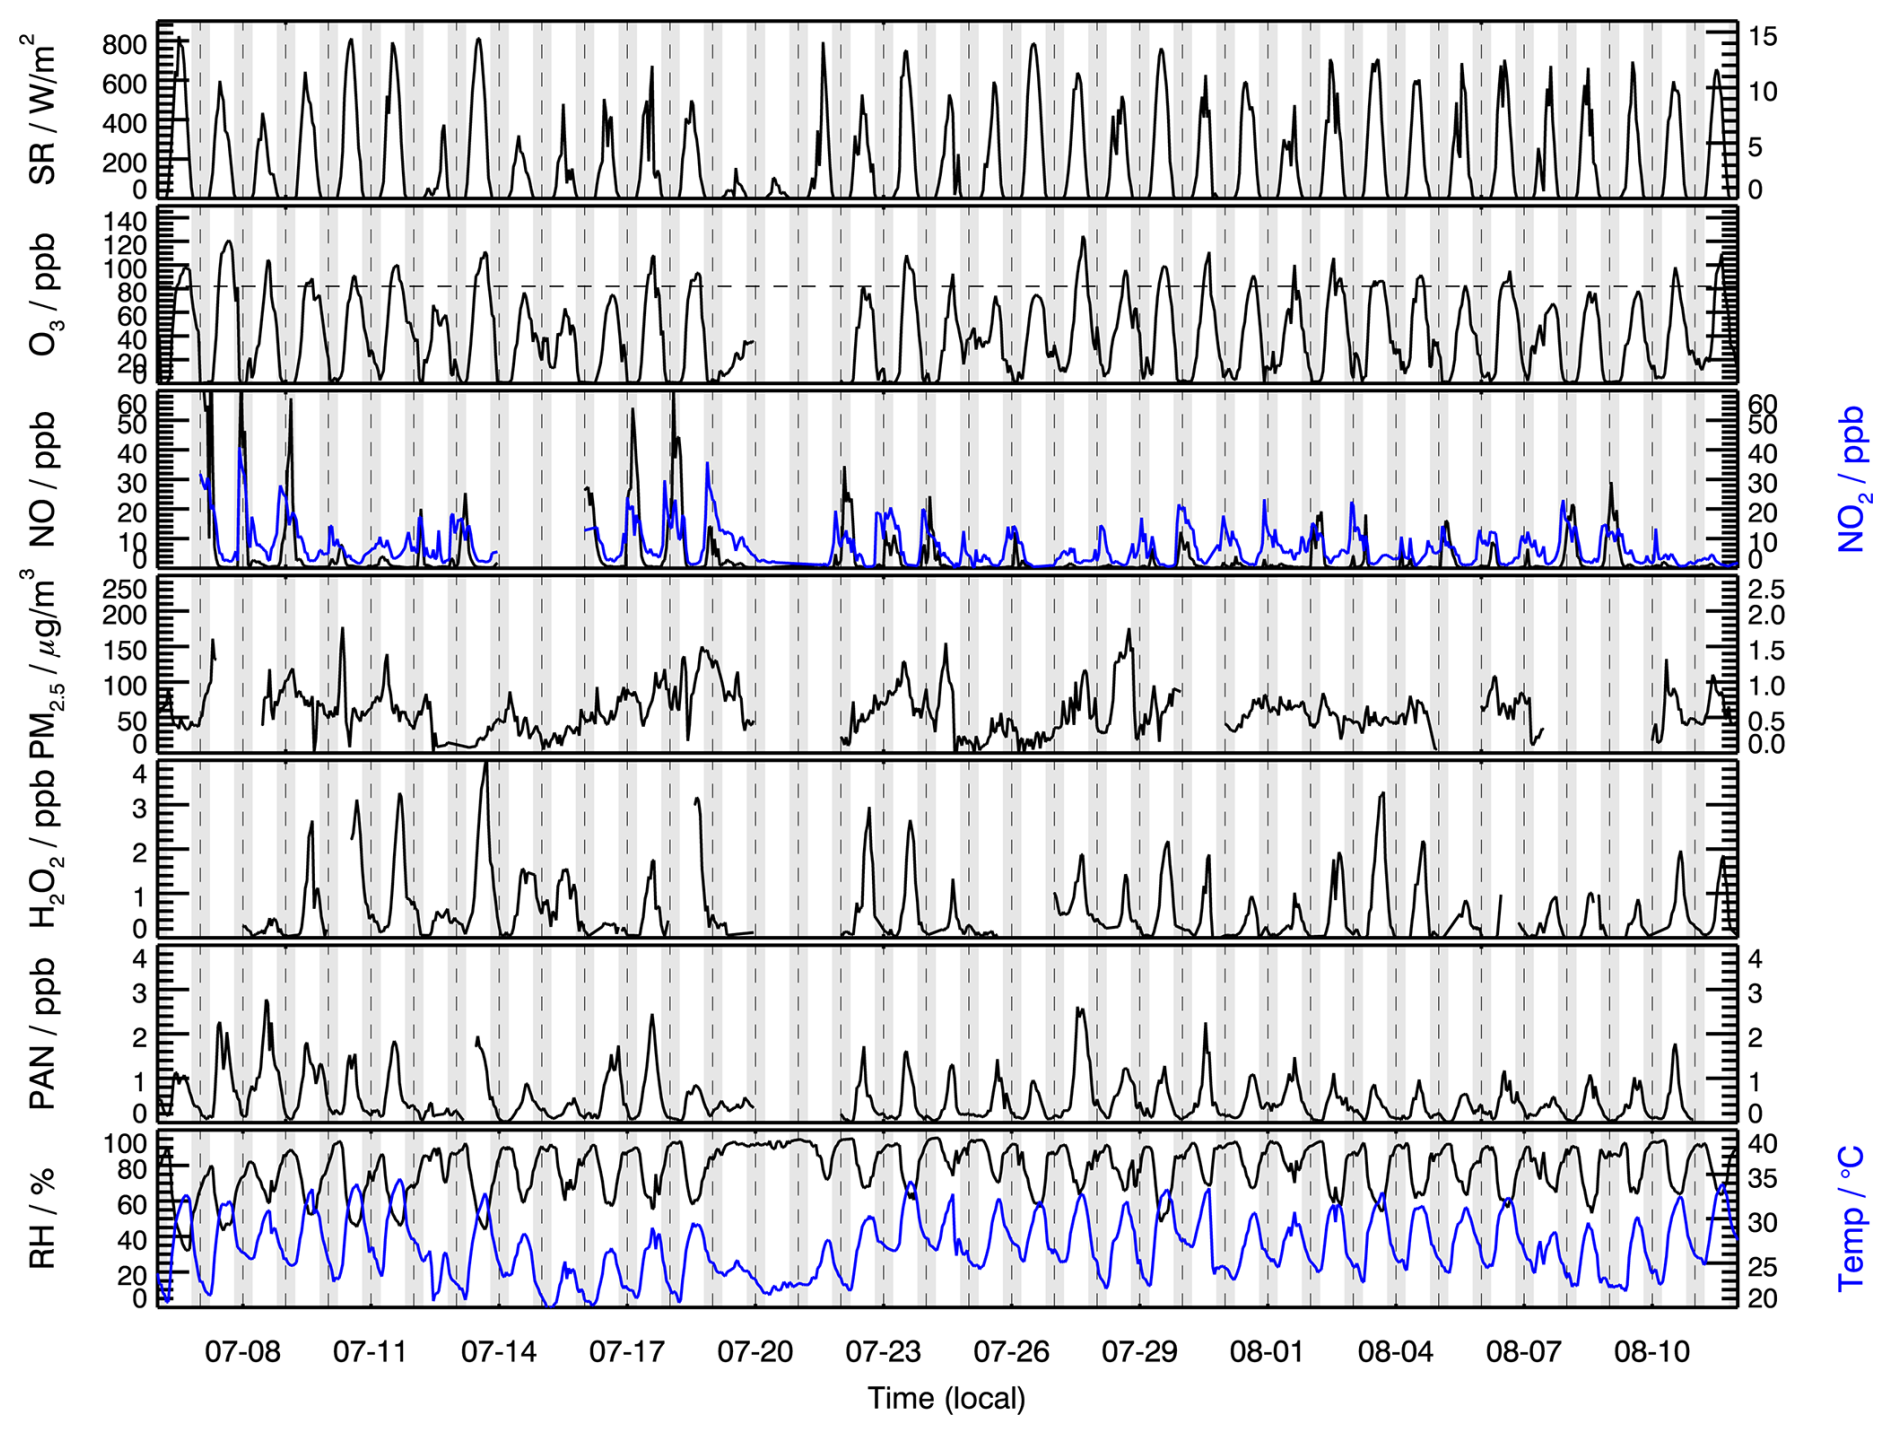
Figure 1Measurements of H2O2, other related chemical species, and meteorological parameters at the SRE-RCEES site during the observation period.
The average H2O2 concentration during the whole observation period was 0.62 ± 0.80 ppb, significantly higher than wintertime concentrations (0.19 ppb) at the same site (Ye et al., 2021b), as summer conditions with high solar radiation intensity and relative humidity are more conducive to H2O2 production. This average concentration also exceeded summer H2O2 levels reported in urban areas such as Beijing (0.27 ppb) (Qin et al., 2018) and Hong Kong (0.32 ppb) (Guo et al., 2014), likely due to lower NOx levels at the rural site, which favor H2O2 formation. Compared to the H2O2 concentrations reported at rural sites in other countries, the levels observed in this study were lower than those in Kinterbish (Watkins et al., 1995) and Whiteface Mountain (1.61 ppb) (Balasubramanian and Husain, 1997). It is worth mentioning that an average H2O2 concentration of 0.51 ± 0.90 ppb was reported at the same site in summer 2014 (Wang et al., 2016), lower than the current study's findings, reflecting a potential increasing trend in H2O2 concentrations over time. In addition, multiyear measurements at the summit of Mount Tai revealed an increasing trend in H2O2 concentrations in cloud water from 2014 to 2018 (Li et al., 2020), indirectly indicating rising gas-phase H2O2 levels in the North China Plain. The significant reduction in NOx emissions in the North China Plain over recent years, while VOC levels remained relatively high or decreased less sharply, has likely shifted the atmospheric chemistry towards conditions more favorable for HO2 recombination, potentially contributing to the observed increasing trend in H2O2 concentrations. This aligns with the known sensitivity of H2O2 formation to NOx levels.
Elevated H2O2 concentrations and high relative humidity in rural areas facilitate the oxidation of SO2 by H2O2 in both aerosol water and cloud water, contributing to sulfate formation and increased PM2.5 levels. During the observation period, the average PM2.5 concentration reached 57 µg m−3, and the co-occurrence of PM2.5 and O3 pollution was frequently observed. This dual pollution phenomenon suggests that high concentrations of oxidants may play a significant role in driving secondary aerosol formation. PAN, another key secondary oxidant measured in this study, reached a maximum concentration of 2.9 ppb. Similar to H2O2 and O3, PAN is a product of photochemical pollution, and its temporal trends closely mirrored those of H2O2 and O3. These trends will be analyzed in detail in Sect. 3.2. As strong oxidizing agents, H2O2, O3, and PAN are proven to be damaging to vegetation and human health. Given the high concentrations of these oxidants observed in this study, photochemical pollution in rural areas poses serious risks to agricultural productivity and human health.
3.2 Diurnal patterns of three photochemical oxidants
The average diurnal trends in H2O2, PAN, and O3 exhibited pronounced daily variations, with concentrations peaking during the daytime and declining at night (Fig. 2). These trends closely followed solar radiation patterns, highlighting the significant contribution of photochemical reactions to their formation. In addition, the pronounced daily variations also indicated the presence of abundant precursors in the region facilitating the production of H2O2, PAN, and O3. In the early morning, as solar radiation intensified, the photolysis of HONO initiated daytime photochemical reactions (Reaction R1), generating peroxyl radicals (Reaction R2). These radicals reacted with NO to produce O3 (Reactions R3–R6), HO2 recombination underwent bimolecular recombination to produce H2O2 (Reaction R7), and peroxyacetyl radicals (PA) reacted with NO2 to form PAN (Reaction R8). These processes led to a rapid increase in the concentrations of all three oxidants, with peak concentrations reaching 1.8, 1.2, and 84 ppb for H2O2, PAN, and O3, respectively.
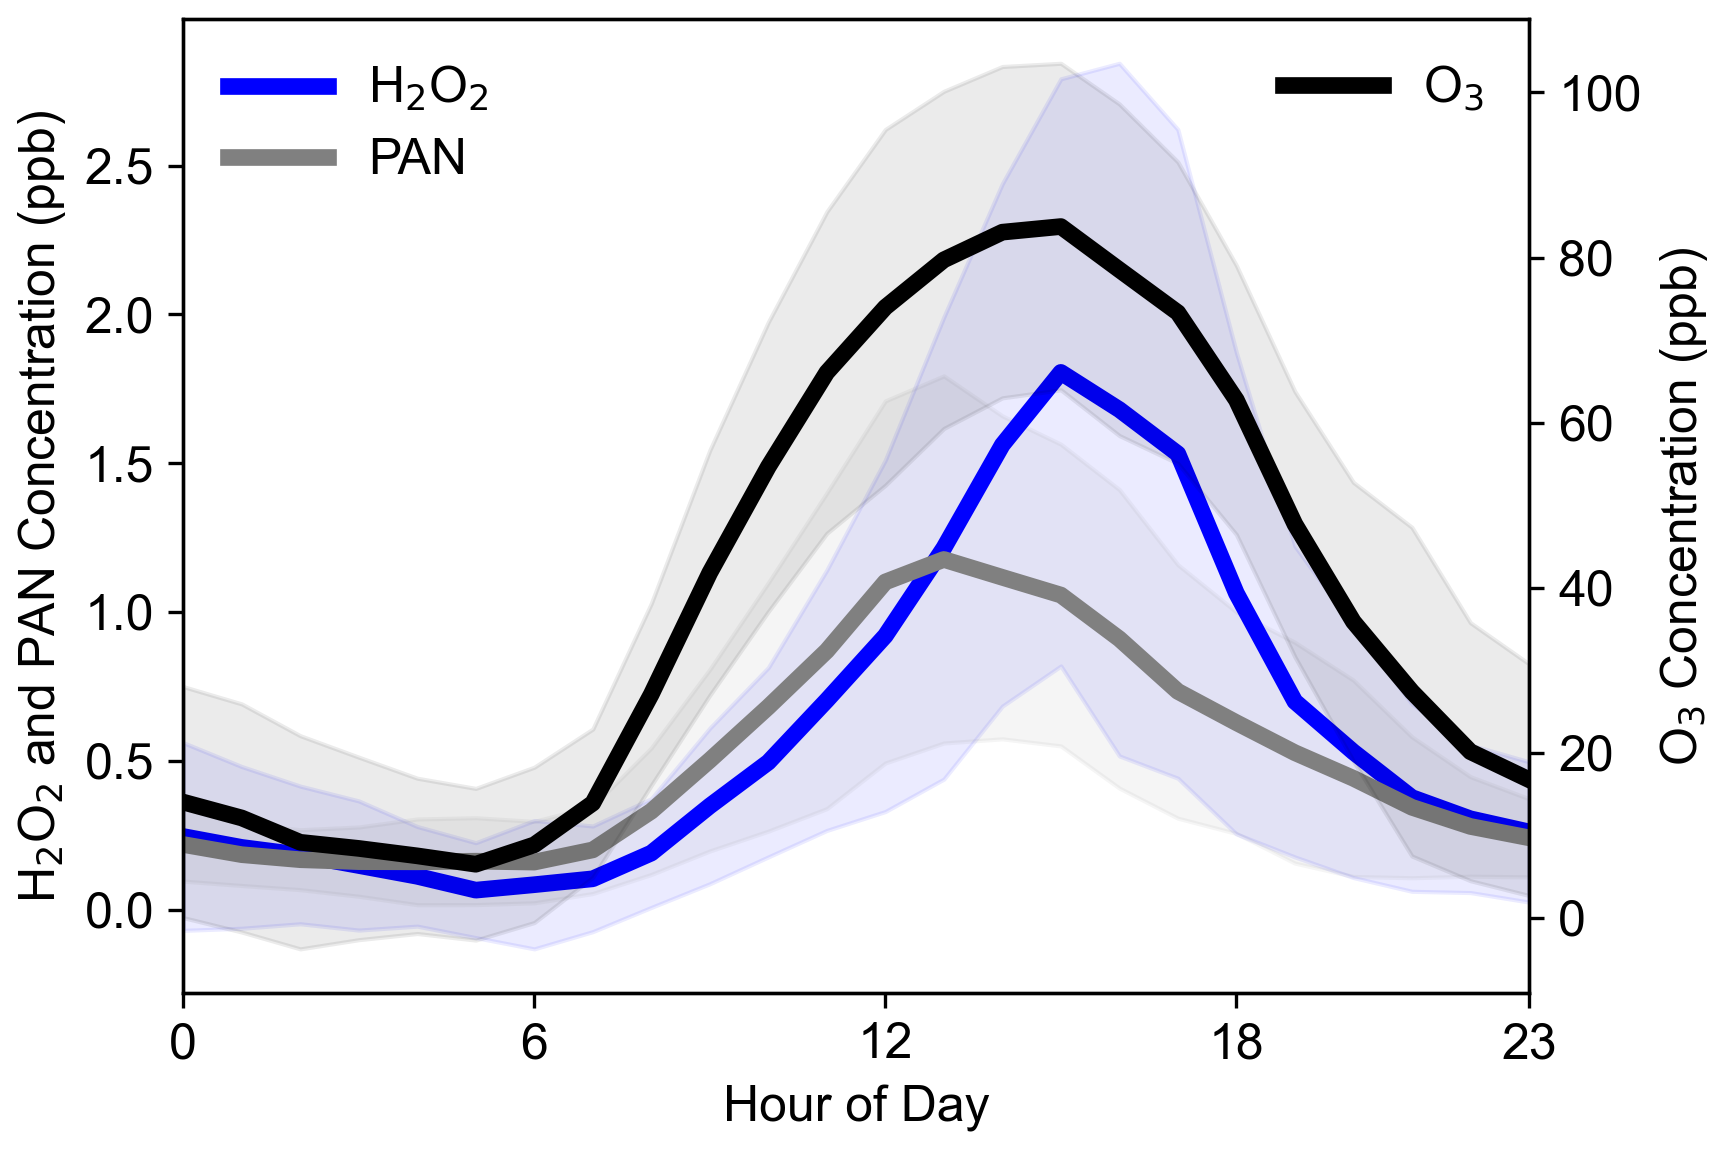
Figure 2Average diurnal cycles of H2O2, PAN, and O3 observed throughout the entire campaign period at the SRE-RCEES site.
Despite sharing similar photochemical formation pathways, the peak times of the three oxidants differed due to variations in their production and removal rates. PAN concentrations peaked around 12:00 LT (all subsequent times are in local time, LT), approximately 2–3 h earlier than H2O2 and O3, a phenomenon also observed in previous studies (Lee et al., 2008a). This earlier peak in PAN can be attributed to its higher thermal decomposition rate at midday. In contrast, the peaks for H2O2 and O3 both occurred around 16:00. Notably, in urban areas, H2O2 peaks often lag behind O3 peaks. For example, observations at the urban Tai'an site in the North China Plain revealed that H2O2 peaks occurred approximately 2 h after O3 peaks (Ye et al., 2021a). This delay can be explained by HO2 chemistry under varying NOx conditions. Under high-NOx conditions, HO2 primarily reacts with NO (reaction rate constant of 8.9 × 10⁻¹² cm3 molecule−1 s−1 at 298 K), whereas under low-NOx conditions, HO2 undergoes bimolecular recombination to form H2O2 (reaction rate constant of 1.5 × 10⁻¹² cm3 molecule−1 s−1 at 298 K). In urban settings, H2O2 peaks only occur when NO concentrations drop to around 100 ppt, allowing HO2 recombination to dominate, thus delaying the H2O2 peak relative to O3. However, at this rural site, daytime NO concentrations were consistently low, resulting in simultaneous peaks for O3 and H2O2.
Following their peaks, the concentrations of all three oxidants declined rapidly. For H2O2, this decrease was primarily driven by dry deposition and, in the evening, enhanced uptake by liquid aerosols formed as relative humidity increased. O3 concentrations dropped due to a combination of dry deposition and NO titration, while PAN levels decreased mainly through thermal decomposition. At night, the absence of photochemical reactions caused all three oxidants to maintain low concentrations.
Figure 3 illustrates the average diurnal trends in ROOH and H2O2. The trends in total peroxides closely align with those of H2O2, indicating similar production and removal mechanisms. H2O2 accounts for 69 % of the total peroxides on average, while ROOH (0.28 ppb) constitutes 31 %. This demonstrates that peroxides in rural areas are predominantly dominated by H2O2, consistent with the findings of Wang et al. (2016) at this site. However, it is important to note that the percentage of ROOH reported in this study represents a lower limit, as not all ROOH is fully captured by the measurement technique. In contrast, Liang et al. (2013) reported that ROOH accounted for 80 % of total peroxides in urban areas such as Beijing. The difference in organic peroxide proportions between Beijing and Wangdu can likely be attributed to variations in chemical conditions, such as differences in VOC compositions, which influence the types and abundances of the peroxyl radicals formed.
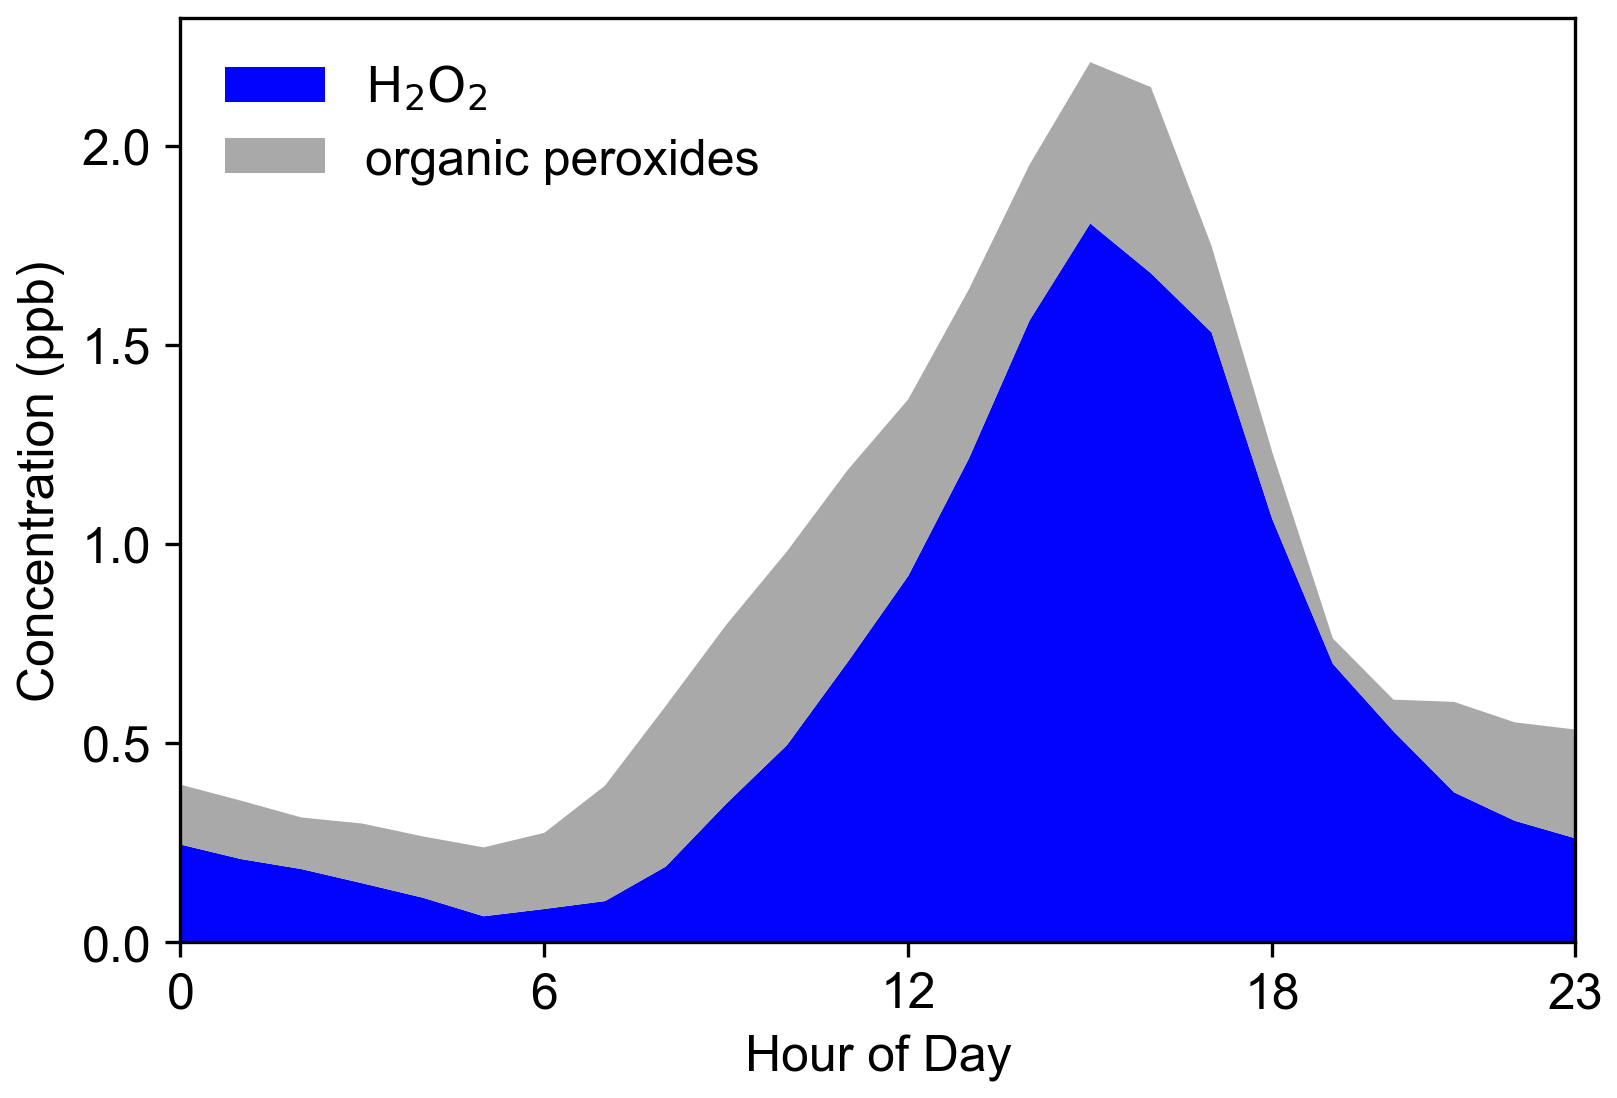
Figure 3Average diurnal cycles of H2O2 and organic peroxides (ROOH) observed throughout the entire campaign period at the SRE-RCEES site.
The diurnal variation in the relative contributions of H2O2 and ROOH to total peroxides reflects their distinct production and loss mechanisms. H2O2 dominates (over 90 %) around 19:00 due to strong photochemical production via HO2 recombination during the day, while its contribution drops to ∼ 25 % by 05:00 due to nighttime losses (e.g., heterogeneous uptake and dry deposition) without replenishment. In contrast, ROOH contributes more significantly in the early morning, likely due to slower loss rates compared to H2O2. ROOH molecules such as CH3OOH (methyl hydroperoxide) have much lower dry-deposition rates – approximately 30 times lower than that of H2O2 – leading to less nighttime loss and a higher relative contribution to total peroxides during early-morning hours. The minimum in ROOH concentration observed around 19:00 represents a transitional point. By this time, daytime photochemical production has largely ceased due to diminishing solar radiation, leading to a decline from its afternoon peak as the removal processes continue. The subsequent increase in ROOH concentration after 19:00, which makes 19:00 a local minimum, may be attributed to nighttime chemical production primarily through (a) the ozonolysis of alkenes (O3+ alkenes RO2 → ROOH) and (b) NO3 radical-initiated oxidation of VOCs (NO2 + O3 → NO3; NO3 + VOCs RO2 → ROOH). These processes become major sources of RO2 (and subsequently ROOH) during the night. In contrast, H2O2 typically continues to decrease throughout the night. Although ozonolysis can also be a source of H2O2, H2O2 generally has a higher dry-deposition velocity than many ROOH species, leading to more efficient net removal overnight. These differences highlight the distinct photochemical dynamics and loss mechanisms of H2O2 compared to ROOH, influenced by diurnal variations in radiation, precursor concentrations, and meteorological conditions.
3.3 Correlations between different atmospheric oxidants
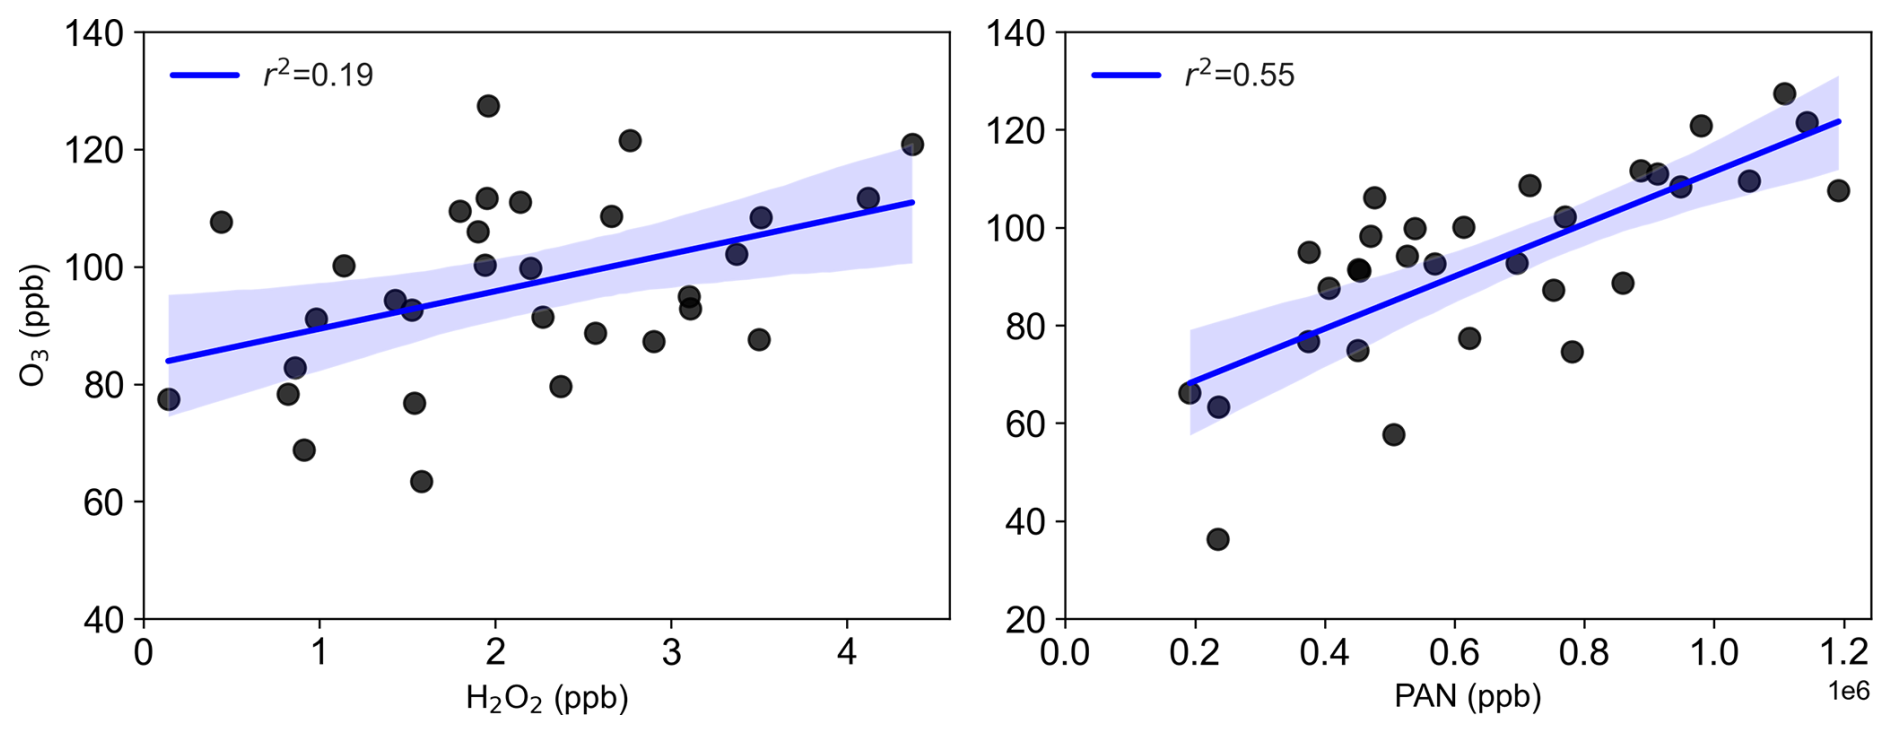
The formation of H2O2, O3, and PAN is closely linked to VOCs, NOx, and solar radiation. Consequently, their concentrations are typically elevated and well-correlated during photochemical pollution episodes. Here, we investigate the relationships among these oxidants. Figure 4 illustrates the correlations between the daily maximum concentrations of H2O2, O3, and PAN. A good correlation (r2=0.55) was observed between PAN and O3, consistent with previous studies (Lee et al., 2008a; Zhang et al., 2014; Xu et al., 2021; Sun et al., 2020). In contrast, the correlation between H2O2 and O3 was weak (r2=0.19). Prior research has shown positive correlations between H2O2 and O3 during photochemical pollution due to their shared dependence on VOC and NOx photochemistry (Hua et al., 2008; Takami et al., 2003; Ye et al., 2021a; Guo et al., 2022), while negative correlations have been reported in the clean marine boundary layer where O3 photolysis dominates radical production (Ayers et al., 1992). The lack of a positive correlation between O3 and H2O2 in this rural polluted environment may indicate additional factors influencing H2O2 concentrations. Notably, heterogeneous uptake by particles has been shown to affect H2O2 levels (de Reus et al., 2005; Qin et al., 2018), and given the relatively high PM2.5 concentrations during the observation period, we hypothesize that heterogeneous loss reduces gas-phase H2O2, weakening its correlation with O3. Additionally, aqueous-phase reactions in aerosol water or cloud droplets, facilitated by high relative humidity during the campaign, could further reduce gas-phase H2O2 without affecting O3, contributing to the decoupling of their peak values. While the focus on daytime maxima limits the direct relevance of nighttime chemistry, processes such as alkene ozonolysis or nocturnal deposition could influence background H2O2 levels, indirectly affecting daytime peaks.
To test this hypothesis, we analyzed the ratio on polluted (daily average PM2.5 < 50 µg m−3) and clean days (daily average PM2.5 ≥ 50 µg m−3). While O3 and H2O2 share similar photochemical formation pathways, O3 is less affected by particle uptake. O3 lifetime was estimated to be 13 d with respect to heterogeneous uptake for dust mass concentrations of 1000 µg m−3, highlighting the minor role of particle uptake on O3 removal (Tang et al., 2017). If the ratio remains stable across polluted and clean conditions, heterogeneous uptake likely has minimal impact on H2O2. However, if the ratio is higher during polluted periods, it is possible that PM2.5 may scavenge H2O2 by heterogeneous uptake. As shown in Fig. 5, the ratio during peak photochemical hours (09:00–18:00) was markedly higher on polluted days compared to clean days, supporting the hypothesis that heterogeneous uptake by PM2.5 significantly reduces H2O2 concentrations. It is important to note that this method provides only a preliminary assessment, as uncertainties exist due to differences in the dependence of H2O2 and O3 on peroxyl radical concentrations and their respective responses to radiation intensity. In addition, differences in photochemical regimes, potentially driven by varying ratios between clean and polluted days, could also influence the relationship independently of particle uptake effects. In the following section, we further examine the impact of PM2.5 on H2O2 budget using a box model.
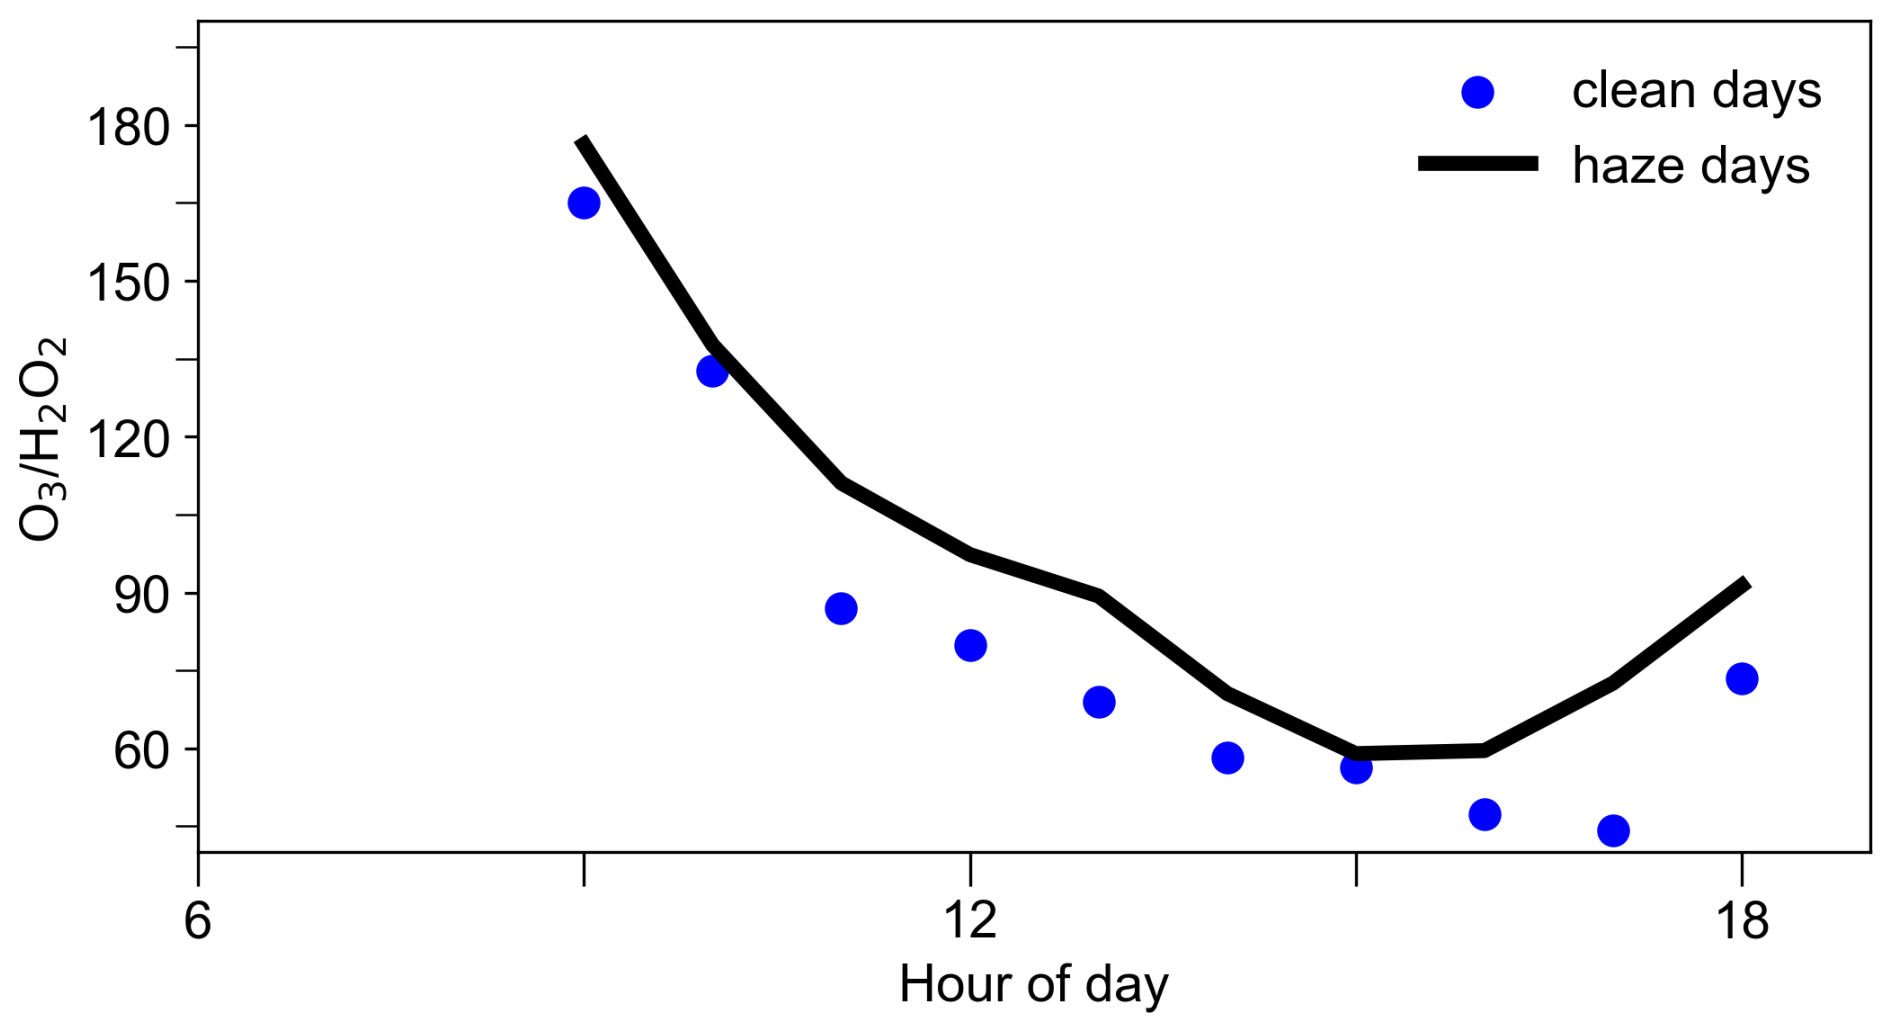
Figure 5Average from 09:00 to 18:00 on clean (daily average PM2.5 < 50 µg m−3) and polluted days (daily average PM2.5 ≥ 50 µg m−3).
3.4 Investigation of the H2O2 budget
To better understand the sources and removal mechanisms of H2O2, we employed a box model to simulate its concentrations. As shown in Fig. 6, base simulations using the model's default H2O2 source and removal mechanisms overestimated H2O2 concentrations compared to observations, with a simulated-to-measured ratio of 2.7. This discrepancy suggests an unaccounted removal pathway, consistent with our earlier hypothesis of H2O2 removal by particle uptake. When a parameterized uptake mechanism with an uptake coefficient of 6 × 10⁻⁴ was incorporated into the box model, the simulated H2O2 concentrations and trends aligned well with observed values (Fig. 6), confirming the significant role of particle uptake in H2O2 removal in rural areas. This uptake coefficient is comparable with the value (5 × 10⁻⁴) estimated during a dense Saharan dust event (de Reus et al., 2005) and lower than the value of 1 × 10⁻³ reported by Wang et al. (2016), which may be likely due to differences in particulate matter composition. Sensitivity tests indicated that an uptake coefficient of 1 × 10⁻³ resulted in underestimation (Fig. S1), supporting 6 × 10⁻⁴ as the optimal value for our study. This coefficient falls within the range (10−4–10−3) determined in laboratory studies for H2O2 uptake on ambient particles collected on filters or artificial particles (Pradhan et al., 2010; Romanias et al., 2012; Qin et al., 2022). We believe that this value represents a reasonable estimate for the conditions at our sampling site, although we acknowledge that a more dynamic treatment of heterogeneous processes that accounts for variations in aerosol composition, phase state, and ambient RH would be valuable in future studies.
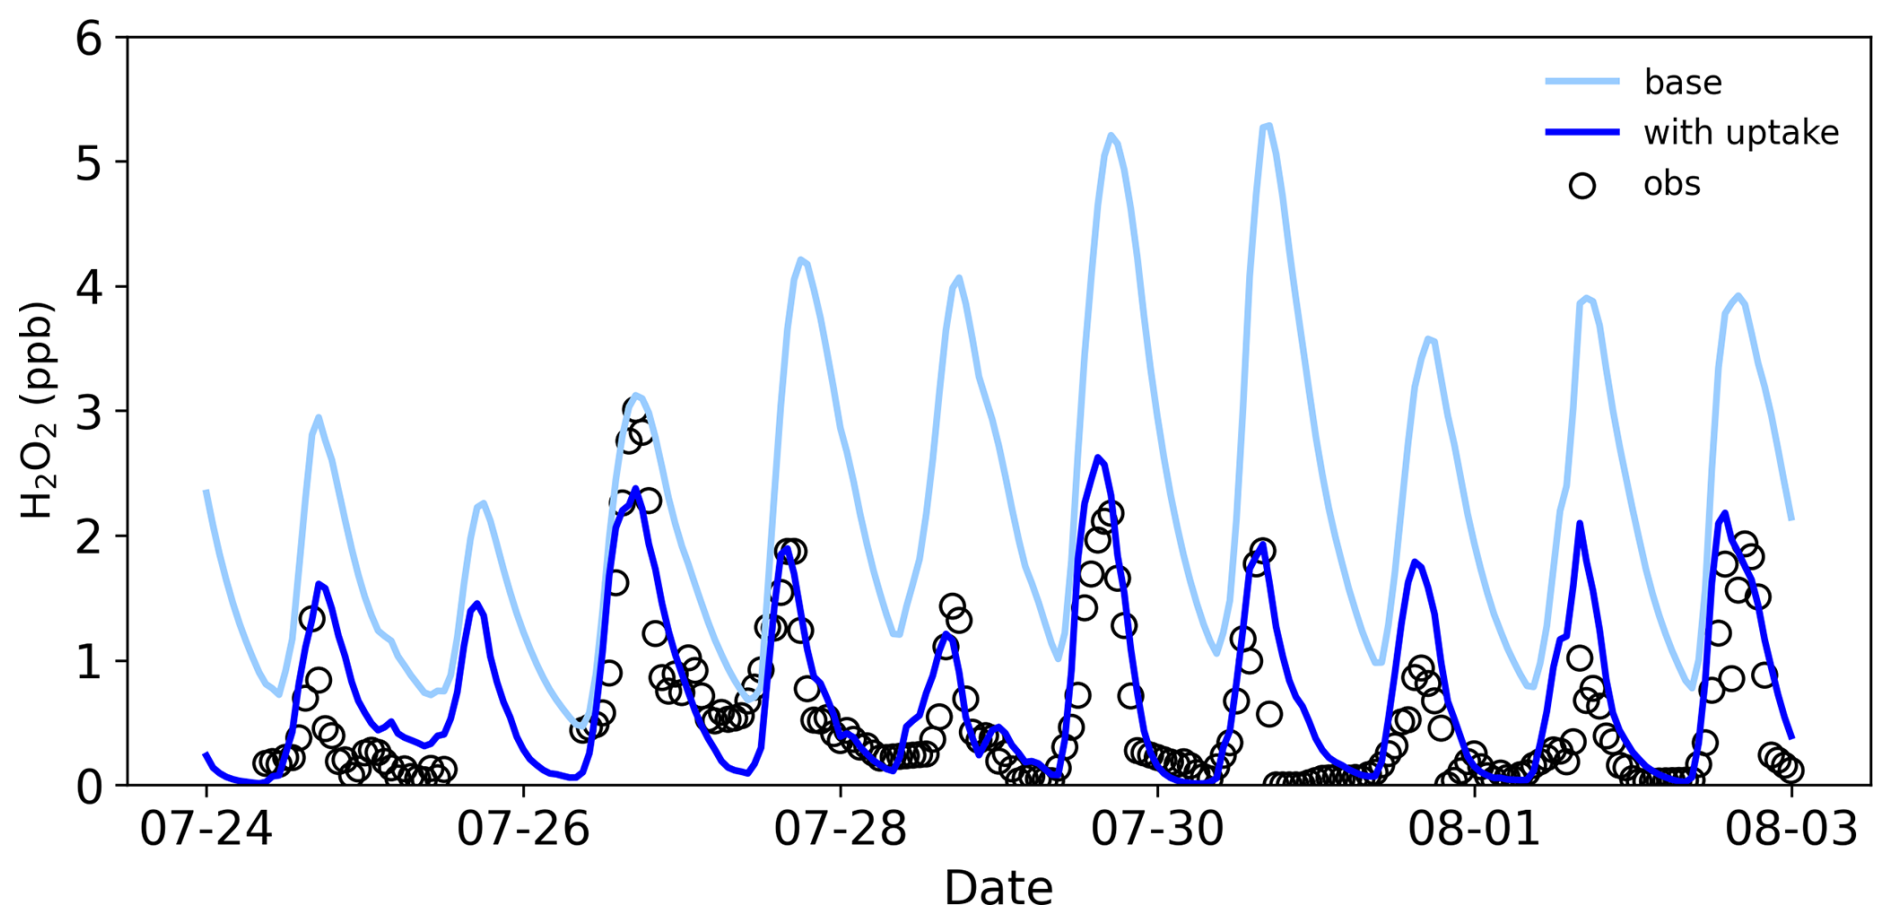
It should be mentioned that previous studies have demonstrated that considering HO2 uptake by particles can partially explain the discrepancy between observed and modeled HO2 concentrations under low-NOx conditions (Kanaya et al., 2007a, b; Whalley et al., 2010; Ma et al., 2022), as well as the phenomenon of increasing O3 concentrations with decreasing particulate matter levels (Li et al., 2019). Since HO2 is a precursor to H2O2, its uptake by particles naturally reduces H2O2 concentrations. However, laboratory-measured HO2 uptake coefficients exhibit significant variability, ranging from 10−5 to 0.82, and are strongly influenced by the composition of the particulate matter (Thornton et al., 2008; Taketani et al., 2012; George et al., 2013; Lakey et al., 2015). Through analysis of the measured radical budget and related parameters, Tan et al. (2020) showed that the HO2 uptake was not important in the North China Plain in 2014, with an uptake coefficient of 0.08. Given that our observational experiments were conducted at the same site with a similar particulate matter composition, we also assumed an HO2 uptake coefficient of 0.08 to investigate its impact on the H2O2 budget. Under this assumption, we found that an H2O2 uptake coefficient of 4.5 × 10⁻⁴ resulted in good agreement between modeled and observed H2O2 concentrations (Fig. S1). The results indicate that considering HO2 uptake reduces the H2O2 uptake coefficient by 25 %. Therefore, uncertainties in the HO2 uptake coefficient significantly affect the accurate simulation of H2O2 concentrations and the estimation of the H2O2 uptake coefficient. A more precise parameterization scheme for HO2 uptake is critical for models to accurately assess the global distribution of H2O2 concentrations and their environmental impacts.
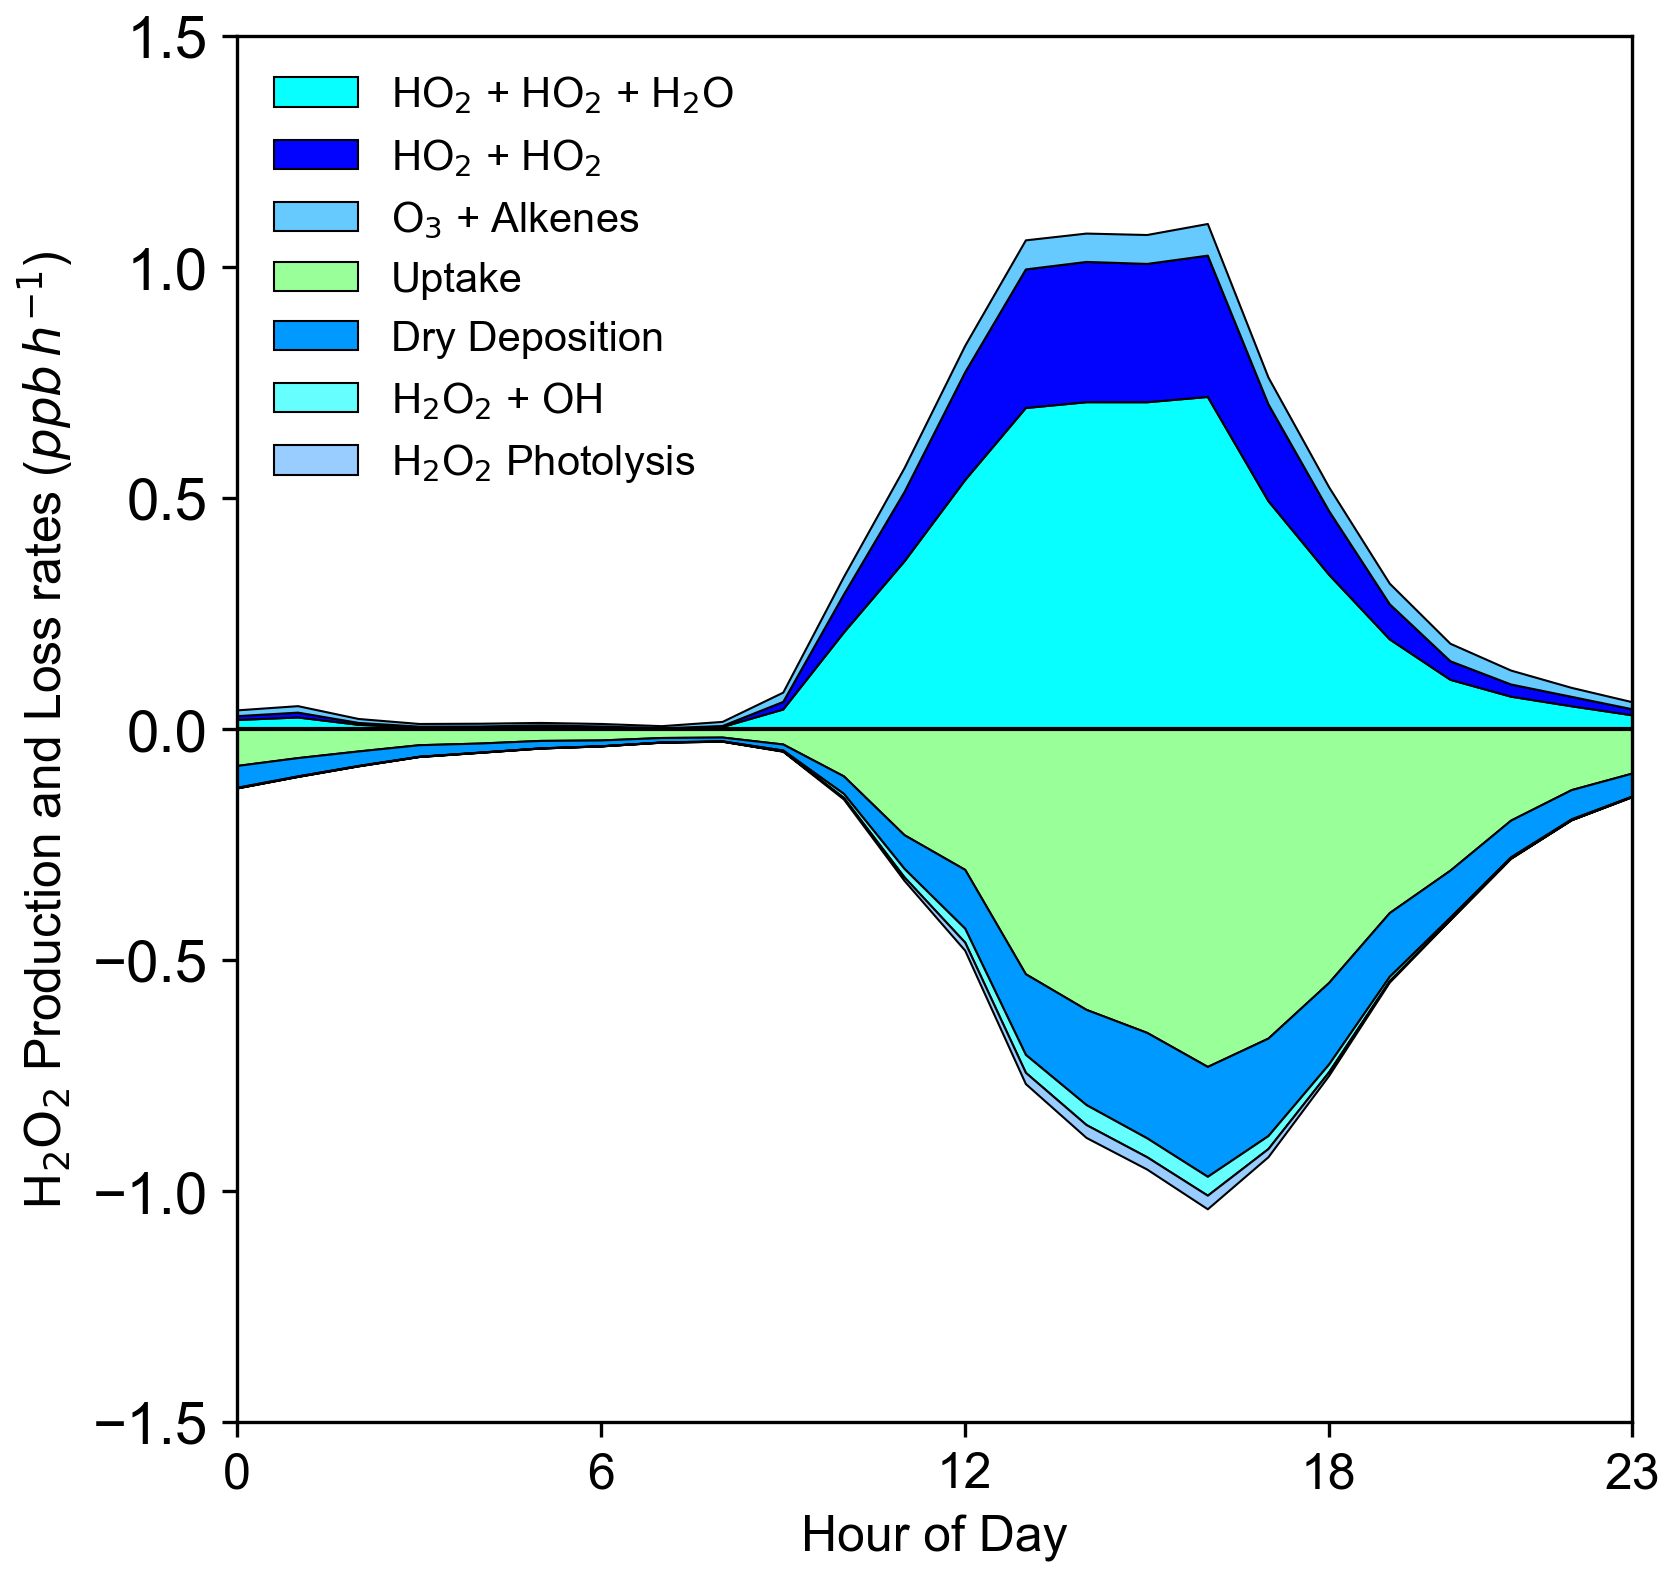
Figure 7 depicts the H2O2 production rates and removal rates by different pathways. The percentage contribution of different pathways is shown in Fig. S2. HO2 bimolecular recombination was identified as the dominant H2O2 production pathway, contributing 91 % of the H2O2 production, with a maximum yield of 1.0 ppb h−1 at noon. This highlighted rapid photochemical production as the primary driver of H2O2 pollution at the rural site. In contrast, the reaction of O3 with alkenes accounted for 9 % of H2O2 production (Fig. S2), with a maximum yield of 0.07 ppb h−1, primarily from O3 + OLI reactions. This mechanism was found to be significant during winter pollution due to high alkene and NO concentrations inhibiting HO2 recombination (Qin et al., 2018). Heterogeneous uptake dominated H2O2 removal, accounting for 69 %, with a maximum removal rate of 0.7 ppb h−1, underscoring its importance during summer pollution periods. Dry deposition, photolysis, and reaction with OH radicals contributed 25 %, 2 %, and 4 % H2O2 losses, respectively. These findings provide a comprehensive understanding of H2O2 sources and sinks in rural environments, emphasizing the critical role of particle uptake in the H2O2 budget.
3.5 Precursor control to mitigate H2O2 pollution
It is evident that photochemical pollution in rural areas is associated with elevated concentrations of H2O2, necessitating urgent measures to mitigate H2O2 pollution by regulating its precursor compounds. Given the diversity of precursors involved in H2O2 formation, a critical objective is to quantify the relative contribution of each precursor of H2O2 pollution to establish prioritized control strategies. In this study, the RIR method was employed to identify the most effective pollutants for H2O2 control (Fig. 8). Here it should be noted that the RIR analysis was performed using the adjusted model with an H2O2 uptake coefficient of 6 × 10⁻⁴ that showed good agreement with observations. The results demonstrate that reducing NO concentrations leads to an increase in H2O2 levels, as the reaction between NO and HO2 inhibits H2O2 production. However, under realistic conditions, a decrease in NO also results in reduced NO2 levels. Since the NO2 heterogeneous reaction is a significant source of HONO, which serves as a key precursor for OH that influences H2O2 formation, a decline in NO2 consequently reduces H2O2 concentrations. To validate this hypothesis, RIR values for NOx were calculated. Although the absolute RIR values for NOx remained negative (−0.06), they were significantly lower than those for NO (−0.9), indicating that the reduction in H2O2 due to decreased NO2 partially offsets the increase in H2O2 caused by reduced NO.
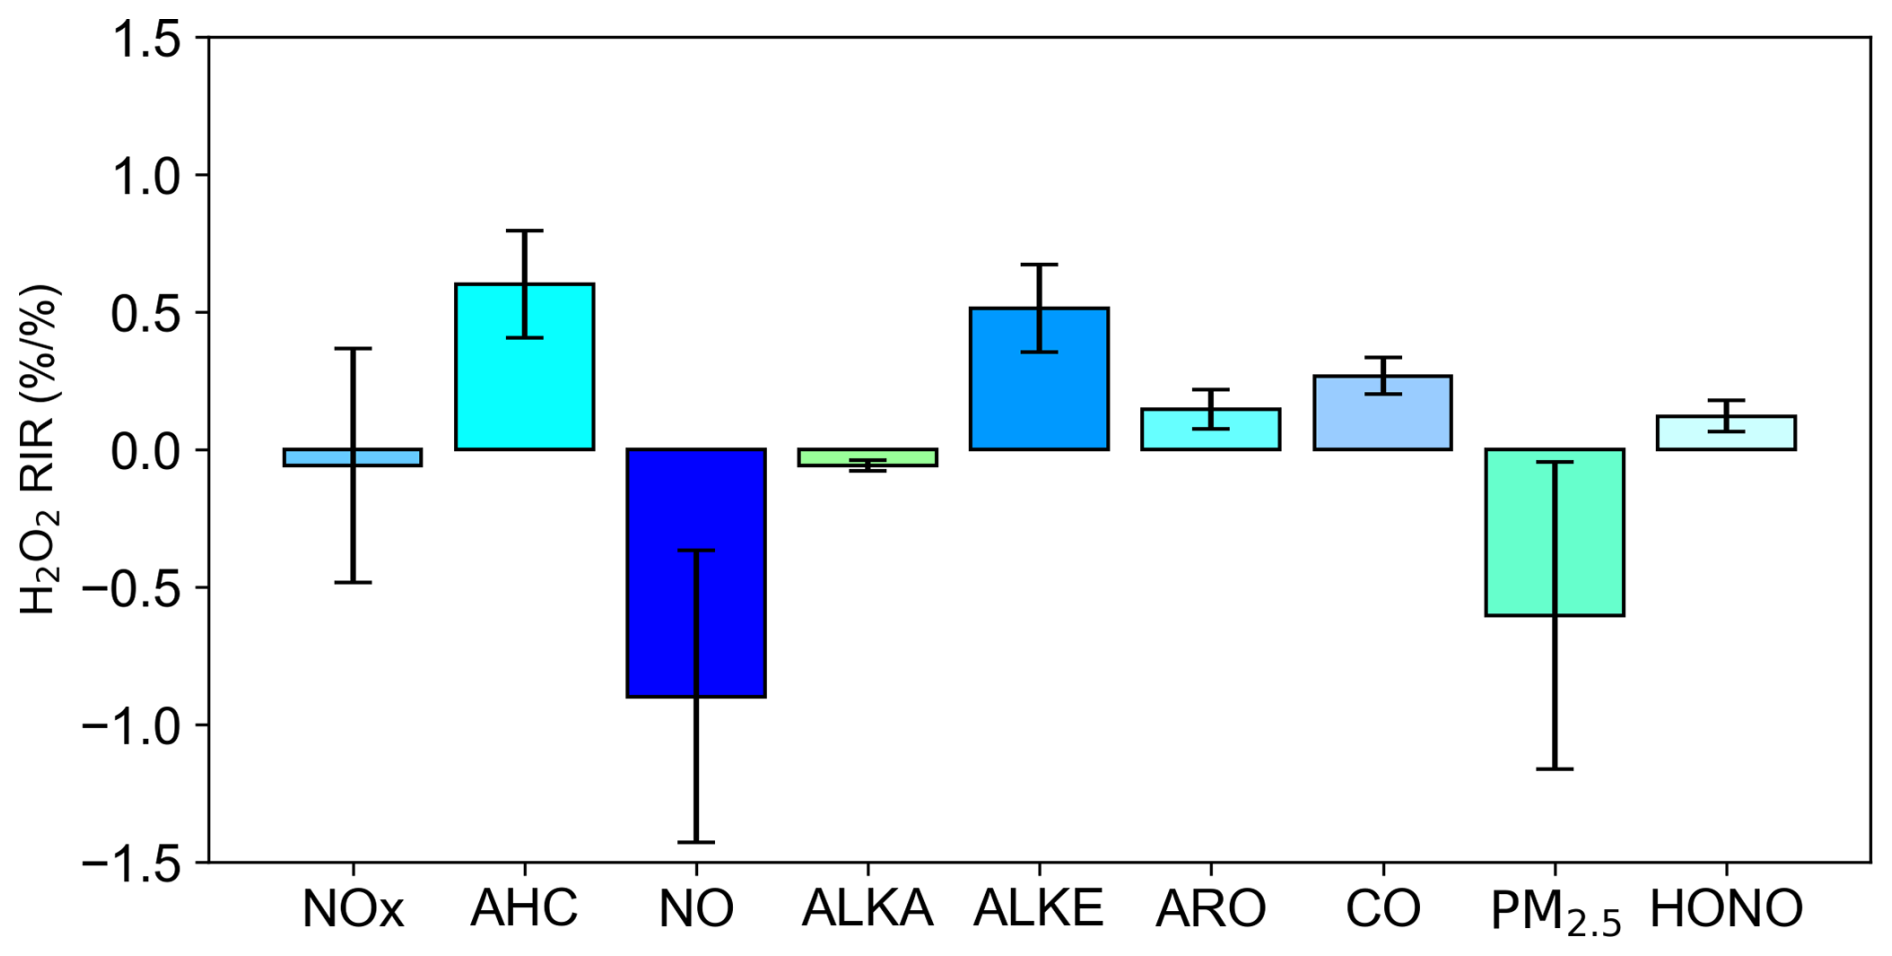
Furthermore, the negative RIR value for alkanes (−0.06) suggests that lowering alkane concentrations enhances H2O2 production, likely due to their lower photochemical reactivities with OH. When alkane levels are reduced, OH radicals preferentially react with more reactive alkenes and aromatics, leading to increased HO2 and hence more H2O2 formation. The RIR values for alkenes (0.51), aromatics (0.15), and CO (0.26) were consistently positive, indicating that reducing these pollutants is effective in reducing H2O2 concentrations, with alkenes exhibiting the most pronounced effect. Consequently, controlling alkene concentrations within anthropogenic VOCs should be prioritized, aligning with findings from previous studies (Wang et al., 2016; Ye et al., 2021a). Coal combustion and gasoline exhaust were identified as the primary sources of alkenes in the region, underscoring the importance of regulating these emissions to mitigate H2O2 pollution. Additionally, the RIR value for HONO was 0.12, indicating that reducing HONO concentrations can further diminish H2O2 levels by limiting the primary radical source. Elevated HONO concentrations have been observed across various sites in China, contributing over 40 % of the primary radical production. Thus, reducing HONO emissions represents a potential mitigating strategy for H2O2. Ye et al. (2022) reported that HONO emissions due to fertilizer use significantly increase H2O2 levels in rural areas, suggesting that reducing excessive fertilizer use could mitigate H2O2 pollution. Moreover, NO2 heterogeneous reactions at various interfaces and nitrate photolysis are additional sources of HONO (Xue et al., 2020; Xue et al., 2022), highlighting the potential to reduce H2O2 by decreasing NO2 concentrations and subsequently limiting HONO production.
The RIR value for PM2.5 (−0.6) was found to be negative, as reducing PM2.5 decreases the uptake of H2O2, thereby increasing its gas-phase concentration. Recent studies have extensively examined the impact of PM2.5 reduction on O3 concentrations, attributing this phenomenon to diminished HO2 radical uptake and enhanced photolysis rates, both of which elevate O3 levels (Wang et al., 2019; Song et al., 2022). These mechanisms similarly contribute to increased H2O2 concentrations, yet the effect of particulate matter reduction on H2O2 has been largely overlooked. This study demonstrates that PM2.5 reduction also decreases H2O2 uptake, further exacerbating its gas-phase concentration. This increase in H2O2 could enhance sulfate formation efficiency and pose greater threats to human health and ecosystems. Given the critical role of H2O2 in an atmospheric oxidation capacity, in global sulfate aerosol formation, and on human health, further research is warranted to investigate H2O2 trends, environmental impacts, and mitigation strategies.
3.6 Implications for O3 formation
H2O2 measurements serve as a valuable indicator of O3 production sensitivity. Under NOx-poor conditions, the HO2 recombination to form H2O2 represents the primary radical termination pathway. Conversely, under NOx-sufficient conditions, the reaction between NO2 and OH to form nitric acid (HNO3) constitutes the dominant termination mechanism. Sillman (1995) identified the ratio as a robust indicator of O3 sensitivity, with model simulations revealing that a ratio between 0.2 and 0.3 corresponds to a transitional regime, while values exceeding 0.3 indicate NOx-limited conditions and values below 0.2 suggest VOC-limited conditions. In the absence of direct gaseous HNO3 measurements, alternative metrics such as the or ratios can be employed to assess O3 sensitivity (Sillman et al., 1998), where NOz encompasses HNO3, PAN, HONO, and alkyl nitrates, and NOy is defined as NOz + NOx.
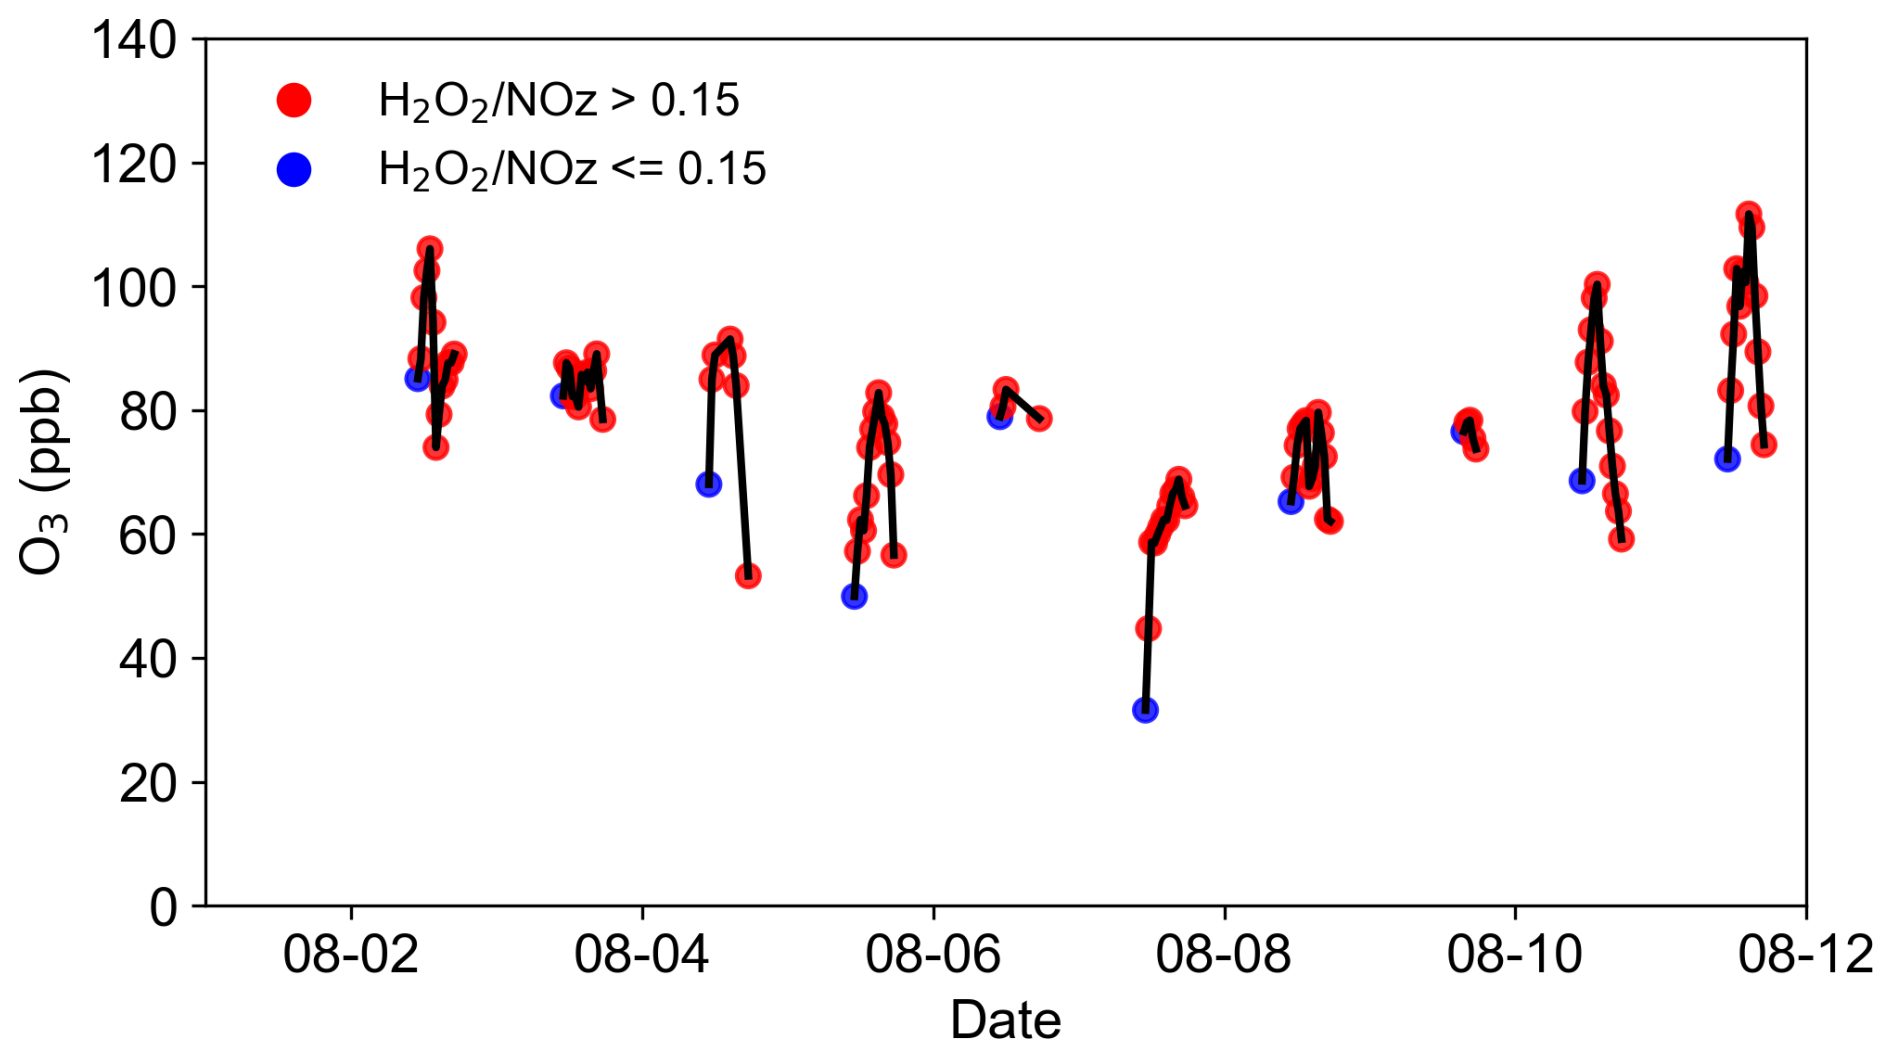
Figure 9O3 concentrations values from 1 to 11 August. The red points represent measurements where is greater than 0.15, while the blue points correspond to measurements where is less than or equal to 0.15.
In this study, simultaneous measurements of H2O2 and NOz enabled the determination of O3 sensitivity using the ratio, with a transitional range identified at 0.15–0.20 (Sillman et al., 1998). The analysis focused on the period of intense photochemical activity between 10:00 and 17:00. As illustrated in Fig. 9, over 82 % of measured values exceeded 0.15, indicating that the rural study area predominantly exhibited NOx-limited or transitional conditions during most of the observed period. It is important to note that this metric can be influenced by additional factors. For instance, significant uptake of H2O2 by particles was observed in this study, suggesting that the actual photochemical production of H2O2 is higher than the measured concentrations. Consequently, the theoretical ratio is likely greater than the observed values, implying that O3 production is more strongly aligned with NOx-limited or transitional regimes.
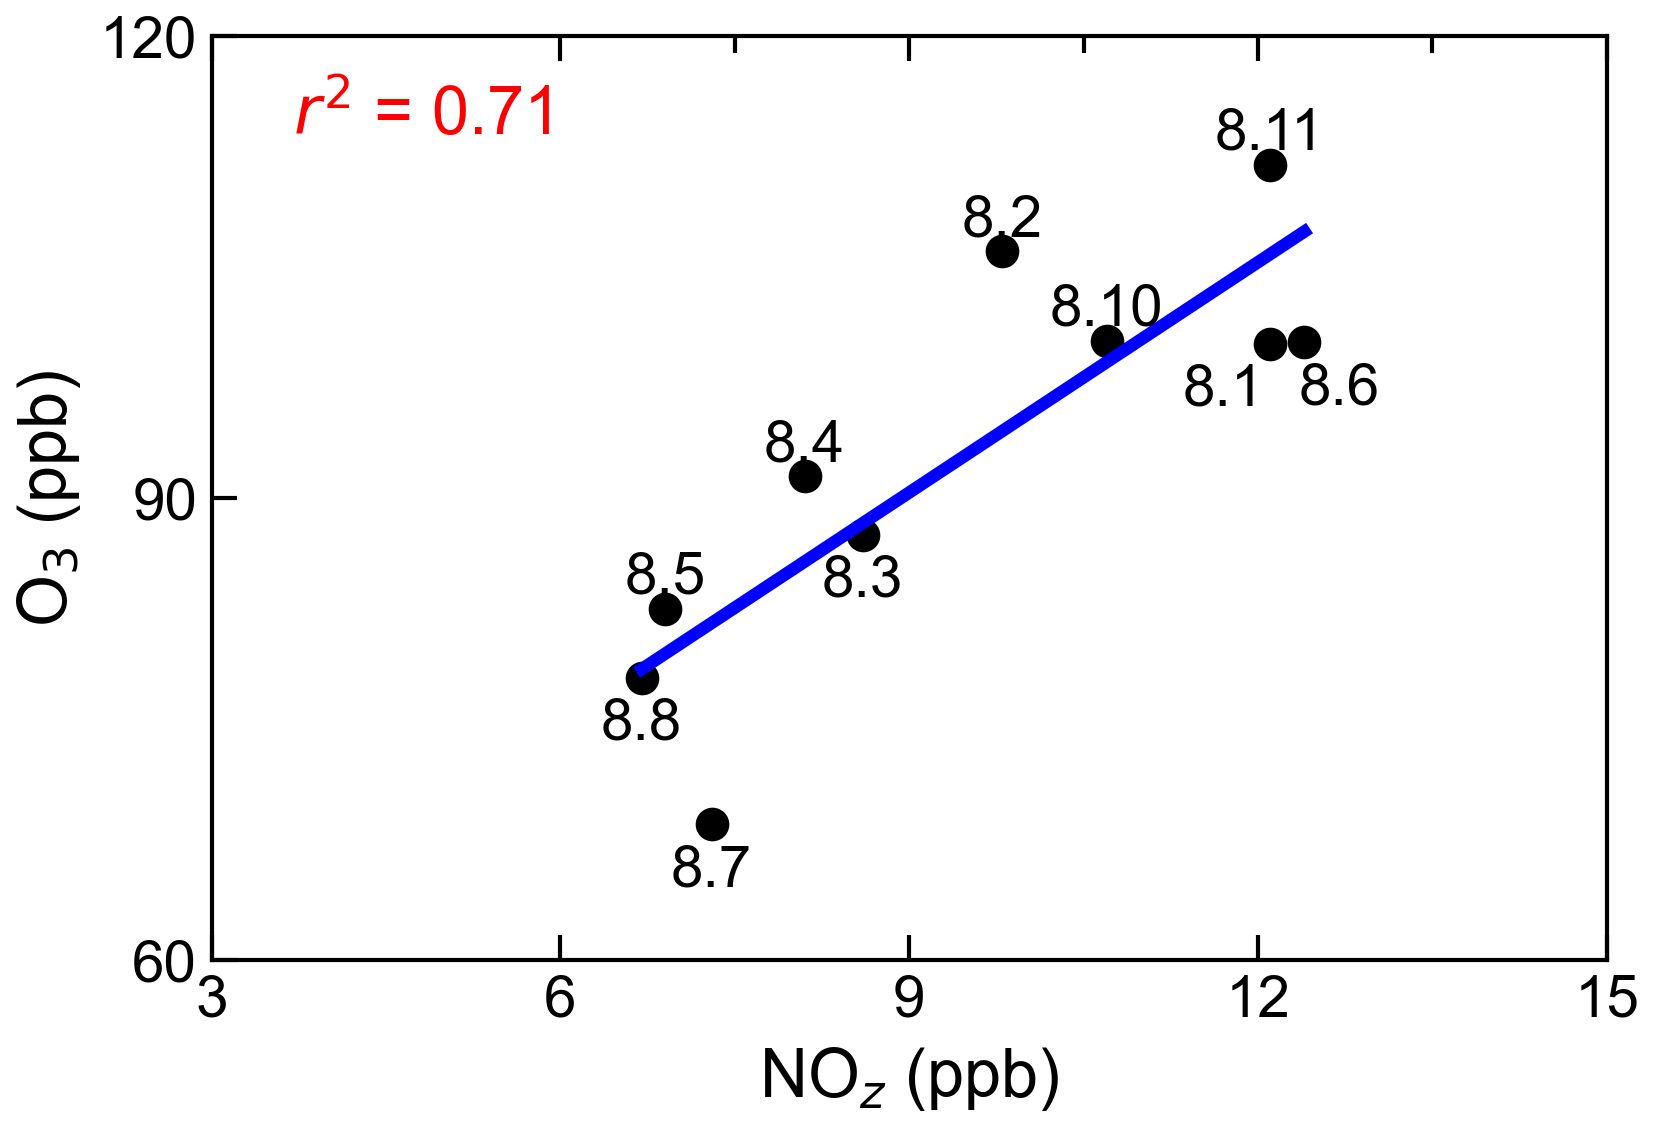
Figure 10Correlation between daily maxima of O3 and NOz. The numbers adjacent to the solid dots represent the dates.
To corroborate these findings, the ratio was also utilized to evaluate O3 sensitivity (Fig. 10). The relationship between peak O3 concentrations and peak NOz concentrations demonstrated a good positive correlation (r2=0.71), with a regression slope of 4.98. This slope is comparable with the value (3.3–7.6) reported in a mountainous area north of Beijing (Wang et al., 2006) but lower than those (6–11) observed in Houston (Daum et al., 2004). Notably, the positive correlation persisted up to NOz concentrations of 12 ppb, differing from observations at other sites where the slope typically decreased for NOz levels above 10 ppb (Trainer et al., 1993). This deviation can be attributed to reduced O3 production efficiency under VOC-limited conditions. However, the sustained positive correlation across the entire study period suggests that the generation of NOz is consistently accompanied by O3 production, further supporting the prevalence of NOx-sensitive or transitional regimes. These results align with those derived from the ratio, affirming the utility of as a reliable indicator of O3 sensitivity.
The findings underscore the importance of controlling NOx concentrations to mitigate photochemical pollution in rural areas. Tan et al. (2017) similarly reported that O3 production in the rural North China Plain is primarily NOx-limited. As NOx emissions continue to decline due to regulatory efforts, an increasing number of regions may transition to NOx-limited or transitional regimes, highlighting the potential benefits of stringent NOx reduction strategies for future O3 pollution control. However, given the need for synergistic management of H2O2 and O3, a dual approach targeting both NOx and VOC emissions remains essential. This integrated strategy will be critical to achieve effective and sustainable air quality improvements.
To investigate photochemical pollution in rural areas, measurements of H2O2 and related parameters were conducted in the Wangdu region during the summer of 2016. H2O2 exhibited a distinct diurnal pattern, with an average concentration of 0.62 ± 0.80 ppb. Daily maximum concentrations of H2O2 varied significantly, ranging from a minimum of 0.2 ppb to a maximum of 4 ppb. The diurnal cycles of H2O2, PAN, and O3 all followed solar radiation trends, indicating that photochemical reactions predominantly control their production. A good correlation (r2=0.55) was observed between daily maximum concentrations of PAN and O3, whereas the correlation between maximum concentrations of H2O2 and O3 was weak, suggesting that unidentified processes influencing gas-phase H2O2 concentrations may attenuate this relationship. Analysis of the ratio revealed that this ratio was significantly higher on polluted days compared to clean days, implying that particle uptake likely reduces gas-phase H2O2 concentrations.
To further elucidate the factors influencing H2O2 concentrations, a box model was employed. The model simulations initially overestimated H2O2 concentrations, with a modeled-to-observed ratio of 2.7. However, when an H2O2 heterogeneous uptake mechanism was incorporated into the model scheme with an uptake coefficient of 6 × 10⁻⁴, the simulated H2O2 concentrations aligned well with the observed data, underscoring the significant role of heterogeneous uptake in H2O2 removal. The primary source of H2O2 was identified as the bimolecular recombination of HO2, contributing 91 % of the total source strength, with a maximum production rate of 1 ppb h−1. The dominant removal pathways for H2O2 included particle uptake (69 %), followed by dry deposition (25 %), reaction with OH (4 %), and photolysis (2 %).
Relative incremental reactivity (RIR) analysis demonstrated that reducing NOx, PM2.5, and alkanes exacerbated H2O2 concentrations, whereas lowering alkenes, aromatics, CO, and HONO effectively reduced H2O2 pollution, with alkenes exhibiting the most pronounced impact. The ratio and the positive correlation between daily peak O3 and NOz concentrations indicated that O3 production predominantly occurred in transitional and NOx-limited regimes. To concurrently mitigate H2O2 and O3 pollution, a dual strategy focusing on VOC control and stringent NOx reduction is essential. This approach will be critical to achieve synergistic control of photochemical pollutants in rural areas.
Future research should focus on long-term H2O2 monitoring across different environments in the region, refining the parameterization of heterogeneous uptake processes (particularly for HO2 and H2O2 under varying aerosol compositions) and investigating the impacts of changing ratios on H2O2 chemistry. In addition, further research on the interactions between gas-phase oxidants and aerosol processes will be vital for understanding the complex feedback mechanisms that influence air quality in rural and urban environments.
The data used in this study are available from the corresponding author upon request (yjmu@rcees.ac.cn).
The supplement related to this article is available online at https://doi.org/10.5194/acp-25-6991-2025-supplement.
YM designed the experiments. CY performed the H2O2 measurements and analyzed the data. CY wrote the paper with input from PL and CX. All authors contributed to measurements, discussing results, and commenting on the paper.
The contact author has declared that none of the authors has any competing interests.
Publisher’s note: Copernicus Publications remains neutral with regard to jurisdictional claims made in the text, published maps, institutional affiliations, or any other geographical representation in this paper. While Copernicus Publications makes every effort to include appropriate place names, the final responsibility lies with the authors.
We thank the science teams of the summer campaign for their support.
This research has been supported by the National Natural Science Foundation of China (grant nos. 42305099 and 42275111).
The article processing charges for this open-access publication were covered by the Max Planck Society.
This paper was edited by Yugo Kanaya and reviewed by Matthew Johnson and one anonymous referee.
Allen, H. M., Bates, K. H., Crounse, J. D., Kim, M. J., Teng, A. P., Ray, E. A., and Wennberg, P. O.: H2O2 and CH3OOH (MHP) in the Remote Atmosphere: 2. Physical and Chemical Controls, J. Geophys. Res.-Atmos., 127, e2021JD035702, https://doi.org/10.1029/2021JD035702, 2022.
Ayers, G., Penkett, S., Gillett, R., Bandy, B., Galbally, I., Meyer, C., Elsworth, C., Bentley, S., and Forgan, B.: Evidence for photochemical control of ozone concentrations in unpolluted marine air, Nature, 360, 446–449, 1992.
Balasubramanian, R. and Husain, L.: Observations of gas-phase hydrogen peroxide at an elevated rural site in New York, J. Geophys. Res.-Atmos., 102, 21209–21220, https://doi.org/10.1029/97jd01480, 1997.
Becker, K. H., Brockmann, K. J., and Bechara, J.: Production of hydrogen peroxide in forest air by reaction of ozone with terpenes, Nature, 346, 256–258, 1990.
Calvert, J. G., Lazrus, A., Kok, G. L., Heikes, B. G., Walega, J. G., Lind, J., and Cantrell, C. A.: Chemical Mechanisms of Acid Generation in the Troposphere, Nature, 317, 27–35, https://doi.org/10.1038/317027a0, 1985.
Chen, X., Aoki, M., Takami, A., Chai, F., and Hatakeyama, S.: Effect of ambient-level gas-phase peroxides on foliar injury, growth, and net photosynthesis in Japanese radish (Raphanus sativus), Environ. Pollut., 158, 1675–1679, https://doi.org/10.1016/j.envpol.2009.12.002, 2010.
Daum, P. H., Kleinman, L. I., Springston, S. R., Nunnermacker, L. J., Lee, Y. N., Weinstein-Lloyd, J., Zheng, J., and Berkowitz, C. M.: Origin and properties of plumes of high ozone observed during the Texas 2000 Air Quality Study (TexAQS 2000), J. Geophys. Res.-Atmos., 109, D17306, https://doi.org/10.1029/2003JD004311, 2004.
de Reus, M., Fischer, H., Sander, R., Gros, V., Kormann, R., Salisbury, G., Van Dingenen, R., Williams, J., Zöllner, M., and Lelieveld, J.: Observations and model calculations of trace gas scavenging in a dense Saharan dust plume during MINATROC, Atmos. Chem. Phys., 5, 1787–1803, https://doi.org/10.5194/acp-5-1787-2005, 2005.
Fischer, H., Pozzer, A., Schmitt, T., Jöckel, P., Klippel, T., Taraborrelli, D., and Lelieveld, J.: Hydrogen peroxide in the marine boundary layer over the South Atlantic during the OOMPH cruise in March 2007, Atmos. Chem. Phys., 15, 6971–6980, https://doi.org/10.5194/acp-15-6971-2015, 2015.
Fischer, H., Axinte, R., Bozem, H., Crowley, J. N., Ernest, C., Gilge, S., Hafermann, S., Harder, H., Hens, K., Janssen, R. H. H., Königstedt, R., Kubistin, D., Mallik, C., Martinez, M., Novelli, A., Parchatka, U., Plass-Dülmer, C., Pozzer, A., Regelin, E., Reiffs, A., Schmidt, T., Schuladen, J., and Lelieveld, J.: Diurnal variability, photochemical production and loss processes of hydrogen peroxide in the boundary layer over Europe, Atmos. Chem. Phys., 19, 11953–11968, https://doi.org/10.5194/acp-19-11953-2019, 2019.
Gao, J., Wang, H., Liu, W., Xu, H., Wei, Y., Tian, X., Feng, Y., Song, S., and Shi, G.: Hydrogen peroxide serves as pivotal fountainhead for aerosol aqueous sulfate formation from a global perspective, Nat. Commun., 15, 4625, https://doi.org/10.1038/s41467-024-48793-1, 2024.
George, I. J., Matthews, P. S. J., Whalley, L. K., Brooks, B., Goddard, A., Baeza-Romero, M. T., and Heard, D. E.: Measurements of uptake coefficients for heterogeneous loss of HO2 onto submicron inorganic salt aerosols, Phys. Chem. Chem. Phys., 15, 12829–12845, https://doi.org/10.1039/C3CP51831K, 2013.
Guo, J., Tilgner, A., Yeung, C., Wang, Z., Louie, P. K. K., Luk, C. W. Y., Xu, Z., Yuan, C., Gao, Y., Poon, S., Herrmann, H., Lee, S., Lam, K. S., and Wang, T.: Atmospheric Peroxides in a Polluted Subtropical Environment: Seasonal Variation, Sources and Sinks, and Importance of Heterogeneous Processes, Environ. Sci. Technol., 48, 1443–1450, https://doi.org/10.1021/es403229x, 2014.
Guo, J., Wang, Z., Cui, Y., and Zhang, X.: Assessment of the H2O2 budget at an urban site concerning the HO2 underprediction and the vertical transport from residual layers, Atmos. Environ., 272, 118952, https://doi.org/10.1016/j.atmosenv.2022.118952, 2022.
He, S. Z., Chen, Z. M., Zhang, X., Zhao, Y., Huang, D. M., Zhao, J. N., Zhu, T., Hu, M., and Zeng, L. M.: Measurement of atmospheric hydrogen peroxide and organic peroxides in Beijing before and during the 2008 Olympic Games: Chemical and physical factors influencing their concentrations, J. Geophys. Res.-Atmos., 115, D17307, https://doi.org/10.1029/2009jd013544, 2010.
Hua, W., Chen, Z. M., Jie, C. Y., Kondo, Y., Hofzumahaus, A., Takegawa, N., Chang, C. C., Lu, K. D., Miyazaki, Y., Kita, K., Wang, H. L., Zhang, Y. H., and Hu, M.: Atmospheric hydrogen peroxide and organic hydroperoxides during PRIDE-PRD'06, China: their concentration, formation mechanism and contribution to secondary aerosols, Atmos. Chem. Phys., 8, 6755–6773, https://doi.org/10.5194/acp-8-6755-2008, 2008.
Kanaya, Y., Cao, R., Akimoto, H., Fukuda, M., Komazaki, Y., Yokouchi, Y., Koike, M., Tanimoto, H., Takegawa, N., and Kondo, Y.: Urban photochemistry in central Tokyo: 1. Observed and modeled OH and HO2 radical concentrations during the winter and summer of 2004, J. Geophys. Res.-Atmos., 112, D21312, https://doi.org/10.1029/2007JD008670, 2007a.
Kanaya, Y., Tanimoto, H., Matsumoto, J., Furutani, H., Hashimoto, S., Komazaki, Y., Tanaka, S., Yokouchi, Y., Kato, S., Kajii, Y., and Akimoto, H.: Diurnal variations in H2O2, O3, PAN, HNO3 and aldehyde concentrations and ratios at Rishiri Island, Japan: Potential influence from iodine chemistry, Sci. Total. Environ., 376, 185–197, https://doi.org/10.1016/j.scitotenv.2007.01.073, 2007b.
Klippel, T., Fischer, H., Bozem, H., Lawrence, M. G., Butler, T., Jöckel, P., Tost, H., Martinez, M., Harder, H., Regelin, E., Sander, R., Schiller, C. L., Stickler, A., and Lelieveld, J.: Distribution of hydrogen peroxide and formaldehyde over Central Europe during the HOOVER project, Atmos. Chem. Phys., 11, 4391–4410, https://doi.org/10.5194/acp-11-4391-2011, 2011.
Lakey, P. S. J., George, I. J., Whalley, L. K., Baeza-Romero, M. T., and Heard, D. E.: Measurements of the HO2 Uptake Coefficients onto Single Component Organic Aerosols, Environ. Sci. Technol., 49, 4878–4885, https://doi.org/10.1021/acs.est.5b00948, 2015.
Lazrus, A. L., Kok, G. L., Lind, J. A., Gitlin, S. N., Heikes, B. G., and Shetter, R. E.: Automated Fluorometric Method for Hydrogen-Peroxide in Air, Anal. Chem., 58, 594–597, https://doi.org/10.1021/Ac00294a024, 1986.
Lee, G., Jang, Y., Lee, H., Han, J.-S., Kim, K.-R., and Lee, M.: Characteristic behavior of peroxyacetyl nitrate (PAN) in Seoul megacity, Korea, Chemosphere, 73, 619–628, https://doi.org/10.1016/j.chemosphere.2008.05.060, 2008a.
Lee, M., Kie, J. A., Kim, Y. M., and Lee, G.: Characteristics of atmospheric hydrogen peroxide variations in Seoul megacity during 2002–2004, Sci. Total. Environ., 393, 299–308, https://doi.org/10.1016/j.scitotenv.2007.11.037, 2008b.
Li, J. R., Zhu, C., Chen, H., Fu, H. B., Xiao, H., Wang, X. F., Herrmann, H., and Chen, J. M.: A More Important Role for the Ozone-S(IV) Oxidation Pathway Due to Decreasing Acidity in Clouds, J. Geophys. Res.-Atmos., 125, e2020JD033220, https://doi.org/10.1029/2020jd033220, 2020.
Li, K., Jacob, D. J., Liao, H., Shen, L., Zhang, Q., and Bates, K. H.: Anthropogenic drivers of 2013–2017 trends in summer surface ozone in China, P. Natl. Acad. Sci. USA, 116, 422–427, https://doi.org/10.1073/pnas.1812168116, 2019.
Liang, H., Chen, Z. M., Huang, D., Zhao, Y., and Li, Z. Y.: Impacts of aerosols on the chemistry of atmospheric trace gases: a case study of peroxides and HO2 radicals, Atmos. Chem. Phys., 13, 11259–11276, https://doi.org/10.5194/acp-13-11259-2013, 2013.
Liu, P., Ye, C., Zhang, C., He, G., Xue, C., Liu, J., Liu, C., Zhang, Y., Song, Y., Li, X., Wang, X., Chen, J., He, H., Herrmann, H., and Mu, Y.: Photochemical Aging of Atmospheric Fine Particles as a Potential Source for Gas-Phase Hydrogen Peroxide, Environ. Sci. Technol., 55, 15063–15071, https://doi.org/10.1021/acs.est.1c04453, 2021.
Liu, Y., Geng, G., Cheng, J., Liu, Y., Xiao, Q., Liu, L., Shi, Q., Tong, D., He, K., and Zhang, Q.: Drivers of Increasing Ozone during the Two Phases of Clean Air Actions in China 2013–2020, Environ. Sci. Technol., 57, 8954–8964, https://doi.org/10.1021/acs.est.3c00054, 2023.
Lu, X., Zhang, L., Wang, X., Gao, M., Li, K., Zhang, Y., Yue, X., and Zhang, Y.: Rapid Increases in Warm-Season Surface Ozone and Resulting Health Impact in China Since 2013, Environ. Sci. Tech. Let., 7, 240–247, 2020.
Ma, X., Tan, Z., Lu, K., Yang, X., Chen, X., Wang, H., Chen, S., Fang, X., Li, S., Li, X., Liu, J., Liu, Y., Lou, S., Qiu, W., Wang, H., Zeng, L., and Zhang, Y.: OH and HO2 radical chemistry at a suburban site during the EXPLORE-YRD campaign in 2018, Atmos. Chem. Phys., 22, 7005–7028, https://doi.org/10.5194/acp-22-7005-2022, 2022.
Ma, Z., Xu, J., Quan, W., Zhang, Z., Lin, W., and Xu, X.: Significant increase of surface ozone at a rural site, north of eastern China, Atmos. Chem. Phys., 16, 3969–3977, https://doi.org/10.5194/acp-16-3969-2016, 2016.
Nunnermacker, L. J., Weinstein-Lloyd, J. B., Hillery, B., Giebel, B., Kleinman, L. I., Springston, S. R., Daum, P. H., Gaffney, J., Marley, N., and Huey, G.: Aircraft and ground-based measurements of hydroperoxides during the 2006 MILAGRO field campaign, Atmos. Chem. Phys., 8, 7619–7636, https://doi.org/10.5194/acp-8-7619-2008, 2008.
Peng, X., Wang, W., Xia, M., Chen, H., Ravishankara, A. R., Li, Q., Saiz-Lopez, A., Liu, P., Zhang, F., Zhang, C., Xue, L., Wang, X., George, C., Wang, J., Mu, Y., Chen, J., and Wang, T.: An unexpected large continental source of reactive bromine and chlorine with significant impact on wintertime air quality, Natl. Sci. Rev., 8, nwaa304, https://doi.org/10.1093/nsr/nwaa304, 2021.
Penkett, S. A., Jones, B. M. R., Brice, K. A., and Eggleton, A. E. J.: Importance of Atmospheric Ozone and Hydrogen-Peroxide in Oxidizing Sulfur-Dioxide in Cloud and Rainwater, Atmos. Environ., 13, 123–137, https://doi.org/10.1016/0004-6981(79)90251-8, 1979.
Pradhan, M., Kalberer, M., Griffiths, P. T., Braban, C. F., Pope, F. D., Cox, R. A., and Lambert, R. M.: Uptake of Gaseous Hydrogen Peroxide by Submicrometer Titanium Dioxide Aerosol as a Function of Relative Humidity, Environ. Sci. Technol., 44, 1360–1365, https://doi.org/10.1021/es902916f, 2010.
Qin, M., Chen, Z., Shen, H., Li, H., Wu, H., and Wang, Y.: Impacts of heterogeneous reactions to atmospheric peroxides: Observations and budget analysis study, Atmos. Environ., 183, 144–153, https://doi.org/10.1016/j.atmosenv.2018.04.005, 2018.
Qin, X., Chen, Z., Gong, Y., Dong, P., Cao, Z., Hu, J., and Xu, J.: Persistent Uptake of H2O2 onto Ambient PM2.5 via Dark-Fenton Chemistry, Environ. Sci. Technol., 56, 9978–9987, https://doi.org/10.1021/acs.est.2c03630, 2022.
Rao, Z., Fang, Y.-G., Pan, Y., Yu, W., Chen, B., Francisco, J. S., Zhu, C., and Chu, C.: Accelerated Photolysis of H2O2 at the Air–Water Interface of a Microdroplet, J. Am. Chem. Soc., 145, 24717–24723, https://doi.org/10.1021/jacs.3c08101, 2023.
Reeves, C. E. and Penkett, S. A.: Measurements of peroxides and what they tell us, Chem. Rev., 103, 5199–5218, https://doi.org/10.1021/cr0205053, 2003.
Ren, Y., Ding, A. J., Wang, T., Shen, X. H., Guo, J., Zhang, J. M., Wang, Y., Xu, P. J., Wang, X. F., Gao, J., and Collett, J. L.: Measurement of gas-phase total peroxides at the summit of Mount Tai in China, Atmos. Environ., 43, 1702–1711, https://doi.org/10.1016/j.atmosenv.2008.12.020, 2009.
Romanias, M. N., El Zein, A., and Bedjanian, Y.: Heterogeneous Interaction of H2O2 with TiO2 Surface under Dark and UV Light Irradiation Conditions, J. Phys. Chem. A, 116, 8191–8200, https://doi.org/10.1021/jp305366v, 2012.
Sillman, S.: The use of NOy, H2O2, and HNO3 as indicators for ozone-NOx-hydrocarbon sensitivity in urban locations, J. Geophys. Res.-Atmos., 100, 14175–14188, 1995.
Sillman, S., He, D., Pippin, M. R., Daum, P. H., Imre, D. G., Kleinman, L. I., Lee, J. H., and Weinstein-Lloyd, J.: Model correlations for ozone, reactive nitrogen, and peroxides for Nashville in comparison with measurements: Implications for O3-NOx-hydrocarbon chemistry, J. Geophys. Res.-Atmos., 103, 22629–22644, 1998.
Sofen, E. D., Alexander, B., and Kunasek, S. A.: The impact of anthropogenic emissions on atmospheric sulfate production pathways, oxidants, and ice core Δ17O(SO), Atmos. Chem. Phys., 11, 3565–3578, https://doi.org/10.5194/acp-11-3565-2011, 2011.
Song, H., Lu, K., Dong, H., Tan, Z., Chen, S., Zeng, L., and Zhang, Y.: Reduced Aerosol Uptake of Hydroperoxyl Radical May Increase the Sensitivity of Ozone Production to Volatile Organic Compounds, Environ. Sci. Tech. Let., 9, 22–29, https://doi.org/10.1021/acs.estlett.1c00893, 2022.
Sun, M., Cui, J. n., Zhao, X., and Zhang, J.: Impacts of precursors on peroxyacetyl nitrate (PAN) and relative formation of PAN to ozone in a southwestern megacity of China, Atmos. Environ., 231, 117542, https://doi.org/10.1016/j.atmosenv.2020.117542, 2020.
Takami, A., Shiratori, N., Yonekura, H., and Hatakeyama, S.: Measurement of hydroperoxides and ozone in Oku-Nikko area, Atmos. Environ., 37, 3861–3872, https://doi.org/10.1016/S1352-2310(03)00454-0, 2003.
Taketani, F., Kanaya, Y., Pochanart, P., Liu, Y., Li, J., Okuzawa, K., Kawamura, K., Wang, Z., and Akimoto, H.: Measurement of overall uptake coefficients for HO2 radicals by aerosol particles sampled from ambient air at Mts. Tai and Mang (China), Atmos. Chem. Phys., 12, 11907–11916, https://doi.org/10.5194/acp-12-11907-2012, 2012.
Tan, Z., Fuchs, H., Lu, K., Hofzumahaus, A., Bohn, B., Broch, S., Dong, H., Gomm, S., Häseler, R., He, L., Holland, F., Li, X., Liu, Y., Lu, S., Rohrer, F., Shao, M., Wang, B., Wang, M., Wu, Y., Zeng, L., Zhang, Y., Wahner, A., and Zhang, Y.: Radical chemistry at a rural site (Wangdu) in the North China Plain: observation and model calculations of OH, HO2 and RO2 radicals, Atmos. Chem. Phys., 17, 663–690, https://doi.org/10.5194/acp-17-663-2017, 2017.
Tan, Z., Hofzumahaus, A., Lu, K., Brown, S. S., Holland, F., Huey, L. G., Kiendler-Scharr, A., Li, X., Liu, X., Ma, N., Min, K.-E., Rohrer, F., Shao, M., Wahner, A., Wang, Y., Wiedensohler, A., Wu, Y., Wu, Z., Zeng, L., Zhang, Y., and Fuchs, H.: No Evidence for a Significant Impact of Heterogeneous Chemistry on Radical Concentrations in the North China Plain in Summer 2014, Environ. Sci. Technol., 54, 5973–5979, https://doi.org/10.1021/acs.est.0c00525, 2020.
Tang, M., Huang, X., Lu, K., Ge, M., Li, Y., Cheng, P., Zhu, T., Ding, A., Zhang, Y., Gligorovski, S., Song, W., Ding, X., Bi, X., and Wang, X.: Heterogeneous reactions of mineral dust aerosol: implications for tropospheric oxidation capacity, Atmos. Chem. Phys., 17, 11727–11777, https://doi.org/10.5194/acp-17-11727-2017, 2017.
Thornton, J. A., Jaeglé, L., and McNeill, V. F.: Assessing known pathways for HO2 loss in aqueous atmospheric aerosols: Regional and global impacts on tropospheric oxidants, J. Geophys. Res.-Atmos., 113, D05303, https://doi.org/10.1029/2007JD009236, 2008.
Trainer, M., Parrish, D. D., Buhr, M. P., Norton, R. B., Fehsenfeld, F. C., Anlauf, K. G., Bottenheim, J. W., Tang, Y. Z., Wiebe, H. A., Roberts, J. M., Tanner, R. L., Newman, L., Bowersox, V. C., Meagher, J. F., Olszyna, K. J., Rodgers, M. O., Wang, T., Berresheim, H., Demerjian, K. L., and Roychowdhury, U. K.: Correlation of ozone with NOy in photochemically aged air, J. Geophys. Res.-Atmos., 98, 2917–2925, https://doi.org/10.1029/92JD01910, 1993.
Walker, S. J., Evans, M. J., Jackson, A. V., Steinbacher, M., Zellweger, C., and McQuaid, J. B.: Processes controlling the concentration of hydroperoxides at Jungfraujoch Observatory, Switzerland, Atmos. Chem. Phys., 6, 5525–5536, https://doi.org/10.5194/acp-6-5525-2006, 2006.
Wang, T., Ding, A., Gao, J., and Wu, W. S.: Strong ozone production in urban plumes from Beijing, China, Geophys. Res. Lett., 33, L21806, https://doi.org/10.1029/2006GL027689, 2006.
Wang, W., Li, X., Shao, M., Hu, M., Zeng, L., Wu, Y., and Tan, T.: The impact of aerosols on photolysis frequencies and ozone production in Beijing during the 4-year period 2012–2015, Atmos. Chem. Phys., 19, 9413–9429, https://doi.org/10.5194/acp-19-9413-2019, 2019.
Wang, W., Parrish, D. D., Li, X., Shao, M., Liu, Y., Mo, Z., Lu, S., Hu, M., Fang, X., Wu, Y., Zeng, L., and Zhang, Y.: Exploring the drivers of the increased ozone production in Beijing in summertime during 2005–2016, Atmos. Chem. Phys., 20, 15617–15633, https://doi.org/10.5194/acp-20-15617-2020, 2020.
Wang, Y., Chen, Z., Wu, Q., Liang, H., Huang, L., Li, H., Lu, K., Wu, Y., Dong, H., Zeng, L., and Zhang, Y.: Observation of atmospheric peroxides during Wangdu Campaign 2014 at a rural site in the North China Plain, Atmos. Chem. Phys., 16, 10985–11000, https://doi.org/10.5194/acp-16-10985-2016, 2016.
Watanabe, K., Yachi, C., Nishibe, M., Michigami, S., Saito, Y., Eda, N., Yamazaki, N., and Hirai, T.: Measurements of atmospheric hydroperoxides over a rural site in central Japan during summers using a helicopter, Atmos. Environ., 146, 174–182, 2016.
Watkins, B. A., Parrish, D. D., Buhr, S., Norton, R. B., Trainer, M., Yee, J. E., and Fehsenfeld, F. C.: Factors influencing the concentration of gas phase hydrogen peroxide during the summer at Kinterbish, Alabama, J. Geophys. Res.-Atmos., 100, 22841–22851, https://doi.org/10.1029/95JD01533, 1995.
Whalley, L. K., Furneaux, K. L., Goddard, A., Lee, J. D., Mahajan, A., Oetjen, H., Read, K. A., Kaaden, N., Carpenter, L. J., Lewis, A. C., Plane, J. M. C., Saltzman, E. S., Wiedensohler, A., and Heard, D. E.: The chemistry of OH and HO2 radicals in the boundary layer over the tropical Atlantic Ocean, Atmos. Chem. Phys., 10, 1555–1576, https://doi.org/10.5194/acp-10-1555-2010, 2010.
Xu, W., Zhang, G., Wang, Y., Tong, S., Zhang, W., Ma, Z., Lin, W., Kuang, Y., Yin, L., and Xu, X.: Aerosol Promotes Peroxyacetyl Nitrate Formation During Winter in the North China Plain, Environ. Sci. Technol., 55, 3568–3581, https://doi.org/10.1021/acs.est.0c08157, 2021.
Xue, C., Ye, C., Kleffmann, J., Zhang, W., He, X., Liu, P., Zhang, C., Zhao, X., Liu, C., Ma, Z., Liu, J., Wang, J., Lu, K., Catoire, V., Mellouki, A., and Mu, Y.: Atmospheric measurements at Mt. Tai – Part II: HONO budget and radical (ROx + NO3) chemistry in the lower boundary layer, Atmos. Chem. Phys., 22, 1035–1057, https://doi.org/10.5194/acp-22-1035-2022, 2022.
Xue, C. Y., Zhang, C. L., Ye, C., Liu, P. F., Catoire, V., Krysztofiak, G., Chen, H., Ren, Y. G., Zhao, X. X., Wang, J. H., Zhang, F., Zhang, C. X., Zhang, J. W., An, J. L., Wang, T., Chen, J. M., Kleffmann, J., Mellouki, A., and Mu, Y. J.: HONO Budget and Its Role in Nitrate Formation in the Rural North China Plain, Environ. Sci. Technol., 54, 11048–11057, 2020.
Ye, C., Liu, P., Ma, Z., Xue, C., Zhang, C., Zhang, Y., Liu, J., Liu, C., Sun, X., and Mu, Y.: High H2O2 Concentrations Observed during Haze Periods during the Winter in Beijing: Importance of H2O2 Oxidation in Sulfate Formation, Environ. Sci. Tech. Let., 5, 757–763, https://doi.org/10.1021/acs.estlett.8b00579, 2018.
Ye, C., Xue, C., Zhang, C., Ma, Z., Liu, P., Zhang, Y., Liu, C., Zhao, X., Zhang, W., He, X., Song, Y., Liu, J., Wang, W., Sui, B., Cui, R., Yang, X., Mei, R., Chen, J., and Mu, Y.: Atmospheric Hydrogen Peroxide (H2O2) at the Foot and Summit of Mt. Tai: Variations, Sources and Sinks, and Implications for Ozone Formation Chemistry, J. Geophys. Res.-Atmos., 126, e2020JD033975, https://doi.org/10.1029/2020JD033975, 2021a.
Ye, C., Chen, H., Hoffmann, E. H., Mettke, P., Tilgner, A., He, L., Mutzel, A., Brüggemann, M., Poulain, L., Schaefer, T., Heinold, B., Ma, Z., Liu, P., Xue, C., Zhao, X., Zhang, C., Zhang, F., Sun, H., Li, Q., Wang, L., Yang, X., Wang, J., Liu, C., Xing, C., Mu, Y., Chen, J., and Herrmann, H.: Particle-Phase Photoreactions of HULIS and TMIs Establish a Strong Source of H2O2 and Particulate Sulfate in the Winter North China Plain, Environ. Sci. Technol., 55, 7818–7830, https://doi.org/10.1021/acs.est.1c00561, 2021b.
Ye, C., Xue, C., Liu, P., Zhang, C., Ma, Z., Zhang, Y., Liu, C., Liu, J., Lu, K., and Mu, Y.: Strong impacts of biomass burning, nitrogen fertilization, and fine particles on gas-phase hydrogen peroxide (H2O2), Sci. Total. Environ., 843, 156997, https://doi.org/10.1016/j.scitotenv.2022.156997, 2022.
Zhang, G., Mu, Y. J., Liu, J. F., Zhang, C. L., Zhang, Y. Y., Zhang, Y. J., and Zhang, H. X.: Seasonal and diurnal variations of atmospheric peroxyacetyl nitrate, peroxypropionyl nitrate, and carbon tetrachloride in Beijing, J. Environ. Sci.-China, 26, 65–74, https://doi.org/10.1016/S1001-0742(13)60382-4, 2014.
Zhang, Q., Liu, J., He, Y., Yang, J., Gao, J., Liu, H., Tang, W., Chen, Y., Fan, W., Chen, X., Chai, F., and Hatakeyama, S.: Measurement of hydrogen peroxide and organic hydroperoxide concentrations during autumn in Beijing, China, J. Environ. Sci.-China, 64, 72–81, https://doi.org/10.1016/j.jes.2016.12.015, 2018.
Zhang, X., He, S. Z., Chen, Z. M., Zhao, Y., and Hua, W.: Methyl hydroperoxide (CH3OOH) in urban, suburban and rural atmosphere: ambient concentration, budget, and contribution to the atmospheric oxidizing capacity, Atmos. Chem. Phys., 12, 8951–8962, https://doi.org/10.5194/acp-12-8951-2012, 2012.