the Creative Commons Attribution 4.0 License.
the Creative Commons Attribution 4.0 License.
 | 16 Jun 2025
Volatile organic compound sources and impacts in an urban Mediterranean area (Marseille, France)
Marvin Dufresne
Thérèse Salameh
Thierry Leonardis
Grégory Gille
Alexandre Armengaud
Stéphane Sauvage
Long-term measurements of volatile organic compound (VOC) concentrations are crucial to improve our knowledge about their role in atmospheric chemistry, especially in regions with high photochemistry, such as the Mediterranean Basin. A field measurement campaign of 18 months has been conducted in Marseille from March 2019 to August 2020 with online measurements of C2 to C16 non-methane hydrocarbons (NMHCs) using two thermal desorber–gas chromatography–flame ionization detector (TD-GC-FID) instruments. The positive matrix factorization model has been applied to this dataset for each season. Six yearlong factors were identified (traffic exhaust, fuel evaporation, industrial sources, shipping, regional and local urban backgrounds, and IVOCs), and two seasonal factors were identified (biogenic sources in summer and residential heating during cold periods).
Traffic (exhaust and evaporation) is the largest contributor to measured NMHC concentrations, with a relative contribution of about 40 %, with the exception of spring 2020, where the relative contribution was only 25 %. The potential contribution of each factor to secondary pollutant formation has been evaluated. Results reveal that the shipping source is potentially one of the most important contributors to secondary organic aerosol formation potential, despite the low contribution of this factor to NMHC concentrations.
The impact of the lockdown due to Covid-19 is clearly visible across all sources, especially the traffic source. The contribution of this source decreased by half during spring 2020 in comparison with other seasons.
A comparison of these results with emission inventories may be useful to evaluate their accuracy for a better understanding of the atmospheric pollution occurring in Marseille.
- Article
(3319 KB) - Full-text XML
-
Supplement
(1263 KB) - BibTeX
- EndNote


Non-methane hydrocarbons (NMHCs) are emitted into the atmosphere by different sources, either of anthropogenic origin, such as road traffic, residential heating, solvent use, and industrial activities, or of natural origin, such as biogenic emissions from plants and trees (Wang et al., 2020; Panopoulou et al., 2018; Thera et al., 2019). Once emitted, these compounds participate in tropospheric photochemistry, contributing to the formation of secondary pollutants like ozone and secondary organic aerosols (SOAs), which may impact health and climate (Lelieveld et al., 2015).
Some of these NMHCs, like benzene and 1,3-butadiene, are classified as carcinogenic by the International Agency for Research on Cancer (IARC). In addition to the health impacts of some of these NMHCs, secondary pollutants also have an impact on health. A recent publication from the World Health Organization (WHO) has pointed out that there are 4.2 million people dying of diseases each year linked to ambient air pollution, and 9 persons out of 10 in the world breathe in polluted air (World Health Organization, 2025b).
Air pollution is even more dramatic in urban environments, with more than 80 % of people living in urban areas where air pollution exceeds the WHO air quality guidelines (World Health Organization, 2025a). Some urban environments, like the Mediterranean Basin, are particularly affected by ambient air pollution and its consequences due to the growing urbanization in this region and considerable anthropogenic and environmental pressures, with contributions of important sources from industries and shipping. Additionally, the Mediterranean climate, characterized by high photochemistry, is conducive to the formation of secondary pollutants, which makes this region a hot spot for global warming (Lelieveld et al., 2014). The Chemistry–Aerosol Mediterranean Experiment (ChArMEx) project, conducted through a coordinated experimental effort, aimed to assess the budget and the climatology of atmospheric pollutants and their impact on air quality and climate. The associated TRANSport, Emissions and Mitigation in the East Mediterranean (TRANSEMED) project focused on atmospheric pollution due to anthropogenic activities in urban areas of the eastern part of the Mediterranean Basin. In this framework, studies have shown a high level of organic compounds in Beirut, Athens, and Istanbul (Panopoulou et al., 2018; Salameh et al., 2016; Thera et al., 2019). Concerning the western part, a study has been performed in Cape Corsica at a remote site (Michoud et al., 2017), but there is a lack of studies on urban areas in this part of the basin. Marseille, a French city in the western part of the Mediterranean Basin, is of interest for improving our knowledge of air pollution in this urban area of the basin. Due to its proximity to an important industrial complex, the presence of the port inside the city, and important anthropogenic activity (as the second-largest city and the third-biggest metropole in France in terms of the number of inhabitants), Marseille is particularly affected by air pollution.
In Marseille, frequent ozone pollution episodes are observed in summer, while PM pollution events occur mainly in winter (Chazeau et al., 2021). The significant health impact of ambient air pollution has been demonstrated in Marseille (Khaniabadi and Sicard, 2021; Magazzino et al., 2020).
Despite these secondary pollutant pollution events, there are still few studies concerning NMHCs in Marseille, and the last one occurred 20 years ago and was conducted across a span of only a few weeks (Coll et al., 2010). According to CITEPA (CITEPA, 2020), some NMHC source emissions have decreased significantly in the last few years. This decrease may be visible in terms of NMHC concentrations (Waked et al., 2016), but uncertainties associated with NMHC emission inventories are still high, especially regarding their speciation (Thunis et al., 2016; Trombetti et al., 2018). Moreover, heavier NMHC-like intermediate-volatility organic compounds (IVOCs) are not well investigated in the literature, despite their important contribution to SOA formation (Ots et al., 2016) and have not been investigated in Marseille yet. This lack of knowledge increases uncertainties in local and regional emission inventories that are used as inputs in the chemistry-transport models used for the implementation of policies to prevent air pollution episodes.
The aim of this work is to identify and quantify the major sources of NMHCs at an urban background site in Marseille, France, over a 1.5-year dataset and evaluate their impact on air pollution. A large set of speciated NMHCs from C2 to C16, including IVOCs, has continuously been measured on an hourly basis from March 2019 to August 2020, providing a unique database.
2.1 Measurement site
A field campaign was conducted from March 2019 to August 2020 at Longchamp in Marseille, an urban background station operated by the local air quality monitoring network (AASQA) AtmoSud. This measurement station is located in a residential area, more precisely in Longchamp Park, at 43°18′19′′ N, 5°23′41′′ E and at an altitude of 71 m above sea level. The measurement site (Fig. 1) is 2 km from the port in the east-southeast direction and 100 m from the nearest road axis. Industrial sources are located farther from the site: a plastic industry 9 km to the east, a metallurgical manufactory and the industrial port of Marseille-Fos 40 km to the west-northwest, and a petrochemical industry 27 km to the northwest. The airport is located 20 km to the northwest.
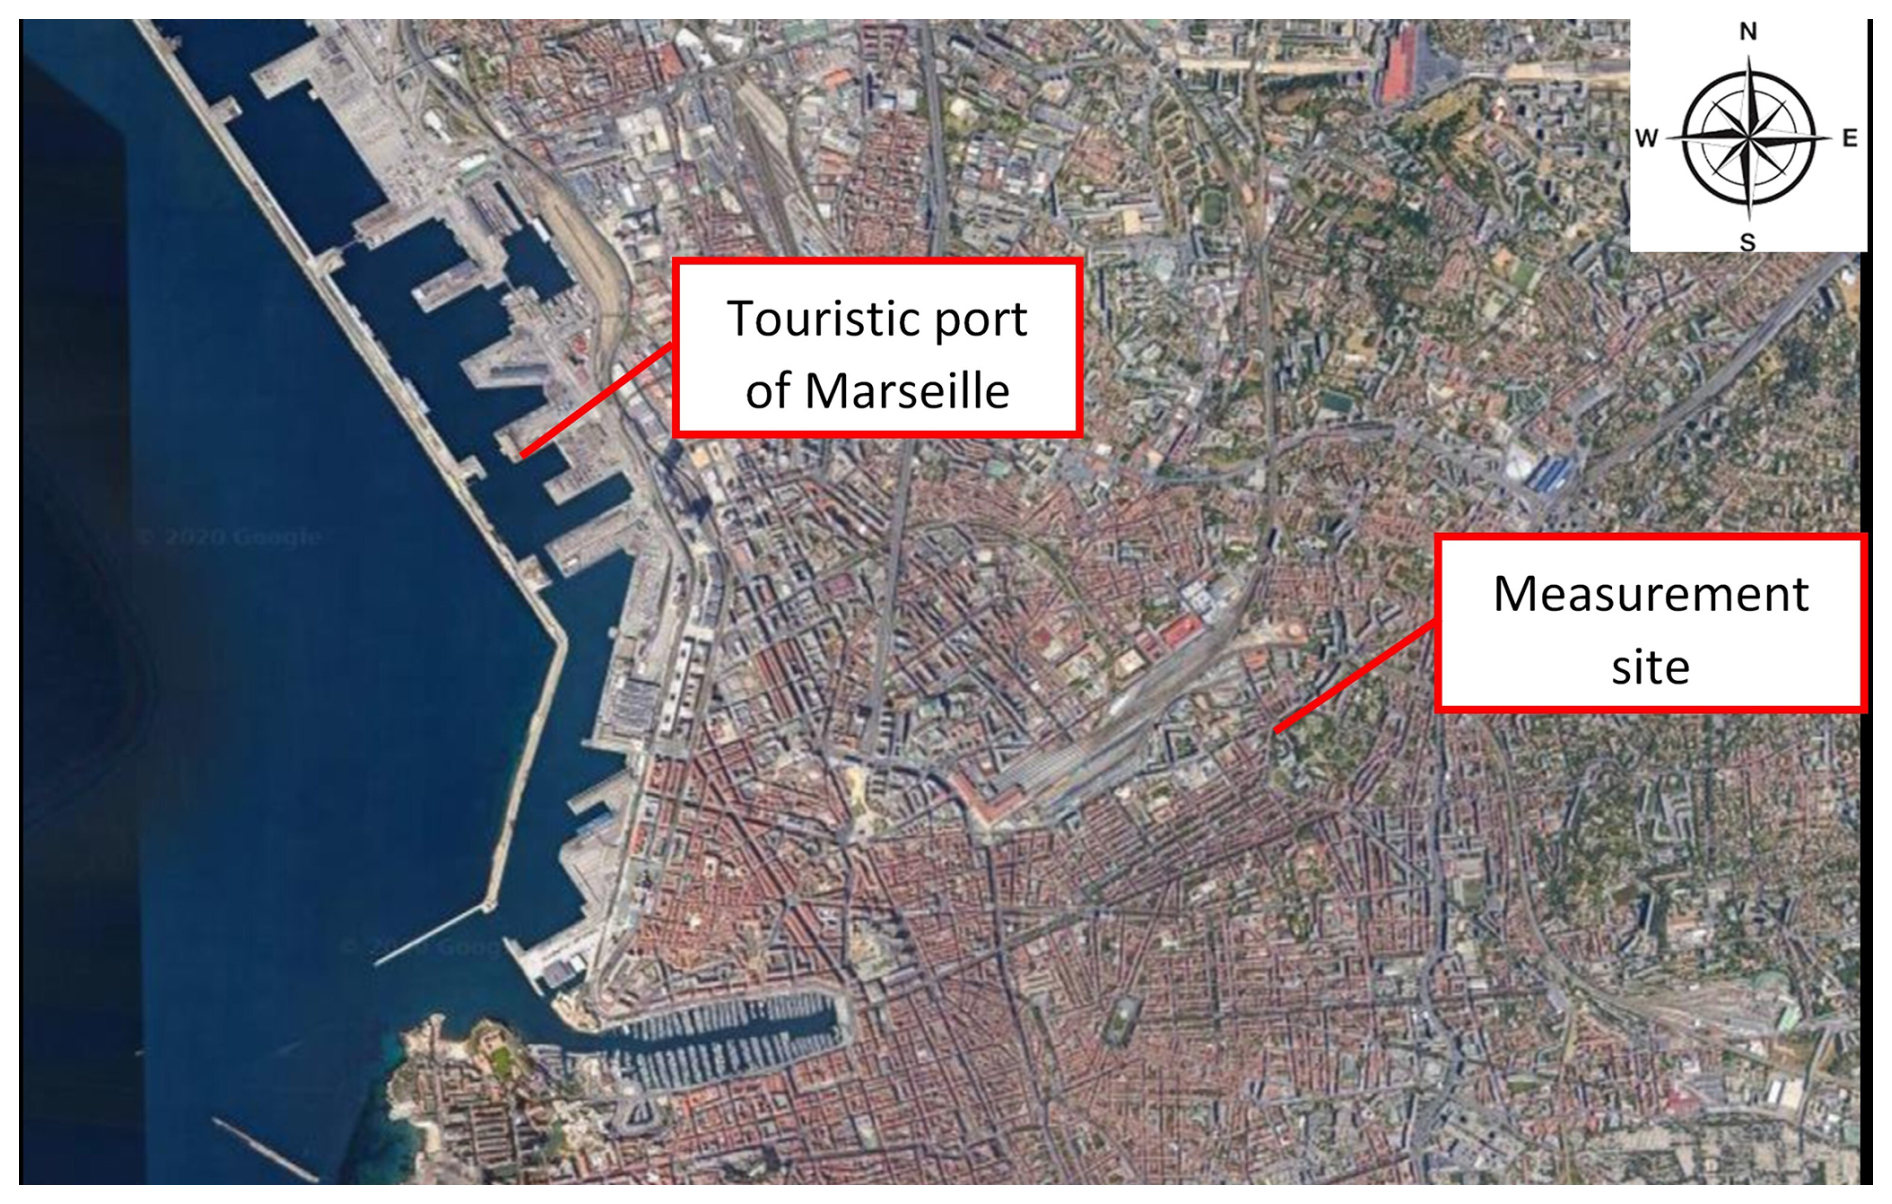
Figure 1The measurement site in Marseille. Adapted from © Google, 2020, TerraMetrics.
Marseille has a typical Mediterranean climate with rainy winters and dry summers. Meteorological conditions during the campaign are discussed in the “Results and discussion” section.
2.2 Material and methods
Two thermal desorber–gas chromatography–flame ionization detector (TD-GC-FID) instruments, from PerkinElmer (Waltham, USA) and Chromatotec (Val de Virvée, France), have been implemented at the measurement site, allowing for the hourly measurement of 70 non-methane hydrocarbons (NMHCs) from 2 to 16 carbon atoms. The PerkinElmer instrument (TD-GC-2FID) measures a total of 61 NMHCs with a number of carbon atoms between 2 and 10 thanks to the two FIDs. The Chromatotec instrument allows for the measurement of a total of 44 C6 to C16 NMHCs. The combination of the measurement of these two devices gives us a mixing ratio of 35 common compounds. The sampling line was a 3 m Sulfinert-treated INOX line.
Compounds are pre-concentrated in a trap and transferred to the chromatographic columns via a heated transfer line. Technical details of the devices are given in Table 1.
Table 1Characteristics of installed instruments.
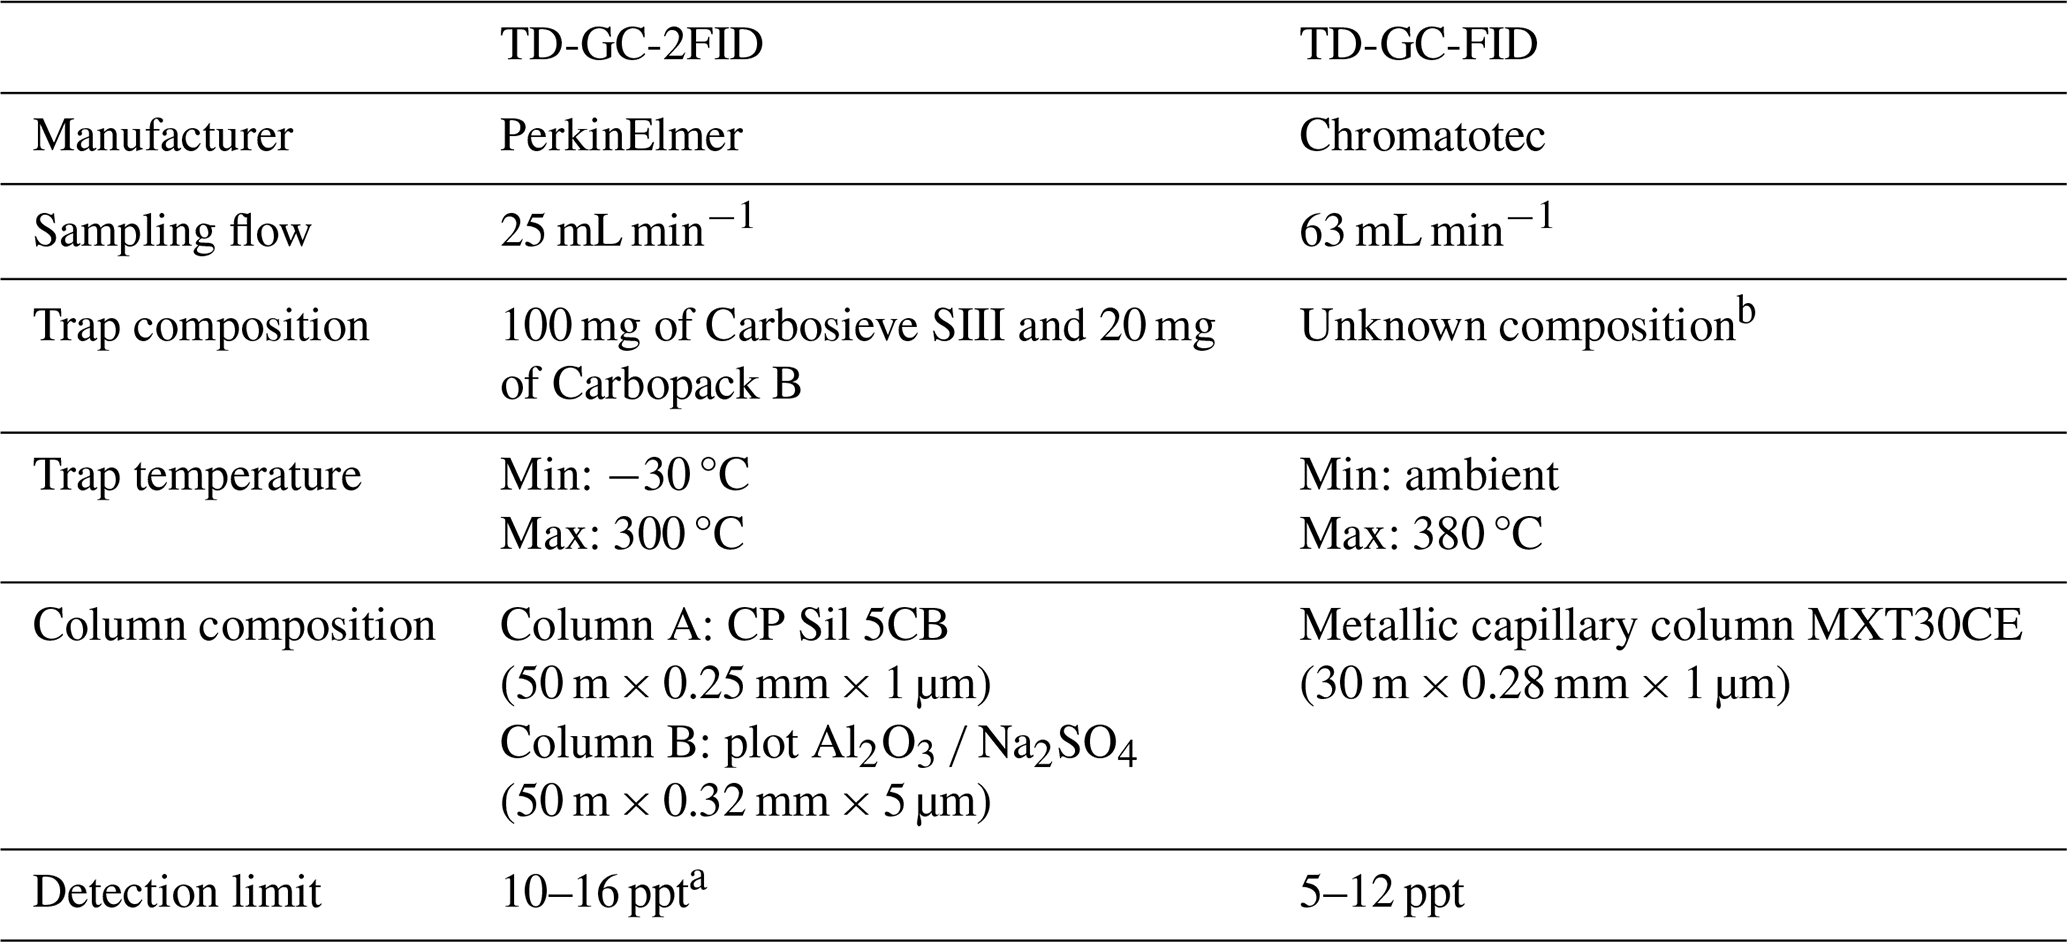
a Except for ethane, ethene, propane, propene, and acetylene, which have a detection limit of 104, 45, 102, 35, and 65 ppt respectively. b This information is not communicated by the supplier.
A Nafion dryer has been added in the sampling line of the TD-GC-2FID specifically to remove water as it can affect NMHC measurements by increasing their concentration by up to a factor of 2.2 for some compounds, like ethene (Bourtsoukidis et al., 2019). In addition, an ozone scrubber made of a 15 cm KI-coated copper tube prevented the ozone effect on the most reactive species, like alkenes (Bourtsoukidis et al., 2019).
A certified standard prepared by the National Physical Laboratory (NPL; Teddington, England) is used to calibrate both devices during the whole campaign, including 29 NMHCs at a 4 ppb level. For compounds that are not present in the NPL standard, the theoretical response factor of FIDs has been calculated by using a reference compound and the effective carbon number (ECN) (Dietz, 1967; Sternberg et al., 1962).
2.3 IVOC calibration method
In the absence of a calibration standard for IVOCs measured by the C6–C16 TD-GC-FID, a calibration procedure has been developed to check the relevance by using ECN. A liquid mixture containing all linear alkanes from C6 to C16 and toluene is injected into two evaporation systems: (i) a heated calibration solution rig, normally used for doping sorbent tubes, has been adapted for the transfer of a gaseous mixture into the TD-GC-FID, (ii) and a liquid calibration unit (LCU) from Ionicon® (Innsbruck, Austria) dedicated to the transfer of gaseous mixture from an initial liquid mixture has been used.
Only hexadecane showed significant differences (30 % underestimation in comparison with theoretical results from ECN for the heated calibration solution rig and 15 % for the LCU; the other compounds are all below 10 % with both evaporation systems). Special attention should be paid to its concentration (see the Supplement and results of the IVOC calibration procedure for more details).
During the whole campaign, the running time of both instruments was higher than 80 %, leading to a unique hourly dataset of C2–C16 NMHCs for 1.5 years.
Besides these instruments, other analyzers were run for the measurement of NOx, O3, SO2, CH4, and CO2, as well as an Aethalometer for the measurement of black carbon concentrations and a particle counter. Meteorological parameters, such as temperature, pressure, wind speed, and wind direction, complete the dataset.
2.4 Quality assurance and quality control
During the whole campaign, many quality assurance and quality control (QA&QC) tests were performed to ensure the quality of the dataset based on the Aerosol, Clouds and Trace gases Research InfraStructure (ACTRIS) guidelines (Reimann et al., 2018). Both instruments' repeatability, reproducibility, and blank values were checked many times during the campaign in the same conditions as ambient air sampling. Comparisons were also made between both instruments for common species and within the same instrument for isomers. More details are available in the Supplement in the quality control section.
2.5 Source apportionment by positive matrix factorization (PMF)
2.5.1 PMF model description
The EPA PMF 5.0 model was applied to our NMHC dataset. This statistical model has been thoroughly described in previous studies (Paatero, 1997; Paatero and Tapper, 1994). In this study, the dataset has been separated into six seasons (from spring 2019 to summer 2020), analyzed separately with the PMF.
An input dataset is regarded by the PMF as a matrix X of n concentration values and m compounds. The objective of the PMF is to solve the chemical mass balance between measured compound concentrations and source profiles following Eq. (1), where the matrix G(n×p) is the factor contribution, F(p×m) the factor profile, p the number of factors, n the measurements, m the species, and E(n×m) the residual part.
The solution of this equation is given by minimizing the residual sum of square Q (see Eq. 2 for a definition of Q) until the value of Q converges into a similar minimum for F and G.
Here, sij is the uncertainty in the measurement for species i in sample j, and eij is the residual. Depending on their behavior, each compound will be separated into p factors.
2.5.2 Uncertainty calculation
As shown in Eq. 2, the uncertainty is a prerequisite input for the PMF analysis. Hence, for each measurement from both devices, uncertainties have been calculated using the methodology proposed by the pan-European research infrastructure ACTRIS. The calculation is based on the sum of two types of errors, random error due to the precision of the device and systematic error. The details of the uncertainty calculation is explained by Hoerger et al. (2015).
Only compounds that are in the standard gas mixture have their uncertainties calculated following this methodology. It represents 28 compounds for the TD-GC-2FID and 13 compounds for the TD-GC-FID. The mean expanded relative uncertainty of these compounds is given in the Supplement Table S3 for both devices. For the TD-GC-2FID, the mean uncertainty range is between 15 % and 40 % for the majority of NMHCs, and four of the compounds have a mean expanded relative uncertainty exceeding 100 %. This is due to concentrations close to the limit of detection (LoD) most of the time during the campaign. For the TD-GC-FID, the mean expanded relative uncertainty range is between 5 % and 25 % for the majority of NMHCs. For the other compounds, their absolute uncertainties are estimated by applying the median relative uncertainty of a compound with a similar concentration and variability present in the standard gas mixture.
2.5.3 Dataset missing values and limit of detection
During the campaign, some data were missing or below the LoD. These data must be replaced as missing values are not accepted by the PMF. Concerning concentrations below the LoD, missing values are replaced by the LoD divided by 2, and uncertainties are calculated following Eq. (3):
where U is the uncertainty (in µg m−3).
The missing values are replaced with the hourly median of the month where there are missing values. In this case, the associated uncertainty is the hourly median previously calculated multiplied by 4.
2.5.4 Determination of the optimal solution
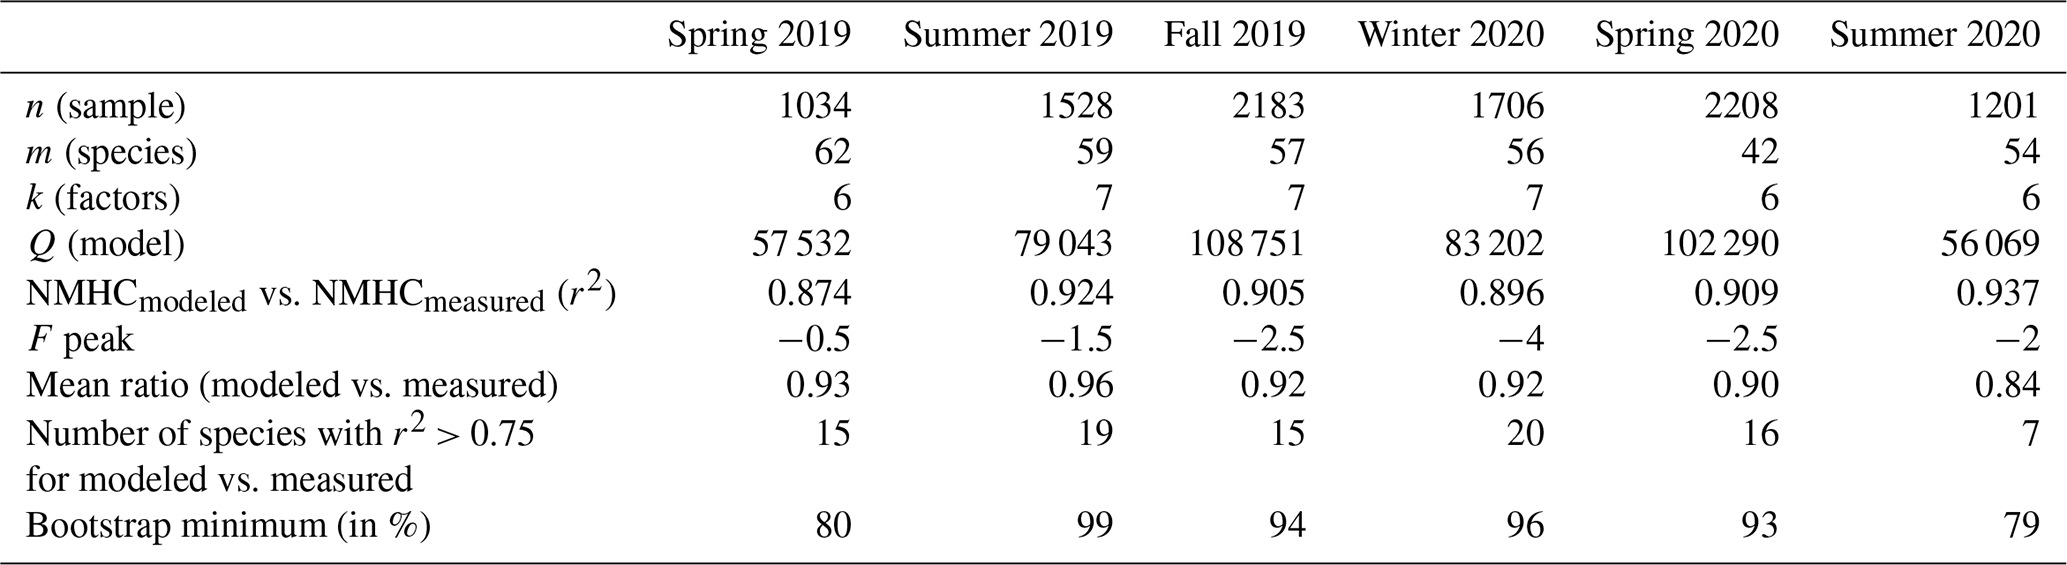
For each season, several base runs were performed with a number of factors varying from 3 to 12. Several parameters have been plotted versus the number of factors to determine the best solution following the method from Lee et al. (1999) and Hopke (2000).
An additional parameter F peak has been used to optimize solutions while checking the rotational variability.
As a result, six factors were selected from spring 2019 and 2020 and summer 2020, while seven were selected for the other seasons. All quality indicators are summarized in Table 2. The “bootstrap” test results showed determination coefficients above 0.6 for all seasons, reinforcing the robustness and stability of PMF results.
3.1 Meteorological conditions
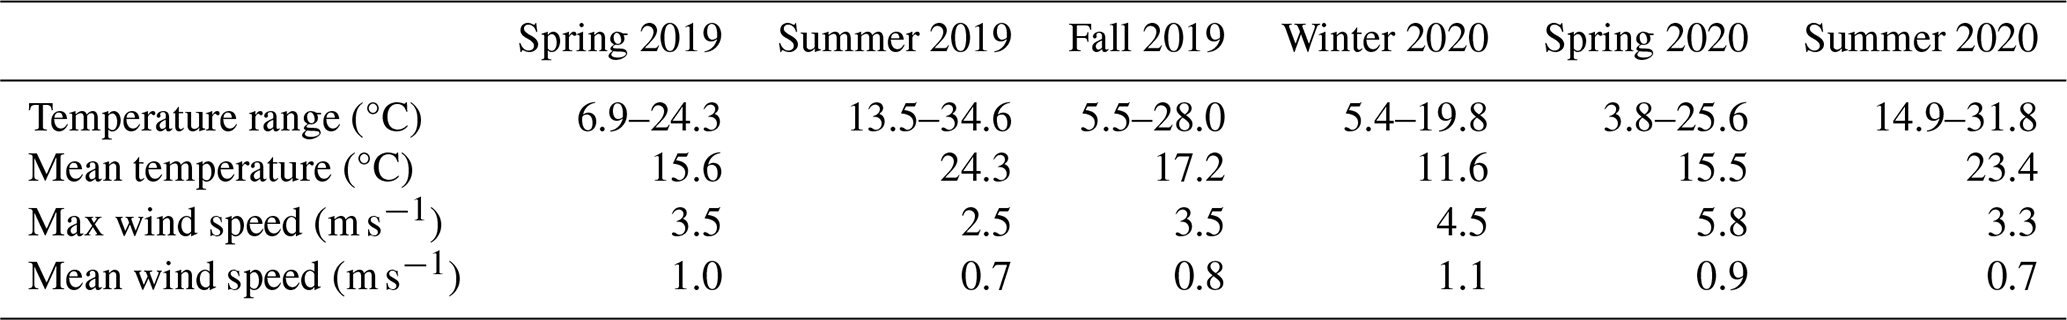
The meteorological conditions during the campaign are given in Table 3 on a seasonal basis. During the campaign, three wind directions were dominant. One originated from the north-northwest and corresponded to the mistral, a typical wind type of the region characterized by dry wind and high wind speed. The two other dominant winds were from the east-east-northeast and the west-west-southwest and corresponded to the land–sea breeze circulation. The land breeze that occurred during nighttime had a lower temperature than during daytime and thus a lower planetary boundary layer (PBL). Furthermore, in land breeze conditions, air masses came from land with potential NMHC emissions, whereas in sea breeze conditions, air masses came from the sea and were poorly polluted. Figure S4 in the Supplement shows the wind rose during the whole campaign.
Table 3Meteorological conditions of the measurement site between 21 March 2019 and 31 August 2020.
3.2 Impact of photochemistry
The PMF tool is applied to measurements at a receptor site, which can be away from the emission sources. Nevertheless, since the reactivity of some VOCs can have an impact on the identification of the sources and their contribution, the photochemical impact on VOCs should be assessed. Recently, a new approach, which applies the PMF on a reevaluated concentration by estimating the concentration before photochemistry depletion or the dispersion of the compounds, has been applied at many receptor sites (Gu et al., 2023; Liu et al., 2023; Stanimirova et al., 2023; Wu et al., 2023). Here we evaluated the impact of the photochemistry on our dataset by assessing the correlation between reactive species with a less reactive one (benzene), originating from the same sources, during daytime and nighttime (Salameh et al., 2015; Sommariva et al., 2011) in winter and summer. Ethene and m,p-xylene were selected as reactive species, whereas n-pentane was chosen as a less reactive species. The kOH of these compounds are 8.51 × 10⁻¹², 2.45 × 10⁻¹¹, 1.52 × 10⁻¹¹, 1.28 × 10⁻¹², and 3.80 × 10⁻¹² molec. cm−3 s−1 for ethene, m-xylene, p-xylene, benzene, and pentane respectively. These values are from Atkinson (1986), except for n-pentane, which comes from Atkinson and Arey (2003). In our case, m- and p-xylenes are not separated, so the value of kOH for the m,p-xylene is the mean of both kOH (1.99 × 10⁻¹¹ molec. cm−3 s−1) of m-xylene and p-xylene.
Figure S4 shows the scatterplot of ethene, m,p-xylene and n-pentane with benzene. Daytime data are concentrations measured between 08:00 and 16:00 UTC, whereas nighttime data are concentrations measured between 21:00 and 05:00 UTC.
For all these compounds, there is no difference between daytime and nighttime scatterplots, with benzene either in winter or in summer. As explained in Sect. 3.1, during daytime the measurement site is mainly under sea breeze conditions, with the sea located 2 km away. We assume that NMHCs from anthropogenic activities are freshly emitted when the site is under sea breeze conditions. The effect of photochemistry on our dataset, and thus also on our PMF results, is negligible.
3.3 General overview
Figure 2 shows the monthly variability of NMHC families: alkanes C2–C3, alkanes C4–C5, alkanes C6–C9, IVOCs (alkanes C10–C16), alkenes C2–C3, alkenes C4–C6, aromatics, and acetylene in parts per billion, and Table S2 gives the mean and median concentrations of all measured compounds during the whole campaign. Alkene concentrations are invalidated between March 2020 and June 2020 due to technical issues. Light alkanes (C2–C3 and C4–C5) are the major compounds. Their measured concentrations explain more than 50 % of the concentration of the sum of NMHCs each month of the whole campaign. The highest concentrations are observed during the cold period between November 2019 and January 2020 and could be explained, on the one hand, by the importance of NMHC emissions from residential heating in the surroundings and low PBL height and, on the other hand, by the photochemical decay undergone in the warm period by such reactive species.
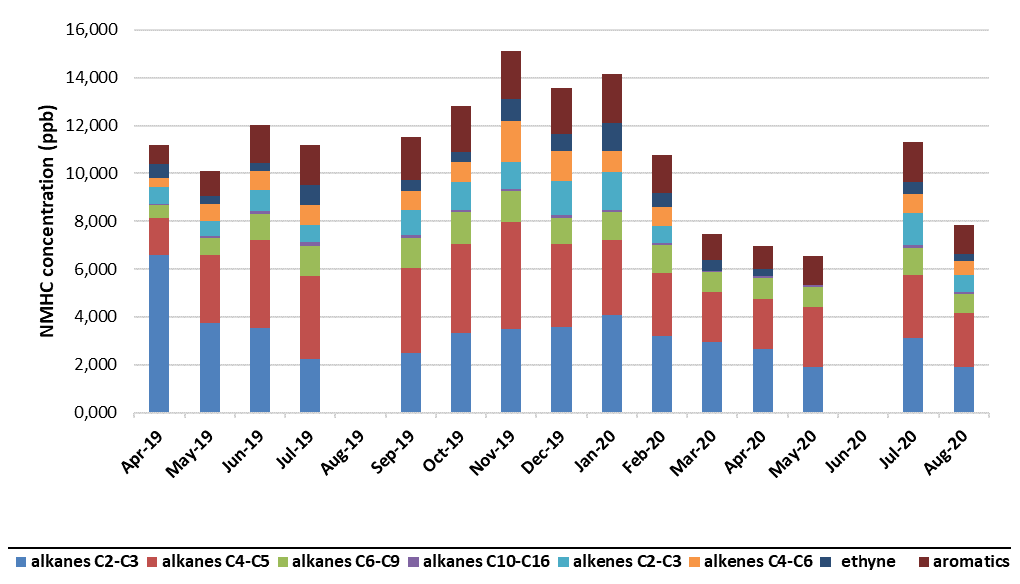
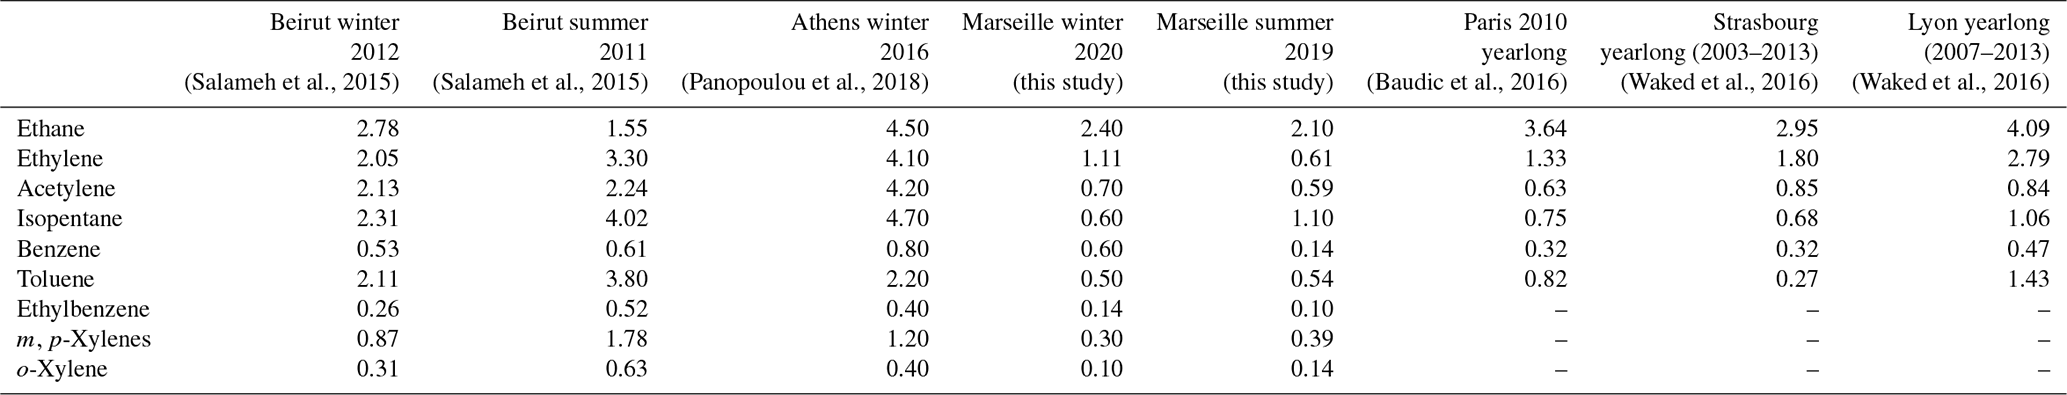
Table 4 shows the comparison of some NMHC concentrations from other studies with those obtained in this study in winter and summer. Marseille has the particularity of having a port inside the city 2–3 km from the measurement site. The measurement site in Beirut is a suburban site (6 km southeast of Beirut downtown) and is surrounded by a forested pine area. The site was occasionally exposed to very high concentrations of i-pentanes and n-pentanes in northern wind conditions (more than 40 ppb). Finally, the measurement site in Athens is in the center of Athens and is on the top of a hill. This city has the particularity of being highly polluted with VOCs in comparison with other Mediterranean cities and has been considered by Panopoulou et al. (2018). Compared to other Mediterranean cities like Athens or Beirut, NMHC concentrations are drastically lower in Marseille, pointing out different country regulations for air quality. On the other hand, measured concentrations at Marseille are lower than those measured in other French cities (Paris, Lyon, Strasbourg), especially ethane and ethylene. Additionally, there are some differences between Paris, Lyon, and Strasbourg that might be due to local particularities. Between 2010 (the year of the Paris dataset) and 2019 (the year of the Marseille dataset), there was a decrease of 20 % in NMHC emissions according to CITEPA (2020), and this trend is more or less visible depending on NMHC species (Waked et al., 2016). The sector most affected by this decreasing trend is road transport, which is an emitter of alkenes, acetylene, alkanes from C4, and aromatics (Baudic et al., 2016).
Table 4NMHC concentration (in ppb) comparison between French cities and cities in the Mediterranean Basin.
3.4 PMF factor identification and contribution
Similarly, for all seasons, five PMF factors have been identified that are related to the following sources: traffic exhaust, fuel evaporation, industrial, shipping, and local and regional urban backgrounds, and one factor is associated with IVOCs. In addition, two season-specific factors have also been identified as being related to biogenic sources in summer and residential heating during the cold period. Details of each source are reported below.
3.4.1 Traffic exhaust
In Marseille the car fleet is characterized by a significant portion of vehicles running on diesel (71.5 %) and approximately 10 % of two-wheelers, according to AtmoSud. The proportion of two-wheelers is similar to that in Paris, comprising approximately 10 % and 20 % (Baudic et al., 2016; Salameh et al., 2019).
The factor defined as traffic exhaust is characterized by a significant amount of aromatic compounds, C7–C8 alkanes, and (to a lesser extent) C2–C3 alkenes. For each season, around 50 % of the variability of toluene and 1,2,4-trimethylbenzene and 40 % of the variability of isooctane and heptane are explained by this factor. The variability of xylenes and C2–C3 alkenes is attributed to this factor by 30 % and 15 % respectively (Fig. 3). The same compounds have been found in traffic exhaust profiles from other studies (Panopoulou et al., 2021; Salameh et al., 2016). In Panopoulou et al. (2021), aromatic compounds and C6–C9 alkanes are mainly explained by a vehicular exhaust factor, but alkenes are separated into a fuel combustion factor due to many combustion processes, like residential heating and traffic. In this study, alkenes are present in the traffic exhaust factor, but they are attributed to the residential heating factor during the cold period 50 % of the time (see Sect. 3.4.3). Despite the separation of these two combustion processes, there is a correlation between the traffic exhaust and residential heating factors, with a correlation coefficient R of 0.50 in fall 2019, 0.61 in winter 2020, and 0.31 in spring 2020 when the traffic volume was low.
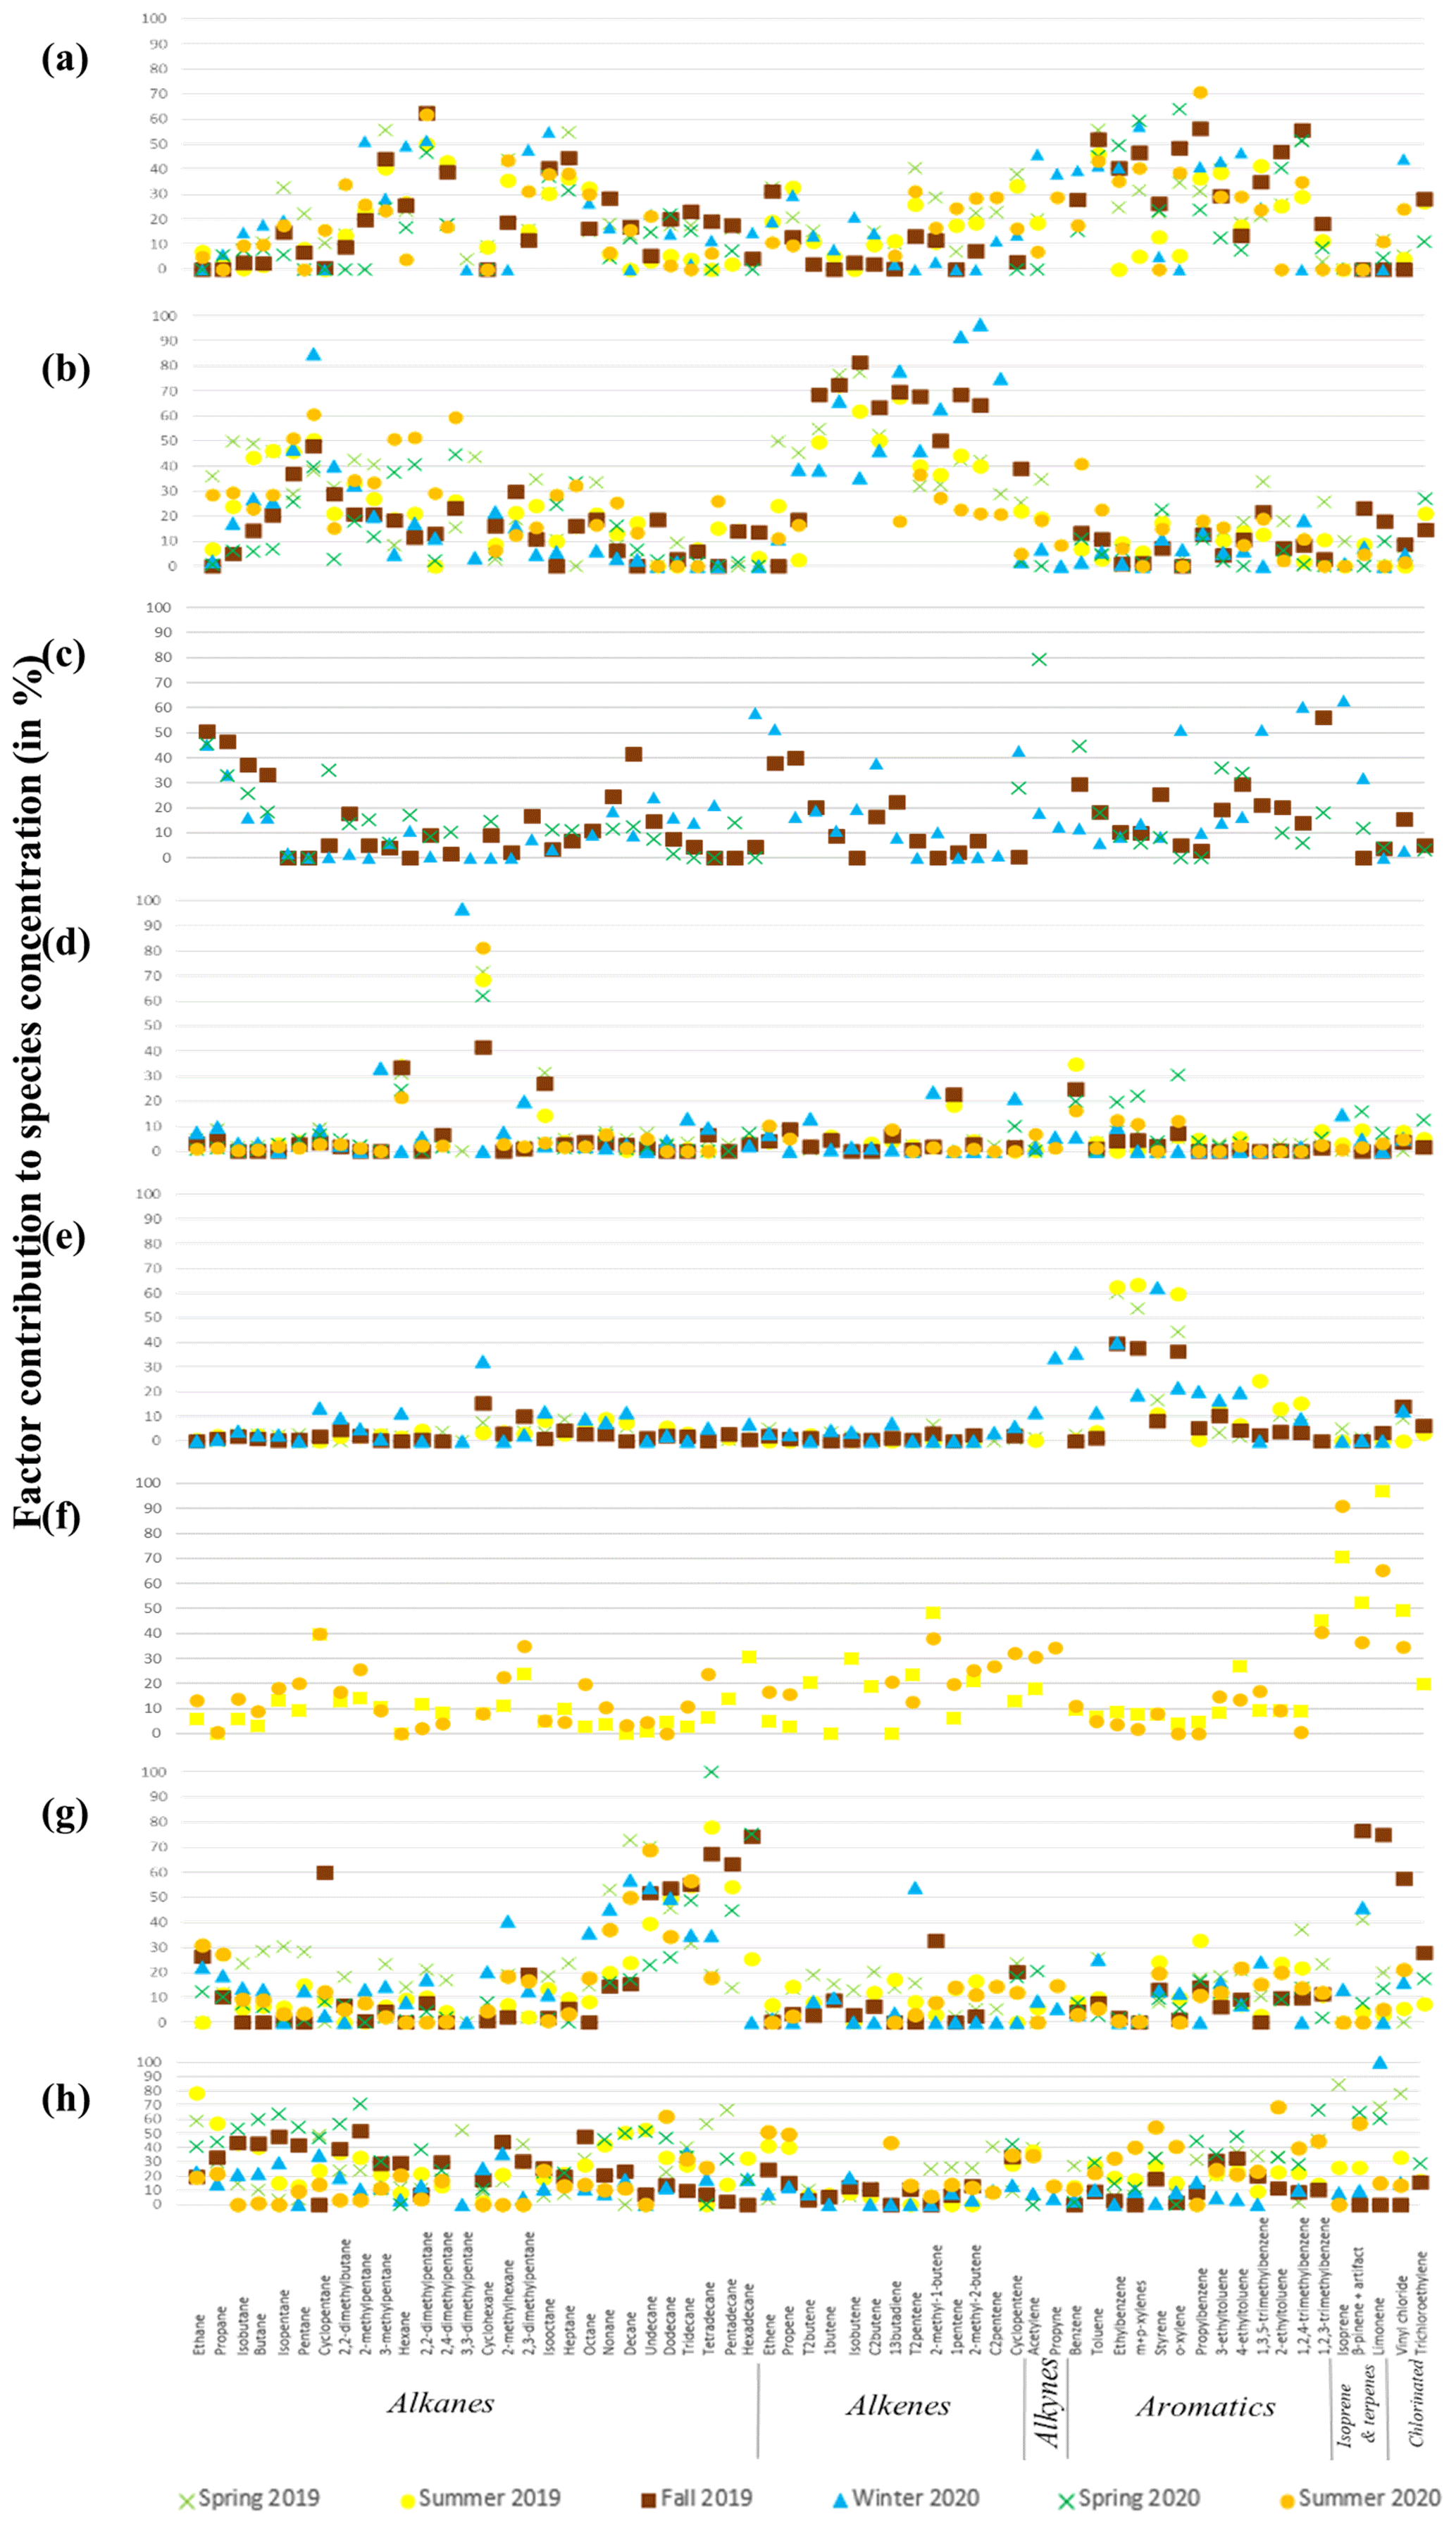
Figure 3Contribution to species concentration of (a) traffic exhaust, (b) fuel evaporation from traffic, (c) residential heating, (d) industrial, (e) shipping, (f) biogenic, (g) IVOC, and (h) local and regional urban background factors for each season. Results are given in percentage.
More generally, C2–C3 alkenes are good tracers of combustion processes (Parrish et al., 2009; Warneke et al., 2007), but to distinguish between specific combustion processes, other ratios can be verified. For instance, the benzene to toluene (B T) ratio is a commonly used ratio to determine the origin of the combustion process (Wang et al., 2014, and references therein). A B T ratio below 0.5 is associated with traffic exhaust, and a ratio above 2 is associated with wood or coal burning (Wang et al., 2014). Nevertheless, these values can vary depending on many parameters (type of vehicle, type of wood, regulations, etc.). In the case of Europe, benzene is expected to have a lower contribution to traffic exhaust due to Directive 98/70/EC (European Union, 1998) for the reduction in benzene emission from fuel and solvents (https://eur-lex.europa.eu/eli/dir/1998/70/oj, last access: 2 June 2025). In this study, the B T ratio from the traffic exhaust factor varies from 0.15 in spring 2019 to 0.07 in summer 2020, pointing out the traffic exhaust origin of this factor on the one hand and the low contribution of benzene due to the European directive in the other hand.
As shown in Fig. 4, it is worth noting that the traffic exhaust chemical fingerprints obtained from independent PMF analysis are very close, regardless of the season, indicating the representativeness of this factor in PMF results and supporting the choice to separate PMF analysis by seasons. The PD–SID, which is a statistical test combining Pearson distance (PD) and standardized identity distance (SID) (Belis et al., 2015; Pernigotti et al., 2016), has largely been used in recent PMF studies to evaluate PMF factors (Borlaza et al., 2021; Manousakas et al., 2021; Mooibroek et al., 2022). Here this statistical test has been applied to the traffic exhaust factor for each season to evaluate potential seasonal variability of its chemical fingerprint. Results show quite similar fingerprints over seasons (Fig. S6), confirming the conclusion made from Fig. 4.
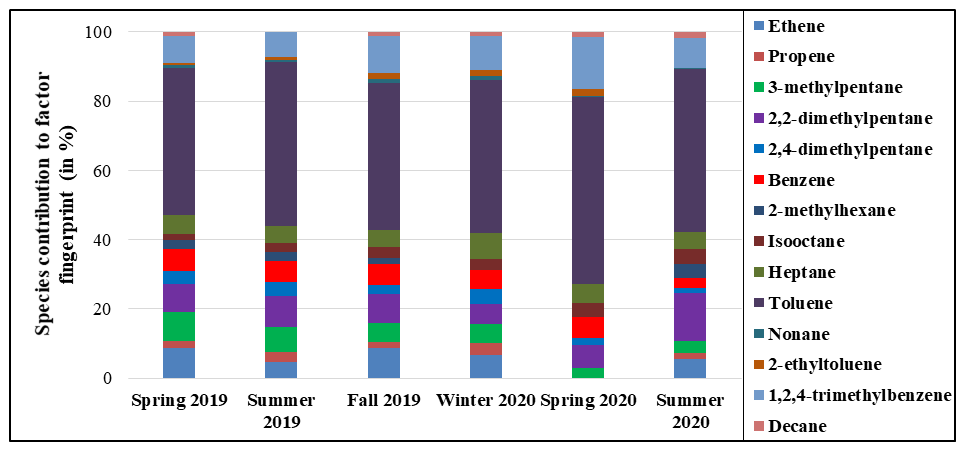
Figure 4Traffic exhaust fingerprint of 14 NMHCs for each season (for technical reasons, ethene and propene were invalidated in spring 2020).
As tracers of combustion processes, the variability of NO and NO2 is compared with the contribution of this PMF factor. The correlations and the associated p values (Table S3) are season dependent, with R varying from 0.48 in summer to 0.63 in winter for NO2 and from 0.06 in spring to 0.60 in winter for NO. This result may be due to the effect of photochemistry in summer, which favors the conversion of NO to NO2 in addition to the regional NO2. NO is more reactive than the measured NMHCs, which likely explains why we do not see any photochemistry impact on our dataset, unlike NO. The p value is always below 1 %, showing a significant correlation between NO2 and the traffic exhaust factor, but the correlation is not clearly visible for NO due to the distance between the station and the road and the short lifetime of NO. The exception of fall 2019 and winter 2020 can be explained by a weaker photochemistry during these seasons.
The average diurnal profile of the contribution of this factor is shown in Fig. 5. One peak is visible at around 07:00 UTC and a smaller one around 18:00 UTC. These peaks are characteristic of traffic emissions corresponding to rush hours and are similar to the ones in other French cities, like Dunkirk (Badol et al., 2008) and Paris (Languille et al., 2020).
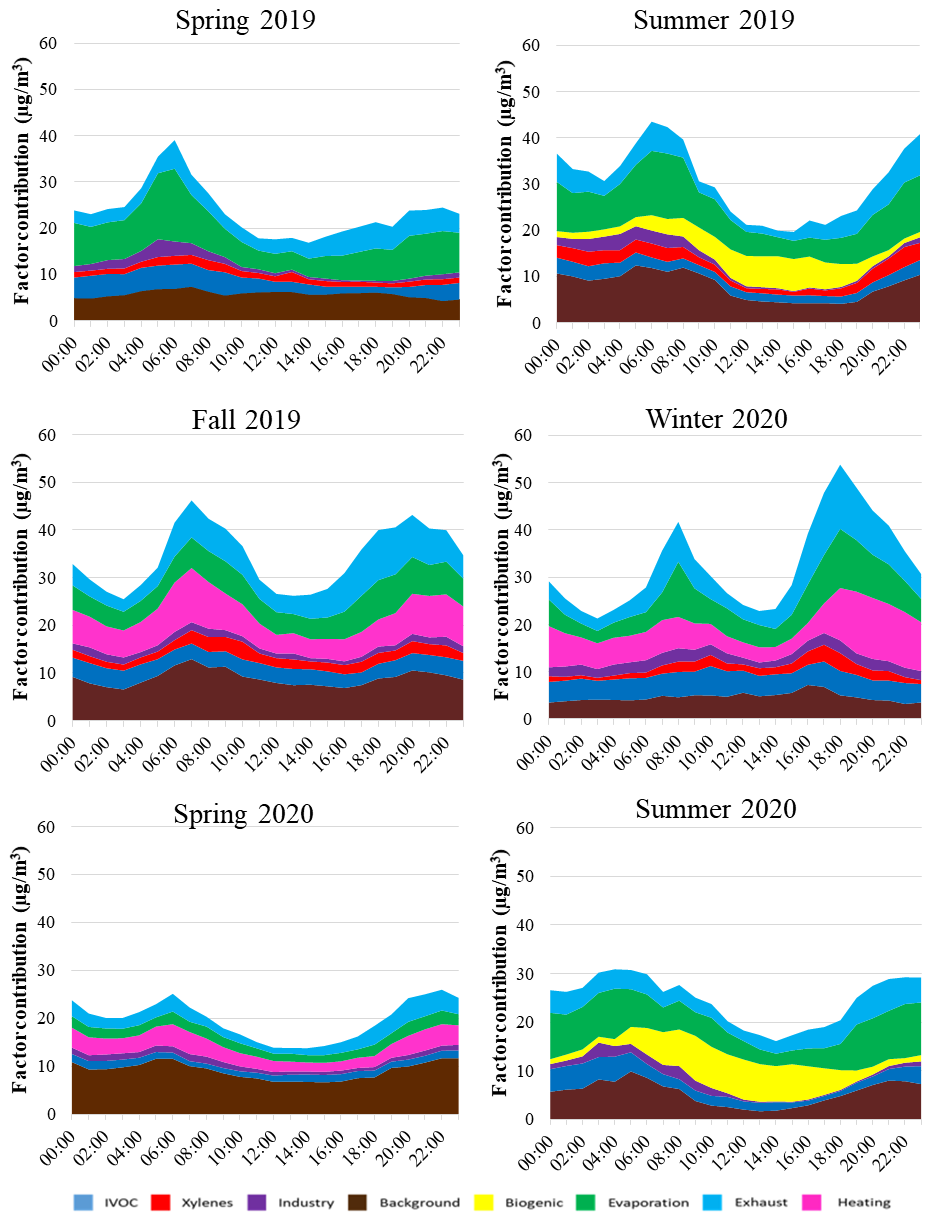
Concerning the seasonal variability, the highest values are observed in winter (around 6 µg m−3) and the lowest values in summer (around 4 µg m−3) (see Table 7 in Sect. 3.6). This difference could be explained by (i) the increase in emissions due to the cold start of vehicles (Clairotte et al., 2013; George et al., 2015; Ludykar et al., 1999) and (ii) the potential photochemical decay of reactive compounds in summer (Filella and Peñuelas, 2006), with an important dilution due to the height of the PBL. The same seasonal variability has been observed in Athens, a Mediterranean city, for the traffic exhaust factor (Panopoulou et al., 2021).
3.4.2 Fuel evaporation
In urban areas, fuel evaporation mainly originates from two types of sources: either vehicles or fuel stations. In the first case, the evaporation source intensity follows the diurnal profile of traffic, while it is more scattered in the second case.
In this study, the chemical profile of this source is mainly composed of C4–C5 alkenes and C4–C6 alkanes (Fig. 3), which are attributed to fuel evaporation by 40 % to 80 % and 25 % to 50 % respectively. Isopentane represents a key compound of this factor.
Based on Baudic et al. (2016), a high contribution of isobutane and butane was found in the fuel evaporation source and C5–C6 alkanes in traffic exhaust. Other studies, such as Salameh et al. (2016) and Panopoulou et al. (2021), have shown an important contribution of C4–C5 alkanes related to traffic and fuel evaporation and C5 alkanes related to fuel evaporation respectively. In this study, there is a high proportion of C5–C6 alkanes during all seasons and a high proportion of isobutane and butane in spring and summer 2019, which is in accordance with fuel evaporation profiles from near-field measurements (Salameh et al., 2019). It is interesting to note that in winter, 90 % of isoprene is attributed to this factor. Some studies have already observed traffic as a major contributor to isoprene emissions in cities during winter (Borbon et al., 2001; Panopoulou et al., 2020).
A fuel station is located 500 m east of the measurement station and is a potential source of the observed isopentane concentrations, especially when the winds come from the east during land breezes. However, the pollution rose in summer 2019 (Fig. S5) does not show a clear influence of the eastern wind on this factor's contribution.
The seasonal variability of this factor is linked to temperature, with the highest values in summer when the temperature is high (around 8 µg m−3) and the lowest values in winter (around 6 µg m−3). This seasonal variability is similar to that of the fuel evaporation related to the traffic factor in Panopoulou et al. (2021).
This factor has a correlation coefficient R varying between 0.07 and 0.43 with NO (with the exception of spring 2020, where the value of R is 0.01) and between 0.39 and 0.61 with NO2, with a p value that is always below 5 % (with the exception of spring 2020 for NO). This means that there is a significant correlation between the fuel evaporation factor and NO2 and, to a lesser extent, NO (Table S4).
The diurnal profile of this factor (Fig. 5) is similar to the diurnal profile of the traffic exhaust factor. All these findings confirm that this factor corresponds to fuel evaporation related to traffic. In addition, the contribution of this factor correlates quite significantly (0.41 to 0.61) with that of the traffic-related factor.
3.4.3 Residential heating
The factor identified as residential heating is characterized by a large number of light alkanes and alkenes (C2–C3), acetylene, and some aromatic compounds like benzene and ethyltoluenes (Fig. 3). This factor is observed only in fall 2019, winter 2020, and spring 2020. For each of these seasons, the variability of light alkanes, alkenes, and benzene is attributed to this factor by more than 40 % (Fig. 3). The diurnal variation in this factor shows a peak in the morning at 07:00–08:00 UTC and a peak at 19:00–20:00 UTC, with the latter extending later into the evening (Fig. 5). This factor's contribution is independent of a specific wind direction and is explained by the residential area surrounding the station.
This profile is similar to other profiles in the literature identified as residential heating (Baudic et al., 2016; Panopoulou et al., 2021; Sauvage et al., 2009). The diurnal profile is barely similar to the wood-burning diurnal profile in Baudic et al. (2016) and the chemical fingerprint mainly composed of light alkanes and alkenes (C2–C3), acetylene, and benzene, confirming the residential heating origin of this factor.
As for traffic exhaust and fuel evaporation, there is a significant correlation with NO and NO2 (around 0.45 and 0.50 for NO2 and 0.13 and 0.50 for NO). However, there is also a high and significant correlation with black carbon from wood burning (0.61 in fall 2019 and 0.80 and 0.78 in winter and spring 2020 respectively) (Table S5).
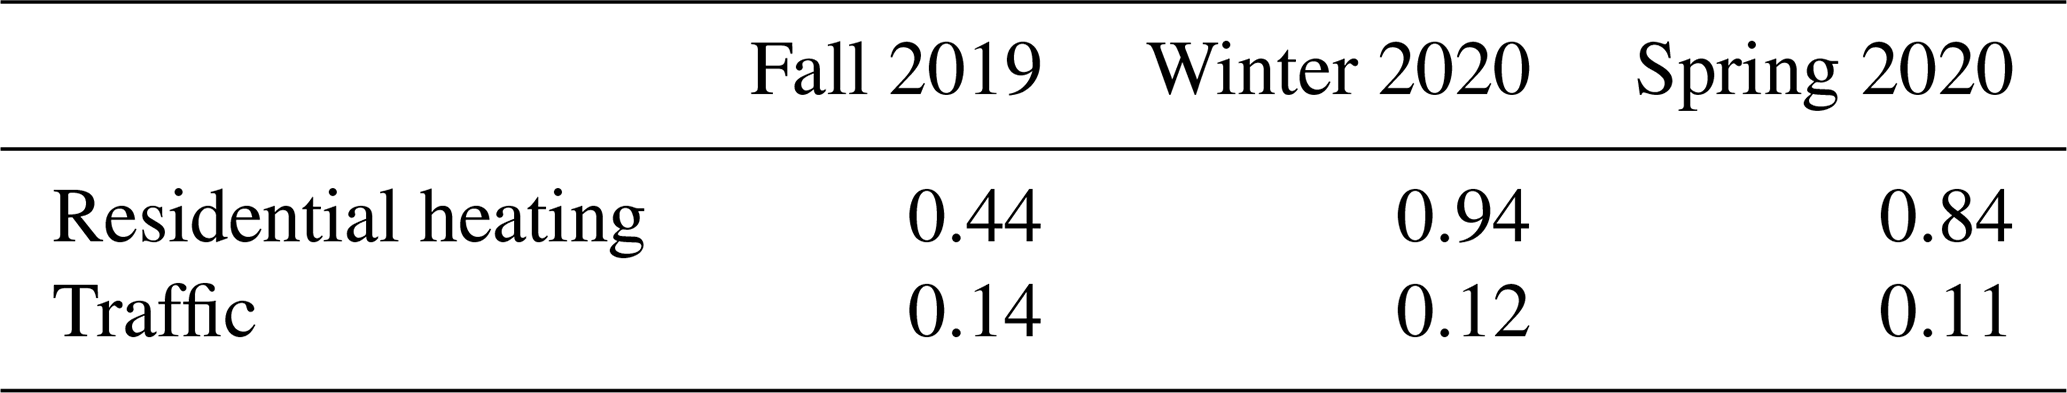
According to AtmoSud, in the Aix-Marseille metropole, 18 % of residences are equipped with fireplaces, and 6 % of residences use wood burning as a principal heating source. All other residences are heated with natural gas or electricity. Wood burning may therefore have a low impact. To determine the influence of the wood-burning emissions on the residential heating factor, the B T ratio is used and compared to the one obtained with traffic emissions for the same seasons (Table 5). For the residential heating factor, the B T ratio is close to 1 in winter and spring 2020, whereas the same ratio is 0.1 in the same period for the traffic exhaust factor, showing the impact of wood burning. The presence of alkanes C2–C3 shows that the residential heating factor is explained not only by wood burning but also by the use of natural gas for residential heating. Indeed, alkanes C2–C3 represent important markers of the natural gas used for heating and cooking in cities (Baudic et al., 2016).
Table 5Benzene to toluene ratio for the traffic factor and the residential heating factor from fall 2019 to spring 2020.
It is worth noting that measured terpene (limonene and β-pinene) concentrations are mainly explained by the residential heating factor in winter. It is known that in urban areas, terpenes can be emitted by anthropogenic activities (Borbon et al., 2023; Dominutti et al., 2019; Kaser et al., 2022; Panopoulou et al., 2020). A comparison between limonene, benzene, and toluene in winter measured by the TD-GC-FID shows a clear correlation, especially during nighttime. Anthropogenic emission of terpenes from residential heating cannot be discarded. It is also important to note that even if these sources were not identified in our studies, limonene can also be emitted in the cities by other anthropogenic sources, such as cleaning or personal care products (Borbon et al., 2024). Thus, the possible impact of these sources on the measured concentrations of limonene cannot be totally discarded.
3.4.4 Industrial
The industrial factor is characterized by the presence of cyclohexane, which is attributed to this factor by more than 70 %, and benzene and isooctane, which are explained by approximately 15 % to 35 %, regardless of the season (Fig. 3).
The temporal variability is characterized by a low background level and episodic high-intensity peaks. These peaks occurred exclusively during land breeze events corresponding to the eastern wind direction (Fig. S5). This sector points out the presence of a plastic production industry located east of the station. This factor is thus attributed to an industrial source.
A similar profile with high benzene and cyclohexane concentrations during nighttime has been found during a study conducted at the station of Marseille Prado (43°27′ N, 5°13′ E), where the impact of the plastic production industry on NMHC concentrations in Marseille has been pointed out (Troussier et al., 2005).
3.4.5 Shipping
A specific factor has been identified during all the seasons in 2019, explaining 35 % to 60 % of the concentration of xylenes (including o-, m-, and p-xylenes) and ethylbenzene (Fig. 3). The contribution's temporal variability of this factor shows low background levels with high peaks regardless of the season and wind direction (Fig. S7). This factor shows some correlation with NO2 and the traffic exhaust factor (Pearson's R above 0.40, with the exception of fall 2019 for both) but has no correlation with NO (Table S6). Hence, like traffic-related sources and residential heating, this factor seems to be linked to combustion processes. The highest correlation is observed with the IVOC factor in spring 2019, with a Pearson correlation coefficient of 0.60, highlighting a possible link between both factors, at least for this season. However, the correlation with the IVOC factor shows strong variation, with a maximum of 0.60 in spring 2019 and a minimum of −0.02 in fall 2019 (Table S6). This variation may be linked to the low concentrations of IVOCs measured during the whole campaign.
Furthermore, in the framework of the recent ADEME/AQACIA project called PAREA (Évolution des PArticules fines en champ proche du tRafic maritimE à Marseille), a measurement campaign took place simultaneously at the same measurement site of Longchamp, Marseille, and at the port of Marseille during summer 2021 for the establishment of the chemical fingerprint of shipping emissions. This source fingerprint determined within the PAREA project is comparable to the profile of this PMF factor with the presence of ethylbenzene and xylenes (EX) and, to a lesser extent, toluene (PAREA project report, accessible via the following link: https://librairie.ademe.fr/mobilite-et-transports/7796-evolution-des-particules-fines-en-champ-proche-du-trafic-maritime.html, last access: 2 June 2025). The variability of this source, characterized by a few peaks occurring at random times, can be explained by several reasons:
-
The VOC emissions of the maritime traffic corresponded to only 2 % of the total VOC emissions in Marseille in 2019 according to the AtmoSud emission inventory (https://cigale.atmosud.org/visualisation.php, last access: 2 June 2025), which is similar to the contribution of this factor to NMHC concentration determined here (between 4 % and 8 %).
-
Only 10 % to 20 % of the winds passing over the port of Marseille arrive at the Longchamp measuring station.
-
Fuel maritime regulations, such as a change in policy with respect to the type of fuel used, may reduce emissions.
-
The international lockdown during spring 2020 likely reduced traffic and associated emissions.
All these reasons could play a role in the fingerprint of the emissions of maritime traffic and their intensities.
Based on the results presented here and those of the PAREA campaign, the shipping source has been identified at our measurement site. However, without results from near-source measurements, it would have been challenging to link this profile to a shipping source. Furthermore, this profile is not comparable to any profile found in source apportionment studies in the literature and so is a novelty here. Due to the particularity of the fingerprint, the ratio between toluene and ethylbenzene or xylenes could be a promising ratio for the identification of the shipping impact on the concentration of NMHCs in an urban atmosphere, but further studies are needed to give a ratio value. Furthermore, in Marseille, ships mainly use marine gas oil (MGO), which is not necessarily the case in other port cities. Moreover, using a ratio of aromatics could be tricky in cities where two-wheelers are used more than in the surrounding suburban area. Salameh et al. (2019) have shown that an increase in the proportion of two-wheelers in the traffic fleet results in an increase in toluene, ethylbenzene, and xylenes compared to benzene. Another issue to consider is that many ratios of aromatics to other compounds have already been used to identify sources in urban areas, like the benzene to toluene ratio for traffic exhaust, industry, coal combustion, biomass burning, or aged air masses, and the m,p-xylene to ethylbenzene ratio used to identify whether the emissions are local or not (Liu et al., 2025).
3.4.6 Biogenic
The chemical profile presented in Fig. 3 for both summers (2019 and 2020) is characterized by the presence of biogenic tracers like isoprene, limonene (sometimes co-eluted with 1,2,3-trimethylbenzene), and β-pinene. Between 65 % and 95 % of isoprene and limonene concentrations in summer are explained by this factor and between 40 % and 50 % are explained by β-pinene. These compounds are well known for being emitted by mainly biogenic sources (Guenther et al., 2012; Sindelarova et al., 2014).
Since our measurement site is located in the surroundings of Longchamp Park, which is composed of trees and plants, biogenic emissions may impact the measurements. The diurnal profile of the biogenic factor's contribution (Fig. 5) shows a low background level during nighttime and an increase in emissions starting early in the morning (05:00 UTC) until a maximum at the beginning of the afternoon and a decrease after 16:00 UTC. This profile is similar to the temperature diurnal profile, which is in turn similar to the solar radiation profile (see Fig. S8). The link between isoprene and terpenes and temperature is well known in the literature (Rasulov et al., 2010; Tingey et al., 1980). Therefore, this factor has been identified as a biogenic factor. It is interesting to note that during spring, monoterpenes (and isoprenes for spring 2019) are mainly explained by this factor. A possible explanation is that biogenic emissions were detected during these seasons but were not strong enough to be well identified by the PMF analysis.
The high contribution of the biogenic factor is associated with southwest (sea breeze conditions) to southeast winds, corresponding to the location of Longchamp Park next to the site. The pollution rose of this factor for summer 2019 is shown in Fig. S5. However, in sea breeze conditions, we cannot discard marine origins for this biogenic source, especially when the main driver of this source is isoprene. This compound has already been observed with high concentrations of up to 9 ppb, coming from the sea of another Mediterranean coastal city (Dayan et al., 2020). Then, considering the lifetime of isoprene, the park close to the station remains the major emission area for BVOCs, but biogenic emissions from the sea cannot be discarded.
3.4.7 IVOC
The IVOC factor is observed during all seasons and is characterized by the presence of C11 to C16 alkanes (see Fig. 3). Their contribution to the factor composition profile varies from 20 % to 80 %. This disparity is explained by the very low concentration of these compounds and therefore a high associated uncertainty. IVOC levels are generally below the C2–C10 NMHC levels (Fraser et al., 1997). Furthermore, only n-alkanes up to hexadecane were measured during this campaign, and some studies have shown that n-alkanes, like IVOCs, are not the major contributors to total IVOCs, which are largely dominated by an unresolved complex mixture of branched and cycloalkanes and aromatics (Zhao et al., 2014, 2016). These compounds are mainly emitted through fossil fuel combustion (Jathar et al., 2017) and biomass burning (Hatch et al., 2018), and the importance of their measurements during field campaigns has already been demonstrated (Ait-Helal et al., 2014; Lu et al., 2020). However, if few studies include IVOC measurements, these compounds are still not considered in source apportionment analyses, probably due to their low concentrations and their high associated uncertainties. This PMF source thus offers new information to the scientific community.
From fall 2019 to summer 2020, a proportion of around 20 % of ethane is explained by this factor, especially in fall 2019 and winter 2020, where the factor is driven by ethane rather than IVOCs.
This factor shows no diurnal profile during mistral events, unlike during sea or land breeze conditions. During land breeze conditions, this factor shows higher levels of IVOCs (see Sect. 3.1 for an explanation), whereas during mistral events, the IVOC levels are close to the ones observed during sea breeze phenomena. This difference between nighttime mistral event concentrations and land breeze concentrations may be due to the wind speed difference between mistral and land breeze events. A high wind speed during mistral events contributes to the advection of pollutants from their sources to the Mediterranean Sea (Drobinski et al., 2007).
The Table S7 presents the R and the p value of this factor with NO; NO2; and evaporation due to the traffic factor, traffic exhaust factor, and residential heating factor. A clear relationship is visible between the IVOC factor and NOx and factors linked to combustion processes during summers and winter 2020. This means that this factor is potentially linked to a combustion process. Nevertheless, this correlation is not present during fall and spring seasons, with the exception of spring 2019.
The correlation coefficient between the IVOC factor and the traffic exhaust factor is the highest during winter 2020, which may indicate a link between the IVOC factor and traffic exhaust during the cold period. The cold start, which leads to the increased contribution of traffic exhaust in winter, is well known for increasing the emission of IVOCs as well, in particular from diesel engines (Drozd et al., 2019; Pereira et al., 2018), which represent 71.5 % of the car fleet in 2019 in Marseille according to AtmoSud. Furthermore, the importance of IVOCs from evaporative sources like unburned diesel for SOA formation has been explained by Drozd et al. (2021), and they are temperature and wind speed dependent, explaining the correlation of IVOCs with the fuel evaporation from traffic and from traffic exhaust (Table S7). It is also worth noting that higher alkanes can be at stronger concentrations in indoor air than in outdoor air (Mai et al., 2024), meaning a possible origin from residential sources when performing outdoor measurements.
To summarize, there is a clear relationship between the IVOC factor and combustion processes, but it is difficult to distinguish a specific combustion process, especially considering that the chemical processes have an impact on the partitioning of IVOCs between the particulate and gaseous phases.
3.4.8 Local and regional urban backgrounds
A factor attributed to the urban background is observed during the whole campaign and explains 20 % to 40 % of the variability of ethane over the period from fall 2019 to summer 2020 and up to 60 % and 80 % in spring 2019 and summer 2019 respectively (Fig. 4).
The presence of other compounds like vinyl chloride and acetylene during some seasons could be due to specific local activities not well identified and separated by this PMF analysis. Globally, the fingerprint of this factor is characterized by long-lived compounds, as already observed in many source apportionment studies (Salameh et al., 2016; Sauvage et al., 2009). The diurnal profile of the background factor shows a relatively steady level during the day (Fig. 5).
To distinguish between the local and regional origin of this source, 3 d back trajectories have been modeled by the National Oceanic and Atmospheric Administration (NOAA) HYSPLIT tool for each hour. Then, the potential source contribution function (PSCF) (Ashbaugh et al., 1985), which is a commonly used function to determine the potential geographical origin of a source (Ara Begum et al., 2005, and references therein), has been applied. As shown in Fig. S9, many urban areas are pointed out as potential source areas contributing to this background factor. In the case of spring 2019, this source's geographical origin is an area east of the site, corresponding to the Po Valley, which is an area with important industrial activities in Italy. In contrast, in spring 2020, Nice, located east of the Marseille site, has been identified as the origin. In both situations, this factor also has a local origin; therefore it is identified as local and regional urban backgrounds.
3.5 Comparison with other PMF studies
The PMF results obtained in this study were compared with those from other cities in France (Paris, Baudic et al., 2016), Europe (Athens, Panopoulou et al., 2021), the eastern Mediterranean Basin (Beirut, Salameh et al., 2016), China (Beijing, Cui et al., 2022), and the USA (Denver, Frischmon and Hannigan, 2024), using the same measurement technique as in our study. These results are summarized in Table 6.
Table 6Comparison of the PMF factors identified between different studies worldwide.
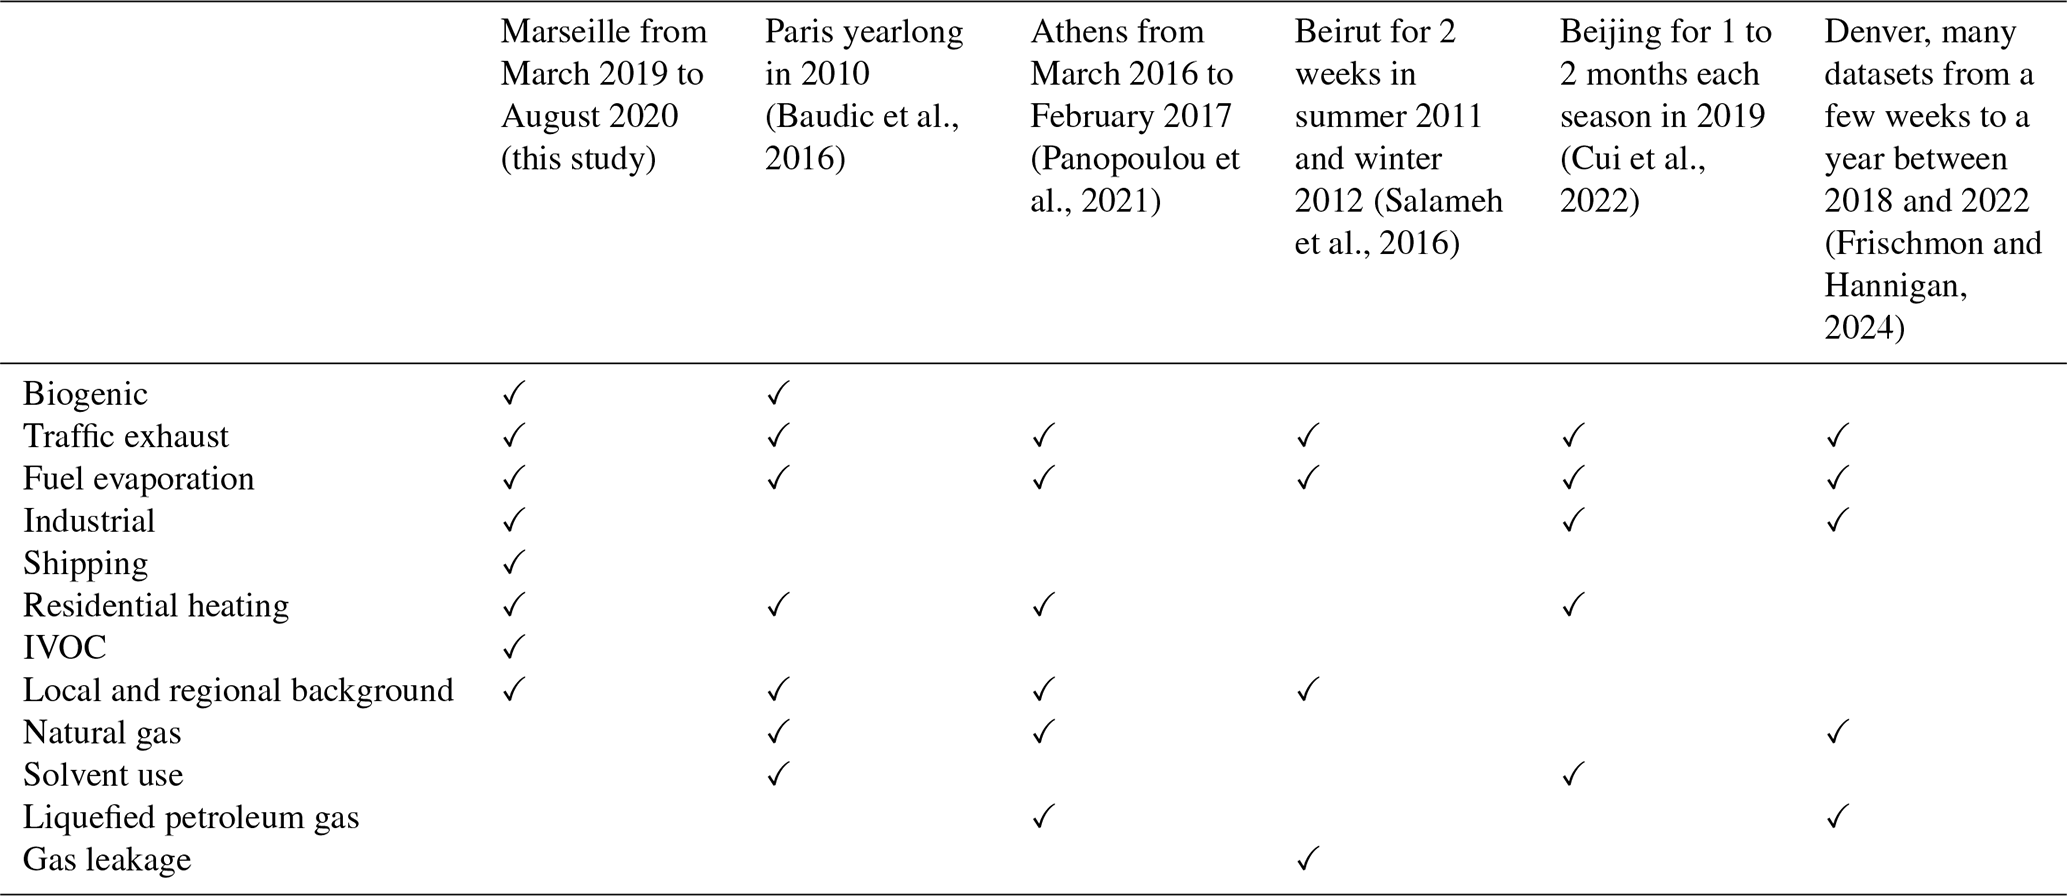
Traffic exhaust and fuel evaporation sources were identified in all these studies, although some studies distinguished these factors with greater precision. For instance, Salameh et al. (2016) were able to separate local and regional traffic exhaust emissions as well as fuel evaporation from both traffic and fuel storage facilities. Residential heating and local and regional background sources were also identified in most of these studies, but they were often mixed with other sources. In Athens, residential heating was combined with the local and regional background, while in Paris, the local and regional background was merged with the natural gas source.
The IVOC and shipping sources were only observed in Marseille. This can be explained by the fact that heavy n-alkanes were specifically measured in Marseille, and the site is located near a port. Finally, the industrial factor was also identified in Beijing and Denver, but its characteristics varied significantly across cities. As previously mentioned, the industrial factor in Marseille explains a significant portion of the measured cyclohexane and benzene concentrations and is linked to a plastic production industry located east of the station. In Beijing, the industrial factor included high concentrations of VOCs, with the most abundant being 2,3,4-trimethylpentane, n-butane, and methylcyclopentane. This factor was associated with petrochemical industries (Cui et al., 2022). In Denver, the industrial factor was attributed to a refinery and fuel storage tanks and was therefore defined as an oil extraction, processing, and evaporation factor (Frischmon and Hannigan, 2024).
Many recent studies present PMF results based on proton transfer reaction–mass spectrometry (PTR-MS) measurements. PTR-MS has the advantage of detecting OVOCs and highly reactive species, but it does not measure alkanes or distinguish between isomers. Consequently, due to differences in the measured compounds, these studies often identify sources that cannot be detected using gas chromatography techniques alone. For example, Languille et al. (2020) identified solvent use in Paris, and Gkatzelis et al. (2021) showed that in USA cities, volatile chemical products (VCPs) are a major source of VOCs. Finally, Simon (2023) identified cooking emissions by combining a PTR-MS dataset with an aerosol chemical speciation monitor (ACSM) dataset in Paris.
Splitting datasets by season during PMF analysis is common for aerosol studies but remains uncommon for VOC studies, where measurements are often conducted during specific periods of each season. Additionally, PMF studies based on PTR-MS measurements typically cover only a few weeks to a few months. One possible reason is the limitation of the EPA PMF model, which can handle a maximum of 500 000 data points (Hopke et al., 2023), posing a constraint for near-real-time instrumentation. As a result, the length of our dataset is a strength, allowing for the coverage of multiple years of seasonal variations. Furthermore, IVOCs are still rarely measured, and very few PMF studies include these compounds. Finally, our campaign was already in progress when the 2020 lockdown occurred, providing valuable insights into its impact on VOC concentrations. All these differences from other VOC source apportionment studies highlight the richness of the information obtained through this analysis.
3.6 Factors' contribution to atmospheric pollution
The seasonal contributions of the PMF factors are presented in Fig. 6 in terms of (a) NMHC concentration, (b) O3 formation potential (OFP), and (c) SOA formation potential (SOAFP). The OFP has been determined for each factor following the updated maximum incremental reactivity (MIR) (Venecek et al., 2018) and the SOAFP following the SOA potential (SOAP) determined by Derwent et al. (2010b). Nevertheless, the MIR and SOAP correspond to the maxima of secondary pollutant formation potential, which occur under summertime conditions when the photochemistry is the most active. Applying the MIR and SOAP to wintertime data may lead to an overestimation of OFP and SOAFP, especially for the most reactive species like alkenes. Therefore, wintertime OFP and SOAFP results have to be interpreted with caution. In addition, the concentration of alkenes was higher in winter than in summer due to residential heating. This observation, combined with the application of MIR values, can lead to a significant overestimation of OFP and SOAFP in winter.
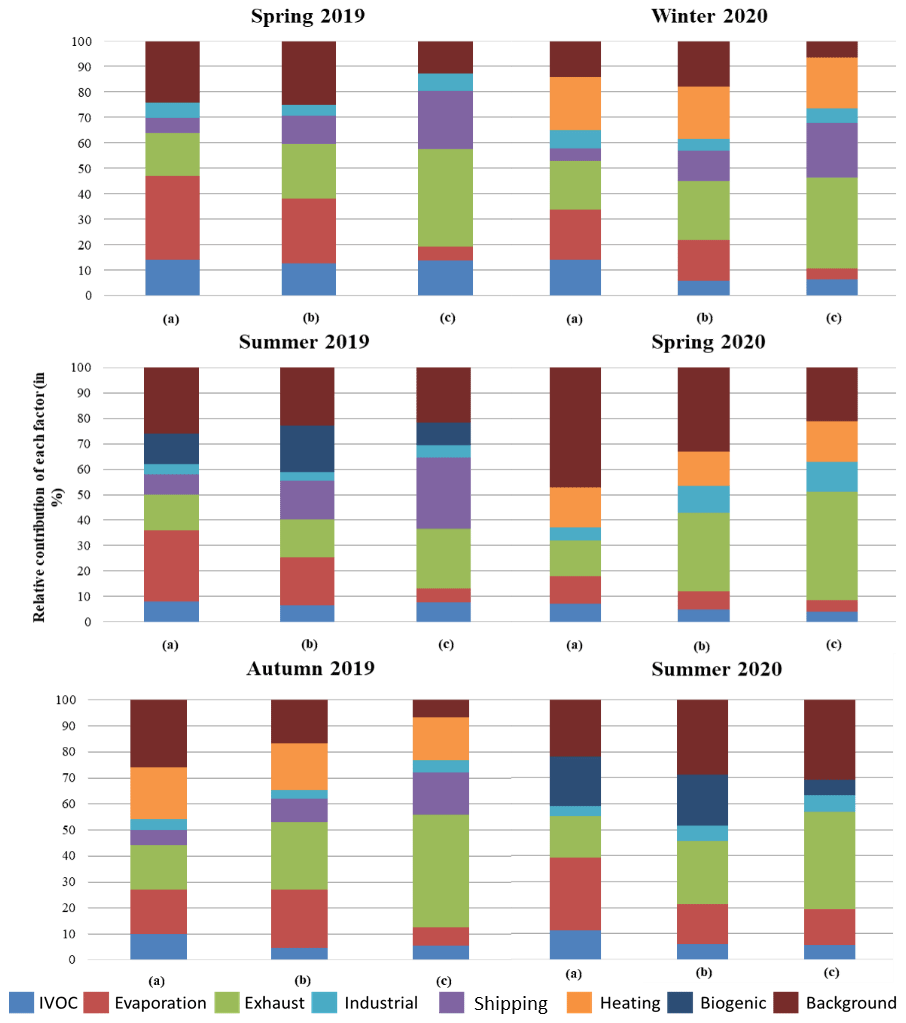
Figure 6Relative contribution of each factor to (a) the NMHC concentration, (b) the O3 formation potential, and (c) the SOA formation potential for each season.
Furthermore, as this campaign was performed at an urban background measurement site and not near emission sources, the results given in Fig. 6 are not the total OFP and SOAFP of emission sources but rather the O3 and SOA that can still be produced by these emission sources when the pollutants reach the measurement site, even if the impact of the photochemistry on our measured concentrations is negligible according to the observations made previously (see Sect. 3.2).
Since alkenes are not considered, the OFP determined for spring 2020 is partially estimated. Concerning the SOAFP, it is likely underestimated for IVOCs and biogenic compounds due to the absence of SOAP from the literature for limonene and C13–C16 alkanes, despite the fact that IVOCs are large contributors to SOA formation (Giani et al., 2019; Miao et al., 2021; Tkacik et al., 2012). Finally, regardless of whether the IVOC factor is well identified by the PMF analysis, it is nevertheless difficult to correctly separate it from the urban background factor and especially from ethane. The consequence is an overestimated contribution of this factor to the NMHC concentration.
As for NMHC concentrations, traffic (evaporation and exhaust) is always the largest contributor to OFP and SOAFP, with a relative contribution varying from 30 % to 50 % for both OFP and SOAFP. Between evaporation and exhaust, exhaust is the principal contributor to OFP and SOAFP due to the presence of alkenes, which have a high OFP, and aromatics, which have a high SOAFP in this factor (kOH(toluene) = 6.2 × 10⁻¹² molec. cm−3 s−1, kOH(o-xylene) = 14.7 × 10⁻¹² molec. cm−3 s−1; Atkinson, 1986), whereas the evaporation factor is mainly composed of C4–C5 alkanes, compounds with long lifetimes (kOH(butane) = 2.4 × 10⁻¹² molec. cm−3 s−1, kOH(pentane) = 3.8 × 10⁻¹² molec. cm−3 s−1; Atkinson and Arey, 2003). The same observation was made in a recent study conducted at an urban background site in Barcelona (In 'T Veld et al., 2024). In contrast, a recent study by Holland et al. (2023) revealed that the top contributors to OFP among NMHCs were ethene, ethane, and propane, based on 3 decades of measurements at both a traffic-related site and an urban background site in London. It is important to note that this study did not evaluate OFP using the MIR method but rather the photochemical ozone creation potential (POCP) method. However, previous research has shown that both methods produce comparable results (Derwent et al., 2010a). More recent studies using long-term datasets in urban background areas across Europe would be valuable to determine which results – those of Holland et al. (2023) or those of our study – are more representative. Traffic is generally the largest emitter of NMHCs in urban areas dealing with NMHC measurements (Panopoulou et al., 2021; Salameh et al., 2016) but not when oxygenated VOCs are included (Baudic et al., 2016; Languille et al., 2020). This points out the importance of including OVOCs in future studies since these pollutants are among the most emitted in urban air (McDonald et al., 2018).
During the cold period, residential heating contributes significantly to NMHC levels, with a mean contribution close to 7 µg m−3, corresponding to 20 % of NMHC levels, which is quite similar to the contribution of residential heating observed in other studies (Baudic et al., 2016; Panopoulou et al., 2021; Sauvage et al., 2009) and is considered the second-largest contributor to NMHC concentrations after traffic. As described in Sect. 3.4.3, the residential heating factor is composed of light alkanes but also alkenes (major contributors to O3 formation) and some aromatic compounds (major contributors to SOA formation). Due to the high contribution of some compounds present in this factor to the OFP and SOAFP, on the one hand, and the seasonal variability of this factor, present only during wintertime, on the other hand, the contribution of residential heating to OFP and SOAFP according to Fig. 6 might be overestimated.
According to Fig. 6, the smallest contributors to NMHC concentrations are the industrial and shipping factors. Their contribution to OFP and SOAFP is totally different, which is related to their chemical fingerprints. The industrial factor is mainly composed of isooctane, cyclohexane, and benzene, which are exclusively species with a low reactivity, whereas the shipping factor is mainly composed of ethylbenzene and xylenes, which are great contributors to SOAFP. Then, despite a similar contribution to NMHC concentrations, the shipping factor is expected to contribute much more to the SOAFP than the industrial factor and is even the strongest potential contributor to the formation of SOA in summer 2019, surpassing road traffic. This result highlights the necessity of better characterizing the shipping profile, and our results will be helpful for further studies.
The results presented above are limited to the sources that have been detected with the measurement of NMHCs. Many sources not identified here can significantly impact the formation of secondary pollutants. Asphalt, which covers a substantial portion of urban ground surfaces, contributes about 3 % of total VOC emissions in Paris, according to Lasne et al. (2023). Since the main VOCs detected were heavy alkanes and aromatics (Lostier et al., 2025), we can infer that this source likely contributes significantly to the SOAFP.
Another source not discussed here is cooking. This source, composed mainly of alcohols and heavy aldehydes (Kumar et al., 2025), contributes a minor fraction of yearly VOC emissions (0.69 % in the UK, according to Carter et al., 2024). However, since aldehydes are strong ozone precursors according to MIR values (Venecek et al., 2018), cooking may have a potential impact on the OFP in urban environments.
Lastly, regarding solvent use, which was not identified in this study despite its substantial contribution to VOC emissions inventories, it is common to either underestimate its contribution or fail to identify it when measuring only NMHCs (McDonald et al., 2018). Incorporating oxygenated VOCs, such as alcohols, acetone, glyoxal, or siloxane, into the measurement dataset would greatly aid in identifying this source. It has been estimated that in both the US and Europe, this source contributes 61 % to the SOAFP (McDonald et al., 2018), underscoring the need for better characterization of this source in urban ambient air environments.
3.7 Impact of Covid-19 lockdown on source contributions
The year 2020 was marked by a health crisis that led to a lockdown across France from 17 March to 10 May 2020. It is of interest to assess the impact of the lockdown on the VOC source apportionment. For this purpose, meteorological conditions during this period first have to be compared with the ones during the same period in 2019 (Table S10).
The temperature range and wind speed range during the lockdown in 2020 were similar to those in 2019. However, when looking at the number of hours under mistral conditions, the number is higher for the mistral event in 2019 in comparison to the same period in 2020. The mistral is well known for being associated with a low level of pollutants due to their dispersion away from their emission sources (Drobinski et al., 2007). Therefore, wind conditions during lockdown in 2020 were more favorable to the accumulation of pollutants than in 2019.
Finally, the global precipitation in this period and the number of hours with precipitation were lower in 2020 than in 2019, leading to an increase in the pollutant's concentrations due to the washing effect of precipitation on air pollution.
Briefly, during the lockdown period, meteorological conditions were favorable to the accumulation of pollutants in comparison to the same period in 2019 due to more stagnant and dryer air masses.
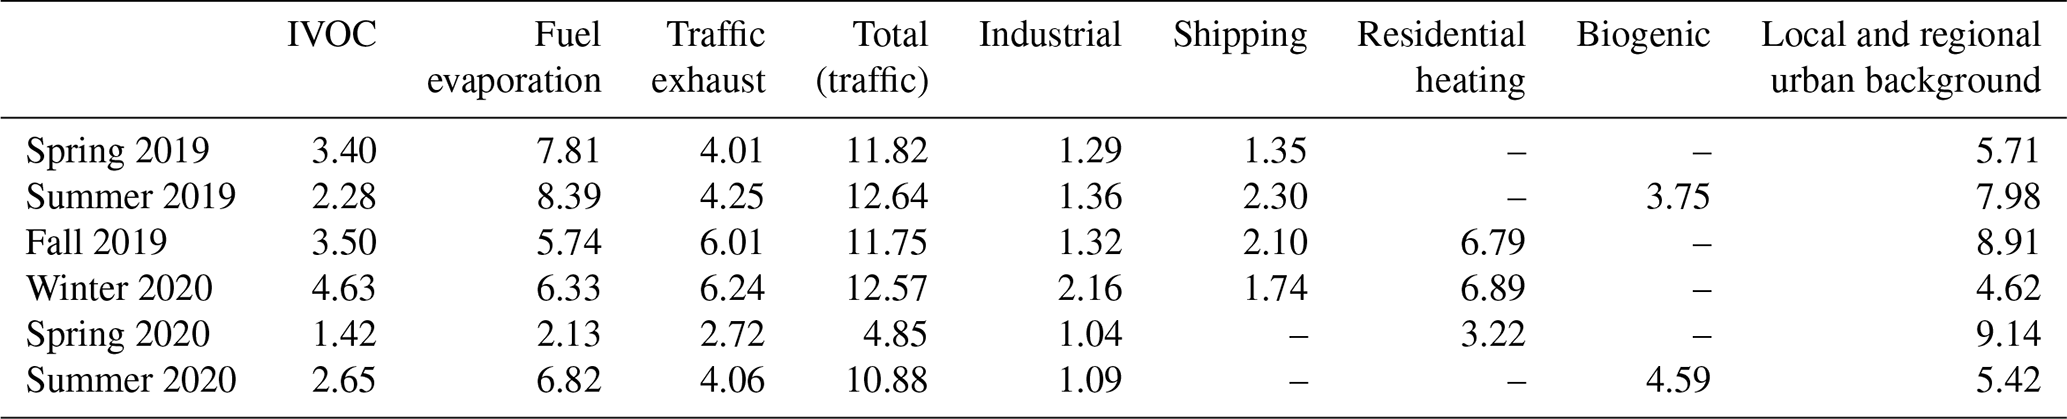
As shown in Table 7, besides the background factor, the contributions of all the factors are significantly lower in spring 2020 compared to spring 2019, even when compared to the other seasons. Even if C2–C6 alkene measurements were invalidated during spring 2020, their absence does not explain the high decrease in the traffic exhaust factor's contribution. From spring 2019 to winter 2020, the percentage of C2–C6 alkenes in the total measured NMHC concentrations from traffic exhaust was between 9.43 % and 16.75 % with a mean percentage of 12.98 %. Assuming a contribution of C2–C6 alkenes equal to this mean for spring 2020, the total traffic contribution reaches 5.57 µg m−3, which is still about 50 % less than during other seasons. This result is in good agreement with the decrease in NOx levels, reaching 50 % compared to the levels measured in the same period during previous years (AtmoSud, 2020). To estimate the impact of the lockdown on SOAFP, we examined the absolute values of SOAFP across seasons. However, it is important to note that these absolute values are highly uncertain, as they assume that all measured compounds react optimally to form SOA. Nonetheless, they provide insights into how seasonal VOC concentrations influence SOAFP. In addition, MIR and SOAP values determined under summer conditions were applied uniformly across all seasons, limiting the validity of seasonal comparisons. Across all seasons, SOAFP values ranged between 584 and 710 µg m−3, except for spring 2019 and spring 2020, where values were 343 and 392 µg m−3 respectively. Consequently, we cannot conclude whether the lockdown had a significant impact on SOAFP.
Table 7Contribution of each factor to NMHC emissions for all seasons. Results are given in µg m−3.
It is important to note that pollutants were affected differently during the lockdown. For instance, in Marseille, while NOx levels rapidly decreased by 50 % compared to previous years, fine particle concentrations were higher between 17 March and 17 April (AtmoSud, 2020). Similarly, a study by Putaud et al. (2021) assessed the specific impact of the lockdown on pollutant concentrations around Milan, Italy. They found that NO2 levels decreased by 30 % in urban background areas, whereas PM10 concentrations remained largely unchanged. This was attributed to the reduction in traffic-related PM emissions being counterbalanced by an increase in PM emissions from residential heating. Therefore, an SOAFP value that appears unaffected by the lockdown may not be unexpected.
VOC concentrations have been decreasing over the past 3 decades (Waked et al., 2016), but because of the Covid-19 lockdown, the comparison between both spring and summer is not conducted under the same condition, and a longer study would be useful to evaluate the interannual variability of VOC concentrations in Marseille.
A 1.5-year field campaign for the measurement of 70 NMHCs from C2 to C16, including IVOCs, was conducted from March 2019 to August 2020 at an urban background site in Marseille, resulting in a unique high-quality hourly dataset, which contributes to a better understanding of atmospheric pollution in the Marseille area.
The EPA PMF 5.0 model has been applied in order to identify sources and quantify their contribution to NMHC concentrations.
During all the seasons, we identified six NMHC sources, namely traffic exhaust, fuel evaporation, urban local and regional backgrounds, industrial, shipping, and an IVOC-specific profile. Two seasonal sources have been identified, e.g., the biogenic source in summer and the residential heating source in winter. There is a difference between cold and warm periods in terms of the contribution of traffic exhaust, which is 33 % (2.0 µg m−3) lower in warm periods compared to cold periods.
Traffic-related sources (exhaust and fuel evaporation) are the largest contributors to measured NMHC concentrations, with contributions of up to 40 % to 50 %, and to OFP and SOAFP during the whole campaign. In summer 2019, these sources contributed 30 %–35 % to OFP and SOAFP. During wintertime, residential heating was the second-largest contributor to measured NMHC concentrations, accounting for 20 % of measured NMHC.
The weakest factors in terms of contribution to NMHC concentrations are the industrial and shipping factors, as they have a low background level with high episodic peaks. The shipping factor is mainly composed of ethylbenzene and xylenes, contributing to an important SOAFP due to the reactivity of these compounds, whereas the industrial factor is essentially composed of benzene, isooctane, and cyclohexane, which have a low reactivity and therefore a small impact on OFP and SOAFP.
Taking advantage of this unique dataset, we were able to assess the effect of the Covid-19 lockdown between March 2020 and May 2020 in Marseille. A significant decrease in the factors' contribution has been shown for all factors except the local and regional urban background, reaching 50 % for traffic-related sources (exhaust and fuel evaporation).
A comparison of these sources' contributions with local and regional emission inventories would be useful to evaluate their accuracy for a better understanding of the atmospheric pollution occurring in Marseille. This comparison is even more critical since traffic contributed 4 % to NMVOC emissions in Marseille in 2019 according to the AtmoSud inventory, which is 10 times lower than in our PMF analysis. However, studies including OVOC measurements show better agreement between field measurements and inventories concerning the contribution of traffic to VOC concentrations. The inclusion of OVOC measurements is thus crucial for evaluating local and regional emission inventories and for helping to identify sources related to solvent use, which is becoming an important VOC contributor in emission inventories.
Additionally, the measurement of IVOCs is very challenging due to the absence of standards for these compounds, their very low concentrations in the atmosphere, and the difficulty of separating most of them into individual species. Still, these compounds are of interest due to their contribution to SOA formation, and measuring them is important in urban areas.
Finally, while this study gives information about NMHCs over 18 months, a decrease in VOC concentrations has been observed across France over the last 3 decades, particularly when considering VOCs emitted by traffic. Therefore, long-term measurements would be of interest for tracking the evolution of VOC concentrations. Furthermore, long-term datasets are also important for evaluating interannual variability.
VOC datasets have been submitted to the EBAS database (https://doi.org/10.48597/KME2-YC9U, Salameh and Dufresne, 2023; https://doi.org/10.48597/F5BM-XPAV, Salameh and Dufresne, 2024).
The supplement related to this article is available online at https://doi.org/10.5194/acp-25-5977-2025-supplement.
SS and TS planned the campaign. MD and TL carried out the campaign with the help of GG and AA. MD analyzed the data under the supervision of SS and TS. MD wrote the paper with the support and feedback from SS and TS.
The contact author has declared that none of the authors has any competing interests.
Publisher's note: Copernicus Publications remains neutral with regard to jurisdictional claims made in the text, published maps, institutional affiliations, or any other geographical representation in this paper. While Copernicus Publications makes every effort to include appropriate place names, the final responsibility lies with the authors.
We kindly acknowledge Ludovic Lanzi for his technical support throughout the field campaign.
This research received financial support from the French Agency for Ecological Transition (ADEME) and the Institut Mines-Télécom Nord Europe (IMT Nord Europe) and has been supported by Research Infrastructures Services Reinforcing Air Quality Monitoring Capacities in European Urban and Industrial Areas (RI-URBANS) (grant no. 101036245). The campaign received financial support from INSU within the frame of MISTRALS and ChArMEx programs.
This paper was edited by Thomas Karl and reviewed by two anonymous referees.
Ait-Helal, W., Borbon, A., Sauvage, S., de Gouw, J. A., Colomb, A., Gros, V., Freutel, F., Crippa, M., Afif, C., Baltensperger, U., Beekmann, M., Doussin, J.-F., Durand-Jolibois, R., Fronval, I., Grand, N., Leonardis, T., Lopez, M., Michoud, V., Miet, K., Perrier, S., Prévôt, A. S. H., Schneider, J., Siour, G., Zapf, P., and Locoge, N.: Volatile and intermediate volatility organic compounds in suburban Paris: variability, origin and importance for SOA formation, Atmos. Chem. Phys., 14, 10439–10464, https://doi.org/10.5194/acp-14-10439-2014, 2014.
Ara Begum, B., Kim, E., Jeong, C.-H., Lee, D.-W., and Hopke, P. K.: Evaluation of the potential source contribution function using the 2002 Quebec forest fire episode, Atmos. Environ., 39, 3719–3724, https://doi.org/10.1016/j.atmosenv.2005.03.008, 2005.
Ashbaugh, L. L., Malm, W. C., and Sadeh, W. Z.: A residence time probability analysis of sulfur concentrations at grand canyon national park, Atmos. Environ., 19, 1263–1270, 1985.
Atkinson, R.: Kinetics and mechanisms of the gas-phase reactions of the hydroxyl radical with organic compounds under atmospheric conditions, Chem. Rev., 86, 69–201, https://doi.org/10.1021/cr00071a004, 1986.
Atkinson, R. and Arey, J.: Atmospheric Degradation of Volatile Organic Compounds, Chem. Rev., 103, 4605–4638, https://doi.org/10.1021/cr0206420, 2003.
AtmoSud: [COVID-19] Un mois après, bilan du confinement sur la qualité de l'air, 3, https://www.atmosud.org/actualite/un-mois-apres-bilan-du-confinement-sur-la-qualite-de-lair (last access: 2 June 2025), 2020.
Badol, C., Locoge, N., and Galloo, J.-C.: Using a source-receptor approach to characterise VOC behaviour in a French urban area influenced by industrial emissions, Sci. Total Environ., 389, 429–440, https://doi.org/10.1016/j.scitotenv.2007.09.002, 2008.
Baudic, A., Gros, V., Sauvage, S., Locoge, N., Sanchez, O., Sarda-Estève, R., Kalogridis, C., Petit, J.-E., Bonnaire, N., Baisnée, D., Favez, O., Albinet, A., Sciare, J., and Bonsang, B.: Seasonal variability and source apportionment of volatile organic compounds (VOCs) in the Paris megacity (France), Atmos. Chem. Phys., 16, 11961–11989, https://doi.org/10.5194/acp-16-11961-2016, 2016.
Belis, C. A., Pernigotti, D., Karagulian, F., Pirovano, G., Larsen, B. R., Gerboles, M., and Hopke, P. K.: A new methodology to assess the performance and uncertainty of source apportionment models in intercomparison exercises, Atmos. Environ., 119, 35–44, https://doi.org/10.1016/j.atmosenv.2015.08.002, 2015.
Borbon, A., Fontaine, H., Veillerot, M., Locoge, N., Galloo, J. C., and Guillermo, R.: An investigation into the traffic-related fraction of isoprene at an urban location, Atmos. Environ., 35, 3749–3760, https://doi.org/10.1016/S1352-2310(01)00170-4, 2001.
Borbon, A., Dominutti, P., Panopoulou, A., Gros, V., Sauvage, S., Farhat, M., Afif, C., Elguindi, N., Fornaro, A., Granier, C., Hopkins, J. R., Liakakou, E., Nogueira, T., Corrêa Dos Santos, T., Salameh, T., Armangaud, A., Piga, D., and Perrussel, O.: Ubiquity of Anthropogenic Terpenoids in Cities Worldwide: Emission Ratios, Emission Quantification and Implications for Urban Atmospheric Chemistry, J. Geophys. Res.-Atmos., 128, e2022JD037566, https://doi.org/10.1029/2022JD037566, 2023.
Borbon, A., Salameh, T., Sauvage, S., and Afif, C.: Light oxygenated volatile organic compound concentrations in an Eastern Mediterranean urban atmosphere rivalling those in megacities, Environ. Pollut., 350, 123797, https://doi.org/10.1016/j.envpol.2024.123797, 2024.
Borlaza, L. J. S., Weber, S., Uzu, G., Jacob, V., Cañete, T., Micallef, S., Trébuchon, C., Slama, R., Favez, O., and Jaffrezo, J.-L.: Disparities in particulate matter (PM10) origins and oxidative potential at a city scale (Grenoble, France) – Part 1: Source apportionment at three neighbouring sites, Atmos. Chem. Phys., 21, 5415–5437, https://doi.org/10.5194/acp-21-5415-2021, 2021.
Bourtsoukidis, E., Ernle, L., Crowley, J. N., Lelieveld, J., Paris, J.-D., Pozzer, A., Walter, D., and Williams, J.: Non-methane hydrocarbon (C2–C8) sources and sinks around the Arabian Peninsula, Atmos. Chem. Phys., 19, 7209–7232, https://doi.org/10.5194/acp-19-7209-2019, 2019.
Carter, T. J., Shaw, D. R., Carslaw, D. C., and Carslaw, N.: Indoor cooking and cleaning as a source of outdoor air pollution in urban environments, Environ. Sci. Process. Impacts, 26, 975–990, https://doi.org/10.1039/D3EM00512G, 2024.
Chazeau, B., Temime-Roussel, B., Gille, G., Mesbah, B., D'Anna, B., Wortham, H., and Marchand, N.: Measurement report: Fourteen months of real-time characterisation of the submicronic aerosol and its atmospheric dynamics at the Marseille–Longchamp supersite, Atmos. Chem. Phys., 21, 7293–7319, https://doi.org/10.5194/acp-21-7293-2021, 2021.
CITEPA: Explorateur de données, https://www.citepa.org/explorateur-de-donnees/ (last access: 2 June 2025), 2020.
Clairotte, M., Adam, T. W., Zardini, A. A., Manfredi, U., Martini, G., Krasenbrink, A., Vicet, A., Tournié, E., and Astorga, C.: Effects of low temperature on the cold start gaseous emissions from light duty vehicles fuelled by ethanol-blended gasoline, Appl. Energ., 102, 44–54, https://doi.org/10.1016/j.apenergy.2012.08.010, 2013.
Coll, I., Rousseau, C., Barletta, B., Meinardi, S., and Blake, D. R.: Evaluation of an urban NMHC emission inventory by measurements and impact on CTM results, Atmos. Environ., 44, 3843–3855, https://doi.org/10.1016/j.atmosenv.2010.05.042, 2010.
Cui, L., Wu, D., Wang, S., Xu, Q., Hu, R., and Hao, J.: Measurement report: Ambient volatile organic compound (VOC) pollution in urban Beijing: characteristics, sources, and implications for pollution control, Atmos. Chem. Phys., 22, 11931–11944, https://doi.org/10.5194/acp-22-11931-2022, 2022.
Dayan, C., Fredj, E., Misztal, P. K., Gabay, M., Guenther, A. B., and Tas, E.: Emission of biogenic volatile organic compounds from warm and oligotrophic seawater in the Eastern Mediterranean, Atmos. Chem. Phys., 20, 12741–12759, https://doi.org/10.5194/acp-20-12741-2020, 2020.
Derwent, R. G., Jenkin, M. E., Pilling, M. J., Carter, W. P. L., and Kaduwela, A.: Reactivity Scales as Comparative Tools for Chemical Mechanisms, J. Air Waste Manage., 60, 914–924, https://doi.org/10.3155/1047-3289.60.8.914, 2010a.
Derwent, R. G., Jenkin, M. E., Utembe, S. R., Shallcross, D. E., Murrells, T. P., and Passant, N. R.: Secondary organic aerosol formation from a large number of reactive man-made organic compounds, Sci. Total Environ., 408, 3374–3381, https://doi.org/10.1016/j.scitotenv.2010.04.013, 2010b.
Dietz, W. A.: Response Factors for Gas Chromatographic Analyses, J. Chromatogr. Sci., 5, 68–71, https://doi.org/10.1093/chromsci/5.2.68, 1967.
Dominutti, P., Keita, S., Bahino, J., Colomb, A., Liousse, C., Yoboué, V., Galy-Lacaux, C., Morris, E., Bouvier, L., Sauvage, S., and Borbon, A.: Anthropogenic VOCs in Abidjan, southern West Africa: from source quantification to atmospheric impacts, Atmos. Chem. Phys., 19, 11721–11741, https://doi.org/10.5194/acp-19-11721-2019, 2019.
Drobinski, P., Saïd, F., Ancellet, G., Arteta, J., Augustin, P., Bastin, S., Brut, A., Caccia, J. L., Campistron, B., Cautenet, S., Colette, A., Coll, I., Corsmeier, U., Cros, B., Dabas, A., Delbarre, H., Dufour, A., Durand, P., Guénard, V., Hasel, M., Kalthoff, N., Kottmeier, C., Lasry, F., Lemonsu, A., Lohou, F., Masson, V., Menut, L., Moppert, C., Peuch, V. H., Puygrenier, V., Reitebuch, O., and Vautard, R.: Regional transport and dilution during high-pollution episodes in southern France: Summary of findings from the Field Experiment to Constraint Models of Atmospheric Pollution and Emissions Transport (ESCOMPTE), J. Geophys. Res.-Atmos., 112, D13105, https://doi.org/10.1029/2006JD007494, 2007.
Drozd, G. T., Zhao, Y., Saliba, G., Frodin, B., Maddox, C., Oliver Chang, M.-C., Maldonado, H., Sardar, S., Weber, R. J., Robinson, A. L., and Goldstein, A. H.: Detailed Speciation of Intermediate Volatility and Semivolatile Organic Compound Emissions from Gasoline Vehicles: Effects of Cold-Starts and Implications for Secondary Organic Aerosol Formation, Environ. Sci. Technol., 53, 1706–1714, https://doi.org/10.1021/acs.est.8b05600, 2019.
Drozd, G. T., Weber, R. J., and Goldstein, A. H.: Highly Resolved Composition during Diesel Evaporation with Modeled Ozone and Secondary Aerosol Formation: Insights into Pollutant Formation from Evaporative Intermediate Volatility Organic Compound Sources, Environ. Sci. Technol., 55, 5742–5751, https://doi.org/10.1021/acs.est.0c08832, 2021.
European Union: Directive 98/70/EC of the European Parliament and of the Council of 13 October 1998 relating to the quality of petrol and diesel fuels and amending Council Directive 93/12/EEC, Off. J. Eur. Commun., L 350, (https://eur-lex.europa.eu/eli/dir/1998/70/oj, last access: 2 June 2025), 58–68, 1998.
Filella, I. and Peñuelas, J.: Daily, weekly, and seasonal time courses of VOC concentrations in a semi-urban area near Barcelona, Atmos. Environ., 40, 7752–7769, https://doi.org/10.1016/j.atmosenv.2006.08.002, 2006.
Fraser, M. P., Cass, G. R., Simoneit, B. R. T., and Rasmussen, R. A.: Air Quality Model Evaluation Data for Organics. 4. C 2–C 36 Non-Aromatic Hydrocarbons, Environ. Sci. Technol., 31, 2356–2367, https://doi.org/10.1021/es960980g, 1997.
Frischmon, C. and Hannigan, M.: VOC source apportionment: How monitoring characteristics influence positive matrix factorization (PMF) solutions, Atmos. Environ. X, 21, 100230, https://doi.org/10.1016/j.aeaoa.2023.100230, 2024.
George, I. J., Hays, M. D., Herrington, J. S., Preston, W., Snow, R., Faircloth, J., George, B. J., Long, T., and Baldauf, R. W.: Effects of Cold Temperature and Ethanol Content on VOC Emissions from Light-Duty Gasoline Vehicles, Environ. Sci. Technol., 49, 13067–13074, https://doi.org/10.1021/acs.est.5b04102, 2015.
Giani, P., Balzarini, A., Pirovano, G., Gilardoni, S., Paglione, M., Colombi, C., Gianelle, V. L., Belis, C. A., Poluzzi, V., and Lonati, G.: Influence of semi- and intermediate-volatile organic compounds (S/IVOC) parameterizations, volatility distributions and aging schemes on organic aerosol modelling in winter conditions, Atmos. Environ., 213, 11–24, https://doi.org/10.1016/j.atmosenv.2019.05.061, 2019.
Gkatzelis, G. I., Coggon, M. M., McDonald, B. C., Peischl, J., Gilman, J. B., Aikin, K. C., Robinson, M. A., Canonaco, F., Prevot, A. S. H., Trainer, M., and Warneke, C.: Observations Confirm that Volatile Chemical Products Are a Major Source of Petrochemical Emissions in U.S. Cities, Environ. Sci. Technol., 55, 4332–4343, https://doi.org/10.1021/acs.est.0c05471, 2021.
Gu, Y., Liu, B., Meng, H., Song, S., Dai, Q., Shi, L., Feng, Y., and Hopke, P. K.: Source apportionment of consumed volatile organic compounds in the atmosphere, J. Hazard. Mater., 459, 132138, https://doi.org/10.1016/j.jhazmat.2023.132138, 2023.
Guenther, A. B., Jiang, X., Heald, C. L., Sakulyanontvittaya, T., Duhl, T., Emmons, L. K., and Wang, X.: The Model of Emissions of Gases and Aerosols from Nature version 2.1 (MEGAN2.1): an extended and updated framework for modeling biogenic emissions, Geosci. Model Dev., 5, 1471–1492, https://doi.org/10.5194/gmd-5-1471-2012, 2012.
Hatch, L. E., Rivas-Ubach, A., Jen, C. N., Lipton, M., Goldstein, A. H., and Barsanti, K. C.: Measurements of I/SVOCs in biomass-burning smoke using solid-phase extraction disks and two-dimensional gas chromatography, Atmos. Chem. Phys., 18, 17801–17817, https://doi.org/10.5194/acp-18-17801-2018, 2018.
Hoerger, C. C., Claude, A., Plass-Duelmer, C., Reimann, S., Eckart, E., Steinbrecher, R., Aalto, J., Arduini, J., Bonnaire, N., Cape, J. N., Colomb, A., Connolly, R., Diskova, J., Dumitrean, P., Ehlers, C., Gros, V., Hakola, H., Hill, M., Hopkins, J. R., Jäger, J., Junek, R., Kajos, M. K., Klemp, D., Leuchner, M., Lewis, A. C., Locoge, N., Maione, M., Martin, D., Michl, K., Nemitz, E., O'Doherty, S., Pérez Ballesta, P., Ruuskanen, T. M., Sauvage, S., Schmidbauer, N., Spain, T. G., Straube, E., Vana, M., Vollmer, M. K., Wegener, R., and Wenger, A.: ACTRIS non-methane hydrocarbon intercomparison experiment in Europe to support WMO GAW and EMEP observation networks, Atmos. Meas. Tech., 8, 2715–2736, https://doi.org/10.5194/amt-8-2715-2015, 2015.
Holland, R., Khan, A. H., Derwent, R. G., Lynch, J., Ahmed, F., Grace, S., Bacak, A., and Shallcross, D. E.: Gas-phase kinetics, POCPs, and an investigation of the contributions of VOCs to urban ozone production in the UK, Int. J. Chem. Kinet., 55, 350–364, https://doi.org/10.1002/kin.21640, 2023.
Hopke, P. K.: A GUIDE TO POSITIVE MATRIX FACTORIZATION, 16, https://www3.epa.gov/ttnamti1/files/ambient/pm25/workshop/laymen.pdf (last access: 2 June 2025), 2000.
Hopke, P. K., Chen, Y., Rich, D. Q., Mooibroek, D., and Sofowote, U. M.: The application of positive matrix factorization with diagnostics to BIG DATA, Chemometr. Intell. Lab., 240, 104885, https://doi.org/10.1016/j.chemolab.2023.104885, 2023.
In 'T Veld, M., Seco, R., Reche, C., Pérez, N., Alastuey, A., Portillo-Estrada, M., Janssens, I. A., Peñuelas, J., Fernandez-Martinez, M., Marchand, N., Temime-Roussel, B., Querol, X., and Yáñez-Serrano, A. M.: Identification of volatile organic compounds and their sources driving ozone and secondary organic aerosol formation in NE Spain, Sci. Total Environ., 906, 167159, https://doi.org/10.1016/j.scitotenv.2023.167159, 2024.
Jathar, S. H., Woody, M., Pye, H. O. T., Baker, K. R., and Robinson, A. L.: Chemical transport model simulations of organic aerosol in southern California: model evaluation and gasoline and diesel source contributions, Atmos. Chem. Phys., 17, 4305–4318, https://doi.org/10.5194/acp-17-4305-2017, 2017.
Kaser, L., Peron, A., Graus, M., Striednig, M., Wohlfahrt, G., Juráň, S., and Karl, T.: Interannual variability of terpenoid emissions in an alpine city, Atmos. Chem. Phys., 22, 5603–5618, https://doi.org/10.5194/acp-22-5603-2022, 2022.
Khaniabadi, Y. O. and Sicard, P.: A 10-year assessment of ambient fine particles and related health endpoints in a large Mediterranean city, Chemosphere, 278, 130502, https://doi.org/10.1016/j.chemosphere.2021.130502, 2021.
Kumar, A., O'Leary, C., Winkless, R., Thompson, M., Davies, H. L., Shaw, M., Andrews, S. J., Carslaw, N., and Dillon, T. J.: Fingerprinting the emissions of volatile organic compounds emitted from the cooking of oils, herbs, and spices, Environ. Sci. Process. Impacts, 27, 244–261, https://doi.org/10.1039/D4EM00579A, 2025.
Languille, B., Gros, V., Petit, J.-E., Honoré, C., Baudic, A., Perrussel, O., Foret, G., Michoud, V., Truong, F., Bonnaire, N., Sarda-Estève, R., Delmotte, M., Feron, A., Maisonneuve, F., Gaimoz, C., Formenti, P., Kotthaus, S., Haeffelin, M., and Favez, O.: Wood burning: A major source of Volatile Organic Compounds during wintertime in the Paris region, Sci. Total Environ., 711, 135055, https://doi.org/10.1016/j.scitotenv.2019.135055, 2020.
Lasne, J., Lostier, A., Romanias, M. N., Vassaux, S., Lesueur, D., Gaudion, V., Jamar, M., Derwent, R. G., Dusanter, S., and Salameh, T.: VOC emissions by fresh and old asphalt pavements at service temperatures: impacts on urban air quality, Environ. Sci. Atmos., 3, 1601–1619, https://doi.org/10.1039/D3EA00034F, 2023.
Lee, E., Chan, C. K., and Paatero, P.: Application of positive matrix factorization in source apportionment of particulate pollutants in Hong Kong, Atmos. Environ., 33, 3201–3212, https://doi.org/10.1016/S1352-2310(99)00113-2, 1999.
Lelieveld, J., Hadjinicolaou, P., Kostopoulou, E., Giannakopoulos, C., Pozzer, A., Tanarhte, M., and Tyrlis, E.: Model projected heat extremes and air pollution in the eastern Mediterranean and Middle East in the twenty-first century, Reg. Environ. Change, 14, 1937–1949, https://doi.org/10.1007/s10113-013-0444-4, 2014.
Lelieveld, J., Evans, J. S., Fnais, M., Giannadaki, D., and Pozzer, A.: The contribution of outdoor air pollution sources to premature mortality on a global scale, Nature, 525, 367–371, https://doi.org/10.1038/nature15371, 2015.
Liu, B., Yang, Y., Yang, T., Dai, Q., Zhang, Y., Feng, Y., and Hopke, P. K.: Effect of photochemical losses of ambient volatile organic compounds on their source apportionment, Environ. Int., 172, 107766, https://doi.org/10.1016/j.envint.2023.107766, 2023.
Liu, X., Zhang, X., Dufresne, M., Wang, T., Wu, L., Lara, R., Seco, R., Monge, M., Yáñez-Serrano, A. M., Gohy, M., Petit, P., Chevalier, A., Vagnot, M.-P., Fortier, Y., Baudic, A., Ghersi, V., Gille, G., Lanzi, L., Gros, V., Simon, L., Héllen, H., Reimann, S., Le Bras, Z., Müller, M. J., Beddows, D., Hou, S., Shi, Z., Harrison, R. M., Bloss, W., Dernie, J., Sauvage, S., Hopke, P. K., Duan, X., An, T., Lewis, A. C., Hopkins, J. R., Liakakou, E., Mihalopoulos, N., Zhang, X., Alastuey, A., Querol, X., and Salameh, T.: Measurement report: Exploring the variations in ambient BTEX in urban Europe and their environmental health implications, Atmos. Chem. Phys., 25, 625–638, https://doi.org/10.5194/acp-25-625-2025, 2025.
Lostier, A., Sarica, T., Lasne, J., Roose, A., Sartelet, K., Jamar, M., Gaudion, V., Dusanter, S., Lesueur, D., Chen, H., Salameh, T., and Romanias, M. N.: Real-World Asphalt Pavement Emissions: Combining Simulation Chamber Measurements and City Scale Modeling to Elucidate the Impacts on Air Quality, ACS EST Air, 2, 426–435, https://doi.org/10.1021/acsestair.4c00323, 2025.
Lu, Q., Murphy, B. N., Qin, M., Adams, P. J., Zhao, Y., Pye, H. O. T., Efstathiou, C., Allen, C., and Robinson, A. L.: Simulation of organic aerosol formation during the CalNex study: updated mobile emissions and secondary organic aerosol parameterization for intermediate-volatility organic compounds, Atmos. Chem. Phys., 20, 4313–4332, https://doi.org/10.5194/acp-20-4313-2020, 2020.
Ludykar, D., Westerholm, R., and Almén, J.: Cold start emissions at +22, −7 and −20 °C ambient temperatures from a three-way catalyst (TWC) car: regulated and unregulated exhaust components, Sci. Total Environ., 235, 65–69, https://doi.org/10.1016/S0048-9697(99)00190-4, 1999.
Magazzino, C., Mele, M., and Schneider, N.: The relationship between air pollution and COVID-19-related deaths: An application to three French cities, Appl. Energ., 279, 115835, https://doi.org/10.1016/j.apenergy.2020.115835, 2020.
Mai, J.-L., Yang, W.-W., Zeng, Y., Guan, Y.-F., and Chen, S.-J.: Volatile organic compounds (VOCs) in residential indoor air during interior finish period: Sources, variations, and health risks, Hyg. Environ. Health Adv., 9, 100087, https://doi.org/10.1016/j.heha.2023.100087, 2024.
Manousakas, M., Diapouli, E., Belis, C. A., Vasilatou, V., Gini, M., Lucarelli, F., Querol, X., and Eleftheriadis, K.: Quantitative assessment of the variability in chemical profiles from source apportionment analysis of PM10 and PM2.5 at different sites within a large metropolitan area, Environ. Res., 192, 110257, https://doi.org/10.1016/j.envres.2020.110257, 2021.
McDonald, B. C., de Gouw, J. A., Gilman, J. B., Jathar, S. H., Akherati, A., Cappa, C. D., Jimenez, J. L., Lee-Taylor, J., Hayes, P. L., McKeen, S. A., Cui, Y. Y., Kim, S.-W., Gentner, D. R., Isaacman-VanWertz, G., Goldstein, A. H., Harley, R. A., Frost, G. J., Roberts, J. M., Ryerson, T. B., and Trainer, M.: Volatile chemical products emerging as largest petrochemical source of urban organic emissions, Science, 359, 760–764, https://doi.org/10.1126/science.aaq0524, 2018.
Miao, R., Chen, Q., Shrivastava, M., Chen, Y., Zhang, L., Hu, J., Zheng, Y., and Liao, K.: Process-based and observation-constrained SOA simulations in China: the role of semivolatile and intermediate-volatility organic compounds and OH levels, Atmos. Chem. Phys., 21, 16183–16201, https://doi.org/10.5194/acp-21-16183-2021, 2021.
Michoud, V., Sciare, J., Sauvage, S., Dusanter, S., Léonardis, T., Gros, V., Kalogridis, C., Zannoni, N., Féron, A., Petit, J.-E., Crenn, V., Baisnée, D., Sarda-Estève, R., Bonnaire, N., Marchand, N., DeWitt, H. L., Pey, J., Colomb, A., Gheusi, F., Szidat, S., Stavroulas, I., Borbon, A., and Locoge, N.: Organic carbon at a remote site of the western Mediterranean Basin: sources and chemistry during the ChArMEx SOP2 field experiment, Atmos. Chem. Phys., 17, 8837–8865, https://doi.org/10.5194/acp-17-8837-2017, 2017.
Mooibroek, D., Sofowote, U. M., and Hopke, P. K.: Source apportionment of ambient PM10 collected at three sites in an urban-industrial area with multi-time resolution factor analyses, Sci. Total Environ., 850, 157981, https://doi.org/10.1016/j.scitotenv.2022.157981, 2022.
Ots, R., Young, D. E., Vieno, M., Xu, L., Dunmore, R. E., Allan, J. D., Coe, H., Williams, L. R., Herndon, S. C., Ng, N. L., Hamilton, J. F., Bergström, R., Di Marco, C., Nemitz, E., Mackenzie, I. A., Kuenen, J. J. P., Green, D. C., Reis, S., and Heal, M. R.: Simulating secondary organic aerosol from missing diesel-related intermediate-volatility organic compound emissions during the Clean Air for London (ClearfLo) campaign, Atmos. Chem. Phys., 16, 6453–6473, https://doi.org/10.5194/acp-16-6453-2016, 2016.
Paatero, P.: Least squares formulation of robust non-negative factor analysis, Chemometr. Intell. Lab., 37, 23–35, https://doi.org/10.1016/S0169-7439(96)00044-5, 1997.
Paatero, P. and Tapper, U.: Positive matrix factorization: A non-negative factor model with optimal utilization of error estimates of data values, Environmetrics, 5, 111–126, https://doi.org/10.1002/env.3170050203, 1994.
Panopoulou, A., Liakakou, E., Gros, V., Sauvage, S., Locoge, N., Bonsang, B., Psiloglou, B. E., Gerasopoulos, E., and Mihalopoulos, N.: Non-methane hydrocarbon variability in Athens during wintertime: the role of traffic and heating, Atmos. Chem. Phys., 18, 16139–16154, https://doi.org/10.5194/acp-18-16139-2018, 2018.
Panopoulou, A., Liakakou, E., Sauvage, S., Gros, V., Locoge, N., Stavroulas, I., Bonsang, B., Gerasopoulos, E., and Mihalopoulos, N.: Yearlong measurements of monoterpenes and isoprene in a Mediterranean city (Athens): Natural vs anthropogenic origin, Atmos. Environ., 243, 117803, https://doi.org/10.1016/j.atmosenv.2020.117803, 2020.
Panopoulou, A., Liakakou, E., Sauvage, S., Gros, V., Locoge, N., Bonsang, B., Salameh, T., Gerasopoulos, E., and Mihalopoulos, N.: Variability and sources of non-methane hydrocarbons at a Mediterranean urban atmosphere: The role of biomass burning and traffic emissions, Sci. Total Environ., 800, 149389, https://doi.org/10.1016/j.scitotenv.2021.149389, 2021.
Parrish, D. D., Kuster, W. C., Shao, M., Yokouchi, Y., Kondo, Y., Goldan, P. D., de Gouw, J. A., Koike, M., and Shirai, T.: Comparison of air pollutant emissions among mega-cities, Atmos. Environ., 43, 6435–6441, https://doi.org/10.1016/j.atmosenv.2009.06.024, 2009.
Pereira, K. L., Dunmore, R., Whitehead, J., Alfarra, M. R., Allan, J. D., Alam, M. S., Harrison, R. M., McFiggans, G., and Hamilton, J. F.: Technical note: Use of an atmospheric simulation chamber to investigate the effect of different engine conditions on unregulated VOC-IVOC diesel exhaust emissions, Atmos. Chem. Phys., 18, 11073–11096, https://doi.org/10.5194/acp-18-11073-2018, 2018.
Pernigotti, D., Belis, C. A., and Spanò, L.: SPECIEUROPE: The European data base for PM source profiles, Atmos. Pollut. Res., 7, 307–314, https://doi.org/10.1016/j.apr.2015.10.007, 2016.
Putaud, J.-P., Pozzoli, L., Pisoni, E., Martins Dos Santos, S., Lagler, F., Lanzani, G., Dal Santo, U., and Colette, A.: Impacts of the COVID-19 lockdown on air pollution at regional and urban background sites in northern Italy, Atmos. Chem. Phys., 21, 7597–7609, https://doi.org/10.5194/acp-21-7597-2021, 2021.
Rasulov, B., Hüve, K., Bichele, I., Laisk, A., and Niinemets, Ü.: Temperature Response of Isoprene Emission in Vivo Reflects a Combined Effect of Substrate Limitations and Isoprene Synthase Activity: A Kinetic Analysis, Plant Physiol., 154, 1558–1570, https://doi.org/10.1104/pp.110.162081, 2010.
Reimann, S., Wegener, R., Claude, A., and Sauvage, S.: Deliverable 3.17. Updated Measurement Guideline for NOx and VOCs, 103, https://www.actris.eu/sites/default/files/inline-files/WP3_D3.17_M42_0.pdf (last access: 2 June 2025), 2018.
Salameh, T. and Dufresne, M.: Measurement of Greenhouse gases (other halogenated) and VOC (hydrocarbons) at Marseille Longchamp (3), EBAS [data set], https://doi.org/10.48597/KME2-YC9U, 2023.
Salameh, T. and Dufresne, M.: VOC (hydrocarbons) at Marseille Longchamp (4), EBAS [data set], https://doi.org/10.48597/F5BM-XPAV, 2024.
Salameh, T., Sauvage, S., Afif, C., Borbon, A., Léonardis, T., Brioude, J., Waked, A., and Locoge, N.: Exploring the seasonal NMHC distribution in an urban area of the Middle East during ECOCEM campaigns: very high loadings dominated by local emissions and dynamics, Environ. Chem., 12, 316–328, 2015.
Salameh, T., Sauvage, S., Afif, C., Borbon, A., and Locoge, N.: Source apportionment vs. emission inventories of non-methane hydrocarbons (NMHC) in an urban area of the Middle East: local and global perspectives, Atmos. Chem. Phys., 16, 3595–3607, https://doi.org/10.5194/acp-16-3595-2016, 2016.
Salameh, T., Sauvage, S., Locoge, N., Gauduin, J., Perrussel, O., and Borbon, A.: Spatial and temporal variability of BTEX in Paris megacity: Two-wheelers as a major driver, Atmos. Environ. X, 1, 100003, https://doi.org/10.1016/j.aeaoa.2018.100003, 2019.
Sauvage, S., Plaisance, H., Locoge, N., Wroblewski, A., Coddeville, P., and Galloo, J. C.: Long term measurement and source apportionment of non-methane hydrocarbons in three French rural areas, Atmos. Environ., 43, 2430–2441, https://doi.org/10.1016/j.atmosenv.2009.02.001, 2009.
Simon, L.: Détermination des sources de composés organiques (gazeux et particulaires) en Ile-de-France, https://theses.fr/2023UPASJ011 (last access: 2 June 2025), 2023
Sindelarova, K., Granier, C., Bouarar, I., Guenther, A., Tilmes, S., Stavrakou, T., Müller, J.-F., Kuhn, U., Stefani, P., and Knorr, W.: Global data set of biogenic VOC emissions calculated by the MEGAN model over the last 30 years, Atmos. Chem. Phys., 14, 9317–9341, https://doi.org/10.5194/acp-14-9317-2014, 2014.
Sommariva, R., de Gouw, J. A., Trainer, M., Atlas, E., Goldan, P. D., Kuster, W. C., Warneke, C., and Fehsenfeld, F. C.: Emissions and photochemistry of oxygenated VOCs in urban plumes in the Northeastern United States, Atmos. Chem. Phys., 11, 7081–7096, https://doi.org/10.5194/acp-11-7081-2011, 2011.
Stanimirova, I., Rich, D. Q., Russell, A. G., and Hopke, P. K.: A long-term, dispersion normalized PMF source apportionment of PM2.5 in Atlanta from 2005 to 2019, Atmos. Environ., 312, 120027, https://doi.org/10.1016/j.atmosenv.2023.120027, 2023.
Sternberg, J. C., Gallaway, W. S., and Jones, D. T. L.: Chapter XVIII: The Mechanism of Response of Flame Ionization Detectors, in: Gas Chromatography: Third International Symposium Held Under the Auspices of the Analysis Instrumentation Division of the Instrument Society of America, edited by: Brenner, N., Callen, J. E., and Weiss, M. D., Academic Press, New York and London, 231–267, 1962.
Thera, B. T. P., Dominutti, P., Öztürk, F., Salameh, T., Sauvage, S., Afif, C., Çetin, B., Gaimoz, C., Keleş, M., Evan, S., and Borbon, A.: Composition and variability of gaseous organic pollution in the port megacity of Istanbul: source attribution, emission ratios, and inventory evaluation, Atmos. Chem. Phys., 19, 15131–15156, https://doi.org/10.5194/acp-19-15131-2019, 2019.
Thunis, P., Degraeuwe, B., Cuvelier, K., Guevara, M., Tarrason, L., and Clappier, A.: A novel approach to screen and compare emission inventories, Air Qual. Atmos. Hlth., 9, 325–333, https://doi.org/10.1007/s11869-016-0402-7, 2016.
Tingey, D. T., Manning, M., Grothaus, L. C., and Burns, W. F.: Influence of Light and Temperature on Monoterpene Emission Rates from Slash Pine, Plant Physiol., 65, 797–801, https://doi.org/10.1104/pp.65.5.797, 1980.
Tkacik, D. S., Presto, A. A., Donahue, N. M., and Robinson, A. L.: Secondary Organic Aerosol Formation from Intermediate-Volatility Organic Compounds: Cyclic, Linear, and Branched Alkanes, Environ. Sci. Technol., 46, 8773–8781, https://doi.org/10.1021/es301112c, 2012.
Trombetti, M., Thunis, P., Bessagnet, B., Clappier, A., Couvidat, F., Guevara, M., Kuenen, J., and López-Aparicio, S.: Spatial inter-comparison of Top-down emission inventories in European urban areas, Atmos. Environ., 173, 142–156, https://doi.org/10.1016/j.atmosenv.2017.10.032, 2018.
Troussier, F., Locoge, N., and Gallo, J. C.: Source apportionment of Volatile Organic Compounds in 3 French sites by descriptive analyses and receptor modelling, Istanbul, Turkey, 10, 2005, https://doi.org/10.2495/AIR070321, 2005.
Venecek, M. A., Carter, W. P. L., and Kleeman, M. J.: Updating the SAPRC Maximum Incremental Reactivity (MIR) scale for the United States from 1988 to 2010, J. Air Waste Manage., 68, 1301–1316, https://doi.org/10.1080/10962247.2018.1498410, 2018.
Waked, A., Sauvage, S., Borbon, A., Gauduin, J., Pallares, C., Vagnot, M.-P., Léonardis, T., and Locoge, N.: Multi-year levels and trends of non-methane hydrocarbon concentrations observed in ambient air in France, Atmos. Environ., 141, 263–275, https://doi.org/10.1016/j.atmosenv.2016.06.059, 2016.
Wang, H., Lou, S., Huang, C., Qiao, L., Tang, X., Chen, C., Zeng, L., Wang, Q., Zhou, M., Lu, S., and Yu, X.: Source Profiles of Volatile Organic Compounds from Biomass Burning in Yangtze River Delta, China, Aerosol Air Qual. Res., 14, 818–828, https://doi.org/10.4209/aaqr.2013.05.0174, 2014.
Wang, R., Yuan, Z., Zheng, J., Li, C., Huang, Z., Li, W., Xie, Y., Wang, Y., Yu, K., and Duan, L.: Characterization of VOC emissions from construction machinery and river ships in the Pearl River Delta of China, J. Environ. Sci., 96, 138–150, https://doi.org/10.1016/j.jes.2020.03.013, 2020.
Warneke, C., McKeen, S. A., de Gouw, J. A., Goldan, P. D., Kuster, W. C., Holloway, J. S., Williams, E. J., Lerner, B. M., Parrish, D. D., Trainer, M., Fehsenfeld, F. C., Kato, S., Atlas, E. L., Baker, A., and Blake, D. R.: Determination of urban volatile organic compound emission ratios and comparison with an emissions database: URBAN VOC EMISSION RATIOS, J. Geophys. Res.-Atmos., 112, D10S47, https://doi.org/10.1029/2006JD007930, 2007.
World Health Organization: Air pollution levels rising in many of the world's poorest cities, https://www.who.int/news/item/12-05-2016-air-pollution-levels-rising-in-many-of-the-world-s-poorest-cities, last access: 2 June 2025a.
World Health Organization: 9 out of 10 people worldwide breathe polluted air but more contries are taking action, https://www.who.int/news/item/02-05-2018-9-out-of-10-people-worldwide-breathe-polluted-air-but-more-countries-are-taking-action, last access: 2 June 2025b.
Wu, Y., Liu, B., Meng, H., Dai, Q., Shi, L., Song, S., Feng, Y., and Hopke, P. K.: Changes in source apportioned VOCs during high O3 periods using initial VOC-concentration-dispersion normalized PMF, Sci. Total Environ., 896, 165182, https://doi.org/10.1016/j.scitotenv.2023.165182, 2023.
Zhao, Y., Hennigan, C. J., May, A. A., Tkacik, D. S., de Gouw, J. A., Gilman, J. B., Kuster, W. C., Borbon, A., and Robinson, A. L.: Intermediate-Volatility Organic Compounds: A Large Source of Secondary Organic Aerosol, Environ. Sci. Technol., 48, 13743–13750, https://doi.org/10.1021/es5035188, 2014.
Zhao, Y., Nguyen, N. T., Presto, A. A., Hennigan, C. J., May, A. A., and Robinson, A. L.: Intermediate Volatility Organic Compound Emissions from On-Road Gasoline Vehicles and Small Off-Road Gasoline Engines, Environ. Sci. Technol., 50, 4554–4563, https://doi.org/10.1021/acs.est.5b06247, 2016.