the Creative Commons Attribution 4.0 License.
the Creative Commons Attribution 4.0 License.
 | 03 Jun 2025
Measurement report: Characterization of aerosol hygroscopicity over Southeast Asia during the NASA CAMP2Ex campaign
Genevieve Rose Lorenzo
Luke D. Ziemba
Avelino F. Arellano
Mary C. Barth
Ewan C. Crosbie
Joshua P. DiGangi
Glenn S. Diskin
Richard Ferrare
Miguel Ricardo A. Hilario
Michael A. Shook
Simone Tilmes
Jian Wang
Qian Xiao
Jun Zhang
This study characterizes the spatial and vertical nature of aerosol hygroscopicity in Southeast Asia and relates it to aerosol composition and sources. Aerosol hygroscopicity via the light scattering hygroscopic growth factor, f(RH), is calculated from the amplification of PM5 (particulate matter with a particle diameter, Dp, <5 µm) scattering measurements from <40 % to 82 % relative humidity during the Cloud, Aerosol, and Monsoon Processes Philippines Experiment (CAMP2Ex) between August and October 2019 over the northwest tropical Pacific. Median f(RH) is low (1.26 with lower to upper quartiles of 1.05 to 1.43) like polluted environments, due to the dominance of the mixture of organic carbon and elemental carbon. The f(RH) is lowest due to smoke from the Maritime Continent (MC) during its peak biomass burning season, coincident with high carbon monoxide concentrations (>0.25 ppm) and pronounced levels of accumulation-mode particles and organic mass fractions. The highest f(RH) values are linked to coarser particles from the West Pacific and aged biomass burning particles in the region farthest away from the MC, where f(RH) values are lower than typical polluted marine environments. Convective transport and associated cloud processing in these regions decrease and increase hygroscopicity aloft in cases with transported air masses exhibiting increased organic and sulfate mass fractions, respectively. An evaluation of the Community Atmosphere Model with Chemistry (CAM-chem) for cases of vertical transport showed the underrepresentation of organics, resulting in overestimated modeled aerosol hygroscopicity. These findings on aerosol hygroscopicity can help to improve aerosol representation in models and the understanding of cloud formation.
- Article
(5129 KB) - Full-text XML
-
Supplement
(686 KB) - BibTeX
- EndNote


Aerosol particles affect climate and visibility through the direct and indirect extinction of solar radiation via absorption and scattering of light and through cloud formation, respectively. Aerosol hygroscopicity compounds aerosol effects on Earth's radiation budget (Zhao et al., 2018; Malm and Day, 2001), secondary aerosol formation and cloud formation (Köhler, 1936), and health (Dockery, 2001). Neglecting the effect of moisture on aerosol growth leads to incorrect estimation of the cooling at Earth's surface due to aerosol particles (Garland et al., 2007). For instance, a decrease in light extinction over the southeast US was linked to reduced aerosol water uptake, coincident with decreases in the sulfate organic ratio (Attwood et al., 2014). Particle aging and/or coating can cause underestimation of both aerosol hygroscopicity in the subsaturated regime (Wang et al., 2018a) and cloud condensation nuclei (CCN) activity in the supersaturated regime for aged particles in China by ∼22 % (Zhang et al., 2017). Remote sensing of aerosol optical properties is also affected by aerosol water content (Ferrare et al., 1998, 2023). Therefore, accurate aerosol hygroscopicity values are critical for remote sensing and satellite observation of aerosol particles (Ziemba et al., 2013; van Diedenhoven et al., 2022).
Aerosol hygroscopicity is described by physical quantities such as the diameter growth factor, g(RH), and light scattering hygroscopic growth factor, f(RH). The g(RH) parameter relates the wet particle diameter of the aerosol at a high relative humidity to the dry diameter of the aerosol at low relative humidity, while f(RH) relates total scattering due to the aerosol at high relative humidity (80 %) to that at low relative humidity (<40 %) (Waggoner et al., 1983; Hegg et al., 1993). Light scattering increases with relative humidity for most particles and is correlated to the chemical composition and size (Baynard et al., 2006; Swietlicki et al., 2008) of particulate matter (Covert et al., 1972; Brock et al., 2016).
Direct measurement of aerosol hygroscopicity, however, is difficult and is also not well represented in climate models (Chen et al., 2014). The hygroscopicity parameter kappa, κ, is a single parameter that was developed to represent water uptake in models. It determines the volume (or mass or moles, with appropriate unit conversions) of water that is associated with a unit volume of a dry aerosol particle (Petters and Kreidenweis, 2007). A simple and commonly used water uptake model for calculating kappa is based on the Zdanovskii, Stokes, and Robinson (ZSR) treatment for water-soluble organic–inorganic mixed aerosol particles (Stokes and Robinson, 1966), where it is assumed that there are no interactions between the organic and inorganic species. In the ZSR model, water uptake of the individual non-interacting components can be summed up linearly to represent the total water uptake of the mixed aerosol. The interaction of organics and inorganics, however, along with the aging-specific density of organics is thought to influence hygroscopicity and affect both the ZSR calculation (Fan et al., 2020) and the aerosol particle growth factor via changes in molecular structure, molecular weight, functionality, and/or other properties (Swietlicki et al., 2008).
Observed and simulated aerosol hygroscopicity are greater in clean marine air masses (f(RH = 85 %/RH = 40 %) = 2.10–2.30 for PM1) compared to air masses over land and near terrestrial biogenic sources (f(RH = 85 %/RH = 40 %) = 1.29–2.10 for PM1), which are secondary organics precursors, and from biomass burning (f(RH = 85 %/RH = 40 %) = 1.02–2.10 for PM1) (Swietlicki et al., 2008; Duplissy et al., 2011; Petters and Kreidenweis, 2007; Burgos et al., 2019; Titos et al., 2021; Gomez et al., 2018). Only the Arctic has aerosol hygroscopicity values (f(RH = 85 %/RH = 40 %) = 2.70 for PM1 and f(RH = 85 %/RH = 40 %) = 3.00 for whole-air samples) that are greater than in clean marine regions (Delene and Ogren, 2002; Zieger et al., 2010). In marine areas, hygroscopicity typically decreases with altitude with decreasing inorganic fractions (Pringle et al., 2010). Cloud processing over marine areas has been observed to increase the oxidation of organic aerosols (Che et al., 2022; Dadashazar et al., 2022) and hygroscopicity in general (Crumeyrolle et al., 2008). Continental aerosol particles have smaller diameters and are usually less hygroscopic due to more organic-rich aerosol particles (κ=0–0.1 from Table S1 in the Supplement) and pure elemental carbon particles (EC, κ=0–0.035 from Table S1) (Wang et al., 2014; Kreidenweis and Asa-Awuku, 2014). Organics are generally less hygroscopic than inorganics (κ=0.56–1.24 from Table S1), and their hygroscopicity is affected by oxidation level (e.g., O:C ratio), oxidation state, and solubility (Brock et al., 2016; Wu et al., 2016; Thalman et al., 2017). Aging has also been found to increase aerosol hygroscopicity through the oxidation of secondary organic aerosols and organic aerosol interactions with inorganics (Engelhart et al., 2008; Liu et al., 2014; Saxena et al., 1995).
Although aerosol studies in the rapidly developing Southeast Asia (SEA) region are increasing, few are focused on the nature of aerosol particles and their interactions with water vapor and clouds (Tsay et al., 2013; Ross et al., 2018; Reid et al., 2023). There has been no comprehensive study of aerosol hygroscopicity in and around the Philippines in Southeast Asia. Understanding the interactions between aerosols and the complex geographic, meteorological, and hydrological environment in Southeast Asia remains challenging due to a still-growing observational database, the prevalence of clouds interfering with remote sensing, and limited modeling studies (Tsay et al., 2013; Lee et al., 2018; Chen et al., 2020; Hong and Di Girolamo, 2020; Amnuaylojaroen, 2023). This, along with increased local and transported emissions and prevalent moisture-rich conditions in the region, altogether motivate the need to understand aerosol hygroscopicity and associated impacts on radiative transfer and on climate (Brock et al., 2016; Ziemba et al., 2013). How freshly emitted nearly hydrophobic particles transform into hygroscopic aerosol particles (Swietlicki et al., 2008), for example, is an understudied topic in Southeast Asia, where there are significant sources of particles with low hygroscopicity (Reid et al., 2023). Understanding aerosol hygroscopicity will also help in the need to improve remote sensing measurements in the region, which is affected by overlapping high- and low-level clouds (Burgos et al., 2019; Hong and Di Girolamo, 2020).
Predicting aerosol hygroscopicity, especially at higher relative humidity (RH), is especially difficult due to optical instruments underestimating particle light scattering at high RH and mechanisms other than hygroscopicity impacting particle growth (Gasparini et al., 2006; Mochida et al., 2006). This is important because atmospheric water content is high in Southeast Asia. For example, the hygroscopicity of secondarily formed organics (via gas-to-particle conversion) is found to be dependent on oxidation state for high RH (Shi et al., 2022). Southeast Asia has elevated levels of organics, inorganics, and elemental carbon (Cruz et al., 2019; AzadiAghdam et al., 2019; Oanh et al., 2006), allowing for an opportunity to see how hygroscopicity responds to a range of relative values of each of these elevated components. Therefore, relating aerosol particle composition to hygroscopicity, for closure (Xu et al., 2020), is particularly significant there.
Aerosol hygroscopicity is a crucial factor in the understanding and modeling of aerosol–cloud interactions, because of the role hygroscopicity plays in cloud drop activation. The NASA Cloud, Aerosol, and Monsoon Processes Philippines Experiment (CAMP2Ex) was designed to understand the role of aerosol particles in cloud formation and in regulating solar radiation during the southwest monsoon (Reid et al., 2023). CAMP2Ex occurred between August and October 2019 over the Philippines and neighboring areas. The campaign provides an aircraft dataset with measurements focused on aerosol and cloud properties, which affords a valuable opportunity to evaluate models with these measurements for shallow to moderate convection, which is one of the biggest challenges for regional and global-scale atmosphere models to represent because these clouds are much smaller than the model grid spacing.
Global atmospheric model evaluation of aerosol extinction for the CAMP2Ex region suggests that biomass burning aerosol hygroscopicity is overestimated by global atmosphere models, with both the model size representation of the aerosol particles and the size discrepancy between model and observations contributing to this (Collow et al., 2022; Edwards et al., 2022). The findings from Collow et al. (2022) and Edwards et al. (2022) bring up the need for a more thorough understanding of the components of biomass burning aerosols in the region that affect observed and modeled hygroscopicity. The overestimation of hygroscopicity due to biomass burning can affect the representation of clouds in the region. Clouds, especially shallow cumulus clouds, like those in the tropical West Pacific (which the CAMP2Ex region is part of) have been underestimated by models due to the lack of observational data to improve convective parameterizations (Chandra et al., 2015). Part of the challenge in modeling aerosol–cloud interactions is the ability to have a high-resolution representation, at the scale of the shallow convection, in a large enough domain, which is important for understanding climatic effects to properly account for the bulk behavior of cloud fields (Spill et al., 2019). This could be addressed by evolving modeling infrastructures, with higher-resolution schemes ranging from regional to convective scale within a larger domain (Pfister et al., 2020; Radtke et al., 2021).
Knowledge gaps identified above are addressed in this study using the CAMP2Ex dataset. To our knowledge, this is the first time this dataset has been explored extensively to characterize aerosol hygroscopicity properties in the region. The goals of this proposed study are to (i) characterize the spatial distribution of aerosol hygroscopicity in Southeast Asia during the CAMP2Ex airborne mission, (ii) relate aerosol hygroscopicity and composition, (iii) identify emission events that impact aerosol hygroscopic growth, and (iv) evaluate a global chemical transport model with regional refinement for aerosol vertical transport.
2.1 CAMP2Ex field campaign
CAMP2Ex included 19 research flights with a NASA P3 from 24 August to 5 October 2019. Twelve of these flights were associated with the southwest monsoon (SWM), followed by a flow reversal with seven flights conducted during the northeast monsoon (NEM) (Reid et al., 2023). As summarized by Reid et al. (2023), the combination of airborne and ship-based measurements helps to characterize interactions between various aerosol particle sources (e.g., biomass burning, industrial, natural) and small to congestus convection. Below we note the P3 instruments most relevant to this study.
2.2 Observations and derived quantities
2.2.1 P3 instrumentation
As summarized in Table 1, data are used from a variety of aerosol particle (NASA/LARC/SD/ASDC, 2020b) and trace gas (NASA/LARC/SD/ASDC, 2020a) instrumentation. The aerosol particle scattering and absorption instruments measure the optical properties of bulk particulate matter (PM5): <5 µm dry diameter (McNaughton et al., 2007). Aerosol composition and size data for submicrometer particles were considered when they were collected using a forward-facing shrouded isokinetic inlet. Non-refractory species in the submicrometer range studied using an aerosol mass spectrometer (AMS) included sulfate, nitrate, ammonium, organics, and chloride. We also use the ratio of the mass spectral marker 44 marker relative to total organic mass, f44, as a possible indicator of air mass age. Submicrometer refractory species of black carbon (also referred to as elemental carbon) from a single particle soot photometer (SP2) were also included in the study. Bulk water-soluble aerosol particles were collected using a particle-into-liquid sampler (PILS) and were analyzed using ion chromatography; species quantified included oxalate, NH, dimethylamine (DMA), K+, SO, Ca2+, Na+, Mg2+, Cl−, NO, Br−, and NO−. Cloud-free conditions are identified to ensure the highest quality aerosol data using a cloud flag product based on measurements from the fast cloud droplet probe (FCDP) and two-dimensional stereo probe (2D-S) (NASA/LARC/SD/ASDC, 2020c). Aerosol particle composition data are considered for those cases when the total aerosol non-refractory particle mass was greater than 0.4 µg sm−3 (with sm3 representing standard cubic meters).
Table 1Summary of instrument data used in this work.
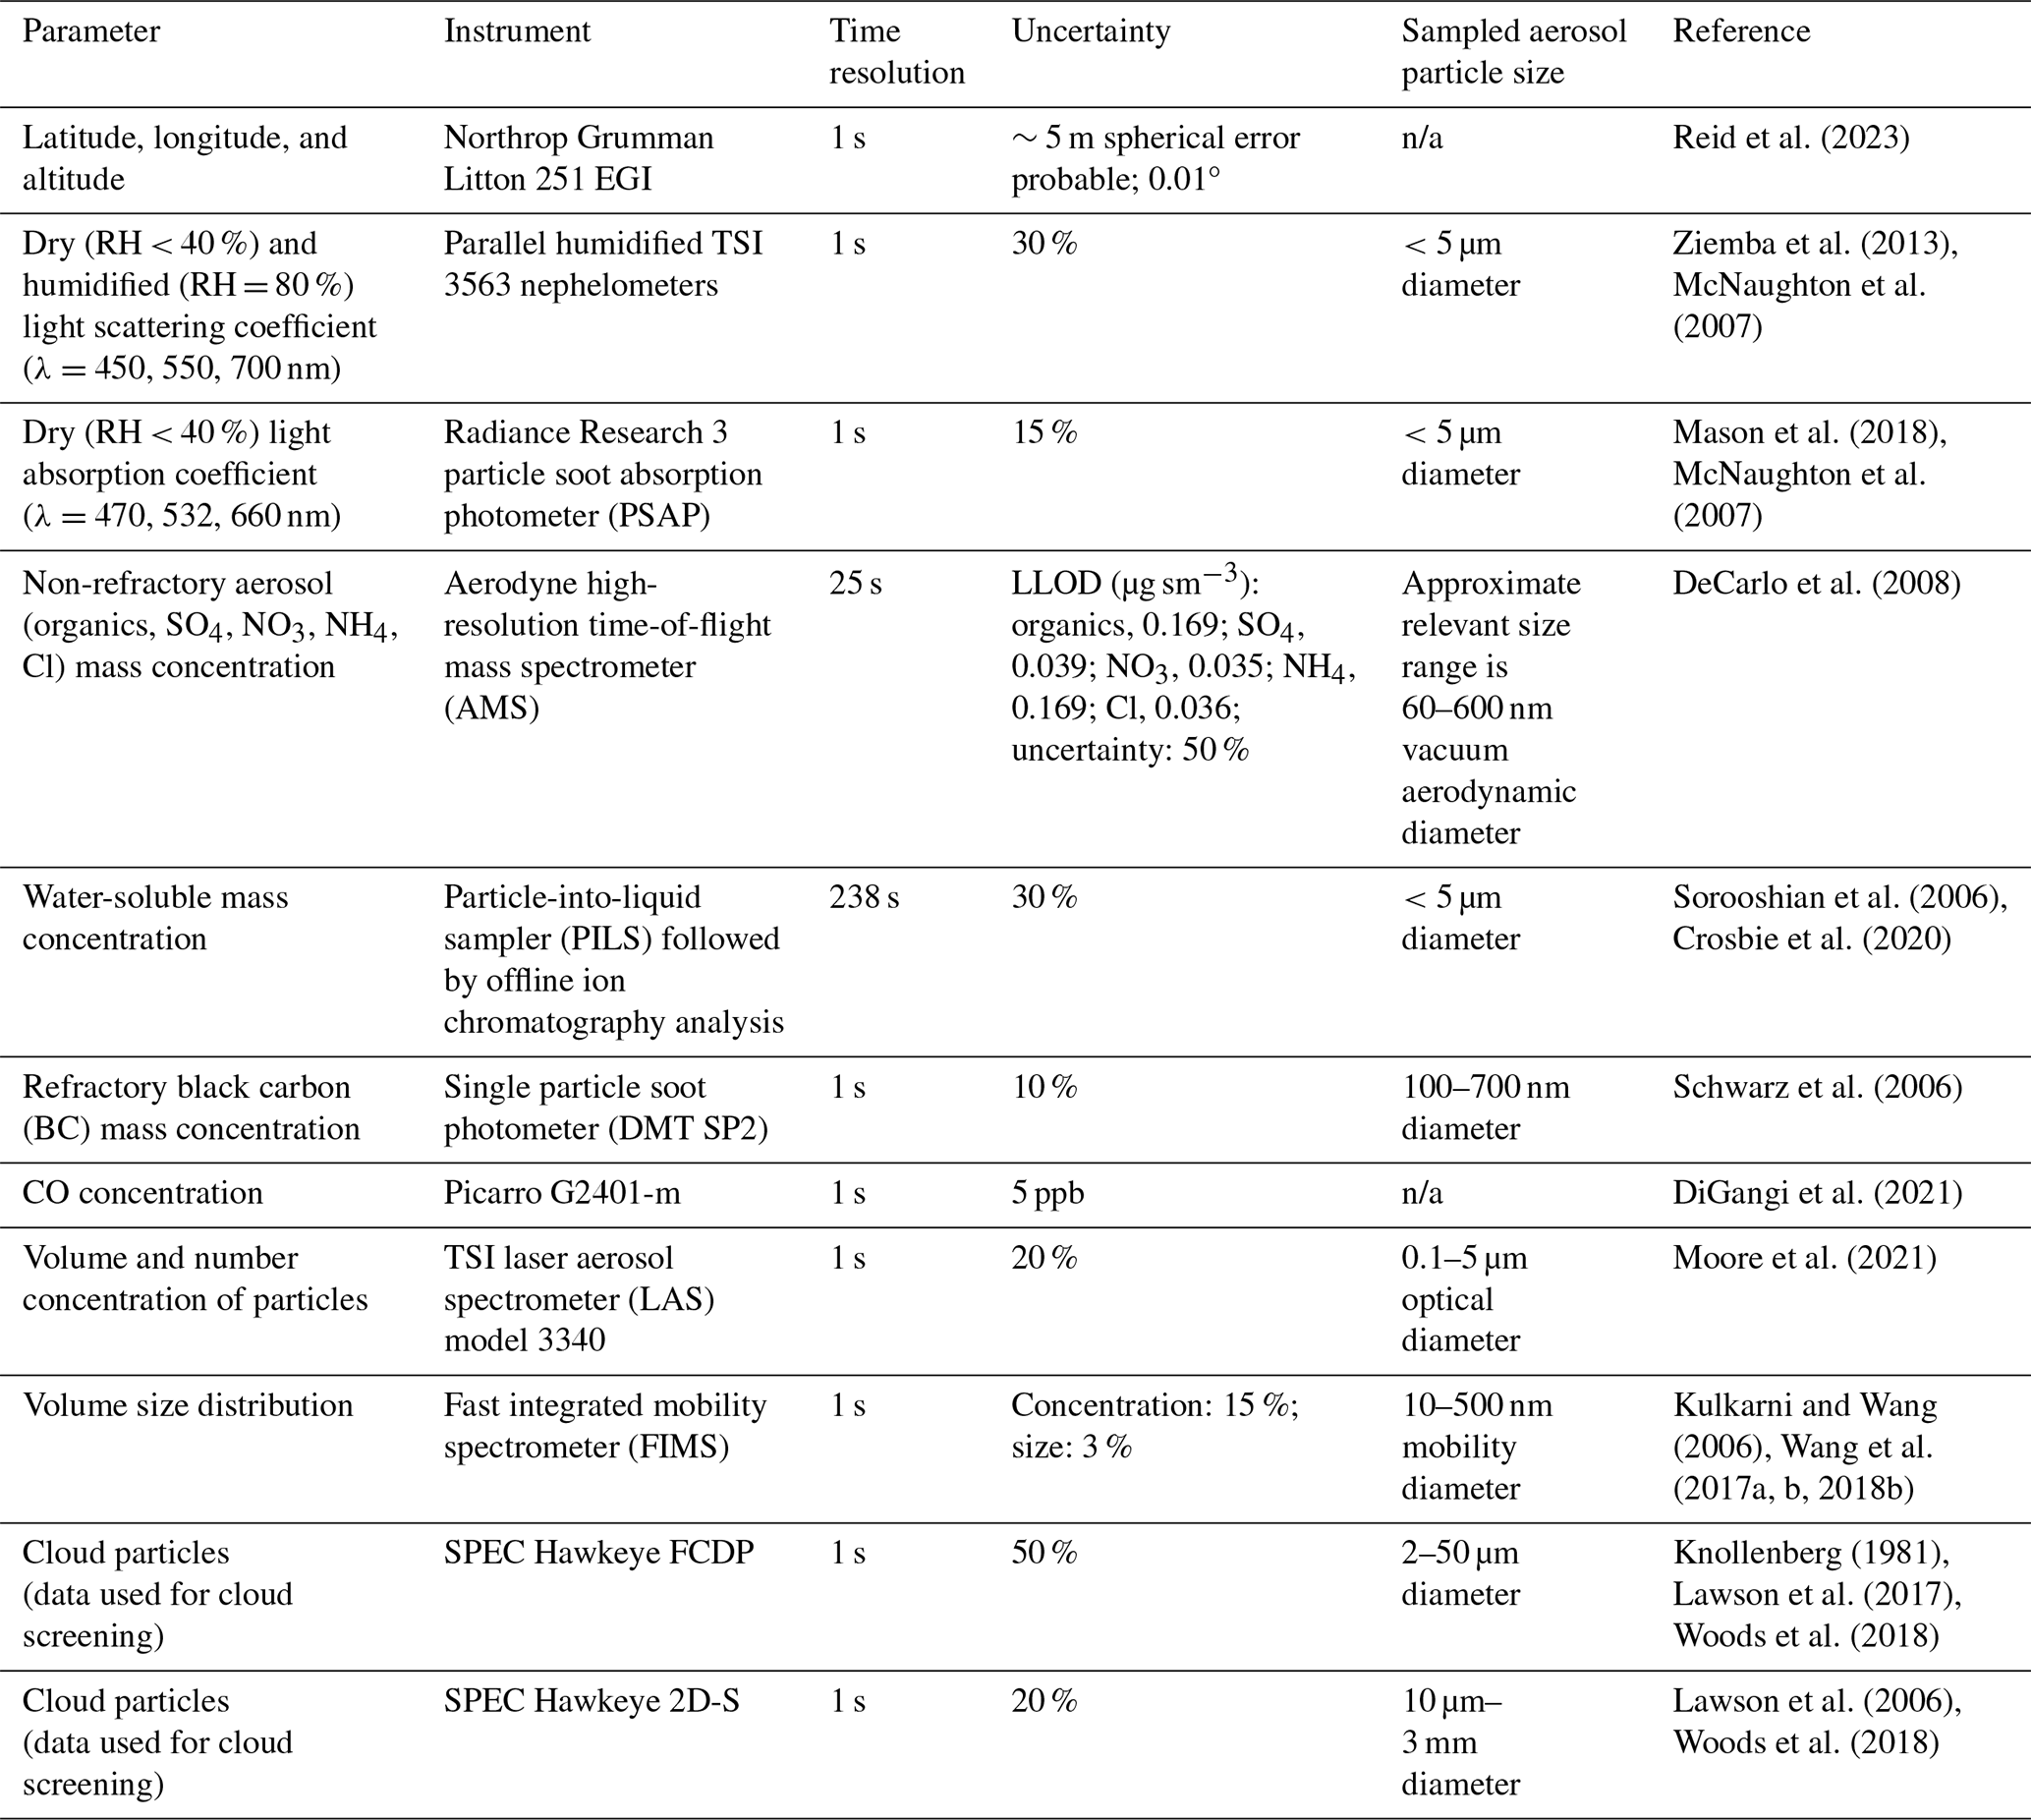
n/a stands for not applicable.
2.2.2 Aerosol hygroscopicity, f(RH), and other aerosol optical properties
Aerosol hygroscopicity is reported using the light scattering hygroscopic growth factor, f(RH), which is unitless and is the amplification factor in scattering due to a change in RH. The f(RH) parameter is calculated from the empirically derived exponential fit coefficient gamma (γ) (Ziemba et al., 2013). The gamma parameter is based on parallel nephelometer measurements of scattering at 550 nm at two different relative humidity levels: dry (<40 %: RHdry) and humidified (controlled to 82±10 %: RHwet). Gamma (Eq. 1) was calculated for times when the dry (SCdry) and humidified (SCwet) scattering coefficients (Table 1) are greater than or equal to 5 Mm−1. The f(RH) (Eq. 2) was then derived from γ (Hänel, 1976).
Each nephelometer was calibrated with pure CO2 prior to the campaign, and zero checks were performed periodically during the flights to prevent baseline drift. All nephelometer scattering coefficient measurements were corrected for truncation errors using a documented method (Anderson and Ogren, 1998). System response was verified in flight by introducing hydrophobic PSL spheres into the sample stream to ensure that the nephelometers were consistent and an f(RH) value of 1.0 is observed. Relative humidity measurements for the calculation of f(RH) were calibrated in the laboratory using nebulized monodisperse 200 nm ammonium sulfate to ensure deliquescence at ∼80 % RH and at the typical measurement flow rates (i.e., 10 L min−1) (Brooks et al., 2002). The RH was slowly ramped up from ∼60 %–90 %, and the apparent deliquescence RH was calculated based on the sharp increase in scattering in the humidogram. The offset between the calculated RH and the deliquescence RH for ammonium sulfate (i.e., ∼79.5 %) was applied to the data post-processing. Calibration at ∼80 % RH increases the confidence in the humidified nephelometer data accuracy. Non-linearities can occur at low RH measurements and add to uncertainties, but the f(RH) calculation is much less sensitive at the dry end of the spectrum. Internal RH sensors were used because their placement is most relevant to the sampling condition inside the nephelometer. Note that sampling efficiency decreases for supermicrometer diameter particles with increasing size up to the 5 µm inlet cutoff, due to losses in transport tubing and in the drying and humidification control system. Thus, derived f(RH) is applicable to accumulation-mode particles and is partially sensitive to coarse-mode particles from 1–5 µm diameter.
Single scattering albedo (SSA) was calculated when both the scattering and the absorption coefficients (smoothed with 30 s running average) were greater than 2 Mm−1. The Ångström exponent (AE) was calculated using the smoothed 30 s running average of the scattering and absorption coefficients. The scattering Ångström exponent (SAE, 450–700 nm) was computed when the scattering coefficient was greater than 2 Mm−1 based on Ziemba et al. (2013), and the absorption Ångström exponent (AAE, 470–660 nm) was computed when the absorption coefficient was greater than 2 Mm−1 to try to minimize noise issues (Mason et al., 2018). Absorption measurements were corrected for a variety of errors using the method from Virkkula (Virkkula, 2010). The PSAP filters were changed before transmission dropped below 70 %. This standard practice minimizes non-linearity effects due to filter loading.
2.2.3 Sea salt
Bulk sea salt mass concentration was calculated using summed PILS concentrations of Na+, Cl−, and Mg2+ along with the respective concentrations of the mass concentrations of K+, Ca2+, and SO in sea salt (0.037, 0.04, and 0.25, respectively, by mass) (Crosbie et al., 2022).
2.2.4 Aerosol particle classification
Aerosol particle optical data were grouped depending on their AAE and SAE (Sect. 2.2.2) values and based on the method of Cazorla et al. (2013), which used sun photometer measurements to arrive at the following classifications as part of evaluating aircraft data over California, USA: coated large particles, dust and elemental carbon mix, dust dominated, organic carbon and dust mix, organic carbon dominated, elemental carbon and organic carbon mix, mixed, and elemental carbon dominated. This method has been used for cases when chemical composition is not available (Höpner et al., 2019) and can be useful because the composition data from the AMS are limited to submicrometer particles (0.06 to 0.6 µm vacuum aerodynamic diameter), while the f(RH) includes relatively larger particles (<5 µm dry diameter).
2.2.5 Effective particle density
Following Shingler et al. (2016b), effective particle density was calculated by dividing the sum of the 30 s total mass concentration from the AMS species (organics, SO, NO, NH, and Cl−) and 30 s averaged black carbon from SP2 by the 30 s averaged integrated (for particles with diameter from 0.1 to 1 µm) volume concentration from the LAS (Table 1).
2.3 Modeling
2.3.1 Trajectory analysis
This work leverages trajectory results explained in detail by Hilario et al. (2021) using the National Oceanic and Atmospheric Administration (NOAA) Hybrid Single Particle Lagrangian Integrated Trajectory Model (HYSPLIT) (Stein et al., 2015; Rolph et al., 2017). Five-day HYSPLIT back trajectories from specific CAMP2Ex flight locations were associated with air masses undergoing long-range transport from either the Maritime Continent (MC), East Asia (EA), peninsular Southeast Asia (PSEA), or the West Pacific (WP) when they were within the regions at altitudes below 2 km for more than 6 h. The back trajectories were generated based on 1 min resolution aircraft locations and 0.25°×0.25° resolution NOAA Global Forecasting System (GFS) archived meteorological data. The source regions are approximately within the following lowest and highest latitude and longitude values, respectively: MC (−9.5 to 6.5° and 95 to 119°), EA (22 to 47° and 105 to 121.5°), PSEA (10 to 20° and 98 to 106°), and WP (3 to 25° and 120.5 to −122.5°). The classification “Other” was used for back trajectories that either passed by the regions but at elevations above the boundary layer (defined as 2 km), came from sources farther away than the four listed above, were more localized to the Philippines, had too few sample counts, or were from stagnant air (Hilario et al., 2021).
2.3.2 CAM-chem model configuration
The Community Atmosphere Model with comprehensive tropospheric and stratospheric chemistry (CAM-chem) is used here as the atmospheric component of the Community Earth System Model (CESM2). CAM-chem includes the modal aerosol model (MAM4) (Liu et al., 2016), and results were evaluated with the CAMP2Ex AMS composition and f(RH) observations for two case studies. Two CAM-chem simulations with different horizontal resolutions were performed using the spectral element grid mesh and dynamical core. The grid mesh resolution for one simulation was uniform with ∼111 km (labeled ne30) (Tilmes and Zhang, 2024). The other simulation employed regional refinement over East Asia with grid spacing ∼27 km (labeled MUSICA) in the regionally refined region and ∼111 km elsewhere across the globe – a configuration as part of the Multi-Scale Infrastructure for Chemistry and Aerosols version 0 (MUSICAv0) (Schwantes et al., 2022). More information about CAM-chem is in the Supplement (Sect. S1).
In CAM-chem, aerosol hygroscopicity is represented with the kappa value (Petters and Kreidenweis, 2007) using the mixing rule (Stokes and Robinson, 1966). Kappa was calculated from the CAM-chem Aitken-mode (0.015–0.053 µm diameter) and accumulation-mode (0.058–0.48 µm diameter) outputs based on the volume fractions of the aerosol constituents (ε, Eq. 3) that were derived from their densities (Table S1). The following internally mixed aerosol species from CAM-chem were included in the analysis: organics (primary and hydrophobic, aged and hygroscopic, and secondary (C15H38O2)), sulfate (NH4HSO4), sea salt, dust (AlSiO5), and black carbon (primary and hydrophobic, aged and hygroscopic) (Tilmes et al., 2023). Some limitations in the calculation of kappa are that CAM-chem does not include nitrate aerosol and that constant kappa values for primary and aged organics based on past work (Table S1) were used, even if it is known that kappa of organics varies with aging (Kuang et al., 2020). Kappa was also calculated from the submicrometer AMS and SP2 observations using the assigned species properties for available aerosol species in CAM-chem: aged organics, aged black carbon, and ammonium sulfate. Submicrometer sea salt and dust data are not available and were not included in the calculation for submicrometer kappa from observations.
To enable a corresponding evaluation based on actual aerosol hygroscopicity observations, the f(RH) values from CAMP2Ex were converted to kappa based on past studies (Brock et al., 2016; Kuang et al., 2017; van Diedenhoven et al., 2022). The approximate wet (80 %) and dry (20 %) relative humidity values of the scattering measurements were used to convert f(RH) to an optical kappa (κopt) based on Eq. (4) (Brock et al., 2016; Kuang et al., 2017). This was approximated from the proportional relationship between the aerosol scattering cross section (which is the basis of f(RH)) and aerosol volume (the change of which is usually described as the growth factor), which Brock et al. (2016) in their study had associated with kappa. The optical kappa was converted to the chemical kappa (κchem) based on the slope of the relationship between κopt and κchem from Brock et al. (2016). This method (Eq. 5) of converting κopt to κchem was also used by van Diedenhoven et al. (2022) for the f(RH) data for CAMP2Ex and is associated with 40 % uncertainty (van Diedenhoven et al., 2022). The derived chemical kappa values for bulk aerosol particles are compared to the kappa calculated using the ZSR mixing rule from the submicrometer observations (AMS and SP2) and model outputs.
3.1 General characterization of f(RH) for CAMP2Ex
3.1.1 Spatial distribution of f(RH)
The f(RH) values in the CAMP2Ex campaign (Fig. 1a) had an interquartile range of values between 1.05 and 1.42 and were low (median of 1.24 for 143 107 points of 1 s data) compared to other (Table 2) polluted marine environments (Titos et al., 2021). We note that the comparisons to other studies may be affected by the slight difference in relative humidity (f(RH = 85 %/RH = 40 % for Titos et al., 2021) and f(RH = 82 ± 10 %/RH < 40 % for this study)) used to calculate f(RH). The distribution of f(RH) and ambient RH values is narrowest in the lowest altitudes (<3 km), where most of the samples were taken (Fig. 1b) (NASA/LARC/SD/ASDC, 2020d). Both f(RH) and ambient RH distributions become broader at higher altitudes, where there is a higher prevalence also for higher f(RH) values and lower ambient RH values. Broadening of the f(RH) distribution at higher altitudes is at least partially attributed to lower dry scattering coefficients that result in increased uncertainty in the calculation of f(RH). The different aerosol sources (Fig. 1a) in the region also contribute to the range of measured f(RH), with transported emissions from more distant sources presumably more influential at the highest altitude ranges.
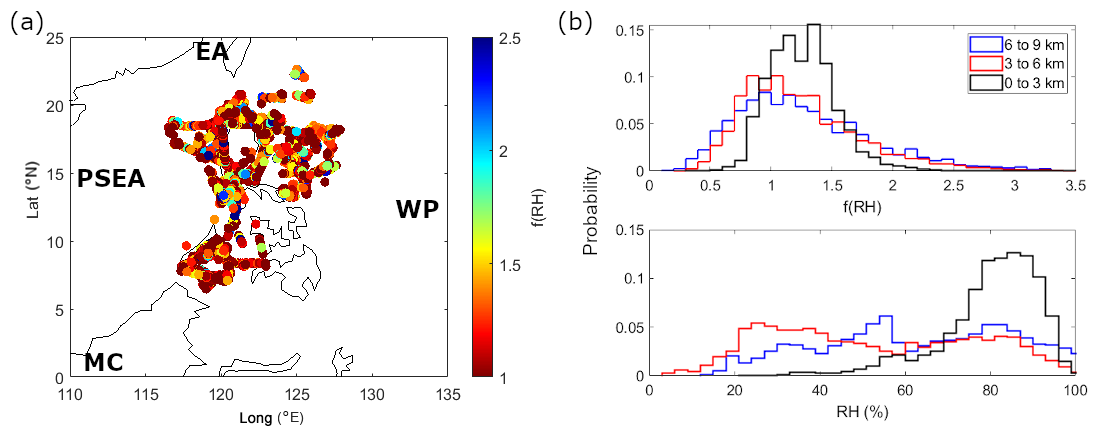
Figure 1(a) Map showing flight locations during CAMP2Ex color coded by f(RH = 82 % ± 10 %/RH < 40 %) 1 s values at 550 nm and approximate locations of the air mass sources (black text) identified by Hilario et al. (2021) that affected CAMP2Ex: Maritime Continent (MC), East Asia (EA), peninsular Southeast Asia (PSEA), and the West Pacific (WP) (PSEA is farther west at ∼105° E and EA extends farther north). (b) Histograms of f(RH = 82 % ± 10 %/RH < 40 %) at 550 nm and ambient relative humidity (RH) for three altitude bins with the following counts: n(0 to 3 km) equals 139 026, n(3 to 6 km) equals 10 321, and n(6 to 9 km) equals 7260.
Table 2Hygroscopicity values of various aerosol types based on selected summary studies for measured g(RH) (Swietlicki et al., 2008) and f(RH) (Eldering et al., 2002; Doherty et al., 2005; Liu and Li, 2018; Dumka et al., 2017; Gogoi et al., 2015; Burgos et al., 2019; Titos et al., 2021), modeled κ (Pringle et al., 2010), and measured f(RH) for identified air masses affecting CAMP2Ex (Hilario et al., 2021): Maritime Continent (MC), East Asia (EA), peninsular Southeast Asia (PSEA), West Pacific (WP), and Other, categorized by associated aerosol source.
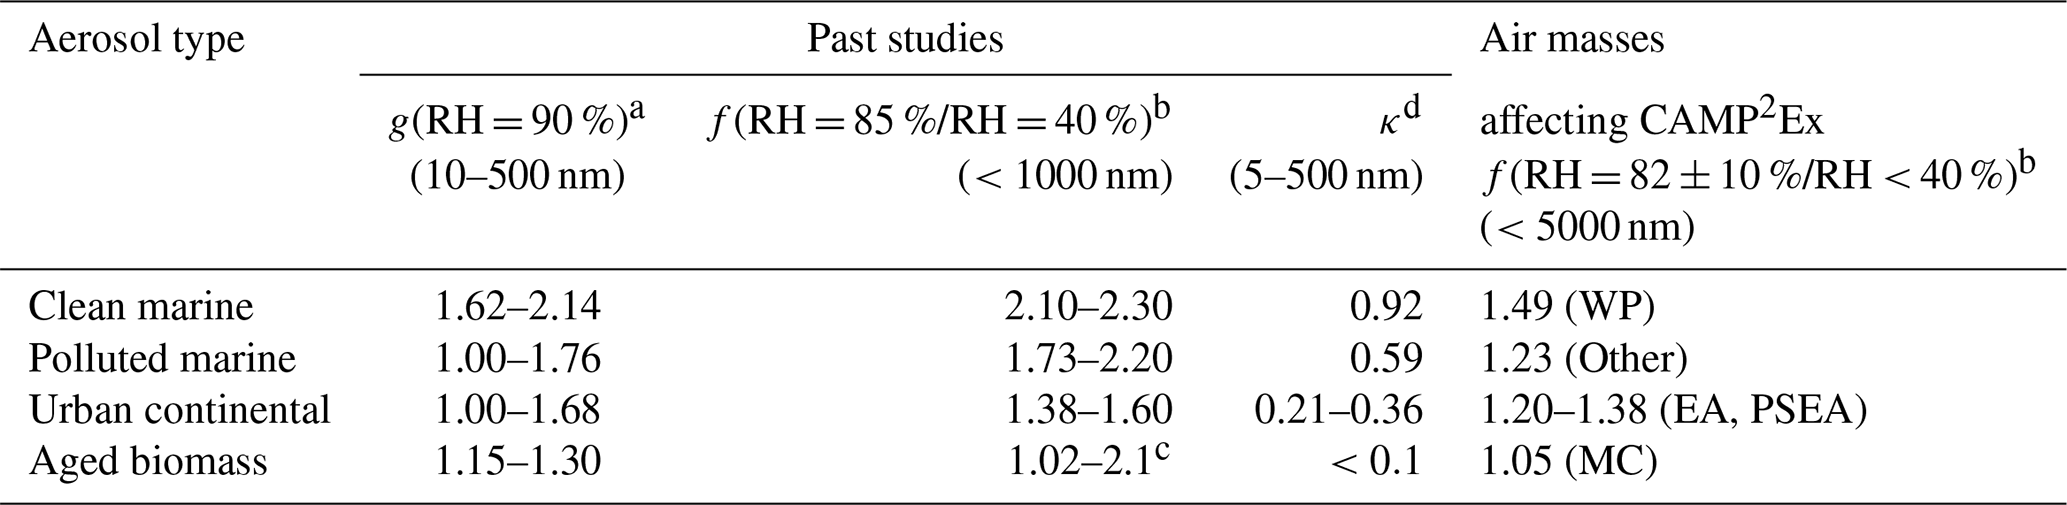
a Mean values from various ground-based sites. b Median values. c Gomez et al. (2018) mean (f(RH = 85 %/RH = 5 %)). d Mean surface values.
The lowest median f(RH) (1.05 with Q1 and Q3 of 0.94 and 1.2) is from air masses traced to the MC (Fig. 2a), which coincide with influence from smoke particles, similar to values recorded in past studies from aged biomass (Table 2). The air mass from EA (Fig. 2a) has the narrowest range of values (Q1: 1.28; median (Q2): 1.38; Q3: 1.47) compared to other air masses, likely representative of urban aerosol particles (Table 2). The highest median f(RH) values (1.49 with Q1 and Q3 of 1.26 of 1.73) are from air masses with back trajectories from the WP (Fig. 2a), likely due to marine aerosol particles interacting with particles from the MC and other regional sources. This mixing of the otherwise clean marine air with regional pollution sources effectively decreases aerosol hygroscopicity, and this type of environment is often called a polluted marine environment (Titos et al., 2021).
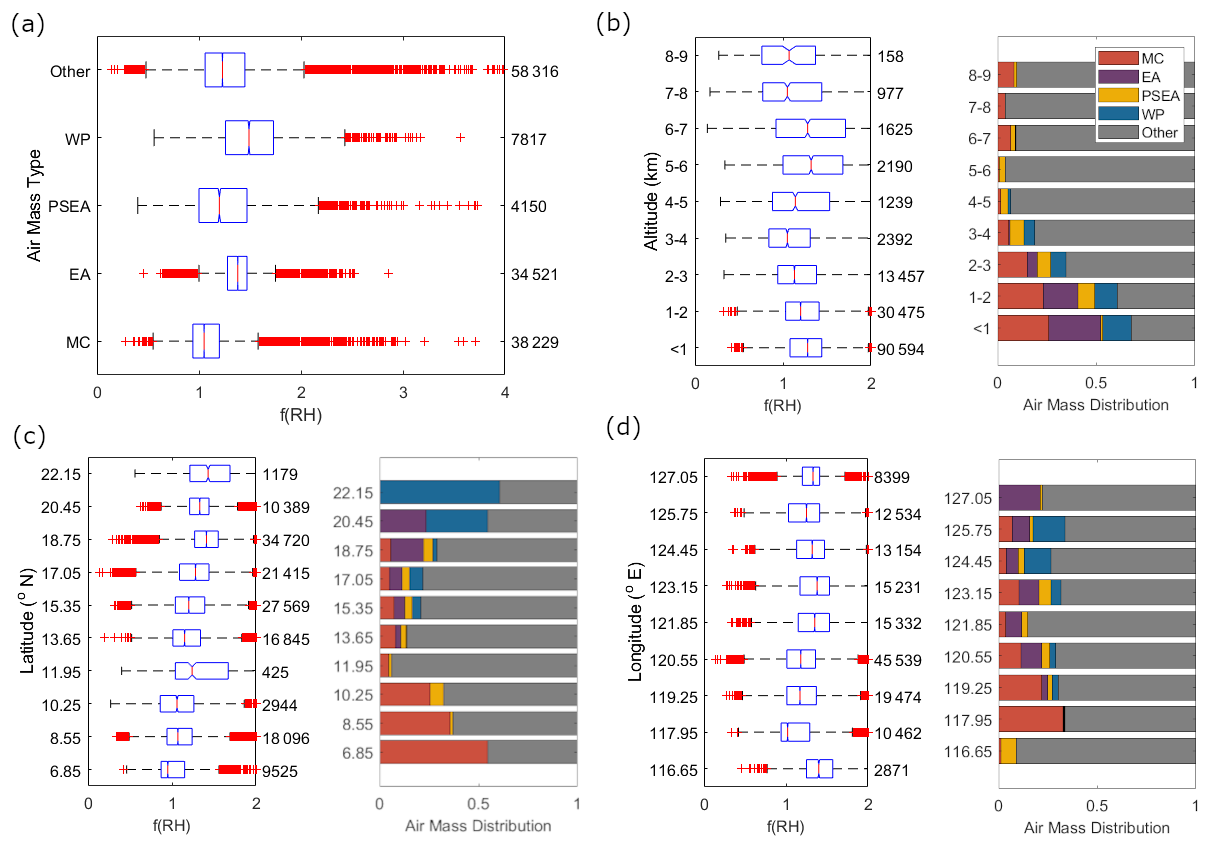
Figure 2Distribution of f(RH = 82 % ± 10 %/RH < 40 %) 1 s data at 550 nm during the CAMP2Ex field campaign for relevant (a) air masses, (b) altitude, (c) latitude, and (d) longitude levels and corresponding stacked bars of air mass contributions for panels (b)–(d). The (a) air mass types are from Hilario et al. (2021). The numbers to the right of the notched boxplots (boxes correspond to the 25th to 75th percentile of the data, the red line is the 50th percentile, the whiskers represent 1.5× the interquartile range, the red crosses are the outliers, and when the notches in the boxplots do not overlap there is 95 % confidence that the medians of the boxplots are different) are the counts, and the (b–d) bars to the right of the boxplots show the fractional contribution of each air mass type to the total number of air masses in the specific location. The y values for (c, d) latitude and longitude are the midpoints of the specific coordinate bins.
Most (98 %) of the f(RH) data were calculated for observations below 3 km (Fig. 2b), due to the relatively clean free troposphere in the region. Median f(RH) values generally decrease with altitude in the lower 3 km. An increase in median f(RH) is observed between 4–6 km (median from 1.14 to 1.32), where the contribution of the mixed air mass (Other) is most dominant. The f(RH) values decrease above 6 km to the lowest median f(RH) (1.07) between 8–9 km, where air masses are generally from Other and the MC.
Latitudinally (Fig. 2c), f(RH) is lowest nearest Borneo in the MC (median of 0.95 to 1.07 in the regions from 6.85–10.25° N), coincident with the dominant influence of biomass burning. There were active fires in the area during the time samples that were taken from this latitude. f(RH) is highest in the northern Philippines (median of 1.33 to 1.44 in the regions from 18.75–22.15° N), where the influence of WP and EA air was most prevalent. This is consistent with the longitude data (Fig. 2d), which exhibit the lowest f(RH) values for longitudes (median of 1.02 to 1.18 in the regions from 117.95–120.55° E) that had the highest MC contribution. The highest f(RH) is observed in longitudes (median of 1.38 to 1.40 in the regions west of 116.65° E and east of 123.15° E) that were more associated with the northern Philippines (Fig. 1a). To delve deeper into our analysis, we discuss next the size and composition data.
3.1.2 f(RH) relationships with size and composition
The relative size of particles per air mass can be inferred from the extinction Ångström exponent (AE), which relates the extinction of light at specific wavelengths to particle size (Ångström, 1929). Since scattering is the dominant component of extinction, the scattering Ångström exponent (SAE) is often used to relate to particle size, where larger SAE suggests smaller particles. The median SAE values (Fig. 3a) are similar and between 2.09 (MC with Q1 and Q3 of 1.92 and 2.26) and 2.16 (Other with Q1 and Q3 of 1.75 and 2.32) for four of five air masses, indicative of smaller particles. The WP has a median value of 1.37 (with Q1 and Q3 of 1.05 and 1.88), suggestive of the presence of a mixture of accumulation-mode and coarse-mode particles (SAE < 1 occurs for large particles like sea salt and dust) (Schuster et al., 2006; Bergstrom et al., 2007). Past studies have suggested that biomass burning particles exhibit SAE values greater than 1.4, which does not discount the fact that most of the f(RH) data collected during CAMP2Ex are possibly impacted by biomass burning.
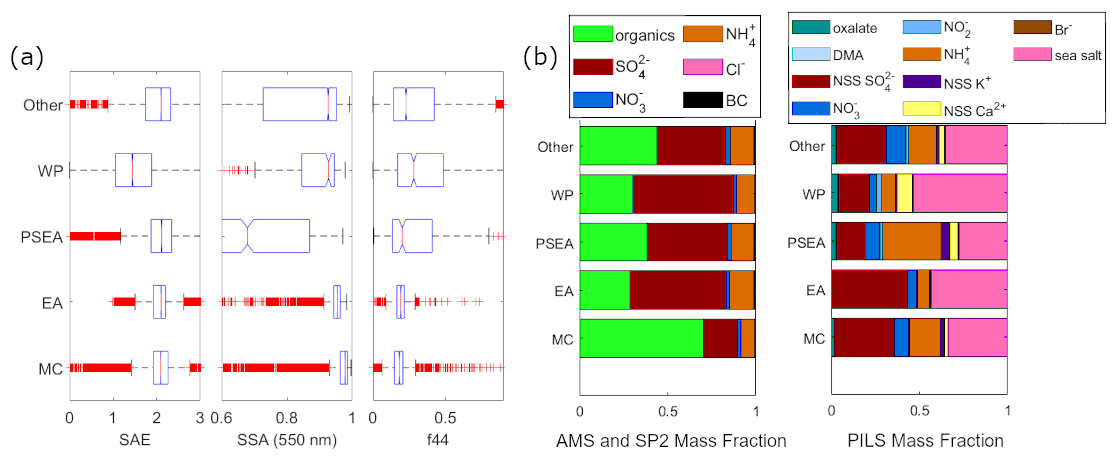
Figure 3Physicochemical properties of air masses. (a) Boxplots (boxes correspond to the 25th to 75th percentile of the data, the red line is the 50th percentile, the whiskers represent 1.5× the interquartile range, the red crosses are the outliers, and when the notches in the boxplots do not overlap there is 95 % confidence that the medians of the boxplots are different) of scattering Ångström exponent (SAE), single scattering albedo (SSA, 550 nm), and ratio of the mass spectral marker 44 relative to total organic mass (f44) and (b) (left) submicrometer mean aerosol mass spectrometer (AMS) derived organic, SO, NO, NH, and Cl− and soot photometer (SP2) derived black carbon (BC) mass fractions and (right) bulk (<5 µm) mean particle-into-liquid sampler (PILS) and ion chromatograph derived oxalate, dimethylamine (DMA), non-sea-salt SO, NO, NO, NH, non-sea-salt K+, non-sea-salt Ca2+, Br−, and sea salt mass fractions. The y-axis labels correspond to air mass sources from Hilario et al. (2021): Maritime Continent (MC), East Asia (EA), peninsular Southeast Asia (PSEA), West Pacific (WP), and Other.
One of the indicators of biomass burning in Southeast Asia is organic matter (Adam et al., 2021). The MC air mass (Fig. 3b) has the greatest (0.71) mass fraction of organics among the air masses and the highest median SSA (0.98 with Q1 and Q3 of 0.96 and 0.99) (Fig. 3a), which suggests more scattering, rather than absorbing, particles (Moosmüller and Sorensen, 2018). This is consistent with observations from fieldwork in tropical peatland fire in Southeast Asia, where particles were mostly from smoldering combustion and were moderately absorbing, with brown carbon dominating absorbance (Stockwell et al., 2016). Smoldering combustion, which is more common in the Maritime Continent (Reid et al., 2013), is known to produce less elemental carbon (Reid et al., 2005) and potassium (Robinson et al., 2004) compared to flaming combustion. Biomass burning activities were active in the MC during the field campaign (Reid et al., 2023). The MC air mass also has the lowest f44 median values (0.18 with Q1 and Q3 of 0.15 and 0.21) (Fig. 3a), suggesting it is the least-oxidized and least photochemically aged air mass and thus closest to the source compared to other air masses. Chen et al. (2022), who studied tropical peat smoldering (similar to that in MC), showed that primary organics were not oxidized (f44<0.02), while secondary organics were highly oxidized; that oxidation increases f44 (oxidized organics: ); and that high RH speeds up the oxidation process especially for smaller particles (∼100 nm) (Chen et al., 2022). In the US, as another example, f44 from wildfire plumes up to 8 h old did not exceed 0.12 (Garofalo et al., 2019). The high RH during CAMP2Ex (Fig. 1b) likely led to the increased oxidation of secondary organics, resulting in median f44 values that are relatively high (for all air masses even in MC), suggesting that most of the particles sampled during CAMP2Ex are aged. The high organic mass fraction is consistent with the MC having the lowest median f(RH) as organics are known to reduce aerosol hygroscopicity (Kalberer, 2014; Sorooshian et al., 2017; Shingler et al., 2016a).
There is an inverse relationship between hygroscopicity and organic mass fraction data that is most evident in f(RH) values collected within the boundary layer (<3 km) during CAMP2Ex (Fig. 4a). Those data points that have the highest organic mass fraction values (>0.6) are also associated with CO concentrations (>250 ppb) that are typically associated with biomass burning (Shingler et al., 2016a) and are mostly from the MC area (Fig. 4b). The relationship between f(RH) and organic mass fraction during CAMP2Ex is similar to that in the Indian Ocean during INDOEX (based on the slope of calculated f(RH) from estimated γ and organic mass fraction) (Quinn et al., 2005), which is similarly affected by the outflow of biomass burning. The slope of the inverse relationship between f(RH) and organic mass fraction is most steeply negative (−0.81) for the air masses coming from EA (Fig. 4c). This slope for the air masses coming from EA is less steep than the f (RH = 85 %/RH = 40 %) at 550 nm to organic mass fraction relationship () from a ground station in the populated and growing region of the Yangtze River Delta in China (Zhang et al., 2015), where organic contributions are lower and mean f(RH) values are higher (1.58±0.12) than the median f(RH) (1.38) during CAMP2Ex for air masses coming from EA.
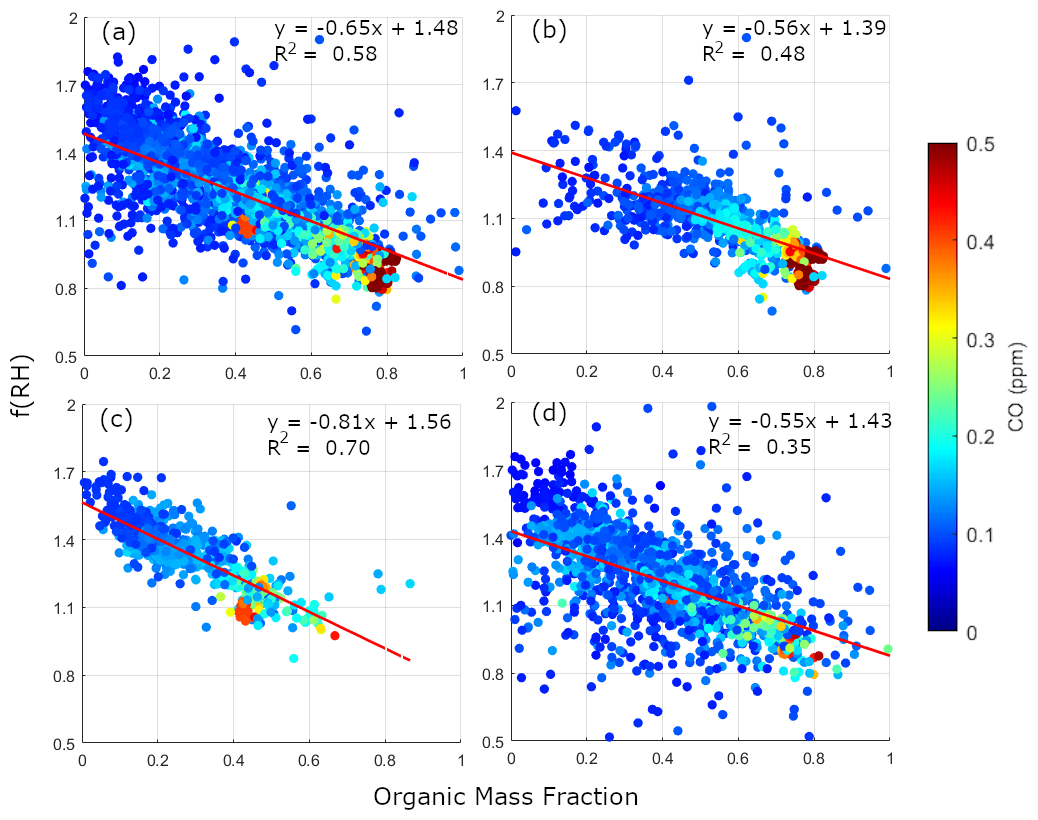
Figure 4Effect of organic mass fraction on f(RH). (a–d) Scatter plots of 30 s averaged f(RH = 82 % ± 10 %/RH < 40 %) at 550 nm and corresponding organic mass fraction contribution to total submicrometer aerosol mass (sum of organic, SO, NO, NH, Cl−, and black carbon (BC) mass concentration) and (red) linear regression line and (upper right) corresponding equation and goodness of fit (a) for all data collected at altitudes below 3 km and (b–d) for air masses coming from (b) the Maritime Continent (MC), (c) East Asia (EA), and (d) Other. The dots are colored according to their CO concentration.
The highest median f(RH) values are from the WP and EA air masses (Fig. 2a). Both have lower organic mass fractions (0.29 and 0.30, respectively) compared to other air masses and are therefore expected to have higher f(RH) based on Fig. 4. The WP air masses have coarser particles, based on their SAE values (Fig. 3a), and have a marine origin (with a higher DMA mass fraction, Fig. 3b) with a high sea salt fraction (54 %, Fig. 3b), contributing to it having the highest median f(RH) amongst the air masses. The WP air masses appear to have interacted with aged organic particles from biomass burning and industry, including fine absorbing particles potentially from industry and dust owing to its relatively high median f44 (0.26 with Q1 and Q3 of 0.17 and 0.48) and low median SSA (0.93 with Q1 and Q3 of 0.85 and 0.95). Particles with predominantly clean marine sources tend to have higher (≥0.97) SSA (Dubovik et al., 2002); thus, the WP data suggest a polluted marine source (Lacagnina et al., 2015). Although, we note that the air masses from the WP have relatively low scattering and absorption coefficients and that these could have affected the calculations for SSA. EA air exhibits the highest non-sea-salt sulfate mass fraction (0.43) (Fig. 3b), which, along with its predominantly fine particle size and median SSA (0.95 with Q1 and Q3 of 0.94 and 0.96), strongly suggests that it was transported from an urban source. Sulfate is a known industrial product of East Asia (Smith et al., 2011; Li et al., 2017; Lorenzo et al., 2023).
Particles from PSEA have the lowest median SSA (0.68 with Q1 and Q3 of 0.55 and 0.87) (Fig. 3a). This suggests the presence of more absorbing particles relative to scattering, possibly including elemental carbon and aged dust. Based on the PSEA air masses having the highest non-sea-salt potassium mass fraction (0.05, Fig. 3b), the particles could be from biomass burning. It is well documented that dust can be entrained in smoke plumes due to reasons such as turbulent mixing around flames and burn fronts (Palmer, 1981; Kavouras et al., 2012; Maudlin et al., 2015; Schlosser et al., 2017). Dust from East Asia and biomass burning from PSEA have been observed to be mixed in the boreal spring in Taiwan (Dong et al., 2018), and although CAMP2Ex sampled during a different season, it is still possible that this mixing of East Asian dust and PSEA biomass burning could have occurred and impacted the CAMP2Ex region during the field campaign.
Using the AAE and SAE with the categorization determined by Cazorla et al. (2013), the f(RH) can be related to the types of aerosols. Note that the median f(RH) values for the aerosol types may be slightly different than the raw 1 s f(RH) data because the median f(RH) is only calculated for the aerosol types when both the scattering and the absorbing Ångström exponent values are available. The highest median f(RH) values of 1.31 (with Q1 and Q3 of 0.89 and 1.46) and 1.21 (with Q1 and Q3 of 0.88 and 1.68) are from the OC–dust mix and coated large particles aerosol types (Fig. 5), respectively, though there are only 55 data points for the OC–dust mix so the aerosol classification for it may not be as robust. The high f(RH) for the coated large particles is consistent with its largest bulk sea salt mass fraction (0.56) (Fig. 5b) compared to other aerosol types, though they only make up 1.8 % of the total number of particles. Dust-dominated particles make up only 0.05 % of the total number of particles and had the highest non-sea-salt calcium and a median f(RH) of 1.15 (with Q1 and Q3 of 0.94 and 1.43).
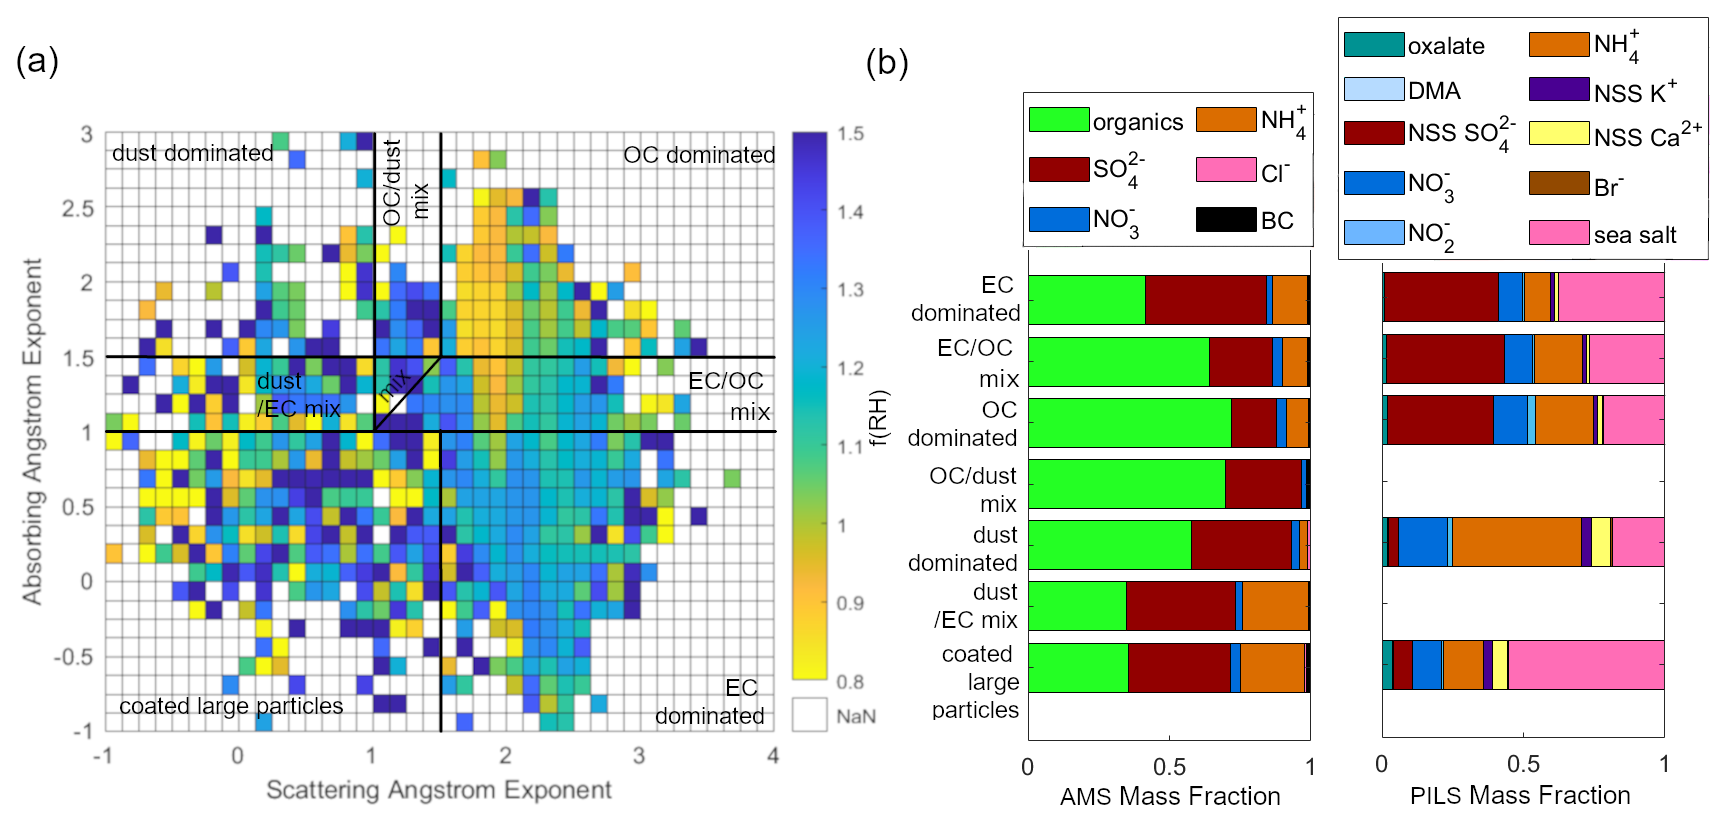
Figure 5Aerosol types based on particle optical data. (a) Median f(RH = 82 % ± 10 %/RH < 40 %) at 550 nm of data points with absorbing Ångström exponent (AAE, 470–660 nm) and scattering Ångström exponent (SAE, 450–700 nm) values that correspond to suggested aerosol types from past studies (Cazorla et al., 2013) with the following counts and bulk median f(RH = 82 % ± 10 %/RH < 40 %) per aerosol type: EC dominated (16 908 and 1.19), EC–OC mix + mix (20 686 and 1.03), OC dominated (1942 and 0.94), OC–dust mix (55 and 1.31), dust dominated (79 and 1.15), dust–EC mix (204 and 1.12), and coated large particles (729 and 1.21). (b) (Left) Submicrometer mean organic, SO, NO, NH, Cl−, and black carbon (BC) mass fractions and (right) available bulk (<5 µm) oxalate, dimethylamine (DMA), non-sea-salt SO, NO, NO, NH, non-sea-salt K+, non-sea-salt Ca2+, Br−, and sea salt mass fractions per aerosol type.
Most of the aerosol particles (<5 µm dry diameter and 93 % of all particles) collected during the CAMP2Ex field campaign have optical properties (Fig. 5a) that resembled EC–OC mix + mix (in this case we combined the subcategories of EC–OC mix and mix) (51 %) and EC-dominated (42 %) aerosol types. These carbonaceous particles are less hygroscopic, and their dominance helps to explain the low median f(RH) in the CAMP2Ex region. The EC-dominated particles have the third highest median f(RH) at 1.19 (with Q1 and Q3 of 1.05 and 1.33), which is unusual because EC is known to be hydrophobic. Compositional data shed some light on this, because the particles classified as EC dominated have higher submicrometer sulfate (0.43) and bulk sea salt (0.38) mass fractions (Fig. 5b) compared to particles classified as OC (0.16 and 0.22) and dust dominated (0.35 and 0.19), which are known to have low hygroscopicity in general. This mixing of sulfate and sea salt with EC-dominated particles increases their bulk f(RH). The EC-dominated particles come from the EA, MC, and Other air masses. East Asia is a known sulfur source, and shipping contributes to sulfate in the region (Miller et al., 2023). Peat smoke particles from MC have also been found in past studies to have sulfate mixed with carbonaceous species (Nakajima et al., 1999), where up to ∼0.20 of the mass fraction of secondary organic aerosol from lab experiments on peat burning was attributed to sulfate (Chen et al., 2022).
The OC-dominated type has the highest submicrometer organic mass fraction (0.72) and a median f(RH) of 0.94 (with Q1 and Q3 of 0.85 and 1.06), which is consistent with the expected effect of organics to lower hygroscopicity. The median f(RH) values below 1, though, are counterintuitive given that the presence of moisture in the region is thought to generally increase the particle size and consequently the amount of aerosol light scattering. Data where f(RH) is less than unity have been observed in past studies due to a number of suspected factors, including (but not limited to) volatilization effects, changes in optical properties during humidification, and particle restructuring (Shingler et al., 2016b).
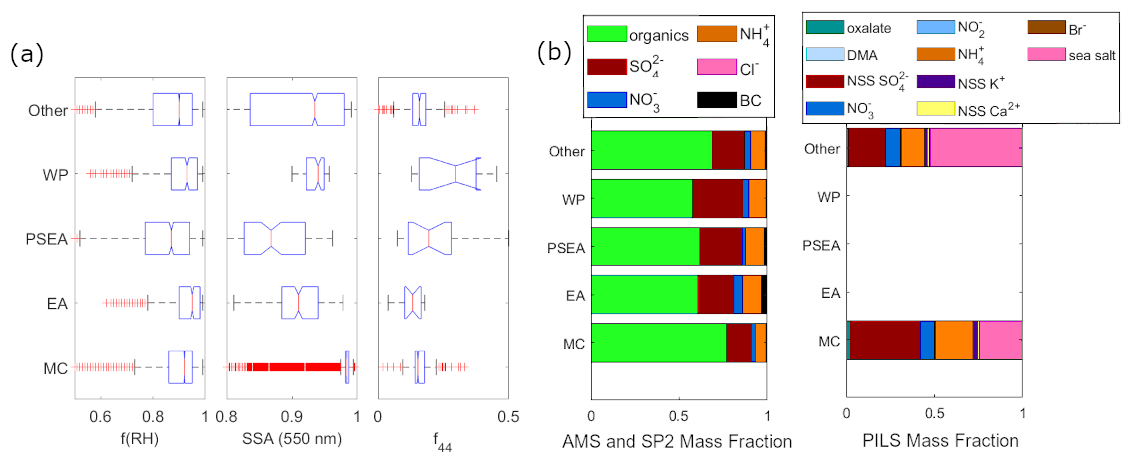
Figure 6Physicochemical properties of air masses with sub-1 f(RH) at 550 nm. (a) Boxplots (boxes correspond to the 25th to 75th percentile of the data, the red line is the 50th percentile, the whiskers represent 1.5× the interquartile range, the red crosses are the outliers, and when the notches in the boxplots do not overlap there is 95 % confidence that the medians of the boxplots are different) of 1 s f(RH = 82 % ± 10 %/RH < 40 %) < 1 (MC: 14 612; EA: 473; PSEA: 986; WP: 483; Other: 9919 counts) and the corresponding single scattering albedo (SSA, 550 nm) and ratio of the mass spectral marker 44 relative to total organic mass (f44) and (b) (left) submicrometer mean organic, SO, NO, NH, Cl−, and black carbon (BC) mass fractions and (right) available bulk (<5 µm) oxalate, DMA, non-sea-salt SO, NO, NO, NH, non-sea-salt K+, non-sea-salt Ca2+, Br−, and sea salt mass fractions. The y-axis labels correspond to air mass sources from Hilario et al. (2021): Maritime Continent (MC), East Asia (EA), peninsular Southeast Asia (PSEA), West Pacific (WP), and Other.
To investigate aerosol characteristics when f(RH) is <1, we plot the f(RH) boxplots from each of the regions for data points where f(RH) < 1 (Fig. 6a). There are several instances (26 473 times or 19 % of the time for the whole campaign) when the f(RH) was below 1. In general, 30 s resolution organic mass fractions greater than 0.75 correspond to sub-1 f(RH) (Fig. 4a). The most prevalent regional air mass association for sub-1 f(RH) is with the MC air masses (f(RH) < 1 from the MC was 56 % of all data). The mean organic mass fraction is dominant (0.57–0.77) and almost doubled compared to the whole campaign (Fig. 3b) for all the air masses with sub-1 f(RH) (Fig. 6b). Mean organic mass fraction is highest for the MC (0.77) air mass. The organics from the sub-1 f(RH) data are the least aged throughout the campaign for the MC, PSEA, and Other air masses (Fig. 6a). The CAMP2Ex data offer an opportunity to inspect the prevalence of such values and to see what factors coincide with such situations. However, the unique sample make-up of the particles in the CAMP2Ex region makes other reasons, including sample losses due to volatilization, also plausible (Reid et al., 2023). Shingler et al. (2016b) also observed such sub-1 values for both f(RH) and the humidified diameter growth factor g(RH) in air masses enriched with carbonaceous components over North America.
The most dominant aerosol types for the sub-1 f(RH) data are the carbonaceous ones (96 %) (Fig. 5b), with the EC/OC component contributing the most: EC–OC mix + mix (the combined subcategories of EC–OC mix and mix) (68 %), EC dominated (18 %), and OC dominated (10 %). Both bulk ammonium and sulfate mass fractions for the MC also are higher for the sub-1 f(RH) cases (Fig. 6b) compared to the whole campaign (Fig. 3b, PILS), while the bulk sea salt mass fraction was lower. The bulk sea salt mass fraction of the Other category (Fig. 6b) increases for the sub-1 f(RH). Most of the particles contributing to the sub-1 f(RH) are fine particles (median Ångström exponent ∼ 2, Fig. 6a) with more reflective characteristics (SSA ≥ 0.90) compared to data for the entire campaign. To understand more about sub-1 f(RH), we will look at a selected case in the following section.
3.2 Case studies
3.2.1 Sub-1 f(RH) from biomass burning smoke
The chosen case study is part of a flight on 16 September 2019 that occurred closest to the Maritime Continent, which is the source of the air masses that had the most counts of sub-1 f(RH) (Sect. 3.1.2). This flight coincided with an active biomass burning event on 14 September 2019 (NASA, 2019), and fire hotspots in the Maritime Continent were numerous throughout September 2019 (Othman et al., 2022). The back trajectories at 01:00 UTC, when the aircraft began to make measurements closest to the surface (∼300 m altitude) and perpendicular to the wind, all come from the southwest of the aircraft location (Fig. 7a), in the direction from where biomass burning emissions were being transported. Details about the flight and conditions during this case study are found in Crosbie et al. (2022). In their study they note the smoke to be from Kalimantan with an age between 48 and 72 h. Consistently low f(RH) (all below 1, Fig. 7b) values were observed for a little less than an hour, until the aircraft began its ascent (Fig.7b). The aerosol mass concentrations of >70 µg m−3 were among the highest in the entire field campaign and were dominated by organics (Fig. 7b).
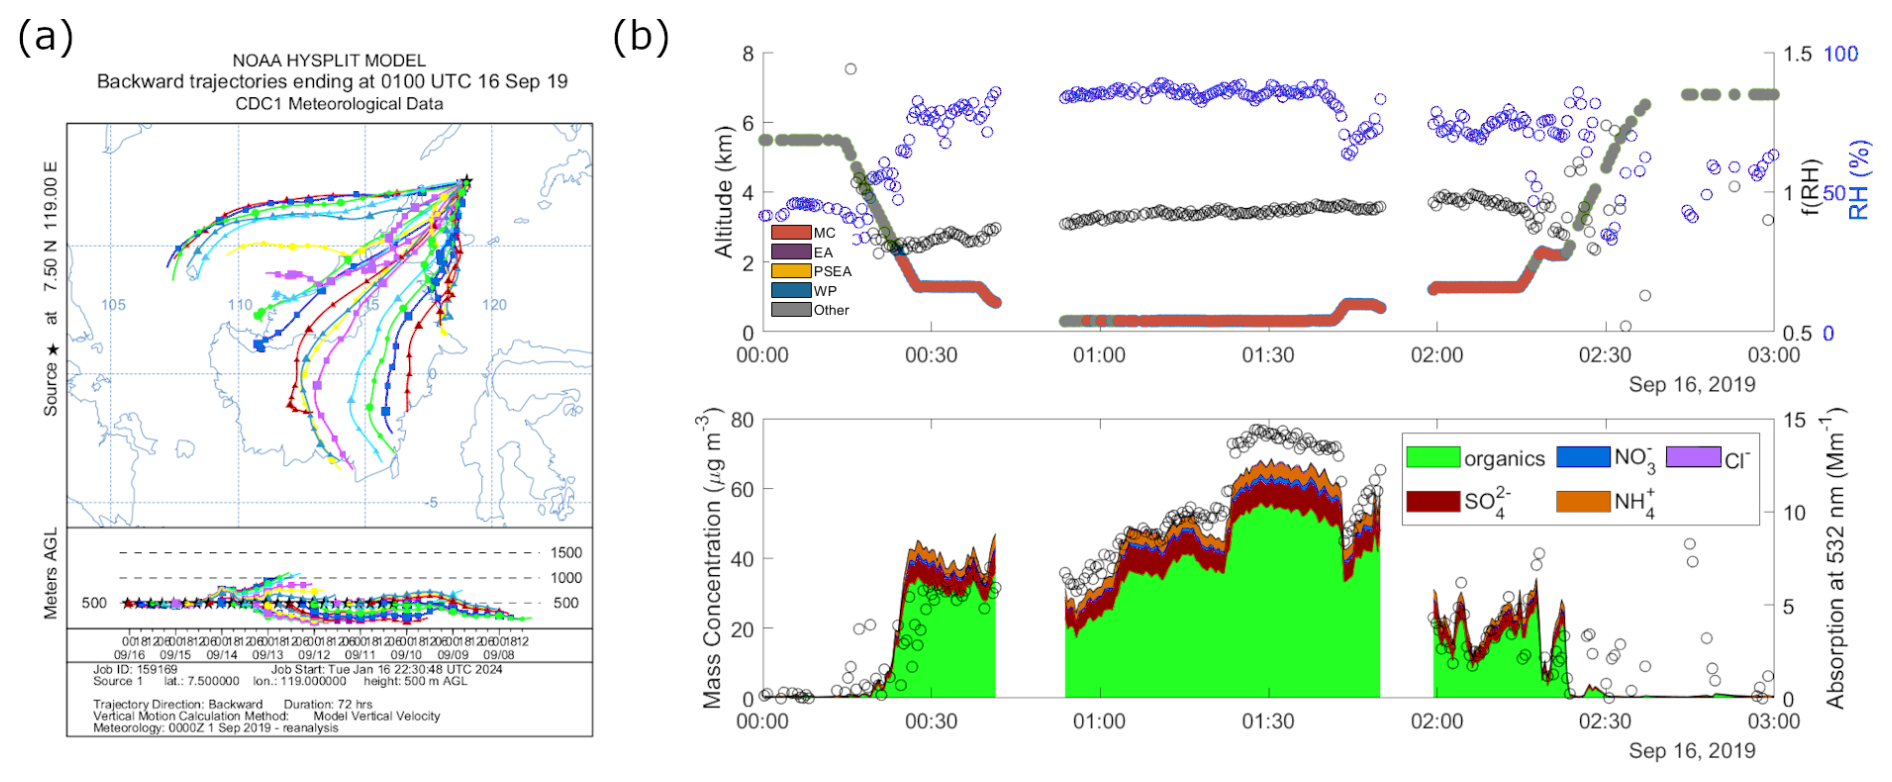
Figure 7Case study of sub-1 f(RH = 82 % ± 10 %/RH < 40 %) at 550 nm on 16 September 2019. (a) Five-day back trajectories at the approximate flight location at 01:00 UTC. (b) (top) Time series plots of altitude colored by regional air mass, f(RH) in black circles, and RH (blue circles), and (bottom) aerosol mass concentrations from the AMS and absorption at 532 nm (black circles) during one of the flight legs closest to the surface from 00:00 to 03:00 UTC.
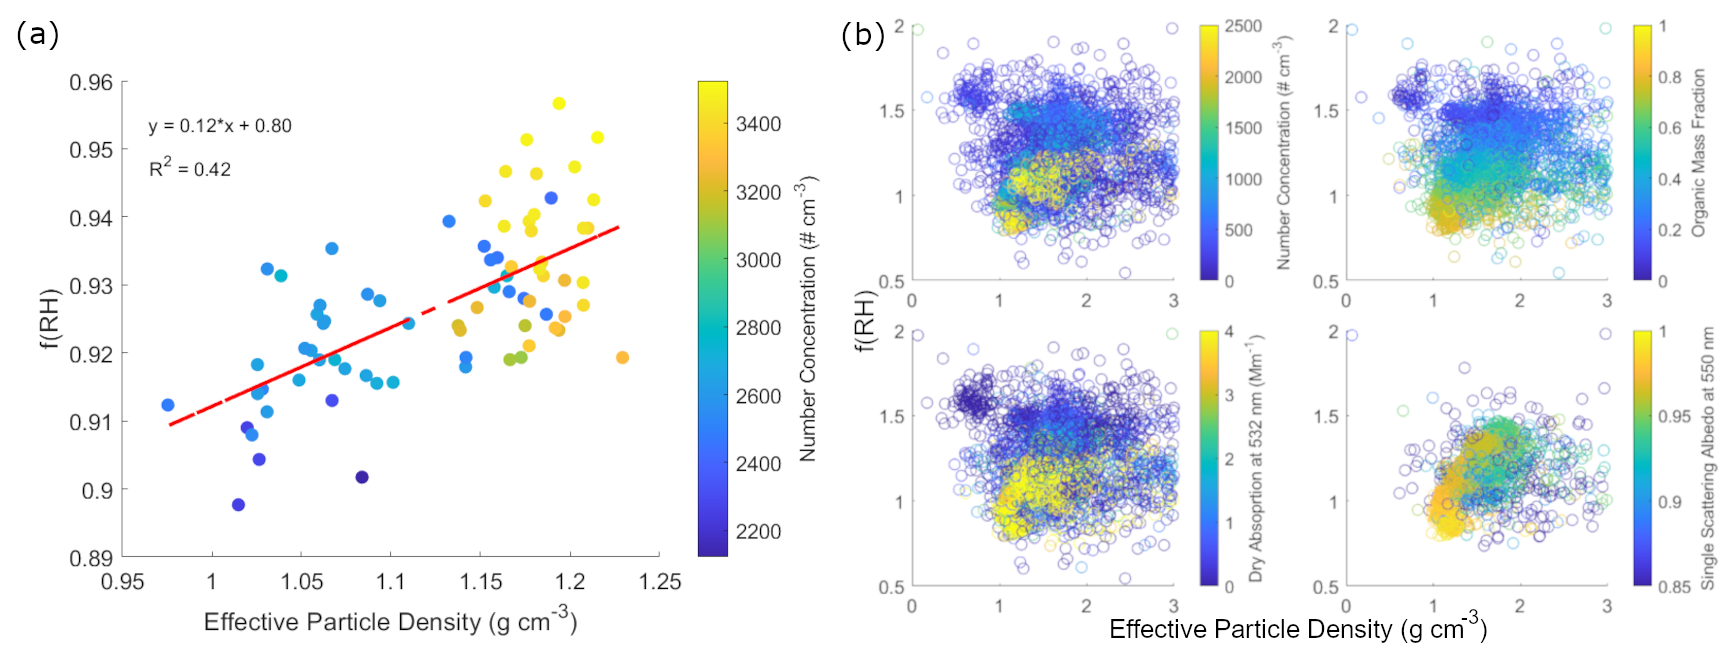
Figure 8Effective particle density and f(RH): 30 s f(RH = 82 % ± 10 %/RH < 40 %) at 550 nm and effective particle density plots for (a) 16 September 2019 from 01:00 to 01:40 UTC colored by dry absorption at 532 nm and with (red) linear regression line and (upper left) corresponding equation and goodness of fit and (b) for the entire CAMP2Ex field campaign and colored by (clockwise from top left) LAS number concentration of particles with diameters between 100 and 1000 nm, organic mass fraction, single scattering albedo at 550 nm, and dry absorption at 532 nm.
The sub-1 f(RH) values during the lowest altitudes of the aircraft, from 01:00 to 01:40 UTC, are correlated with approximations of the submicrometer particle effective density (Fig. 8a). Absorption measurements along with back trajectories linked to active fires point to the increasing presence of EC and brown carbon with increasing particle density (even if there were no valid EC measurements for this specific time). Submicrometer number concentration, dry absorption (532 nm), organic mass fraction, and single scattering albedo are highest for the smallest effective density values for sub-1 f(RH) (Fig. 8b) during the entire campaign, likely due to the presence of EC and OC. This is consistent with the most dominant aerosol type during the field campaign, which is a mix of elemental and organic carbon based on SAE and AAE values. The dataset cannot be used to prove particle restructuring, and it is very likely that the sub-1 f(RH) values are due to other factors since particles' history included passes through humid areas where restructuring presumably would have already occurred prior to reaching the aircraft. In addition, smoldering from peat, which is dominant in the MC fires (Reid et al., 2023), is known to produce homogenous spheres, with no voids, that are similar to OC particles (Pokhrel et al., 2021), making restructuring unlikely to be the dominant mechanism to explain our findings. However, we present these results for the sake of documenting a Southeast Asia case of these unusual events occurring in EC-rich and/or organic-rich air masses similar to past work (e.g., Shingler et al., 2016b, and references therein) to emphasize that these events occur throughout the world and to motivate more research into the matter.
Smoke particles are known to have a range of density values, depending on their degree of atmospheric aging, affecting their size and the processes they undergo. The effective particle density is usually lower for biomass burning particles from smoldering that have larger diameters (Pokhrel et al., 2021) compared to flaming. Freshly emitted smoldering particles have effective densities from 1.03 to 1.21 g cm−3 that do not vary much with diameter based on a laboratory study (Pokhrel et al., 2021). Our calculated values fall within this range (Fig. 8). This adds confidence to our observation that organics (brown carbon), which dominate smoldering emissions, are the major contributors to the sub-1 f(RH). Both aerosol hygroscopicity and effective particle density are important for properly modeling cloud condensation nuclei, one of the most important factors in aerosol–cloud interactions.
3.2.2 Vertical transport
The vertical distribution of aerosols affects cloud formation; we investigate this through two cases of aerosol vertical transport. The vertical transport cases were identified from averages of the available vertical profiles made during CAMP2Ex. A large-scale event (01:53 to 06:20 UTC 20 September 2019) north of Luzon, Philippines, due to a tropical cyclone, and a smaller-scale event (02:55 to 06:02 UTC 24 September 2019) east of Luzon, due to shallow convection, were chosen for the case studies. The measured median CO mixing ratio was used as a tracer for vertical transport (Kar et al., 2004). An increase in the median CO mixing ratio at higher altitudes and multi-level winds from a similar direction were the main criteria used to identify the cases.
Northerly to northwesterly winds are the dominant source for the first case (Fig. 9a) influenced by Tropical Cyclone (TC) Tapah (TC Tapah's center was ∼600 km northeast of the aircraft location). This suggests the influence of East Asia on the sample as described in Crosbie et al. (2022), where the meteorology is discussed in more detail. There is a general decrease in f(RH) from the lower levels that follows a similar trend to the decrease in total mass (Fig. 9b) and sulfate mass fraction. Sulfate is hygroscopic so it is understandable that the f(RH) decreased with altitude as the sulfate mass fraction decreased. The increase in CO between 6–7 km (Fig. 9b) suggests vertical transport aloft and is accompanied by a subsequent decrease in f(RH) and ammonium mass fraction and an increase in organic mass fraction (Fig. 9b) between 6–8 km. This is consistent with analysis in previous sections, which shows decreased f(RH) with increased organic mass fractions.
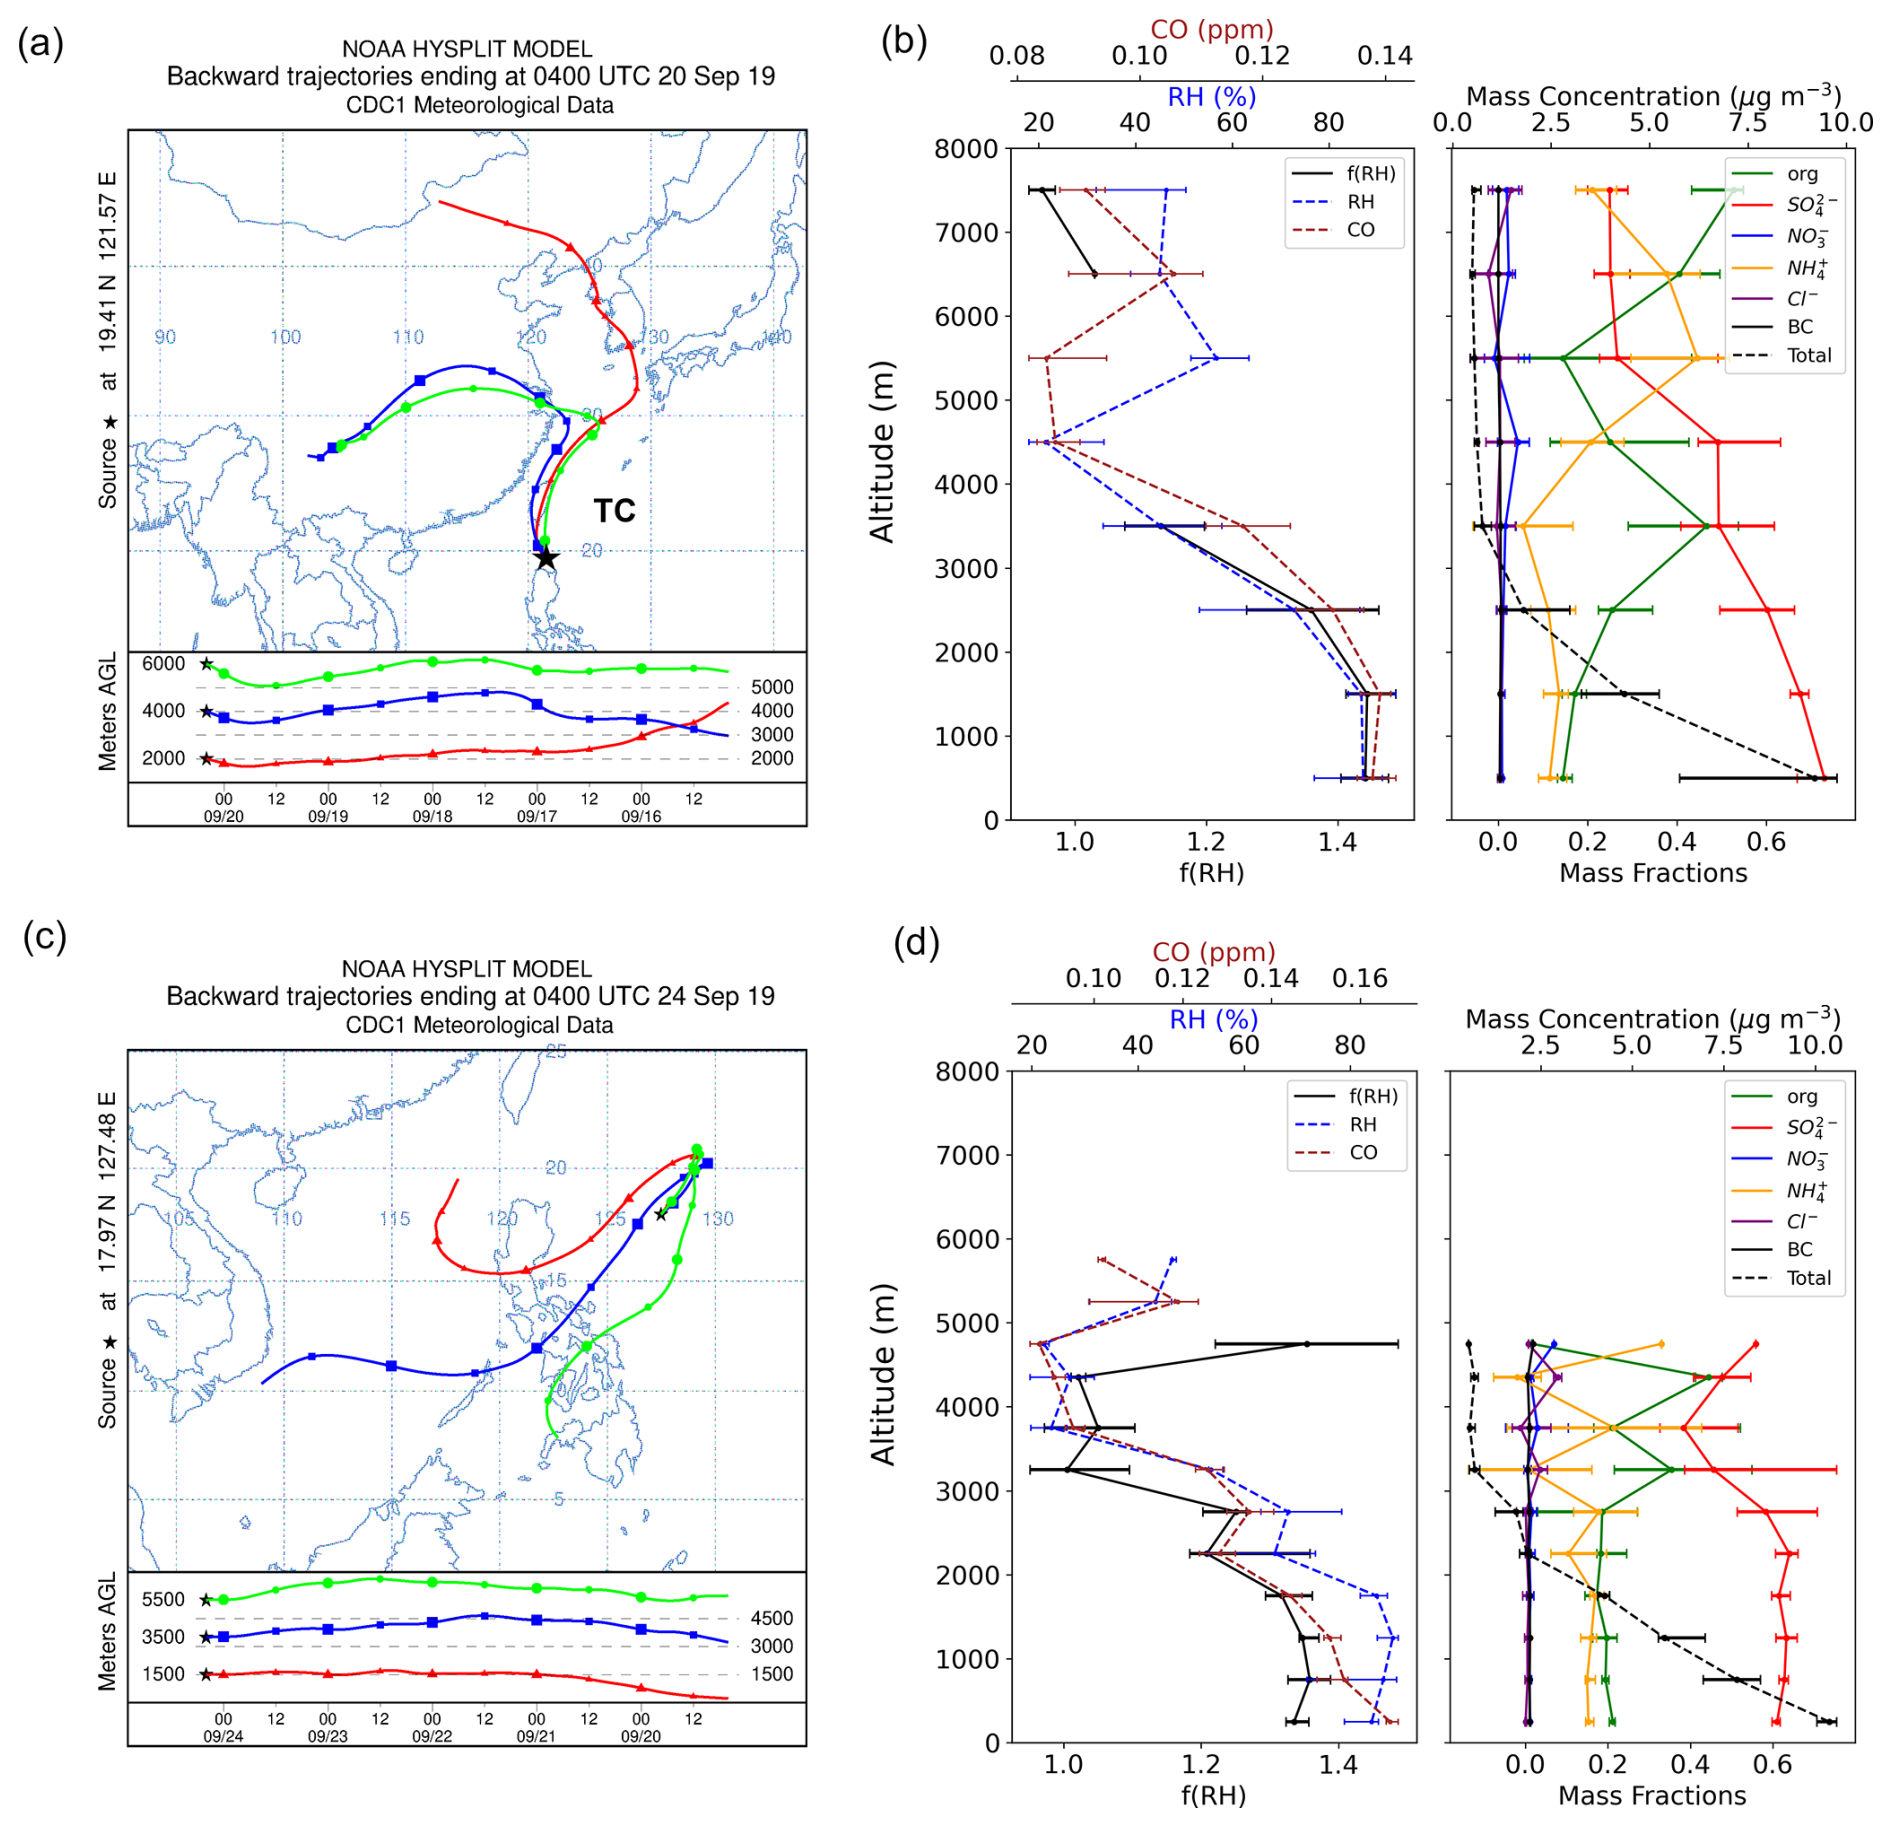
Figure 9Case studies of (a, b) tropical-cyclone-induced convection on 20 September 2019 and (c, d) shallow convection on 24 September 2019. (a) Five-day multi-level back trajectories from the average location of the aircraft from 01:53 to 06:20 UTC, with the approximate TC center location; (b) vertical profiles (median and 25th and 75th percentiles) of (left) f(RH = 82 % ± 10 %/RH < 40 %) at 550 nm, relative humidity (RH), and CO mixing ratio and (right) submicrometer mass fractions of organics, sulfate, nitrate, ammonium, and black carbon and sum of mass concentrations from AMS and SP2 (dashed black line) for 1 km altitude bins; (c) five-day multi-level back trajectories from the average location of the aircraft from 02:55 to 06:02 UTC; and (d) vertical profiles of f(RH = 82 % ± 10 %/RH < 40 %) at 550 nm, relative humidity (RH), CO mixing ratio, and submicrometer mass fractions and sum of mass concentrations from AMS and SP2 for 0.5 km altitude bins.
Accompanying the general decrease in f(RH) with altitude are decreasing submicrometer median volume size distribution (VSD) magnitudes and volume-weighted average diameters (Fig. 10). Possible reasons for these trends are that larger hygroscopic particles, such as sulfate (which make up the largest mass fraction at lower levels), were scavenged (especially at lower altitudes) and/or activated into cloud drops, leaving the smaller particles behind. Submicrometer aerosol mass also decreases with altitude, with values below 1 µg m−3 (Fig. 9b). There is a slight increase in VSD magnitude from 6–8 km compared to 4–6 km, and especially at larger diameters, broadening the VSD curve, which may suggest cloud processing (Eck et al., 2012). Although sulfate enhancements have traditionally been the marker for cloud processes (Barth et al., 2000; Faloona, 2009), more recent studies have observed potential cloud processing cases with increased organics (i.e., Wonaschuetz et al., 2012; Dadashazar et al., 2022). This case could thus be showing vertically transported organic matter that has possibly affected or was affected by the clouds between 6–7 km. Another observation is the increase in ammonium and nitrate mass fractions above 4 km (Fig. 9b). There is no corresponding valid f(RH) data, and we can only infer based on the CO profile that begins to shift toward a more positive slope with increasing altitude that this increase in ammonium could also be associated with cloud processing. Ammonia is abundant in East Asia (Pawar et al., 2021), and although there are still limited studies, the scavenging efficiencies of organics and ammonium (compared to sulfate) could also be contributing to their increasing mass fractions with altitude (Yang et al., 2015; Hilario et al., 2025).
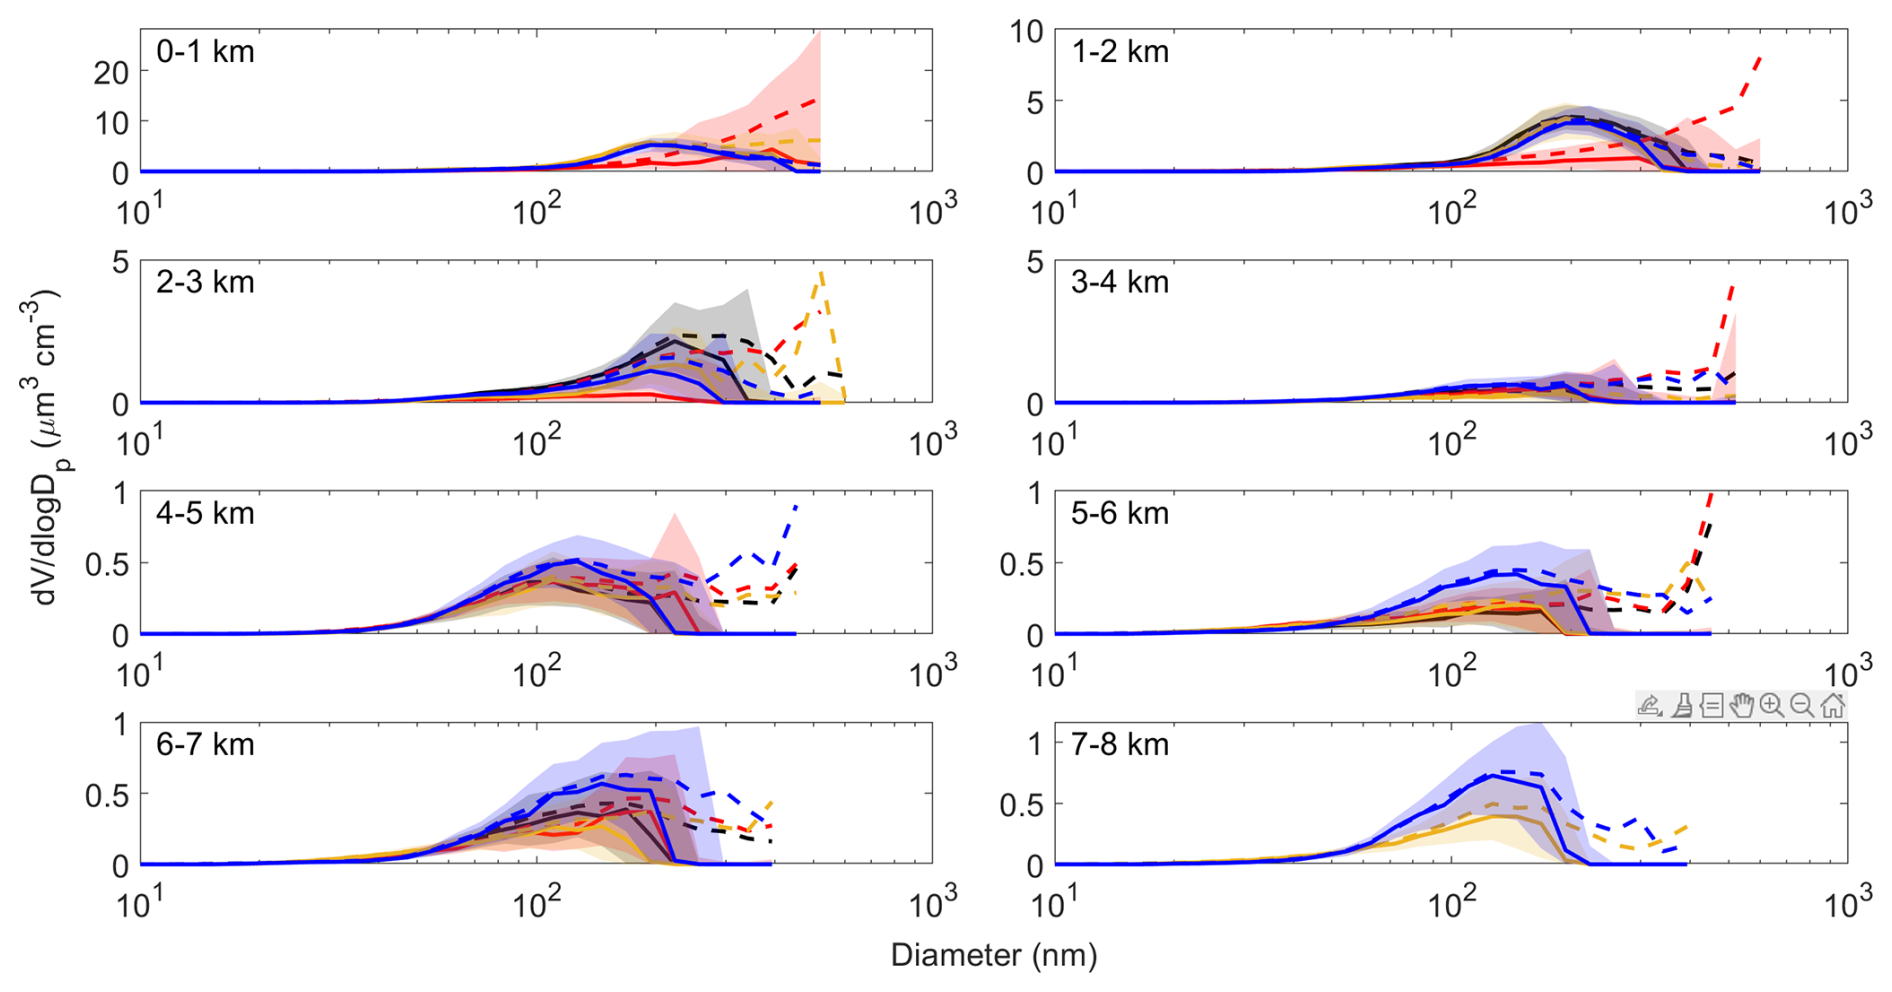
Figure 10Volume size distributions for the tropical-cyclone-induced convection case study. Median (solid line), mean (dashed line), and 25th to 75th percentiles (shaded area) of volume size distributions of submicrometer particles from a fast integrated mobility spectrometer (FIMS) every 1 km altitude on 20 September 2019 from 01:53 to 06:20 UTC. The colors represent four separate vertical profiles, where black was from 01:35 to 02:19 UTC, red was from 03:40 to 04:44 UTC, yellow was from 04:59 to 05:27 UTC, and blue was from 05:52 to 06:20 UTC.
The second case, the shallow cumulus case on 24 September 2019 (Hilario et al., 2025), has multi-level wind trajectories initially from the West Pacific in the northeast direction, which appear to have come from the Philippines and the general southwest direction from 2 d before (Fig. 9c). The most evident increase in CO (Fig. 9d) is observed between 5–5.5 km, at an altitude lower than the previous case. Both RH and f(RH) have a similar trend to CO throughout the vertical profile, which slightly follows the trend of sulfate mass fraction. This is observed especially in the lower levels (until ∼2 km) where RH and f(RH) are relatively steady, even with a large decrease in total aerosol mass.
At higher altitudes, above 4.5 km, f(RH) increases to a greater degree with decreased organic mass fraction and increased sulfate mass fraction (Fig. 9d), possibly due to cloud processing. Like the first case, the VSD plots (Fig. 11) for this case show decreasing VSD magnitudes and volume-weighted average diameters with increasing altitudes. The broadening of the VSDs above 3 km, concurrent with the increased sulfate mass fraction, likewise suggests cloud processing. There is a known sulfate source, a power plant in western Luzon, in the Philippines, that is along the path of the 1.5 km back trajectory (Fig. 9c) and may possibly contribute to sulfate in the region (Lorenzo et al., 2023). It is possible that this and other sulfate sources in the region, such as those from ships (Miller et al., 2023), are being transported vertically and affecting aerosol hygroscopicity in the areas where there is shallow convection.
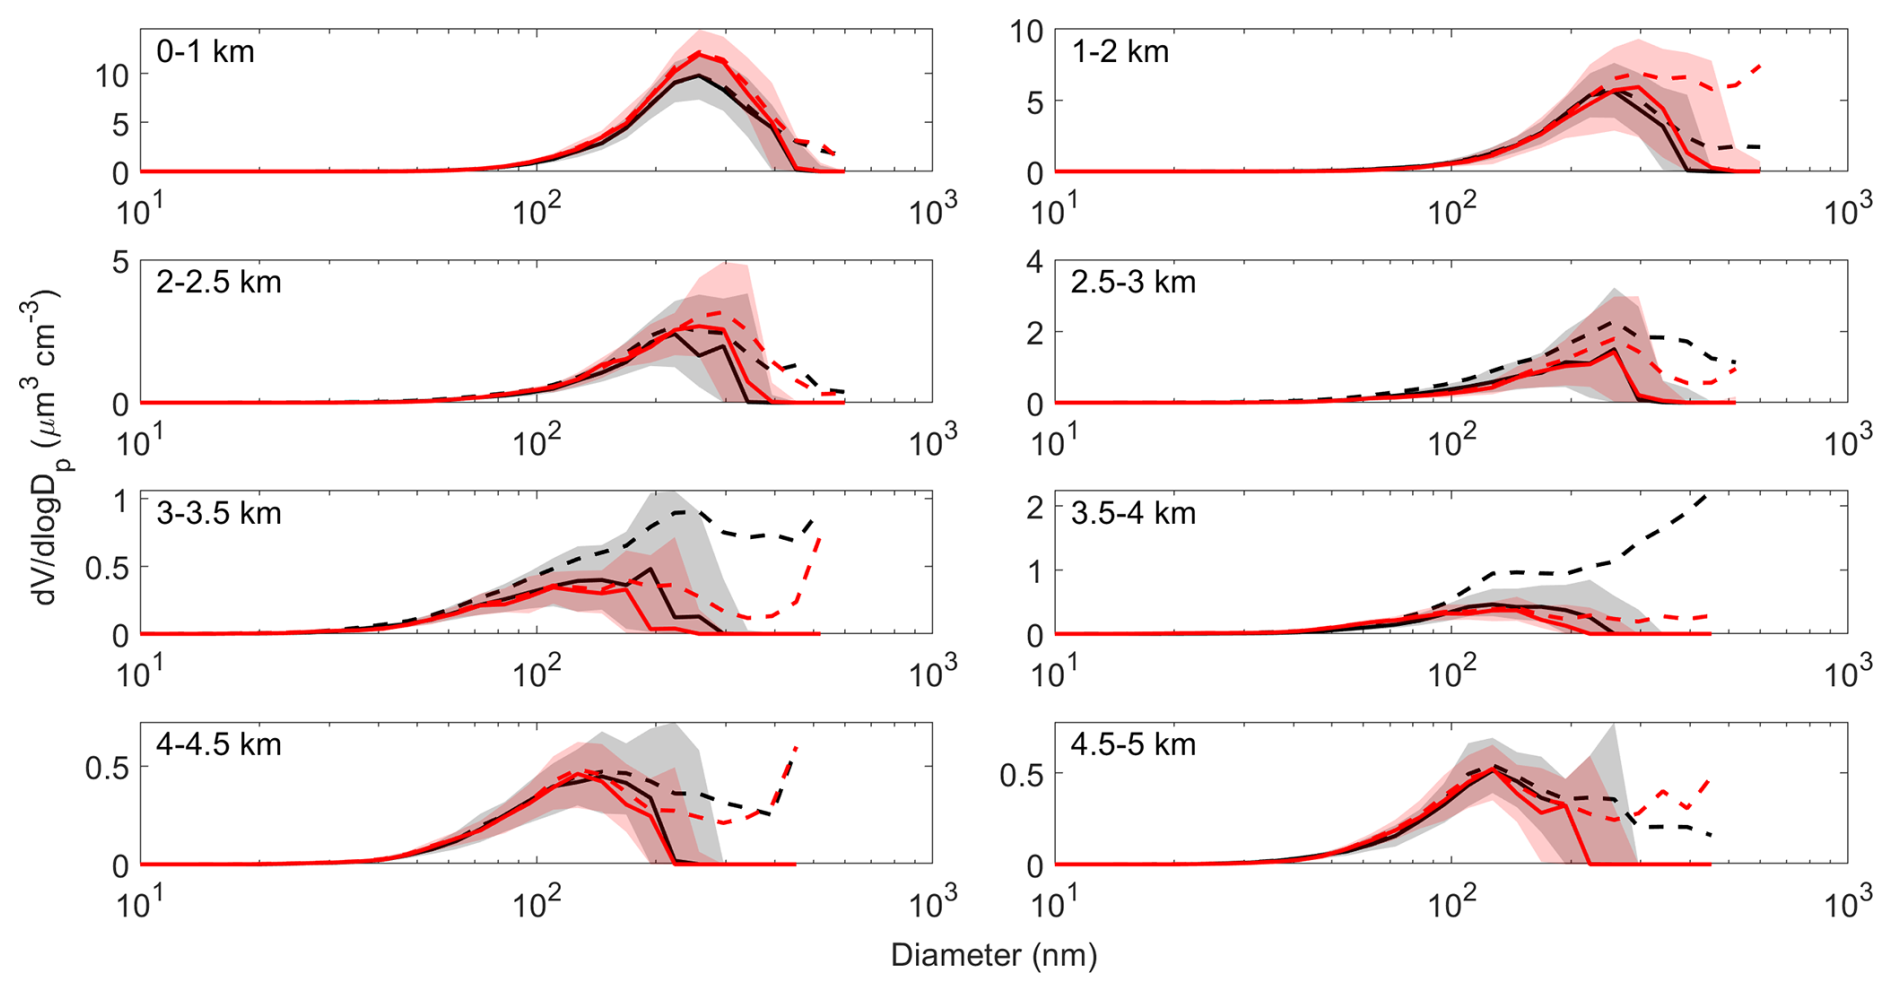
Figure 11Volume size distributions for the shallow convection case study. Median (solid line), mean (dashed line), and 25th to 75th percentiles (shaded area) of volume size distributions of submicrometer particles (FIMS) in 0.5–1 km altitude increments on 24 September 2019 from 02:55 to 06:02 UTC. The colors represent two separate vertical profiles, where black was from 02:55 to 04:07 UTC and red was from 05:42 to 06:02 UTC.
In summary, for both cases vertical transport in cumulus clouds corresponds to higher f(RH), with lower organic mass fractions or increased sulfate mass fractions at cloud outflow altitudes. At slightly higher altitudes, increasing organics with decreasing ammonium decreases f(RH) for the tropical cyclone case. The VSD magnitudes and the averaged diameter of the aerosol size decrease from cloud base to cloud outflow altitudes, with the VSDs broadening likely due to cloud processing. The understanding and representation of the vertical transport or aerosols due to the tropical cyclone and shallow convection and their role in aerosol–cloud interaction is further investigated as we evaluate modeled data using the two cases that we have just discussed.
3.2.3 Model evaluation
To give regional context to the cases, we begin the discussion of model evaluation with the horizontal distribution of the modeled (∼111 km resolution) near-surface aerosol hygroscopicity (kappa: calculated from the volume fractions and kappa values (Eq. 3) of the modeled submicrometer aerosol species as described in Sect. 2.3.2) and winds within the CAMP2Ex domain. We compare the model kappa values to kappa from different regions around the world based on previous studies. Subsequently, we discuss how the modeled submicrometer kappa at different vertical levels compares to the kappa derived from bulk f(RH) (<5 µm) (Eqs. 4 and 5) as well as from kappa derived from submicrometer AMS and SP2 species (Eq. 3) from the aircraft observations.
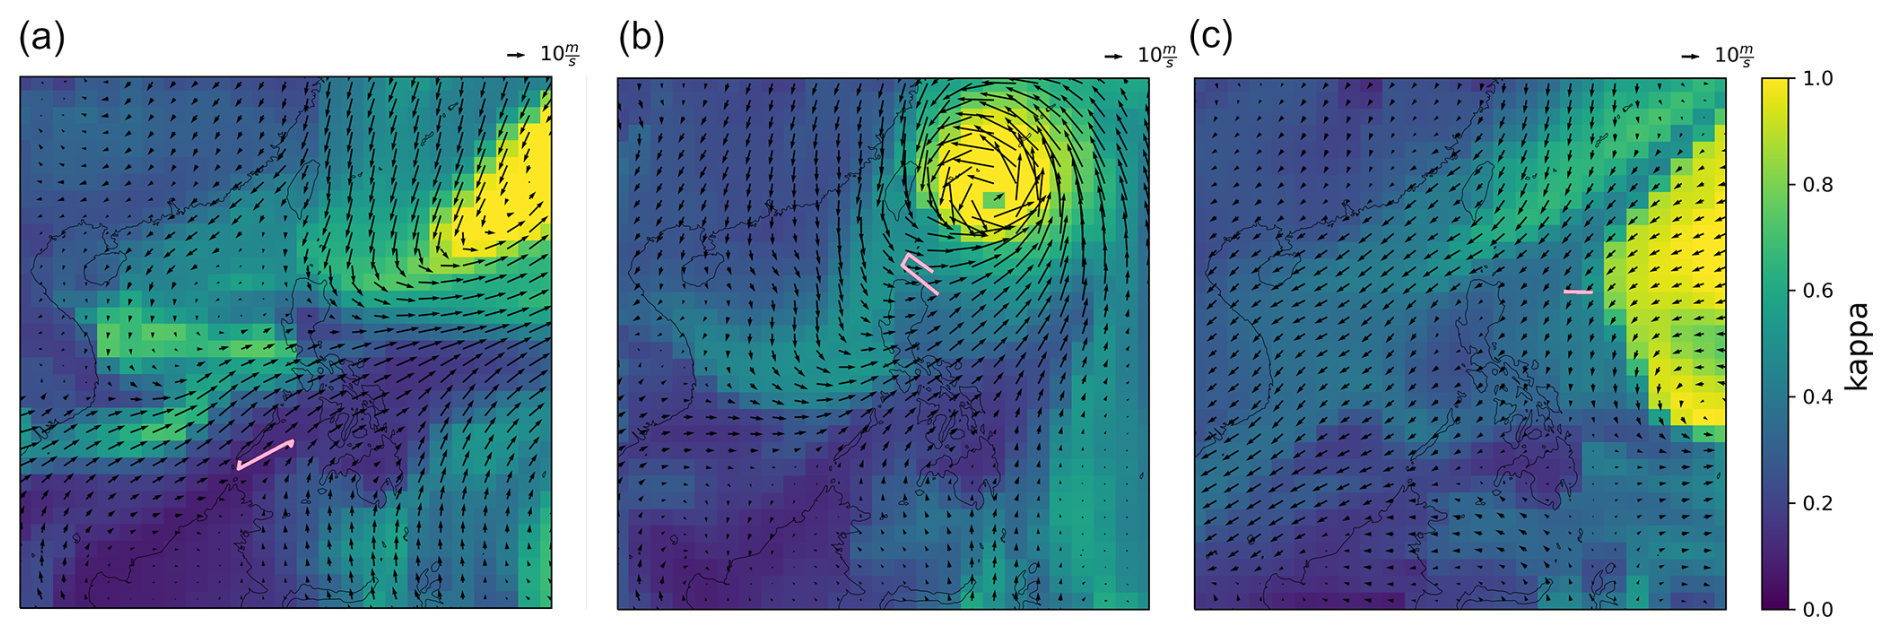
Figure 12Modeled kappa and winds at 957 hPa for (a) the biomass burning smoke case at 06:00 UTC on 16 September 2019, (b) the tropical-cyclone-induced case at 06:00 UTC on 20 September 2019, and (c) the shallow convection case at 06:00 UTC on 24 September 2019. The pink lines represent the aircraft locations from 02:15 to 04:22 UTC on 16 September 2019, from 01:53 to 06:20 UTC on 20 September 2019, and from 02:55 to 06:02 UTC on 24 September 2019.
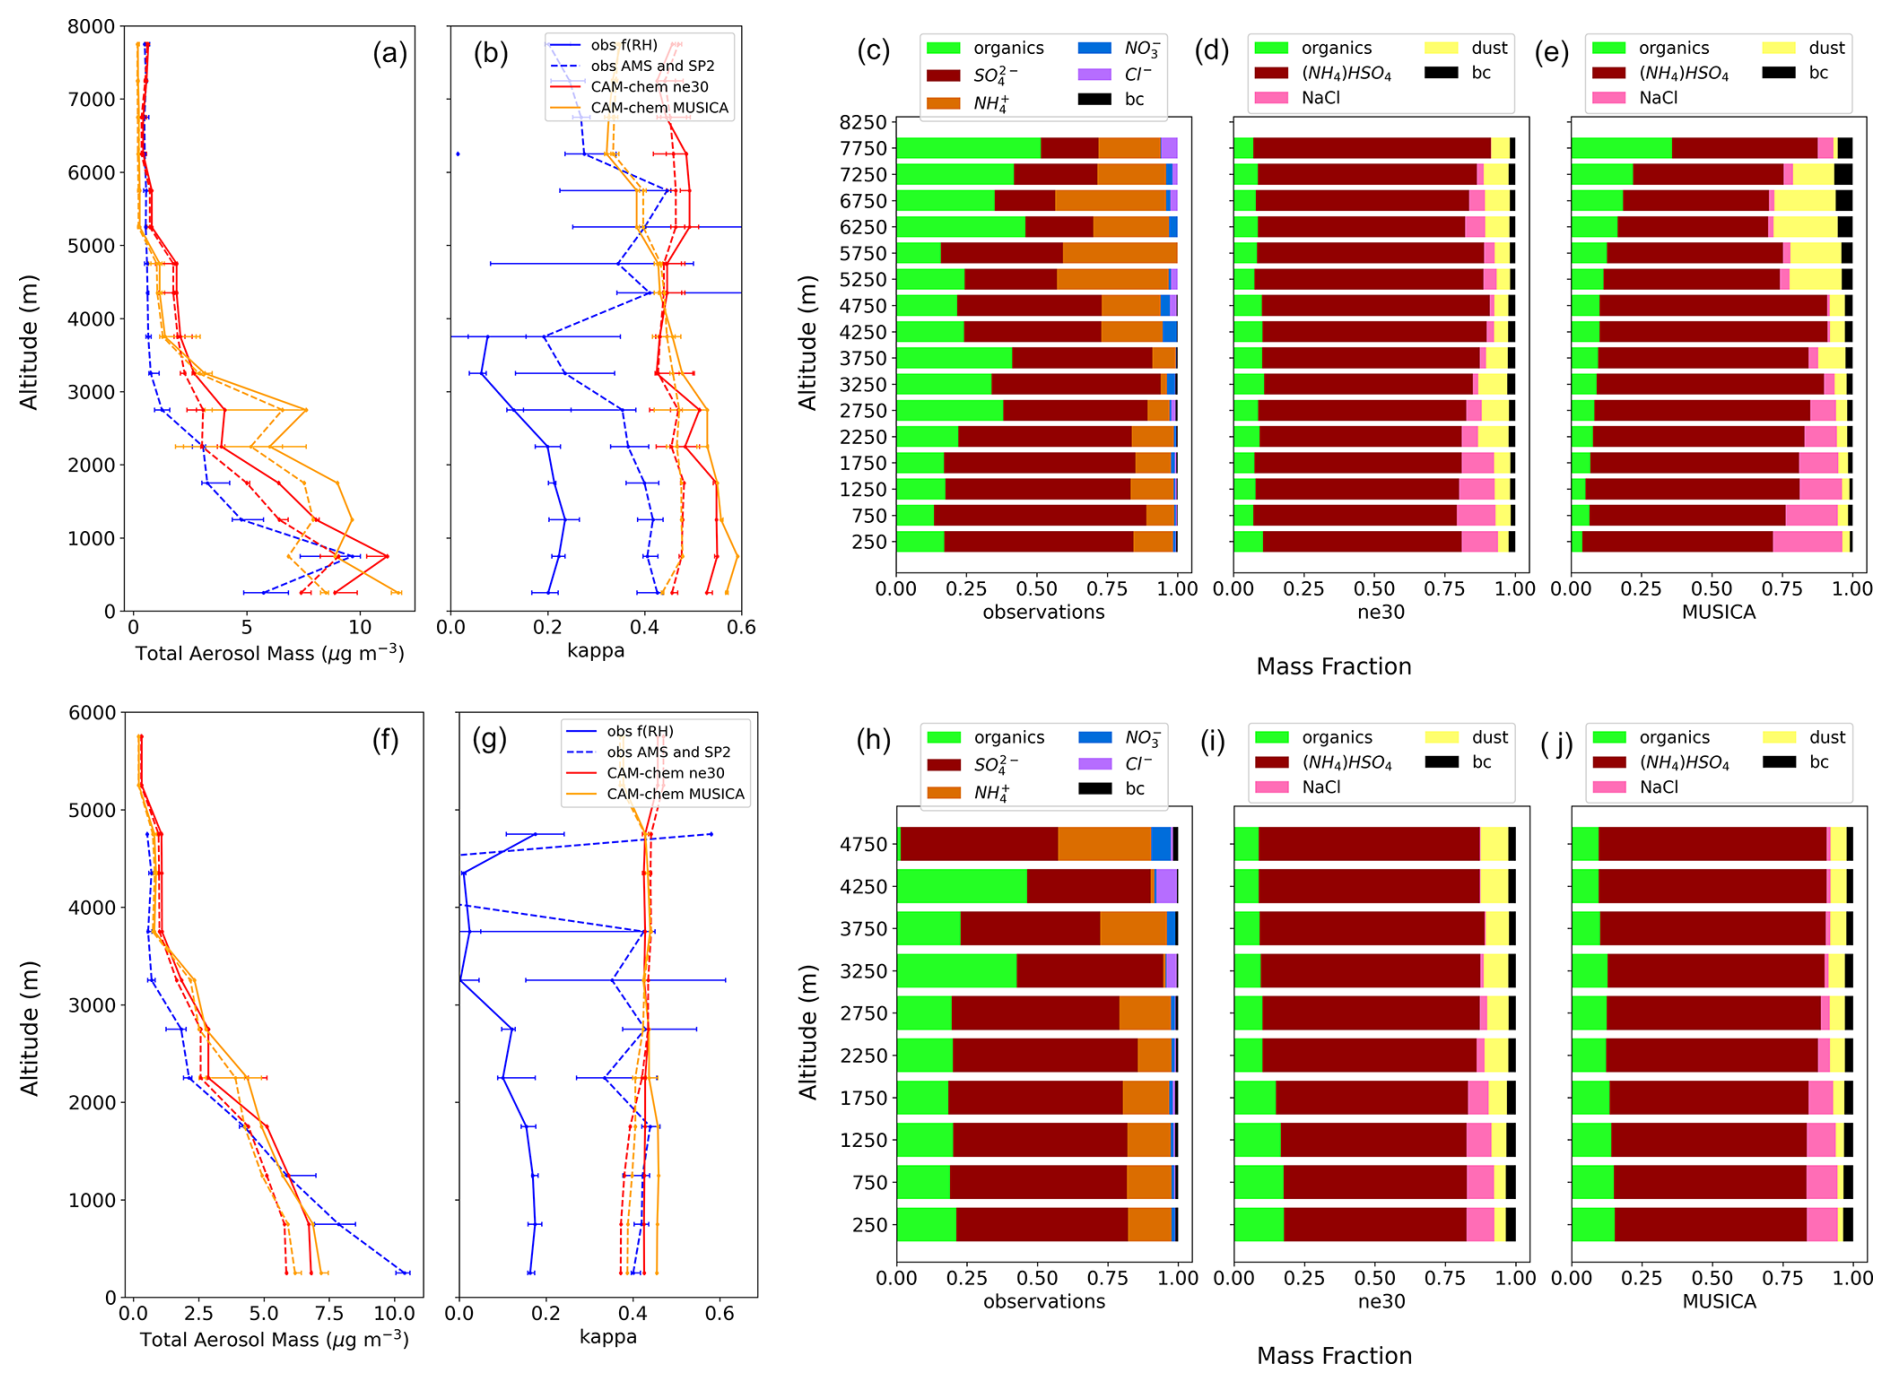
Figure 13Vertical profiles of observed data and CAM-chem model outputs for ne30 ∼ 1° and MUSICA 0.25° grids for (a–e) the tropical-cyclone-induced convection case on 20 September 2019 and (f–j) the shallow convection case on 24 September 2019 at 500 m intervals. (a) Total observed submicrometer aerosol mass (01:53 to 06:20 UTC) from AMS (organics, SO, NO, NH, Cl−) and SP2 (black carbon – BC) data and CAM-chem output (06:00 UTC) (organics: primary and hydrophobic, hygroscopic, and secondary (C15H38O2); sulfate (NH4HSO4); sea salt; dust (AlSiO5); and black carbon (primary and hydrophobic, hygroscopic)), where the solid line includes all the CAM-chem species and the dashed line excludes dust and sea salt, and (b) calculated kappa from observed f(RH = 82 % ± 10 %/RH < 40 %) at 550 nm (solid line, <5 µm) and from AMS and SP2 (dashed line, submicrometer) data and using the ZSR mixing rule for all CAM-chem aerosol species (solid line, submicrometer) and excluding dust and sea salt (dashed line). The lines correspond to the median values of data in the given altitude intervals, and the bars correspond to the 25th and 75th percentile values. Submicrometer median mass fractions at 500 m intervals of (c) observational data (01:53 to 06:20 UTC) and (d, e) corresponding CAM-chem model outputs (06:00 UTC) for (d) ne30 ∼ 1° and (e) MUSICA 0.25° grids for the tropical-cyclone-induced convection case on 20 September 2019. CAM-chem outputs were combined into five main categories: organics (primary and hydrophobic, hygroscopic, and secondary (C15H38O2)); sulfate (NH4HSO4); sea salt; dust (AlSiO5); and black carbon (primary and hydrophobic, hygroscopic). (f) Total observed submicrometer aerosol mass (02:55 to 06:02 UTC) from AMS and SP2 data and (06:00 UTC) CAM-chem output and (g) calculated kappa from observed f(RH = 82 % ± 10 %/RH < 40 %) and from AMS and SP2 data. Submicrometer median mass fractions of (h) observational data (02:55 to 06:02 UTC) and (i, j) corresponding CAM-chem model outputs (06:00 UTC) for the shallow convection case on 24 September 2019.
The CAM-chem modeled surface kappa values (Fig. 12) in the CAMP2Ex region of interest, during the time when the three cases discussed in Sect. 3.2.1 and 3.2.2 were sampled, are within the range of globally modeled surface kappa in clean marine (0.9–1.0), continental (0.1–0.4), and continental outflow and/or polluted marine (0.4–0.6) regions from previous studies (Pringle et al., 2010). The highest modeled kappa (∼1.0, Fig. 12a and b) is like that previously found in clean marine areas. The high kappa values are influenced by the strong winds, which can increase sea salt emissions, due to the tropical cyclone which was still developing on 16 September 2019 and more fully developed on 20 September 2019. The Pacific Ocean is also the source of high kappa values (∼0.9–1.0) for the shallow convection case on 24 September 2019 (Fig. 12c). For all three cases there were low kappa values (<0.4) in areas with low wind speeds and over land, especially over Borneo and East Asia, typical of continental and continental outflow regions. For the two cases that were within the southwest monsoon (Fig. 13a and b), the lowest kappa values (<0.2) were in Borneo and downwind areas including the southern Philippines and areas east of it.
The modeled surface kappa values (∼0.1–0.5) below the aircraft positions for the case studies of interest (pink lines in Fig. 12), though over the sea, are lower than in those areas most affected by the Pacific Ocean and are influenced by emissions from Borneo (Figs. 7a and 12a), East Asia (Figs. 9a and 12b), and the Philippines (Fig. 9c and 12c) based on back trajectories. Kappa values, calculated from the median f(RH) derived from scattering measurements, for the five air masses discussed in Sect. 3.1 and 3.2 (MC: −0.02; EA: 0.14; PSEA: 0.10; WP: 0.24; Other: 0.11), all fall in the continental category even though the majority of these air masses are technically in regions with continental outflow or polluted marine regions. The CAM-chem kappa values for the aircraft positions for the case studies with vertical transport (Fig. 12b and c; ∼0.40–0.50) are more than double the range of calculated kappa from East Asia (0.14) and Other (0.11) air masses that are influencing the case studies. To make sense of this difference between globally modeled surface kappa values and those which are calculated from the CAMP2Ex f(RH), we delve more into aerosol vertical transport and its connection to aerosol hygroscopicity and evaluate the vertical profile of the kappa calculated from the CAM-chem model outputs.
The CAM-chem model (Fig. 13a) was able to represent the general trends in the observed total submicrometer mass vertical profile for the tropical-cyclone-induced convection case. The observations from AMS are only for non-refractory aerosol species, however, and so sea salt and dust are not included in the total mass, possibly affecting the comparison with the model output, which accounts for both. The uniform ∼111 km grid mesh CAM-chem and MUSICA outputs show approximate contributions by sea salt and dust to be 5 % to 20 % of the total mass (Fig. 13d and e). This could explain the higher total mass values from the model outputs compared to observations for some altitude levels, though in general even without dust and sea salt the CAM-chem model still has slightly higher aerosol total mass values (dashed lines in Fig. 13a) compared to the observations. The CAM-chem model represents the approximate aerosol total mass well for this case probably because of its large-scale nature, where wind speeds are high (>20 m s−1) and where the aerosol particles are potentially from a large source (East Asia) (Figs. 9a and 13a). Together, the sum of the sulfate and ammonium mass fractions is similar for the observed (Fig. 13c) and modeled outputs close to the surface (Fig. 13d and e), where the model output is ammonium bisulfate and not just sulfate, but the actual mass concentrations of sulfate from the models are generally higher than the observations above 1 km (Fig. S1a in the Supplement). This sulfate-based compound dominates the total aerosol mass for both the observations and the model outputs, as is expected based on its source air mass from East Asia, and accounts for the similar observed and modeled total mass shape profiles (Fig. S1). The organic mass fraction, on the other hand, is lower by almost half of the observed organic mass fraction due to sulfate dominating. This has a direct effect on modeled aerosol hygroscopicity (kappa), as it was shown earlier that f(RH) decreases with an increased organic mass fraction (Fig. 4).
Median modeled kappa for the tropical-cyclone-induced convection case is more than twice in magnitude compared to the median derived kappa from f(RH) (Fig. 13b), though they have a similar vertical profile shape. It has been noted from previous studies that the conversion of observed f(RH) to kappa (Brock et al., 2016) may be associated with up to 40 % uncertainty (van Diedenhoven et al., 2022), though this does not change the fact that the kappa from CAM-chem is still approximately twice the calculated observed kappa. We note that additional uncertainties as a result of the conversion from Brock et al. (2016) could also be contributing to the discrepancy. Brock et al. (2016) used submicrometer measurements in the southeast US, while CAMP2Ex f(RH) was calculated for particles less than 5 µm. Kappa calculated from f(RH) represents larger particles (<5 µm) compared to the kappa calculated from CAM-chem (<0.48 µm), and the difference in size of the particles could be contributing to this disparity in kappa.
We compare more similar-sized particles, kappa derived from AMS and SP2 measurements (<0.70 µm diameter) with kappa calculated from CAM-chem (Fig. 13b), and find that the kappa derived from AMS and SP2 is still lower than that computed from CAM-chem outputs. The kappa from AMS and SP2 is approximately twice (100 % larger than) the kappa from f(RH), probably due to more than just particle size differences. Based on Mie theory and studies comparing f(RH) of PM1 and PM10 particles (Zieger et al., 2013; Titos et al., 2021), CAMP2Ex f(RH) would be larger if it were measuring just submicrometer particles due to the increased scattering efficiency for accumulation-mode particles compared to coarse particles. Although, based on Fig. 3 of Titos et al. (2021), the difference in f(RH) in marine sites would only be ∼0.1 (given median observed SAE), and that would translate to a ∼20 % to 40 % increase in kappa. Thus, although size plays a role, composition also contributes to the difference in the calculated kappa values between observations and the model. Examples of past studies in the region with low kappa values suggest that both the size and the compositional effect together are important. Lab experiments of tropical peat burning showed that smaller (70 nm) primary organic particles (POAs) became more oxidized faster compared to larger particles (dry diameter = 150 nm), and kappa for oxidized POAs (dry diameter = 100 nm) was 0.16 (Chen et al., 2022). Ground measurements of aerosol particles (dry diameter ∼ 56–100 nm) in Quezon City in the Philippines, which were dominated by elemental carbon, yielded kappa values less than 0.10 (AzadiAghdam et al., 2019).
The over- and underrepresented mass of sulfates and organics, respectively (Fig. 13b), by the model may be causing the higher kappa in the model. Based on the discussion in Sect. 3.1.2 on air masses coming from East Asia (Fig. 4c), as is the case for this event, an organic mass fraction that is lower by half can increase the f(RH) (f(RH = (−0.81 × organic mass fraction) + 1.56)) and therefore the derived kappa by ∼70 %. Organics, especially secondary organic aerosols, have been underpredicted by CAM-chem in urban and urban outflow regions (Schwantes et al., 2022). This is consistent with the observations for this case, which is influenced by urban outflow from East Asia and thus affects the calculated kappa from the model. CO (Fig. S1) is also underrepresented by the model, potentially due to emissions inventories (Hua et al., 2024).
For the case of shallow convection, the shape of the vertical profile of the CAM-chem model output total mass concentration is similar to the observed total mass concentration profile (Fig. 13f), though it underestimates the observed total concentration by approximately 2 to 4.5 µg m−3 below 1 km altitude and then overestimates concentrations by approximately 0.5 to 2 µg m−3 above 1 km. This is due to the model underestimating organics and sulfate close to the surface, while sulfate is overestimated above 1 km (Fig. S1b). The effect of this is seen in the model-derived kappa, which is, like the previous case, higher than the calculated kappa from observations, though to a lesser degree (Fig. 13g). Unlike the case of the tropical-cyclone-induced convection, the modeled kappa is relatively unchanging in shape compared to the kappa derived from observations. This is likely due to the differences in the compositional profile at the higher altitudes, even if the total mass is similar. The model is not able to represent the increase and decrease in organic mass fraction from 3.5 to 4.5 km (Fig. 13h) and dominance of sulfate above 4.5 km. At those altitudes the observations become dominated by sulfate, ammonium, and nitrate (Fig. 13h), even with losses due to scavenging and activation as shown by decreased aerosol mass with altitude, probably due to the in-cloud production of sulfate as discussed in Sect. 3.2.2. The mass fraction profiles from the model (Fig. 13i and j) appear to have a steadily decreasing (increasing) organic and sea salt (sulfate and dust) mass fraction with height. This case is a smaller-scale event with smaller surface winds associated with it (Fig. 12c) compared to the tropical cyclone case (Fig. 12b). With weak forcing, it is likely that the CAM cumulus parameterizations does not predict the convection observed in the shallow convection case affecting modeled aerosol mass vertical distribution and, consequently, kappa in both the uniform ∼111 global model and the regionally refined simulations. This is similar to a model evaluation study (i.e., GEOS and GOCART) of CAMP2Ex aerosol extinction data, which recommended an improvement of shallow convection schemes to improve the representation of vertical transport (Collow et al., 2022). In fact, the CO increase above 5 km, which we used to identify convection, is not captured by CAM-chem (Fig. S2). What is consistent though is that for both the observations and the model output of this shallow convection case, the relative magnitude of the model kappa is lower than that of the tropical cyclone case.
This study reports on low PM5 (Dp<5 µm) aerosol hygroscopicity measured during CAMP2Ex 2019 in Southeast Asia due to organics from biomass burning. Aging and vertical transport changes the hygroscopicity of particles affecting clouds in the region. Comparisons with a global atmospheric chemistry model reveal discrepancies between observed and modeled aerosol concentrations and hygroscopicity, emphasizing the need to improve emissions inventories and shallow cloud parameterizations. Notable results of this work, following the study goals raised at the end of Sect. 1, are as follows.
The generally low median f(RH) (1.24 with Q1 and Q3 of 1.05 and 1.43, respectively) of aerosol particles (Dp<5 µm) in Southeast Asia during the CAMP2Ex campaign from 24 August to 5 October 2019 is linked to the dominating regional effect of biomass burning from the Maritime Continent. Measurements of f(RH) in other polluted marine environments around the world for PM10 (Dp<10 µm) and PM1 (Dp<1 µm) particles have higher ranges (median of ∼1.7–2.0) of f(RH) values (Titos et al., 2021). The median f(RH) values of air masses from the Maritime Continent were exceptionally low (1.05 with Q1 and Q3 of 0.94 and 1.20, respectively) for polluted marine environments and are more similar to those with biomass burning (Gomez et al., 2018). The air masses with the highest f(RH) from CAMP2Ex are generally from the West Pacific, in the northernmost regions of the Philippines and farthest away from the Maritime Continent. Their median f(RH) (1.49 with Q1 and Q3 of 1.26 and 1.73, respectively) is also lower than what has been associated with typical polluted marine environments.
Throughout CAMP2Ex, submicrometer organic matter is the main aerosol component associated with biomass burning and the low f(RH) values. Organics are a major feature of total aerosol mass, especially in air masses traced back to the Maritime Continent. Biomass burning smoke is spread out in the region increasing AOD downwind of the MC (Fig. 2 in Reid et al., 2023) and is corroborated by cases of sub-1 f(RH) and submicrometer reflective particles with elevated organic mass fractions that are present in all the air masses. Based on clustering analysis using optical properties, the majority of the particles sampled during the campaign appear to be a mixture of both organic and elemental carbon. Organics dominate in terms of mass fraction due to the smoldering-type burning in peat fire (Reid et al., 2023) from the Maritime Continent, which is known to produce more organics than elemental carbon (Reid et al., 2005). This is consistent with what Miller et al. (2023) observed where the highest median levels of organic and elemental carbon mass during CAMP2Ex were due to biomass burning from the Maritime Continent. Without organics, the baseline f(RH) (1.38–1.55, Fig. 4) is still lower than measurements from other areas (i.e., ∼1.8 from the Yangtze River Delta in China and from INDOEX over the Indian Ocean; 2.19 from SEAC4RS in and around the US; ∼2.6 from ICARTT over North America and Europe; ∼3 from ACE-ASIA over the Yellow Sea and Sea of Japan; and ∼3.5 from Melpitz, Germany) (Zhang et al., 2015; Quinn et al., 2005; Shingler et al., 2016a; Zieger et al., 2014) probably due to the presence of elemental carbon, which is the second most dominant aerosol type during the campaign. The unique relationship between organic matter and hygroscopicity in the CAMP2Ex region is important information that can help in model evaluations (Burgos et al., 2020).
Farther away from the Maritime Continent, the organic particles have aged and become more oxidized as they interacted with the other air masses. The West Pacific is a remote region in the northern Philippines and is downwind of biomass burning from MC, resulting in a combined marine and polluted aerosol. The oldest biomass burning aerosols were observed there. The organic oxidation values of the aerosol particles in the air mass from the West Pacific are close to the threshold of maximum oxidation that has been observed in previous studies (Cubison et al., 2011). Vertical transport decreases and increases hygroscopicity at cloud level with increased organic and sulfate mass fractions, respectively, in the West Pacific. These aerosol constituents are thought to be transported from the MC and the Philippines and their surrounding oceans, where natural and industrial sources are significant (Miller et al., 2023), and then cloud processed.
Evaluation of the global chemical transport CAM-chem model at two output grids (∼111 and 25 km) against two convective cases from CAMP2Ex show the underrepresentation of organics in general and a higher derived aerosol hygroscopicity (kappa), which may be linked to the possible overestimation of aerosol hygroscopicity from biomass burning based on studies of aerosol optical depth and extinction in the area (Collow et al., 2022; Edwards et al., 2022). CAM-chem overestimates sulfate in the tropical-cyclone-induced convection case, consistent with results from an assessment of the NAAPS reanalysis product on the positive bias of sulfate from East Asia (Edwards et al., 2022). The vertical representation of the aerosol composition for the larger-scale convection case due to a tropical cyclone is better than that for the shallow convection case. Cloud processing and increased hygroscopicity are not captured by the model for the shallow convection case, irrespective of model grid size. The representation of shallow convection in the area by global models remains challenging, based on other model evaluation studies (Collow et al., 2022). Past studies on biomass burning aerosol effects on convection in Southeast Asia using a cloud-scale model emphasized the importance of aerosol composition and absorptive properties, as well as their effect on atmospheric stability, in the understanding of aerosol–cloud interactions (Hodzic and Duvel, 2018). It is thus ideal that cloud-scale models be evaluated using the dataset from CAMP2Ex, where the invigoration of shallow clouds has been observed (Reid et al., 2023).
The implications of the low aerosol hygroscopicity in the region and its effects on clouds and climate are just beginning to be unraveled. The mixing and aging of organic and elemental carbon from biomass burning smoke in the Maritime Continent with background and transported sources influences hygroscopicity observations and modeling uncertainties and can be the topic of future work. Improvements in harmonization in terms of aerosol particle sizes and composition, along with updated emissions inventories, will be helpful moving forward both for the observations and modeling of aerosol hygroscopicity. These suggestions can hopefully improve shallow cumulus representation, which is still the biggest source of differences in model sensitivity in the understanding of climate change (Bony and Dufresne, 2005), in the region and globally. Emerging endeavors to implement higher-resolution schemes in a large domain (Pfister et al., 2020; Radtke et al., 2021) to capture both fine-scale aerosol–cloud processes along with improved observations in Southeast Asia hold promise.
CAMP2Ex data archived per research flight and parameter type can be found at https://doi.org/10.5067/Airborne/CAMP2Ex_Aerosol (P-3 In-Situ Aerosol Data) (NASA/LARC/SD/ASDC, 2020b), https://doi.org/10.5067/Airborne/CAMP2Ex_Cloud (P-3 In-Situ Cloud Data) (NASA/LARC/SD/ASDC, 2020c), https://doi.org/10.5067/Airborne/CAMP2Ex_MetNav (P-3 In-Situ Meteorological and Navigational Data) (NASA/LARC/SD/ASDC, 2020d), and https://doi.org/10.5067/Airborne/CAMP2Ex_TraceGas (P-3 In-Situ Trace Gas Data) (NASA/LARC/SD/ASDC, 2020a). CAM-chem model outputs can be found at https://doi.org/10.6084/m9.figshare.26755936.v1 (Tilmes and Zhang, 2024).
The supplement related to this article is available online at https://doi.org/10.5194/acp-25-5469-2025-supplement.
LDZ, ECC, JPDG, GSD, RF, MRAH, MS, JW, QX, and AS carried out various aspects of the data collection. ST and JZ conducted the CAM-chem model simulations. GRL, LDZ, AFA, MB, ECC, RF, MRAH, MS, JW, QX, and AS performed analysis and interpretation of the data. GRL and AS prepared the manuscript with contributions from the coauthors.
At least one of the (co-)authors is a member of the editorial board of Atmospheric Chemistry and Physics. The peer-review process was guided by an independent editor, and the authors also have no other competing interests to declare.
Publisher's note: Copernicus Publications remains neutral with regard to jurisdictional claims made in the text, published maps, institutional affiliations, or any other geographical representation in this paper. While Copernicus Publications makes every effort to include appropriate place names, the final responsibility lies with the authors.
This article is part of the special issue “Cloud, Aerosol and Monsoon Processes Philippines Experiment (CAMP2Ex) (ACP/AMT inter-journal SI)”. It is not associated with a conference.
The authors gratefully acknowledge the NOAA Air Resources Laboratory (ARL) for the provision of the HYSPLIT transport and dispersion model and READY website (https://www.ready.noaa.gov, last access: 31 January 2024) used in this publication. The NSF National Center for Atmospheric Research is a major facility sponsored by the US National Science Foundation under cooperative agreement no. 1852977.
This research has been supported by the National Aeronautics and Space Administration (grant no. 80NSSC18K0148) and the Office of Naval Research (grant no. N00014-21-1-2115).
This paper was edited by Paul Zieger and reviewed by two anonymous referees.
Adam, M. G., Tran, P. T., Bolan, N., and Balasubramanian, R.: Biomass burning-derived airborne particulate matter in Southeast Asia: A critical review, J. Hazard. Mater., 407, 124760, https://doi.org/10.1016/j.jhazmat.2020.124760, 2021.
Amnuaylojaroen, T.: Air Pollution Modeling in Southeast Asia – An Overview, in: Vegetation Fires and Pollution in Asia, edited by: Vadrevu, K. P., Ohara, T., and Justice, C., Springer, Cham, Switzerland, 531–544, https://doi.org/10.1007/978-3-031-29916-2_31, 2023.
Anderson, T. L. and Ogren, J. A.: Determining aerosol radiative properties using the TSI 3563 integrating nephelometer, Aerosol Sci. Tech., 29, 57–69, https://doi.org/10.1080/02786829808965551, 1998.
Ångström, A.: On the atmospheric transmission of sun radiation and on dust in the air, Geografiska Ann., 11, 156–166, https://doi.org/10.1080/20014422.1929.11880498, 1929.
Attwood, A., Washenfelder, R., Brock, C., Hu, W., Baumann, K., Campuzano-Jost, P., Day, D., Edgerton, E., Murphy, D., and Palm, B.: Trends in sulfate and organic aerosol mass in the Southeast US: Impact on aerosol optical depth and radiative forcing, Geophys. Res. Lett., 41, 7701–7709, https://doi.org/10.1002/2014GL061669, 2014.
AzadiAghdam, M., Braun, R. A., Edwards, E.-L., Bañaga, P. A., Cruz, M. T., Betito, G., Cambaliza, M. O., Dadashazar, H., Lorenzo, G. R., and Ma, L.: On the nature of sea salt aerosol at a coastal megacity: Insights from Manila, Philippines in Southeast Asia, Atmos. Environ., 216, 116922, https://doi.org/10.1016/j.atmosenv.2019.116922, 2019.
Barth, M., Rasch, P., Kiehl, J., Benkovitz, C., and Schwartz, S.: Sulfur chemistry in the National Center for Atmospheric Research Community Climate Model: Description, evaluation, features, and sensitivity to aqueous chemistry, J. Geophys. Res.-Atmos., 105, 1387–1415, https://doi.org/10.1029/1999JD900773, 2000.
Baynard, T., Garland, R., Ravishankara, A., Tolbert, M., and Lovejoy, E.: Key factors influencing the relative humidity dependence of aerosol light scattering, Geophysical. Res. Lett., 33, L06813, https://doi.org/10.1029/2005GL024898, 2006.
Bergstrom, R. W., Pilewskie, P., Russell, P. B., Redemann, J., Bond, T. C., Quinn, P. K., and Sierau, B.: Spectral absorption properties of atmospheric aerosols, Atmos. Chem. Phys., 7, 5937–5943, https://doi.org/10.5194/acp-7-5937-2007, 2007.
Bony, S. and Dufresne, J. L.: Marine boundary layer clouds at the heart of tropical cloud feedback uncertainties in climate models, Geophys. Res. Lett., 32, L20806, https://doi.org/10.1029/2005GL023851, 2005.
Brock, C. A., Wagner, N. L., Anderson, B. E., Attwood, A. R., Beyersdorf, A., Campuzano-Jost, P., Carlton, A. G., Day, D. A., Diskin, G. S., and Gordon, T. D.: Aerosol optical properties in the southeastern United States in summer – Part 1: Hygroscopic growth, Atmos. Chem. Phys., 16, 4987–5007, https://doi.org/10.5194/acp-16-4987-2016, 2016.
Brooks, S. D., Wise, M. E., Cushing, M., and Tolbert, M. A.: Deliquescence behavior of organic/ammonium sulfate aerosol, Geophys. Res. Lett., 29, 1917, https://doi.org/10.1029/2002GL014733, 2002.
Burgos, M. A., Andrews, E., Titos, G., Alados-Arboledas, L., Baltensperger, U., Day, D., Jefferson, A., Kalivitis, N., Mihalopoulos, N., and Sherman, J.: A global view on the effect of water uptake on aerosol particle light scattering, Sci. Data, 6, 1–19, https://doi.org/10.1038/s41597-019-0158-7, 2019.
Burgos, M. A., Andrews, E., Titos, G., Benedetti, A., Bian, H., Buchard, V., Curci, G., Kipling, Z., Kirkevåg, A., and Kokkola, H.: A global model–measurement evaluation of particle light scattering coefficients at elevated relative humidity, Atmos. Chem. Phys., 20, 10231–10258, https://doi.org/10.5194/acp-20-10231-2020, 2020.
Cazorla, A., Bahadur, R., Suski, K., Cahill, J. F., Chand, D., Schmid, B., Ramanathan, V., and Prather, K.: Relating aerosol absorption due to soot, organic carbon, and dust to emission sources determined from in-situ chemical measurements, Atmos. Chem. Phys., 13, 9337–9350, https://doi.org/10.5194/acp-13-9337-2013, 2013.
Chandra, A. S., Zhang, C., Klein, S. A., and Ma, H. Y.: Low-cloud characteristics over the tropical western Pacific from ARM observations and CAM5 simulations, J. Geophys. Res.-Atmos., 120, 8953–8970, https://doi.org/10.1002/2015JD023369, 2015.
Che, H., Segal-Rozenhaimer, M., Zhang, L., Dang, C., Zuidema, P., Dobracki, A., Sedlacek III, A. J., Coe, H., Wu, H., and Taylor, J.: Cloud processing and weeklong ageing affect biomass burning aerosol properties over the south-eastern Atlantic, Commun. Earth Environ., 3, 182, https://doi.org/10.1038/s43247-022-00517-3, 2022.
Chen, J., Zhao, C., Ma, N., and Yan, P.: Aerosol hygroscopicity parameter derived from the light scattering enhancement factor measurements in the North China Plain, Atmos. Chem. Phys., 14, 8105–8118, https://doi.org/10.5194/acp-14-8105-2014, 2014.
Chen, J., Budisulistiorini, S. H., Itoh, M., and Kuwata, M.: Roles of relative humidity and particle size on chemical aging of tropical peatland burning particles: Potential influence of phase state and implications for hygroscopic property, J. Geophys. Res.-Atmos., 127, e2022JD036871, https://doi.org/10.5194/acp-22-13219-2022, 2022.
Chen, Q., McGowan, S., Gouramanis, C., Fong, L., Balasubramanian, R., and Taylor, D.: Rapidly rising transboundary atmospheric pollution from industrial and urban sources in Southeast Asia and its implications for regional sustainable development, Environ. Res. Lett., 15, 1040a1045, https://doi.org/10.1088/1748-9326/abb5ce, 2020.
Collow, A. B. M., Buchard, V., Colarco, P. R., da Silva, A. M., Govindaraju, R., Nowottnick, E. P., Burton, S., Ferrare, R., Hostetler, C., and Ziemba, L.: An evaluation of biomass burning aerosol mass, extinction, and size distribution in GEOS using observations from CAMP2Ex, Atmos. Chem. Phys., 22, 16091–16109, https://doi.org/10.5194/acp-22-16091-2022, 2022.
Covert, D. S., Charlson, R., and Ahlquist, N.: A study of the relationship of chemical composition and humidity to light scattering by aerosols, J. Appl. Meteorol., 11, 968–976, https://doi.org/10.1175/1520-0450(1972)011<0968:ASOTRO>2.0.CO;2, 1972.
Crosbie, E., Shook, M. A., Ziemba, L. D., Anderson, B. E., Braun, R. A., Brown, M. D., Jordan, C. E., MacDonald, A. B., Moore, R. H., and Nowak, J. B.: Coupling an online ion conductivity measurement with the particle-into-liquid sampler: Evaluation and modeling using laboratory and field aerosol data, Aerosol Sci. Tech., 54, 1542–1555, https://doi.org/10.1080/02786826.2020.179549, 2020.
Crosbie, E., Ziemba, L. D., Shook, M. A., Robinson, C. E., Winstead, E. L., Thornhill, K. L., Braun, R. A., MacDonald, A. B., Stahl, C., and Sorooshian, A.: Measurement report: Closure analysis of aerosol–cloud composition in tropical maritime warm convection, Atmos. Chem. Phys., 22, 13269–13302, https://doi.org/10.5194/acp-22-13269-2022, 2022.
Crumeyrolle, S., Gomes, L., Tulet, P., Matsuki, A., Schwarzenboeck, A., and Crahan, K.: Increase of the aerosol hygroscopicity by cloud processing in a mesoscale convective system: a case study from the AMMA campaign, Atmos. Chem. Phys., 8, 6907–6924, https://doi.org/10.5194/acp-8-6907-2008, 2008.
Cruz, M. T., Bañaga, P. A., Betito, G., Braun, R. A., Stahl, C., Aghdam, M. A., Cambaliza, M. O., Dadashazar, H., Hilario, M. R., Lorenzo, G. R., Ma, L., MacDonald, A. B., Pabroa, C., Yee, J. R., Simpas, J. B., and Sorooshian, A.: Size-resolved composition and morphology of particulate matter during the southwest monsoon in Metro Manila, Philippines, Atmos. Chem. Phys., 19, 10675–10696, https://doi.org/10.5194/acp-19-10675-2019, 2019.
Cubison, M., Ortega, A., Hayes, P., Farmer, D., Day, D., Lechner, M., Brune, W., Apel, E., Diskin, G., and Fisher, J.: Effects of aging on organic aerosol from open biomass burning smoke in aircraft and laboratory studies, Atmos. Chem. Phys., 11, 12049–12064, https://doi.org/10.5194/acp-11-12049-2011, 2011.
Dadashazar, H., Corral, A. F., Crosbie, E., Dmitrovic, S., Kirschler, S., McCauley, K., Moore, R., Robinson, C., Schlosser, J. S., and Shook, M.: Organic enrichment in droplet residual particles relative to out of cloud over the northwestern Atlantic: analysis of airborne ACTIVATE data, Atmos. Chem. Phys., 22, 13897–13913, https://doi.org/10.5194/acp-22-13897-2022, 2022.
DeCarlo, P., Dunlea, E., Kimmel, J., Aiken, A. C., Sueper, D., Crounse, J., Wennberg, P., Emmons, L., Shinozuka, Y., and Clarke, A.: Fast airborne aerosol size and chemistry measurements above Mexico City and Central Mexico during the MILAGRO campaign, Atmos. Chem. Phys., 8, 4027–4048, https://doi.org/10.5194/acp-8-4027-2008, 2008.
Delene, D. J. and Ogren, J. A.: Variability of aerosol optical properties at four North American surface monitoring sites, J. Atmos. Sci., 59, 1135–1150, https://doi.org/10.1175/1520-0469(2002)059<1135:VOAOPA>2.0.CO;2, 2002.
DiGangi, J. P., Choi, Y., Nowak, J. B., Halliday, H. S., Diskin, G. S., Feng, S., Barkley, Z. R., Lauvaux, T., Pal, S., and Davis, K. J.: Seasonal variability in local carbon dioxide biomass burning sources over central and eastern US using airborne in situ enhancement ratios, J. Geophys. Res.-Atmos., 126, e2020JD034525, https://doi.org/10.1029/2020JD034525, 2021.
Dockery, D. W.: Epidemiologic evidence of cardiovascular effects of particulate air pollution, Environ. Health Perspect., 109, 483–486, https://doi.org/10.1289/ehp.01109s4483, 2001.
Doherty, S. J., Quinn, P. K., Jefferson, A., Carrico, C. M., Anderson, T. L., and Hegg, D.: A comparison and summary of aerosol optical properties as observed in situ from aircraft, ship, and land during ACE-Asia, J. Geophys. Res.-Atmos., 110, D04201, https://doi.org/10.1029/2004JD004964, 2005.
Dong, X., Fu, J. S., Huang, K., Lin, N.-H., Wang, S.-H., and Yang, C.-E.: Analysis of the co-existence of long-range transport biomass burning and dust in the subtropical West Pacific Region, Sci. Rep., 8, 8962, https://doi.org/10.1038/s41598-018-27129-2, 2018.
Dubovik, O., Holben, B., Eck, T. F., Smirnov, A., Kaufman, Y. J., King, M. D., Tanré, D., and Slutsker, I.: Variability of absorption and optical properties of key aerosol types observed in worldwide locations, J. Atmos. Sci., 59, 590-608, https://doi.org/10.1175/1520-0469(2002)059<0590:VOAAOP>2.0.CO;2, 2002.
Dumka, U., Kaskaoutis, D., Sagar, R., Chen, J., Singh, N., and Tiwari, S.: First results from light scattering enhancement factor over central Indian Himalayas during GVAX campaign, Sci. Total Environ., 605, 124–138, https://doi.org/10.1016/j.scitotenv.2017.06.138, 2017.
Duplissy, J., DeCarlo, P. F., Dommen, J., Alfarra, M. R., Metzger, A., Barmpadimos, I., Prevot, A. S., Weingartner, E., Tritscher, T., and Gysel, M.: Relating hygroscopicity and composition of organic aerosol particulate matter, Atmos. Chem. Phys., 11, 1155–1165, https://doi.org/10.5194/acp-11-1155-2011, 2011.
Eck, T. F., Holben, B. N., Reid, J., Giles, D., Rivas, M., Singh, R. P., Tripathi, S., Bruegge, C., Platnick, S., and Arnold, G.: Fog-and cloud-induced aerosol modification observed by the Aerosol Robotic Network (AERONET), J. Geophys. Res.-Atmos., 117, D07206, https://doi.org/10.1029/2011JD016839, 2012.
Edwards, E.-L., Reid, J. S., Xian, P., Burton, S. P., Cook, A. L., Crosbie, E. C., Fenn, M. A., Ferrare, R. A., Freeman, S. W., and Hair, J. W.: Assessment of NAAPS-RA performance in Maritime Southeast Asia during CAMP2Ex, Atmos. Chem. Phys., 22, 12961–12983, https://doi.org/10.5194/acp-22-12961-2022, 2022.
Eldering, A., Ogren, J., Chowdhury, Z., Hughes, L. S., and Cass, G. R.: Aerosol optical properties during INDOEX based on measured aerosol particle size and composition, J. Geophys. Res.-Atmos., 107, 8001, https://doi.org/10.1029/2001JD001572, 2002.
Engelhart, G., Asa-Awuku, A., Nenes, A., and Pandis, S.: CCN activity and droplet growth kinetics of fresh and aged monoterpene secondary organic aerosol, Atmos. Chem. Phys., 8, 3937–3949, https://doi.org/10.5194/acp-8-3937-2008, 2008.
Faloona, I.: Sulfur processing in the marine atmospheric boundary layer: A review and critical assessment of modeling uncertainties, Atmos. Environ., 43, 2841-2854, https://doi.org/10.1016/j.atmosenv.2009.02.043, 2009.
Fan, X., Liu, J., Zhang, F., Chen, L., Collins, D., Xu, W., Jin, X., Ren, J., Wang, Y., and Wu, H.: Contrasting size-resolved hygroscopicity of fine particles derived by HTDMA and HR-ToF-AMS measurements between summer and winter in Beijing: the impacts of aerosol aging and local emissions, Atmos. Chem. Phys., 20, 915–929, https://doi.org/10.5194/acp-20-915-2020, 2020.
Ferrare, R., Melfi, S., Whiteman, D., Evans, K., Poellot, M., and Kaufman, Y.: Raman lidar measurements of aerosol extinction and backscattering: 2. Derivation of aerosol real refractive index, single-scattering albedo, and humidification factor using Raman lidar and aircraft size distribution measurements, J. Geophys. Res.-Atmos., 103, 19673–19689, https://doi.org/10.1029/98JD01647, 1998.
Ferrare, R., Hair, J., Hostetler, C., Shingler, T., Burton, S. P., Fenn, M., Clayton, M., Scarino, A. J., Harper, D., and Seaman, S.: Airborne HSRL-2 measurements of elevated aerosol depolarization associated with non-spherical sea salt, Front. Remote Sens., 4, 1143944, https://doi.org/10.3389/frsen.2023.1143944, 2023.
Garland, R. M., Ravishankara, A., Lovejoy, E. R., Tolbert, M. A., and Baynard, T.: Parameterization for the relative humidity dependence of light extinction: Organic-ammonium sulfate aerosol, J. Geophys. Res.-Atmos., 112, D19303, https://doi.org/10.1029/2006JD008179, 2007.
Garofalo, L. A., Pothier, M. A., Levin, E. J., Campos, T., Kreidenweis, S. M., and Farmer, D. K.: Emission and evolution of submicron organic aerosol in smoke from wildfires in the western United States, ACS Earth Space Chem., 3, 1237–1247, https://doi.org/10.1021/acsearthspacechem.9b00125, 2019.
Gasparini, R., Collins, D. R., Andrews, E., Sheridan, P. J., Ogren, J. A., and Hudson, J. G.: Coupling aerosol size distributions and size-resolved hygroscopicity to predict humidity-dependent optical properties and cloud condensation nuclei spectra, J. Geophys. Res.-Atmos., 111, D05S13, https://doi.org/10.1029/2005JD006092, 2006.
Gogoi, M. M., Babu, S. S., Jayachandran, V., Moorthy, K. K., Satheesh, S., Naja, M., and Kotamarthi, V.: Optical properties and CCN activity of aerosols in a high-altitude Himalayan environment: Results from RAWEX-GVAX, J. Geophys. Res.-Atmos., 120, 2453–2469, https://doi.org/10.1002/2014JD022966, 2015.
Gomez, S. L., Carrico, C., Allen, C., Lam, J., Dabli, S., Sullivan, A., Aiken, A. C., Rahn, T., Romonosky, D., and Chylek, P.: Southwestern US biomass burning smoke hygroscopicity: The role of plant phenology, chemical composition, and combustion properties, J. Geophys. Res.- Atmos., 123, 5416–5432, https://doi.org/10.1029/2017JD028162, 2018.
Hänel, G.: The properties of atmospheric aerosol particles as functions of the relative humidity at thermodynamic equilibrium with the surrounding moist air, in: Advances in geophysics, Elsevier, 73–188, https://doi.org/10.1016/S0065-2687(08)60142-9, 1976.
Hegg, D., Larson, T., and Yuen, P. F.: A theoretical study of the effect of relative humidity on light scattering by tropospheric aerosols, J. Geophys. Res.-Atmos., 98, 18435–18439, https://doi.org/10.1029/93JD01928, 1993.
Hilario, M. R. A., Crosbie, E., Shook, M., Reid, J. S., Cambaliza, M. O. L., Simpas, J. B. B., Ziemba, L., DiGangi, J. P., Diskin, G. S., and Nguyen, P.: Measurement report: Long-range transport patterns into the tropical northwest Pacific during the CAMP2Ex aircraft campaign: chemical composition, size distributions, and the impact of convection, Atmos. Chem. Phys., 21, 3777–3802, https://doi.org/10.5194/acp-21-3777-2021, 2021.
Hilario, M. R. A., Barth, M., Bennett, R., Crosbie, E., DiGangi, J. P., Diskin, G. S., Lorenzo, G. R., Rutledge, S., Martin, M. Y., and Ziemba, L.: Quantifying scavenging efficiencies of different aerosol species and size-resolved volume concentrations in tropical convective clouds over the West Pacific, J. Atmos. Sci., 82, 267–282, https://doi.org/10.1175/JAS-D-24-0064.1, 2025.
Hodzic, A. and Duvel, J. P.: Impact of biomass burning aerosols on the diurnal cycle of convective clouds and precipitation over a tropical island, J. Geophys. Res.-Atmos., 123, 1017–1036, https://doi.org/10.1002/2017JD027521, 2018.
Hong, Y. and Di Girolamo, L.: Cloud phase characteristics over Southeast Asia from A-Train satellite observations, Atmos. Chem. Phys., 20, 8267–8291, https://doi.org/10.5194/acp-20-8267-2020, 2020.
Höpner, F., Bender, F. M., Ekman, A. M., Andersson, A., Gustafsson, Ö., and Leck, C.: Investigation of two optical methods for aerosol-type classification extended to a Northern Indian Ocean site, J. Geophys. Res.-Atmos., 124, 8743–8763, https://doi.org/10.1029/2018JD029685, 2019.
Hua, W., Lou, S., Huang, X., Xue, L., Ding, K., Wang, Z., and Ding, A.: Diagnosing uncertainties in global biomass burning emission inventories and their impact on modeled air pollutants, Atmos. Chem. Phys., 24, 6787–6807, https://doi.org/10.5194/acp-24-6787-2024, 2024.
Kalberer, M.: Aerosol physics and chemistry, Encyclop. Atmos. Sci., 1, 23–31, https://doi.org/10.1016/B978-0-12-382225-3.00049-9, 2014.
Kar, J., Bremer, H., Drummond, J. R., Rochon, Y. J., Jones, D. B., Nichitiu, F., Zou, J., Liu, J., Gille, J. C., and Edwards, D. P.: Evidence of vertical transport of carbon monoxide from Measurements of Pollution in the Troposphere (MOPITT), Geophys. Res. Lett., 31, L23105, https://doi.org/10.1029/2004GL021128, 2004.
Kavouras, I. G., Nikolich, G., Etyemezian, V., DuBois, D. W., King, J., and Shafer, D.: In situ observations of soil minerals and organic matter in the early phases of prescribed fires, J. Geophys. Res.Atmos., 117, D12313, https://doi.org/10.1029/2011JD017420, 2012.
Knollenberg, R. G.: Techniques for probing cloud microstructure, in: Clouds, their formation, Optical properties, and Effects, edited by: Hobbs, P. V., Deepak, A., Academic Press, 15–91, https://doi.org/10.1016/B978-0-12-350720-4.50007-7, 1981.
Köhler, H.: The nucleus in and the growth of hygroscopic droplets, Trans. Faraday Soc., 32, 1152–1161, 1936.
Kreidenweis, S. and Asa-Awuku, A.: Aerosol Hygroscopicity: Particle water content and its role in atmospheric processes, in: Treatise on Geochemistry, 2nd Edn., edited by: Holland, H. D. and Turekian, K. K., Elsevier, https://doi.org/10.1016/B978-0-08-095975-7.00418-6, 2014.
Kuang, Y., Zhao, C., Tao, J., Bian, Y., Ma, N., and Zhao, G.: A novel method for deriving the aerosol hygroscopicity parameter based only on measurements from a humidified nephelometer system, Atmos. Chem. Phys., 17, 6651–6662, https://doi.org/10.5194/acp-17-6651-2017, 2017.
Kuang, Y., He, Y., Xu, W., Zhao, P., Cheng, Y., Zhao, G., Tao, J., Ma, N., Su, H., and Zhang, Y.: Distinct diurnal variation in organic aerosol hygroscopicity and its relationship with oxygenated organic aerosol, Atmos. Chem. Phys., 20, 865–880, https://doi.org/10.5194/acp-20-865-2020, 2020.
Kulkarni, P. and Wang, J.: New fast integrated mobility spectrometer for real-time measurement of aerosol size distribution: II. Design, calibration, and performance characterization, J. Aerosol Sci., 37, 1326–1339, https://doi.org/10.1016/j.jaerosci.2006.01.010, 2006.
Lacagnina, C., Hasekamp, O. P., Bian, H., Curci, G., Myhre, G., van Noije, T., Schulz, M., Skeie, R. B., Takemura, T., and Zhang, K.: Aerosol single-scattering albedo over the global oceans: Comparing PARASOL retrievals with AERONET, OMI, and AeroCom models estimates, J. Geophys. Res.-Atmos., 120, 9814–9836, https://doi.org/10.1002/2015JD023501, 2015.
Lawson, P., Gurganus, C., Woods, S., and Bruintjes, R.: Aircraft observations of cumulus microphysics ranging from the tropics to midlatitudes: Implications for a “new” secondary ice process, J. Atmos. Sci., 74, 2899–2920, https://doi.org/10.1175/JAS-D-17-0033.1, 2017.
Lawson, R. P., O'Connor, D., Zmarzly, P., Weaver, K., Baker, B., Mo, Q., and Jonsson, H.: The 2D-S (stereo) probe: Design and preliminary tests of a new airborne, high-speed, high-resolution particle imaging probe, J. Atmos. Ocean. Tech., 23, 1462–1477, https://doi.org/10.1175/JTECH1927.1, 2006.
Lee, H.-H., Iraqui, O., Gu, Y., Yim, S. H.-L., Chulakadabba, A., Tonks, A. Y.-M., Yang, Z., and Wang, C.: Impacts of air pollutants from fire and non-fire emissions on the regional air quality in Southeast Asia, Atmos. Chem. Phys., 18, 6141–6156, https://doi.org/10.5194/acp-18-6141-2018, 2018.
Li, G., Bei, N., Cao, J., Huang, R., Wu, J., Feng, T., Wang, Y., Liu, S., Zhang, Q., and Tie, X.: A possible pathway for rapid growth of sulfate during haze days in China, Atmos. Chem. Phys., 17, 3301–3316, https://doi.org/10.5194/acp-17-3301-2017, 2017.
Liu, H., Zhao, C., Nekat, B., Ma, N., Wiedensohler, A., Van Pinxteren, D., Spindler, G., Müller, K., and Herrmann, H.: Aerosol hygroscopicity derived from size-segregated chemical composition and its parameterization in the North China Plain, Atmos. Chem. Phys., 14, 2525–2539, https://doi.org/10.5194/acp-14-2525-2014, 2014.
Liu, J. and Li, Z.: Significant underestimation in the optically based estimation of the aerosol first indirect effect induced by the aerosol swelling effect, Geophys. Res. Lett., 45, 5690–5699, https://doi.org/10.1029/2018GL077679, 2018.
Liu, X., Ma, P.-L., Wang, H., Tilmes, S., Singh, B., Easter, R., Ghan, S., and Rasch, P.: Description and evaluation of a new four-mode version of the Modal Aerosol Module (MAM4) within version 5.3 of the Community Atmosphere Model, Geosci. Model Dev., 9, 505–522, https://doi.org/10.5194/gmd-9-505-2016, 2016.
Lorenzo, G. R., Arellano, A. F., Cambaliza, M. O., Castro, C., Cruz, M. T., Di Girolamo, L., Gacal, G. F., Hilario, M. R. A., Lagrosas, N., Ong, H. J., Simpas, J. B., Uy, S. N., and Sorooshian, A.: An emerging aerosol climatology via remote sensing over Metro Manila, the Philippines, Atmos. Chem. Phys., 23, 10579–10608, https://doi.org/10.5194/acp-23-10579-2023, 2023.
Malm, W. C. and Day, D. E.: Estimates of aerosol species scattering characteristics as a function of relative humidity, Atmos. Environ., 35, 2845–2860, https://doi.org/10.1016/S1352-2310(01)00077-2, 2001.
Mason, B., Wagner, N., Adler, G., Andrews, E., Brock, C., Gordon, T., Lack, D., Perring, A., Richardson, M., and Schwarz, J.: An intercomparison of aerosol absorption measurements conducted during the SEAC4RS campaign, Aerosol Sci. Tech., 52, 1012–1027, https://doi.org/10.1080/02786826.2018.1500012, 2018.
Maudlin, L., Wang, Z., Jonsson, H., and Sorooshian, A.: Impact of wildfires on size-resolved aerosol composition at a coastal California site, Atmos. Environ., 119, 59–68, https://doi.org/10.1016/j.atmosenv.2015.08.039, 2015.
McNaughton, C. S., Clarke, A. D., Howell, S. G., Pinkerton, M., Anderson, B., Thornhill, L., Hudgins, C., Winstead, E., Dibb, J. E., and Scheuer, E.: Results from the DC-8 Inlet Characterization Experiment (DICE): Airborne versus surface sampling of mineral dust and sea salt aerosols, Aerosol Sci. Tech., 41, 136–159, https://doi.org/10.1080/02786820601118406, 2007.
Miller, R. M., Rauber, R. M., Di Girolamo, L., Rilloraza, M., Fu, D., McFarquhar, G. M., Nesbitt, S. W., Ziemba, L. D., Woods, S., and Thornhill, K. L.: Influence of natural and anthropogenic aerosols on cloud base droplet size distributions in clouds over the South China Sea and West Pacific, Atmos. Chem. Phys., 23, 8959–8977, https://doi.org/10.5194/acp-23-8959-2023, 2023.
Mochida, M., Kuwata, M., Miyakawa, T., Takegawa, N., Kawamura, K., and Kondo, Y.: Relationship between hygroscopicity and cloud condensation nuclei activity for urban aerosols in Tokyo, J. Geophys. Res.-Atmos., 111, D23204, https://doi.org/10.1029/2005JD006980, 2006.
Moore, R. H., Wiggins, E. B., Ahern, A. T., Zimmerman, S., Montgomery, L., Campuzano Jost, P., Robinson, C. E., Ziemba, L. D., Winstead, E. L., and Anderson, B. E.: Sizing response of the Ultra-High Sensitivity Aerosol Spectrometer (UHSAS) and Laser Aerosol Spectrometer (LAS) to changes in submicron aerosol composition and refractive index, Atmos. Meas. Tech., 14, 4517–4542, https://doi.org/10.5194/amt-14-4517-2021, 2021.
Moosmüller, H. and Sorensen, C.: Small and large particle limits of single scattering albedo for homogeneous, spherical particles, J. Quant. Spectrosc. Ra., 204, 250–255, https://doi.org/10.1016/j.jqsrt.2017.09.029, 2018.
Nakajima, T., Higurashi, A., Takeuchi, N., and Herman, J. R.: Satellite and ground-based study of optical properties of 1997 Indonesian forest fire aerosols, Geophys. Res. Lett., 26, 2421–2424, https://doi.org/10.1029/1999GL900208, 1999.
NASA: Smoke Blankets Borneo, in: Earth Observatory Image of the Day for September 18, 2019, https://earthobservatory.nasa.gov/images/145614/smoke-blankets-borneo (last access: 23 May 2025), 2019.
NASA/LARC/SD/ASDC: CAMP2Ex P-3 In-Situ Trace Gas Data, NASA Langley Atmospheric Science Data Center DAAC [data set], https://doi.org/10.5067/Airborne/CAMP2Ex_TraceGas, 2020a.
NASA/LARC/SD/ASDC: CAMP2Ex P-3 In-Situ Aerosol Data, NASA Langley Atmospheric Science Data Center DAAC [data set], https://doi.org/10.5067/Airborne/CAMP2Ex_Aerosol, 2020b.
NASA/LARC/SD/ASDC: CAMP2Ex P-3 In-Situ Cloud Data, NASA Langley Atmospheric Science Data Center DAAC [data set], https://doi.org/10.5067/Airborne/CAMP2Ex_Cloud, 2020c.
NASA/LARC/SD/ASDC: CAMP2Ex P-3 In-Situ Meteorological and Navigational Data, NASA Langley Atmospheric Science Data Center DAAC [data set], https://doi.org/10.5067/Airborne/CAMP2Ex_MetNav, 2020d.
Oanh, N. K., Upadhyay, N., Zhuang, Y.-H., Hao, Z.-P., Murthy, D., Lestari, P., Villarin, J., Chengchua, K., Co, H., and Dung, N.: Particulate air pollution in six Asian cities: Spatial and temporal distributions, and associated sources, Atmosp. Environ., 40, 3367–3380, https://doi.org/10.1016/j.atmosenv.2006.01.050, 2006.
Othman, M., Latif, M. T., Hamid, H. H. A., Uning, R., Khumsaeng, T., Phairuang, W., Daud, Z., Idris, J., Sofwan, N. M., and Lung, S.-C. C.: Spatial-temporal variability and health impact of particulate matter during a 2019–2020 biomass burning event in Southeast Asia, Sci. Rep., 12, 7630, https://doi.org/10.1038/s41598-022-11409-z, 2022.
Palmer, T. Y.: Large fire winds, gases and smoke, Atmos. Environ., 15, 2079–2090, https://doi.org/10.1016/0004-6981(81)90241-9, 1981.
Pawar, P. V., Ghude, S. D., Jena, C., Móring, A., Sutton, M. A., Kulkarni, S., Lal, D. M., Surendran, D., Van Damme, M., and Clarisse, L.: Analysis of atmospheric ammonia over South and East Asia based on the MOZART-4 model and its comparison with satellite and surface observations, Atmos.Chem. Phys., 21, 6389–6409, https://doi.org/10.5194/acp-21-6389-2021, 2021.
Petters, M. and Kreidenweis, S.: A single parameter representation of hygroscopic growth and cloud condensation nucleus activity, Atmos. Chem. Phys., 7, 1961–1971, https://doi.org/10.5194/acp-7-1961-2007, 2007.
Pfister, G. G., Eastham, S. D., Arellano, A. F., Aumont, B., Barsanti, K. C., Barth, M. C., Conley, A., Davis, N. A., Emmons, L. K., and Fast, J. D.: The multi-scale infrastructure for chemistry and aerosols (MUSICA), B. Am. Meteorol. Soc., 101, E1743–E1760, https://doi.org/10.1175/BAMS-D-19-0331.1, 2020.
Pokhrel, R. P., Gordon, J., Fiddler, M. N., and Bililign, S.: Impact of combustion conditions on physical and morphological properties of biomass burning aerosol, Aerosol Sci. Tech., 55, 80–91, https://doi.org/10.1080/02786826.2020.1822512, 2021.
Pringle, K., Tost, H., Pozzer, A., Pöschl, U., and Lelieveld, J.: Global distribution of the effective aerosol hygroscopicity parameter for CCN activation, Atmos. Chem. Phys., 10, 5241–5255, https://doi.org/10.5194/acp-10-5241-2010, 2010.
Quinn, P. K., Bates, T., Baynard, T., Clarke, A., Onasch, T., Wang, W., Rood, M., Andrews, E., Allan, J., and Carrico, C.: Impact of particulate organic matter on the relative humidity dependence of light scattering: A simplified parameterization, Geophys. Res. Lett., 32, L22809, https://doi.org/10.1029/2005GL024322, 2005.
Radtke, J., Mauritsen, T., and Hohenegger, C.: Shallow cumulus cloud feedback in large eddy simulations–bridging the gap to storm-resolving models, Atmos. Chem. Phys., 21, 3275–3288, https://doi.org/10.5194/acp-21-3275-2021, 2021.
Reid, J., Koppmann, R., Eck, T., and Eleuterio, D.: A review of biomass burning emissions part II: intensive physical properties of biomass burning particles, Atmos. Chem. Phys., 5, 799–825, https://doi.org/10.5194/acp-5-799-2005, 2005.
Reid, J., Maring, H., Narisma, G., van den Heever, S., Di Girolamo, L., Ferrare, R., Holz, R., Lawson, P., Mace, G., and Simpas, J.: The coupling between tropical meteorology, aerosol lifecycle, convection, and radiation, during the Cloud, Aerosol and Monsoon Processes Philippines Experiment (CAMP2Ex), B. Am. Meteorol. Soc., 104, E1179–E1205, https://doi.org/10.1175/BAMS-D-21-0285.1, 2023.
Reid, J. S., Hyer, E. J., Johnson, R. S., Holben, B. N., Yokelson, R. J., Zhang, J., Campbell, J. R., Christopher, S. A., Di Girolamo, L., and Giglio, L.: Observing and understanding the Southeast Asian aerosol system by remote sensing: An initial review and analysis for the Seven Southeast Asian Studies (7SEAS) program, Atmos. Res., 122, 403–468, https://doi.org/10.1016/j.atmosres.2012.06.005, 2013.
Robinson, M. S., Chavez, J., Velazquez, S., and Jayanty, R.: Chemical speciation of PM2.5 collected during prescribed fires of the Coconino National Forest near Flagstaff, Arizona, J. Air Waste Manage. Assoc., 54, 1112–1123, https://doi.org/10.1080/10473289.2004.10470985, 2004.
Rolph, G., Stein, A., and Stunder, B.: Real-time environmental applications and display system: READY, Environ. Model. Softw., 95, 210–228, https://doi.org/10.1016/j.envsoft.2017.06.025, 2017.
Ross, A. D., Holz, R. E., Quinn, G., Reid, J. S., Xian, P., Turk, F. J., and Posselt, D. J.: Exploring the first aerosol indirect effect over Southeast Asia using a 10-year collocated MODIS, CALIOP, and model dataset, Atmos. Chem. Phys., 18, 12747–12764, https://doi.org/10.5194/acp-18-12747-2018, 2018.
Saxena, P., Hildemann, L. M., McMurry, P. H., and Seinfeld, J. H.: Organics alter hygroscopic behavior of atmospheric particles, J. Geophys. Res.-Atmos., 100, 18755–18770, https://doi.org/10.1029/95JD01835, 1995.
Schlosser, J. S., Braun, R. A., Bradley, T., Dadashazar, H., MacDonald, A. B., Aldhaif, A. A., Aghdam, M. A., Mardi, A. H., Xian, P., and Sorooshian, A.: Analysis of aerosol composition data for western United States wildfires between 2005 and 2015: Dust emissions, chloride depletion, and most enhanced aerosol constituents, J. Geophys. Res.-Atmos., 122, 8951–8966, https://doi.org/10.1002/2017JD026547, 2017.
Schuster, G. L., Dubovik, O., and Holben, B. N.: Angstrom exponent and bimodal aerosol size distributions, J. Geophys. Res.-Atmos., 111, D07207, https://doi.org/10.1029/2005JD006328, 2006.
Schwantes, R. H., Lacey, F. G., Tilmes, S., Emmons, L. K., Lauritzen, P. H., Walters, S., Callaghan, P., Zarzycki, C. M., Barth, M. C., and Jo, D. S.: Evaluating the impact of chemical complexity and horizontal resolution on tropospheric ozone over the conterminous US with a global variable resolution chemistry model, J. Adv. Model. Earth Syst., 14, e2021MS002889, https://doi.org/10.1029/2021MS002889, 2022.
Schwarz, J. P., Gao, R.-S., Fahey, D. W., Thomson, D. S., Watts, L. A., Wilson, J. C., Reeves, J. M., Darbeheshti, M., Baumgardner, D., and Kok, G. L.: Single‐particle measurements of midlatitude black carbon and light‐scattering aerosols from the boundary layer to the lower stratosphere, J. Geophys. Res.-Atmos., 111, D16207, https://doi.org/10.1029/2006JD007076, 2006.
Shi, J., Hong, J., Ma, N., Luo, Q., He, Y., Xu, H., Tan, H., Wang, Q., Tao, J., and Zhou, Y.: Measurement report: On the difference in aerosol hygroscopicity between high and low relative humidity conditions in the North China Plain, Atmos. Chem. Phys., 22, 4599–4613, https://doi.org/10.5194/acp-22-4599-2022, 2022.
Shingler, T., Crosbie, E., Ortega, A., Shiraiwa, M., Zuend, A., Beyersdorf, A., Ziemba, L., Anderson, B., Thornhill, L., and Perring, A. E.: Airborne characterization of subsaturated aerosol hygroscopicity and dry refractive index from the surface to 6.5 km during the SEAC4RS campaign, J. Geophys. Res.-Atmos., 121, 4188–4210, https://doi.org/10.1002/2015JD024498, 2016a.
Shingler, T., Sorooshian, A., Ortega, A., Crosbie, E., Wonaschütz, A., Perring, A. E., Beyersdorf, A., Ziemba, L., Jimenez, J. L., and Campuzano-Jost, P.: Ambient observations of hygroscopic growth factor and f (RH) below 1: Case studies from surface and airborne measurements, J. Geophys. Res.-Atmos., 121, 13661–13677, https://doi.org/10.1002/2016JD025471, 2016b.
Smith, S. J., Aardenne, J. v., Klimont, Z., Andres, R. J., Volke, A., and Delgado Arias, S.: Anthropogenic sulfur dioxide emissions: 1850–2005, Atmos. Chem. Phys., 11, 1101–1116, https://doi.org/10.5194/acp-11-1101-2011, 2011.
Sorooshian, A., Brechtel, F. J., Ma, Y., Weber, R. J., Corless, A., Flagan, R. C., and Seinfeld, J. H.: Modeling and characterization of a particle-into-liquid sampler (PILS), Aerosol Sci. Tech., 40, 396–409, https://doi.org/10.1080/02786820600632282, 2006.
Sorooshian, A., Shingler, T., Crosbie, E., Barth, M., Homeyer, C., Campuzano-Jost, P., Day, D., Jimenez, J., Thornhill, K., and Ziemba, L.: Contrasting aerosol refractive index and hygroscopicity in the inflow and outflow of deep convective storms: Analysis of airborne data from DC3, J. Geophys. Res.-Atmos., 122, 4565–4577, https://doi.org/10.1002/2017JD026638, 2017.
Spill, G., Stier, P., Field, P. R., and Dagan, G.: Effects of aerosol in simulations of realistic shallow cumulus cloud fields in a large domain, Atmos. Chem. Phys., 19, 13507–13517, https://doi.org/10.5194/acp-19-13507-2019, 2019.
Stein, A., Draxler, R. R., Rolph, G. D., Stunder, B. J., Cohen, M., and Ngan, F.: NOAA's HYSPLIT atmospheric transport and dispersion modeling system, B. Am. Meteorol. Soc., 96, 2059–2077, https://doi.org/10.1175/BAMS-D-14-00110.1, 2015.
Stockwell, C. E., Jayarathne, T., Cochrane, M. A., Ryan, K. C., Putra, E. I., Saharjo, B. H., Nurhayati, A. D., Albar, I., Blake, D. R., and Simpson, I. J.: Field measurements of trace gases and aerosols emitted by peat fires in Central Kalimantan, Indonesia, during the 2015 El Niño, Atmos. Chem. Phys., 16, 11711–11732, https://doi.org/10.5194/acp-16-11711-2016, 2016.
Stokes, R. and Robinson, R.: Interactions in aqueous nonelectrolyte solutions. I. Solute-solvent equilibria, J. Phys. Chem., 70, 2126–2131, 1966.
Swietlicki, E., Hansson, H.-C., Hämeri, K., Svenningsson, B., Massling, A., McFiggans, G., McMurry, P. H., Petäjä, T., Tunved, P., and Gysel, M.: Hygroscopic properties of submicrometer atmospheric aerosol particles measured with H-TDMA instruments in various environments – a review, Tellus B, 60, 432–469, https://doi.org/10.1111/j.1600-0889.2008.00350.x, 2008.
Thalman, R., de Sá, S. S., Palm, B. B., Barbosa, H. M., Pöhlker, M. L., Alexander, M. L., Brito, J., Carbone, S., Castillo, P., and Day, D. A.: CCN activity and organic hygroscopicity of aerosols downwind of an urban region in central Amazonia: seasonal and diel variations and impact of anthropogenic emissions, Atmos. Chem. Phys., 17, 11779–11801, https://doi.org/10.5194/acp-17-11779-2017, 2017.
Tilmes, S. and Zhang, J.: CAM-chem Model Outputs used in “Measurement Report: Characterization of Aerosol Hygroscopicity over Southeast Asia during the NASA CAMP2Ex Campaign”, NSF National Center for Atmospheric Research [data set], https://doi.org/10.6084/m9.figshare.26755936.v2, 2024.
Tilmes, S., Mills, M. J., Zhu, Y., Bardeen, C. G., Vitt, F., Yu, P., Fillmore, D., Liu, X., Toon, B., and Deshler, T.: Description and performance of a sectional aerosol microphysical model in the Community Earth System Model (CESM2), Geosci. Model Dev., 16, 6087–6125, https://doi.org/10.5194/gmd-16-6087-2023, 2023.
Titos, G., Burgos, M. A., Zieger, P., Alados-Arboledas, L., Baltensperger, U., Jefferson, A., Sherman, J., Weingartner, E., Henzing, B., and Luoma, K.: A global study of hygroscopicity-driven light-scattering enhancement in the context of other in situ aerosol optical properties, Atmos. Chem. Phys., 21, 13031–13050, https://doi.org/10.5194/acp-21-13031-2021, 2021.
Tsay, S.-C., Hsu, N. C., Lau, W. K.-M., Li, C., Gabriel, P. M., Ji, Q., Holben, B. N., Welton, E. J., Nguyen, A. X., and Janjai, S.: From BASE-ASIA toward 7-SEAS: A satellite-surface perspective of boreal spring biomass-burning aerosols and clouds in Southeast Asia, Atmos. Environ., 78, 20-34, https://doi.org/10.1016/j.atmosenv.2012.12.013, 2013.
van Diedenhoven, B., Hasekamp, O. P., Cairns, B., Schuster, G. L., Stamnes, S., Shook, M., and Ziemba, L.: Remote sensing of aerosol water fraction, dry size distribution and soluble fraction using multi-angle, multi-spectral polarimetry, Atmos. Meas. Tech., 15, 7411–7434, https://doi.org/10.5194/amt-15-7411-2022, 2022.
Virkkula, A.: Correction of the calibration of the 3-wavelength Particle Soot Absorption Photometer (3ë PSAP), Aerosol Sci. Tech., 44, 706–712, https://doi.org/10.1080/02786826.2010.482110, 2010.
Waggoner, A., Weiss, R., and Larson, T.: In-situ, rapid response measurement of H2SO4/(NH4) 2SO4 aerosols in urban Houston: A comparison with rural Virginia, Atmos. Environ., 17, 1723–1731, https://doi.org/10.1016/0004-6981(83)90179-8, 1983.
Wang, J., Pikridas, M., Pinterich, T., Spielman, S. R., Tsang, T., McMahon, A., and Smith, S.: A Fast Integrated Mobility Spectrometer for rapid measurement of sub-micrometer aerosol size distribution, Part II: Experimental characterization, J. Aerosol Sci., 113, 119–129, https://doi.org/10.1016/j.jaerosci.2017.05.001, 2017a.
Wang, J., Pikridas, M., Spielman, S. R., and Pinterich, T.: A fast integrated mobility spectrometer for rapid measurement of sub-micrometer aerosol size distribution, Part I: Design and model evaluation, J. Aerosol Sci., 108, 44–55, https://doi.org/10.1016/j.jaerosci.2017.02.012, 2017b.
Wang, X., Ye, X., Chen, H., Chen, J., Yang, X., and Gross, D. S.: Online hygroscopicity and chemical measurement of urban aerosol in Shanghai, China, Atmos. Environ., 95, 318–326, https://doi.org/10.1016/j.atmosenv.2014.06.051, 2014.
Wang, Y., Li, Z., Zhang, Y., Du, W., Zhang, F., Tan, H., Xu, H., Fan, T., Jin, X., and Fan, X.: Characterization of aerosol hygroscopicity, mixing state, and CCN activity at a suburban site in the central North China Plain, Atmos. Chem. Phys., 18, 11739–11752, https://doi.org/10.5194/acp-18-11739-2018, 2018a.
Wang, Y., Pinterich, T., and Wang, J.: Rapid measurement of sub-micrometer aerosol size distribution using a fast integrated mobility spectrometer, J. Aerosol Sci., 121, 12–20, https://doi.org/10.1016/j.jaerosci.2018.03.006, 2018b.
Wonaschuetz, A., Sorooshian, A., Ervens, B., Chuang, P. Y., Feingold, G., Murphy, S. M., de Gouw, J., Warneke, C., and Jonsson, H. H.: Aerosol and gas re‐distribution by shallow cumulus clouds: An investigation using airborne measurements, J. Geophys. Res.-Atmos., 117, D17202, https://doi.org/10.1029/2012JD018089, 2012.
Woods, S., Lawson, R. P., Jensen, E., Bui, T., Thornberry, T., Rollins, A., Pfister, L., and Avery, M.: Microphysical properties of tropical tropopause layer cirrus, J. Geophys. Res.-Atmos., 123, 6053–6069, https://doi.org/10.1029/2017JD028068, 2018.
Wu, Z., Zheng, J., Shang, D., Du, Z., Wu, Y., Zeng, L., Wiedensohler, A., and Hu, M.: Particle hygroscopicity and its link to chemical composition in the urban atmosphere of Beijing, China, during summertime, Atmos. Chem. Phys., 16, 1123–1138, https://doi.org/10.5194/acp-16-1123-2016, 2016.
Xu, W., Ovadnevaite, J., Fossum, K. N., Lin, C., Huang, R.-J., O'Dowd, C., and Ceburnis, D.: Aerosol hygroscopicity and its link to chemical composition in the coastal atmosphere of Mace Head: marine and continental air masses, Atmos. Chem. Phys., 20, 3777–3791, https://doi.org/10.5194/acp-20-3777-2020, 2020.
Yang, Q., Easter, R. C., Campuzano-Jost, P., Jimenez, J. L., Fast, J. D., Ghan, S. J., Wang, H., Berg, L. K., Barth, M. C., and Liu, Y.: Aerosol transport and wet scavenging in deep convective clouds: A case study and model evaluation using a multiple passive tracer analysis approach, J. Geophys. Res.-Atmos., 120, 8448–8468, https://doi.org/10.1002/2015JD023647, 2015.
Zhang, F., Wang, Y., Peng, J., Ren, J., Collins, D., Zhang, R., Sun, Y., Yang, X., and Li, Z.: Uncertainty in predicting CCN activity of aged and primary aerosols, J. Geophys. Res.-Atmos., 122, 11723–11736, https://doi.org/10.1002/2017JD027058, 2017.
Zhang, L., Sun, J., Shen, X., Zhang, Y., Che, H., Ma, Q., Zhang, Y., Zhang, X., and Ogren, J.: Observations of relative humidity effects on aerosol light scattering in the Yangtze River Delta of China, Atmos. Chem. Phys., 15, 8439–8454, https://doi.org/10.5194/acp-15-8439-2015, 2015.
Zhao, G., Zhao, C., Kuang, Y., Bian, Y., Tao, J., Shen, C., and Yu, Y.: Calculating the aerosol asymmetry factor based on measurements from the humidified nephelometer system, Atmos. Chem. Phys., 18, 9049—060, https://doi.org/10.5194/acp-18-9049-2018, 2018.
Zieger, P., Fierz-Schmidhauser, R., Gysel, M., Ström, J., Henne, S., Yttri, K. E., Baltensperger, U., and Weingartner, E.: Effects of relative humidity on aerosol light scattering in the Arctic, Atmos. Chem. Phys., 10, 3875—890, https://doi.org/10.5194/acp-10-3875-2010, 2010.
Zieger, P., Fierz-Schmidhauser, R., Weingartner, E., and Baltensperger, U.: Effects of relative humidity on aerosol light scattering: results from different European sites, Atmos. Chem. Phys., 13, 10609–10631, https://doi.org/10.5194/acp-13-10609-2013, 2013.
Zieger, P., Fierz-Schmidhauser, R., Poulain, L., Müller, T., Birmili, W., Spindler, G., Wiedensohler, A., Baltensperger, U., and Weingartner, E.: Influence of water uptake on the aerosol particle light scattering coefficients of the Central European aerosol, Tellus B, 66, 22716, https://doi.org/10.3402/tellusb.v66.22716, 2014.
Ziemba, L. D., Lee Thornhill, K., Ferrare, R., Barrick, J., Beyersdorf, A. J., Chen, G., Crumeyrolle, S. N., Hair, J., Hostetler, C., and Hudgins, C.: Airborne observations of aerosol extinction by in situ and remote-sensing techniques: Evaluation of particle hygroscopicity, Geophys. Res. Lett., 40, 417–422, https://doi.org/10.1029/2012GL054428, 2013.