the Creative Commons Attribution 4.0 License.
the Creative Commons Attribution 4.0 License.
 | 02 Jun 2025
Counteracting influences of gravitational settling modulate aerosol impacts on cloud-base-lowering fog characteristics
Nathan H. Pope
Adele L. Igel
One common process for marine fog formation is cloud base lowering (CBL), which is frequently observed, for example, off the coast of California and in Canada's Grand Banks, as well as other foggy ocean regions. While previous studies have extensively examined the meteorological controls on CBL fog, its microphysical characteristics have received comparatively less attention. We employ a single-column model to investigate the interplay among aerosols, microphysics, and CBL fog evolution under diverse meteorological conditions. We find that lower aerosol concentrations make fog formation more probable but that if fog does form, fog water concentrations are lower. Lower aerosol concentrations lead to earlier fog formation due to faster gravitational settling of larger droplets, which serves to flux moisture downward. Faster gravitational settling (among other mechanisms at low aerosol concentration) also suppresses entrainment at cloud top, which aids in keeping the liquid water path high. However, faster gravitational settling also limits the fog water concentration through faster liquid deposition to the surface. It is these counteracting influences of gravitational settling that appear to cause both prolonged fog duration and suppressed fog water concentration. The relative strength of these counteracting influences depends on the environmental conditions.
- Article
(1336 KB) - Full-text XML
- BibTeX
- EndNote


Marine fog poses a significant meteorological hazard, and its annual economic impact can rival that of hurricanes (Gultepe et al., 2007). A disproportionate number of maritime accidents occur in foggy conditions, including the tragic sinking of the RMS Titanic (Koračin et al., 2014). The complexity of marine fog formation mechanisms makes modeling and forecasting marine fog a challenge (Leipper, 1994; Lewis et al., 2004; Koračin et al., 2014; Koračin, 2017).
During a study of fog along the California coast, Anderson (1931) observed that turbulent mixing within pre-existing stratus clouds could lower the cloud base, leading to fog formation. Subsequent research by Oliver et al. (1978) and Pilié et al. (1979) investigated this phenomenon, referred to as “stratus-lowering fog” or cloud-base-lowering (CBL) fog, and identified it as one of the most prevalent fog formation mechanisms in California. Additionally, data from the 2018 C-FOG campaign (Fernando et al., 2021) indicated the common occurrence of CBL in the Grand Banks (Dorman et al., 2021). Notably, the California coast and the Grand Banks represent two types of regions susceptible to marine fog with cloud base lowering. The northern California case has a summer concentration of fog occurrence related to cold water upwelling along the coast, while Atlantic Canada over the continental shelf (including the Grand Banks) has significant fog occurrence related to high sea surface temperature (SST) gradients along a western ocean boundary current (Lewis et al., 2004; Gultepe et al., 2007; Koračin, 2017). Furthermore, it is worth noting that land-based fog also frequently forms through CBL (Haeffelin et al., 2010). Therefore, we think it is plausible that CBL serves as one of the predominant mechanisms for fog formation on a global scale.
Since stratus lowering is a common fog formation mechanism on the California coast (Pilié et al., 1979), many studies on stratus-lowering fog have focused on that region (Leipper, 1994; Koračin et al., 2001, 2005). During the summer months, the North Pacific high creates a large anticyclonic system that generates upper-level offshore flow at the California coast, which drives subsiding air that caps a boundary layer. The cool sea surface temperatures limit surface heat fluxes, leading to a shallow boundary layer that is favorable for CBL fog formation (Leipper, 1994; Lewis et al., 2004; Koračin et al., 2014; Zdunkowski et al., 1982). Studies indicate that radiative cloud top cooling is the primary driver of CBL along the California coast, which strengthens at night with the lack of solar heating and drives fog formation in the early morning (Pilié et al., 1979; Leipper, 1994; Koračin et al., 2001, 2005). The findings of Wagh et al. (2021) for Atlantic Canada agree, noting that stratus-lowering fog cases during the C-FOG campaign were related to cloud top cooling, stability, and entrainment at the top of the boundary layer. Although the sea surface is cool, studies (Pilié et al., 1979; Koračin et al., 2001; Lewis et al., 2003) have noted that the air is nonetheless cooler than the sea surface during CBL events. Pilié et al. (1979) explain that the sea surface fluxes both sensible and latent heat into the boundary layer, counteracting moisture loss due to entrainment and supporting turbulent mixing. Though differential advection can play a role in the setup of a CBL fog case (Wagh et al., 2021), it has been conceived of as a Lagrangian process occurring within a column (Pilié et al., 1979; Koračin et al., 2001). As long as the conditions of a subsidence-capped boundary layer and net cooling of the boundary layer persist, the cloud base will tend to be lower. As a result, Koračin et al. (2001) posit that back trajectories, or the path that an air parcel took and the conditions it experienced along that path, are the primary predictor of fog formation through CBL. Lewis et al. (2003) and Koračin et al. (2001) both find that a cloudy air mass that remains offshore for a long time will tend to form fog, and thus fog on the California coast can be predicted by wind patterns and CBL conditions along the Lagrangian path of an air mass. A diagram summarizing the processes involved in fog formation through CBL adapted from Pilié et al. (1979) is shown in Fig. 1.
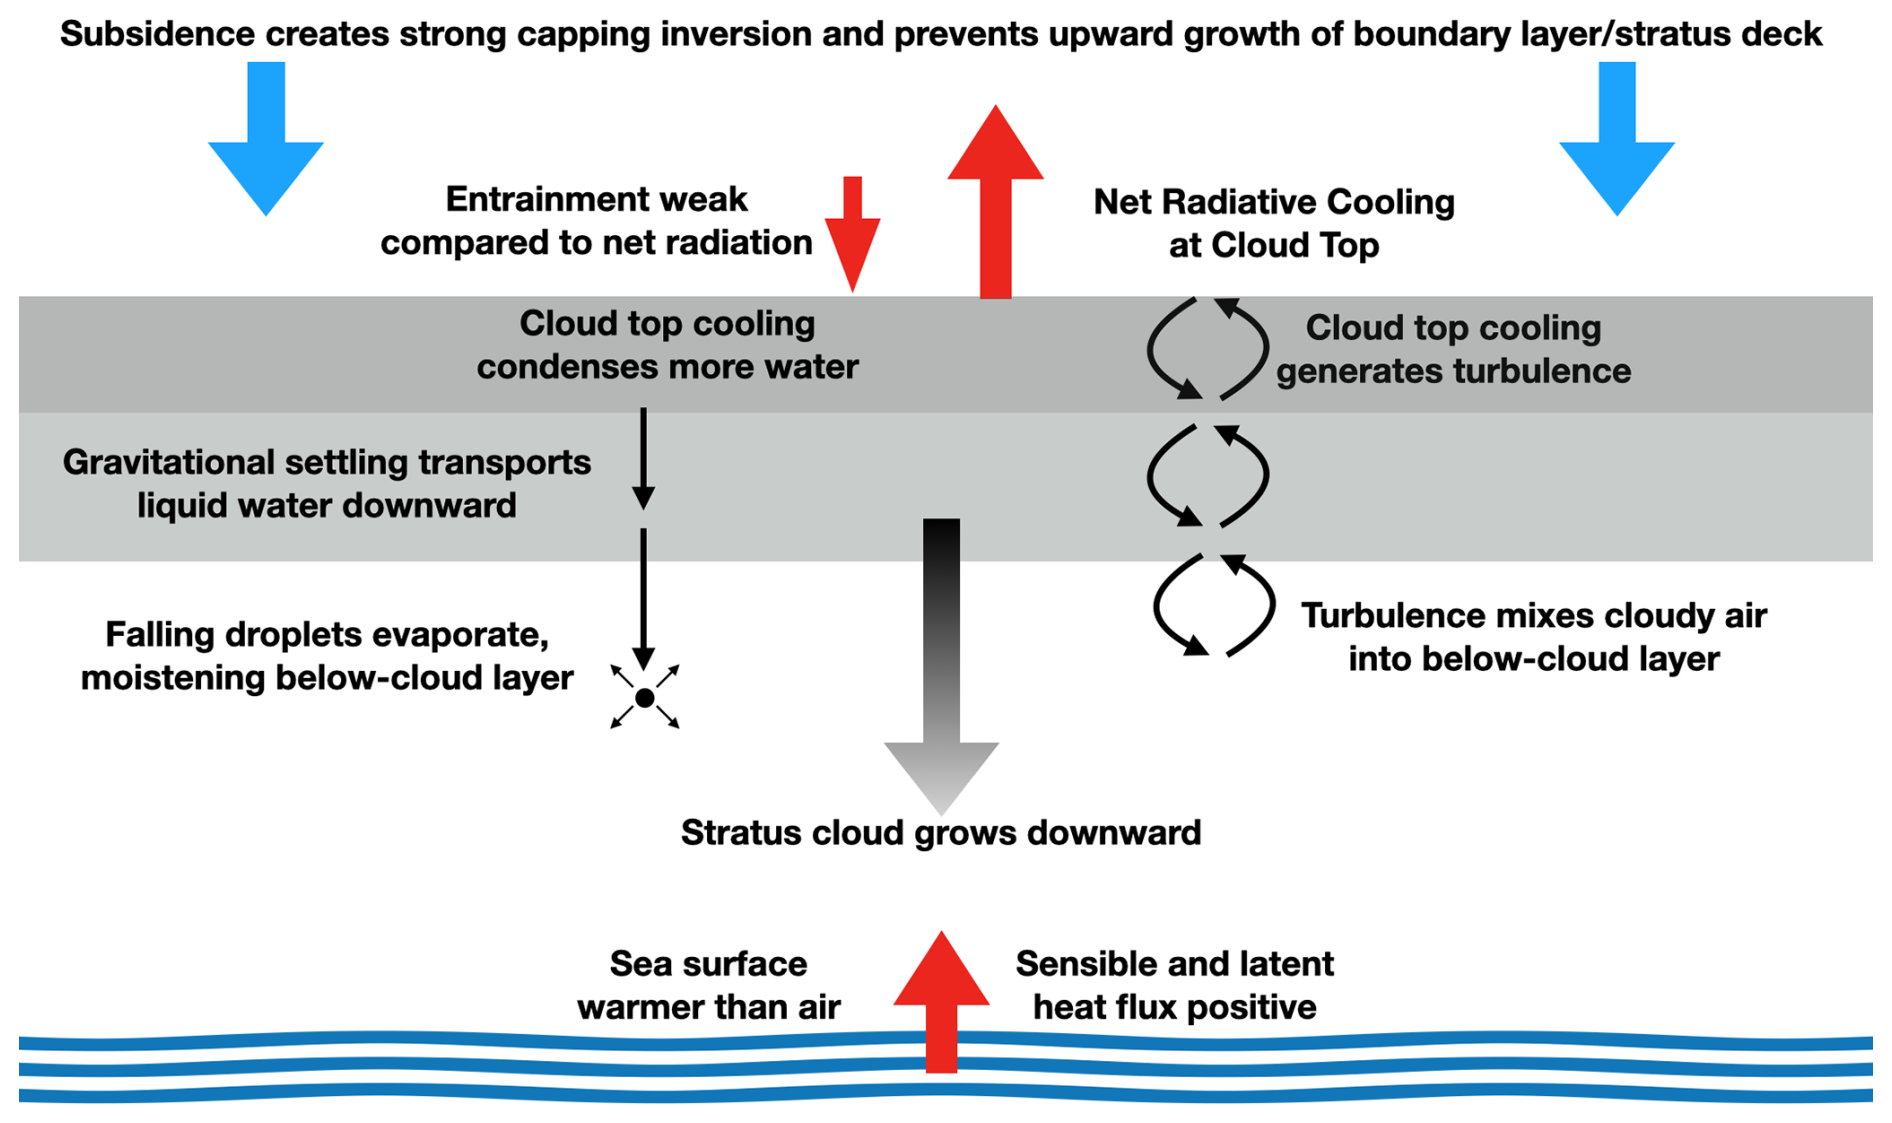
Figure 1Schematic adapted from Pilié et al. (1979) representing the processes involved in CBL fog formation.
This line of research largely ignores the degree to which the microphysical properties of the stratus clouds can influence the rate of cloud base descent. Microphysical impacts on fog have been investigated through observational (Gultepe et al., 1996; Duynkerke, 1999; Zhao et al., 2013; Haeffelin et al., 2010; Niu et al., 2012) and modeling (Gultepe and Milbrandt, 2007; Tardif and Rasmussen, 2010; Pope and Igel, 2023) studies. Gultepe and Milbrandt (2007) found that accurate parameterization of microphysical properties helped improve the accuracy of fog simulations. Studies on radiation fog on land find that a higher aerosol concentration and larger diameter favor fog formation (Koračin, 2017; Boutle et al., 2018; Stolaki et al., 2015), but the dependence varies based on the type of fog being considered (Niu et al., 2012). Haeffelin et al. (2010) found that radiation fog and CBL fog near Paris probably had different sensitivities to microphysics. Pope and Igel (2023) indicate that marine fog formed through CBL is enhanced by lower aerosol concentrations due to greater evaporation below cloud base. Uncertainty around the microphysical sensitivity of different types of marine fog can limit the accuracy of forecasts because assumptions made about microphysics within the models may not be applicable to certain marine fog scenarios. Oliver et al. (1978) and Pilié et al. (1979) commented on the microphysical processes behind CBL fog. In particular, Pilié et al. (1979) noted that, though radiative cooling drove the downward propagation of cloud base, the propagation itself results from a combination of turbulent mixing and droplet settling. Dupont et al. (2012) note that high Doppler velocities in observed CBL fog cases point towards gravitational settling as a major driver of CBL.
While it is understood that aerosols can impact fog formed through cloud base lowering, the relationship between aerosol and CBL fog is not well-understood. This study uses a single-column model to conduct a modeling experiment that tests how CBL fog responds to aerosol concentration. In addition to studying the relationship between aerosol and fog, our aim is to examine the microphysical processes of marine CBL fogs as well as the relationship between microphysics and several meteorological forcing conditions. By examining these relationships in detail, we can better understand the physical processes that drive cloud base lowering, and this knowledge can be applied to fog modeling and forecasting more generally.
2.1 Model and parameterizations
PAFOG is a single-column model (SCM) developed by Bott and Trautmann (2002). It uses a 2.5 level Yamada scheme for turbulence (Mellor and Yamada, 1974, 1982), a surface scheme based on Mccumber and Pielke (1981), and a δ two-stream radiation approximation from Zdunkowski et al. (1982). PAFOG includes a 2-D spectral bin microphysics scheme, MISTRA (Bott et al., 1996). MISTRA is a computationally expensive microphysics scheme that can be afforded due to the computational cost savings of SCMs. In MISTRA, there is no distinction between aerosol particles and droplets. Particles are binned by the overall size of the droplet and by the aerosol particle dry size. As such, MISTRA does not rely on a distinction between activated and non-activated droplets when calculating the droplet size distribution, and 2-D bin schemes have a particular advantage over 1-D schemes due to their ability to account for solute effects for both unactivated and activated particles. In a series of experiments, PAFOG was embedded within WRF and significantly improved fog simulations relative to WRF (Kim and Yum, 2013; Kim et al., 2020b, a). In a case study based upon data from the 2018 C-FOG campaign around the SE Newfoundland coast and the NW edge of the Grand Banks, PAFOG coupled with ERA5 advection terms performed well (Chen et al., 2021). PAFOG with a bulk scheme and MIFOG (Bott et al., 1990) with bin microphysics both agreed with other SCMs in the Demistify intercomparison (Boutle et al., 2022). PAFOG with MISTRA can recreate microphysical processes with a high level of fidelity, allowing for a detailed study of the response of CBL fog to microphysics. Specifically, it helps facilitate investigation into how changes to the microphysical properties of the fog propagate through into the evolution and life cycle of a fog event.
For our experiment, we set up PAFOG to create an idealized case in which a persistent stratus deck lowers at its base, becomes fog, and then rises back up over the course of 24 h. Fog is defined as occurring when the lowest model level is cloudy, and cloud is defined by a liquid water mass concentration of 0.01 g kg−1 when only hydrometeors with radii greater than 1 µm and less than 40 µm are considered. Relative to a fog identification based on visibility, this CWC-based definition will tend to identify more fog at lower aerosol concentration due to the relationship between Na, droplet size, and visibility. However, removing the dependence of fog identification on the droplet size distribution gives us a simpler metric to use in this experiment. The entire modeled column has a height of 2400 m and a grid spacing of 4 m. We use a 2 s time step. The initialization includes a 280 m thick boundary layer capped by an 8 K step inversion. Air subsides at 3 mm s−1 above the boundary layer, and the water vapor mixing ratio above the boundary layer is 3.5 g kg−1. The boundary layer itself is very moist, with a water mixing ratio of 9.2 g kg−1 and a potential temperature of 12 °C at the start of the initialization. The initialization run begins at 14:00 UTC because initial tests showed this time to be associated with the simulated daily maximum of cloud base height. The solar radiation is consistent with late spring at 38° N and the sea surface temperature is 13 °C. These values are meant to be broadly representative of coastal California. The remaining parameters are chosen primarily to ensure that the model produces a stable cloud layer that does not tend towards growth or dissipation over a simulation time of 60 h.
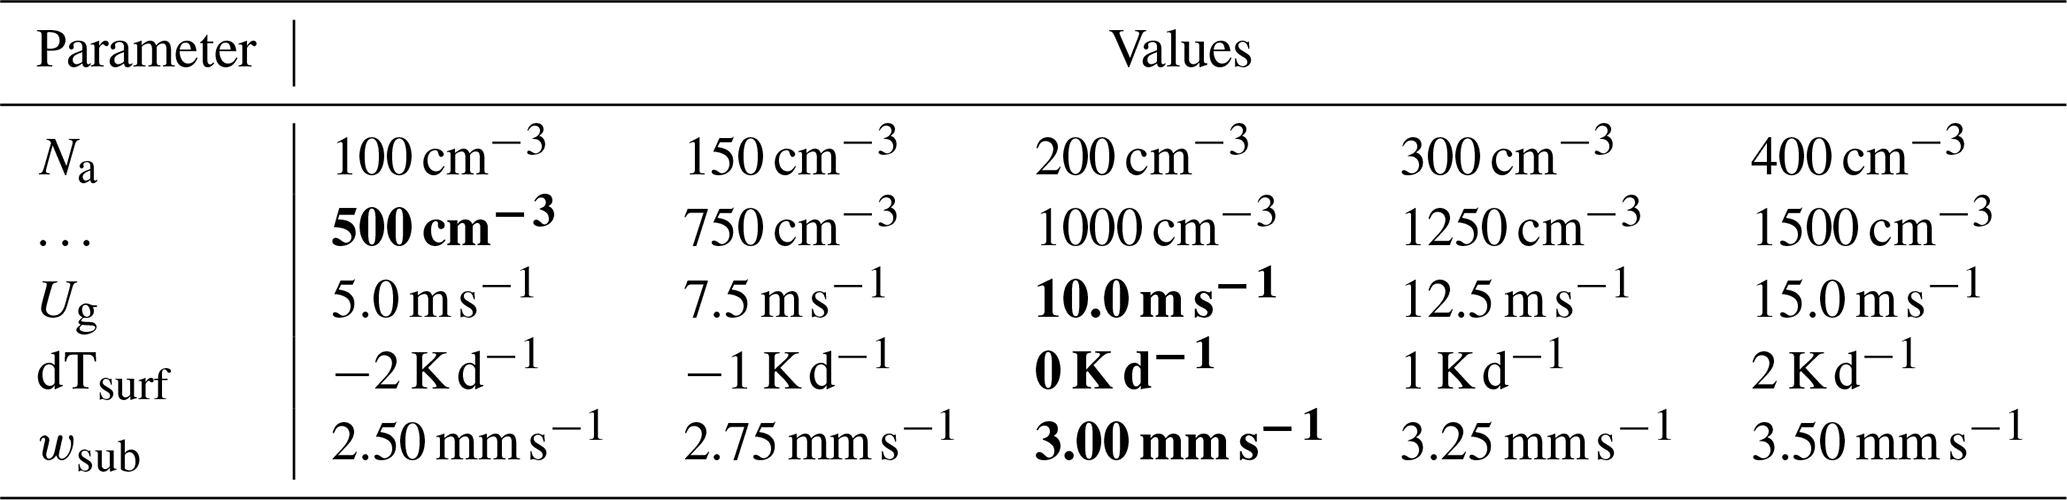
Table 1Table showing input parameter values. There are 1250 total simulations in the experiment. Boldfaced values are used in the initialization run and constitute the experiment's “base case.”
For all simulations, we configured MISTRA with 40 aerosol size bins and 80 droplet size bins. The bins are logarithmically spaced. Aerosol size bins have minimum radii ranging from 0.01 to 2.1 µm, while droplet size bins have minimum radii from 0.01 to 500 µm. The aerosol distribution is triple-peaked, with each peak represented as a lognormal distribution. The distribution is based on the marine aerosol distributions described in Fitzgerald (1991). The aerosol number distribution is given by
where r is the particle radius in micrometers (µm) and Na is the total aerosol concentration. If we define the Aitken mode as particles with diameters between 0.01 and 0.1 µm, accumulation mode between 0.1 and 1 µm, and course mode as having diameters greater than 1 µm, then we find that 45.7 % of particles are in the Aitken mode, 54.2 % are in the accumulation mode, and 0.1 % are coarse-mode aerosols. All particles are assumed to be ammonium sulfate. Aerosol concentration is initially constant throughout the modeled column. Activated droplets comprise the majority of cloud water by mass when cloud water is greater than 0.01 g kg−1, though some non-activated droplets are large enough to be considered cloud water. Because we want to focus this study on the indirect effects of aerosols, we suppress the direct radiative impact of aerosols above the boundary layer top. As such, the full particle spectrum is used for radiation calculations within and below the cloud–boundary layer, but aerosols above the inversion do not substantially impact the radiation budget at cloud top.
2.2 Experimental design
We vary four parameters for our experiment to generate 1250 test simulations. To mitigate model spin-up effects, each experiment is initialized with an initialization run at 48 h. At the time of the restart for the experiments – that is, the initial time of each experimental simulation – the potential temperature at 2 m is 11.5 °C and the water mixing ratio is 8.45 g kg−1. After 10 min, cloud base is between 120 and 140 m depending upon the input parameters. Each experiment is run for 24 h.
Three of the parameters modify the meteorological background in which our fog case is forming. The first of these “background” variables is the subsidence velocity above the boundary layer (wsub) from 2.5 to 3.5 mm s−1, which are reasonable values for the California coast (Wood and Bretherton, 2004; Koračin and Dorman, 2001). The second is the geostrophic wind (Ug), which is varied from 5.0 to 15.0 m s−1. We evaluated and found that applying both wmax and Ug as step changes to the velocity field had minimal adverse impacts on the simulations. Wind and turbulence quickly stabilized. In addition to these two parameters, we vary the rate of change of the sea surface temperature (dTsurf) from −2 to +2 K d−1. The modeled ocean surface warms or cools at a constant rate defined by dTsurf. This change mimics the effects of advection of the fog over a sea surface temperature gradient. This range is modest in a nearshore context but is wide enough to begin to see its impact, particularly later in the simulation. All three of these background parameters have five possible values. Finally, we vary Na, the aerosol concentration, in 10 (non-constant) steps from 100 to 1500 cm−3. Na acts as the independent variable for evaluating the impact of microphysics on our fog case. Since we are primarily concerned with the microphysical properties of aerosol, the radiative impact of aerosol is disabled above a height of 480 m. Table 1 shows all the values of each input parameter. Boldfaced values are used in the initialization run and constitute the experiment's “base case”. Processed model output and code can be found in Pope and Igel (2025) to reproduce all figures in this paper.
3.1 Overall response
We first look at the response of fog density and thickness in the model to the combinations of parameters shown in Table 1. We quantify fog density with the surface cloud water content (CWC). Figure 2 shows the maximum surface CWC and the liquid water path at the time that maximum surface CWC occurs. All points included in this plot correspond to simulations that produced fog. As such, maximum surface CWC has a minimum value of 0.01 g kg−1. Under adiabatic conditions, one would expect that the relationship between liquid water path and maximum surface CWC depends only on cloud top height and temperature. However, the relationship between cloud top height, liquid water path, and surface CWC is complicated by the non-adiabatic distribution of liquid water within the cloud, particularly near the surface, which is affected by turbulence as well as by gravitational settling.
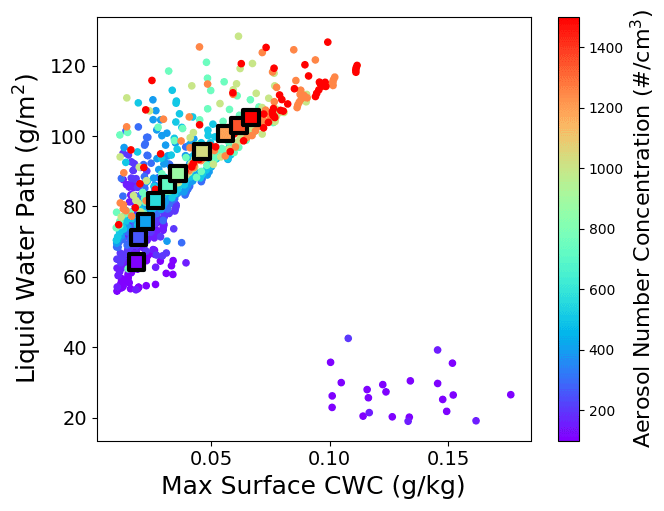
Figure 2Maximum surface CWC and liquid water path at the time of maximum surface CWC for all simulations that produced fog. Points are colored by Na. Note the well-separated group of points at the lower right of the plot. In addition to low Na, simulations in this outlier group had a cooling surface and typically low Ug. Square points with black borders represent mean values for each aerosol concentration with the outlier points excluded.
Figure 2 shows that in general the liquid water path increases as the maximum surface CWC increases as would be expected. It also shows that the maximum surface CWC and liquid water path of fog are correlated with higher Na. In the lower right of Fig. 2 are outlier simulations, which are a subset of simulations with low Na and a cooling surface formed by dense but atypically shallow fog layers. All of these simulations ended with a much thinner boundary layer in which the height of the inversion is lowered by at least 100 m, with the lowering occurring after nightfall. Once fog formed in these simulations, it did not dissipate prior to the simulation end. We suspect that the combination of input parameters present in these simulations, particularly the stabilizing influence of a cooling sea surface, suppresses mixing and causes the boundary layer to collapse. Despite being physically reasonable, the gap between these outlier simulations and their non-outlier neighbors in input parameter space is indicative of some kind of discontinuity. In light of this, we perform the rest of this analysis with the outlier simulations removed unless otherwise noted.
Results regarding the frequency and duration of fog are summarized in Fig. 3. Figure 3a shows the fraction of simulations that formed fog as a function of Na and Fig. 3b shows the mean fog duration. Mean fog duration is calculated with non-foggy simulations included with a duration of zero and therefore combines the mean duration of fog-producing simulations with the proportion of simulations that produced fog. Figure 3c shows mean fog duration versus aerosol concentration averaged over background condition subsets (combinations of Ug, wmax, and SST rate of change) in which all simulations form fog. For example, the “10 sims” line includes background conditions where simulations were foggy at all 10 aerosol concentrations, the “9 sims” line is for background conditions where only the highest aerosol condition was non-foggy, and so on down to the “6 sims” line, where no fog formed at aerosol concentrations greater than the base case value of 500 cm−3. The purpose of this additional analysis is to remove the influence of non-foggy simulations on the average fog duration.
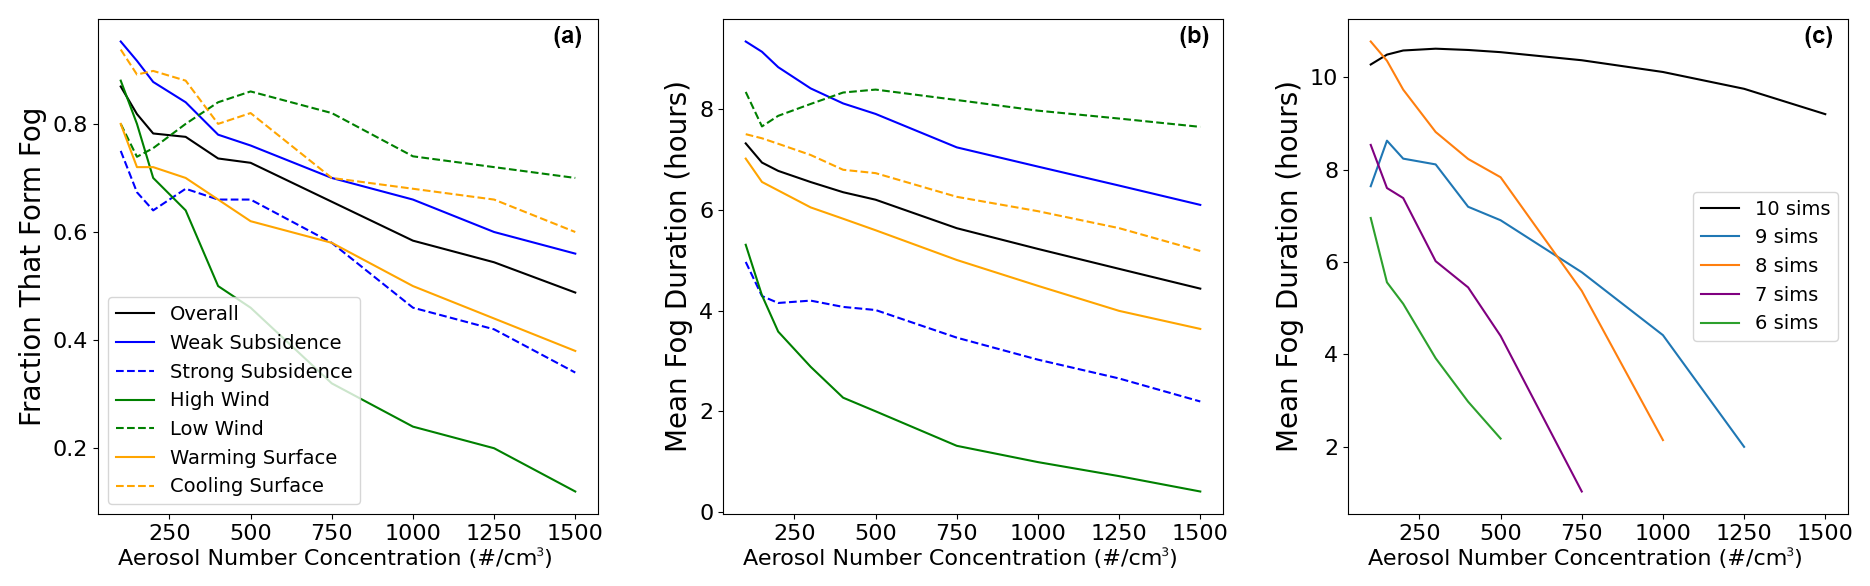
Figure 3Relationships between Na and (a) the fraction of simulations that form fog at some time and (b) the mean fog duration including non-foggy simulations with respect to Na averaged over different simulation subsets based on input parameter values. Panel (c) shows the mean duration of foggy simulations with respect to Na for combinations of wsub, Ug, and dTsurf in which the specified number of simulations (continuously starting from the lowest Na) all formed fog.
Figure 3a shows that overall, greater aerosol concentration made fog less likely to form. Figure 3b shows that the mean fog duration (including non-foggy simulations) also decreases with increasing aerosol concentration. Fog formation fraction and mean fog duration line up well with each other and possibly suggest that increasing aerosol concentration makes fog less likely to form but does not impact the duration of fog that does form. However, Fig. 3c shows that aerosol concentration impacts both the likelihood of fog formation and the duration of fog that forms. Duration changes are largely driven by changes in the onset time rather than changes in the dissipation time (not shown). In background conditions where only the highest aerosol concentrations did not form fog, fog duration decreased with increasing aerosol concentration. Therefore, increasing aerosol concentration makes fog less likely to form and tends to reduce the duration of fog that does form. This contrasts with fog density and thickness, which is enhanced by increased aerosol concentration (Fig. 2). Previous work in Pope and Igel (2023) indicated a trade-off between fog area and maximum fog density when varying microphysics parameters only, with lower aerosol concentrations and wider drop size distributions leading to more widespread but less dense fog. That experiment used a double-moment bulk scheme and modeled 3-D space for a fog event related to the passage of a cyclonic system through the Canadian Grand Banks region. The fact that the same relationship is observed in these two very different modeling experiments, whose primary similarity is that they contain a fog event formed through cloud base lowering, lends weight to the supposition that a trade-off exists outside of models. A more detailed discussion of this phenomenon can be found in Sect. 3.2.
Figure 3 shows that, over the parameter ranges tested in this experiment, both fog formation likelihood and fog duration were least sensitive to the SST rate of change and most sensitive to the geostrophic wind speed, making Na neither the most nor least important factor. Geostrophic wind impacted average fog formation likelihood by nearly a factor of 4, with over 95 % of simulations with 10 m s−1 geostrophic wind forming fog while only 26 % of simulations with 15 m s−1 geostrophic wind did the same. Na, meanwhile, impacted fog formation likelihood by a just under a factor of 2. Additionally, geostrophic wind speed modified the response of simulation fogginess to aerosol. The odds of fog formation and expected fog duration in the low wind cases were not strongly impacted by aerosol concentration, deviating from the high-wind cases in which higher aerosol concentrations strongly inhibited fog formation. The inverse is also true, and aerosol concentration affected the response of fog to geostrophic wind. Both fog formation likelihood and fog duration were less sensitive to geostrophic wind at low aerosol concentrations.
These initial results raise several questions. First, why is it that increasing aerosol leads to increased liquid water path and density of fog at the surface but decreases the likelihood of fog formation and duration of fog in the model? Second, what processes drive each of these trends? Do the same processes simultaneously drive higher fog thickness and density and lower fog duration and odds of formation, or are different processes responsible for each? Furthermore, are the modeled processes that drive the response of fog to aerosol primarily microphysical or thermodynamic? In the following sections, we examine these questions.
3.2 The duration–density relationship
We first analyze the relationship between fog density and fog duration. To more clearly show the duration–density relationship, Fig. 4 shows the relationship with respect to each input parameter, with larger points representing higher values of each input parameter. For all background input variables, longer mean fog duration is associated with higher max surface CWC. This is not a surprise, as we would expect meteorological conditions that produce longer-lasting fog to tend towards producing denser fog as well within the context of this experiment. However, this is not the case for aerosol concentration. As already discussed, we see a pronounced trade-off between fog density and duration with respect to aerosol that differs starkly from the relationship when only external meteorological factors are varied. This contrast suggests that the processes controlling the duration–density relationship for varying aerosol concentration are microphysical rather than thermodynamic, which is to say that the relationship does not act like a forcing condition.
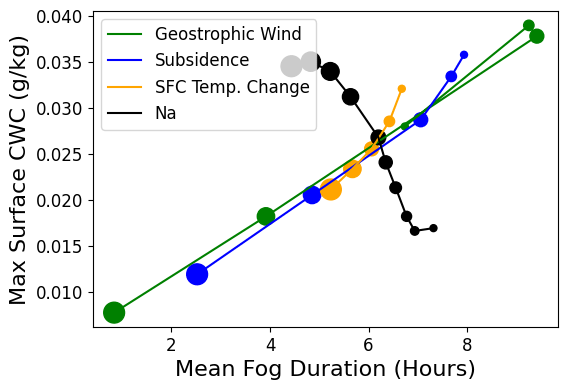
Figure 4Mean fog duration over all non-outlier simulations (both foggy and non-foggy) as a function of max surface CWC averaged over each input parameter value. Point size represents the relative value of each input parameter, with the largest points representing Ug = 15 m s−1, wsub = 3.5 mm s−1, SST rate of change = 2 K d−1, and Na = 1500 cm−3.
We can also look at how the aerosol concentration influences the duration–density relationship for varying meteorology. Figure 5a shows best-fit lines of the relationship between the square of fog duration and the maximum surface CWC. Each line is the best-fit relationship for the up to 125 experiments for each aerosol concentration (fewer than 125 only if outlier simulations have been removed). The squared duration was found to have a more linear relationship with the maximum surface CWC than duration alone.1 The slopes of the best-fit lines show that the relationship between squared duration and maximum surface CWC for varying meteorological conditions is stronger for higher aerosol concentrations. In fact, there is essentially no relationship between fog duration and density when meteorological conditions are varied for very low Na.
Figure 5Panel (a) shows relationships between the square of fog duration (an assumed proxy for fog area) and max surface CWC during the fog event. Trend lines are shown for each input value of aerosol content with the 95 % confidence interval shaded. Panel (b) shows the maximum thickness of the subsaturated layer during fog and the cloud droplet deposition velocity in the lowest model level averaged for each value of Na. The standard deviations of are shown for both axes. R2 values are shown for each Na listed in panel (a). Note the low R2 values at low Na, which result from the weak overall relationship between squared fog duration and maximum surface fog density. Relative to the overall simulation variability of fog density at the surface, the trend lines do a good job of describing the relationship between squared duration and density at low Na.
3.3 Aerosol influence on microphysical controls
One explanation for the decrease in fog duration with higher aerosol concentration is presented in Fig. 5b. In our modeled fog case, fog is sometimes present at the surface when relative humidity is less than 100 %. In Fig. 5b, the x axis shows the maximum thickness of the layer of subsaturated air with CWC > 0.01 g kg−1 (which we define to be “cloudy” air) at the bottom of the cloud during fog. It measures how high off the ground the saturation level can be while fog is present at the surface. A lower aerosol number concentration leads to a much thicker (up to 100 m) layer of subsaturated cloud because lower aerosol concentrations typically lead to larger cloud droplets, which fall faster (Fig. 5b) and survive longer in subsaturated air before evaporating. The greater maximum thickness of the subsaturated layer while fog is present is not primarily caused by a less moist boundary layer (not shown) but is instead caused by aerosol concentration influencing the distribution of liquid water within the near-surface layer. Faster-falling droplets lead to a greater flux of liquid water below the saturation level, while slower evaporation allows droplets to persist longer in subsaturated air and continue falling. Essentially, lower Na gives a stratus cloud the ability to reach down farther and touch the ground earlier and for a longer period than it otherwise would. Such considerations can then plausibly explain why model fog has a longer duration at low aerosol concentrations.
However, we hypothesize that the higher fall speed of larger droplets also acts to limit the density of the fog that forms at ground level and that this limitation explains both the weaker relationship between squared fog duration and maximum 2 m cloud liquid water concentration when meteorological conditions are varied and the duration–density trade-off when aerosol concentrations are varied. This hypothesis can be at least qualitatively understood by considering a very simple conceptual model of the liquid water path (LWP). The evolution of the LWP can be understood as a balance between the thermodynamic forcing for cloud growth (Fthermo) and the loss of water due to deposition to the surface. Fthermo includes all processes that lead to condensation or evaporation of water in the cloud as well as large-scale divergence. Surface deposition, neglecting turbulent contributions, will be given by the gravitational settling rate of droplets (vT) and the surface cloud water content. Combined, we have
When the LWP is at its maximum, the tendency is zero and CWCsurf is also maximized:
This equation clearly shows that if the thermodynamic forcing is unchanged by the aerosol concentration (which is not the case as we will discuss next), we expect lower maximum modeled fog density for higher droplet fall speeds associated with reduced aerosol concentrations. Furthermore, to a first approximation, we expect that the (squared) modeled fog duration is proportional to Fthermo given that stronger forcing for cloud water formation ought to imply longer-lived fog. As such, in order to see the modeled fog density and duration scale together with a change in aerosol concentration, Fthermo would need to be more strongly dependent on the aerosol concentration than vT is. Our simulations suggest that this is not the case. Moreover, Eq. (2) tells us that the relationship between fog density and duration (proportional to Fthermo) for a given aerosol concentration (or droplet size) and varying meteorology is given by a slope that is proportional to . That is, duration and fog density will be more weakly related given varying meteorological conditions when the droplet fall speed is high and aerosol concentration is low.
In summary, we see here that modeled meteorological conditions have a reduced ability to modify the fog density when the aerosol concentration is low and that meteorological conditions are much more important for fog density when the aerosol concentration is high. At low aerosol concentrations, fog density at the surface is strongly controlled by the microphysical process of droplet settling. This settling causes liquid water to fall below the saturation level, causing cloud base to extend downward, but increases the rate of liquid water deposition on the surface. The net effect of the higher gravitational settling flux associated with low Na is greater fog duration and reduced fog density at the surface. However, in this discussion, we have not examined any possible influence of the aerosol concentration on the thermodynamic forcing for fog. This is discussed next.
3.4 Aerosol influence on thermodynamic controls
In the previous section, we discussed how cloud droplets can settle through a layer of subsaturated but cloudy air. This layer allows the cloud to reach the surface earlier and more often than it would if this layer were not present in the cloud. However, this is not the only way that the larger, less numerous cloud droplets associated with lower aerosol concentration can lead to increased likelihood of fog formation and longer fog duration. Greater downward flux of liquid water into subsaturated air has the corollary effect of opposing the net upward transport of water vapor through the evaporation of cloud droplets below cloud base. This increases the vertical moisture gradient in the boundary layer and – all else being equal – leads to greater relative humidity near the surface (when the aerosol concentration is low). Additionally, low aerosol concentrations can enhance fog formation by suppressing entrainment. Entrainment warms and dries the boundary layer, which means that more entrainment will tend to suppress clouds and fog formation. A number of studies have found a decrease in liquid water path associated with increased aerosols in non-precipitating clouds, and several mechanisms for this have been proposed involving changes to cloud top evaporation, sedimentation, and radiation that all lead to decreased entrainment for lower aerosol concentrations (Bretherton et al., 2007; Ackerman et al., 2004; Wang et al., 2003; Hill et al., 2008; Williams and Igel, 2021; Igel, 2024). Thus, lower aerosol concentrations and the resulting larger and less numerous droplets decrease the rate of entrainment and can lead to increased liquid water path.
Figure 6 shows the impact of Na on boundary layer moisture loss due to both entrainment and surface deposition for the first half of the simulation. We choose the first half rather than the entire simulation because it is most relevant to fog formation. To isolate the impact of Na on moisture flux and eliminate cases in which the cloud dissipated, we use only background conditions in which all aerosol concentrations led to fog formation and plot the difference in mean moisture loss for each aerosol concentration relative to the mean values for the aerosol base case of 500 cm−3. Positive values indicate more moisture loss in the boundary layer.
Figure 6Impacts of Na on boundary layer moisture loss due to entrainment and surface deposition relative to Na = 500 cm−3. The dashed blue line represents the surface deposition of cloud droplets only, and the dashed black line shows combined moisture loss due to entrainment and cloud droplet deposition.
Based on Fig. 6, we can see that higher aerosol concentrations tend to enhance moisture loss due to entrainment and suppress moisture loss due to surface deposition. The increased entrainment with higher aerosol concentration is consistent with the previous studies cited above. Greater entrainment flux also increases the temperature of the boundary layer, meaning that the thermodynamic response of the boundary layer to decreased aerosol concentration due to its impact on entrainment is favorable to fog. However, we also see that there is greater net moisture loss at low aerosol concentrations due to surface deposition, which is primarily comprised of drizzle (defined as droplets with radius greater than or equal to 40 µm). Although not directly comparable, the difference in moisture loss across the range of aerosol concentrations (about 50 g m-2) is consistent with the differences in LWP shown in Fig. 2. Despite the greater aerosol concentrations being thermodynamically less favorable to LWP and CWC, fog density is more strongly impacted by surface deposition. In other words, the two terms in Eq. (2) have opposite dependencies on the aerosol concentration and our simulations suggest that the dependence of the settling speed on aerosol concentration is greater.
In summary, so far, we have seen that modeled microphysical changes (enhanced precipitation formation and faster fall speeds) and thermodynamic changes (reduced entrainment) at low aerosol concentrations compete with one another to determine the relationship between aerosol concentration and fog density. Our simulations suggest that the microphysical changes dominate. However, these processes work together to give rise to longer-lived (earlier-forming) fog at low aerosol concentrations. Faster-falling droplets that form more easily at low Na reach the surface faster, and suppressed entrainment, while eventually being of less importance than precipitation enhancement for determining the LWP, will favor earlier fog formation.
3.5 Relative importance of microphysical and thermodynamic processes
To better understand the relative importance of thermodynamics and microphysics in the relationship between aerosol concentration and fog duration, we perform some additional analysis with alternative definitions of fog presence. The default fog condition in our experiment is a CWC of 0.01 g kg−1 in the lowest model level. This fog identification condition is sensitive to both proposed mechanisms and notably allows fog to be present even if the air is subsaturated. In an attempt to identify which mechanism or mechanisms are important for the simulated response of fog duration to aerosol, we created two pseudo-fog onset conditions. The first is simple and based on the relative humidity at the 2 m level. When the relative humidity near the surface reaches a threshold value of 99 %, it is considered fog. We do not use RH = 100 % because too few simulations achieve saturation at the 2 m level. This condition is still susceptible to the impact of below-cloud evaporation, which can increase relative humidity below cloud base. It is also sensitive to the redistribution of moisture throughout the boundary layer by any other means, like turbulence. To control for this as well, we create a “mixed boundary layer” onset condition that corrects for the potential redistribution of moisture within the boundary layer and calculates what the relative humidity at 10 m would be if the boundary layer were well-mixed. To find this, we calculate the mean liquid water potential temperature and the density-weighted mean moisture (both liquid and vapor) concentration for the boundary layer. Then, we calculate what the relative humidity at 10 m would be if its potential temperature and water vapor mixing ratio were equal to these means to give us a relative humidity value for the 10 m level if energy and water content were constant with height within the boundary layer. We choose a threshold value of 98 % as our fog condition to ensure that a reasonable number of simulations “form” fog.
Figure 7 shows expected fog duration as a function of Na for each of our three fog identification conditions. We see that different relationships between our fog identification conditions at different aerosol conditions indicate that different proposed mechanisms for the relationship between aerosol and fog duration dominate over different portions of our aerosol concentration range.
Figure 7Fog duration difference as a function of Na for the standard fog condition, the 2 m relative humidity fog condition, and the mixed boundary layer fog condition. Shaded regions represent 95 % confidence intervals.
At values of Na of ∼ 300 cm−3 and below, the three lines diverge. The default CWC threshold shows fog enhancement at the lowest concentration, while the 2 m RH condition shows a moderate fog reduction and the mixed boundary layer fog condition shows a substantial reduction in fog, which indicates that the microphysical processes are most important for explaining the enhanced fog duration as aerosol concentration decreases. We suspect that the relationship between the mixed boundary layer fog condition and Na, as well as the relationships between the three lines, can be primarily explained by gravitational settling impacting both the relative humidity profile and cloud water concentration profile below the saturation level base.
Above Na ∼ 500 cm−3, the relationship between aerosol and fog is not significantly impacted by the fog identification condition. This indicates that entrainment is the most important of our proposed physical mechanisms within this range of aerosol concentrations. This explains the effect shown in Fig. 3, where fog is much more sensitive to aerosol when geostrophic wind is high compared to when it is low. Higher wind speed increases turbulence in the boundary layer through mechanical shearing, which in turn increases entrainment. When geostrophic wind speed is low, leading to weaker entrainment and mixing between the boundary layer and free troposphere, then the impact of aerosol concentration on entrainment is correspondingly weakened. High geostrophic wind speed, on the other hand, both suppresses fog and enhances the suppressive effect that high Na has on fog overall.
Our study investigates the sensitivity of marine fog formed through cloud base lowering to aerosols under different meteorological conditions using PAFOG, a single-column model with a 2-D spectral bin microphysics scheme, MISTRA. Varying aerosol number concentrations from 100 to 1500 cm−3 changed the overall simulation fog duration by about 60 %. Moreover, lower aerosol concentration led to both lower fog density and longer-lived fog. These seemingly paradoxical results were explored by examining both microphysical and thermodynamic processes.
Lower aerosol concentrations lead to fewer, larger cloud droplets that have a higher gravitational settling rate. This higher gravitational settling rate enhances fog formation and duration by fluxing liquid water below cloud base. It also allows for the formation of a substantial layer of subsaturated but cloudy (CWC > 0.01 g kg−1) air. This is a microphysical response that cannot be understood by examining the thermodynamic properties of the boundary layer alone. That said, lower aerosol concentrations also suppress entrainment warming and drying, which makes fog thermodynamically more favorable. At the beginning of the fog life cycle, these processes support earlier fog formation. Which is more important may depend on the aerosol concentration, with the microphysical responses being more important at low concentrations and the thermodynamic responses being more important at high concentrations.
As the fog matures, the higher gravitational settling at low aerosol concentration increases surface deposition. Suppressed entrainment still favors an enhancement in fog density at low aerosol concentrations, but the rapid removal of cloud water by surface deposition outweighs this thermodynamic response. Overall the fog density is limited at low aerosol concentrations. In addition, low aerosol concentration makes fog density much less sensitive to the environmental conditions in which it forms.
The sensitivity of fog formation to aerosol concentration was dependent on the environmental conditions. Conditions that support high entrainment rates, such as high wind speeds, are substantially more susceptible to the aerosol concentration, likely as a result of the ability of aerosol concentration to modify the entrainment rate.
One caveat to our result that low aerosol concentration increases fog duration is that we used a cloud water threshold to define fog rather than a more traditional definition based on visibility. Visibility is greater for a given cloud water content when droplets are large, as is the case in low-aerosol conditions. If we had used a visibility-based fog definition, the duration sensitivity to aerosol concentration would not have been as large. Another potential pitfall is this study's reliance on PAFOG. Though PAFOG has performed well in past studies (Kim and Yum, 2013; Kim et al., 2020b, a; Chen et al., 2021) and demonstrated generally good agreement with other SCMs in the Demistify intercomparison (Boutle et al., 2022), it is just one model. Experiments using other models could help validate these results, and observational work can aid in the application of these findings to real-world contexts. Despite these qualifications, our observation of two competing mechanisms that drive the response to aerosol and multiple fog–aerosol response regimes that can be modulated by meteorological conditions in this experiment highlights the importance of studying the response of fog to microphysics under a variety of circumstances.
Code and model output data appearing in figures are available at https://doi.org/10.5281/zenodo.15475331 (Pope and Igel, 2025).
NHP performed the investigation and analysis and wrote the original draft. ALI supervised the project and edited and reviewed the writing.
The contact author has declared that neither of the authors has any competing interests.
Publisher's note: Copernicus Publications remains neutral with regard to jurisdictional claims made in the text, published maps, institutional affiliations, or any other geographical representation in this paper. While Copernicus Publications makes every effort to include appropriate place names, the final responsibility lies with the authors.
We thank Andreas Bott for providing the source code for the PAFOG model. We also thank the anonymous reviewers for providing constructive comments to improve the manuscript.
This research has been supported by the Office of Naval Research (grant no. N00014-20-1-2304-0).
This paper was edited by Shaocheng Xie and reviewed by two anonymous referees.
Ackerman, A. S., Kirkpatrick, M. P., Stevens, D. E., and Toon, O. B.: The impact of humidity above stratiform clouds on indirect aerosol climate forcing, Nature, 432, 1014–1017, 2004. a
Anderson, J. B.: Observations from airplanes of cloud and fog conditions along the southern California coast, Mon. Weather Rev., 59, 264–270, 1931. a
Bott, A. and Trautmann, T.: PAFOG—A new efficient forecast model of radiation fog and low-level stratiform clouds, Atmos. Res., 64, 191–203, 2002. a
Bott, A., Sievers, U., and Zdunkowski, W.: A radiation fog model with a detailed treatment of the interaction between radiative transfer and fog microphysics, J. Atmos. Sci., 47, 2153–2166, 1990. a
Bott, A., Trautmann, T., and Zdunkowski, W.: A numerical model of the cloud-topped planetary boundary-layer: Radiation, turbulence and spectral microphysics in marine stratus, Q. J. Roy. Meteor. Soc., 122, 635–667, 1996. a
Boutle, I., Price, J., Kudzotsa, I., Kokkola, H., and Romakkaniemi, S.: Aerosol–fog interaction and the transition to well-mixed radiation fog, Atmos. Chem. Phys., 18, 7827–7840, https://doi.org/10.5194/acp-18-7827-2018, 2018. a
Boutle, I., Angevine, W., Bao, J.-W., Bergot, T., Bhattacharya, R., Bott, A., Ducongé, L., Forbes, R., Goecke, T., Grell, E., Hill, A., Igel, A. L., Kudzotsa, I., Lac, C., Maronga, B., Romakkaniemi, S., Schmidli, J., Schwenkel, J., Steeneveld, G.-J., and Vié, B.: Demistify: a large-eddy simulation (LES) and single-column model (SCM) intercomparison of radiation fog, Atmos. Chem. Phys., 22, 319–333, https://doi.org/10.5194/acp-22-319-2022, 2022. a, b
Bretherton, C., Blossey, P. N., and Uchida, J.: Cloud droplet sedimentation, entrainment efficiency, and subtropical stratocumulus albedo, Geophys. Res. Lett., 34, L03813, https://doi.org/10.1029/2006GL027648, 2007. a
Chen, C., Zhang, M., Perrie, W., Chang, R., Gultepe, I., Fernando, H. J., and Chen, X.: A Case Study: Evaluation of PAFOG One-D Model With Advection in Simulations of Fog/Stratus From C-FOG Experiment, J. Geophys. Res.-Atmos., 126, e2021JD034812, https://doi.org/10.1029/2021JD034812, 2021. a, b
Dorman, C. E., Grachev, A. A., Gultepe, I., and Fernando, H. J.: Toward Improving Coastal-Fog Prediction (C-FOG), Bound.-Lay. Meteorol., 181, 167–170, https://doi.org/10.1007/s10546-021-00664-8, 2021. a
Dupont, J.-C., Haeffelin, M., Protat, A., Bouniol, D., Boyouk, N., and Morille, Y.: Stratus–fog formation and dissipation: a 6-day case study, Bound.-Lay. Meteorol., 143, 207–225, 2012. a
Duynkerke, P. G.: Turbulence, radiation and fog in Dutch stable boundary layers, Bound.-Lay. Meteorol., 90, 447–477, 1999. a
Fernando, H. J., Gultepe, I., Dorman, C., Pardyjak, E., Wang, Q., Hoch, S., Richter, D., Creegan, E., Gaberšek, S., Bullock, T., Hocut, C., Chang, R., Alappattu, D., Dimitrova, R., Flagg, D., Grachev, A., Krishnamurthy, R., Singh, D. K., Lozovatsky, I., Nagare, B., Sharma, A., Wagh, S., Wainwright, C., Wroblewski, M., Yamaguchi, R., Bardoel, S., Coppersmith, R. S., Chisholm, N., Gonzalez, E., Gunawardena, N., Hyde, O., Morrison, T., Olson, A., Perelet, A., Perrie, W., Wang, S., and Wauer, B.: C-FOG: life of coastal fog, B. Am. Meteorol. Soc., 102, E244–E272, 2021. a
Fitzgerald, J. W.: Marine aerosols: A review, Atmos. Environ. A-Gen., 25, 533–545, 1991. a
Gultepe, I. (Ed.) and Milbrandt, J.: Microphysical observations and mesoscale model simulation of a warm fog case during FRAM project, in: Fog and boundary layer clouds: Fog visibility and forecasting, Springer, 1161–1178, https://doi.org/10.1007/978-3-7643-8419-7_4, 2007. a, b
Gultepe, I., Isaac, G., Leaitch, W., and Banic, C.: Parameterizations of marine stratus microphysics based on in situ observations: Implications for GCMs, J. Climate, 9, 345–357, 1996. a
Gultepe, I., Tardif, R., Michaelides, S., Cermak, J., Bott, A., Bendix, J., Müller, M. D., Pagowski, M., Hansen, B., Ellrod, G., Jacobs, W., Toth, G., and Cober, S. G.: Fog research: A review of past achievements and future perspectives, Pure Appl. Geophys., 164, 1121–1159, 2007. a, b
Haeffelin, M., Bergot, T., Elias, T., Tardif, R., Carrer, D., Chazette, P., Colomb, M., Drobinski, P., Dupont, E., Dupont, J.-C., Gomes, L., Musson-Genon, L., Pietras, C., Plana-Fattori, A., Protat, A., Rangognio, J., Raut, J.-C., Rémy, S., Richard, D., Sciare, J., and Zhang, X.: PARISFOG: Shedding new light on fog physical processes, B. Am. Meteorol. Soc., 91, 767–783, 2010. a, b, c
Hill, A., Dobbie, S., and Yin, Y.: The impact of aerosols on non-precipitating marine stratocumulus. I: Model description and prediction of the indirect effect, Q. J. Roy. Meteor. Soc. 134, 1143–1154, 2008. a
Igel, A. L.: Processes Controlling the Entrainment and Liquid Water Response to Aerosol Perturbations in Non-Precipitating Stratocumulus Clouds, J. Atmos. Sci., 81, 1605–1616, 2024. a
Kim, C. K. and Yum, S. S.: A study on the transition mechanism of a stratus cloud into a warm sea fog using a single column model PAFOG coupled with WRF, Asia-Pac. J. Atmos. Sci., 49, 245–257, 2013. a, b
Kim, W., Yum, S. S., Hong, J., and Song, J. I.: Improvement of fog simulation by the nudging of meteorological tower data in the WRF and PAFOG coupled model, Atmosphere, 11, 311, https://doi.org/10.3390/atmos11030311, 2020a. a, b
Kim, W., Yum, S. S., and Kim, C. K.: Numerical simulation of sea fog over the Yellow Sea: comparison between UM+ PAFOG and WRF+ PAFOG coupled systems, Asia-Pac. J. Atmos. Sci., 56, 89–105, 2020b. a, b
Koračin, D.: Modeling and forecasting marine fog, in: Marine fog: challenges and advancements in observations, modeling, and forecasting, edited by: Koračin, D. and Dorman, C. E., Springer, 425–475, https://doi.org/10.1007/978-3-319-45229-6, 2017. a, b, c
Koračin, D. and Dorman, C. E.: Marine atmospheric boundary layer divergence and clouds along California in June 1996, Mon. Weather Rev., 129, 2040–2056, 2001. a
Koračin, D., Lewis, J., Thompson, W. T., Dorman, C. E., and Businger, J. A.: Transition of stratus into fog along the California coast: Observations and modeling, J. Atmos. Sci., 58, 1714–1731, 2001. a, b, c, d, e, f
Koračin, D., Businger, J. A., Dorman, C. E., and Lewis, J. M.: Formation, evolution, and dissipation of coastal sea fog, Bound.-Lay. Meteorol., 117, 447–478, 2005. a, b
Koračin, D., Dorman, C. E., Lewis, J. M., Hudson, J. G., Wilcox, E. M., and Torregrosa, A.: Marine fog: A review, Atmos. Res., 143, 142–175, 2014. a, b, c
Leipper, D. F.: Fog on the US west coast: A review, B. Am. Meteorol. Soc., 75, 229–240, 1994. a, b, c, d
Lewis, J., Koracin, D., Rabin, R., and Businger, J.: Sea fog off the California coast: Viewed in the context of transient weather systems, J. Geophys. Res.-Atmos., 108, 4457, https://doi.org/10.1029/2002JD002833, 2003. a, b
Lewis, J., Koračin, D., and Redmond, K.: Sea fog research in the United Kingdom and United States: A historical essay including outlook, B. Am. Meteorol. Soc., 85, 395–408, 2004. a, b, c
Mccumber, M. C. and Pielke, R. A.: Simulation of the effects of surface fluxes of heat and moisture in a mesoscale numerical model: 1. Soil layer, J. Geophys. Res.-Oceans, 86, 9929–9938, 1981. a
Mellor, G. L. and Yamada, T.: A hierarchy of turbulence closure models for planetary boundary layers, J. Atmos. Sci., 31, 1791–1806, 1974. a
Mellor, G. L. and Yamada, T.: Development of a turbulence closure model for geophysical fluid problems, Rev. Geophys., 20, 851–875, 1982. a
Niu, S., Liu, D., Zhao, L., Lu, C., Lü, J., and Yang, J.: Summary of a 4-year fog field study in northern Nanjing, Part 2: Fog microphysics, Pure Appl. Geophys., 169, 1137–1155, 2012. a, b
Oliver, D., Lewellen, W., and Williamson, G.: The interaction between turbulent and radiative transport in the development of fog and low-level stratus, J. Atmos. Sci., 35, 301–316, 1978. a, b
Pilié, R., Mack, E., Rogers, C., Katz, U., and Kocmond, W.: The formation of marine fog and the development of fog-stratus systems along the California coast, J. Appl. Meteorol. Clim., 18, 1275–1286, 1979. a, b, c, d, e, f, g, h, i, j
Pope, N. and Igel, A.: Processed model output in support of Pope and Igel 2025, Zenodo [code/data set], https://doi.org/10.5281/zenodo.15475331, 2025. a, b
Pope, N. H. and Igel, A. L.: Identifying Important Microphysical Properties and Processes for Marine Fog Forecasts, Mon. Weather Rev., 151, 2427–2441, 2023. a, b, c
Stolaki, S., Haeffelin, M., Lac, C., Dupont, J.-C., Elias, T., and Masson, V.: Influence of aerosols on the life cycle of a radiation fog event. A numerical and observational study, Atmos. Res., 151, 146–161, 2015. a
Tardif, R. and Rasmussen, R. M.: Evaporation of nonequilibrium raindrops as a fog formation mechanism, J. Atmos. Sci., 67, 345–364, 2010. a
Wagh, S., Krishnamurthy, R., Wainwright, C., Wang, S., Dorman, C. E., Fernando, H. J., and Gultepe, I.: Study of Stratus-Lowering Marine-Fog Events Observed During C-FOG, Bound.-Lay. Meteorol., 181, 317–344, 2021. a, b
Wang, S., Wang, Q., and Feingold, G.: Turbulence, condensation, and liquid water transport in numerically simulated nonprecipitating stratocumulus clouds, J. Atmos. Sci., 60, 262–278, 2003. a
Williams, A. S. and Igel, A. L.: Cloud top radiative cooling rate drives non-precipitating stratiform cloud responses to aerosol concentration, Geophys. Res. Lett., 48, e2021GL094740, https://doi.org/10.1029/2021GL094740, 2021. a
Wood, R. and Bretherton, C. S.: Boundary layer depth, entrainment, and decoupling in the cloud-capped subtropical and tropical marine boundary layer, J. Climate, 17, 3576–3588, 2004. a
Zdunkowski, W., Panhans, W., Welch, R., and Korb, G.: Radiation scheme for circulation and climate models, Contrib. Atmos. Phys., 55, 215–238, 1982. a, b
Zhao, L., Niu, S., Zhang, Y., and Xu, F.: Microphysical characteristics of sea fog over the east coast of Leizhou Peninsula, China, Adv. Atmos. Sci., 30, 1154–1172, 2013. a
If we think of the diurnal cycle as forcing fog onset and dissipation, then different parts of the day are conducive to fog formation and “densifying” (in this case the first half of the simulation corresponding to afternoon and night), or fog thinning and dissipation (the morning). In a well-mixed layer, the rate at which cloud base lowers prior to fog onset will be proportional to the rate at which cloud becomes denser at a fixed height and will therefore also be roughly proportional to the rate at which the fog becomes denser after fog onset. This means that when conditions are more favorable to fog, not only will it form earlier, giving it more time to densify before conditions become unfavorable to fog, it will also become denser more rapidly during that time. The combined effect of a longer time during which the fog becomes more dense and a faster rate of densification tells us that peak fog density ought to be roughly proportional to the square of fog duration.