the Creative Commons Attribution 4.0 License.
the Creative Commons Attribution 4.0 License.
 | 26 May 2025
Impact on the stratocumulus-to-cumulus transition of the interaction of cloud microphysics and macrophysics with large-scale circulation
Je-Yun Chun
Peter N. Blossey
Sarah J. Doherty
This study examines the impact of the interaction of cloud microphysics and macrophysics with the large-scale circulation on the stratocumulus-to-cumulus transition (SCT) using a large-eddy simulation (LES) combined with weak-temperature-gradient (WTG) parameterization. The WTG approximates large-scale circulation by inducing domain-mean subsidence to counter buoyancy perturbations relative to a reference thermodynamic profile. A stationary sea-salt sprayer perturbs transitioning clouds over a Lagrangian domain.
Results show that the cloud response to aerosol injection differs significantly depending on whether stratified adjustments in the large-scale circulation in response to buoyancy perturbations are considered. Aerosol injection suppresses precipitation and enhances entrainment in both cases. Additionally, reduced surface sensible heat flux by precipitation suppression weakens boundary layer turbulence. Without the WTG, cloud-top height rises without a compensating adjustment in subsidence, delaying drizzle-induced stratocumulus thinning (“drizzle-depletion” feedback) by several days.
With the WTG, intensified subsidence restrains cloud-top growth and accelerates stratocumulus thinning, leading to reduced boundary layer turbulence by weakened longwave cloud-top cooling and increased susceptibility to cloud breakup. For lightly precipitating clouds, aerosol injection accelerates the SCT by enhancing cloud thinning through warming driven by increased entrainment (“deepening–warming” mechanism). For heavily precipitating clouds, where the SCT is dominated by drizzle-depletion feedback, aerosol injection delays the SCT marginally as intensified subsidence amplifies the deepening–warming mechanism.
These findings suggest that ignoring large-scale circulation adjustments in limited-domain models may overestimate aerosol cooling effects by ∼15–30 W m−2.
- Article
(8939 KB) - Full-text XML
- BibTeX
- EndNote


Subtropical marine clouds are a focal area in climate research due to their pivotal role in shaping the Earth's energy balance (Wood, 2012). The cooling influence of overcast low marine clouds results from their efficient reflection of solar insolation and from their emission of outgoing longwave radiative flux being comparable in intensity to that from the ocean surface. As air masses flow equatorward along the trade winds, these clouds undergo cloud breakup within a few days, a process referred to as the stratocumulus-to-cumulus transition (SCT). The SCT is driven by rising sea surface temperatures (SSTs) and evolving meteorological dynamics associated with the descending branches of the Hadley circulation (e.g., Albrecht et al., 1995; Norris, 1998; Wood and Bretherton, 2006). The large-scale circulation modulates large-scale subsidence (e.g., Myers and Norris, 2013; van der Dussen et al., 2016) and inversion instability (e.g., Wood and Bretherton, 2006; Sandu et al., 2010), both of which significantly impact the SCT. The large-scale circulation, in turn, responds to variations in the heat balance caused by changes in the meridional gradient of SST (e.g., Bjerknes, 1966) and by radiative forcing. The current generation of weather and climate models has particular difficulty in constraining the radiative effects of clouds along the SCT because the pivotal processes relevant to the clouds span such a broad range of scales and because interactions between scales are complex (Bony and Dufresne, 2005; Zelinka et al., 2017).
One fundamental mechanism causing the SCT is the “deepening–warming” feedback (Krueger et al., 1995; Bretherton and Wyant, 1997; Wyant et al., 1997). As air masses are advected with the trade winds over a warming ocean surface, surface latent heat flux (LHF) increases, thereby deepening the marine boundary layer (MBL). Cloud-top cooling, which is a main source of boundary layer turbulence over the shallow stratocumulus-topped MBL, becomes insufficient to overcome warming caused by the entrainment of free-tropospheric air. Simultaneously, the enhanced surface LHF promotes the formulation of cumulus clouds, inducing penetrative entrainment by cumulus updrafts. This further promotes the entrainment of dry and warm air from the free troposphere (FT). The combined effect accelerates the dissipation of the stratocumulus layer, thereby resulting in the SCT. Another process that can drive the SCT is the “drizzle-depletion” feedback (Wood et al., 2011; Xue et al., 2008; Yamaguchi et al., 2017). Once drizzle is initiated, rain droplets accrete cloud droplets (collision-coalescence, Wood, 2006) and scavenge aerosol particles, both of which ultimately reduce the number of cloud-forming aerosols. The reduced aerosol loading results in larger rain droplets which more effectively collide with other droplets, further reducing aerosol concentrations. This positive feedback loop can quickly deplete the stratocumulus layer, thereby resulting in the SCT.
Aerosols have been identified as an important modulator of cloud and MBL properties and thus potentially of the SCT and resulting cloud radiative effect. An increase in the concentration of aerosols that act as cloud condensation nuclei (CCN) results in more numerous and smaller cloud droplets, thereby increasing cloud albedo when cloud macrophysical properties are unchanged (Twomey effect, Twomey, 1974, 1977). This change in cloud droplet size can, however, then influence the cloud macrophysical properties and therefore the SCT. The SCT is delayed and even inhibited when typical pristine low cloud precipitation is suppressed by aerosol perturbations. The reduced cloud droplet and raindrop sizes reduce the collision–coalescence efficiency, thereby interrupting the positive feedback loop of the drizzle-depletion process (Lifetime effect, Albrecht, 1989). On the other hand, with smaller and more numerous cloud droplets, the overall droplet sedimentation velocity is reduced, so more droplets remain closer to the inversion layer (Bretherton et al., 2007). Cloud droplets in contact with the dry and warm free troposphere are efficiently evaporated and, in turn, hasten the mixing of free-tropospheric air into the cloud layer (Zhou et al., 2017). This tends to desiccate the stratocumulus layer, thereby hastening the SCT. Another possible process weakening the aerosol effect of enhancing cloud lifetime is that the cloud deepening caused by drizzle suppression, in turn, increases the potential for rain production enough to offset the initial suppression of precipitation (Stevens and Feingold, 2009; Seifert et al., 2015). These complex, sometimes countervailing cloud responses, are strongly dependent on atmospheric conditions and are entangled with each other (Stevens and Feingold, 2009; Gryspeerdt et al., 2019) such that the net impact on the cloud radiative effect remains very uncertain.
Large-eddy simulations (LESs) are a useful tool to investigate the impact of aerosols on the SCT because they explicitly resolve processes fundamental to cloud physics and dynamics (e.g., Sandu and Stevens, 2011; Yamaguchi et al., 2017; Blossey et al., 2021). However, it is not yet feasible to routinely run larger regional- or global-scale LESs due to the huge computational cost. Simulations with more limited (e.g., <100 km) domains, which have been widely used, cannot represent the interactions between all the relevant scales of physics and dynamics ranging from microphysics to the large-scale circulation, all of which play an important role in the SCT. Previous studies have demonstrated that the modification of large-scale thermodynamics and dynamics can modulate the SCT. Diamond et al. (2022) show that the adjustment in subsidence can modify the thermodynamic profiles as well as the entrainment drying and warming. Dagan (2022) reveals that the large-scale changes in the thermodynamic and dynamic conditions by subtropical rain suppression potentially enhance tropical cloudiness. This interplay between the modification in microphysics and large-scale conditions complicates the response of clouds to aerosol perturbation.
The primary objective of this study is to comprehensively explore the intricate interplay between various scales, spanning microphysics to the large-scale circulation, and their impact on the SCT. Within this context, our investigation focuses on evaluating the potential effectiveness and practicality of implementing a climate intervention approach known as marine cloud brightening (MCB) (Latham, 1990). MCB involves the deliberate injection of sea-salt aerosols into subtropical low clouds as a means to counteract anthropogenic global warming.
A question is whether cloud macrophysical changes resulting from aerosol perturbations characteristic of MCB would be affected by the adjustment of the large-scale circulation. Localized perturbations in convection, which can be caused by a strong horizontal gradient of precipitation, significantly modify marine boundary layer buoyancy profiles. Yet, as validated from observations such as in pockets of open cells and ship tracks, horizontal gradients in buoyancy and boundary layer depth are small (Bretherton et al., 2010). This results from an adjustment in subsidence, which acts as a remote feedback that homogenizes the buoyancy profile (Sobel and Bretherton, 2000).
To quantify the effect of this adjustment on cloud evolution, we employ a large-eddy simulation (LES) model integrated with a weak-temperature-gradient (WTG) approximation, where the latter parameterizes the remote adjustments of subsidence facilitated by gravity waves, thereby minimizing tropical buoyancy perturbations (Sobel and Bretherton, 2000; Blossey et al., 2009; Bretherton and Blossey, 2017). Aerosol–cloud interactions in deep convective clouds have been studied using WTG methods (e.g., Anber et al., 2019; Abbott and Cronin, 2021). WTG methods have also been extended to model the interactions and exchanges between two separate simulations (e.g., Daleu et al., 2012), and Dagan (2022) used such a two-column WTG method to study the impact of aerosol perturbations on the coupled evolution of tropical and subtropical columns, finding that subtropical aerosol perturbations could have downstream impacts if they reach deep convective regions. Because our focus on the SCT places our simulations far from deep convective regions and for simplicity, our implementation of the WTG includes only a single column (our LES simulation) and uses fixed large-scale buoyancy soundings. Such single-column WTG methods do not, in general, account for the impact of local heating anomalies on the large-scale buoyancy sounding that might result from dense and basin-wide application of MCB. Larger-scale (e.g., regional- to global-scale) simulations will explicitly simulate these large-scale circulation responses to aerosol perturbations and cloud brightening. However, these larger-scale models can not resolve the small-scale processes driving cloud adjustments to perturbations and as such will not capture the coupling between cloud responses and the large-circulation change and the resulting feedbacks to cloud brightening.
This article is structured as follows: in Sect. 2, we provide detailed insights into our model configurations and WTG setup, while in Sect. 3, we present a comparative analysis of simulation outcomes and contrasting scenarios with and without the WTG and with and without aerosol injection.
2.1 Model
For the LES modeling we use the System for Atmospheric Modeling (SAM) version 6.10, built with a finite difference representation of the anelastic system on the Arakawa C-grid spatial discretization (Khairoutdinov and Randall, 2003). The horizontal grid spacing is 50 m in both the x and y directions, and the vertical resolution is 10 m near the cloud layer (600–2000 m altitude), gradually stretching to 15 m down to the surface (0–600 m) and up to 100 m at the top of the model domain (3600 m). The horizontal domain size is , with grid numbers . The model time step is adaptive with a typical value of ∼0.5–1 s. Doubly periodic boundary conditions are used for both the x and y directions. Advection of scalar fields, such as moisture, liquid-ice static energy and aerosols, is treated using an advection scheme that preserves monotonicity (Blossey and Durran, 2008). The subgrid-scale turbulence is parameterized using a 1.5-order turbulent closure model with a prognostic formulation of turbulent kinetic energy. The Rapid Radiative Transfer Model for GCMs (RRTMG; Mlawer et al., 1997) calculates short- and longwave radiative transfer and includes the overlying atmosphere above the LES model top (≈3.6 km) in the computation of radiative heating rates and fluxes. Sensible and latent heat fluxes from the ocean surface in each grid box are estimated considering interaction with the surface turbulence based on Monin–Obukhov theory.
The two-moment Morrison microphysics scheme (Morrison and Grabowski, 2008) predicts the number concentrations and mixing ratios of liquid water cloud droplets and rain droplets. The cloud microphysics scheme is coupled with a bulk aerosol scheme (Berner et al., 2013), predicting the number and dry mass of a single lognormal accumulation mode with a fixed geometric standard deviation of 1.5. The conversion among dry aerosols, clouds and rain droplets is represented using activation (Abdul-Razzak and Ghan, 2000), autoconversion and accretion (Khairoutdinov and Kogan, 2000), and precipitation evaporation and scavenging of interstitial aerosol by cloud droplets and rain (see appendix in Berner et al., 2013).
The natural sea-salt spray aerosol number and mass fluxes are diagnosed based on the wind speed, and all of these aerosols are in a single, lognormal accumulation mode with a characteristic radius of 130 nm (Clarke et al., 2006; Berner et al., 2013). The injected aerosols also have a mean dry diameter of 255 nm because the model version used here has a single-mode aerosol scheme with a fixed width and is not set up to accurately represent aerosol particles with a wide range of sizes. This size is larger than that which has been identified as the optimal size for the purpose of MCB (30–100 nm in diameter, Wood, 2021).
Condensation occurs when the water vapor mixing ratio exceeds the saturation mixing ratio, which is estimated using saturation adjustment. Thus, only the influence of cloud droplet size and number on droplet sedimentation is considered, while their impact on droplet evaporation is not (see, e.g., Ackerman et al., 2004, 2009). Ice-phase hydrometeor species are not considered because the simulation domain is below the freezing level everywhere.
2.2 Weak temperature gradient (WTG)
The WTG scheme used in this study is based on the approach given in Appendix A in Blossey et al. (2009). The weak-temperature-gradient (WTG) approximation assumes that in low-latitude regions, gravity waves quickly adjust the temperature profile in each atmospheric column to achieve a nearly uniform (i.e., minimized horizontal temperature gradient), moist-adiabatic state across the tropics. This adjustment leads to a vertical velocity feedback mechanism, which compensates for diabatic heating differences by inducing large-scale vertical motion. Under the WTG, this induced vertical velocity serves to regulate temperature anomalies by redistributing air within the column. The basic principle of the WTG approximation is that domain-mean anomalies of virtual temperature in the simulated column are calculated relative to location- and time-dependent climatological buoyancy profiles, and these are used as the primary drivers of the perturbation in the column mean vertical motion. This approach ensures that any perturbations in heating within the column prompt an offsetting large-scale subsidence or ascent, maintaining thermal stability.
The core of the WTG approach in this study involves solving a modified gravity wave equation, as presented in Blossey et al. (2009), to adjust vertical velocity in response to column heating. This adjustment can be described by the following equation:
where ω′ is the pressure velocity perturbation in response to local temperature anomalies; f is the Coriolis parameter, representing rotational effects on large-scale circulation; am is momentum damping rate, which parameterizes the effect of gravity waves and turbulence; k is the horizontal wavenumber, defining the scale over which temperature anomalies adjust; Rd is the specific gas constant for dry air; is the virtual temperature anomaly, representing the deviation of the column temperature from a reference state; and p is the pressure, with boundaries at surface and tropopause pressures. Here, we use vertically uniform am=0.5 d−1 and a value of horizontal wavenumber k corresponding to a wavelength of 1300 km, as in Blossey et al. (2009).
Sandu et al. (2010) demonstrated that the composite transition derived from Lagrangian analysis closely resembles a climatological transition constructed in an Eulerian framework. Based on this, we assume that the climatological buoyancy profiles along the composite trajectory accurately represent the background buoyancy profiles. For our analysis, we use ERA5 climatological data from the summer months of 2002–2005 (June–August (JJA)) along the climatological trajectory over the northeast Pacific, as detailed in Table C1 of Sandu et al. (2010). The specifics of how subsidence adjustments are applied using the WTG approach are described in Appendix A of Blossey et al. (2009).
2.3 Data
The SCT simulations are based on the initial profiles and SST evolution developed by Sandu and Stevens (2011) and the modified subsidence for a better representation of the subsidence rate at the inversion height in Bretherton and Blossey (2014), which are used for the 3 d Lagrangian advection of a composite climatological, low-level isobaric trajectory over the JJA northeast Pacific; therefore, the detailed descriptions of the setups are provided there. Here, we mainly focus on the reference (REF) and the fast (FAST) transition cases. The FAST case has a higher SST, weaker large-scale divergence, deeper initial boundary layer depth and higher moisture in the MBL and FT than the REF case (see Figs. 2 and 5 in Sandu and Stevens, 2011). The potential temperature jump across the inversion layer is much weaker in the FAST than in the REF case.
Table 1 summarizes the cases analyzed in this study. This study mainly focuses on three cases. The first case (REFNO) is the REF case without implementation of the WTG, and thus, subsidence is prescribed as given in Bretherton and Blossey (2014). The remaining two cases (REFWTG and FASTWTG) are the REF and FAST cases with the implementation of the WTG, respectively, so that subsidence is adjusted based on the ERA5 climatological thermodynamic profiles as described in Sect. 2.2. Although subsidence correction by Bretherton and Blossey (2014) does reduce buoyancy anomalies, small anomalies can still persist. Consequently, the implementation of the WTG induces a minor change in subsidence within the simulation, leading to variations in cloud and MBL properties. This rationale underlies the necessity of running simulations without aerosol injection for both REFNO and REFWTG cases to establish a clear baseline for comparing background and perturbed conditions. The aerosol number concentration, Na, in the MBL and FT is 33 and 100 cm−3, respectively, in the three cases. The lower value of MBL Na (i.e., 33 cm−3) than the climatological value (greater than ∼100 cm−3) is chosen to produce precipitation enough to be influenced by aerosol injections, while the FT Na value is a climatological mean value (e.g., Mohrmann et al., 2018). To test the sensitivity to aerosol loadings, three additional REF cases with the WTG are conducted: (i) the aerosol injection rate is reduced to one-fourth of that in other cases (REFweak), (ii) Na in the lower FT is reduced from 100 to 55 cm−3 (REFFT) and (iii) background Na in the MBL is increased to 300 cm−3 (REFMBL). Since the results from the additional three cases are consistent with the conclusions from the main cases, we briefly investigate them in Appendix C.
Sandu and Stevens (2011)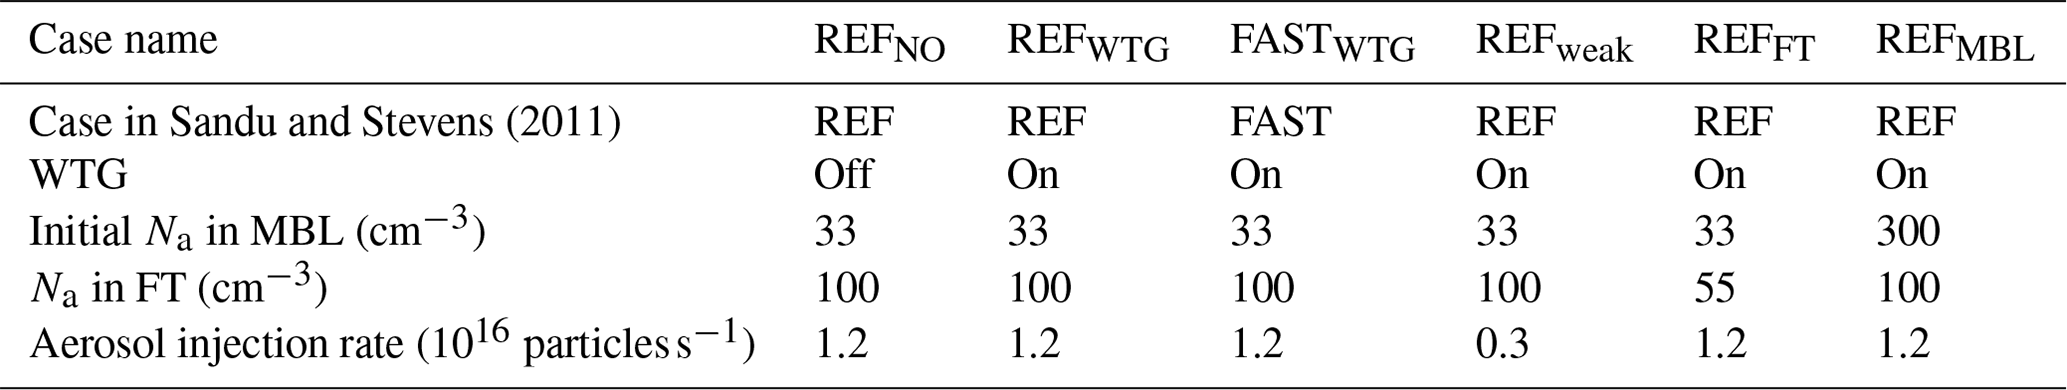
To allow the MBL and clouds to sufficiently evolve, the runs are spun up for 18 h nudged to initial profiles with a timescale of 10 min. A long spin-up time is chosen to allow the mesoscale organization to fully develop, since it is important for determining cloud adjustments (e.g., through precipitation). Throughout the simulation, temperature and specific humidity 500 m above inversion are nudged with a timescale of 1 h to the climatological mean profiles along the trajectory. After the spin-up, the simulations are branched into runs with (PLUME) and without (CTRL) aerosol injection. A stationary point sprayer on the ocean surface injects 1.2×10¹⁶ aerosols per second for ∼4.16 h. This injection rate is for the dry sea-salt aerosol and is selected as being sufficient to produce a measurable perturbation in cloud albedo, based on Wood (2021, their Table 2). Effects on the injected plume buoyancy and mixing due to evaporation of co-emitted water in an actual injected plume are not accounted for, but recent outdoor studies have suggested that this may be less of an issue than has been previously hypothesized (Hernandez-Jaramillo et al., 2024). As noted above, this injected aerosol has a dry diameter of 255 nm. We acknowledge that this is larger than the optimally sized aerosol for MCB, but as noted above this is necessary to accommodate the model limitation of only being able to accommodate a single aerosol size mode.
The domain is rotated to align the geostrophic background wind with the y axis (i.e., wind in the lower MBL turns with height and reaches a steady direction to nearly the y axis in the upper MBL) to minimize the advection of plume in the x direction (Fig. 1). Due to the Lagrangian framework, the sprayer effectively moves in the negative y axis direction and, due to the periodic boundary conditions, passes through the domain about five times. This is analogous to a situation in which air masses traverse a region where several stationary sprayers are spaced at intervals of 12 km along their trajectory, similar to MCB scenarios given in Wood (2021). Because the point sprayer moves through the domain along the background winds (the y axis), the diffusion of the injected aerosols is mainly in the x direction. The plume of injected aerosol is quickly dispersed and covers the whole domain within 24 h (Fig. 1). Thus, the impact of mesoscale variability of aerosols on the transitioning clouds is not represented on days 2 and 3.
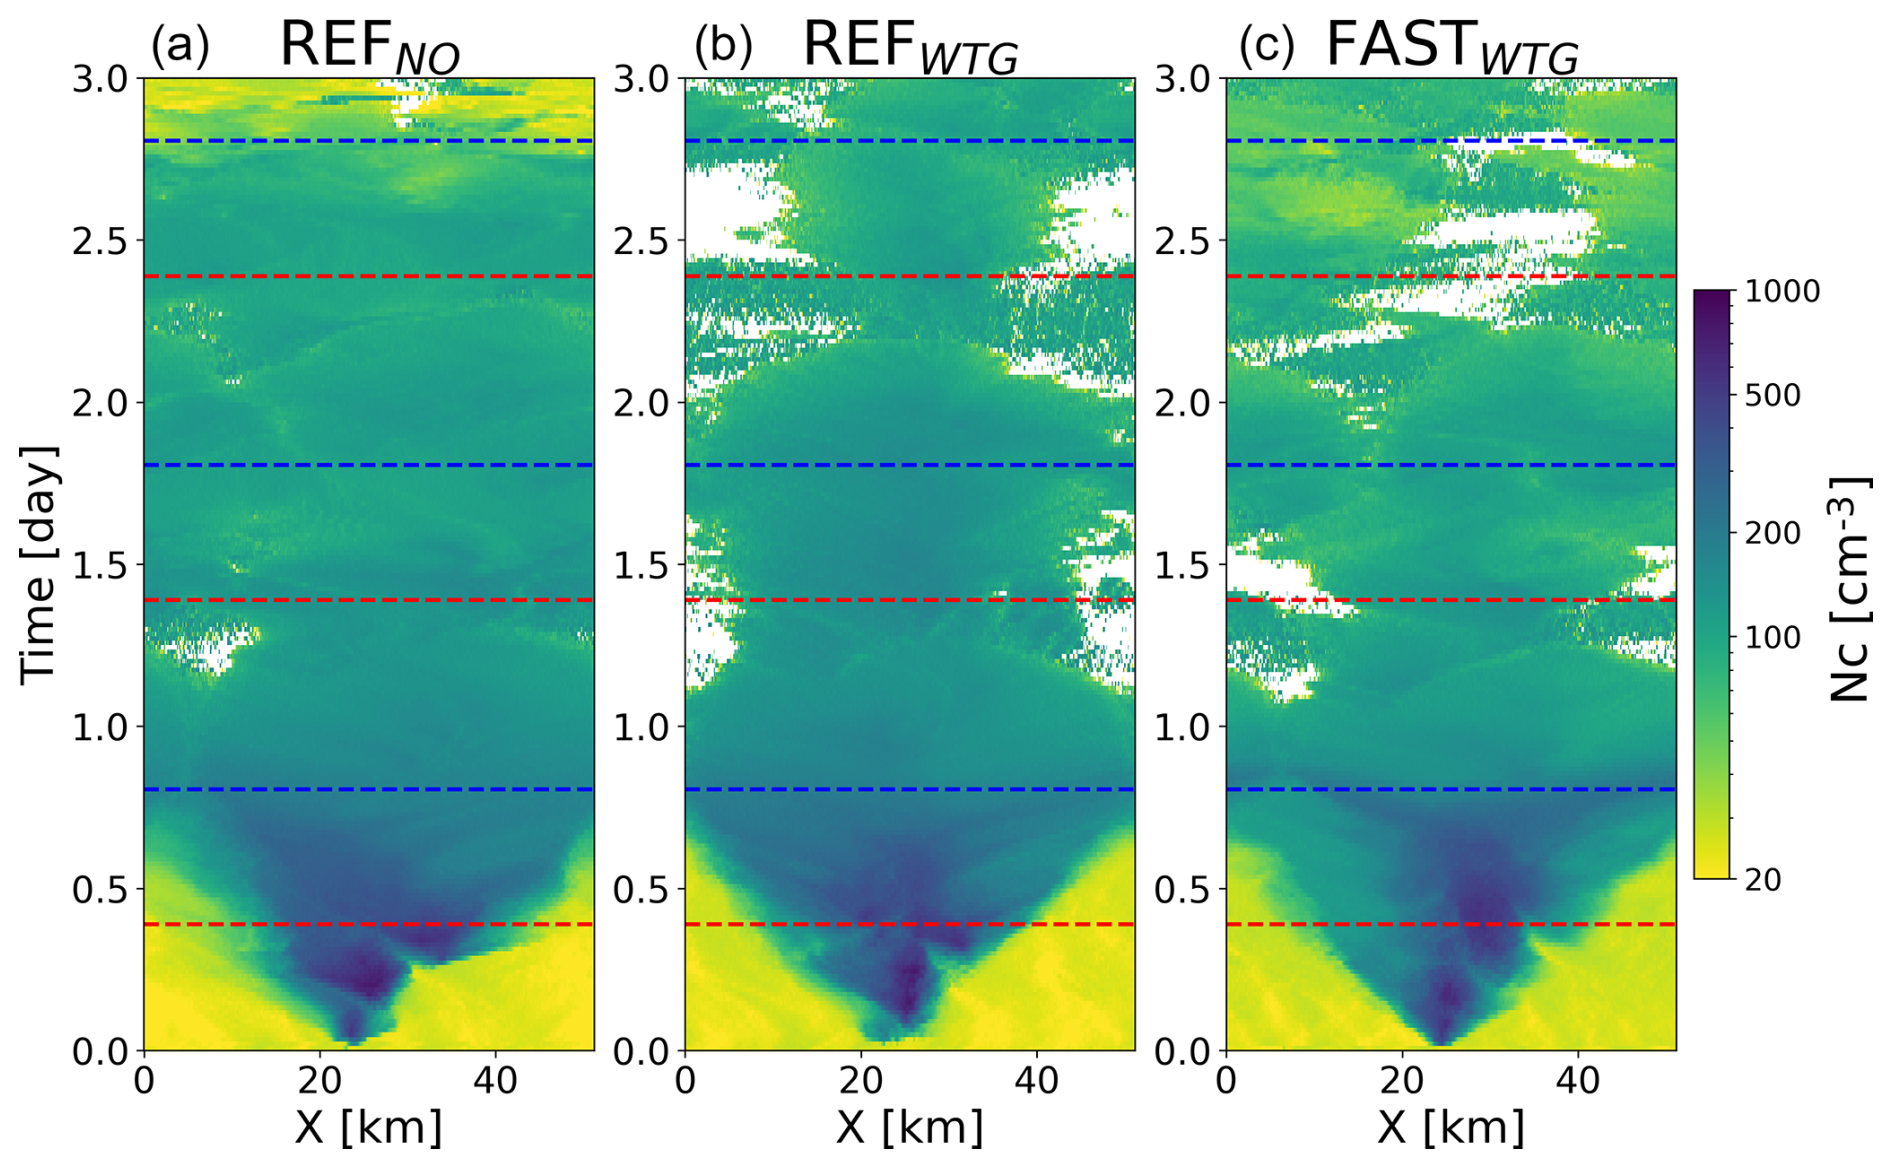
Figure 1Hovmöller plots of cloud number concentration Nc in the PLUME runs for the (a) REFNO, (b) REFWTG and (c) FASTWTG cases, showing the dispersion of the plume in the model domain.
3.1 Overview of the SCT with and without the WTG
Figures 2 and 3 illustrate the evolution of the MBL and cloud properties in the REFNO, REFWTG and FASTWTG cases for both the CTRL (solid lines) and PLUME (dashed lines) runs. Section 3.1.1 describes the CTRL runs, and Sect. 3.1.2 discusses the response of the MBL and clouds to aerosol injection.
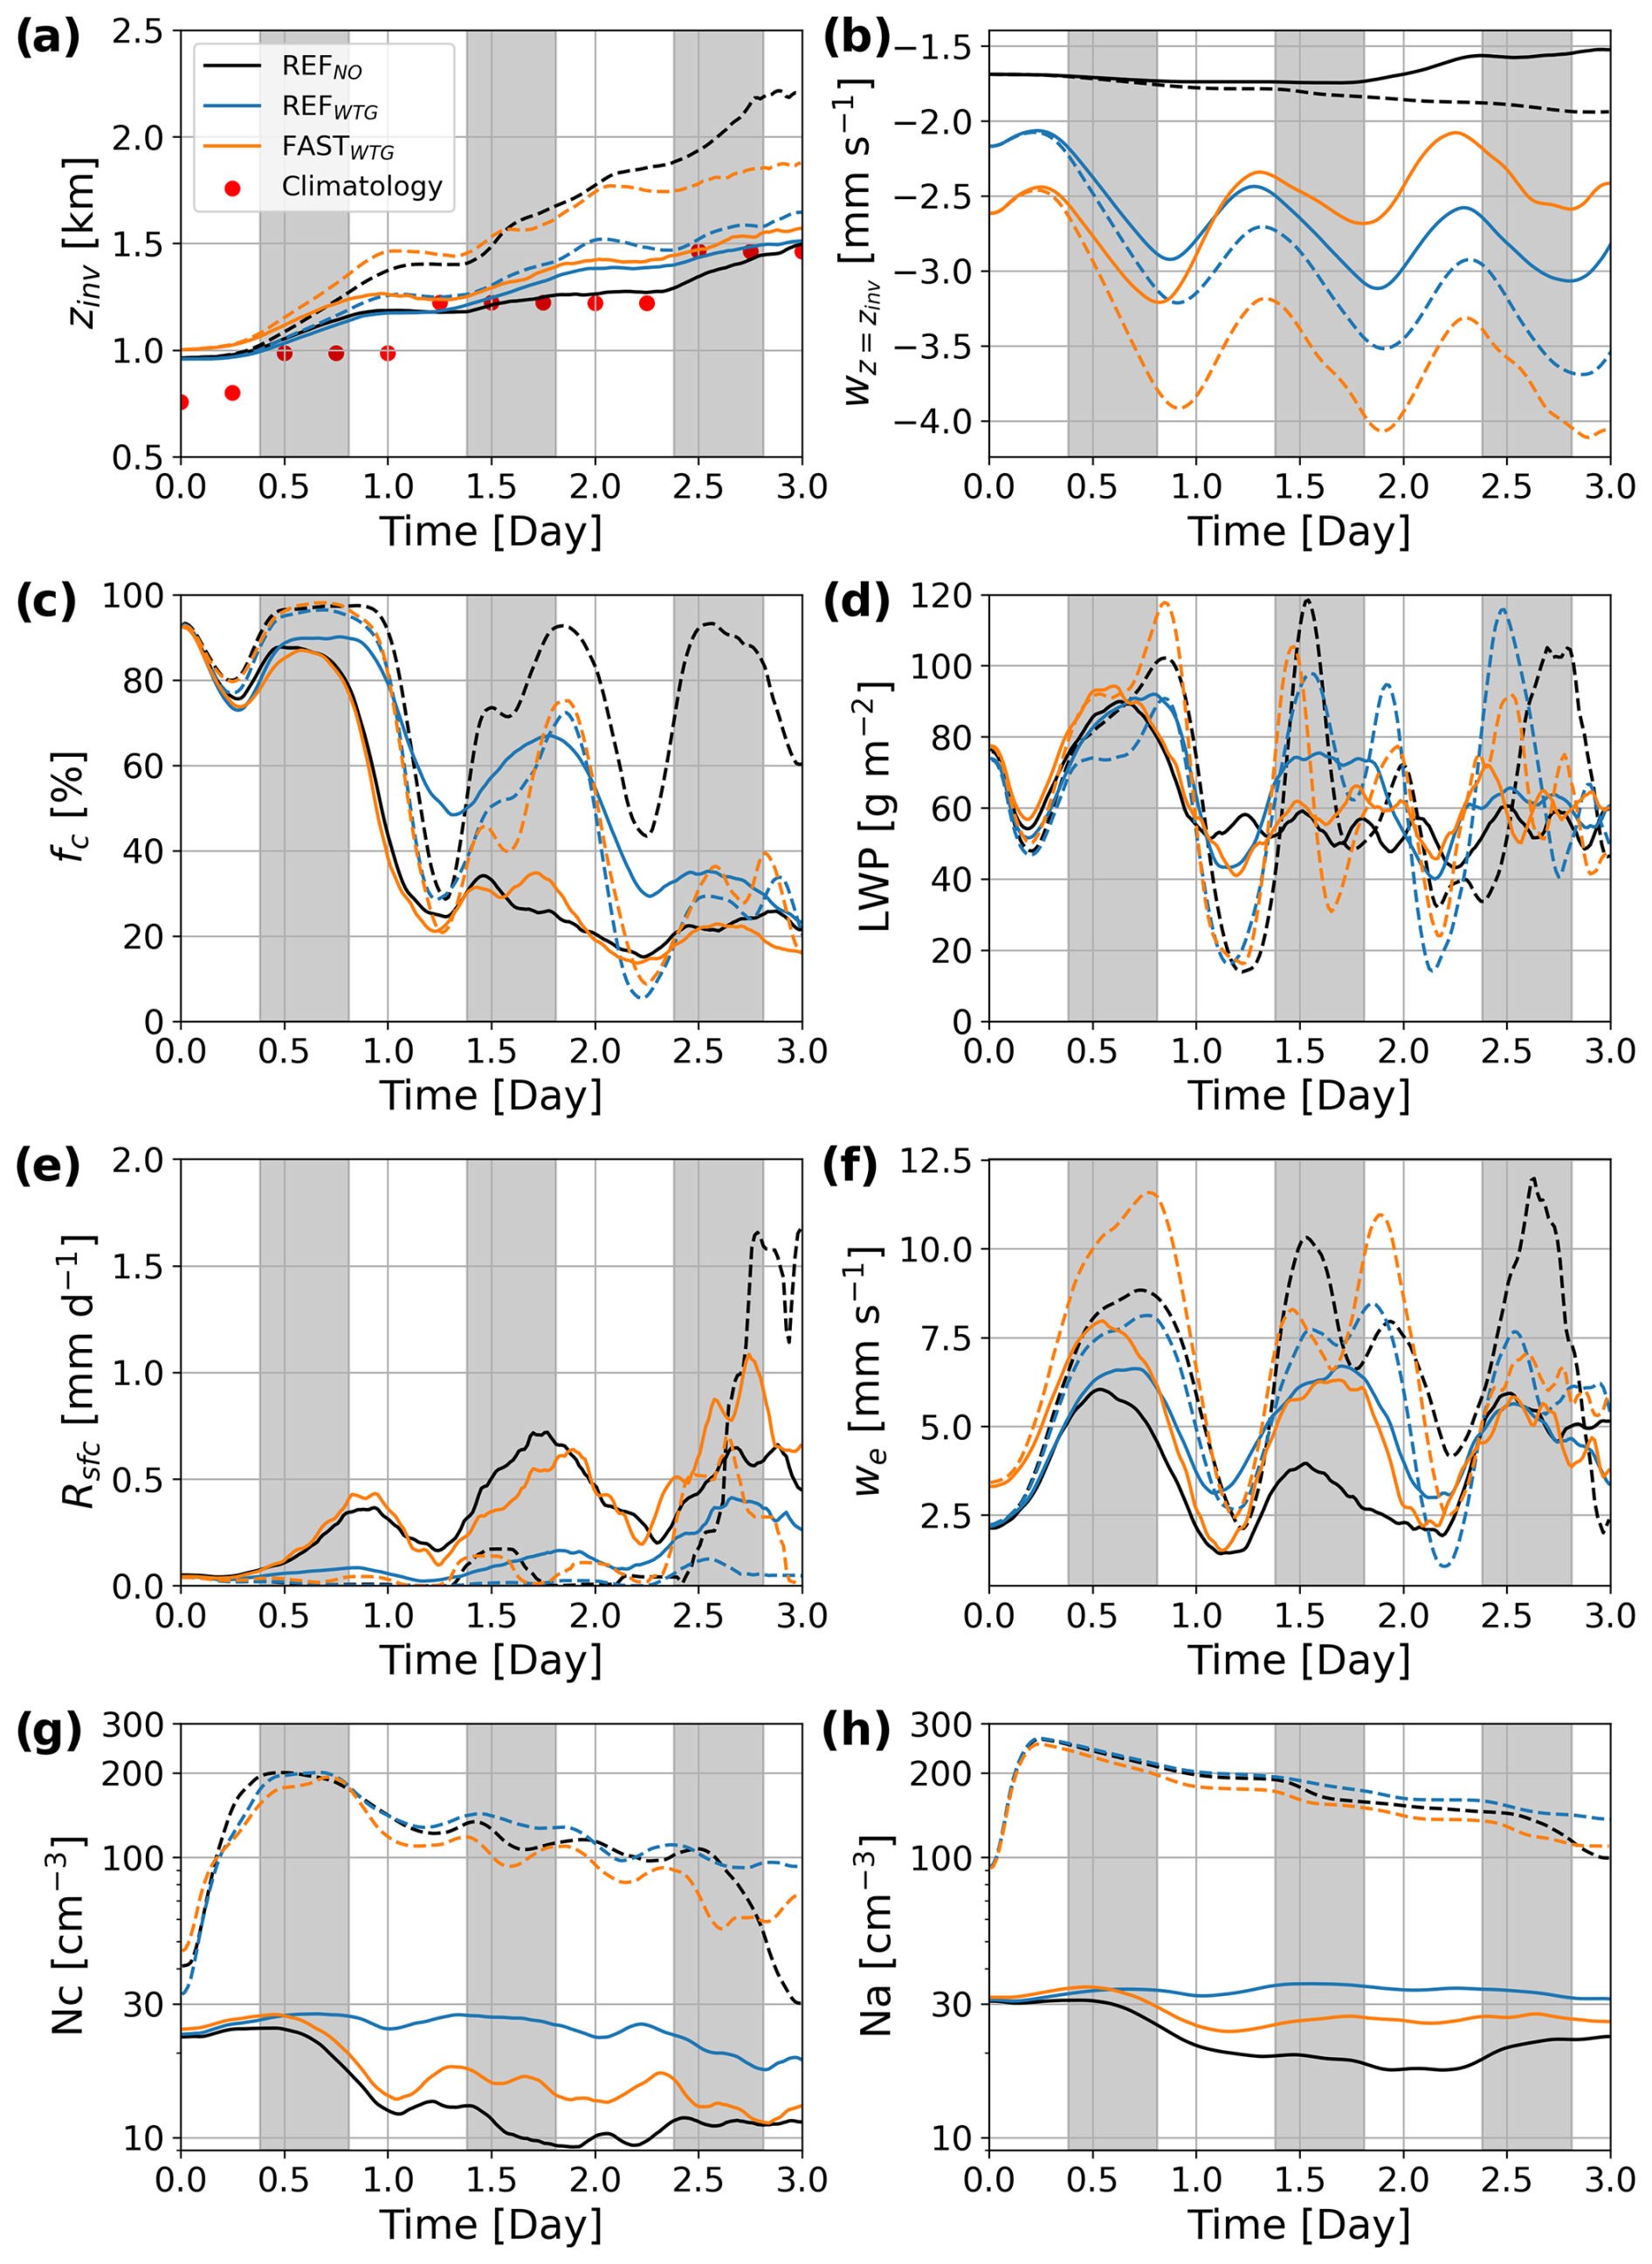
Figure 2Time evolution of cloud and marine boundary layer properties: (a) inversion height, (b) vertical velocity at inversion height, (c) cloud cover (fc), (d) cloud liquid water path (LWP), (e) surface rain rate (Rsfc), (f) entrainment rate (we), (g) cloud droplet number concentration and (h) total (cloud + aerosol number concentration). The solid lines indicate the values for the CTRL runs and the dashed lines for the PLUME runs. The black, blue and orange colors denote the runs for the REFNO, REFWTG and FASTWTG cases, respectively. Grey bands refer to the nighttime. The red dots in (a) indicate the inversion height in the climatology along the composite trajectory.
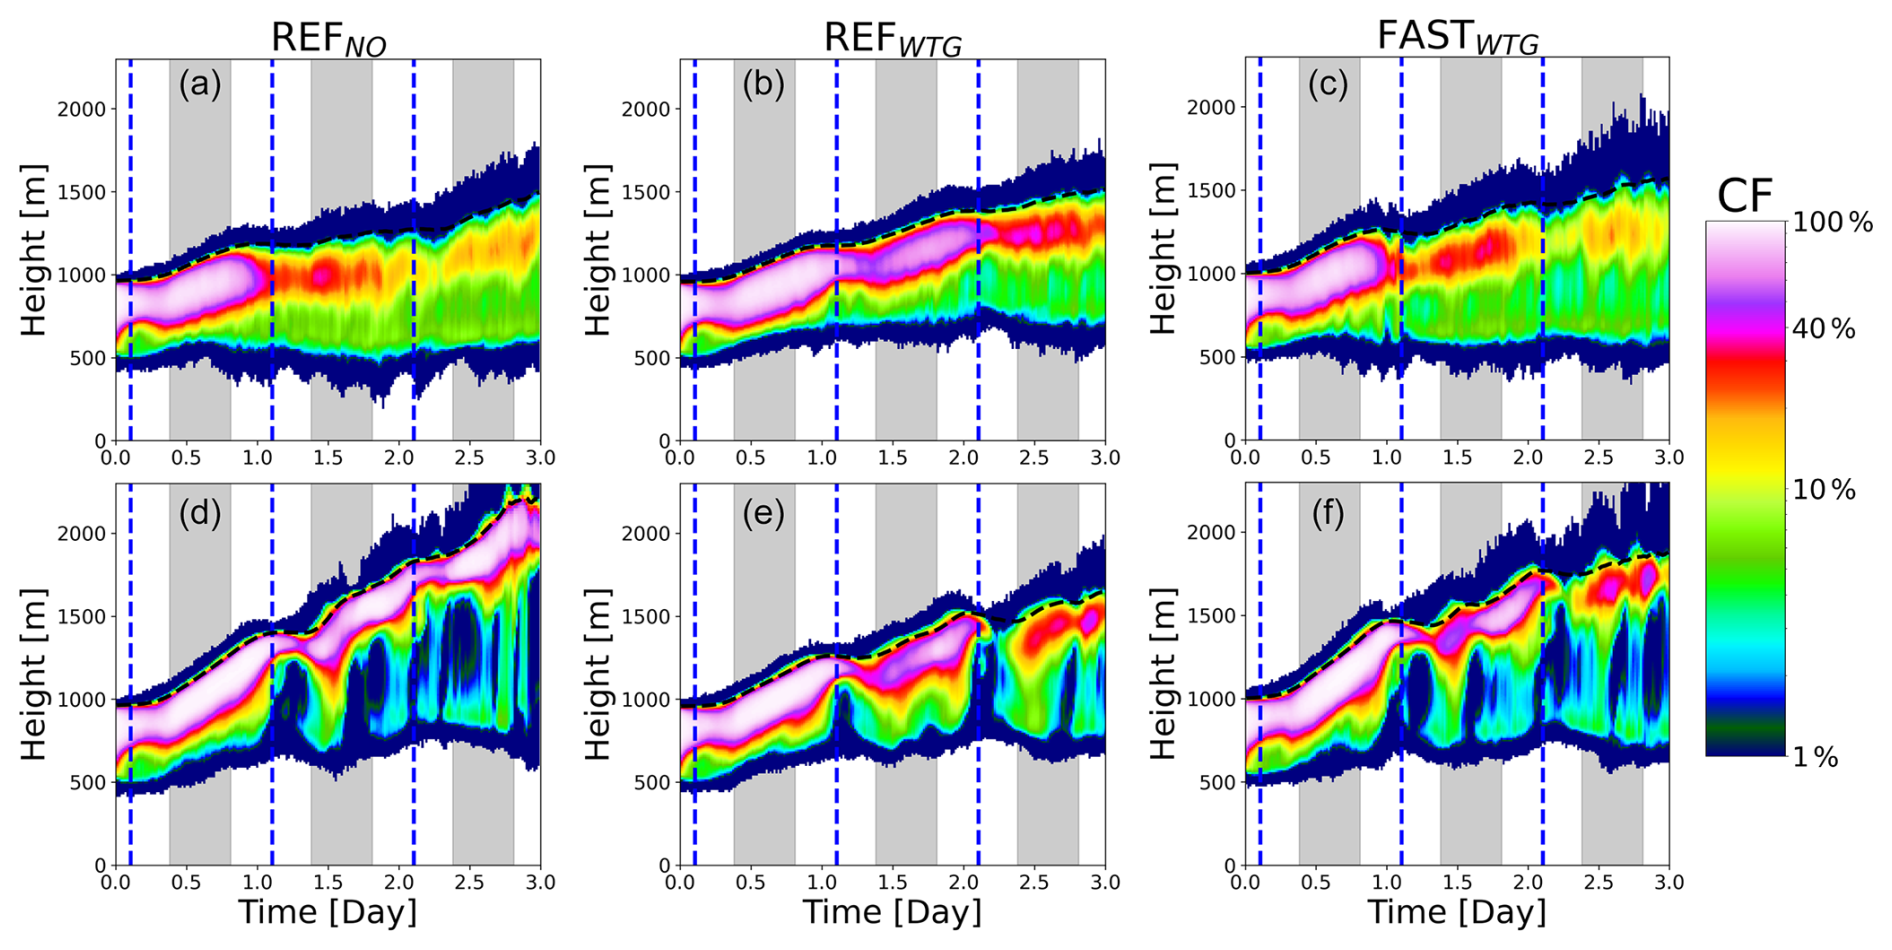
Figure 3Time evolution of the vertical profiles in cloud fraction (CF). The left (a, d), middle (b, e) and right (c, f) columns are for the REFNO, REFWTG and FASTWTG cases, respectively. The upper (a–c) and lower (d–f) rows represent the CTRL and PLUME runs, respectively. The black dashed line denotes the inversion height, and the blue dashed line represents the time of local noon.
3.1.1 Baseline (CTRL) runs
The SCT occurs as a response to the increasing SST in all CTRL cases, as indicated by a gradual decrease in cloud cover, fc, throughout the 3 d simulations (Fig. 2c). As in the climatology, the MBL depth increases with SST and reaches 1500 m at the end of the simulations (Fig. 2a). In REFNO, fc exceeds 50 % and the surface precipitation rate (Rsfc) is lower than 0.5 mm d−1 on day 1 (Fig. 2e). As the clouds deepen with the MBL, Rsfc increases to ∼0.5 mm d−1 on day 3. After the onset of strong precipitation, the supply of the CCN from the natural sea-salt spray becomes lower than the depletion of cloud droplets by accretion, leading to a decrease in Nc to 10 cm−3, and fc becomes lower than 30 % without significant diurnal variation. This indicates that the SCT is mainly driven by the combined effects of drizzle depletion of clouds and the weakening of overturning circulation in the MBL by the evaporation of strong precipitation below the cloud base.
The adjustment in subsidence through the WTG approximation greatly affects the evolution of clouds and the MBL. The SCT in the REFWTG case is slower than in the REFNO case (e.g., Fig. 2c). As illustrated in Appendix A, the WTG intensifies the subsidence in order to reduce the buoyancy perturbation with respect to climatology. Since the aerosol number concentration in the lower FT is higher than in the MBL, when intensified subsidence is accompanied by enhanced entrainment, more CCN are incorporated into the MBL. The stronger supply of CCN reduces the precipitation rate and, thus, delays the SCT. fc gradually decreases from 90 % to 20 % with an apparent diurnal cycle driven by solar heating. Nc and Na remain greater than 20 cm−3, and Rsfc is lower than 0.2 mm d−1 for the first 2 d, which implies that the cloud breakup is likely to be caused by cloud thinning by entrainment warming and drying rather than strong precipitation (Fig. 2e and g). As the MBL deepens further on day 3, Rsfc increases to ∼0.4 mm d−1, and precipitation starts to contribute to cloud breakup.
In the FASTWTG case, the pace of the SCT is faster than for the REFWTG case and comparable to the reference case without the WTG (REFNO). Despite the greater supply of FT aerosol due to stronger entrainment in the FASTWTG case, a moister FT produces sufficient precipitation to hasten the SCT, as indicated by a similar evolution of fc and Rsfc. The similarity between REFNO and FASTWTG makes analysis of the impact of the adjustment in subsidence on the SCT feasible.
3.1.2 Runs with aerosol injections (PLUME)
Aerosol injection quickly elevates aerosol concentrations throughout the MBL. Na and Nc rapidly increase to 250 and 200 cm−3, respectively, during the period of the injection. Notably, most of the injected aerosols are activated despite being injected during the daytime when boundary layer turbulence weakens. This result runs counter to the argument from Jenkins et al. (2013) that most of the injected aerosols are not activated because the turbulence during daytime is not strong enough to deliver the injected aerosols to the cloud base to activate them. A smaller activation fraction in Jenkins et al. (2013) may also reflect a greater fraction of aerosol smaller than 100 nm used in that study.
For the REFNO case, aerosol injection induces increased entrainment and rapid growth of the MBL, which raises the cloud-top height (Fig. 2a). On day 1, fc becomes close to overcast at night and early the following day but rapidly decreases to 30 % in the afternoon. On days 2–3, however, despite the deepening and decoupling of the MBL, the cloud-layer motions – intensified by suppression of cloud-base precipitation – still supply enough moisture to maintain a stratocumulus layer below the inversion. This is why the stratocumulus layer is not dissipated, although the we enhancement (Fig. 2f) elevates the cloud base by drying and warming the MBL. In response to the increase in cloud number concentration with aerosol injection, Rsfc in the REFNO decreases to <0.1 mm d−1 on days 1 and 2 (Fig. 2e). On day 3, Rsfc becomes greater in the PLUME run than in the CTRL run because the deeper (∼1500 m) cumulus cloud depth (Fig. 3d) can produce strong precipitation despite having a higher cloud droplet number concentration. This implies that when the adjustment in subsidence is not considered, the suppression of significant precipitation by aerosol injection is likely to delay the transition from overcast stratocumulus to cumulus for a couple of days (Erfani et al., 2022). We can expect from the significant Rsfc on day 3 that a few days following the aerosol injection, the SCT starts to occur due to a positive feedback loop in which strong precipitation scavenges aerosols, leading to low cloud droplet number concentrations and thus greater precipitation (Yamaguchi et al., 2017).
Allowing subsidence to respond to buoyancy anomalies induced by aerosol perturbations strongly affects the MBL and cloud evolution. As the aerosol injection in the REFWTG and FASTWTG cases increases entrainment and induces boundary layer deepening, subsidence intensifies to bring the sounding in the LES model closer to the reference (ERA JJA climatological) sounding along the trajectory. The intensified subsidence from aerosol injection suppresses the MBL deepening in the REFWTG and FASTWTG cases (Fig. 2c), consistent with Dagan et al. (2022), who found a similar response to aerosol enhancement in shallow convective clouds. Without an adjustment in subsidence in the REFNO case, the boundary layer depth increases by 700 m in 3 d, while that in the REFWTG and FASTWTG cases only deepens by 100–400 m. In all three cases, precipitation suppression results in increased turbulence and entrainment.
When subsidence adjustment is accounted for (i.e., REFWTG), aerosol injection hastens the SCT compared with REFNO. The combined effects of the enhanced we and intensified subsidence induce a much faster cloud thinning, leading to the earlier dissipation of the stratocumulus layer (Fig. 3e). Even in the FASTWTG case, where precipitation is significantly suppressed and thus liquid water path (LWP) and fc increase, the stratocumulus layer completely dissipates within the 3 d simulation. This indicates that accounting for the subsidence adjustment has a major effect on the cloud evolution and, thus, the timing of the SCT.
One notable feature of the effect on cloud evolution of aerosol injection in the REFWTG and FASTWTG cases is a rapid decrease in fc and in LWP in the afternoon (Fig. 2a). Even in the FASTWTG case, where precipitation is significantly suppressed, the fc and LWP in the PLUME case become smaller than in the CTRL case on the second afternoon. Since reflection of solar shortwave (SW) radiation only occurs during daytime, this diurnal variation should significantly account for the variation in the cloud radiative effect. In the REFNO case, on the other hand, after day 1.5 fc and LWP are always greater in the PLUME run than in the CTRL run. In Sect. 3.2 and Appendix B, the characteristics of boundary layer turbulence are investigated to more deeply understand the impact of the adjustment in subsidence and the aerosol perturbation on the SCT.
3.2 Boundary layer turbulence
In the MBL, the main sources of turbulence are cloud-top cooling; surface buoyancy flux; and latent heating, which, in decoupled or cumulus-coupled boundary layers, occurs in cumulus updrafts. Cloud-top cooling dominates the stratocumulus regime due to the high cloud cover and low SSTs, while surface buoyancy flux and latent heating in Cu updrafts dominate in the cumulus regime due to low cloud cover and high SSTs. Figure B1 demonstrates the relationship between cloud radiative heating rate and cloud thickness, as measured by cloud LWP. Longwave (LW) radiative cooling linearly increases with cloud depth below a threshold (in-cloud LWP ∼20 g m−2), likely due in part to lower fc associated with smaller LWP values, and then saturates above it (Fig. B1b). On the other hand, SW radiative heating sub-linearly increases with LWP (Fig. B1c). Appendix B discusses how the cloud thickness and subsidence rate can influence cloud breakup. The surface buoyancy flux is determined by sensible and latent heat fluxes (hereafter defined as SHF and LHF, respectively), which can be quantified by . Since the order of magnitude of changes in SHF and LHF from the aerosol injections is similar and , changes in SHF play a leading role in changes in the surface buoyancy flux in these simulations.
Figure 4 shows the daily-averaged cloud radiative heating in the upper MBL. The SW cloud radiative heating and LW cooling by at the upper MBL, and , are calculated by averaging the cloudy-sky (all-sky minus clear-sky) SW and LW radiative heating rates, respectively, in the upper half of the boundary layer. The LW emission from the cloud top to space induces net cooling in the upper MBL, which is partially offset by solar SW absorption. Since the area of clouds with in-cloud LWP exceeding 20 g m−2 becomes smaller with the SCT, also weakens with time (i.e., along the trajectory). The weakening of along the trajectory in the CTRL runs is less rapid in REFWTG than in REFNO and FASTWTG, due to the slower cloud breakup.
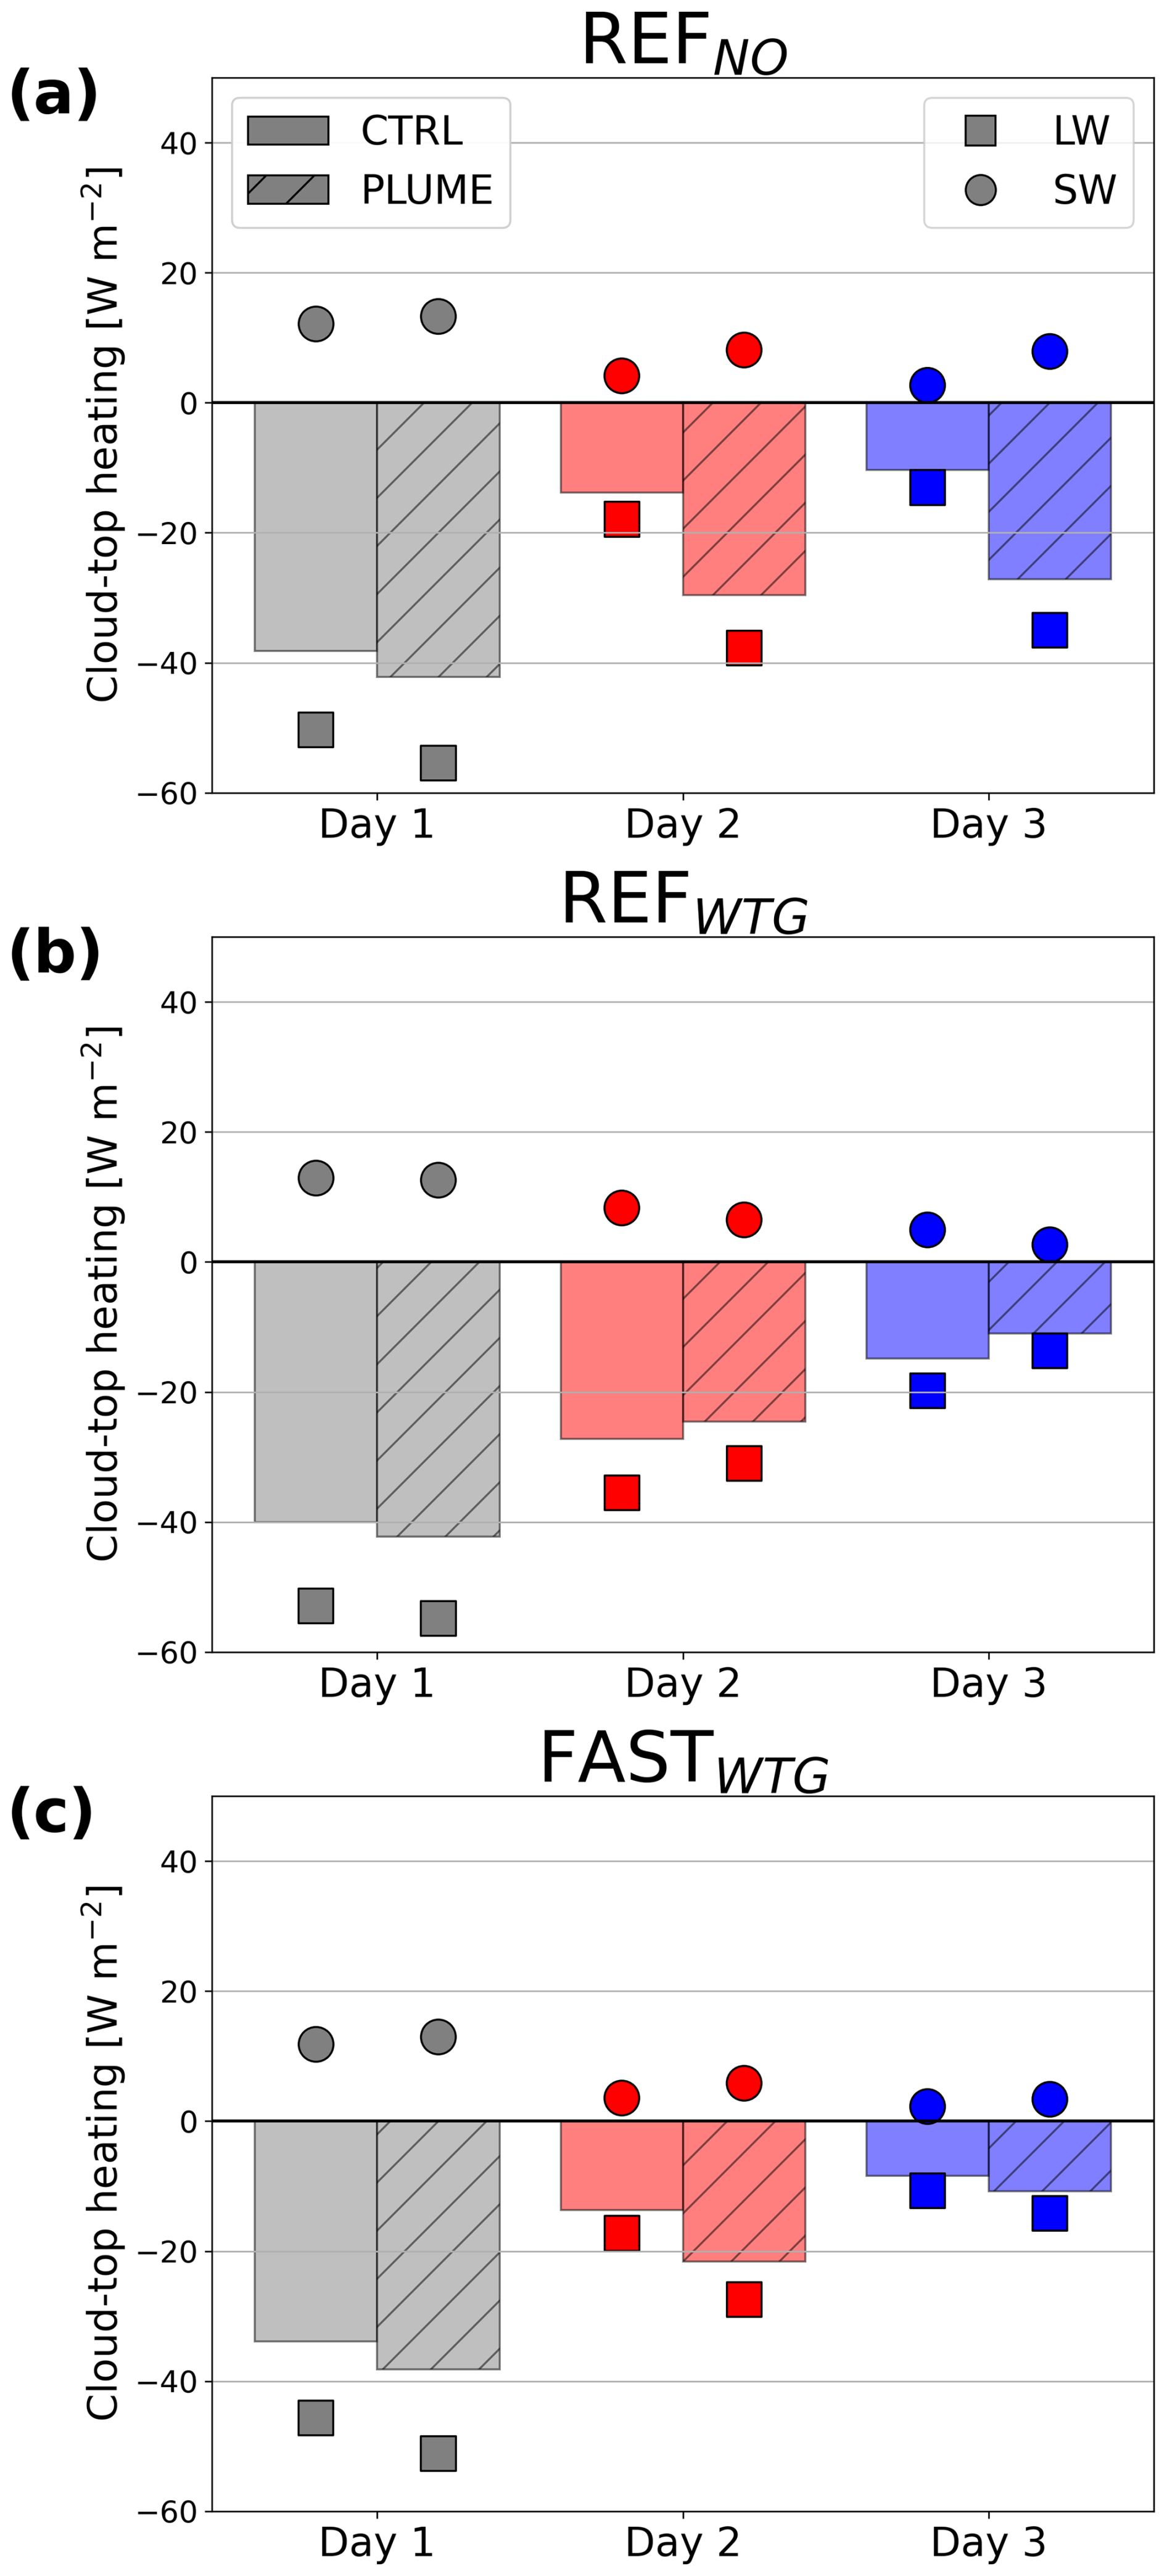
Figure 4Cloud-top radiative heating rates in the CTRL and PLUME runs on day 1, 2 and 3 for the (a) REFNO, (b) REFWTG and (c) FASTWTG cases. Bars denote the net (LW + SW) cloud-top radiative heating rate. The smaller squares and circles indicate the average LW and SW radiative heating rates, respectively.
Changes in in response to aerosol injections greatly differ depending on whether the WTG adjustment is implemented. When the adjustment is not included, the radiative cooling of the cloud top in REFNO becomes extremely effective in response to aerosol injection, and it weakens quite slowly with time (Fig. 4a). This is why the stratocumulus layer is not dissipated, although the MBL is deeper than 2000 m, and the surface buoyancy production is smaller in the PLUME run. In the REFWTG (Fig. 4b) and FASTWTG (Fig. 4c) cases, on the other hand, the net cooling by clouds in the PLUME runs decreases more rapidly along the trajectory. This can largely be attributed to the thinning of clouds under intensified subsidence with consequently smaller outgoing LW emissions. In REFWTG, is stronger on day 1 in the PLUME run but weakens after this relative to the CTRL run. This implies that the aerosol perturbation enhances cloud cover on the first day, but the polluted clouds break up more easily afterward. In the FASTWTG case, the significant suppression of drizzle with aerosol injection in turn significantly enhances LWP and fc. While this effect also weakens with time, it is more persistent in the FASTWTG case than in REFWTG, possibly because drizzle depletion plays a stronger role in the SCT in the FASTWTG CTRL simulation.
The diurnally averaged differences in the entrainment rate (), surface buoyancy flux () and net radiative heating by clouds in the upper MBL () are shown in Fig. 5. The bars for each value indicate the interquartile range of the differences. In all cases, the surface buoyancy flux decreases in the PLUME runs due to drizzle suppression, leading to the reduced evaporative cooling of drizzle in the subcloud layer (Fig. 5a). On day 1, dB0 becomes increasingly negative as the plume track spreads, and then it is unchanged or becomes slightly less negative on days 2–3 once the plume track covers the whole domain. Notable is that variation on days 2 and 3 (i.e., the interquartile range) is marginal, indicating that the change in dB0 is robust throughout the whole day. The enhanced entrainment rate makes the lowest layer drier, intensifying the LHF. However, the contribution of entrainment drying and warming to the surface buoyancy flux is negligible, as the MBL becomes more decoupled.
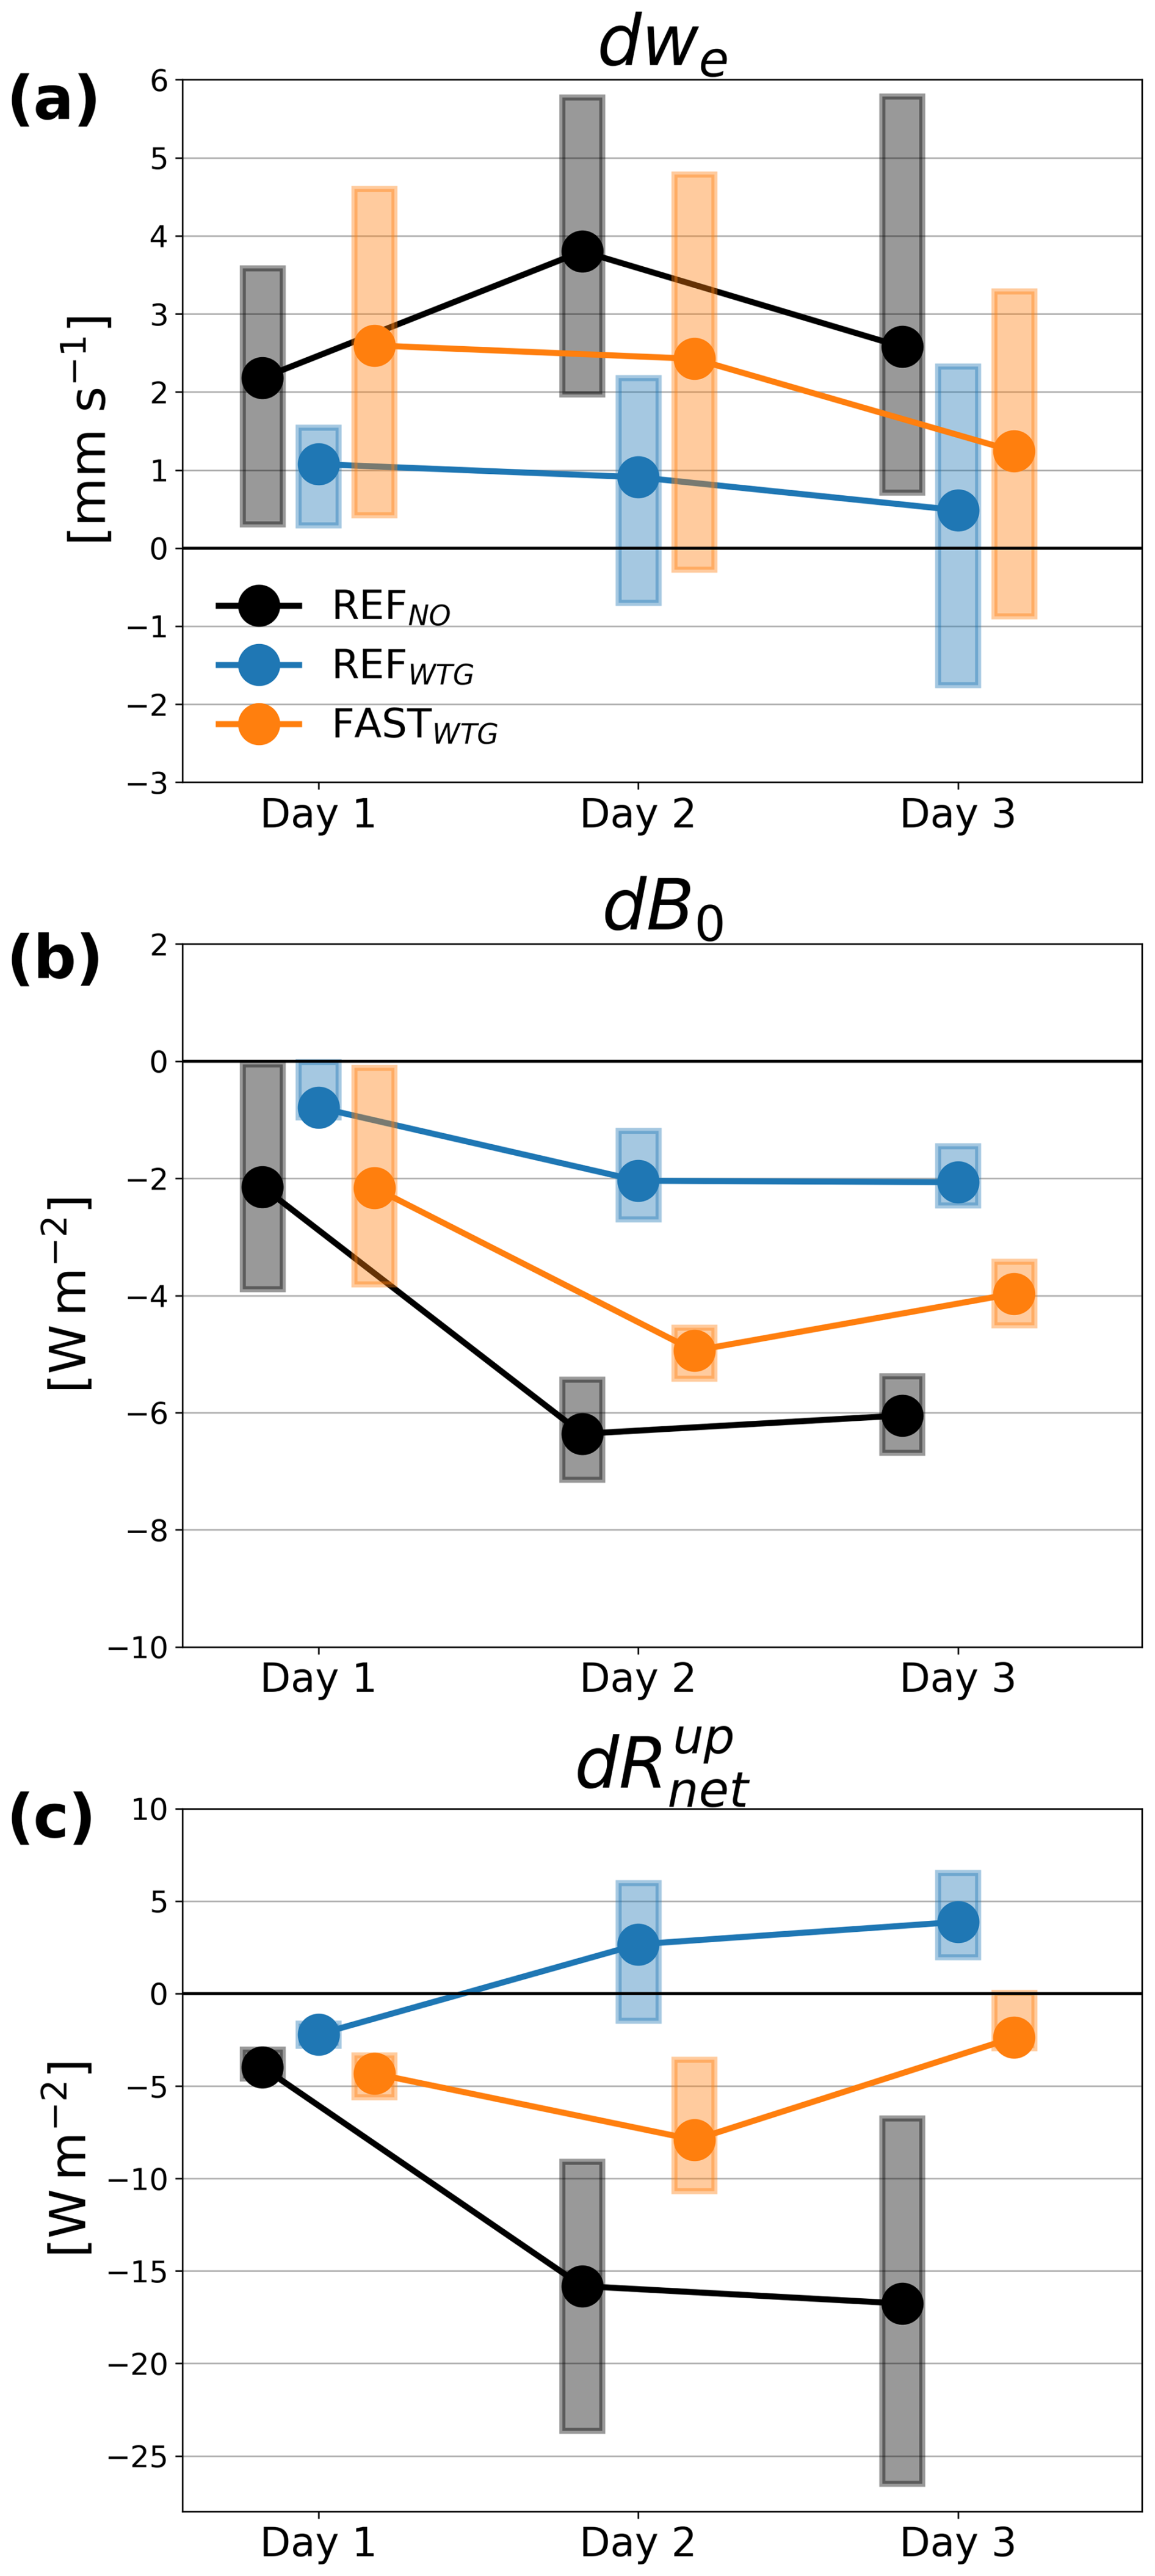
Figure 5Changes in the (a) entrainment rate (we), (b) surface buoyancy flux (B0) and (c) cloud radiative heating rate at the upper MBL () caused by aerosol injections. Solid dots denote the diurnal means of the changes, while the shaded bars represent the interquartile range of the changes.
Although the values of dB0 and (Fig. 5b and c) do not quantitatively represent their contribution to the MBL turbulence, they qualitatively represent the turbulence changes in the MBL induced by the aerosol perturbation. Among the three cases, the decrease in B0 is greatest for REFNO. However, the weaker driving of turbulence by the smaller surface buoyancy flux (dB0 W m−2 on day 3) is more than offset by stronger radiative cooling in the upper part of the MBL ( W m−2 on day 3). As a result, the increased turbulence in the MBL is intense enough to sustain the stratocumulus layer. This implies that turbulence generated by increased cloud-top cooling surpasses turbulence dissipation by the decreased surface buoyancy flux, so the MBL turbulence is intense enough to sustain the stratocumulus layer. In the REFWTG case, even becomes positive after day 2, indicating that both a decreased surface buoyancy flux and cloud-top cooling dissipate the turbulence in the PLUME run. In the FASTWTG run, is slightly more negative than dB0 on day 2 but less negative on day 3, which implies that the MBL turbulence should be much weaker in the PLUME than CTRL runs despite having similar amounts of precipitation suppression to REFNO.
The entrainment rate is enhanced by the aerosol perturbation due to the more effective evaporation of cloud water lying at the inversion layer. On day 1, dwe increases with time as the plume track spreads and as the cloud adjustments to the aerosol injection have not yet reached equilibrium (∼1–4 d, Schubert et al., 1979; Wood, 2007; Glassmeier et al., 2021). In the REFNO case, where the SCT is inhibited by the aerosol perturbation, the enhanced cloud-top cooling (Fig. 4a) intensifies the turbulence at the inversion layer. In the REFWTG and FASTWTG cases, on the other hand, the entrainment enhancement does not increase on day 2 because the cloud-top cooling is less effective due to cloud breakup. On day 3, dwe becomes much weaker, such that the interquartile range of dwe includes zero. This implies that entrainment enhancement, which is a dominant process for LWP adjustment over stratocumulus cloud decks, becomes less pronounced as the clouds break up.
Figure 6 illustrates the vertical structure of the diurnally averaged MBL turbulence on each day. The vertical profiles of buoyancy flux B (Fig. 6a–c) are consistent with the findings from Figs. 4 and 5. In general, B is weaker in the subcloud layer in the PLUME runs than in the CTRL runs due to the decrease in B0. In particular, a more negative B at the cloud base in the PLUME run indicates that the MBL becomes more decoupled, driven by enhanced we. In the cloud layer, B is greater in the PLUME runs than in the CTRL runs because of the stronger radiative cooling associated with greater cloud cover due to rain suppression by the aerosol perturbation. It is notable that B in the cloud layer does not decrease with time in the REFNO case, but in the REFWTG and FASTWTG cases it decreases on days 2–3 due to the SCT, as illustrated in Fig. 5c.
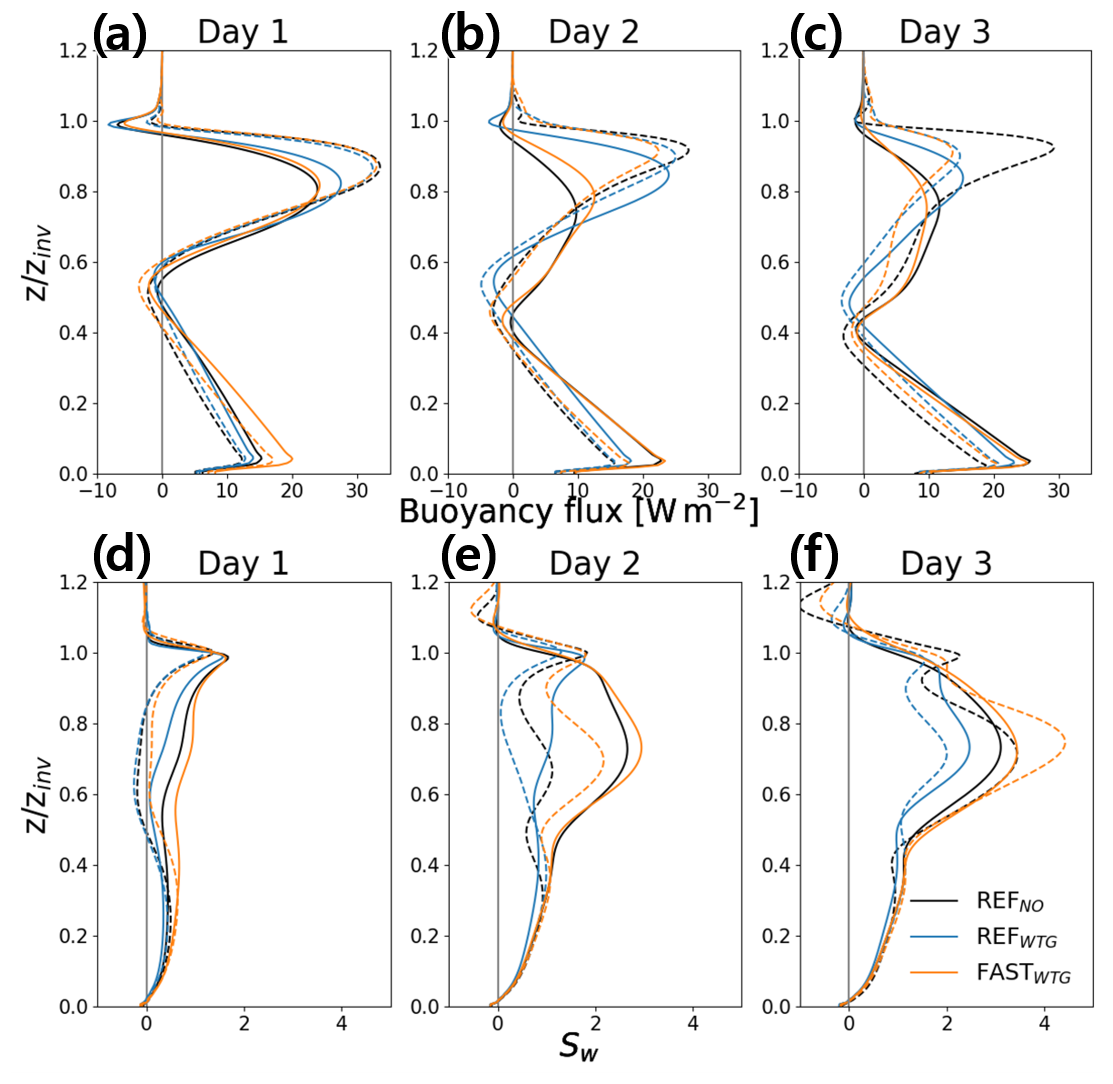
Figure 6Diurnal-mean vertical profiles of (a–c) buoyancy flux and (d–f) skewness of the vertical wind speed on (a, d) day 1, (b, e) day 2 and (c, f) day 3 cases. Black, red and blue lines denote the profiles of REFNO, REFWTG and FASTWTG cases, respectively. Solid and dashed lines represent the profiles for the CTRL and PLUME runs, respectively.
Figure 6d–f show the vertical profile of vertical-velocity skewness, . In subtropical, stratocumulus-capped marine boundary layers, negative Sw generally indicates that turbulence and convection are dominated by downdrafts associated with cloud-top cooling, while positive Sw is related to cumulus convection and/or subcloud-layer turbulence driven by positive surface buoyancy fluxes (B0). In the CTRL runs, Sw is positive throughout the simulation, due to significant B0, which increases along the trajectory as SST increases. When aerosols are injected into drizzling clouds, Sw at the cloud layer decreases due to smaller B0, the suppression of cloud-base precipitation and the increase in cloud-layer turbulence induced by stronger cloud-top cooling. This indicates that the contribution of cloud-top cooling to MBL turbulence is greater in a polluted than in a pristine MBL. On day 3 (Fig. 6f), the decreases in Sw at the cloud layer with aerosol injection become less significant. This is mainly attributed to a weaker turbulence production at cloud top (Fig. 6c) and an increase of SST and cumulus convection with time.
To understand the diurnal variation of clouds in the PLUME and CTRL runs shown in Sect. 3.1.1, turbulence properties in the night, morning and afternoon are shown in Figs. 7 and 8. In all cases, buoyancy production in the near-inversion cloud layer () is strongest at night, due to the absence of shortwave (SW) solar absorption and the significant longwave (LW) radiative cooling (Figs. 7 and 8a). Near-inversion buoyancy production is greater in the PLUME runs than CTRL runs, since the aerosol perturbation's impact on drizzle suppression (resulting in a positive LWP adjustment) is more significant than its impact on entrainment enhancement (negative LWP adjustment). Before noon (morning), clouds exert a consistent LW radiative cooling since fc is still high, but the cloud-top cooling effect starts to be partly offset by SW solar absorption (Figs. 7 and 8b).
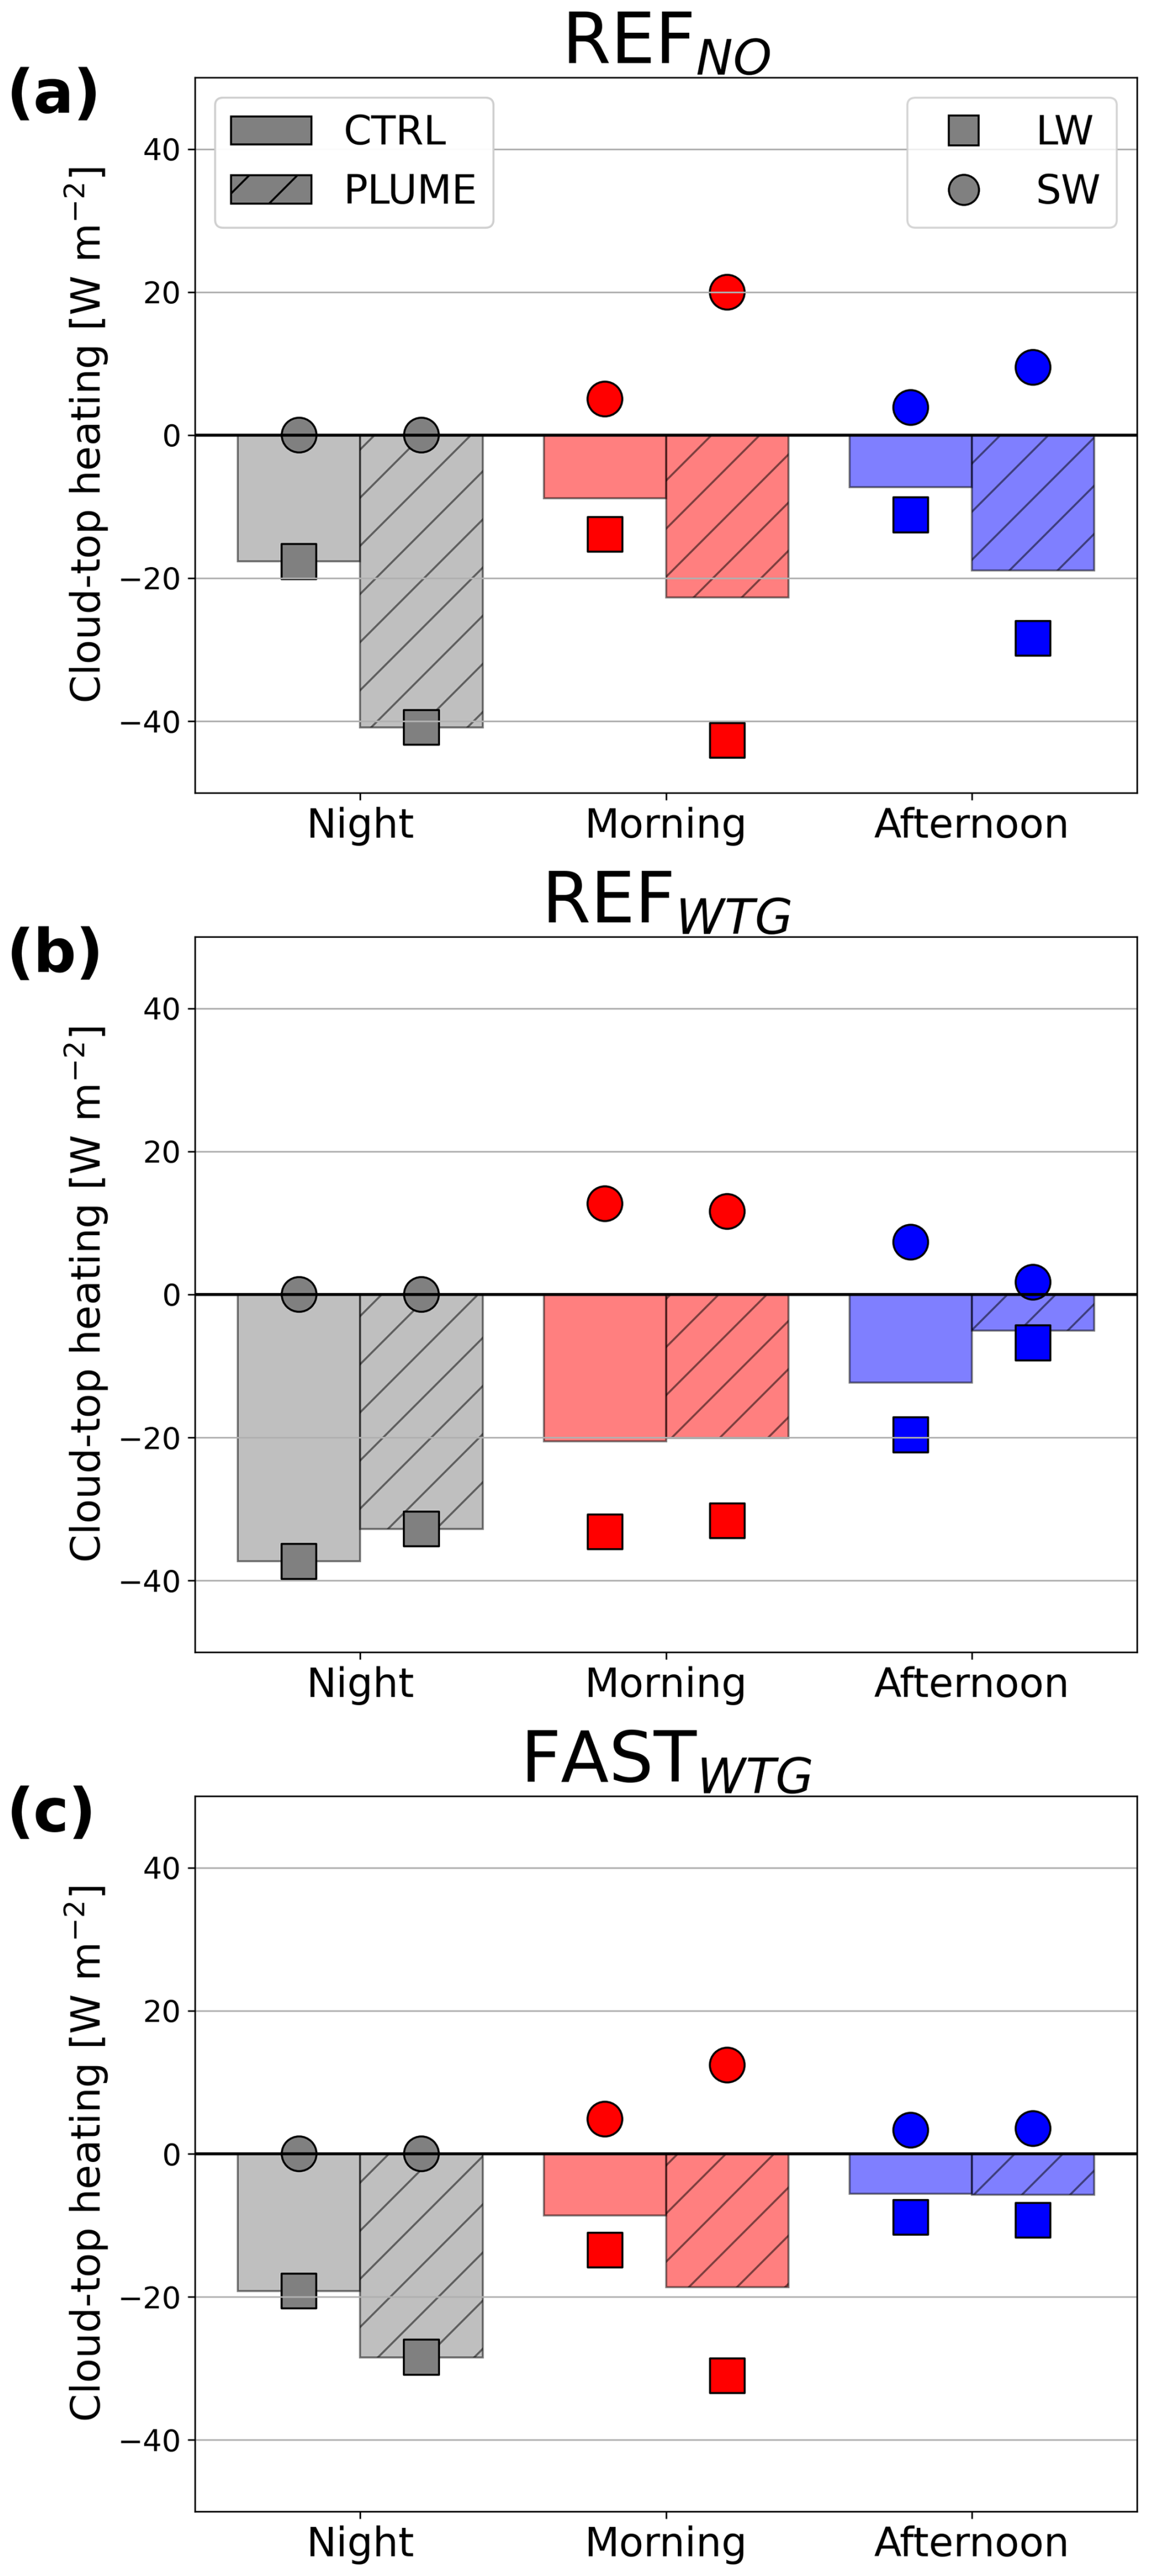
Figure 7Same as Fig. 4 but for different three time ranges (night, morning and afternoon) on day 2.
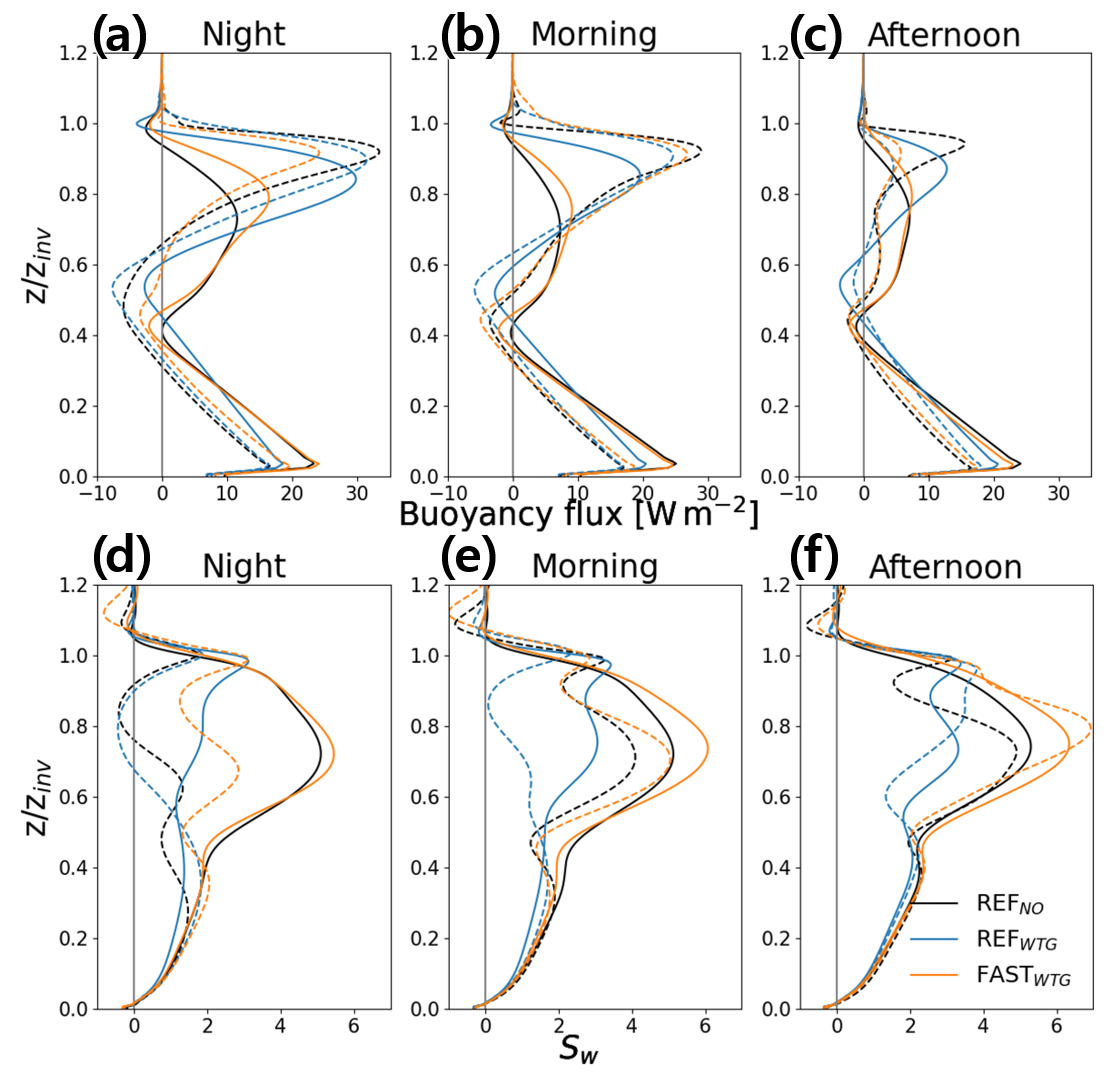
Figure 8Same as Fig. 6 but for different three time ranges (night, morning and afternoon) on day 2.
In the afternoon, LW radiative cooling and SW solar absorption both weaken as fc decreases. Changes in and roughly offset each other in the PLUME run for the REFNO case, so the net cooling rate does not vary during the daytime (Fig. 7a), and the buoyancy production in the near-inversion cloud layer remains significant (Fig. 8c). In the PLUME runs for the REFWTG and FASTWTG cases, however, significantly decreases so that the net cooling rate in the afternoon is much smaller than in the morning. The significant decrease in Rup (and thus weak buoyancy production at cloud layer) is mainly attributed to the cloud thinning and breakup, with LWP in an increasing fraction of falling below 20 g m−2, due to the impacts of the adjustment in subsidence. The greater Sw within the cloud layer also suggests a complete breakup of Sc layers (Fig. 8f). The analysis of diurnal variation in turbulence implies that the application of the WTG method has a pronounced impact on Sc layers during daytime.
3.3 Cloud radiative effect (CRE)
Previous sections illustrate the adjustments in cloud properties that result from aerosol injections. To analyze the radiative effect of aerosol perturbations over the various cases, we quantify the changes in the cloud radiative effect (computed at top of atmosphere) caused by changes in cloud properties. Here , so positive dCRE indicates a net warming effect and negative a net cooling effect. The SW cloud radiative effect is decomposed into the components caused by changes in the cloud droplet number concentration (), cloud thickness (dCRELWP) and cloud cover (), as illustrated in Appendix B in Chun et al. (2023). Here, we also consider the LW cloud radiative effect (dCRELW) since changes in fc and inversion height by aerosol injection are not negligible through the SCT.
Table 2 and Fig. 9 summarize the decomposed dCRE on each day. As expected, the increase in Nc enhances the cloud albedo throughout the 3 d simulations in all the cases. On day 1, the injected aerosols are quickly activated to cloud droplets, but the plume track is still narrow. As the plume quickly fills the domain during the first 20 h and the decrease in domain-mean Nc is slow, the negative does not significantly decrease in the REFNO and FASTWTG cases and even increases in the REFWTG case, due to a slow decrease in fc. On day 3, decreases in the magnitude of occur in all the cases because of the combined effects of decreased fc and Nc in the PLUME runs on day 3.
Table 2Summary of diurnal-average and total changes in cloud radiative effect [W m−2] for the PLUME runs relative to the CTRL runs.
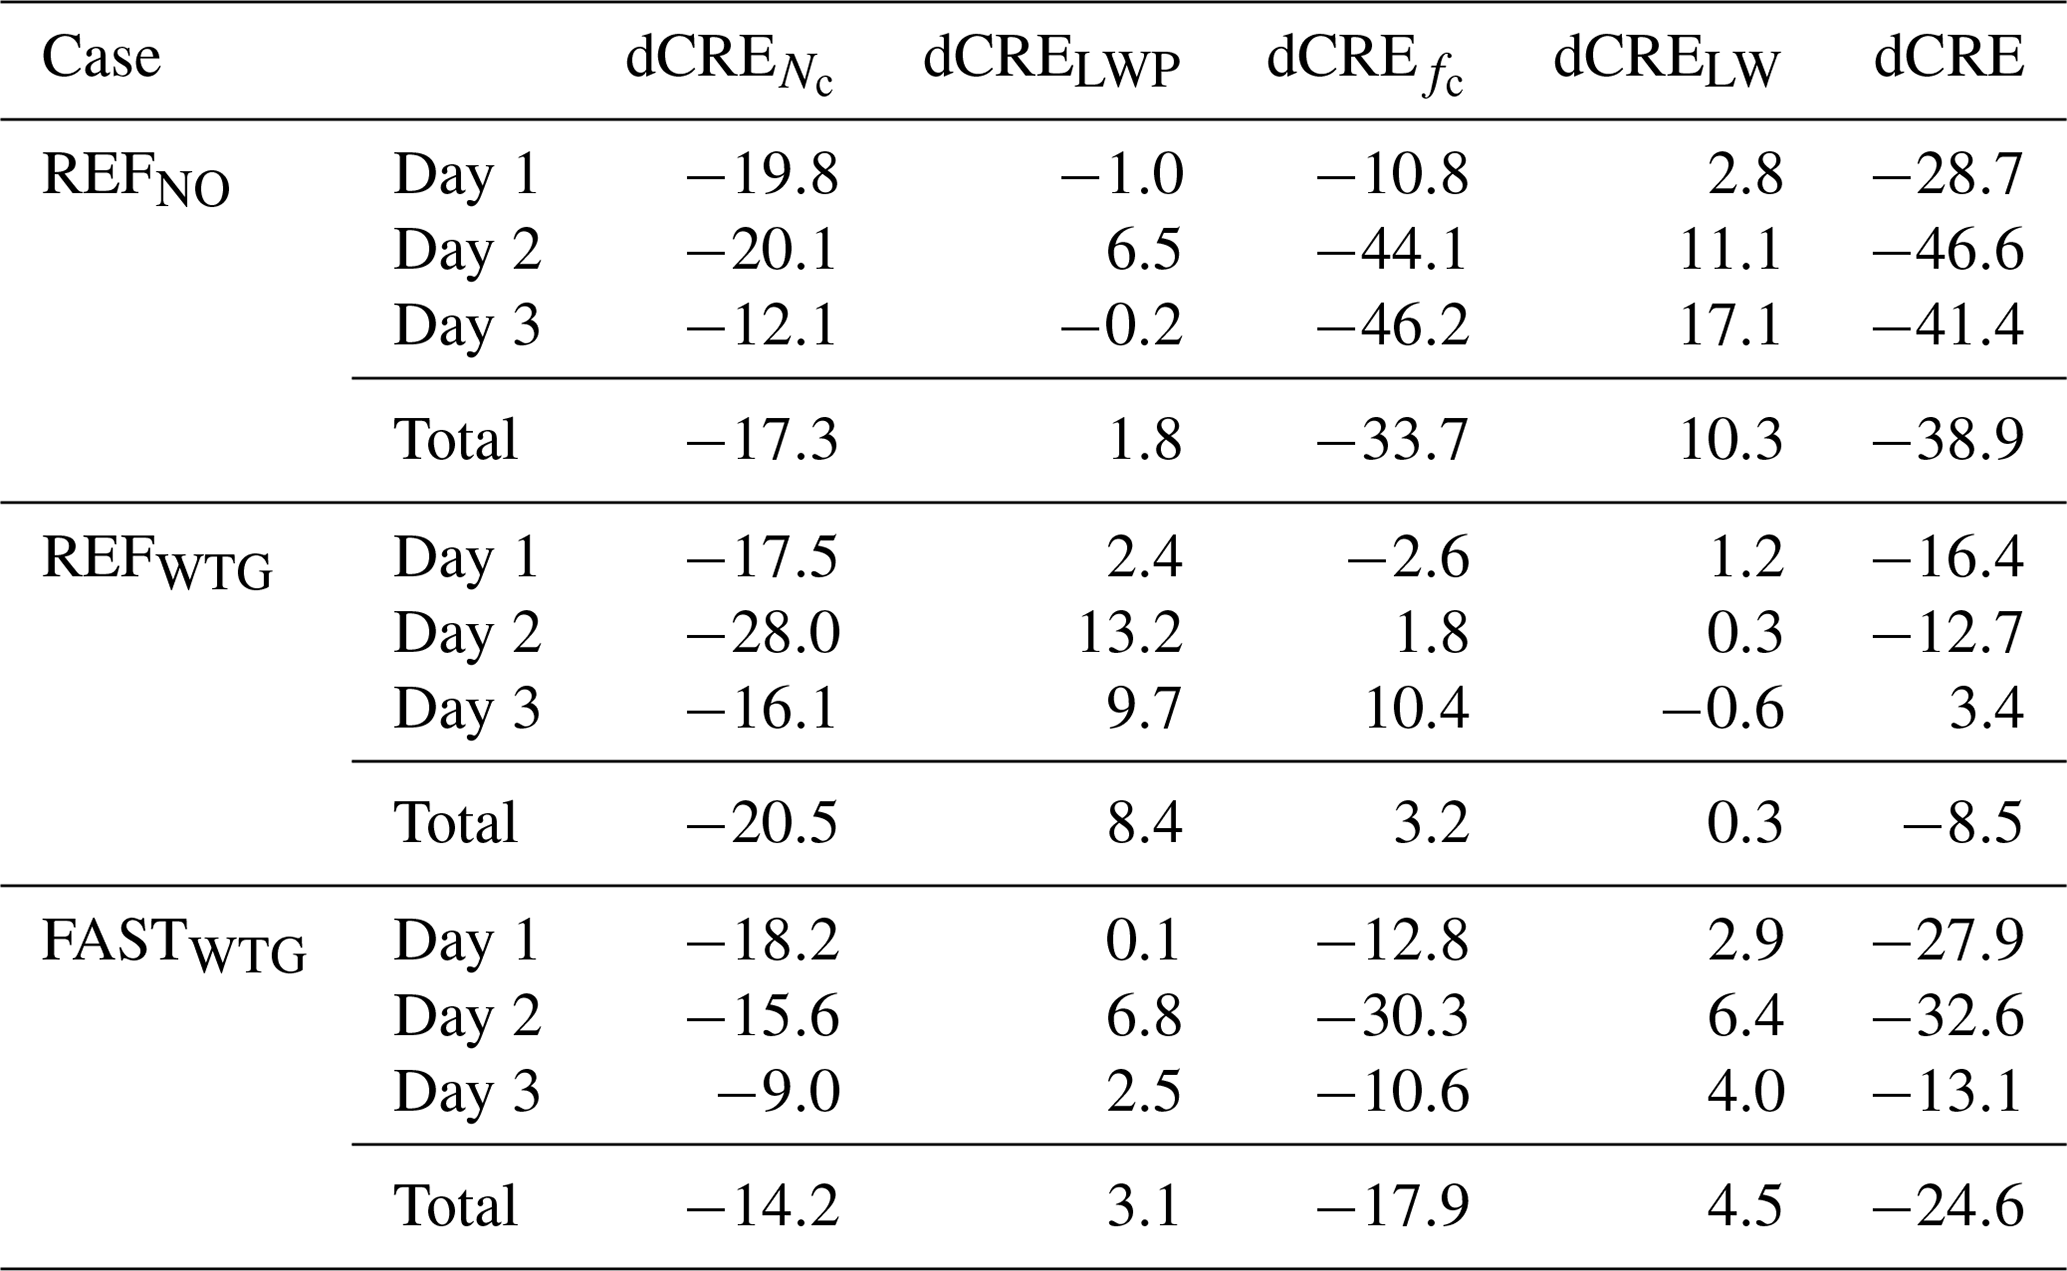
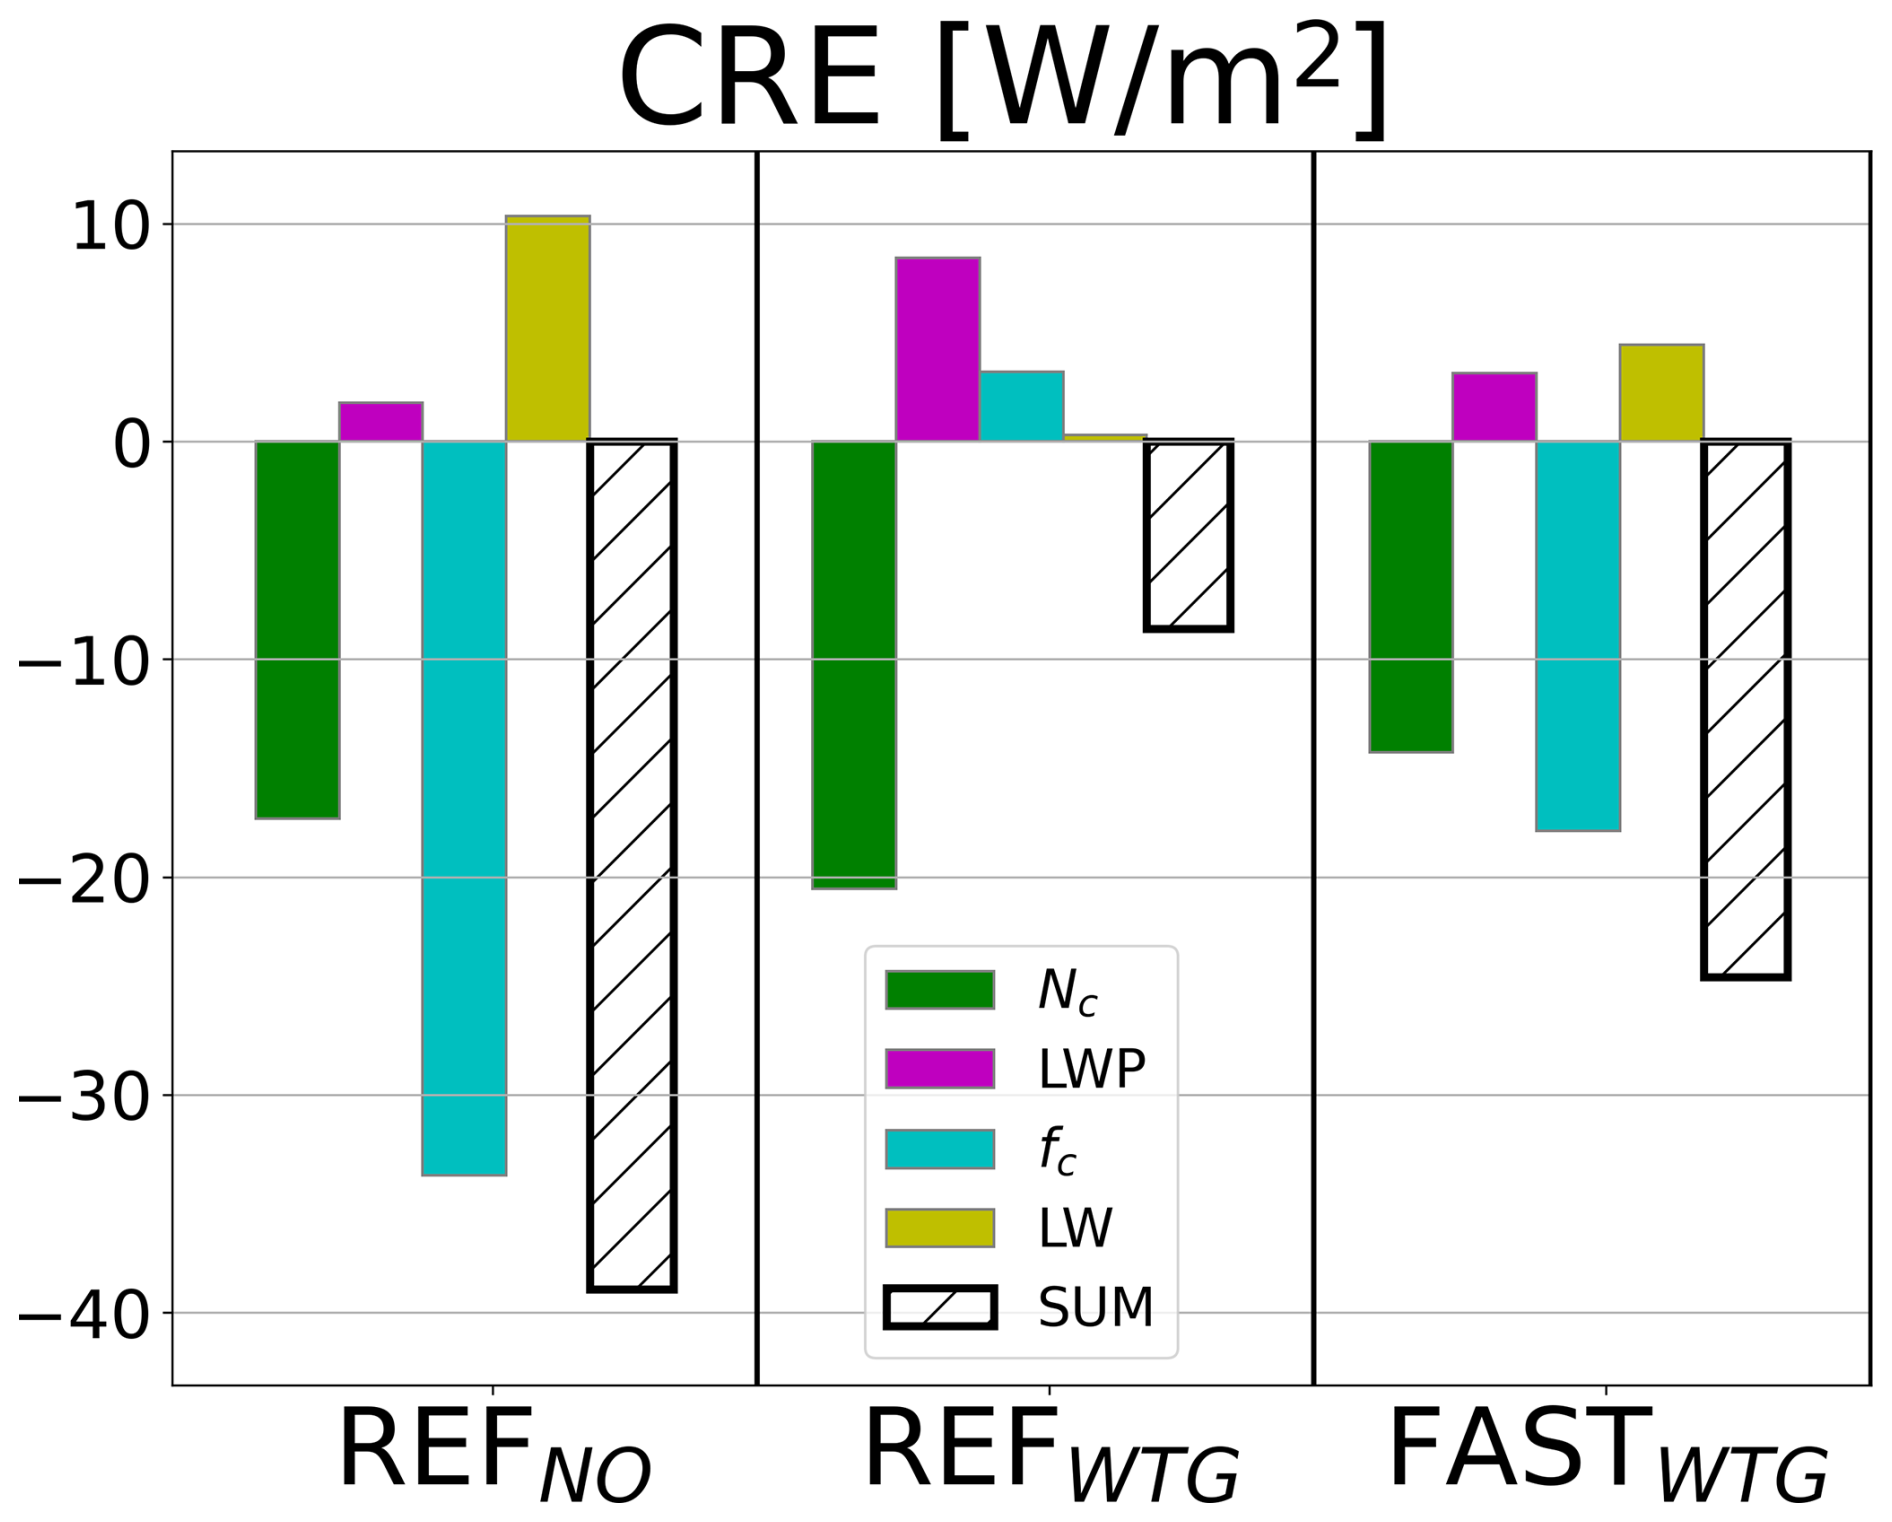
Figure 9The difference in the decomposed 3 d cloud radiative effect between the PLUME and CTRL runs (dCRE) for each case, showing contributions from (green), dCRELWP (magenta), (blue) and dCRELW (yellow). See Table 2 for the values on each day.
There is a significant difference in between the cases with and without the WTG adjustment. In the REFNO case, is −10.8 W m−2 and the cooling effect increases 4-fold on days 2 and 3 (−44.1 and −46.2 W m−2, respectively) because the SCT is inhibited. In the REFWTG case, on day 1 is negative (−2.6 W m−2) but becomes positive on day 2 (1.8 W m−2) and increases to 10.4 W m−2 on day 3. In the FASTWTG, the negative on day 1 (−12.8 W m−2), caused by a delayed SCT, becomes more negative on day 2 (−30.3 W m−2). On day 3, the magnitude of is smaller (−10.6 W m−2) due to the SCT in the PLUME run. The radiative effect of changes in cloud thickness (i.e., dCRELWP) is minor on day 1 in the three cases but becomes more pronounced on day 2. On day 3, dCRELWP weakens, suggesting that the timescale of adjustment in cloud thickness is roughly 1 d, as pointed out by Glassmeier et al. (2021). This timescale is also consistent with the observed timescale for the relaxation of LWP fluctuations in the subtropical regions where the SCT occurs (Eastman et al., 2016).
The change in outgoing LW radiative flux, which has not received as much attention in previous studies of low clouds' radiative effect, is nontrivial when the background precipitation is significantly suppressed and cloud cover increases in response. Since the MBL depths increase along the trajectory, the difference between cloud-top temperature (CTT) and SST increases. Thus, changes in cloud cover exert a nontrivial change in the LW cloud radiative effect. In the REFNO case, as the SCT is completely inhibited during the 3 d simulation and the MBL depth rapidly increases in the PLUME run, dCRELW increases along the trajectory (from 2.8 W m−2 on day 1 to 17.1 W m−2 on day 3). The magnitude of dCRELW is smaller in the FASTWTG case than in the REFNO because the MBL deepening is suppressed by intensified subsidence. In the weakly precipitating MBL of the (REFWTG) case, dCRELW does not account for the total dCRE, since the decrease in fc during daytime is compensated at night, and CTT does not significantly change due to the adjustment in subsidence.
The total dCRE (i.e., dCRE averaged across the 3 d simulations) differs greatly between the cases with and without the WTG. In the REFNO case, a significant total cooling effect (−38.9 W m−2) results from roughly equal contributions from the Twomey effect (−17.3 W m−2) and changes in cloud macrophysics (−21.6 W m−2), associated mostly with the delay in the SCT. In the REFWTG case, the slightly larger dCRENc (−20.5 W m−2) is partially offset, by 58 %, by the change in cloud macrophysics (together, 11.9 W m−2), resulting in a smaller, but still significant, net cooling effect of −8.5 W m−2. In the FASTWTG case, a smaller decrease in cloud LWP and an increase in cloud cover augment the negative CRE from the increase in dCRENc. Here, the CRE from the change in cloud macrophysical properties (−10.3 W m−2) is three-quarters of dCRENc (−14.2 W m−2). The total dCRE is −24.6 W m−2, which is only 63 % of that in the REFNO case, where the change in precipitation is comparable. This implies that if we do not consider the interaction between the aerosol–cloud interactions and the larger-scale circulation, the cloud radiative effect will be overestimated.
One key finding of this study is that incorporating the adjustment in the large-scale circulation to the background thermodynamic state in response to an aerosol perturbation has a crucial impact on the lifetime of stratocumulus clouds. With fixed large-scale dynamics, the aerosol perturbation inhibits a large amount of precipitation, thereby leading to the destabilization and the rapid growth of the boundary layer. Consequently, this inhibits the stratocumulus-to-cumulus transition (SCT). It is anticipated from our results that as the marine boundary layer (MBL) continuously deepens with time, or along the trajectory, for a couple of days precipitation is initiated in the clouds deepened through aerosol injection, despite the clouds having a larger number of cloud droplets. This is a type of buffering or deepening effect (Stevens and Feingold, 2009; Seifert et al., 2015), which results in the SCT. With a framework that accounts for an interactive large-scale circulation, on the other hand, intensified subsidence from buoyancy perturbations suppresses cloud deepening (Dagan et al., 2022). As a result, the cloud becomes thinner and loses the potential to generate turbulence by cloud-top cooling, inducing cloud breakup. This suggests that the aerosol perturbation does not inhibit the SCT but changes the transition regime from a precipitation-driven drizzle-depletion to an entrainment-driven deepening–warming mechanism.
The stark contrast in the pace of the SCT indicates that the cloud radiative effect will be overestimated if the interplay between the aerosol–cloud interactions and the large-scale circulation is not accounted for. For strongly precipitating MBLs, the reduced longevity of the stratocumulus layer by aerosol perturbation associated with the subsidence intensification reduces the cooling effect to a third compared to cases without the subsidence intensification. For lightly precipitating MBLs, positive LWP adjustments cancel 50 % of the Twomey effect. This implies that integrating the interplay of aerosol–cloud interactions (ACIs) with the large-scale circulation more accurately constrains the radiative forcing associated with anthropogenic climate change and the deliberate injection of targeted aerosols to mitigate anthropogenic global warming (i.e., climate intervention by marine cloud brightening, MCB).
Our research findings also highlight the contrast in fundamental processes inherent to stratocumulus and cumulus cloud regimes, emphasizing the significance of adopting a regime-centered approach, as recommended by Stevens and Feingold (2009). In the context of overcast shallow stratocumulus, characterized by well-mixed boundary layers, we observe that the intensification of cloud-top entrainment due to an aerosol perturbation drives cloud thinning (i.e., negative cloud adjustments) but that thinning is partly or, in the heavily precipitating state, more than compensated for by positive adjustments associated with precipitation suppression (Albrecht, 1989; Ackerman et al., 2004; Wang et al., 2011; Rosenfeld et al., 2019; Chen et al., 2022; Yuan et al., 2023) and increased surface heat fluxes (Chun et al., 2023; Chen et al., 2024). However, as clouds undergo the transition, the influence of cloud-top entrainment adjustments diminishes, owing to a weakened contribution from cloud tops to boundary layer turbulence. Simultaneously, an adjustment in surface buoyancy production becomes more pronounced since the deeper cumulus clouds tend to produce more precipitation than shallower stratocumulus clouds. Given that the impact of subsidence adjustments emerges as the dominant factor when significant changes in precipitation occur, the influence of subsidence adjustments tends to be less pronounced in this regime. In contrast, deeper cumulus clouds exhibit a greater susceptibility to modulation through the interplay between aerosol perturbations and the large-scale circulation.
The realization of the interactive large-scale circulation used in this model, the weak temperature gradient (WTG), is limited because this method is simplified. For this approximation, the background thermodynamic states for the WTG (e.g., lower free-tropospheric temperature and moisture) do not respond to the background dynamic adjustment. This approximation might be acceptable for 3 d simulations. As the pollution track is widespread, however, the thermodynamic reference state should be changed, thereby affecting the cloud adjustment. In addition, the localized but persistent radiative forcing caused by the aerosol perturbation potentially causes an imbalance in the energy budget, inducing perturbations in the large-scale circulation and, thereby, winds, surface fluxes and clouds (Abbott and Cronin, 2021; Dagan, 2022; Diamond et al., 2022). Another critical point raised by Dagan (2022) is the interaction between different cloud regimes, such as those in the subtropics and tropics. Aerosol loadings in one regime can significantly impact cloud properties in another by perturbing large-scale circulations. This interdependence suggests that understanding the impact of aerosol–cloud interaction on the climate system requires a closer investigation of the interconnections across distant regions, where regional aerosol perturbations can propagate through modulating large-scale dynamics to influence cloud and atmospheric properties far from their origin. Such insights underscore the importance of a comprehensive approach in studying climate dynamics, where aerosol–cloud interactions are evaluated in the context of both local processes and their broader, system-wide effects.
The experiments presented in this study offer valuable insights into the impact of aerosol perturbations on the SCT. However, it is important to acknowledge their limitations in fully constraining the radiative effects of aerosol perturbations on the SCT. The analysis primarily focuses on two composite trajectories, the REF and FAST cases derived from Sandu and Stevens (2011), which, while informative, do not fully capture the diverse variability of the boundary layer and cloud behavior during transitions. Additionally, the WTG approach in this study relies on thermodynamic profiles from ERA5 reanalysis, which, though useful, may introduce biases typical of weather and climate models in the SCT regime. ERA5 vertical profiles of temperature, moisture and other variables may not fully capture the subtle thermodynamic gradients and interactions characteristic of SCT regions, potentially affecting the representation of cloud formation and dissipation processes. Moreover, the utilization of a single climatological profile for the WTG in this investigation provides valuable insights but may not comprehensively account for the intricate interactions between cloud microphysics, macrophysics and large-scale circulations. Therefore, it is imperative for future research to expand upon these findings by conducting experiments representative of various geographic locations where compact low clouds are prevalent, so their breakup processes can be more comprehensively studied.
This study explores the interaction of cloud microphysics and macrophysics with large-scale circulation impacts in large-eddy simulations of the stratocumulus-to-cumulus transition (SCT). To account for the interaction of large-scale dynamics with changes in microphysics and macrophysics, we utilized the weak-temperature-gradient (WTG) approach. The WTG approach approximates the large-scale dynamical responses to buoyancy perturbations with respect to a reference climatological thermodynamic condition. We investigate two climatological trajectories over the northeast Pacific (Sandu and Stevens, 2011), where the SCT frequently occurs. These cases are systematically examined through simulations both with and without aerosol injections, providing insights into the intricate response to aerosol perturbations.
Throughout the preceding sections, we have highlighted the pivotal influence of adjustments in the large-scale circulation and its subsequent response to aerosol perturbations on the SCT. The growth of the marine boundary layer (MBL) triggered by aerosol injection introduces a negative buoyancy perturbation, thereby altering the thermodynamic state and inducing enhancement of the subsidence. This intensified subsidence suppresses cloud-top height growth, as observed in previous work (van der Dussen et al., 2016), and simultaneously elevates cloud-base height due to enhanced cloud-top entrainment warming and drying processes. Consequently, this intricate interplay results in an accelerated thinning of the cloud layer.
Due to the intensified subsidence, there is an increase in the fraction of clouds with LWP lower than a critical threshold (∼20 g m−2), characterized by a reduced emissivity and weakened longwave radiative cooling efficiency, where clouds become more susceptible to cloud breakup, thereby hastening the SCT. Meanwhile, a reduction in cloud-base precipitation driven by the aerosol perturbation makes the subcloud layer warmer, leading to weakened surface buoyancy fluxes. Since cloud depth diurnally decreases with solar absorption and surface buoyancy weakens throughout the day, the cloud breakup driven by the aerosol perturbation becomes more pronounced during daytime.
In a weakly precipitating MBL in which enhanced entrainment drives a deepening–warming transition, the SCT is accelerated due to the decreases in turbulent generation from decreases in both cloud-top cooling and the surface buoyancy flux. In a strongly precipitating MBL in which precipitation drives a drizzle-depletion transition, the cloud amount increases due to the retention of liquid water through suppressed precipitation, but this does not inhibit the SCT. Without accounting for the subsidence adjustment triggered by the aerosol perturbation, the free growth of the MBL through precipitation suppression inhibits the stratocumulus breakup, a phenomenon in alignment with a recent study (Prabhakaran et al., 2023).
The MBL and cloud adjustments resulting from the interaction of an aerosol perturbation with the large-scale circulation strongly modulates the cloud radiative effect (CRE). For a lightly drizzling MBL, the Twomey effect brightens the clouds, and this is largely offset by accelerated cloud breakup. Despite the decrease in cloud cover during daytime, the cloud recovery at night makes longwave (LW) radiative forcing a marginal contribution to the total radiative forcing. For a heavily precipitating MBL, a positive LWP adjustment driven by reduced precipitation augments the Twomey brightening, but this enhancement in LWP is smaller than in the case without subsidence adjustment. The increase in cloud cover, especially at night, reduces LW radiative emission into space and partially cancels the SW radiative cooling. Nonetheless, the total change in the cloud radiative effect with aerosol injection exerts a cooling impact across all cases.
The inversion height (zinv) from the climatology, which represents the large-scale background thermodynamic profiles, is slightly lower than those in the model simulations (Fig. 2a). This results in a negative buoyancy perturbation in the upper part of the boundary layer compared to the background. Subsidence is intensified to reduce the negative buoyancy deviation by inducing adiabatic warming (Figs. 2b and A1b). The reduction in cloud-base precipitation by an influx of the FT aerosol intensifies in-cloud turbulence, leading to deepening of the MBL. The tendency toward the MBL deepening further intensifies subsidence in order to reduce the virtual potential temperature (θv) anomaly in the background state. θv in the FASTWTG case is higher than in the REFWTG case due to the higher SST and greater latent heat release by precipitation formation (Fig. 2e), leading to weaker subsidence in the FASTWTG case than in the REFWTG case. As a result of the subsidence adjustment, the inversion height (zinv) in the cases with the WTG remains close to that in the background state. The entrainment rate (we) is higher in the REFWTG and FASTWTG cases than in the REFNO case because the deepening rate is comparable, but subsidence is intensified (Fig. 2f).
Table A1Same as Table 2 but for the REFweak, REFFT and REFMLB cases.
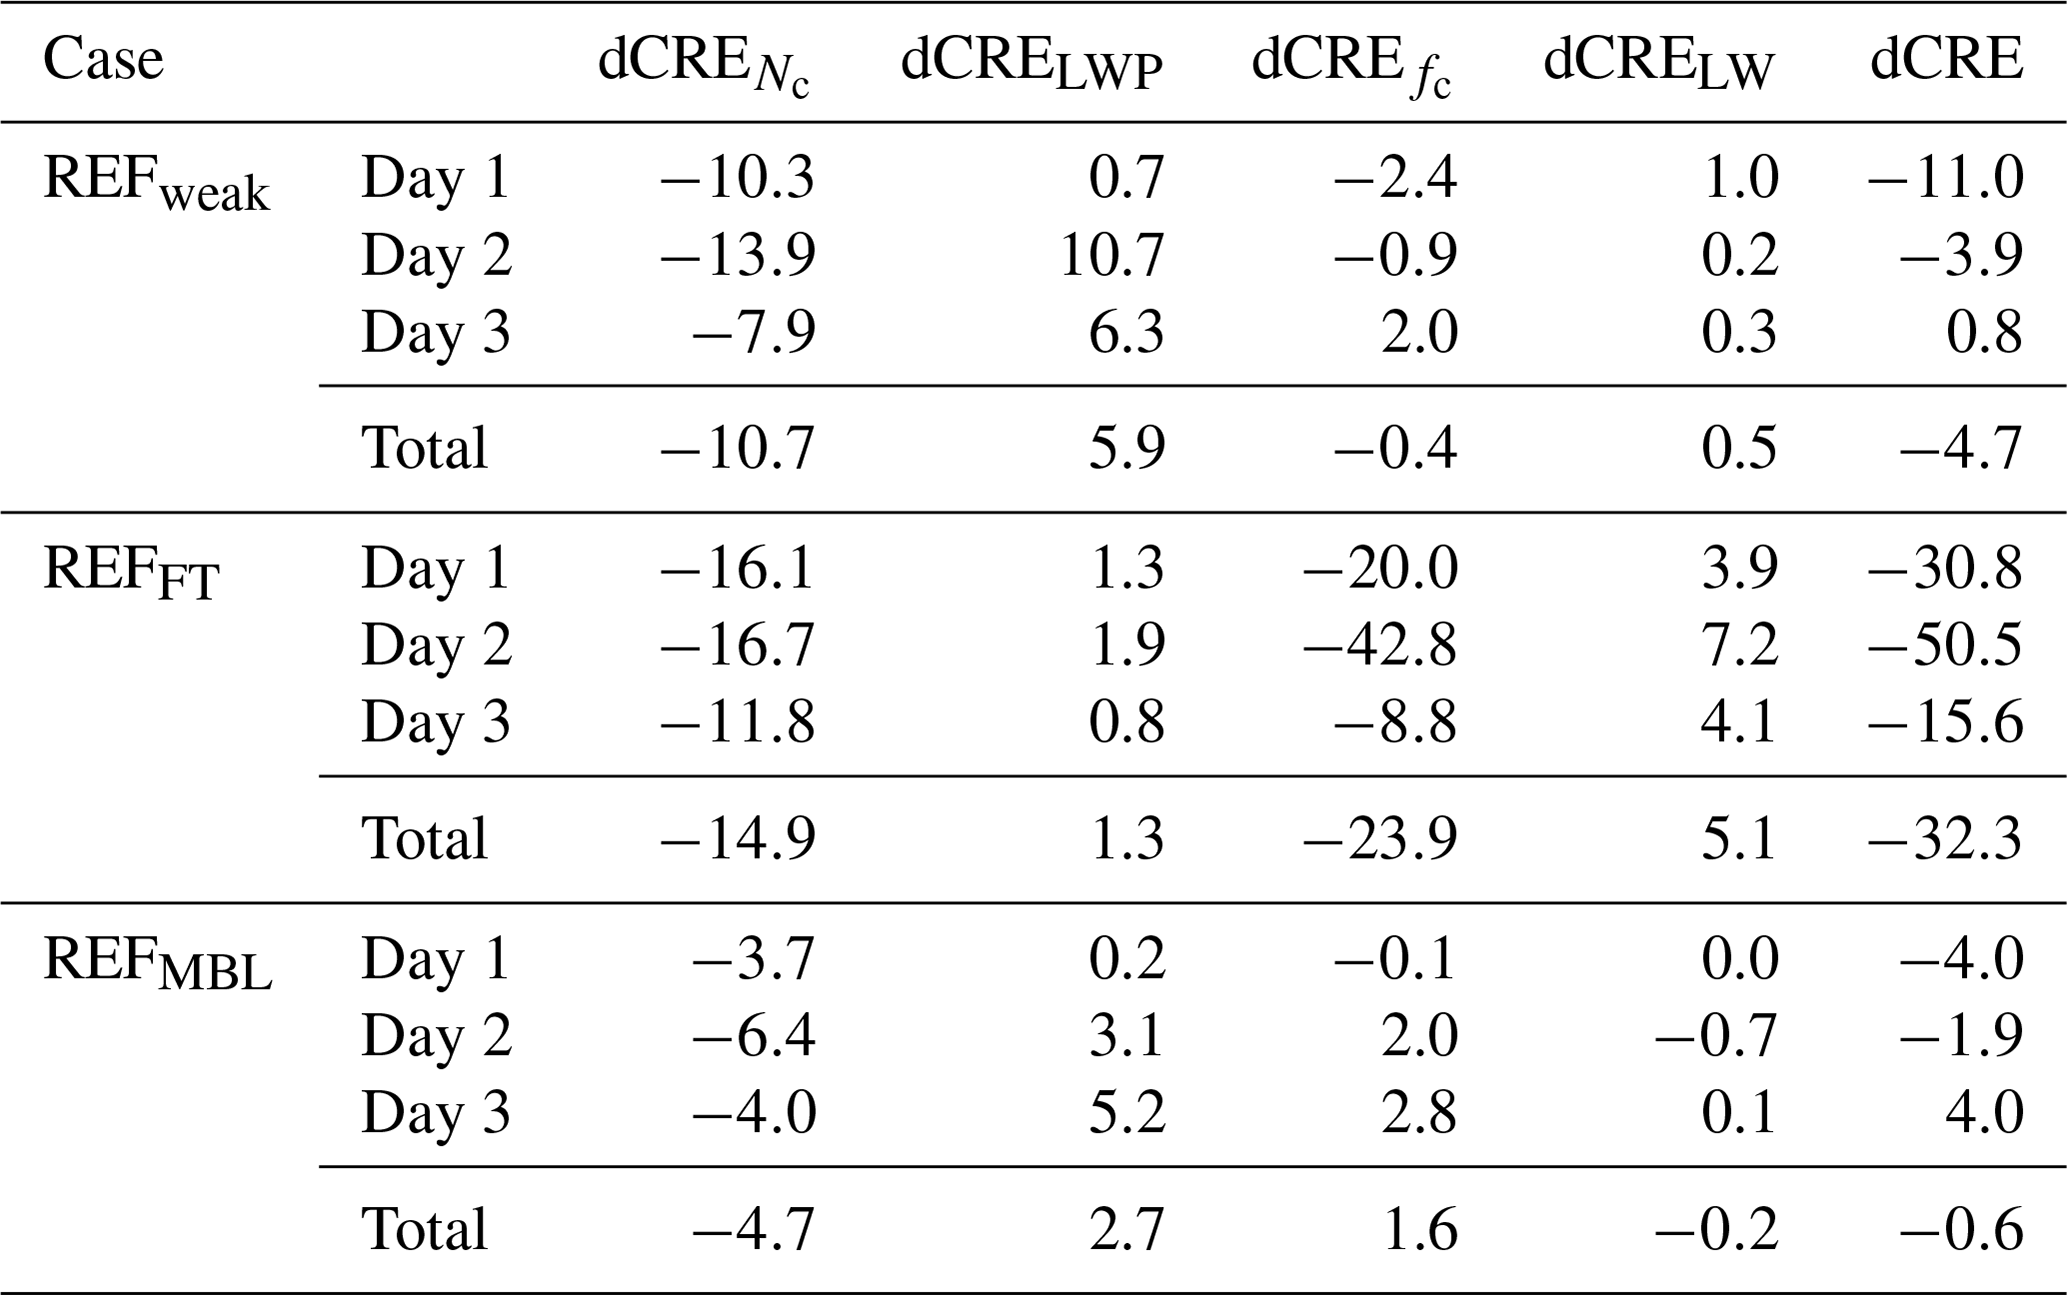
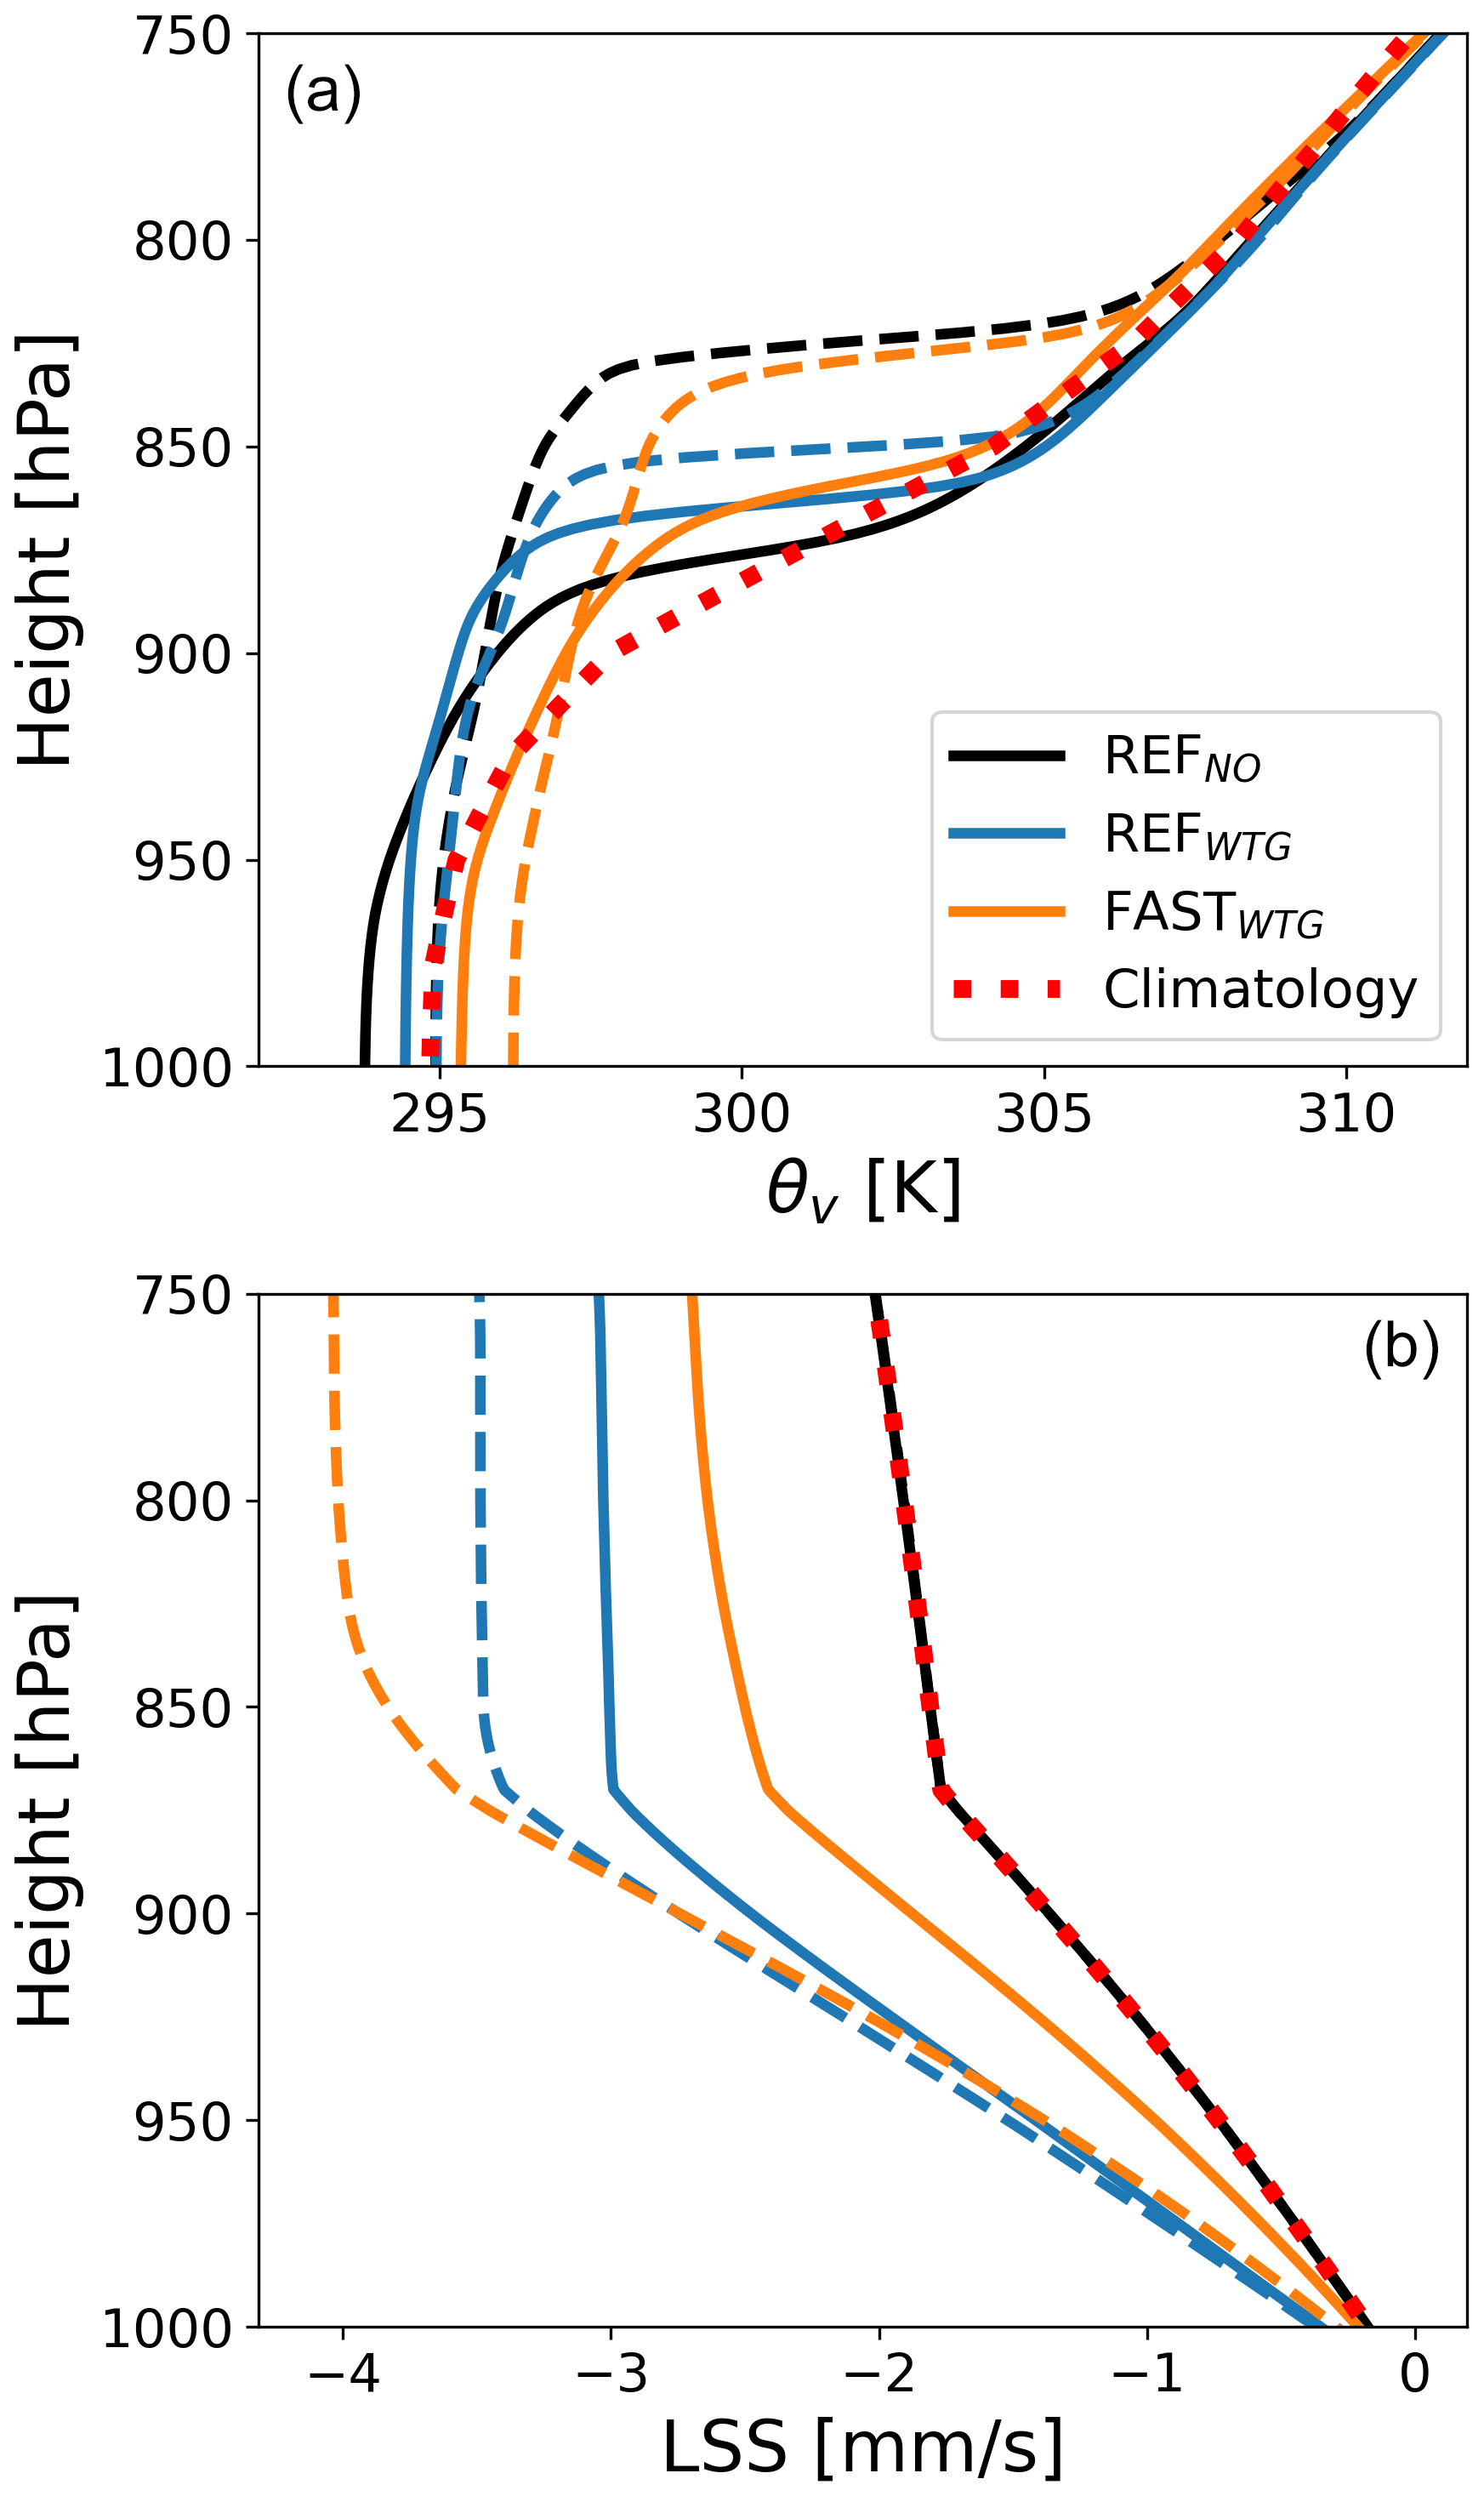
Figure A1Vertical profiles of (a) virtual potential temperature θv and (b) large-scale subsidence for the CTRL (solid) and PLUME (dashed) runs on day 2 for the three cases. The dotted red line represents the ERA5 climatology at the location of climatological trajectory on day 2 used for the background profile for the WTG.
The aerosol injections in the cases with the WTG adjustment (dashed lines in Fig. A1) perturb the buoyancy profile and, thus, the large-scale vertical motion. The decrease in precipitation flux down to the surface with aerosol injection reduces θv in the MBL and, in turn, intensifies subsidence to dampen the decrease in θv. In addition, the tendency of the MBL deepening by enhanced we leads to an additional negative θv perturbation at the upper part of the boundary layer, resulting in the further intensification of subsidence. The subsidence is intensified further in the FASTWTG case than in the REFWTG case due to a greater reduction in precipitation and increased we. The prescribed feedback loop illustrates that the boundary layer deepening by aerosol enhancement is buffered by intensified subsidence as illustrated in Dagan et al. (2022).
Figure B1 illustrates the dependency of the cloud radiative heating rate on in-cloud LWP in the afternoon. Individual scatter plots indicate radiative heating by clouds in each column. LW radiative cooling sharply increases with cloud depth for in-cloud LWP up to 20 g m−2 and then becomes saturated above 20 g m−2. SW radiative heating, on the other hand, sublinearly increases with LWP. As a result, the net cloud radiative cooling rate sharply strengthens up to a LWP of 20 g m−2 and then weakens above 20 g m−2. As discussed in Bretherton et al. (2010), when the boundary layer depth decreases (i.e., ), clouds thinner than 20 g m−2 quickly dissipate through a positive feedback loop (MBL depth decreases–decrease in cloud thickness–decrease in radiative driving of turbulence and entrainment–decrease in cloud thickness). With the WTG implementation, both weakened turbulence in the MBL (e.g., Figs. 4 and 5) and intensified subsidence (Appendix A) by an aerosol perturbation make the stratocumulus more vulnerable to cloud breakup.
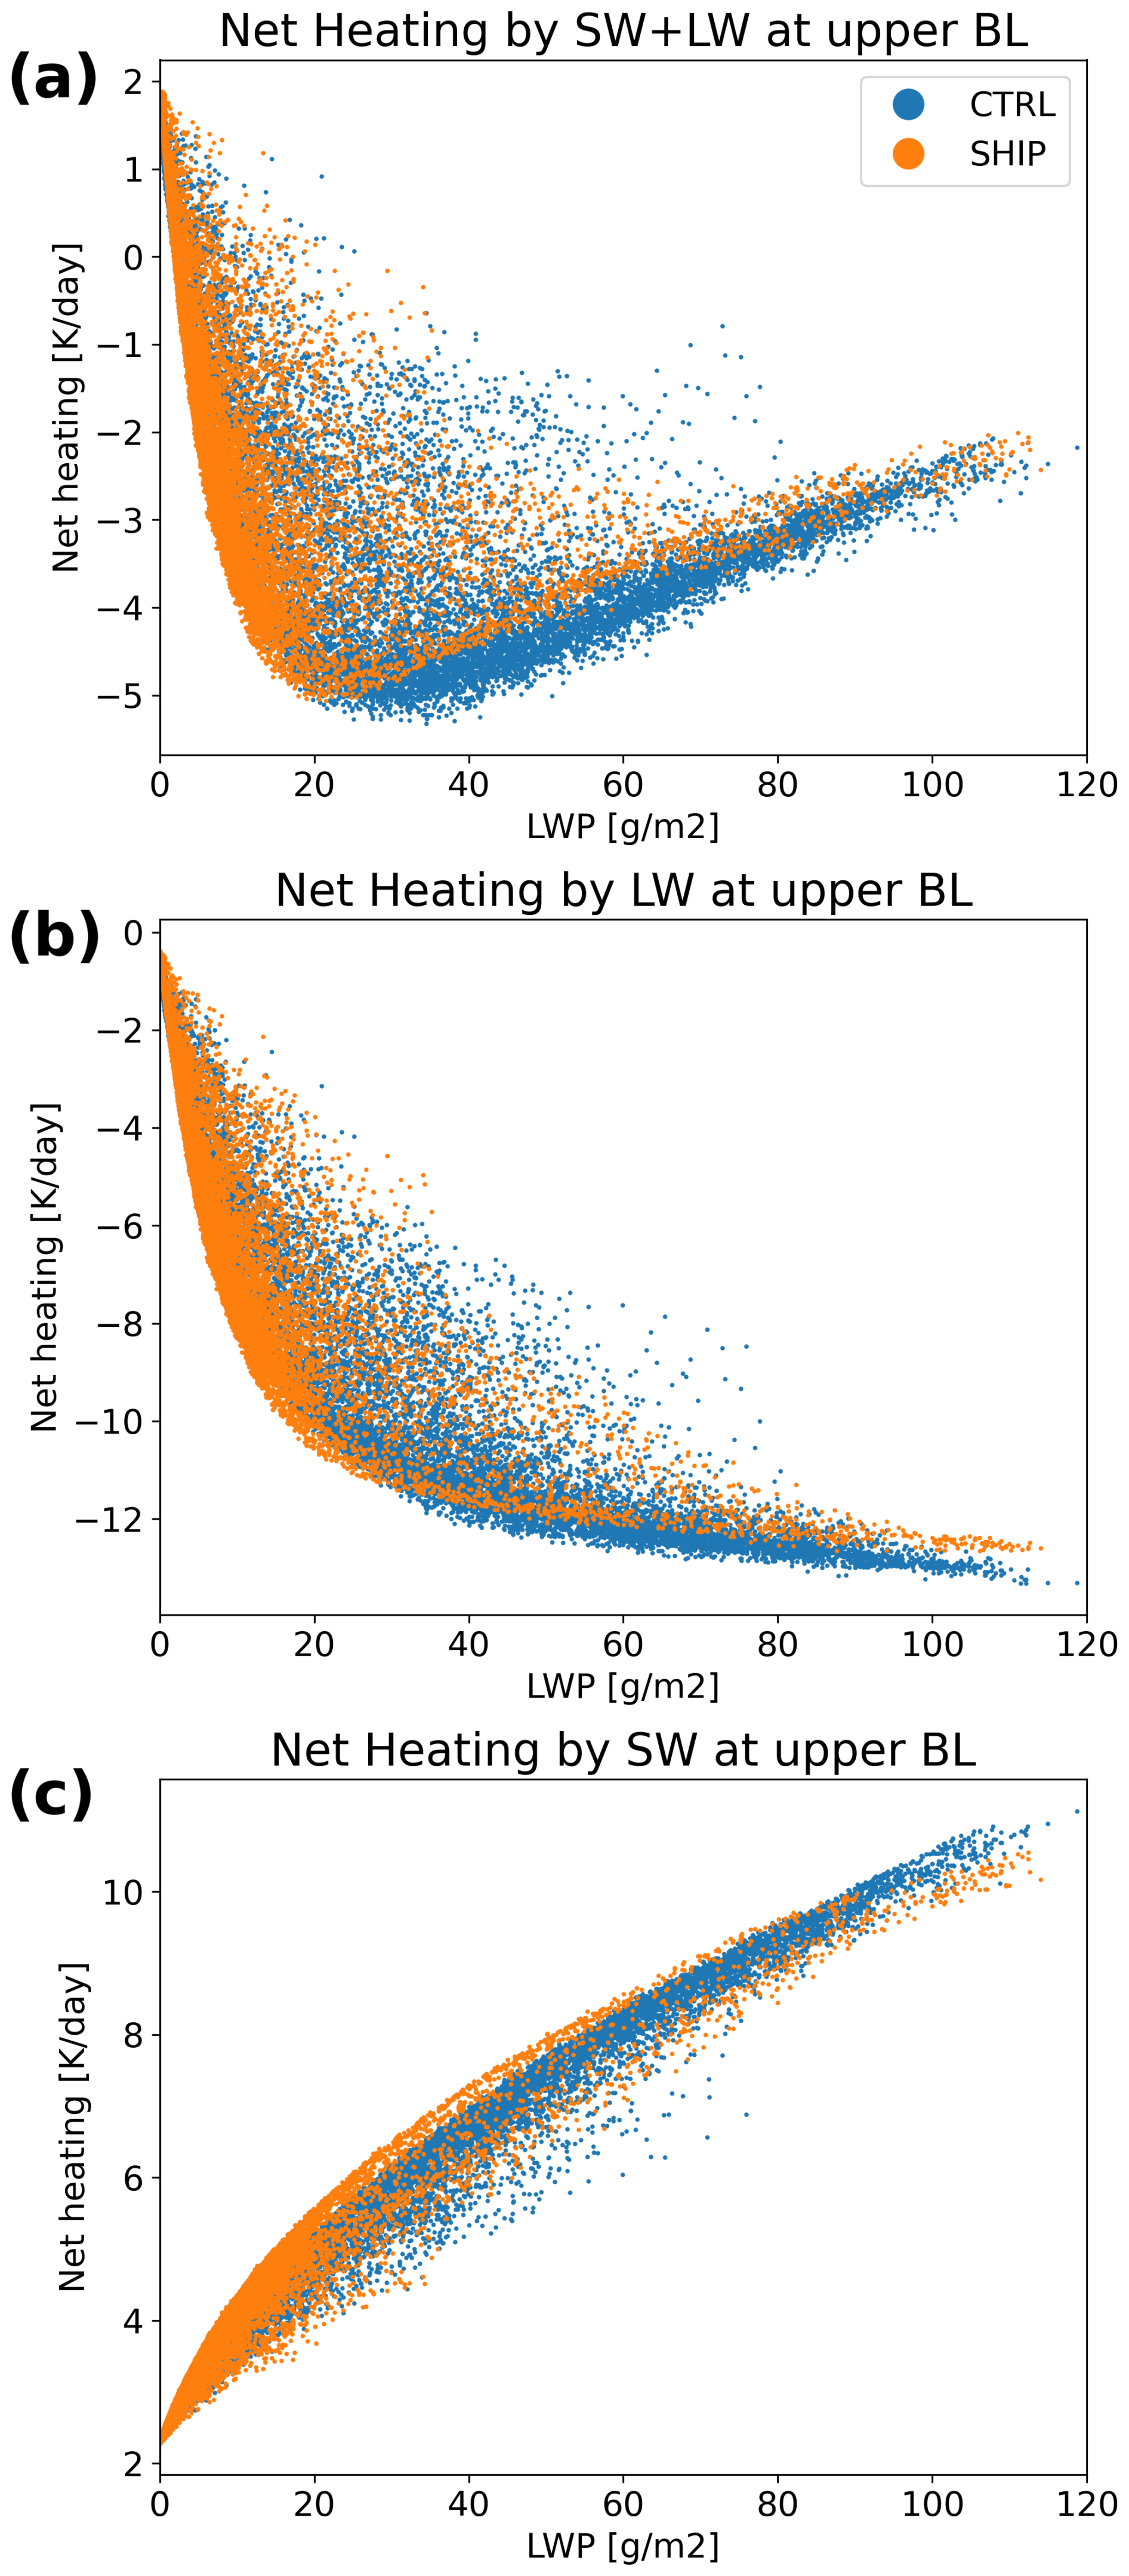
Figure B1(a) SW and LW radiative heating rates by clouds in the upper part of the BL (i.e., the mean at the levels in the upper half of the MBL) on day 1.25 for the CTRL (blue) and PLUME (orange) runs. (b, c) Same as (a) but for the LW and SW only, respectively.
To test the sensitivity of accounting for large-scale circulation responses to aerosol conditions, the REFWTG case is repeated with three different sets of aerosol conditions, as given in Table 1. The evolution of the cloud and MBL properties is illustrated in Fig. C1, similar to Fig. 2.
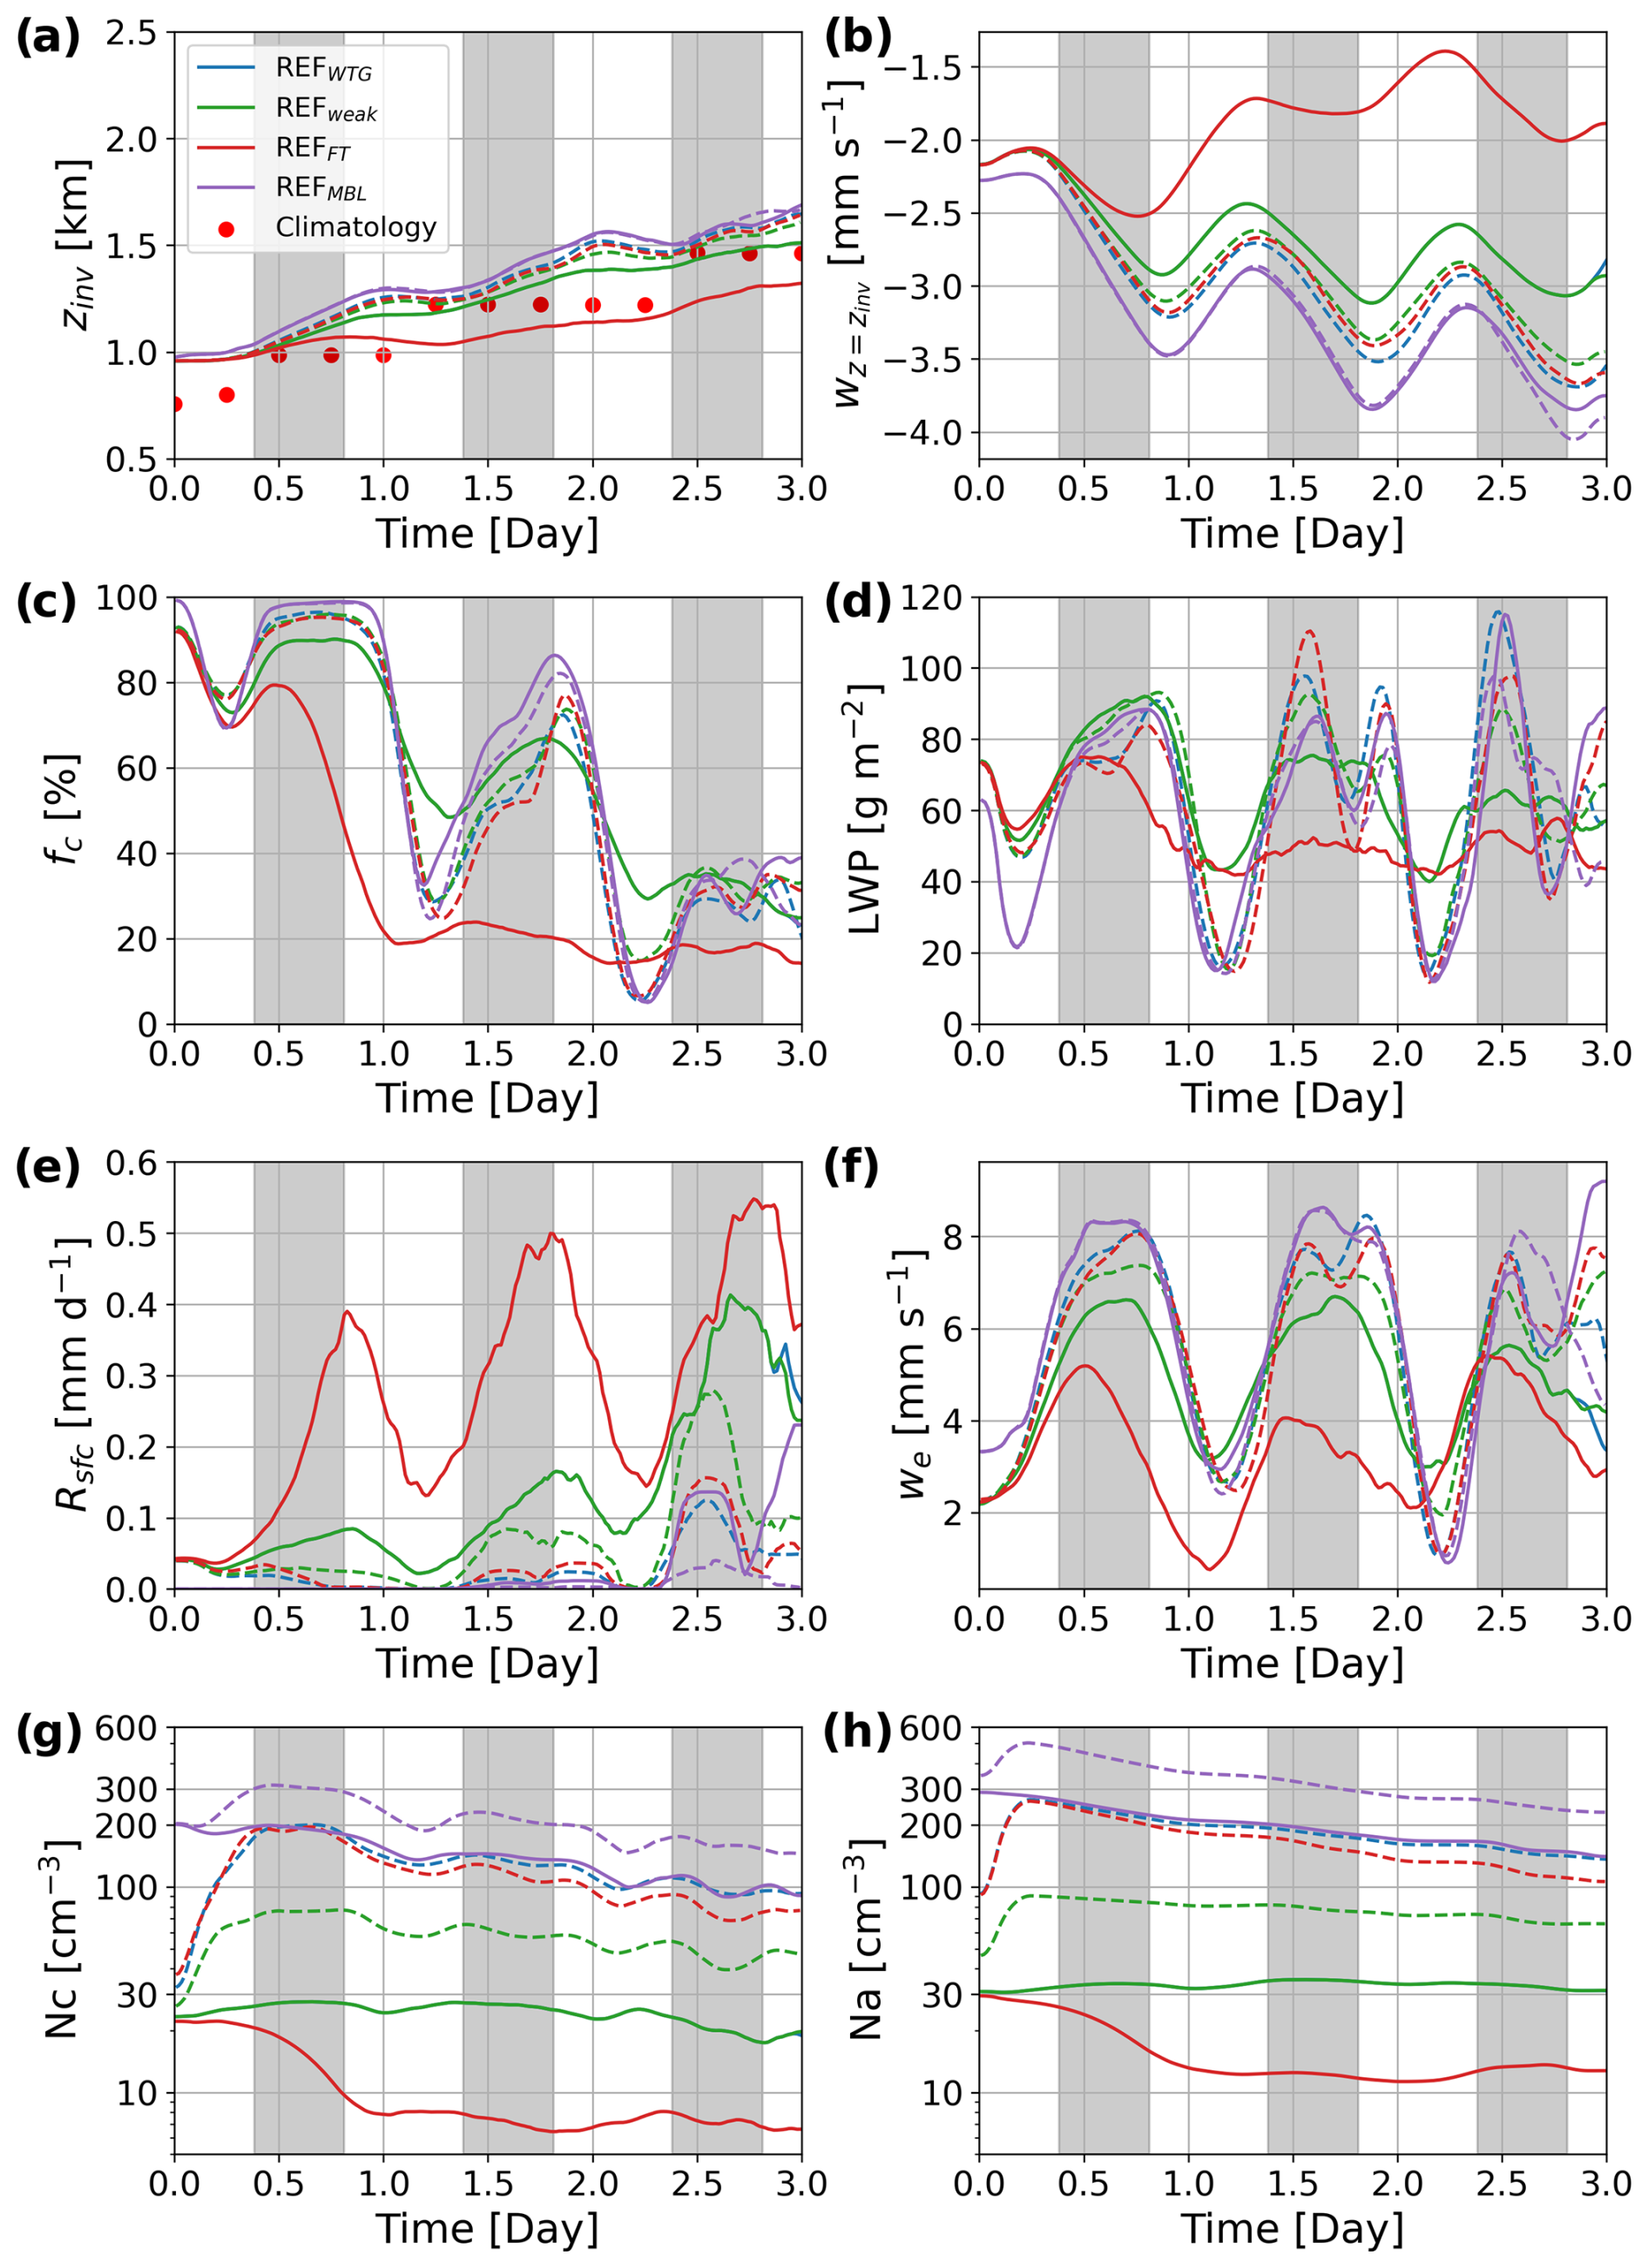
Figure C1Same as Fig. 1 but for the REFWTG (blue), REFweak (green), REFFT (red) and REFMBL (purple) cases.
The only difference between the REFweak and REFWTG cases is the aerosol injection rate, so the CTRL run is exactly the same as for the REFWTG case in Fig. 2. In the REFWTG case PLUME run, Na in the MBL and Nc are both enhanced to 90 cm−3 – aerosol perturbation smaller than in the REFWTG PLUME case by a factor of 3 (∼300 cm−3) (Fig. C1g and h). This case examines the sensitivity to aerosol perturbation in the SCT with weak precipitation.
In the REFFT case, the stratocumulus layer has a weaker supply of aerosol from the lower FT. Clouds rapidly break up on the first night due to the rapid scavenging of the larger cloud droplets by stronger precipitation (Fig. C1c and e). Due to the stabilization by rain evaporation below the cloud base, zinv is slightly lower than that in the climatology. Due to the polluted MBL, the precipitation rate in the REFMBL case is too weak to reach the surface (Rsfc<0.1 mm d−1), so the change in Rsfc by aerosol injection is negligible. This case examines the impact of aerosol injection on the SCT in a non-precipitating MBL.
With aerosol injections, the clouds and MBL evolve similarly to those in the REFWTG case. As discussed in Sects. 3.1.2 and 3.1.3, the stratocumulus layer gradually thins, with a significant diurnal variation (thinning during the daytime and recovering at night). The decreases in fc and LWP are comparable in the REFweak and REFWTG cases, although Nc enhancement is 3 times weaker in the former case. This result is consistent with Manshausen et al. (2023), revealing that liquid water increases driven by aerosol perturbations in raining clouds are constant over the emission ranges observed. One discernible feature is a slightly higher fc and LWP on day 2 in the REFweak case than in the REFWTG case. In the REFFT case, aerosol injections effectively reduce Rsfc and thus increase fc, LWP, we and subsidence. The difference in fc and LWP between the CTRL and PLUME runs is quickly reduced along the trajectory due to the enhanced subsidence, as in the FASTWTG case. Due to a pristine lower FT, the aerosol number concentration in the MBL and cloud number concentration rapidly decreases with time. In the REFMBL case, the perturbations caused by aerosol injection are much smaller due to small changes in we and Rsfc.
Changes in cloud radiative effects in the REFweak case are broadly similar to those in REFWTG case but weaker in magnitude with an overall dCRE that is negative but about half as strong as in the REFWTG case. In the REFFT case, dCRE is more negative than for the FASTWTG case, due to earlier cloud breakup in the REFFT case than in the FASTWTG case. In the REFMBL case, dCRE on day 1 is negative but increases with time and becomes positive on day 3, leading to a small radiative forcing across all 3 d.
The original model source code and documentation are publicly available at http://rossby.msrc.sunysb.edu/SAM.html (Khairoutdinov and Randall, 2003). Case setup files and modified version of source codes for the simulations (SAM-UW) are archived at https://doi.org/10.5281/zenodo.15093143 (Chun, 2025). Python scripts used for data analysis are available upon request.
JYC, RW and PNB formulated the original model study. JYC and PNB set up the model runs. JYC conducted and analyzed the runs with input from RW, PNB and SJD. JYC drafted the paper. RW, PNB and SJD provided edits and revisions.
The contact author has declared that none of the authors has any competing interests.
Publisher's note: Copernicus Publications remains neutral with regard to jurisdictional claims made in the text, published maps, institutional affiliations, or any other geographical representation in this paper. While Copernicus Publications makes every effort to include appropriate place names, the final responsibility lies with the authors.
This study was primarily supported by NOAA's Climate Program Office Earth's Radiation Budget (ERB) program, grant NA22OAR4310474, as well as through the University of Washington's Marine Cloud Brightening Program, which is funded by the generous support of a growing consortium of individual and foundation donors. This publication is also partially funded by the Cooperative Institute for Climate, Ocean and Ecosystem Studies (CICOES) under NOAA Cooperative Agreement NA20OAR4320271, contribution no. 2024-1349. This work used Bridges-2 (Brown et al., 2021) at Pittsburgh Supercomputing Center through allocation EES210037 from the Advanced Cyberinfrastructure Coordination Ecosystem: Services & Support (ACCESS) program (Boerner et al., 2023), which is supported by the National Science Foundation (grant nos. 2138259, 2138286, 2138307, 2137603 and 2138296).
This research has been supported by the National Oceanic and Atmospheric Administration (grant nos. NA22OAR4310474 and NA20OAR4320271). This work used Bridges-2 at Pittsburgh Supercomputing Center through allocation EES210037 from the Advanced Cyberinfrastructure Coordination Ecosystem: Services & Support (ACCESS) program, which is supported by the National Science Foundation (grant nos. 2138259, 2138286, 2138307, 2137603 and 2138296).
This paper was edited by Tak Yamaguchi and reviewed by two anonymous referees.
Abbott, T. H. and Cronin, T. W.: Aerosol invigoration of atmospheric convection through increases in humidity, Science, 371, 83–85, 2021. a, b
Abdul-Razzak, H. and Ghan, S. J.: A parameterization of aerosol activation: 2. Multiple aerosol types, J. Geophys. Res.-Atmos., 105, 6837–6844, https://doi.org/10.1029/1999JD901161, 2000. a
Ackerman, A. S., Kirkpatrick, M. P., Stevens, D. E., and Toon, O. B.: The impact of humidity above stratiform clouds on indirect aerosol climate forcing, Nature, 432, 1014–1017, https://doi.org/10.1038/nature03174, 2004. a, b
Ackerman, A. S., VanZanten, M. C., Stevens, B., Savic-Jovcic, V., Bretherton, C. S., Chlond, A., Golaz, J.-C., Jiang, H., Khairoutdinov, M., Krueger, S. K., Lewellen, D. C., Lock, A., Moeng, C.-H., Nakamura, K., Petters, M. D., Snider, J. R., Weinbrecht, S., and Zulauf, M.: Large-eddy simulations of a drizzling, stratocumulus-topped marine boundary layer, Mon. Weather Rev., 137, 1083–1110, https://doi.org/10.1175/2008MWR2582.1, 2009. a
Albrecht, B. A.: Aerosols, cloud microphysics, and fractional cloudiness, Science, 245, 1227–1230, https://doi.org/10.1126/science.245.4923.1227, 1989. a, b
Albrecht, B. A., Jensen, M. P., and Syrett, W. J.: Marine boundary layer structure and fractional cloudiness, J. Geophys. Res.-Atmos., 100, 14209–14222, https://doi.org/10.1029/95JD00827, 1995. a
Anber, U. M., Wang, S., Gentine, P., and Jensen, M. P.: Probing the response of tropical deep convection to aerosol perturbations using idealized cloud-resolving simulations with parameterized large-scale dynamics, J. Atmos. Sci., 76, 2885–2897, 2019. a
Berner, A. H., Bretherton, C. S., Wood, R., and Muhlbauer, A.: Marine boundary layer cloud regimes and POC formation in a CRM coupled to a bulk aerosol scheme, Atmos. Chem. Phys., 13, 12549–12572, https://doi.org/10.5194/acp-13-12549-2013, 2013. a, b
Bjerknes, J.: A possible response of the atmospheric Hadley circulation to equatorial anomalies of ocean temperature, Tellus, 18, 820–829, https://doi.org/10.3402/tellusa.v18i4.9712, 1966. a
Blossey, P. N. and Durran, D. R.: Selective monotonicity preservation in scalar advection, J. Comput. Phys., 227, 5160–5183, https://doi.org/10.1016/j.jcp.2008.01.043, 2008. a
Blossey, P. N., Bretherton, C. S., and Wyant, M. C.: Subtropical Low Cloud Response to a Warmer Climate in a Superparameterized Climate Model. Part II: Column Modeling with a Cloud Resolving Model, J. Adv. Model. Earth Sy., 1, 8, https://doi.org/10.3894/JAMES.2009.1.8, 2009. a, b, c, d, e
Blossey, P. N., Bretherton, C. S., and Mohrmann, J.: Simulating observed cloud transitions in the northeast Pacific during CSET, Mon. Weather Rev., 149, 2633–2658, https://doi.org/10.1175/MWR-D-20-0328.1, 2021. a
Boerner, T. J., Deems, S., Furlani, T. R., Knuth, S. L., and Towns, J.: ACCESS: Advancing Innovation: NSF's Advanced Cyberinfrastructure Coordination Ecosystem: Services & Support, in: Practice and Experience in Advanced Research Computing 2023: Computing for the Common Good, PEARC '23, Association for Computing Machinery, 23–27 July 2023, New York, NY, USA, 173–176, https://doi.org/10.1145/3569951.3597559, 2023. a
Bony, S. and Dufresne, J.-L.: Marine boundary layer clouds at the heart of tropical cloud feedback uncertainties in climate models, Geophys. Res. Lett., 32, L20806, https://doi.org/10.1029/2005GL023851, 2005. a
Bretherton, C., Blossey, P. N., and Uchida, J.: Cloud droplet sedimentation, entrainment efficiency, and subtropical stratocumulus albedo, Geophys. Res. Lett., 34, L03813, https://doi.org/10.1029/2006GL027648, 2007. a
Bretherton, C. S. and Blossey, P. N.: Low cloud reduction in a greenhouse-warmed climate: Results from Lagrangian LES of a subtropical marine cloudiness transition, J. Adv. Model. Earth Sy., 6, 91–114, https://doi.org/10.1002/2013MS000250, 2014. a, b, c
Bretherton, C. S. and Blossey, P. N.: Understanding Mesoscale Aggregation of Shallow Cumulus Convection Using Large-Eddy Simulation, J. Adv. Model. Earth Sy., 9, 2798–2821, https://doi.org/10.1002/2017MS000981, 2017. a
Bretherton, C. S. and Wyant, M. C.: Moisture Transport, Lower-Tropospheric Stability, and Decoupling of Cloud-Topped Boundary Layers, J. Atmos. Sci., 54, 148–167, https://doi.org/10.1175/1520-0469(1997)054<0148:MTLTSA>2.0.CO;2, 1997. a
Bretherton, C. S., Uchida, J., and Blossey, P. N.: Slow manifolds and multiple equilibria in stratocumulus-capped boundary layers, J. Adv. Model. Earth Sy., 2, 14, https://doi.org/10.3894/JAMES.2010.2.14, 2010. a, b
Brown, S. T., Buitrago, P., Hanna, E., Sanielevici, S., Scibek, R., and Nystrom, N. A.: Bridges-2: A Platform for Rapidly-Evolving and Data Intensive Research, in: Practice and Experience in Advanced Research Computing 2021: Evolution Across All Dimensions, PEARC '21, Association for Computing Machinery, 18–22 July 2021, New York, NY, USA, https://doi.org/10.1145/3437359.3465593, 2021. a
Chen, Y., Haywood, J., Wang, Y., Malavelle, F., Jordan, G., Partridge, D., Fieldsend, J., De Leeuw, J., Schmidt, A., Cho, N., Oreopoulos, L., Platnick, S., Grosvenor, D., Field, P., and Lohmann, U.: Machine learning reveals climate forcing from aerosols is dominated by increased cloud cover, Nat. Geosci., 15, 609–614, https://doi.org/10.1038/s41561-022-00991-6, 2022. a
Chen, Y.-S., Zhang, J., Hoffmann, F., Yamaguchi, T., Glassmeier, F., Zhou, X., and Feingold, G.: Diurnal evolution of non-precipitating marine stratocumuli in a large-eddy simulation ensemble, Atmos. Chem. Phys., 24, 12661–12685, https://doi.org/10.5194/acp-24-12661-2024, 2024. a
Chun, J.-Y.: Impact on the Stratocumulus-to-cumulus Transition of the Interaction of Cloud Microphysics and Macrophysics with Large-scale Circulation, Zenodo [data set], https://doi.org/10.5281/zenodo.15093143, 2025. a
Chun, J.-Y., Wood, R., Blossey, P., and Doherty, S. J.: Microphysical, macrophysical, and radiative responses of subtropical marine clouds to aerosol injections, Atmos. Chem. Phys., 23, 1345–1368, https://doi.org/10.5194/acp-23-1345-2023, 2023. a, b
Clarke, A. D., Owens, S. R., and Zhou, J.: An ultrafine sea-salt flux from breaking waves: Implications for cloud condensation nuclei in the remote marine atmosphere, J. Geophys. Res.-Atmos., 111, D06202, https://doi.org/10.1029/2005JD006565, 2006. a
Dagan, G.: Sub-Tropical Aerosols Enhance Tropical Cloudiness-Remote Aerosol-Cloud Lifetime Effect, J. Adv. Model. Earth Sy., 14, e2022MS003368, https://doi.org/10.1029/2022MS003368, 2022. a, b, c, d
Dagan, G., Stier, P., Spill, G., Herbert, R., Heikenfeld, M., van den Heever, S. C., and Marinescu, P. J.: Boundary conditions representation can determine simulated aerosol effects on convective cloud fields, Communications Earth & Environment, 3, 71, https://doi.org/10.1038/s43247-022-00399-5, 2022. a, b, c
Daleu, C. L., Woolnough, S. J., and Plant, R.: Cloud-resolving model simulations with one-and two-way couplings via the weak temperature gradient approximation, J. Atmos. Sci., 69, 3683–3699, 2012. a
Diamond, M. S., Saide, P. E., Zuidema, P., Ackerman, A. S., Doherty, S. J., Fridlind, A. M., Gordon, H., Howes, C., Kazil, J., Yamaguchi, T., Zhang, J., Feingold, G., and Wood, R.: Cloud adjustments from large-scale smoke–circulation interactions strongly modulate the southeastern Atlantic stratocumulus-to-cumulus transition, Atmos. Chem. Phys., 22, 12113–12151, https://doi.org/10.5194/acp-22-12113-2022, 2022. a, b
Eastman, R., Wood, R., and Bretherton, C. S.: Time scales of clouds and cloud-controlling variables in subtropical stratocumulus from a Lagrangian perspective, J. Atmos. Sci., 73, 3079–3091, https://doi.org/10.1175/JAS-D-16-0050.1, 2016. a
Erfani, E., Blossey, P., Wood, R., Mohrmann, J., Doherty, S. J., Wyant, M., and O, K.-T.: Simulating Aerosol Lifecycle Impacts on the Subtropical Stratocumulus-to-Cumulus Transition Using Large-Eddy Simulations, J. Geophys. Res.-Atmos., 127, e2022JD037258, https://doi.org/10.1029/2022JD037258, 2022. a
Glassmeier, F., Hoffmann, F., Johnson, J. S., Yamaguchi, T., Carslaw, K. S., and Feingold, G.: Aerosol-cloud-climate cooling overestimated by ship-track data, Science, 371, 485–489, https://doi.org/10.1126/science.abd3980, 2021. a, b
Gryspeerdt, E., Goren, T., Sourdeval, O., Quaas, J., Mülmenstädt, J., Dipu, S., Unglaub, C., Gettelman, A., and Christensen, M.: Constraining the aerosol influence on cloud liquid water path, Atmos. Chem. Phys., 19, 5331–5347, https://doi.org/10.5194/acp-19-5331-2019, 2019. a
Hernandez-Jaramillo, D. C., Medcraft, C., Braga, R. C., Butcherine, P., Doss, A., Kelaher, B., Rosenfeld, D., and Harrison, D. P.: New airborne research facility observes sensitivity of cumulus cloud microphysical properties to aerosol regime over the great barrier reef, Environ. Sci.-Atmos., 4, 861–871, https://doi.org/10.1039/D4EA00009A, 2024. a
Jenkins, A. K. L., Forster, P. M., and Jackson, L. S.: The effects of timing and rate of marine cloud brightening aerosol injection on albedo changes during the diurnal cycle of marine stratocumulus clouds, Atmos. Chem. Phys., 13, 1659–1673, https://doi.org/10.5194/acp-13-1659-2013, 2013. a, b
Khairoutdinov, M. and Kogan, Y.: A new cloud physics parameterization in a large-eddy simulation model of marine stratocumulus, Mon. Weather Rev., 128, 229–243, https://doi.org/10.1175/1520-0493(2000)128<0229:ANCPPI>2.0.CO;2, 2000. a
Khairoutdinov, M. F. and Randall, D. A.: Cloud Resolving Modeling of the ARM Summer 1997 IOP: Model Formulation, Results, Uncertainties, and Sensitivities, J. Atmos. Sci., 60, 607–625, https://doi.org/10.1175/1520-0469(2003)060<0607:CRMOTA>2.0.CO;2, 2003 (code available at: http://rossby.msrc.sunysb.edu/SAM.html, last access: 13 April 2025). a, b
Krueger, S. K., McLean, G. T., and Fu, Q.: Numerical Simulation of the Stratus-to-Cumulus Transition in the Subtropical Marine Boundary Layer. Part I: Boundary-Layer Structure, J. Atmos. Sci., 52, 2839–2850, https://doi.org/10.1175/1520-0469(1995)052<2839:NSOTST>2.0.CO;2, 1995. a
Latham, J.: Control of global warming?, Nature, 347, 339–340, https://doi.org/10.1038/347339b0, 1990. a
Manshausen, P., Watson-Parris, D., Christensen, M. W., Jalkanen, J.-P., and Stier, P.: Rapid saturation of cloud water adjustments to shipping emissions, Atmos. Chem. Phys., 23, 12545–12555, https://doi.org/10.5194/acp-23-12545-2023, 2023. a
Mlawer, E. J., Taubman, S. J., Brown, P. D., Iacono, M. J., and Clough, S. A.: Radiative transfer for inhomogeneous atmospheres: RRTM, a validated correlated-k model for the longwave, J. Geophys. Res.-Atmos., 102, 16663–16682, https://doi.org/10.1029/97JD00237, 1997. a
Mohrmann, J., Wood, R., McGibbon, J., Eastman, R., and Luke, E.: Drivers of Seasonal Variability in Marine Boundary Layer Aerosol Number Concentration Investigated Using a Steady State Approach, J. Geophys. Res.-Atmos., 123, 1097–1112, https://doi.org/10.1002/2017JD027443, 2018. a
Morrison, H. and Grabowski, W. W.: Modeling supersaturation and subgrid-scale mixing with two-moment bulk warm microphysics, J. Atmos. Sci., 65, 792–812, https://doi.org/10.1175/2007JAS2374.1, 2008. a
Myers, T. A. and Norris, J. R.: Observational Evidence That Enhanced Subsidence Reduces Subtropical Marine Boundary Layer Cloudiness, J. Climate, 26, 7507–7524, https://doi.org/10.1175/JCLI-D-12-00736.1, 2013. a
Norris, J. R.: Low Cloud Type over the Ocean from Surface Observations. Part I: Relationship to Surface Meteorology and the Vertical Distribution of Temperature and Moisture, J. Climate, 11, 369–382, https://doi.org/10.1175/1520-0442(1998)011<0369:LCTOTO>2.0.CO;2, 1998. a
Prabhakaran, P., Hoffmann, F., and Feingold, G.: Effects of intermittent aerosol forcing on the stratocumulus-to-cumulus transition, Atmos. Chem. Phys., 24, 1919–1937, https://doi.org/10.5194/acp-24-1919-2024, 2024. a
Rosenfeld, D., Zhu, Y., Wang, M., Zheng, Y., Goren, T., and Yu, S.: Aerosol-driven droplet concentrations dominate coverage and water of oceanic low-level clouds, Science, 363, eaav0566, https://doi.org/10.1126/science.aav0566, 2019. a
Sandu, I. and Stevens, B.: On the factors modulating the stratocumulus to cumulus transitions, J. Atmos. Sci., 68, 1865–1881, https://doi.org/10.1175/2011JAS3614.1, 2011. a, b, c, d, e, f
Sandu, I., Stevens, B., and Pincus, R.: On the transitions in marine boundary layer cloudiness, Atmos. Chem. Phys., 10, 2377–2391, https://doi.org/10.5194/acp-10-2377-2010, 2010. a, b, c
Schubert, W. H., Wakefield, J. S., Steiner, E. J., and Cox, S. K.: Marine Stratocumulus Convection. part II: Horizontally Inhomogeneous Solutions, J. Atmos. Sci., 36, 1308–1324, https://doi.org/10.1175/1520-0469(1979)036<1308:MSCPIH>2.0.CO;2, 1979. a
Seifert, A., Heus, T., Pincus, R., and Stevens, B.: Large-eddy simulation of the transient and near-equilibrium behavior of precipitating shallow convection, J. Adv. Model. Earth Sy., 7, 1918–1937, https://doi.org/10.1002/2015MS000489, 2015. a, b
Sobel, A. H. and Bretherton, C. S.: Modeling Tropical Precipitation in a Single Column, J. Climate, 13, 4378–4392, https://doi.org/10.1175/1520-0442(2000)013<4378:MTPIAS>2.0.CO;2, 2000. a, b
Stevens, B. and Feingold, G.: Untangling aerosol effects on clouds and precipitation in a buffered system, Nature, 461, 607–613, https://doi.org/10.1038/nature08281, 2009. a, b, c, d
Twomey, S.: Pollution and the planetary albedo, Atmos. Environ. (1967), 8, 1251–1256, https://doi.org/10.1016/0004-6981(74)90004-3, 1974. a
Twomey, S.: The influence of pollution on the shortwave albedo of clouds, J. Atmos. Sci., 34, 1149–1152, https://doi.org/10.1175/1520-0469(1977)034<1149:TIOPOT>2.0.CO;2, 1977. a
van der Dussen, J. J., de Roode, S. R., and Siebesma, A. P.: How large-scale subsidence affects stratocumulus transitions, Atmos. Chem. Phys., 16, 691–701, https://doi.org/10.5194/acp-16-691-2016, 2016. a, b
Wang, H., Rasch, P. J., and Feingold, G.: Manipulating marine stratocumulus cloud amount and albedo: a process-modelling study of aerosol-cloud-precipitation interactions in response to injection of cloud condensation nuclei, Atmos. Chem. Phys., 11, 4237–4249, https://doi.org/10.5194/acp-11-4237-2011, 2011. a
Wood, R.: Rate of loss of cloud droplets by coalescence in warm clouds, J. Geophys. Res.-Atmos., 111, D21205, https://doi.org/10.1029/2006JD007553, 2006. a
Wood, R.: Cancellation of Aerosol Indirect Effects in Marine Stratocumulus through Cloud Thinning, J. Atmos. Sci., 64, 2657–2669, https://doi.org/10.1175/JAS3942.1, 2007. a
Wood, R.: Stratocumulus clouds, Mon. Weather Rev., 140, 2373–2423, https://doi.org/10.1175/MWR-D-11-00121.1, 2012. a
Wood, R.: Assessing the potential efficacy of marine cloud brightening for cooling Earth using a simple heuristic model, Atmos. Chem. Phys., 21, 14507–14533, https://doi.org/10.5194/acp-21-14507-2021, 2021. a, b, c
Wood, R. and Bretherton, C.: On the Relationship between Stratiform Low Cloud Cover and Lower-Tropospheric Stability, J. Climate, 19, 6425–6432, https://doi.org/10.1175/jcli3988.1, 2006. a, b
Wood, R., Bretherton, C. S., Leon, D., Clarke, A. D., Zuidema, P., Allen, G., and Coe, H.: An aircraft case study of the spatial transition from closed to open mesoscale cellular convection over the Southeast Pacific, Atmos. Chem. Phys., 11, 2341–2370, https://doi.org/10.5194/acp-11-2341-2011, 2011. a
Wyant, M. C., Bretherton, C. S., Rand, H. A., and Stevens, D. E.: Numerical Simulations and a Conceptual Model of the Stratocumulus to Trade Cumulus Transition, J. Atmos. Sci., 54, 168–192, https://doi.org/10.1175/1520-0469(1997)054<0168:NSAACM>2.0.CO;2, 1997. a
Xue, H., Feingold, G., and Stevens, B.: Aerosol Effects on Clouds, Precipitation, and the Organization of Shallow Cumulus Convection, J. Atmos. Sci., 65, 392–406, https://doi.org/10.1175/2007JAS2428.1, 2008. a
Yamaguchi, T., Feingold, G., and Kazil, J.: Stratocumulus to Cumulus Transition by Drizzle, J. Adv. Model. Earth Sy., 9, 2333–2349, https://doi.org/10.1002/2017MS001104, 2017. a, b, c
Yuan, T., Song, H., Wood, R., Oreopoulos, L., Platnick, S., Wang, C., Yu, H., Meyer, K., and Wilcox, E.: Observational evidence of strong forcing from aerosol effect on low cloud coverage, Science Advances, 9, eadh7716, https://doi.org/10.1126/sciadv.adh7716, 2023. a
Zelinka, M. D., Randall, D. A., Webb, M. J., and Klein, S. A.: Clearing clouds of uncertainty, Nat. Clim. Change, 7, 674–678, https://doi.org/10.1038/nclimate3402, 2017. a
Zhou, X., Ackerman, A. S., Fridlind, A. M., Wood, R., and Kollias, P.: Impacts of solar-absorbing aerosol layers on the transition of stratocumulus to trade cumulus clouds, Atmos. Chem. Phys., 17, 12725–12742, https://doi.org/10.5194/acp-17-12725-2017, 2017. a
- Abstract
- Introduction
- Methods
- Results
- Discussion
- Summary
- Appendix A: Adjustment in large-scale subsidence by the weak temperature gradient
- Appendix B: Cloud radiative heating rate and MBL collapse as a response to a decrease in cloud thickness
- Appendix C: Sensitivity to aerosol conditions
- Code and data availability
- Author contributions
- Competing interests
- Disclaimer
- Acknowledgements
- Financial support
- Review statement
- References