the Creative Commons Attribution 4.0 License.
the Creative Commons Attribution 4.0 License.
 | 09 May 2025
Impact of wildfire smoke on Arctic cirrus formation – Part 2: Simulation of MOSAiC 2019–2020 cases
Cristofer Jimenez
Daniel A. Knopf
Johanna Roschke
Johannes Bühl
Kevin Ohneiser
Ronny Engelmann
A simulation study of the potential impact of wildfire smoke on Arctic cirrus formation is presented. The simulations complement the MOSAiC (Multidisciplinary drifting Observatory for the Study of Arctic Climate) field observations, discussed in Part 1 (Ansmann et al., 2025) of this work. The observations suggest that Siberian wildfire smoke had a strong impact on Arctic cirrus formation in the winter of 2019–2020. Via simulations, a detailed insight into the potential of wildfire smoke to influence Arctic cirrus formation as a function of observed meteorological and environmental conditions (temperature, relative humidity, large-scale and gravity-wave-induced lofting conditions, and ice-nucleating particle (INP) concentration) is provided. Lidar-derived values of the INP concentration serve as input, and ice crystal number concentration (ICNC) values retrieved from combined lidar–radar observations are used for comparison with the simulation results. The simulations show that the observed smoke pollution levels in the upper troposphere were high enough to trigger strong ice nucleation. The simulations also corroborate the hypothesis stated in Part 1 (Ansmann et al., 2025): the persistent smoke layer, continuously observed over the central Arctic during the winter half year 2019–2020, was able to widely suppress homogeneous freezing so that the smoke aerosol most probably controlled cirrus formation and properties. The observations suggest that the INP reservoir was continuously refilled from the lower stratosphere. Furthermore, the simulations confirm that the observed high ice saturation ratios of 1.3–1.5 over the North Pole region at cirrus tops (with top temperatures of −60 to −75 °C) point to inefficient INPs, as expected when wildfire smoke particles (organic particles) serve as INPs. Finally, the simulations revealed that ice nucleation in widespread and frequently occurring shallow updrafts (with low amplitudes) seems to be responsible for the observed low ICNC values of typically 1–50 crystals L−1 in the Arctic cirrus virga.
- Article
(8794 KB) - Full-text XML
- Companion paper
- BibTeX
- EndNote


The MOSAiC (Multidisciplinary drifting Observatory for the Study of Arctic Climate) expedition (Shupe et al., 2022) offered the unique opportunity to investigate the potential impact of wildfire smoke on cirrus formation. During the 1-year MOSAiC field campaign, from October 2019 to September 2020, aged Siberian wildfire smoke in the upper troposphere–lower stratosphere (UTLS) covered the central Arctic during the first 7.5 months (October 2019 to mid-May 2020) (Ohneiser et al., 2021a; Ansmann et al., 2024). Ice clouds frequently developed in the smoke-polluted upper-tropospheric air masses.
In Part 1 (Ansmann et al., 2025), we presented our MOSAiC observations of smoke and cirrus properties during the 2019–2020 winter half year. Lidar and radar measurements were performed aboard the research ice breaker Polarstern, which drifted with the pack ice in the North Pole region. The MOSAiC observations provided strong indications that the permanently observed upper-tropospheric wildfire smoke layer (consisting of organic aerosol particles) controlled cirrus formation during the entire winter half year and widely suppressed the homogeneous freezing of background aerosol particles. Furthermore, high ice saturation ratios of 1.3–1.5, often found in the radiosonde data in the upper part of the extended cirrus fields, point to heterogeneous ice nucleation on inefficient ice-nucleating particles (INPs), as expected when organic particles serve as INPs (Kanji et al., 2008; Wang and Knopf, 2011; Knopf et al., 2018).
The simulations in this paper (Part 2) complement the MOSAiC field observations in Part 1 (Ansmann et al., 2025). Models enable us to better understand the complex processes of ice nucleation, ice growth, and sedimentation under given temperature, humidity, and large-scale and gravity-wave-related lofting conditions. The most important questions to be answered in this paper are as follows:
-
Can the ice crystal number concentrations (ICNCs) observed in Arctic cirrus clouds (see Part 1; Ansmann et al., 2025) be reproduced by simulations of heterogeneous ice nucleation on organic particles by using the measured smoke pollution levels as input in the simulations?
-
Can heterogeneous ice nucleation on organic particles suppress the homogeneous freezing of background aerosol particles and, thus, dominate cirrus formation processes?
The main goal of the simulations presented in this article is to introduce wildfire smoke as a new INP type in the cirrus research field and to demonstrate that INP parameterizations, applicable to glassy organic aerosol particles, allow a realistic consideration of forest fire smoke in cirrus ice nucleation processes. We concentrate on a few key simulation scenarios in this initial phase of model-based smoke–cirrus interaction studies. In this context, we also explain why the observed ICNC values in the Arctic cirrus clouds were small, as observed during the MOSAiC field campaign (Ansmann et al., 2025).
The paper is organized as follows: in Sect. 2, the simulation model is explained. In Sect 3, we summarize key observational findings, presented in Part 1 (Ansmann et al., 2025). The measured virga ICNCs served as a guide in the development of our simulation strategy and were used as orientation in the design of most realistic simulation scenarios. In Sect. 4, we present and discuss the simulation results and provide answers to the two questions stated above. A summary of the main simulation results and the conclusions on smoke–cirrus interactions, based on both observations and simulations, are provided in Sect. 5.
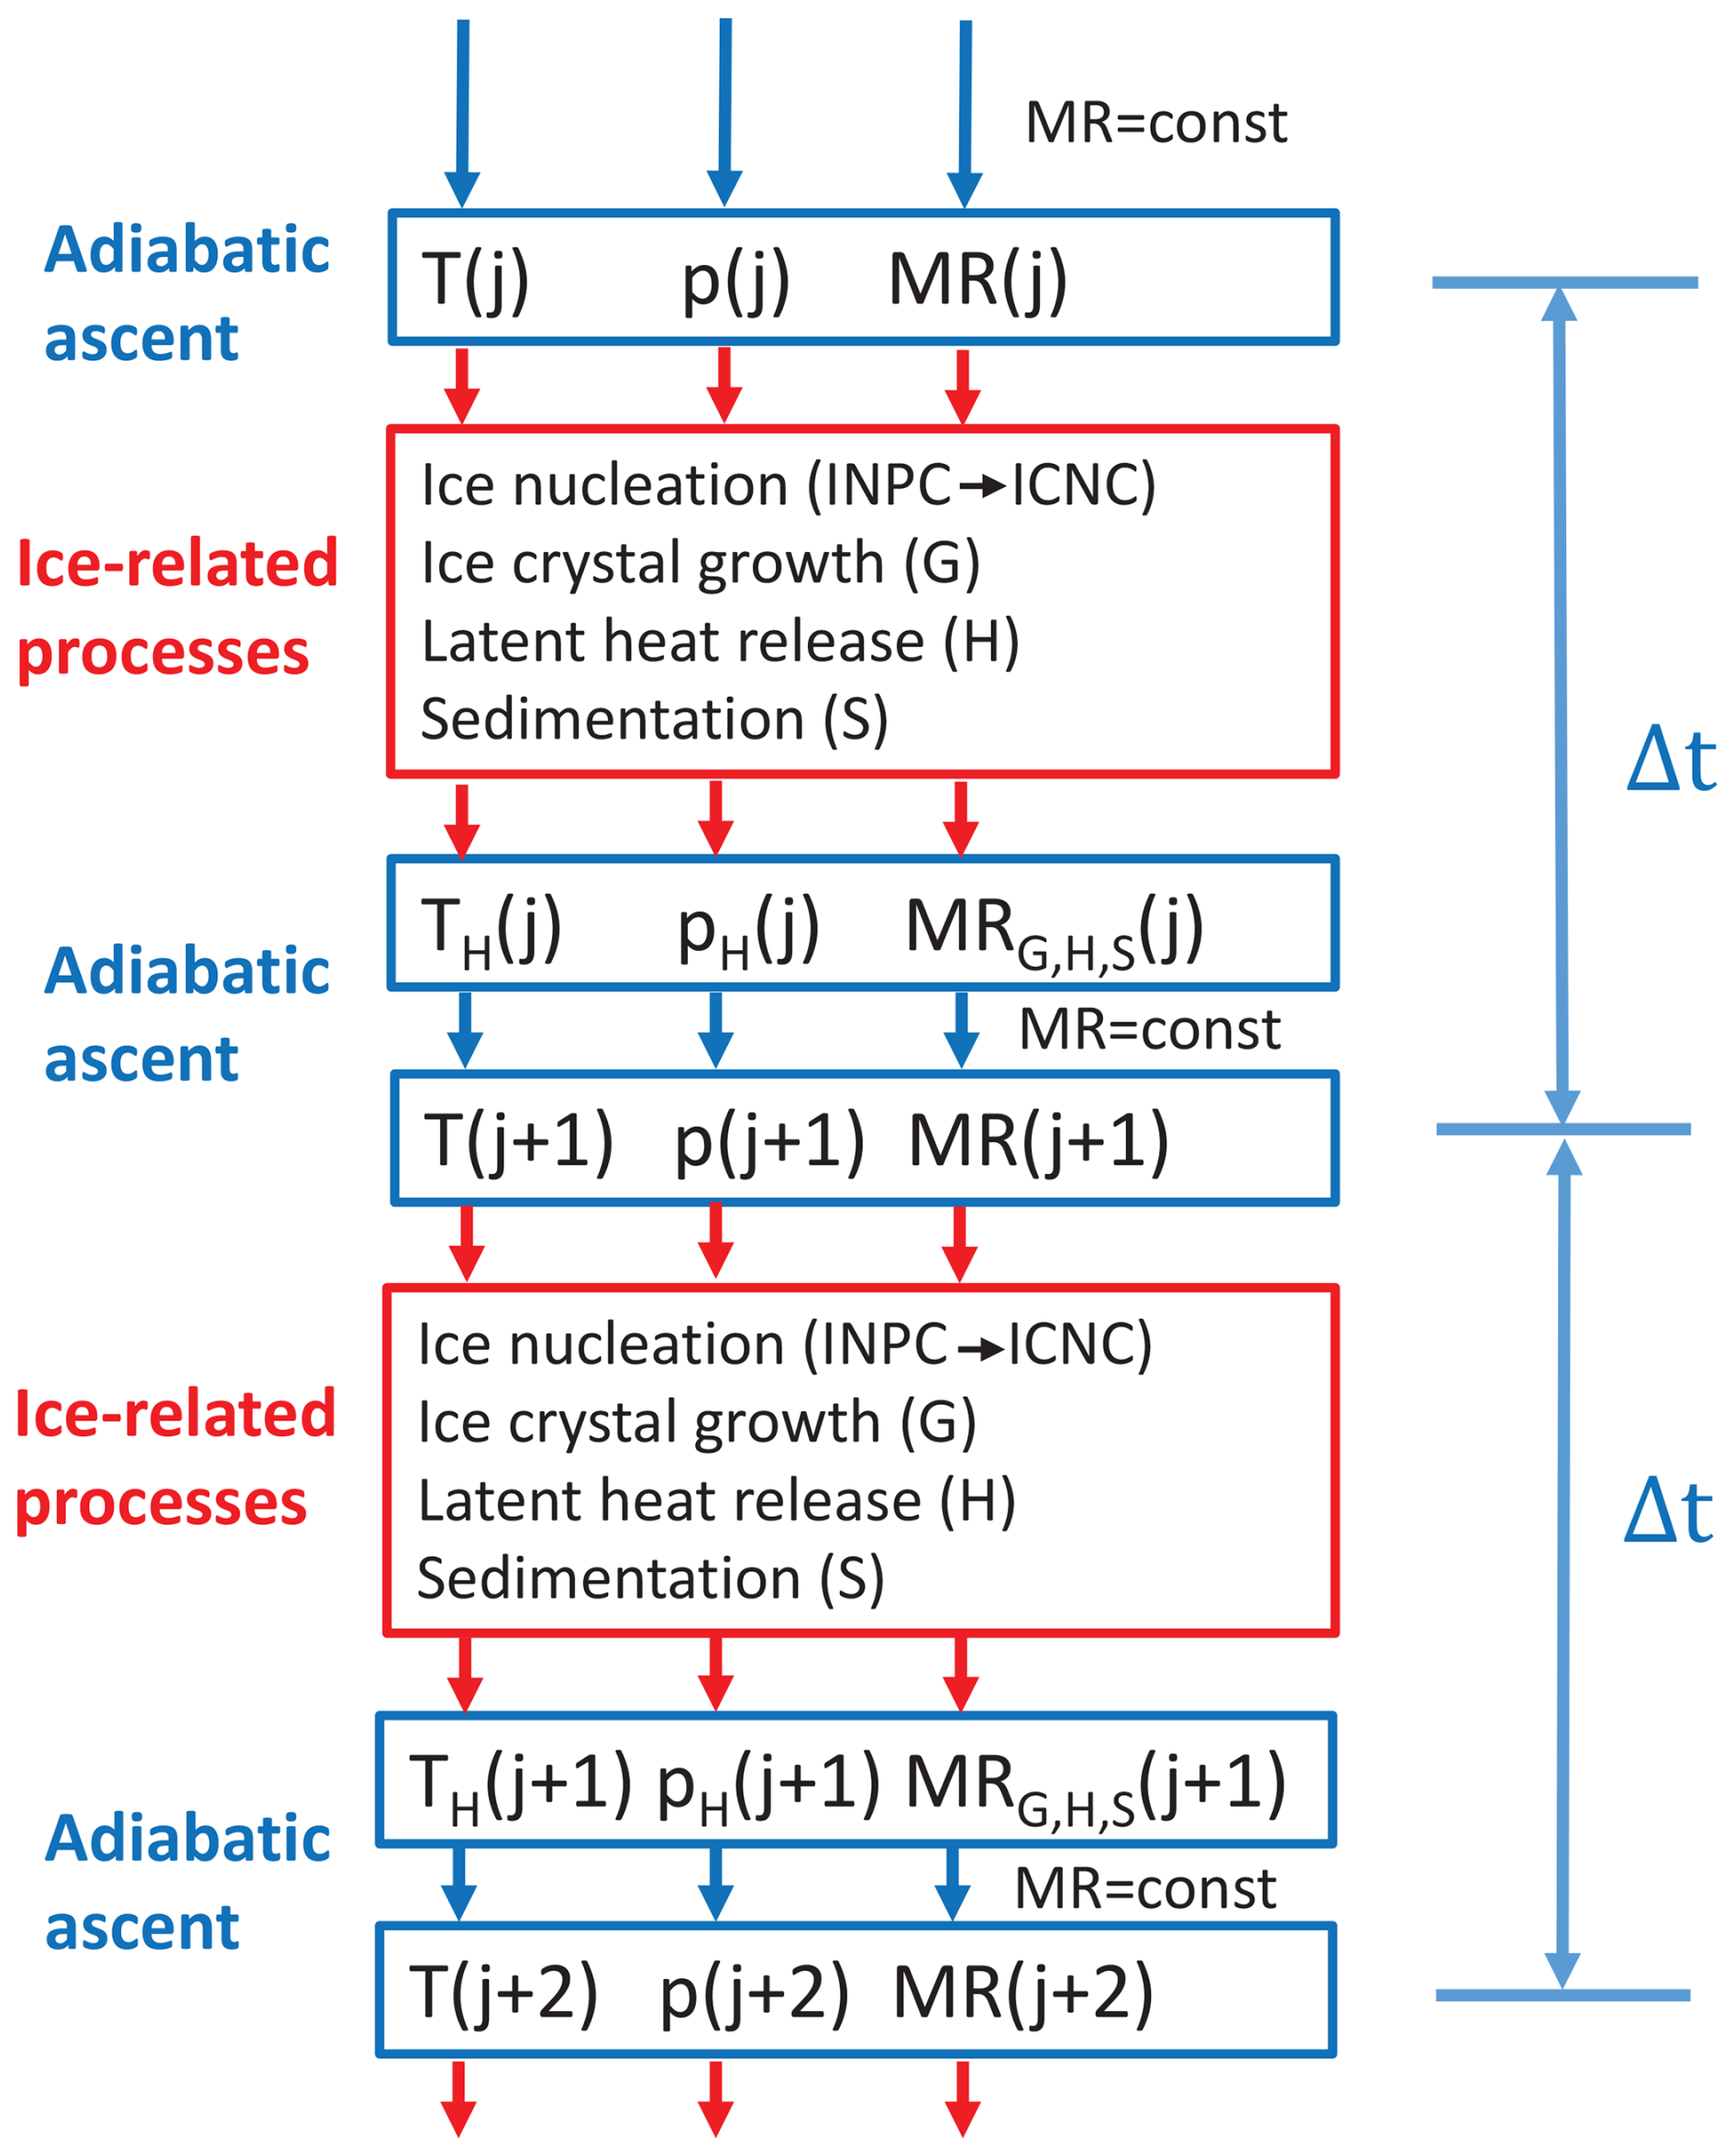
Figure 1Overview of the simulation steps. An adiabatically ascending, smoke-filled air parcel is simulated. Meteorological input parameters are the air temperature (T), air pressure (p), relative humidity (RH), and water vapor mixing ratio (MR) at the starting height (z0). The computation of the adiabatic rise of the air parcel is indicated by blue arrows and boxes. Red boxes contain the computation of ice-related processes, i.e., the nucleation of ice crystals, the growth of ice crystals, heat release, and the sedimentation of crystals. These processes influence the meteorological conditions. Indices G, H, and S indicate the impact of ice crystal growth, heat release, and sedimentation on the different meteorological parameters. The vertical (range) resolution is defined by the product of the selected vertical velocity and the temporal resolution Δt in the computation. Computations performed in steps j, j+1, and j+2 are considered in the sketch.
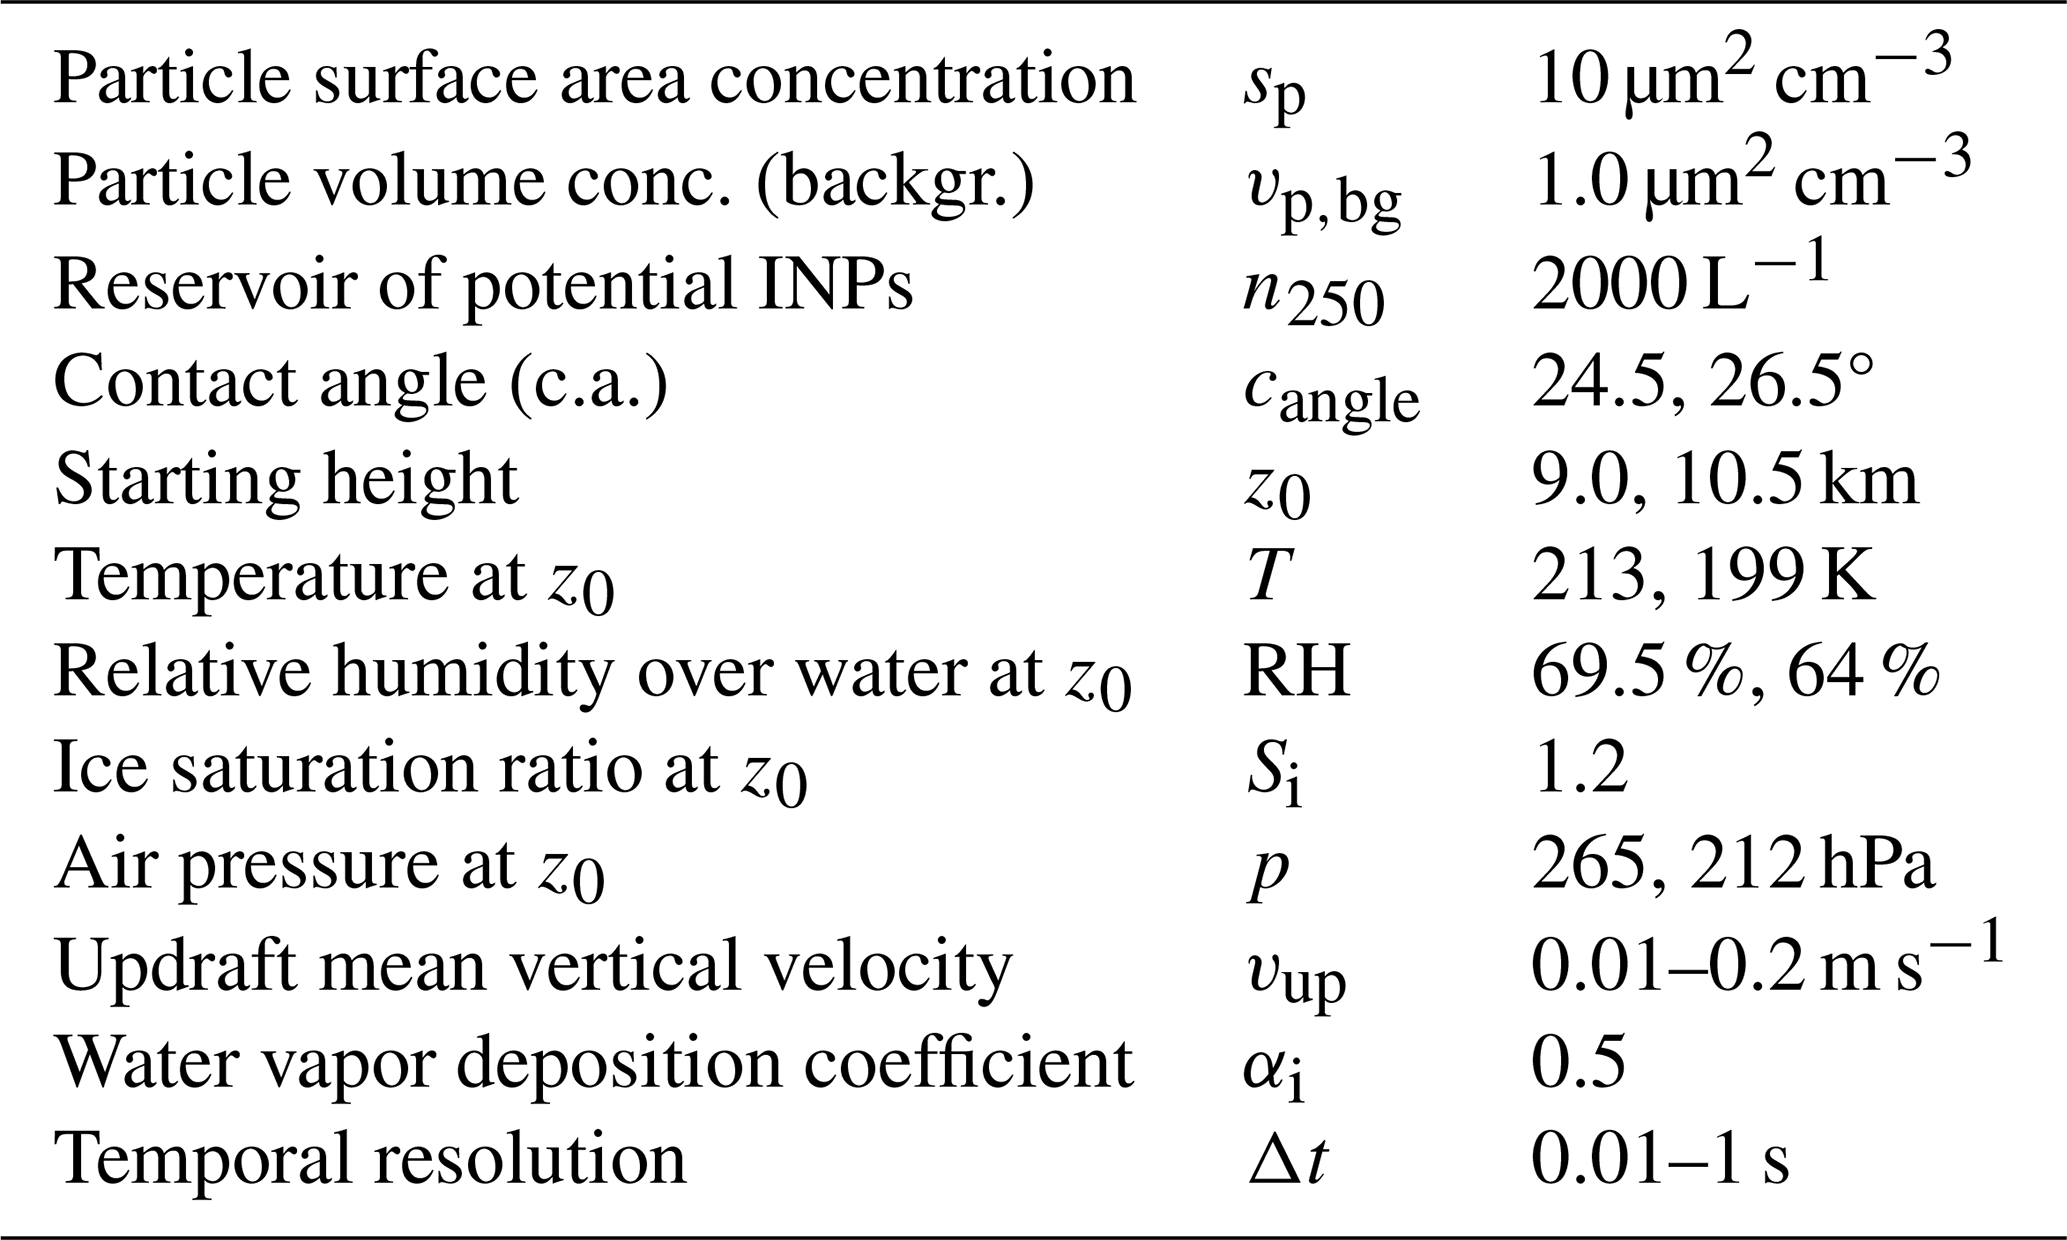
Table 1Meteorological and smoke aerosol input in the ice nucleation simulations. The volume concentration is given for sulfate background particles.
The model permits the simulation of ice nucleation and growth of ice crystals in an adiabatically ascending air parcel. This air parcel starts in the coldest region of a cirrus layer, i.e., at cloud top, where ice nucleation usually begins. The main steps of the simulations are shown in Fig. 1. All essential atmospheric and aerosol input parameters and values required in the simulations are given in Table 1. The meteorological input data (air pressure, p; temperature, T; relative humidity, RH, over water; and corresponding water vapor mixing ratio, MR, at height z0) were taken from the MOSAiC radiosonde database (Maturilli et al., 2022). Typical cirrus-top observations are considered. While the November and December ice clouds showed cloud-top temperatures of −60 to −65 °C and cloud-top heights of around 9 km, the January and February ice clouds had top temperatures of −70 to −75 °C and cirrus-top heights of typically above 10 km. We concentrate on the January cirrus scenarios in our simulation study. Examples of January cirrus observations are shown in Part 1 (Ansmann et al., 2025) and in Sect. 3 of this paper. The smoke aerosol input data (e.g., the particle surface area concentration, PSAC, denoted as sp in equations) were available from lidar observations before and after cirrus events (Ansmann et al., 2025).
The simulation of an ascending smoke-filled air parcel starts at height z0. Atmospheric input values at z0 are temperature, pressure, and relative humidity. The smoke PSAC input is set to a typical value of 10 µm2 cm−3 (required in heterogeneous ice nucleation calculations), while the background volume concentration is set to 1 µm3 cm−3 (required in homogeneous ice nucleation calculations). The air parcel is ascending adiabatically (blue arrows and boxes in Fig. 1) so that temperature T decreases at a rate of 0.00984 K m−1. The decrease in air pressure (p) is obtained by applying the barometric formula. The vertical ascent of an air parcel can be caused by large-scale lofting events (e.g., orographic or frontal lofting events) (Kärcher and Lohmann, 2002) or short-term lofting events, e.g., resulting from gravity wave activity (Haag and Kärcher, 2004; Spichtinger et al., 2005; Podglajen et al., 2016; Kärcher and Podglajen, 2019; Kärcher et al., 2019). Updraft speeds are typically in the range of 1–5 cm s−1 in the case of large-scale lofting events and 10–30 cm s−1 during gravity-wave-induced updraft events.
During the adiabatic rise, the water vapor mixing ratio (MR) in the air parcel remains constant so that the relative humidity and the respective ice saturation ratio (Si) increase. After the ice nucleation onset ice saturation ratio (Si,on) is exceeded, strong ice nucleation sets in. The nucleated ice particles start to grow via the deposition of water vapor on the crystal surfaces. Ice growth leads to a reduction in water vapor in the air parcel and, thus, a decrease in Si. The burst-like ice nucleation event stops when the ice saturation ratio again reaches the onset value and further decreases. The growing ice crystals form a broad size spectrum, and a broad spectrum of falling velocities consequently develops. A certain number of the larger crystals with comparably high sedimentation speed leave the air parcel (sedimentation effect) and no longer contribute to the reduction in water vapor within the air parcel via ice growth processes. The processes of ice formation, growth, heat release related to ice production, and sedimentation are highlighted in the red boxes in Fig. 1. Each simulation step (j, j+1, …) includes the computation of the adiabatic ascent of the air parcel within the time interval Δt; the computation of the ice-related processes; and the computation of their impact on the meteorological parameters of temperature, pressure, and the water vapor mixing ratio. The vertical (range) resolution in the computations is defined by the product of the selected vertical velocity and the temporal resolution Δt. Temporal resolutions down to 0.01 s can be selected in the computations.
Besides the heterogeneous nucleation of ice crystals on the smoke INPs (organic particles), homogeneous freezing of the omnipresent liquid sulfate particles is simulated. The main simulation results are time series of the number concentrations of heterogeneously and homogeneously nucleated ice crystals (ni,het and ni,hom, respectively) and the total numbers of heterogeneously and homogeneously nucleated ice crystals ( and , respectively) nucleated during a simulated updraft event. We widely follow the modeling concept as given in recent work by Kärcher et al. (2022, 2023) and Spichtinger et al. (2023). These papers provide a good introduction into state-of-the-art cirrus modeling.
In the following subsections, we describe the different parts of the simulation model: the ice nucleation parameterizations are given Sect. 2.1, the computation of ice crystal growth via the deposition of water vapor on the crystals is described in Sect. 2.2, and a simple approach to roughly consider sedimentation of ice crystals is outlined in Sect. 2.3.
2.1 Ice crystal nucleation
An accurate analysis of the INP budget requires a prognostic treatment of INPs (Knopf et al., 2023a). Diagnostic and prognostic approaches to ice nucleation parameterization are available, including time-independent (singular) number and surface-area-based descriptions and a time-dependent description following classical nucleation theory (CNT). The choice of the ice nucleation parameterization defines the size of the INP reservoir. Following the singular hypothesis, only a small fraction of the particles (smoke particles in our case) can serve as INPs that are activatable. Following the CNT scheme, by contrast, all smoke particles can be activated on a random base. The introduction of an INP reservoir is the most realistic approach, especially in view of the large number of available INPs over the North Pole region during the winter of 2019–2020.
In our specific approach, the INP concentration (INPC) and ICNC are treated in a prognostic fashion. The transfer from the INPC to ICNC is the first process listed in the red boxes in Fig. 1. This means that we account for sources and sinks of INPs and ice crystals, as discussed in detail by Knopf et al. (2023a). The smoke particles are considered to be the source of INPs. Once the INPs activate and form ice crystals, these INPs are removed from the INP reservoir (sink of INPs). The activated INPs are the source of ice crystals. To account for the time dependence of ice nucleation and ice crystal growth and removal processes, taking place simultaneously, we chose an ice nucleation parameterization based on CNT (Knopf and Alpert, 2023). In CNT, the heterogeneous ice nucleation rate coefficient, Jhet (in units of cm−2 s−1), describes the number of ice nucleation events per unit surface area and time. Multiplication by the particle surface area yields an ice nucleation rate (in units of s−1), ultimately determining the number of ice nucleation events, i.e., the ice crystal number concentration per modeling time step. Another feature of our model is that we assume that the INP reservoir consists of all available smoke particles with a radius >250 nm. This means that all smoke particles in the large-particle fraction (n250) are potentially activable INPs in an air parcel. Here, we follow the argumentation given in Knopf et al. (2023a). Because of the specific smoke conditions during the MOSAiC winter half year (comprising a practically unlimited downward flux of smoke particles from the stratosphere), we could even set the INP reservoir to “unlimited”.
We selected temporal resolutions from 0.1 to 1 s in the simulations for updraft scenarios with vertical velocities from 20 to 1 cm s−1. We found that a temporal resolution Δt of 1, 0.5, and 0.1 s is sufficient to adequately resolve the burst-like ice nucleation events in air parcels ascending with a vertical velocity of 1, 3, and 20 cm s−1, respectively.
Regarding heterogeneous nucleation of ice crystals on organic aerosol particles at cirrus temperatures, we apply the deposition ice nucleation (DIN) parameterization (Wang and Knopf, 2011). The method is also outlined in Ansmann et al. (2021) for lidar applications. The predicted ice crystal nucleation rate jhet is given by the following:
where sp is the smoke particle surface area concentration (in cm−2 cm−3), also denoted as PSAC, and Jhet is the nucleation rate coefficient, which is a function of the contact angle (cangle), ice nucleation temperature (T), and ice saturation ratio (Si; i.e., the ratio of the partial pressure of water vapor, pw, and saturation vapor pressure with respect to ice, pi,sat). The retrieval of sp from lidar backscatter observations is described in Ansmann et al. (2021, 2023). The contact angles for organic aerosol are in the range of 22–30° (Wang and Knopf, 2011). With increasing ice nucleation efficiency, the contact angle decreases. For mineral dust, the contact angle is in the range of 10–15° (Wang and Knopf, 2011). In the model, the contact angle increases with temperature. The respective ice nucleation onset value (Si,on) is about 1.25–1.3 for a contact angle of 23.5° at 220 K and 1.45–1.5 for a contact angle of 26.5° at 200 K (Wang and Knopf, 2011; Wang et al., 2012). Regarding the organic material, leonardite (a standard humic-acid surrogate material) is assumed to represent the amorphous organic coating of smoke particles. Leonardite, an oxidation product of lignite, is a humic-acid-containing soft, waxy particle (mineraloid) that is black or brown in color and soluble in alkaline solutions. The INP characteristics of leonardite have been studied in detail in laboratory experiments (Kanji et al., 2008; Wang and Knopf, 2011; Knopf and Alpert, 2013; Rigg et al., 2013).
The number concentration of ice crystals (ni,het, or ICNC, in cm−3), nucleated in the computational time step Δt (in s), is given by the following:
Equation (2) assumes that all wildfire smoke particles are potential INPs and, thus, contribute to the INP reservoir (Knopf et al., 2023a). According to the discussion in Sect. 3.2 in Ansmann et al. (2025), the observed MOSAiC particle surface area concentration (sp, or PSAC) was of the order of 10 µm2 cm−3. In our simulations, we restricted the INP reservoir to the particle number concentration n250 (considering particles with a radius > 250 nm), assuming that the large-particle fraction contains the most favorable INPs (DeMott et al., 2010). The n250 is about 2000 L−1 for sp values of 10 µm2 cm−3. More details on the INP reservoir are given in Sect. 2.1.1. As mentioned above, once an INP is activated to form an ice crystal, this INP (and the respective contribution to the PSAC) is removed from the INP reservoir in the simulation.
We also simulate ice nucleation via homogeneous freezing (Koop et al., 2000; Knopf and Rigg, 2011; Schneider et al., 2021). The predicted ice crystal nucleation rate jhom is given by the following:
where vp,bg is the volume concentration for sulfate background aerosol (in cm−3 cm−3) and Jhom is the ice nucleation rate coefficient (in cm−3 s−1), with the latter being a function of temperature (T) and the ice saturation ratio (Si) (Koop et al., 2000). Here, we assume sulfate particles with a radius of 50–100 nm. For computational details in the case of lidar application, the reader is referred to Ansmann et al. (2021). The onset ice saturation ratio (Si,on) is 1.5–1.6 in the case of homogeneous freezing. All available liquid background aerosol particles can be regarded as INPs (Heymsfield et al., 2017). According to the airborne in situ observations of Schröder et al. (2002), conducted during the Lindenberg Aerosol Characterization Experiment 1998 (Ansmann et al., 2002), the number concentration of background sulfate particles is of the order of 250 cm−3 or 250 000 L−1 in the upper troposphere, while the respective volume concentration (vp,bg) required in Eq. (4) is about 1.0 µm3 cm−3.
The number concentration of homogeneously nucleated ice crystals (ni,hom, in cm−3) is calculated as follows:
An updated approach to compute ni,hom can be found in Koop and Zobrist (2009). According to previous studies (Knopf and Rigg, 2011; Riechers et al., 2013), Jhom in Eq. (3) is probably 1–2 orders of magnitude too large. However, our simulations show that this overestimation has only a minor impact on ni,hom. In the case of Arctic cirrus with ice nucleation temperatures of around 200 K, the overestimation is of the order of 5 %.
The concentration of ice crystals, nucleated in the simulated time interval Δt, is finally given by the following sum:
2.1.1 INP reservoir
The INP reservoir considers smoke particles with a radius > 250 nm in our simulations. The respective smoke particle number concentration n250 is estimated from lidar observations of the 532 nm particle extinction coefficient (σ532) in the upper troposphere at cloud-free conditions (Ohneiser et al., 2021a; Ansmann et al., 2023, 2025). Note that we use σ532 for the smoke aerosol extinction coefficient here (in Part 2) and E for the ice crystal extinction coefficient in Part 1 (Ansmann et al., 2025).
According to the study of Ansmann et al. (2021), which deals with the conversion of lidar-derived smoke extinction coefficients (in Mm−1) into microphysical properties of smoke particles, the surface area concentration sp (in µm2 cm−3) and the large-particle fraction n250 (in cm−3) are given by the following respective expressions:
and
Here, cs is the extinction-to-surface-area conversion factor (in Mm µm2 cm−3) and c250 is the extinction-to-particle-number conversion factor (in Mm cm−3). The values of cs and c250 for aged wildfire smoke can be found in Ansmann et al. (2021). The link between sp and n250 is simply given by the following expression:
Equation (8) is used in the model simulation to handle the INP reservoir (n250); the decrease in n250 resulting from the nucleation of new ice crystals (ni,het); and the respective decrease in the surface area concentration sp, used in the computation of ni,het with Eq. (2). For aged wildfire smoke, the ratio is 5 µm2 (Ansmann et al., 2021). The factor can be interpreted as the average particle surface area of all particles in the large-particle fraction (defined by n250).
2.2 Ice crystal growth
The nucleated ice crystals grow via the deposition of water vapor on the crystals. This process reduces the water vapor content in the air parcel and, thus, the ice saturation ratio Si. If Si decreases below the ice nucleation threshold or onset level Si,on or RHi,on, ice nucleation will stop. The ice particle mass growth rate (for one crystal) is given by Lohmann et al. (2016):
When assuming compact spherical ice crystals with a radius ri shortly after nucleation, instead of hexagonal plates or columns, the ice particle capacitance Ci (Westbrook et al., 2008) can be replaced by ri. According to Skrotzki et al. (2013), this important simplification is justified. When expressing by (Lohmann et al., 2016), we can compute the increase in the ice particle radius (in m) within the simulation time step Δt as follows:
where ρi is the bulk ice mass density (assumed to be 925 kg m−3). Equation (10) is used in the computation of the mass growth term (Eq. 18).
The term FG is related to the mass transfer of water molecules to the surface of the crystals (Skrotzki et al., 2013):
where Rw=461.5 J kg−1 K−1 is the specific gas constant of water vapor and pi,sat is the ice saturation pressure (in Pa). Mass transfer of water molecules to the surface of the ice crystals is considered via the so-called modified version of water vapor diffusivity (Skrotzki et al., 2013). is given by the following:
with the water vapor diffusivity
Here, T and p are air temperature and pressure, respectively, and T0=273 K and p0=1013 hPa. Δw in Eq. (12) is the so-called water vapor jump length, which is often chosen to be of the order of the mean free path λw (in m) of the water vapor molecules in air; thus, we use λw≈Δw (Skrotzki et al., 2013). The mean free path λw is given by the following:
where kB is the Boltzmann constant; σw and σa represent the collision diameter of a water vapor molecule (about 0.27 nm) and of an air molecule (about 0.37 nm), respectively; and Mw,mol and Ma,mol denote the molar mass of water and of air, respectively. In short, , with temperature in Kelvin and pressure in Pascal. The thermal velocity (in m s−1) in Eq. (12) is given by the following:
In short, . Finally, the accommodation coefficient or deposition coefficient αi (Skrotzki et al., 2013) in Eq. (12) must be given as input and is set at a constant value. Reasonable values are 0.5–1.0. Skrotzki et al. (2013) recommended a deposition growth coefficient of 1.0. Kärcher et al. (2022, 2023) introduced a complex scheme to compute αi as function of the crystal size and ice saturation ratio (Si). The approach is based on sophisticated laboratory investigations discussed in the articles. The discussions in Kärcher et al. (2023) emphasize that further work is needed in this complex field of research. We follow Spichtinger et al. (2023) and set αi=0.5.
The thermodynamic term FH in Eqs. (9) and (10) is related to latent heat release due to the diffusion of heat away from the ice crystal (Lohmann et al., 2016):
Here, J kg−1 (denoted as the heat of sublimation) and K is the thermal conductivity coefficient (in J m−1 s−1 K−1):
FH contributes to the sum FG+FH by < 5 % for temperatures < 235 K and is, thus, of low importance.
In the following, we explain the successive steps in the simulations of the MOSAiC ice nucleation events. The starting height z0 of the simulations is set into the top region of the cirrus (the coldest part of the cloud with highest ice saturation ratio). In the case of a simulated gravity wave (GW), the air parcel will be lofted from z0 to z0+AGW, with the amplitude of the gravity wave AGW, and will then descend to z0−AGW before returning to z0. We also simulated large-scale lofting events from z0 to z0+300 m and a constant updraft speed of 1–3 cm s−1.
In Fig. 1, the calculation steps j and j+1 after exceeding the threshold or onset ice saturation level (Si,on) for heterogeneous or homogeneous ice nucleation are shown. As long as the threshold relative humidity RHi,on is not reached, the simulated air parcel just ascends with the given vertical velocity and ni remains zero. The number of ice crystals that nucleated in step j (after exceeding the onset Si,on) is given by ni(j) (see Eqs. 2–5). All ice crystals that formed earlier (during foregoing time steps, indicated by index l (l<j) from 1 to j−1 in Eq. 18) remain in the air parcel during the entire ascent and permanently grow via water vapor uptake. The consideration of sedimentation aspects is discussed in Sect. 2.3. The time given for ice crystals that nucleated in the earlier step l to grow is . This means that the crystal size increases with age according to Eqs. (9) and (10) in the computations of ice mass growth in step jstep=j. Via this process of the continuous deposition of water vapor on the crystals in supersaturated air, a broad crystal size spectrum develops with time.
The ice mass Qi(j) (in kg m−3) produced within the time interval Δt(j) (see the first red box in Fig. 1) is given by the following expression:
with the bulk ice mass density (ρi) (kg m−3), the ice crystal number concentration (ni) (m3), and ri (m). For simplicity, the core mass density of an INP with a radius rINP (set to 0.25 µm) in Eq. (18) is assumed to be equal to ρi. The increase in the crystal radius ri(j) by Δri within time step Δt(j) is computed by using Eq. (10).
In the next step, the ice mass Qi(j) that formed during the time interval Δt(j) must be subtracted from the absolute humidity (kg m−3) in the air parcel,
to obtain the absolute humidity after ice growth in step j,
Furthermore, the heat release resulting from the water vapor deposition on the ice embryos and growing ice crystals increases the temperature (Spichtinger et al., 2023):
The air pressure p(j) (in Pa) is influenced via the dependence of the barometric formula on the ambient temperature TH(j); therefore, we introduce pH(j) in Fig. 1. Then, we step forward and compute the water vapor pressure after ice growth (index G) and heat release (index H) using Eq. (19):
The respective water vapor mixing ratio (MRG,H in Fig. 1) is given by , while the ice saturation ratio, affected by ice crystal growth and related water vapor loss, can be written as follows (see Eqs. 19 and 20):
To remind the reader, the ice saturation ratio is defined as . The values of and pi,sat are given in Pascal.
The consideration of the removal of ice crystals from the air parcel by crystal sedimentation processes (Sect. 2.3) would influence the ice mass production and the mixing ratio reduction. This impact of sedimentation is indicted by index S in Fig. 1.
After the computation of ice nucleation, crystal growth, and potential sedimentation-related crystal losses (red boxes in Fig. 1), the next step of adiabatic lofting is simulated (blue boxes in Fig. 1). The water vapor mixing ratio MR is again constant during this computation of adiabatic lofting.
2.3 Sedimentation of ice crystals
As a result of ice growth, sedimentation processes come into play. Crystals start to fall, and the larger ones (with significant sedimentation speed) will leave the air parcel and, thus, no longer contribute to ice growth effects in the simulated ascending air parcel. Spichtinger and Gierens (2009) and Spichtinger and Cziczo (2010) have introduced comprehensive sedimentation schemes that consider the ice crystal size spectrum and size-resolved fall velocities. This approach was applied in the cirrus simulations of Krämer et al. (2016).
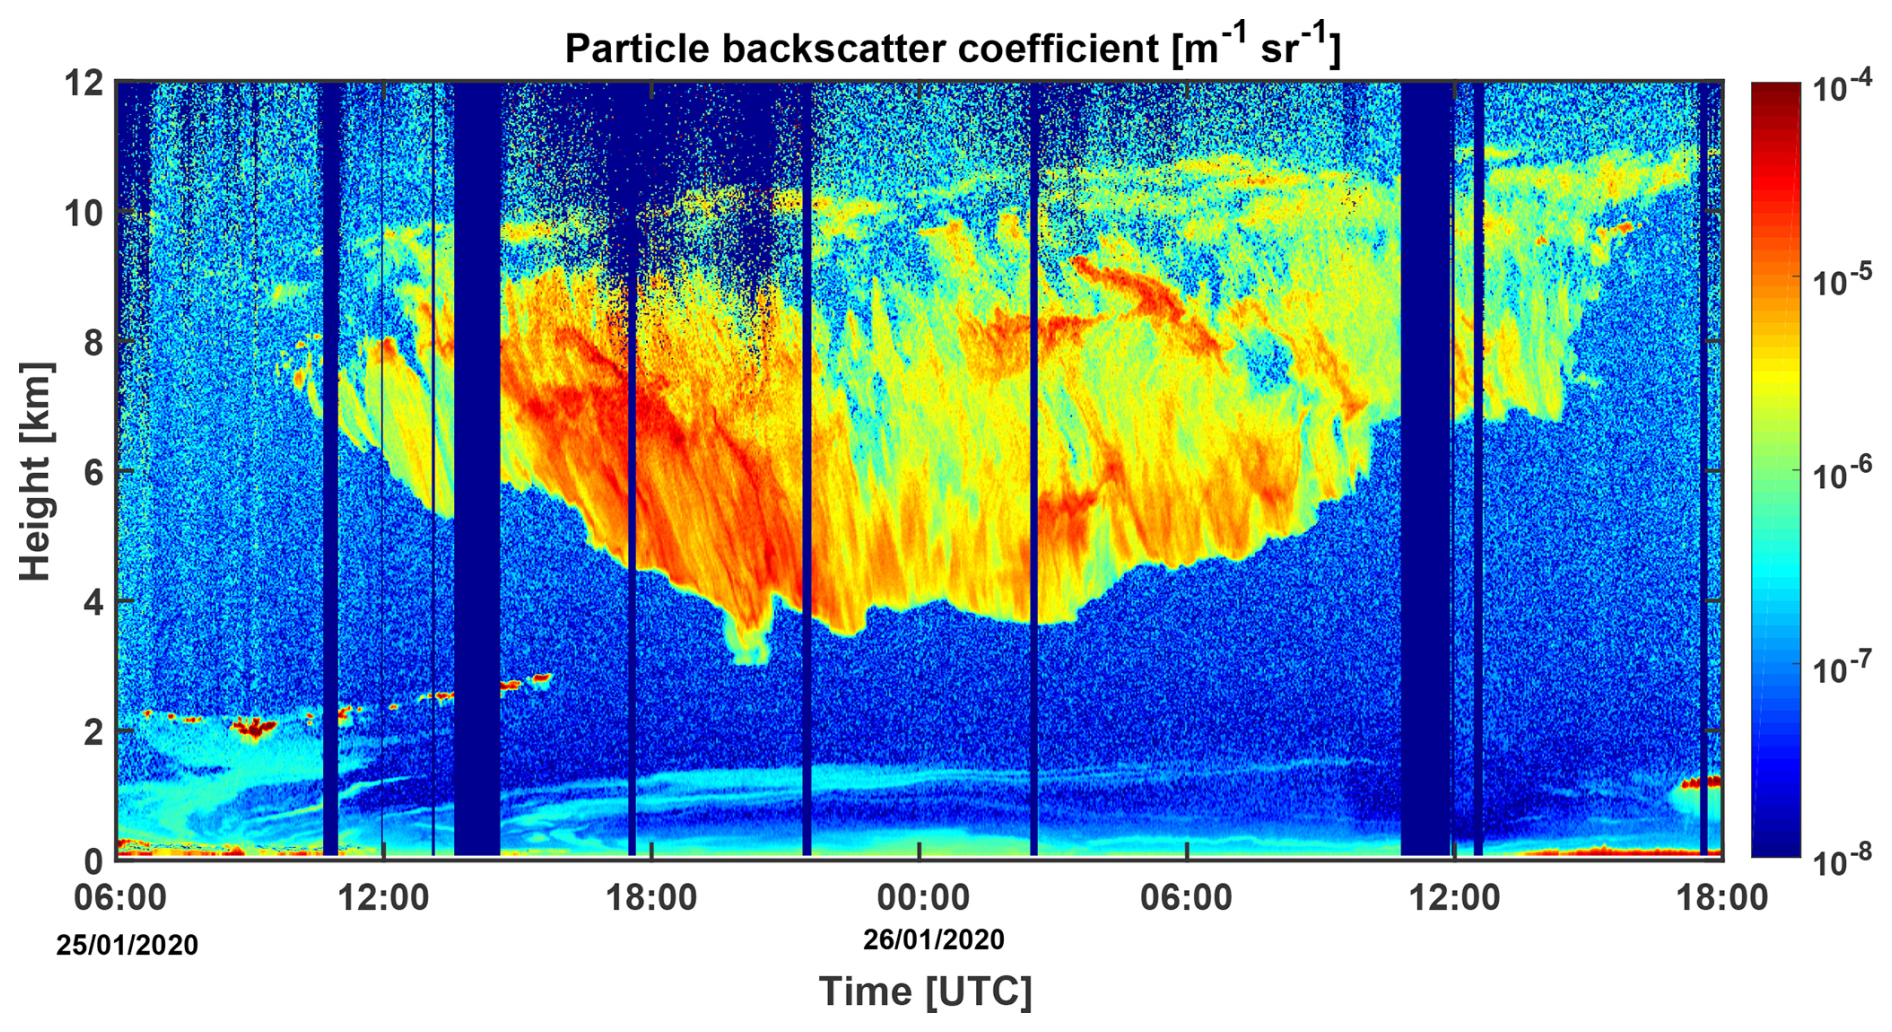
Figure 2Cirrus life cycle observed with lidar over Polarstern at 87.4° N, 93–94° E on 25–26 January 2020. The cirrus (in light green, yellow, and red colors) belongs to the synoptic cirrus category (top-down generation of cirrus structures) (Lynch2002). The cirrus-top layer (ice nucleation zone) ascended from about 9.5 to 11 km within 30 h. Ice crystal virga of falling ice crystals reached down to 4 km height. The sublimation of crystals determines the lower rim of the virga zone. The particle backscatter coefficient at 1064 nm is shown. Multiplication of the backscatter coefficients by a cirrus lidar ratio of 30 sr yields the cirrus extinction coefficient.
In our simulation, we simply assume that all particles with ri(j)>10 µm leave the air parcel. Ice crystals are no longer considered in the mass computation with Eq. (18) if their radius exceeds this threshold value. Khvorostyanov and Curry (2005) showed that ice crystals with a radius of 5, 10, and 15 µm may fall with respective velocities of 5–10 cm s−1, 10–15 cm s−1, and 15–20 cm s−1 in the upper troposphere at temperatures below −40 °C. During an ice nucleation event of, e.g., 300 s, particles with a radius of 10 µm can, therefore, reach heights of 30–45 m below the height at which they were nucleated. However, the simulations showed that sedimentation processes at temperatures of −60 to −75 °C (typical MOSAiC cirrus-top temperatures) have almost no influence on ice nucleation events (in simulations of short-term gravity-wave-induced air parcel lofting). Because of the rather slow growth of ice crystals at temperatures of around −70 °C, crystal sizes remain mostly below 20 µm (in diameter); therefore, the sedimentation-related removal of crystals from the simulated air parcel has almost no impact on the simulation results.
Our simple sedimentation scheme allows us to simulate the maximum possible impact of sedimentation. The minimum impact is simulated by switching off the sedimentation routine. To roughly match the sedimentation-related impact on ice nucleation, as simulated by Spichtinger and Cziczo (2010), we have to set the sedimentation threshold radius to 25–35 µm instead of the used radius of 10 µm.
In Figs. 2–5, we provide a brief overview of the key findings regarding smoke and cirrus properties during the MOSAiC winter half year of 2019–2020. An extended discussion is given in Part 1 of this work (Ansmann et al., 2025). Figure 2 shows the complete life cycle of an Arctic cirrus cloud system, observed on 25–26 January 2020 during a 6 d cirrus period (21–26 January 2020). Two other cirrus events of this long-lasting period, observed on 21–22 January 2020, are discussed in Part 1 (Ansmann et al., 2025). The meteorological conditions measured with radiosondes, launched every 6 h, and the cirrus properties observed with lidar and radar during the 21–26 January 2020 period served as a guide and orientation in our effort to design realistic smoke and cirrus simulation scenarios.
Large-scale lofting over 30 h caused an ascent of the cirrus-top layer from about 9.5 to 11 km height (with a mean lofting velocity of about 1.5 cm s−1) on 25–26 January 2020. Extended virga reached down to about 4 km above Polarstern. The cirrus-top temperature and ice saturation ratio were °C and Si=1.36 at the beginning of the cirrus event (according to the observations with radiosonde launched at 05:00 UTC on 25 January). Later on, the temperatures decreased to −75 °C and the ice saturation ratios ranged from 1.25 to 1.32 just below the tropopause. As mentioned before, ice nucleation preferably takes place in the coldest region of the cirrus layer and, thus, close to the top of the cirrus field.
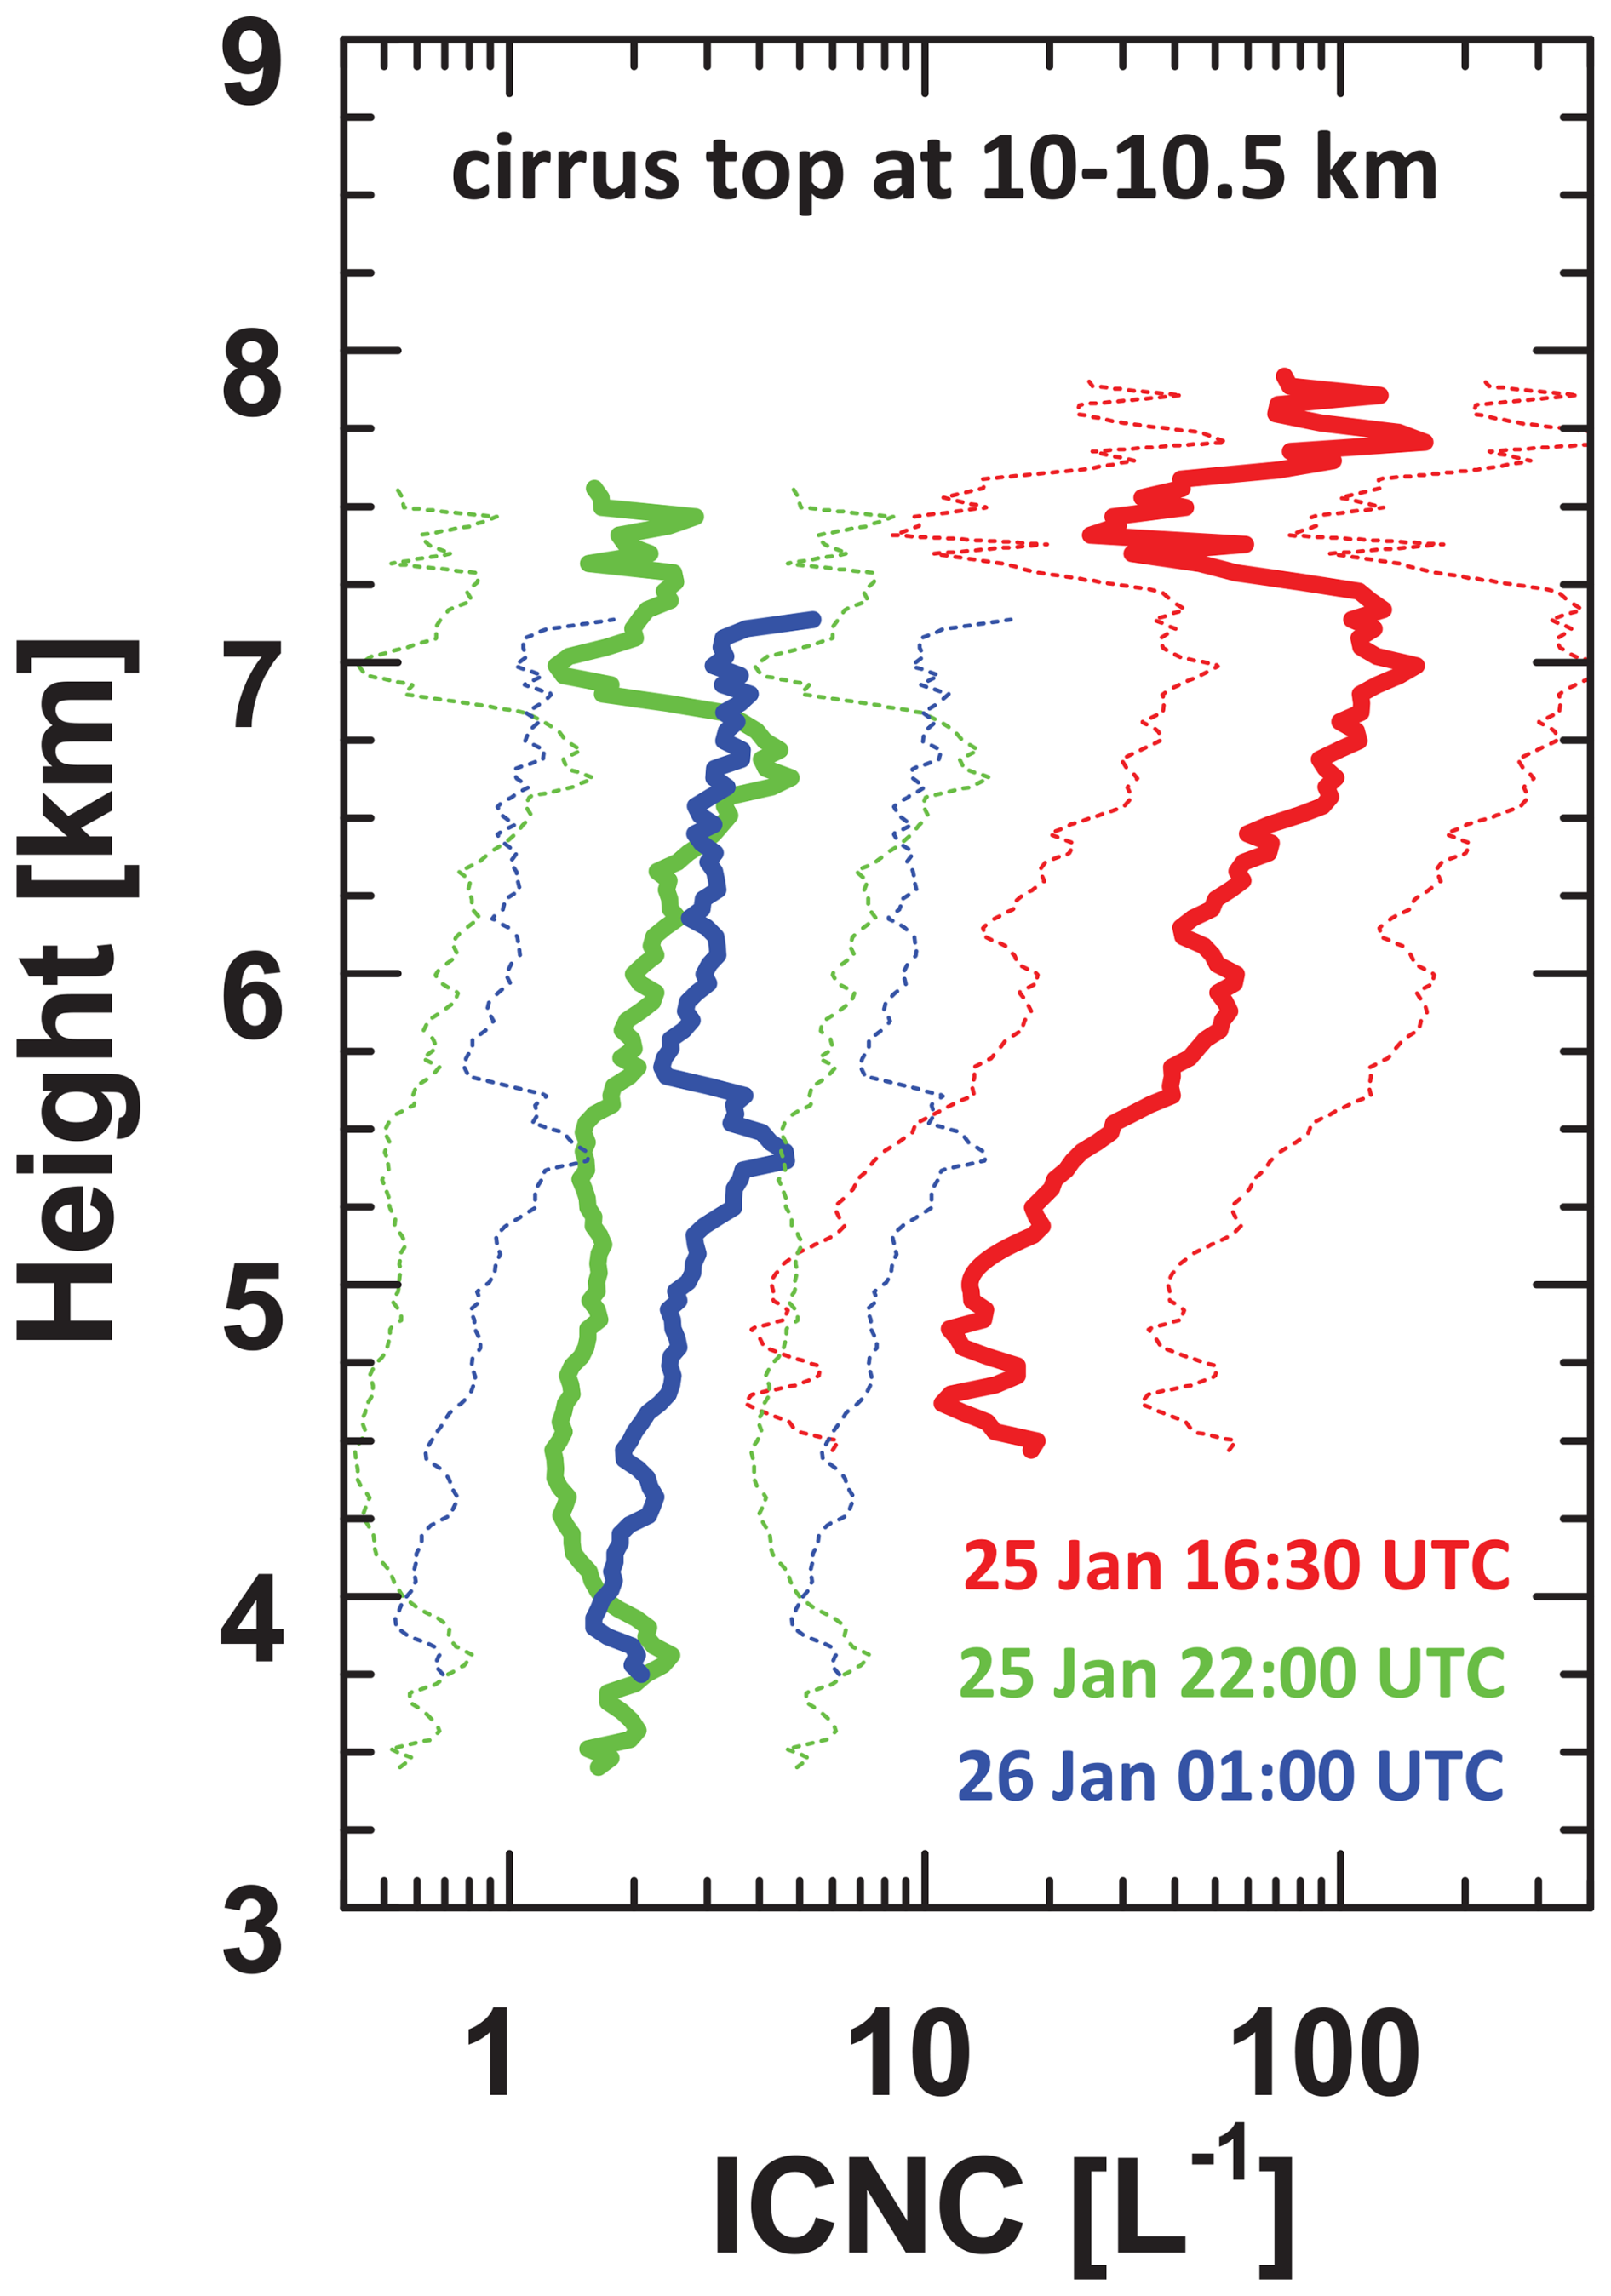
Figure 3Ice crystal number concentration (ICNC, 1 h mean profiles; start of the measurement period is given in the panel) retrieved from combined lidar–radar observations in the virga height range on 25–26 January 2020 (see Fig. 2). Ice nucleation usually starts at the cirrus top, which was at heights > 10 km on 25–26 January. The ICNC retrieval uncertainty range is indicated by thin dashed lines.
Figure 3 shows 1 h mean ICNC height profiles derived from combined lidar and radar observations in extended virga fields on 25–26 January 2020. The retrieval is explained in Ansmann et al. (2025). The three ICNC profiles cover the range of MOSAiC ICNC values well. In the majority of the observations, the virga ICNC values were between 1 and 10 L−1, although they were also between 10 and 50 L−1 in many cases. Values > 100 L−1 were rare. It has been mentioned in Part 1 (Ansmann et al., 2025) that the virga observations (geometrical structures, frequency of occurrence, and ICNC) contain information about the strength (amplitude and duration) and occurrence frequency of individual updraft events and, thus, about the respective strength of the ice nucleation processes. The generally observed high virga occurrence frequency suggested that short-term updraft events (and not large-scale lofting events) mainly contributed to ice nucleation in the observed cirrus clouds during the MOSAiC expedition.
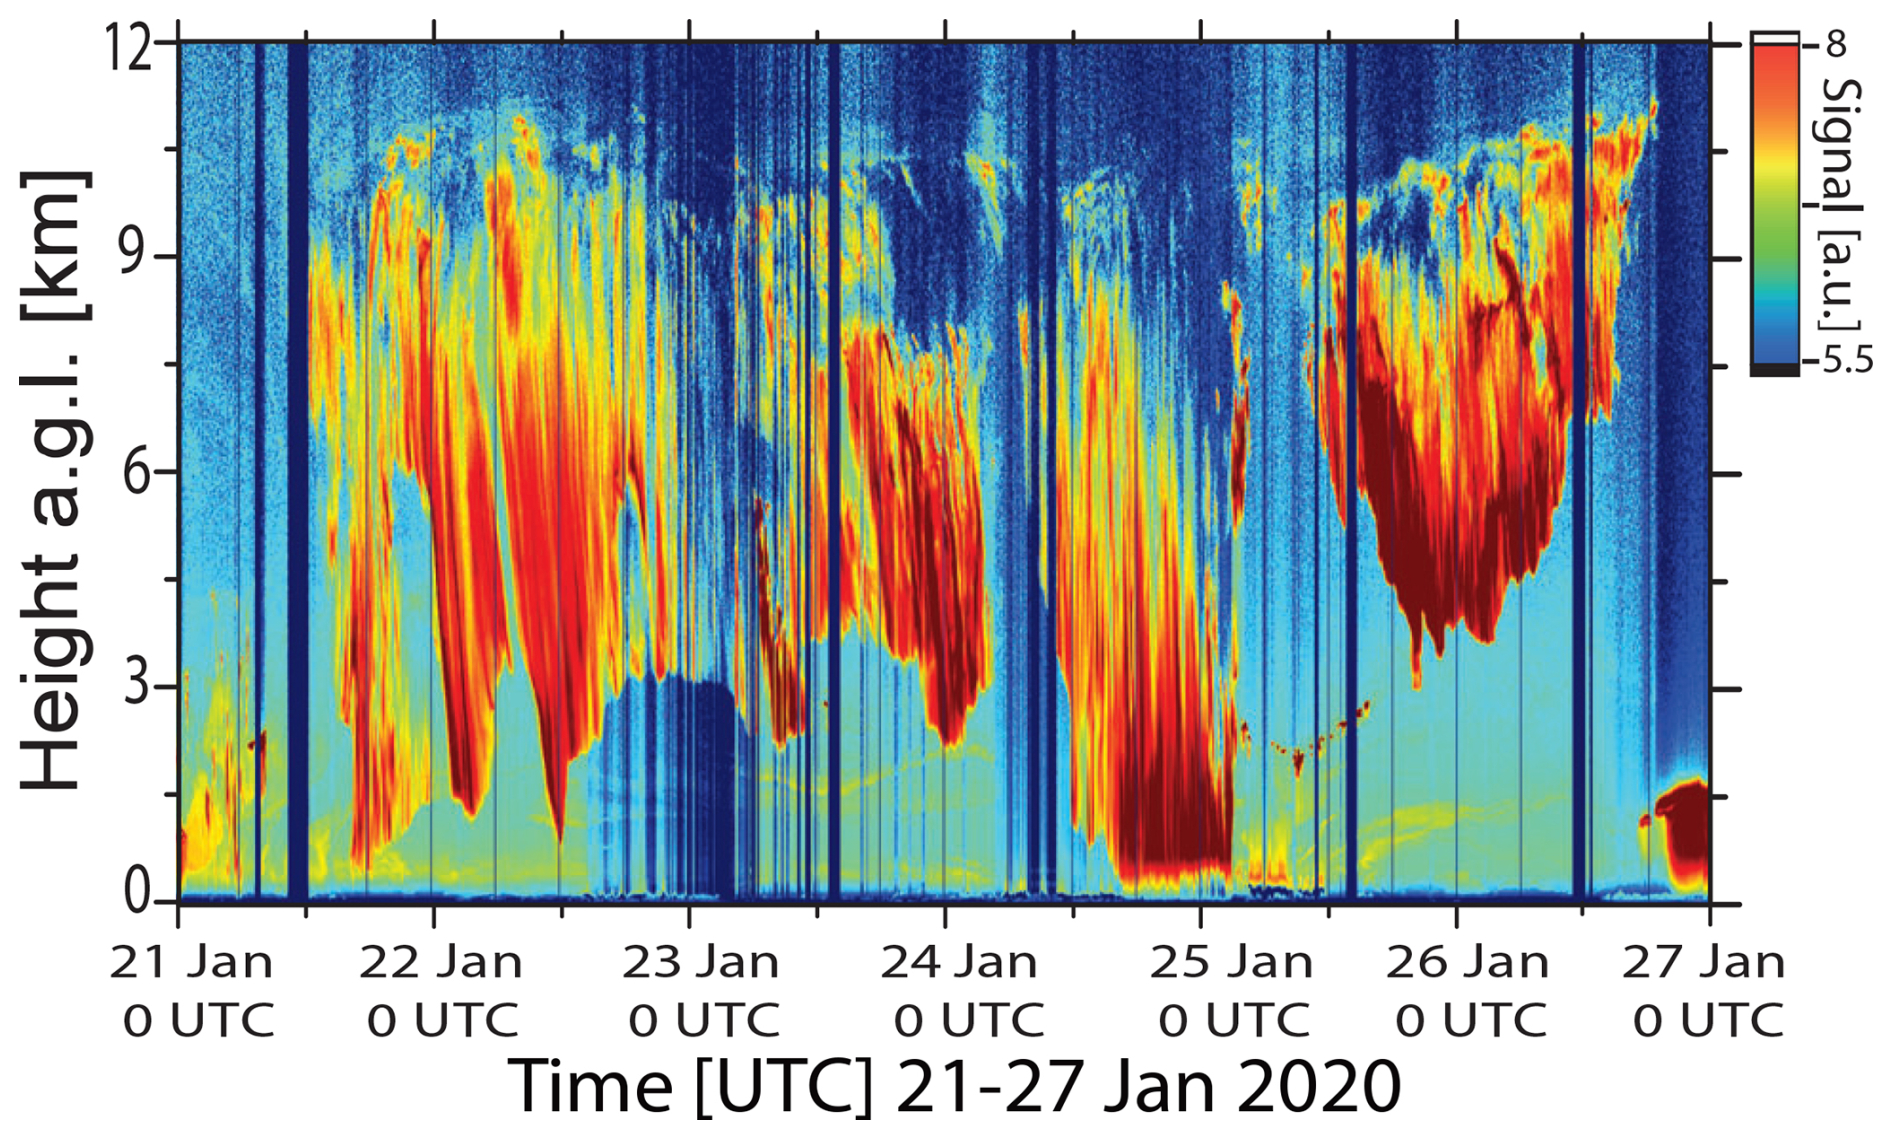
Figure 4Lidar observations of smoke (in light yellow) at heights of around 10.5 km during a 6 d cirrus period, lasting from 21 to 26 January 2020. Ice crystal fallstreaks (virga in orange and red) are visible, mainly from 10 km down to 1–3 km height. Aged wildfire smoke was continuously observed during cloud-free periods above 6 km during the entire MOSAiC winter half year (Ohneiser et al., 2021a) with maximum pollution levels around or just above the tropopause. The height–time display of the range-corrected 1064 nm lidar return signal is presented using a logarithmic scale (in arbitrary units, a.u.).
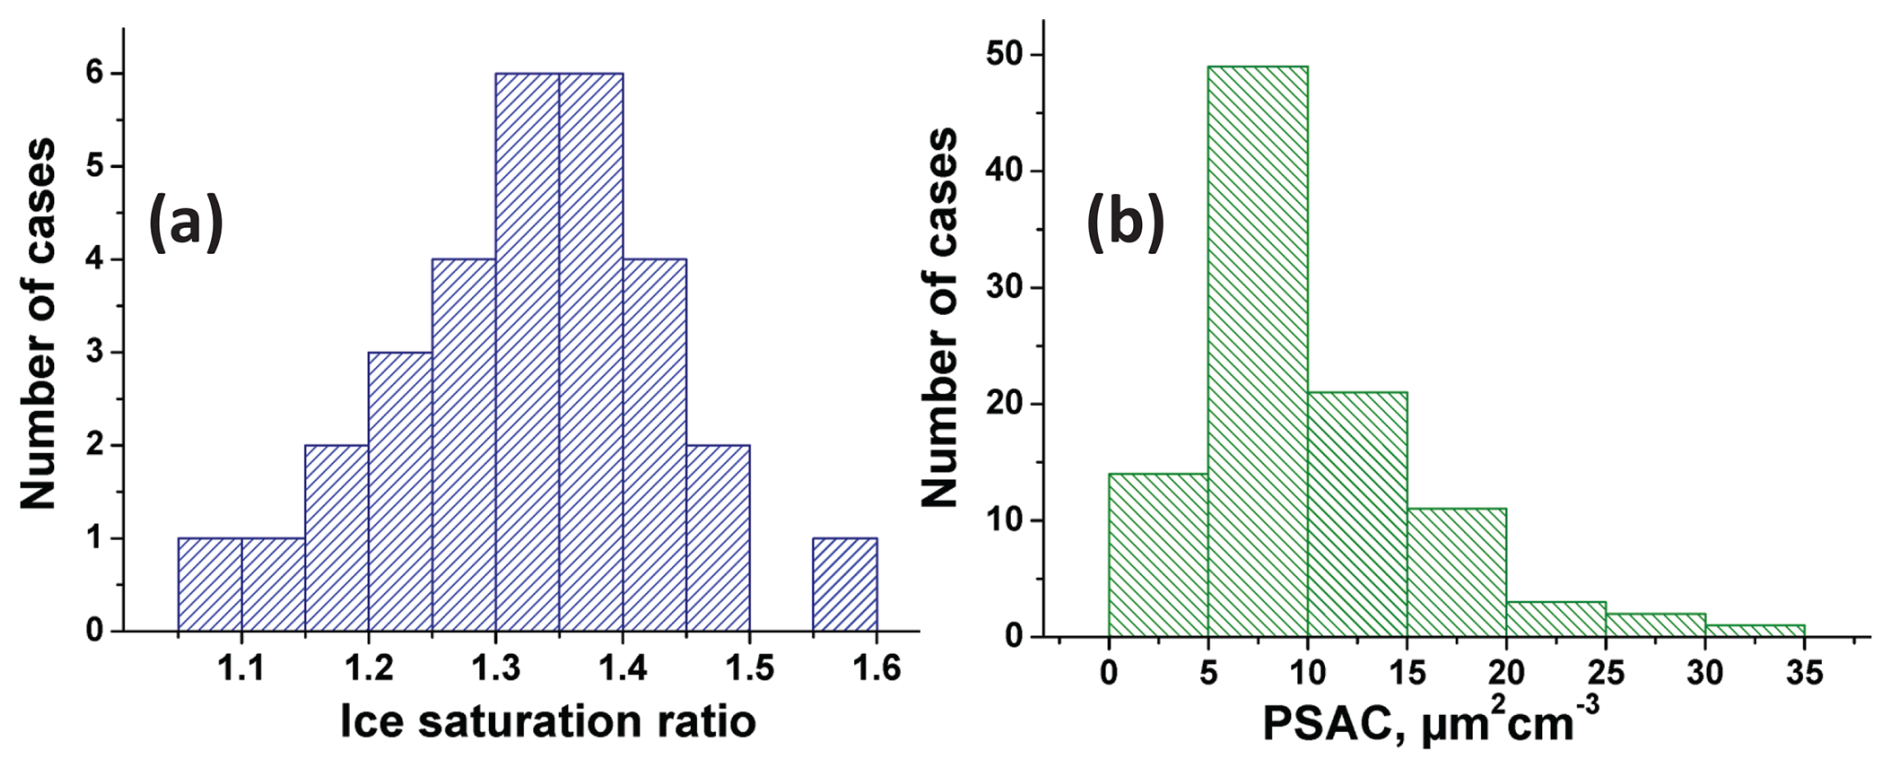
Figure 5(a) Frequency of occurrence of the maximum ice saturation ratio measured with radiosondes in extended cirrus fields. A total of 30 radiosonde profiles were analyzed (November 2019 to February 2020). The highest ice saturation ratios were usually measured close to the top of the cirrus layers. (b) The frequency of occurrence of the smoke particle surface area concentration (PSAC) derived from lidar observations at the tropopause under cirrus-free conditions (November 2019 to February 2020).
Figure 4 shows an important MOSAiC finding that is unfortunately not easy to identify in the height–time display of the shown lidar backscatter signal. As extensively discussed in Ohneiser et al. (2021a) and Ansmann et al. (2023, 2024), we observed almost constant levels of wildfire smoke pollution in the UTLS over the central Arctic from October 2019 to mid-May 2020. As can be seen in Fig. 4, there was always smoke at heights of around 10.5 km, i.e., within and above the cirrus-top height range. Smoke particles were continuously detected from about 6 km up to 2–4 km above the local tropopause. A very clear and impressive observation of a series of cirrus evolution events, all of which were initiated within the permanently polluted upper troposphere, was presented in Fig. 14 in Ansmann et al. (2023), observed during another long-lasting cirrus period from 25 to 29 February 2020. The simulations will show that homogeneous freezing is widely, if not fully, suppressed under such conditions. The observation of the persistent UTLS smoke layer is probably our strongest and most convincing argument for the hypothesis that smoke controlled cirrus formation in the central Arctic during the full MOSAiC winter half year.
The histograms in Fig. 5 provide an overview of the maximum values of the ice saturation ratios observed with radiosondes in extended cirrus fields and the smoke levels derived from the lidar observations. The histogram in Fig. 5a is based on the analysis of 30 MOSAiC radiosonde observations performed during 4 months (November 2019 to February 2020). A careful inspection of each of the used radiosonde profiles in combination with the corresponding cirrus lidar observations clearly revealed that all 30 sondes ascended through cirrus layers. The cirrus backscatter profile signatures, observed with lidar, were usually in perfect agreement with the respective radiosonde RH and temperature profile signatures. The maximum ice saturation ratio (Si) values accumulate between 1.3 and 1.4 in Fig. 5a and point to the dominance of heterogeneous ice nucleation on inefficient INPs, as expected when organic particles serve as INPs. In Fig. 5b, the distribution of the frequency of occurrence of lidar-derived PSAC values observed during the winter months, from November to February, at the tropopause height level is given. In terms of the respective smoke particle extinction coefficients, the smoke perturbation caused 20 times higher extinction values than observed during undisturbed clean conditions. The humidity and pollution values in Fig. 5 and the ICNC profiles in Fig. 3 were used as orientation in the design of the simulation scenarios.
The main goal of the simulations was to provide a deeper insight into the ability of smoke to influence ice formation at cirrus temperatures of −60 to −75 °C and, more generally, to obtain a detailed view of the roles of heterogeneous and homogeneous ice nucleation in cirrus formation processes during the MOSAiC winter half year. We start with a scenario of large-scale lofting of air parcels, characterized by low lofting velocities of 1 and 3 cm s−1. Then, we discuss ice nucleation during short-term updraft events resulting from gravity wave activity. A typical lofting velocity of 20 cm s−1 is selected in these simulations. Of specific interest are those updraft conditions that lead to low ICNCs of <50 L−1, as typically observed during the MOSAiC winter half year. Finally, the impact of a mixture of less efficient to very efficient smoke particles on ice formation is illuminated.
To facilitate the comparison of different simulation scenarios, we use similar starting conditions for the ascending air parcels in most simulations. All lofting simulations start with an ice saturation ratio Si(z0)=1.2 at the starting height z0. Simulations with a temperature of T(z0)=199 K at z0=10.5 km represent cirrus formation conditions usually observed in January and February 2020, whereas simulations with a temperature of T(z0)=213 K at z0=9 km reflect the cirrus formation conditions usually observed in November and December 2019. Table 1 contains the smoke input data (particle surface area concentration, sp; volume concentration under background aerosol conditions, vp,bg; and number concentration of large smoke particles, n250) and the input data for the cold Arctic cirrus scenario (T=199 K, p=212 hPa, RH = 64 % at the starting height z0=10.5 km, cangle=26.5°) and the warm Arctic cirrus scenario (T=213 K, p=265 hPa, RH = 69.5 % at the starting height z0=9 km, and cangle=24.5°).
4.1 Ice nucleation during large-scale lofting
In Fig. 6, two large-scale lofting scenarios with low ascent velocities of 1 and 3 cm s−1 are presented. In addition, simulations with constant vertical velocities of 10 and 20 cm s−1 are included to show the dependence of ice nucleation on ascent speed. An ice nucleation event under cold-cirrus conditions (as observed on 22 January 2020, presented in Part 1 of this work, or on 25–26 January, as shown in Fig. 2 in this paper) is simulated. We compare scenarios of heterogeneous ice nucleation on smoke particles with respective homogeneous freezing scenarios for background aerosol conditions. In the latter simulations, the smoke particle number concentration is set to zero.
All simulations show burst-like ice nucleation events. These well-defined events are the result of the interplay between two processes (causing opposite effects). The ascent of the air parcel leads to a monotonic increase in the ice saturation ratio (Si), and when the onset value Si,on is reached and exceeded, ice nucleation sets in. On the other hand, the growth of ice particles via the deposition of water vapor on the ice crystal surfaces reduces the water vapor in the ascending air parcel. The ice saturation ratio Si decreases according to Eq. (23). When Si drops below the onset value (Si,on), ice nucleation stops.
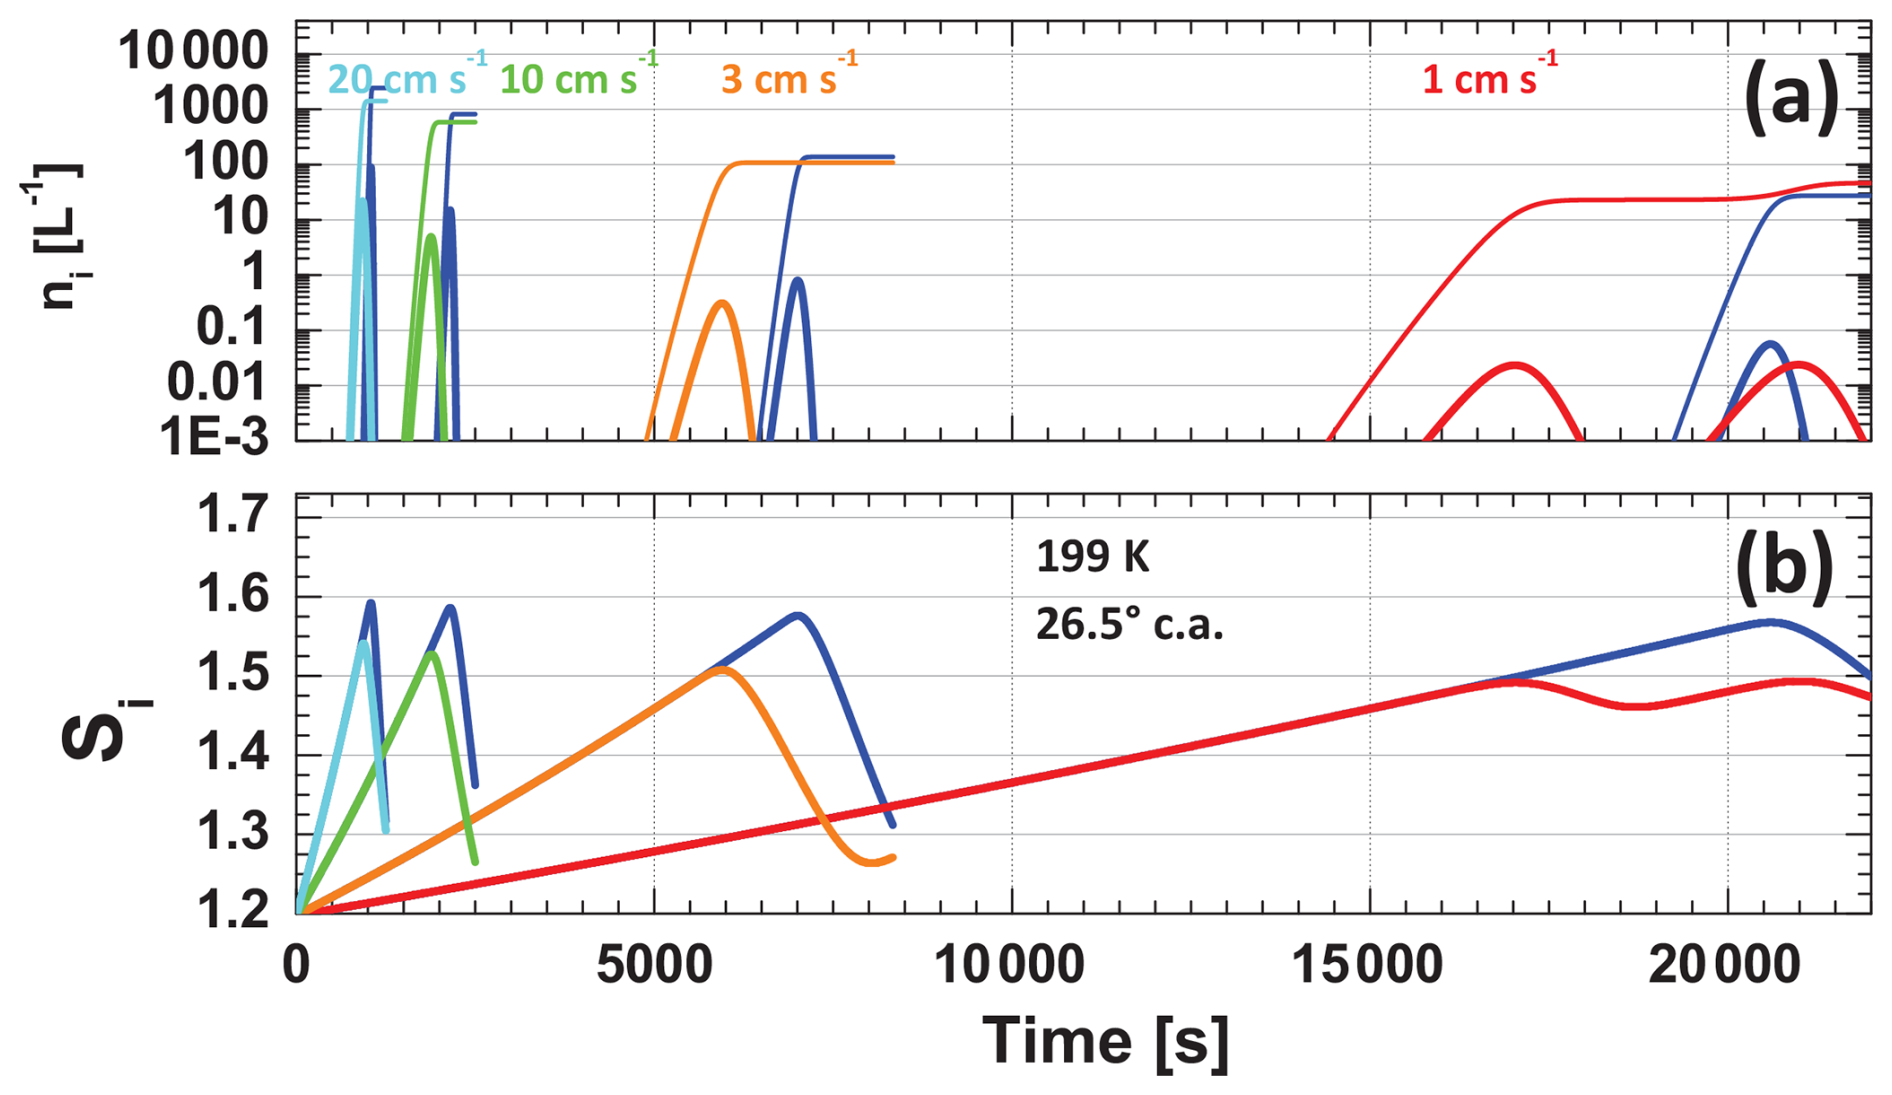
Figure 6Simulation of deposition ice nucleation (DIN) on smoke INPs during the adiabatic rise of an air parcel ascending with a constant updraft velocity of 1 cm s−1 (red), 3 cm s−1 (orange), 10 cm s−1 (green), and 20 cm s−1 (cyan). For comparison, the homogeneous freezing of background aerosol particles (dark blue, under smoke-free conditions) is shown. Temperature T(z0) is 199 K and the ice saturation ratio Si(z0) is 1.2 for all scenarios at the start of the ascent at height z0. (a) Temporal evolution of the ice crystal number concentration and (number of crystals nucleated within Δt=1 s) and (b) of the ice saturation ratio Si. The thick solid lines in panel (a) show ni, whereas the thin lines present the sum ∑ni of all nucleated crystals. The strong drop in the Si values is caused by ice crystal growth. Simulated sedimentation effects lead to two ice nucleation events in the case of an updraft velocity of 1 cm s−1 (in red). The time resolution in the simulation is 0.1, 0.5, and 1 s for the scenarios with lofting velocities of 10 and 20, 3, and 1 cm s−1, respectively.
In our study, the onset ice saturation ratio (Si,on) is defined by the ice saturation ratio (Si) for which the ice crystal number concentration (ni,hom or ni,het) nucleated within Δt=1 s exceeds (for the first time) the value of 0.001 L−1 in an ascending air parcel. The onset ice saturation ratios are and 1.474 for homogeneous and heterogeneous ice nucleation at 199 K, respectively.
The consideration of crystal sedimentation by applying our simplified sedimentation approach, outlined in Sect. 2.3, leads to a second nucleation event in the scenario with a 1 cm s−1 ascent rate (shown in red in Fig. 6). Similar sedimentation-related features occur in the other simulations, but they are not shown in Fig. 6. The second event is related to the fact that ice crystals with a radius > 10 µm are removed from the air parcel in the simulation and no longer contribute to the reduction in the ice saturation ratio via ice crystal growth. However, the ascent of the simulated air parcel continues. With a reduced impact of ice growth, the ice saturation ratio starts to rise again and exceeds the onset value Si,on for heterogeneous ice nucleation; therefore, another burst-like structure is observed. Similar recurring ice nucleation features caused by the sedimentation impact have been shown and discussed by Spichtinger and Cziczo (2010) and Krämer et al. (2016).
The main message of Fig. 6 is that wildfire smoke PSAC values of the order of 10 µm2 cm−3 and respective n250 values of around 2000 L−1, as observed during the MOSAiC winter half year, are high enough to cause strong heterogeneous ice nucleation events and to prevent homogeneous freezing. In all four simulation pairs with different vertical velocities the reached maximum value of the ice saturation ratio is lower in the case of smoke-induced heterogeneous ice nucleation than the respective Si,on value for the homogeneous freezing of background aerosol particles (see Fig. 6b). Ice nucleation on smoke particles can start earlier in a rising air parcel than homogeneous freezing. Before the onset ice saturation ratio for homogeneous freezing is reached during the further ascent of the air parcel, growth of the already formed ice crystals can strongly reduce the water vapor pressure (see Fig. 6b) so that the onset value (Si,on) for homogeneous freezing can no longer be reached; therefore, homogeneous ice nucleation will be completely suppressed as long as INPs are available in the rising air parcel. If the INP reservoir is empty, Si can further increase under the almost unlimited rising conditions during large-scale lofting events, and homogeneous freezing events can occur and dominate the further cirrus evolution. Thus, the following question arises: “How reasonable is the assumption that homogeneous ice nucleation can dominate ice formation in a highly and constantly polluted upper troposphere with an almost unlimited INP reservoir continuously refilled from the lower stratosphere?”.
By comparing the simulations with different ascent velocities, we see a strong impact of the vertical velocity on the total numbers of nucleated ice crystals ( and ). The integrated ICNC values are < 50 L−1 in Fig. 6a for a typical synoptic ascent rate of 1 cm s−1. The numbers increase with increasing vertical velocity and are of the order of 100 L−1 (vertical velocity of 3 cm s−1), 1000 L−1(vertical velocity of 10 cm s−1), or even exceed 2000 L−1 (vertical velocity of 20 cm s−1). The higher the vertical velocity, the higher the (maximum) Si value, reached in the rising air parcel, and the higher the respective maximum ice crystal number concentrations (thick solid lines in Fig. 6a) before the growth of the nucleated ice crystals becomes strong enough to terminate the nucleation event. This result is not new and has been shown in many existing publications (see, e.g., Kärcher and Lohmann, 2002).
4.2 Gravity-wave-induced ice nucleation
The MOSAiC observations indicate that large-scale lofting occurred (as shown in Fig. 2) and may have contributed to cirrus formation. However, the observed high virga occurrence frequency suggests that short-term updraft events resulting from, for example, gravity wave activity (Podglajen et al., 2016) dominated and triggered most of the observed ice nucleation events. Figure 7 shows a simulation scenario with ice nucleation initiated during the updraft phase of a gravity wave. A typical updraft mean vertical velocity of 0.2 m s−1 (during the first quarter of the wave) and a relatively large gravity wave amplitude of 250 m are simulated (Podglajen et al., 2016; Kärcher and Podglajen, 2019). Again, we compare heterogeneous ice nucleation in a smoke-filled air parcel with a respective homogeneous freezing event (under pure background aerosol conditions). As in the large-scale lofting simulation, homogeneous freezing will be suppressed as long as smoke INPs are available in the simulated air parcel because of the higher threshold (Si,on) required to start homogeneous freezing.
The simulated large updraft amplitude of 250 m and ascent velocity of 20 cm s−1 provide favorable conditions for strong ice nucleation. Significant DIN begins after 600 s (ni>0.001 L−1 s−1; orange curve in Fig. 6b) when the onset ice saturation ratio of is exceeded. The nucleation period stops about 120 s later when Si drops below Si,on again. The sum of all heterogeneously nucleated ice crystals is 1482 L−1. The respective homogeneous freezing event needs higher supersaturation ratios () and, at the end, produces more ice crystals ( L−1).
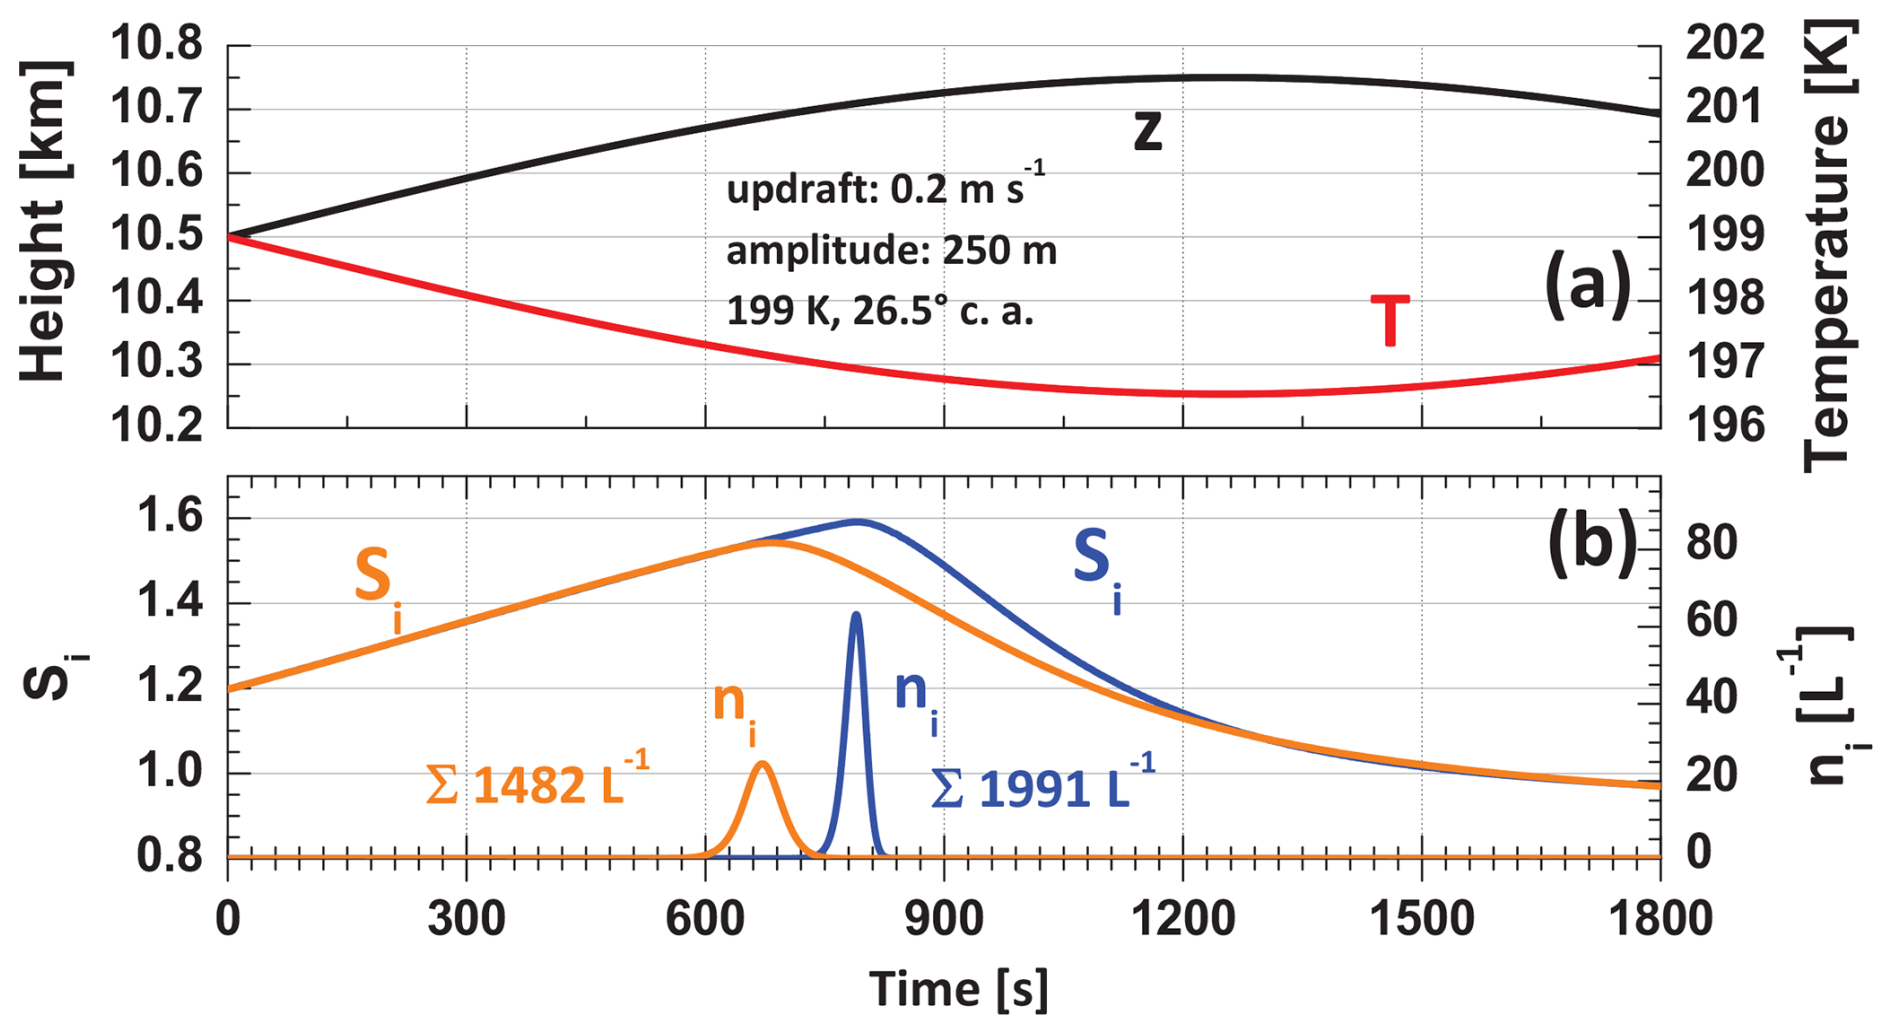
Figure 7Heterogeneous ice nucleation (orange ni curve in panel b) and homogeneous ice nucleation (blue ni curve in panel b) during the ascent of a smoke-filled and smoke-free air parcel, respectively, along the black z curve in panel (a). The upward motion is caused by a gravity wave, characterized by an updraft mean vertical velocity of 0.2 m s−1 (during the first quarter of the wave period) and a wave amplitude of 250 m. The temperature (T, red curve in panel a) is 199 K at the starting height z0=10.5 km, while the ice saturation ratio Si (orange Si curve in panel b) at z0 is 1.2. The ice crystal number concentration ni, nucleated in Δt=1 s, is shown together with the sum ∑ni of all heterogeneously or homogeneously nucleated ice crystals (given as numbers in panel b). The temporal resolution in the simulations is 0.1 s.
This scenario with a large wave amplitude probably provides the most favorable conditions where homogeneous freezing comes into play. The INP reservoir in a given air parcel may be empty after a few minutes; therefore, homogeneous freezing can set in after further rise of the air parcel or during subsequent updraft events that are experienced by the presently INP-free air parcel. In the case of such large amplitudes, the ice nucleation onset value (Si,on) for both heterogeneous and homogeneous ice nucleation (under smoke-free conditions) can be easily reached and exceeded so that large ice production is possible via both ice nucleation pathways. The simulations in Sect. 4.1 and 4.2 show that both ice nucleation modes can lead to rather low and rather high ICNC values; thus, the identification of the ice nucleation mode based on ICNC values is not possible.
As already discussed in Part 1 (Ansmann et al., 2025) of this work, it is worthwhile mentioning that situations can occasionally occur in which homogeneous freezing can set in under conditions with low INP numbers. This has been shown by Rolf et al. (2012), Krämer et al. (2016), and Kärcher et al. (2022). Homogeneous ice nucleation is possible in the presence of a low number of INPs when the updrafts are strong enough that the diffusional growth of the few heterogeneously nucleated ice crystals via water vapor deposition is not sufficient to reduce the relative humidity in the ascending air parcel significantly and to prevent the ice saturation ratio (Si) in the lofted air parcel from reaching and exceeding the onset ice saturation ratio (Si,on) for homogeneous freezing.
4.3 Ice nucleation in the case of low gravity wave amplitudes
The high ICNC values of the order of 1500–2000 L−1 shown in Fig. 7 were, however, not observed during MOSAiC. In well-defined, well-resolved virga, indicating single, unique updraft events, we typically found ICNCs of 1–10 L−1 or 10–50 L−1, but we rarely observed values > 100 L−1. In many cases, the observed ICNC profiles in the virga height range provided the clear impression that aggregation effects (leading to a significant reduction in ICNC with crystal falling time and, thus, decreasing height; see discussion in Ansmann et al., 2025) did not play a significant role; hence, the virga ICNC values, available at heights from 1 to 3 km below the ice nucleation cells at cirrus top, can be used as trustworthy estimates for the ICNCs at cirrus top.
In the next step, we reduced the updraft amplitude in order to obtain low ICNC (∑ni) values, to be better in line with the MOSAiC observations (Ansmann et al., 2025). According to the superpressure balloon observations of Podglajen et al. (2016), updraft events with low amplitudes occur much more frequently at UTLS heights in polar regions than strong updrafts (with large amplitudes). The observations of Podglajen et al. (2016) and their consequences with respect to the observable ICNC levels are discussed in detail in Sect. 3.5 in Part 1 of this work (Ansmann et al., 2025). Besides a decrease in the amplitude, and thus the height range, available for an air parcel to rise and to initiate ice nucleation, a decrease in the vertical velocity also leads to a reduction in the ICNC, as shown in Sect. 4.1. Podglajen et al. (2016) observed both, namely that updrafts with low amplitudes and low vertical velocity occur most frequently. In our study, the main focus is on the impact of the amplitude on ice nucleation in order to keep the discussion simple.
A simulation leading to low ICNC values is shown in Fig. 8. In the case of a gravity wave amplitude of 160 m (and Si(z0)=1.2), a very low ICNC number of L−1 is obtained in the simulation with a wildfire-polluted upper troposphere (orange ni curve in Fig. 8b). After exceeding Si,on, only 10 m of further lofting remains for ice nucleation; thus, a strong burst-like ice nucleation event cannot evolve. Homogeneous freezing is completely suppressed in the simulation of a shallow updraft with 160 m amplitude. The ice saturation ratio (Si) remains below Si,on for homogeneous freezing. To initiate homogeneous freezing, amplitudes of around 200 m are needed, as also simulated in Fig. 8.
It is noteworthy to mention that the simulation of an ascending air parcel that contains no ice crystals at the beginning of a nucleation event (as discussed here) is also representative of cases with air parcels that already contain ice crystals before the (new) ice nucleation event starts. The so-called pre-existing ice effect (Kuebbeler et al., 2014) may prohibit any further heterogeneous and, especially, homogeneous ice nucleation events when the pre-existing ICNC is greater than 100 L−1 in the air parcel. However, the pre-existing ice effect plays a negligible role when the pre-existing ICNC is far below 100 L−1, as was typically the case during the MOSAiC winter half year.
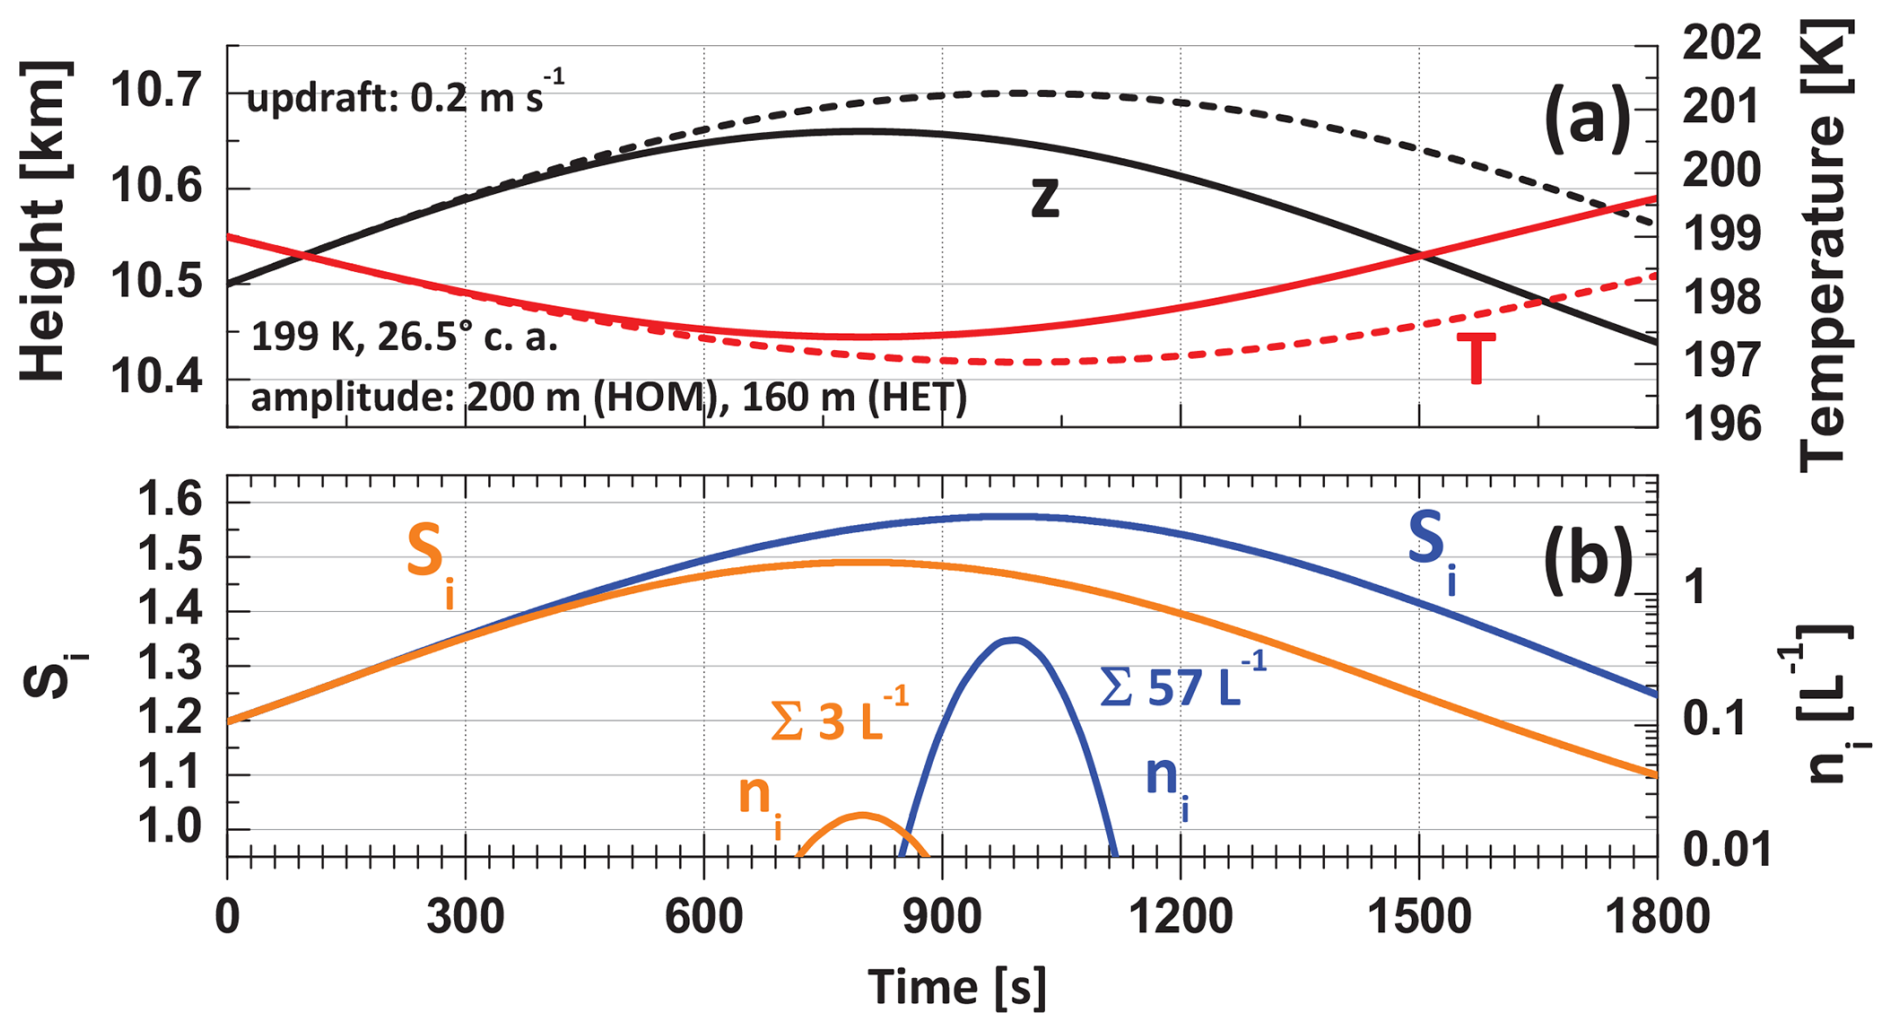
Figure 8Same as Fig. 7 except for lower gravity wave amplitudes of 200 m (homogeneous freezing; dashed curves in panel a) and 160 m (DIN; solid curves in panel a). In panel (b), orange and blue curves indicate simulations of heterogeneous and homogeneous ice nucleation, respectively. As in Fig. 7, the ice crystal number concentration ni, nucleated in Δt=1 s, is shown together with the sum ∑ni of all heterogeneously or homogeneously nucleated ice crystals (given as numbers in panel b).
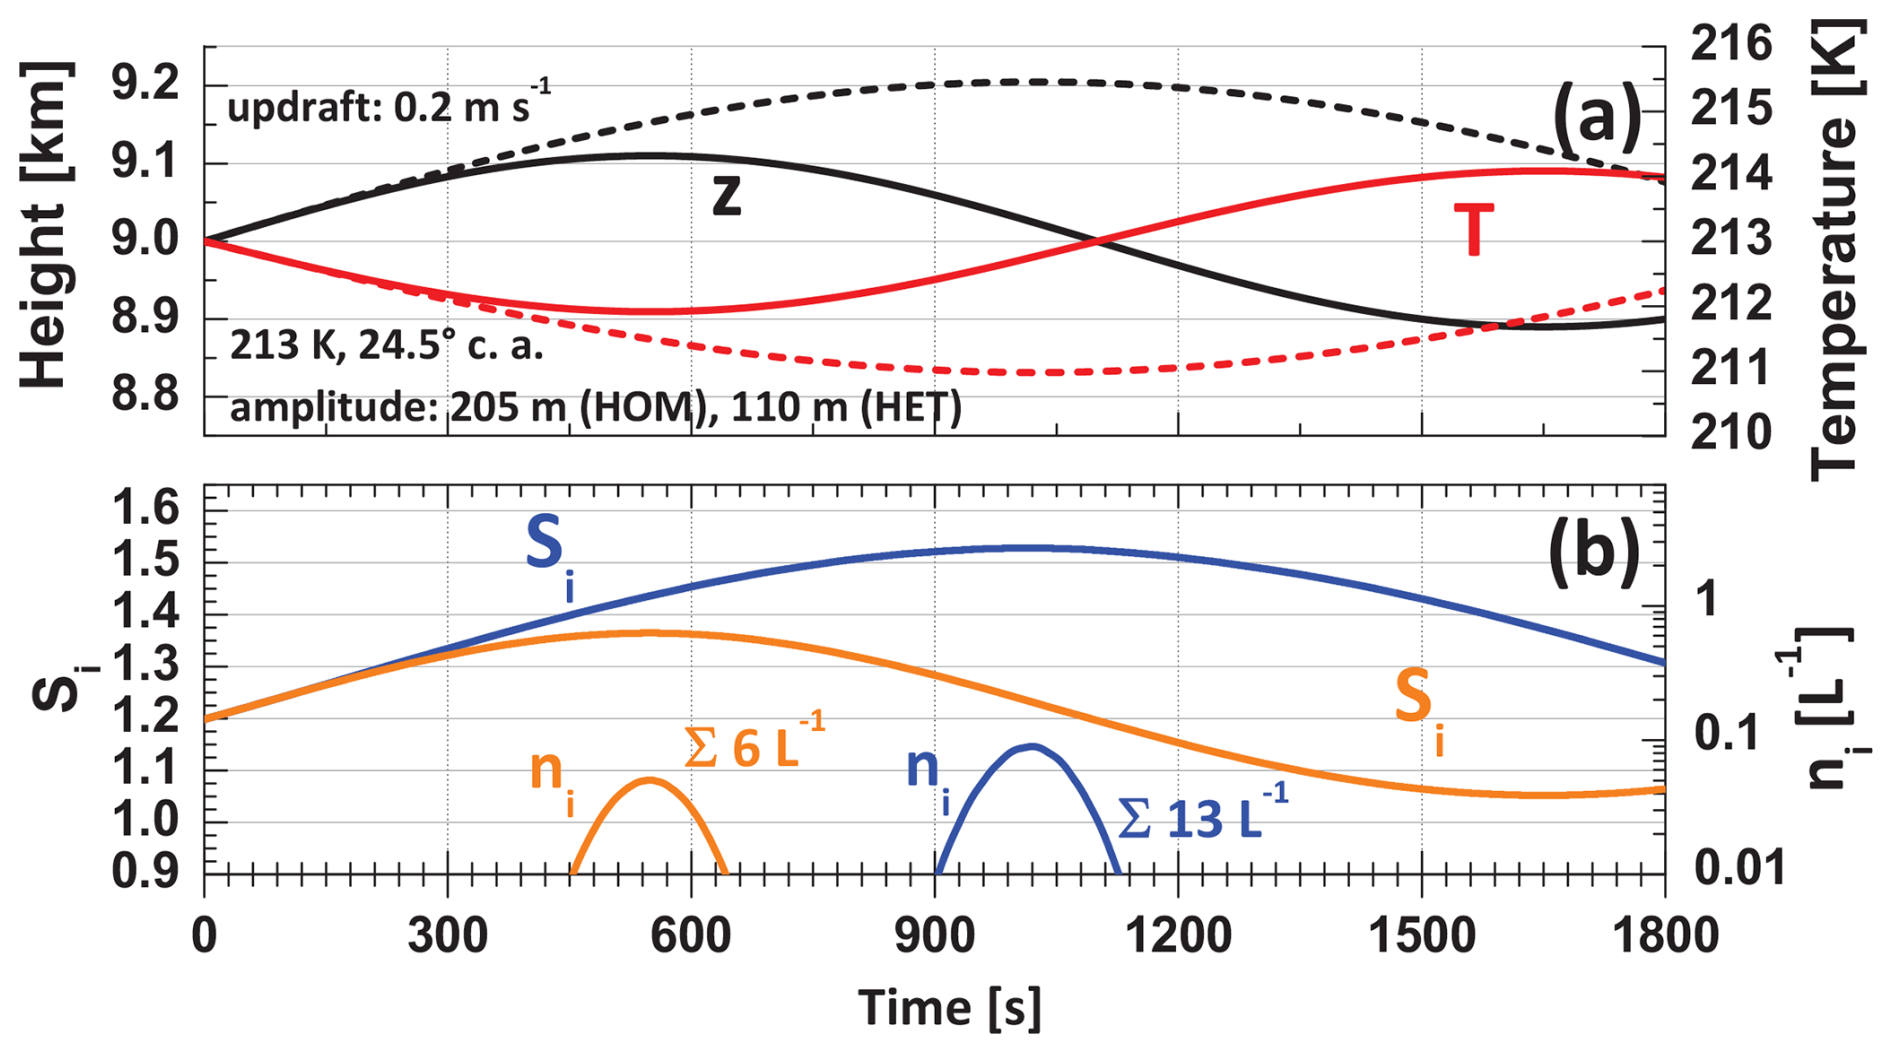
Figure 9Same as Fig. 8 except for a warm Arctic cirrus with T(z0)=213 K at z0=9 km, a lower contact angle (c.a.) of 24.5°, and amplitudes of 200 m (homogeneous freezing) and 110 m (heterogeneous ice nucleation). Again, the ice crystal number concentration ni, nucleated in Δt=1 s, is shown together with the sum ∑ni of all heterogeneously or homogeneously nucleated ice crystals (given as numbers in panel b).
Figures 7 and 8 show simulations for cold-cirrus conditions, as observed in January and February 2020. In November and December 2019, the cirrus developed at temperatures of −60 to −65°C, and cirrus-top heights were frequently at 8–9 km height. Such a scenario is shown in Fig. 9. With an increasing temperature, the onset Si value decreases (Wang and Knopf, 2011). The increased ice activity at higher temperatures is considered in the INPC computation by selecting a contact angle of 24.5° (instead of 26.5° at 199 K). As can be seen, lower updraft amplitudes of 100–120 m are sufficient to initiate ice nucleation on smoke particles in the case of a higher cirrus-top temperature. Homogeneous ice nucleation again needs amplitudes of around 200 m before significant ice nucleation starts. The onset ice saturation ratios are and 1.349 for homogeneous and heterogeneous ice nucleation at 213 K, respectively.
4.4 Gravity wave amplitude impact on ice nucleation: summary
Figure 10 shows the impact of the updraft amplitude on the accumulated number of nucleated ice crystals. As can be seen, the number of totally nucleated ice crystals (ICNC) increases strongly with increasing updraft amplitude (for a given warm or cold-cirrus scenario as long as the amplitudes are small (Fig. 10). The ICNC is generally small (< 10 L−1) for relatively shallow updrafts. For updrafts with a large amplitude, the dependence of the ICNC on the amplitude size is low. In the case of large amplitudes and a correspondingly large height range with , strong ice nucleation and strong ice growth set in. Even a large increase in the amplitude will no longer lead to a strong ICNC increase.
As mentioned, according to the balloon observations of Podglajen et al. (2016) over Antarctica, shallow updrafts occur much more frequently than strong updrafts with relatively large amplitudes. Consequently, the observed ICNCs should be low in most cases, as ice nucleation mainly occurs during updrafts with a low amplitude. This aspect may explain why most of the observed MOSAiC ICNC values are low.
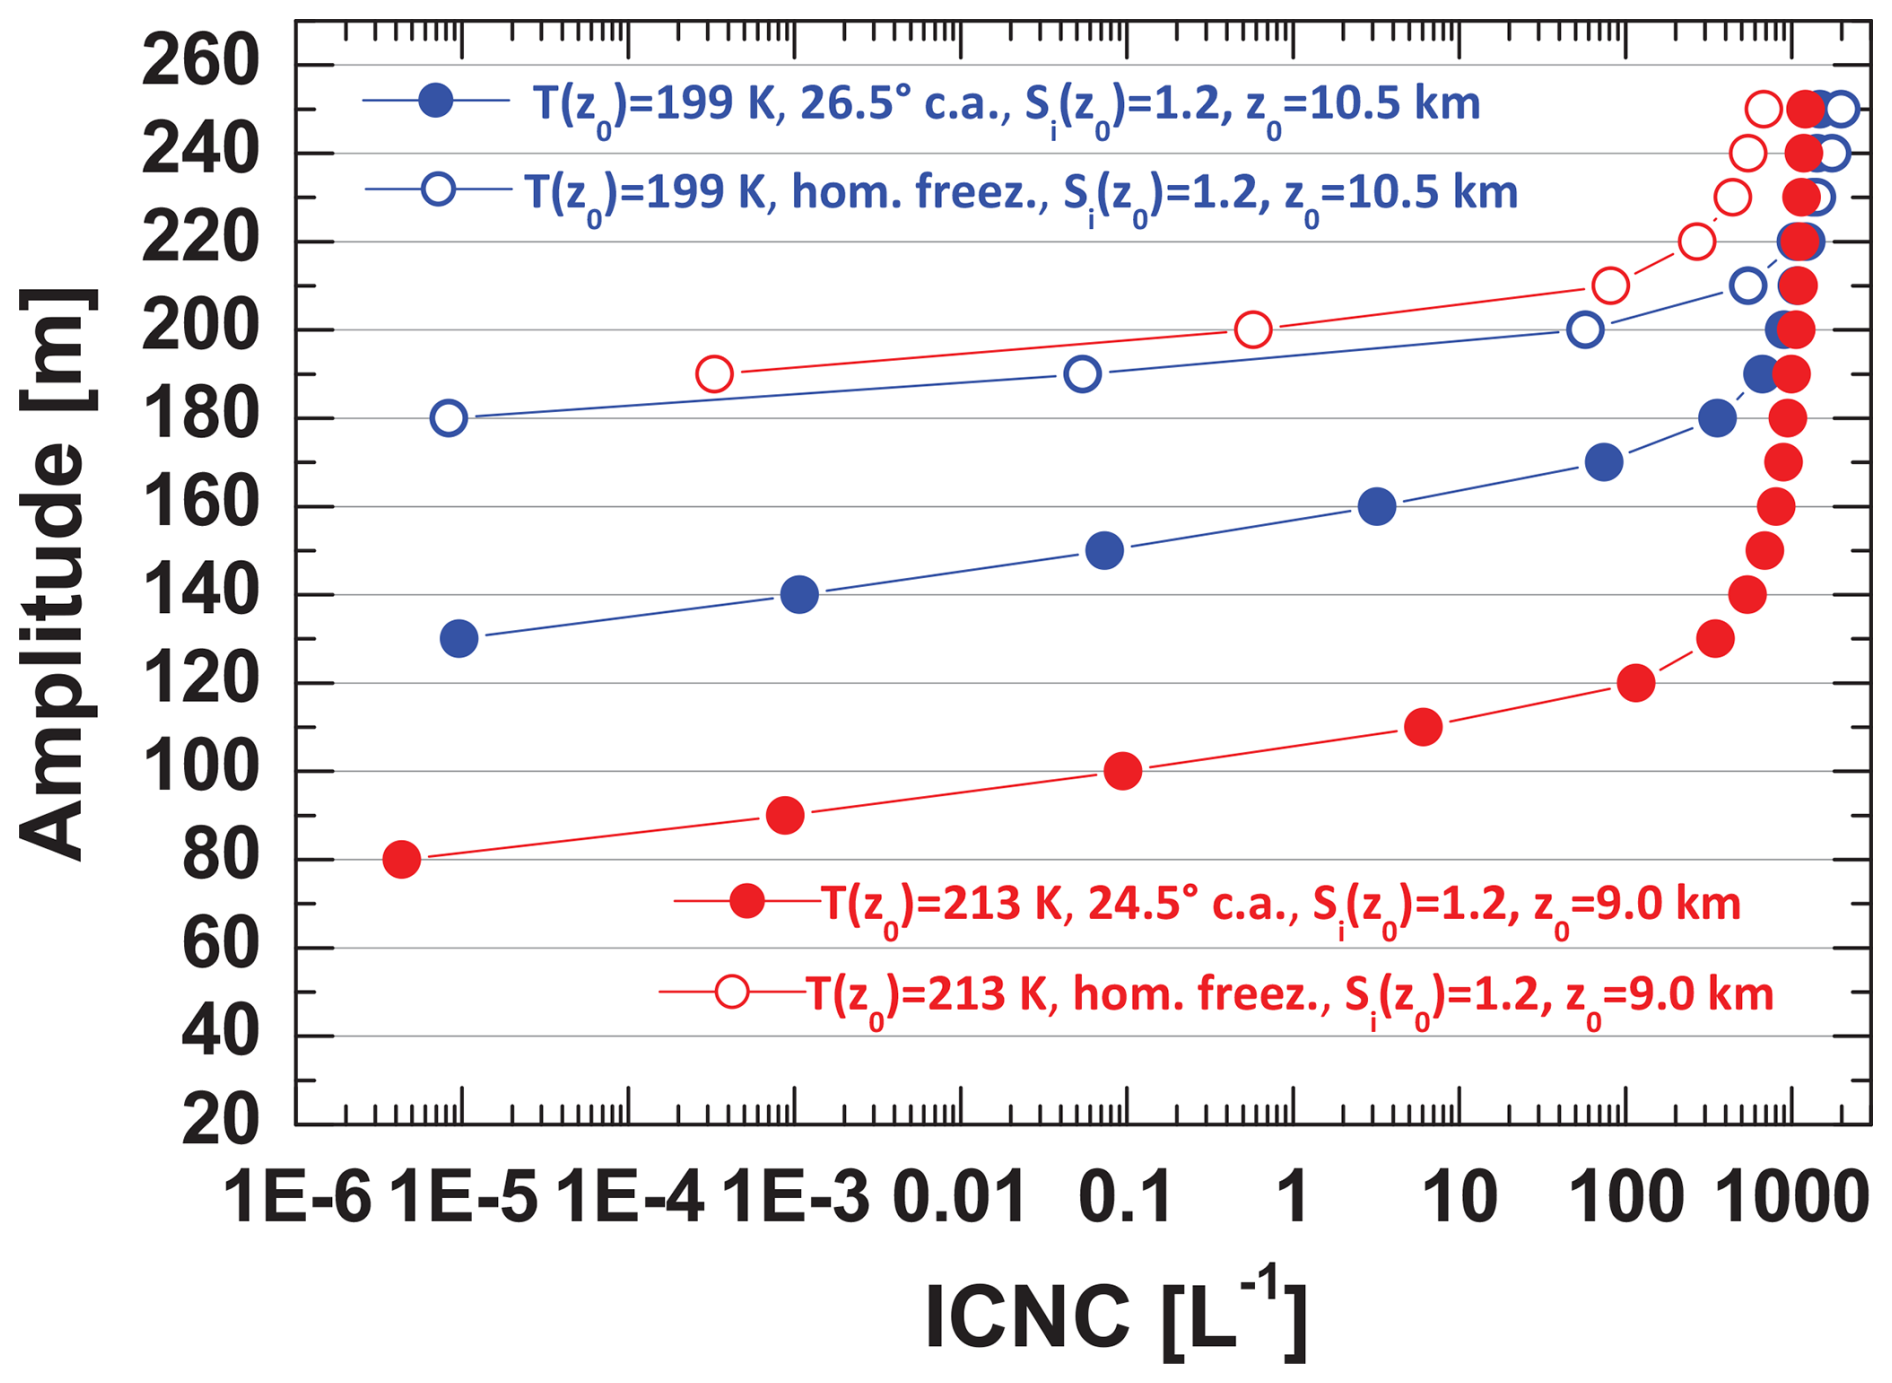
Figure 10Impact of the gravity wave amplitude on the overall sum of heterogeneously nucleated ice crystals (ICNC, solid circles) for cirrus-top temperatures of 199 K (in blue) and 213 K (in red). Homogeneous freezing scenarios (open circles) are shown for comparison. The mean updraft vertical velocity was set to 0.2 m s−1.
Podglajen et al. (2016) also found a strong decrease in the frequency of occurrence for the updraft vertical velocity with increasing updraft speed. Low vertical velocities occur much more frequently than high vertical velocities. As discussed in Sect. 4.1, the ICNC decreases with decreasing updraft mean vertical velocity. The findings of Podglajen et al. (2016) again point to the dominance of low ice crystal production; thus, all in all, it is not surprising that most of the measured ICNC values were low in the Arctic cirrus clouds.
When keeping the observations of typically low ICNCs of 1–50 L−1 in cirrus virga in mind as well as the fact that the smoke INP reservoir was always well filled (and refilled from above) during the entire 2019–2020 winter half year, it seems quite unrealistic to assume that homogeneous freezing significantly contributed to cirrus formation during the MOSAiC winter half year. Homogeneous freezing is only possible in clean air, i.e., under aerosol background conditions, so that the liquid sulfate particles of the background aerosol can start to freeze when the respective onset ice saturation ratio (Si,on) is reached and exceeded. Even if we assume a completely isolated air parcel (no exchange of aerosol particles or moisture with neighboring and polluted air parcels higher up), 10–50 short-term lofting events and respective heterogeneous ice nucleation events may be required before an initially smoke-filled air parcel is free of any smoke INPs and homogeneous ice nucleation can set in.
From Fig. 10 and the findings of Podglajen et al. (2016), we can further conclude that the conditions are always more favorable for heterogeneous ice nucleation than for homogeneous freezing. More opportunities for heterogeneous ice nucleation are given (because more shallow updrafts are available with amplitudes large enough to start ice nucleation) than for homogeneous ice nucleation, for which amplitudes of around 200 m are required before the onset ice saturation ratio is reached and ice nucleation can start.
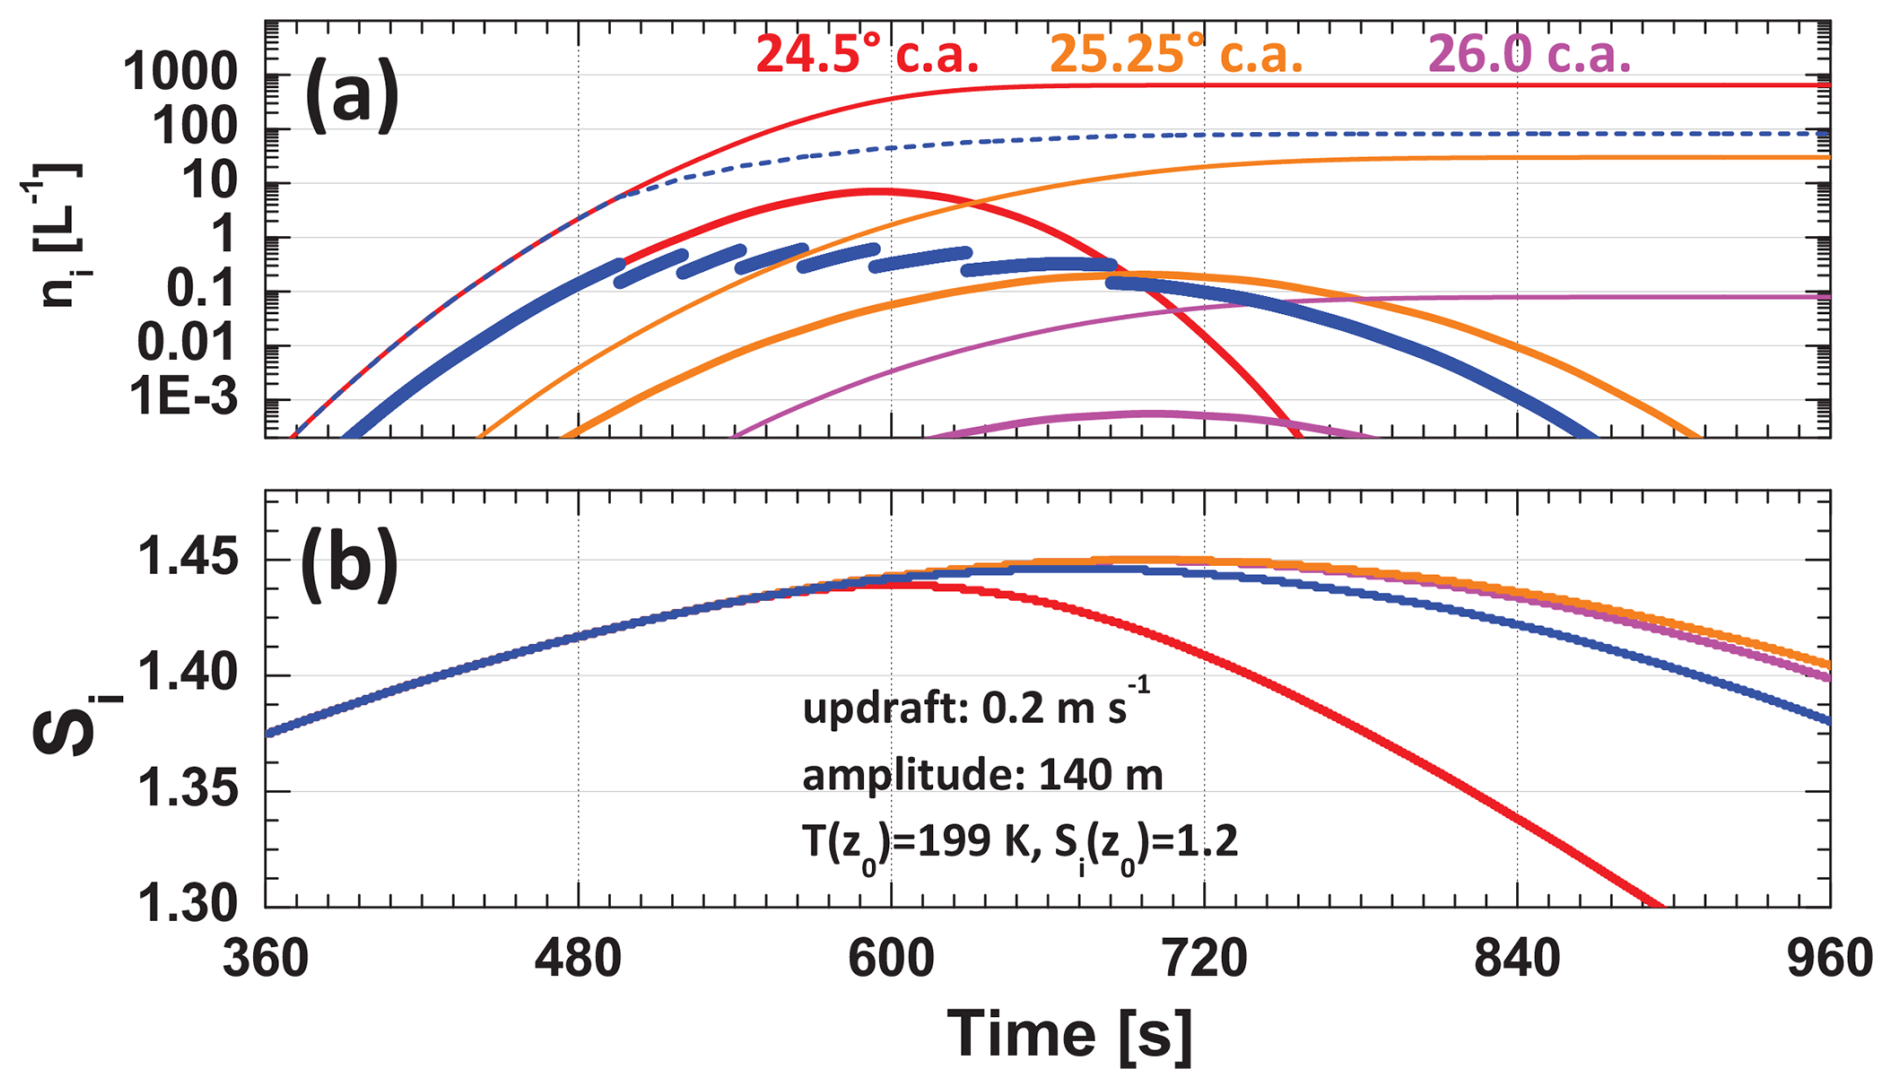
Figure 11Ice nucleation scenario with a smoke aerosol mixture of efficient to inefficient INPs characterized by a broad contact angle distribution. A Gaussian distribution of contact angles (representing different ice-active smoke particle fractions) is simulated. is given as thick blue line segments, whereas ∑ni is given as a dashed blue line in panel a). The cirrus-top temperature is 199 K, the updraft amplitude is 140 m, and the updraft mean vertical velocity is 0.2 m s−1. The corresponding Si curve (starting at 1.2 at z0) is shown as a thick blue line in panel (b). For comparison, the evolution of ni (thick lines in panel a), ∑ni (thin lines in panel a), and Si (in panel b) for scenarios with a single contact angle (c.a.) of 24.5° (red), 25.25° (orange), and 26.0° (magenta) for the entire smoke particle population is shown.
4.5 Ice nucleation in the case of an aerosol mixture of efficient and inefficient smoke INPs
The final simulations focus on the impact of a mixture of relatively efficient to very inefficient smoke INPs on ice nucleation. Similar simulations with a mixture of less efficient to efficient dust INPs were presented by Kärcher et al. (2022). The aged wildfire smoke observed over the North Pole region from October 2019 to May 2020 was emitted into the atmosphere over Siberia in July–August 2019. After 3–10 months of long-range transport, there may have been many fractions of organic aerosol particles with very different ice nucleation efficiencies, expressed by contact angles, e.g., from 24.5° (efficient INPs) to 29.5° (very inefficient INPs). To provide an impression of the ice activity of a complex aerosol mixture, we defined a Gaussian distribution of 50 different smoke INP fractions, characterized by 50 different contact angles from 24.5 to 29.5°. The Gaussian distribution was centered at the INP fraction with a contact angle of 27.0°. The contact angle half-width of the Gaussian distribution was 1.25°. The INP reservoir was set to n250=2000 L−1, as in the previous cases. By using this mixture, we compared the simulation runs with fixed, single contact angles of 24.5, 25.25, and 26.0° for all particles in the INP reservoir to the contact angle of the mixture. The results are shown in Fig. 11.
In the case of the aerosol mixture, the smoke fraction with the highest ice nucleation efficiency is activated first. When this INP reservoir for the most ice-active fraction (24.5° c.a.) is depleted, the next fraction (24.6° c.a.) becomes ice-active, and so on. Note again that the onset saturation ratio (Si,on) is lowest for 24.5° and increases as the contact angle increases. In the case of a wave amplitude of 140 m, only a few INP fractions become activated (contact angles from 24.5 to 25.2°). We can conclude that heterogeneous ice nucleation is widely controlled by the most efficient INPs and that the inefficient INPs may not be activated at all.
Based on a dense set of aerosol and cirrus observations in the central Arctic over a half year (Part 1; Ansmann et al., 2025) and accompanying ice nucleation simulations (Part 2), we have presented the first systematic study of the potential impact of wildfire smoke on cirrus formation. As the number of major wildfire events has been increasing in recent years and ground-based and spaceborne lidars have detected a strong increase in the frequency of occurrence of wildfire smoke in the UTLS height range since 2017, it is important to better understand the role of wildfire smoke in the atmospheric system in order to accurately consider wildfire smoke in atmospheric modeling and future climate research.
The observations in Part 1 (Ansmann et al., 2025) of this work have already provided a number of arguments supporting a strong impact of wildfire smoke on cirrus formation during the MOSAiC winter half year. We observed a persistent upper-tropospheric INP reservoir that was continuously refilled by a downward flux of smoke particles from the stratosphere. This virtually unlimited source of INPs is the cornerstone of our hypothesis that heterogeneous ice nucleation on smoke particles dominated and that homogeneous freezing processes were widely suppressed. In terms of optical properties, the particle light-extinction coefficient was enhanced by a factor of 20 (due to the presence of smoke) compared to pure background aerosol extinction coefficients. As an independent indication (complementary to the lidar and radar observations) of a strong impact of smoke on cirrus formation, the MOSAiC radiosondes, which ascended through extended cirrus fields, mainly measured maximum ice saturation ratios of 1.3–1.5. These maximum ice saturation ratios usually occurred in the uppermost part of the cirrus layers and point to heterogeneous ice nucleation initiated by inefficient INPs, as expected when glassy organic aerosol particles serve as INPs.
The simulation study in this paper complements the observations and confirms the hypothesis regarding a potentially strong impact of smoke on cirrus formation. Simulations allow a much deeper view into ice nucleation processes by considering ice nucleation, ice growth, heat release, and sedimentation. Furthermore, rather different scenarios with respect to air parcel lofting conditions can be studied based on simulations. For the first time, an INP reservoir was introduced in cirrus simulations by following the argumentation of Knopf et al. (2023a). The introduction of an INP reservoir also most suitably considers the fact that high levels of smoke pollution were permanently observed with lidar in the upper troposphere during the first 7.5 months of the MOSAiC expedition.
The simulations showed that PSAC values of about 10 ± 5 µm2 cm−3, as measured during MOSAiC, are high enough to initiate strong ice nucleation processes and to prevent homogeneous freezing. The simulations supported the hypothesis that ice nucleation is a strong function of the amplitude of short-term updraft events. The lower the amplitude, the lower the number of nucleated ice crystals. Together with the observations of Podglajen et al. (2016), who indicated that shallow updrafts with low amplitudes occur much more frequently than strong updrafts with large amplitudes, the simulations are in good agreement with the MOSAiC observations, which most frequently showed quite low ICNCs. In summary, we found many indications, from both observations and simulations, that support the hypothesis that wildfire smoke played a strong role in central Arctic cirrus formation processes in the winter of 2019–2020. However, even in the case of a highly polluted UTLS, we cannot completely rule out occasional situations in which smoke-free conditions were present in a number of air parcels after the consumption of all or almost all of the INPs (after many updraft events), meaning that homogeneous freezing processes could have started in these air parcels.
Disregarding the numerous arguments for a significant smoke impact on ice formation in the Arctic upper troposphere, a caveat of our study is that we do not know the exact deposition ice nucleation properties of wildfire smoke particles that aged over months of long-range transport in the upper troposphere and lower stratosphere. INP-related laboratory studies for this special particle type are not available. Therefore, we applied a deposition ice nucleation parameterization that reflects the characteristics of organic particles derived from laboratory studies (Wang and Knopf, 2011; Wang et al., 2012). These organic surrogate INPs possess a highly viscous (including solid) phase state and oxygenated functional groups, as would be expected for actual UTLS smoke particles (Knopf et al., 2018). It is unlikely that the ice nucleation efficiency of an organic smoke particle would be orders of magnitude different, as studies on organic particles serving as INPs have shown (Murray et al., 2010; Knopf et al., 2018; Wolf et al., 2020). Clearly, more research, including the collection of smoke particles and laboratory studies (e.g., Knopf et al., 2023b) as well as airborne in situ measurements (Cziczo et al., 2017), is required in this exciting field of atmospheric research.
As an outlook, we plan to extend our smoke–cirrus interaction studies. Within the framework of the DACAPO-PESO (Dynamics, Aerosol, Cloud and Precipitation Observations in the Pristine Environment of the Southern Ocean) campaign in Punta Arenas, southern Chile (Radenz et al., 2021), we continuously monitored smoke layers in the upper troposphere and the stratosphere in 2020 and 2021 that originated from the record-breaking bushfires in eastern Australia in December 2019 and January 2020 (Ohneiser et al., 2020, 2022). Many cirrus layers developed in the polluted upper troposphere over the southernmost tip of South America, in the usually rather clean atmosphere over the Southern Ocean. Thus, a unique lidar–radar data set is available to explore the impact of the Australian smoke (from the burning of eucalyptus trees) on midlatitude cirrus formation in the usually very clean Southern Hemisphere.
Polly lidar observations (level-0 data, measured signals) are available from the PollyNet database (Polly, 2024). All of the analysis products are available from TROPOS upon request (polly@tropos.de) and from https://doi.org/10.1594/PANGAEA.935539 (Ohneiser et al., 2021b). Cloud radar data were downloaded from the Cloudnet database at https://doi.org/10.60656/00945b67503743f0 (Engelmann et al., 2023). MOSAiC radiosonde data are available from https://doi.org/10.1594/PANGAEA.928656 (Maturilli et al., 2021, 2022). Products from synergistic lidar–radar studies and cirrus simulation results can be obtained from the corresponding author upon request.
The paper was written and designed by AA and DAK. The data analysis was performed by CJ, JR, JB, KO, and RE. AA developed the simulation model and produced the simulation results. All co-authors were actively involved in the extended discussions and the elaboration of the final design of the manuscript.
At least one of the (co-)authors is a member of the editorial board of Atmospheric Chemistry and Physics. The peer-review process was guided by an independent editor, and the authors also have no other competing interests to declare.
Publisher’s note: Copernicus Publications remains neutral with regard to jurisdictional claims made in the text, published maps, institutional affiliations, or any other geographical representation in this paper. While Copernicus Publications makes every effort to include appropriate place names, the final responsibility lies with the authors.
Data used in this article were produced as part of the international Multidisciplinary drifting Observatory for the Study of the Arctic Climate (MOSAiC) with the tag MOSAiC20192020 and the project ID AWI_PS122_00. The authors would like to thank everyone who contributed to the measurements used here (Nixdorf et al., 2021).
The Multidisciplinary drifting Observatory for the Study of the Arctic Climate (MOSAiC) program was supported by the German Federal Ministry for Education and Research (BMBF) via funding to the Alfred-Wegener-Institut Helmholtz-Zentrum für Polar- und Meeresforschung (AWI) and the Polarstern expedition PS122 (under grant no. N-2014-H-060_Dethloff). The lidar analysis on smoke–cirrus interaction was further supported by BMBF funding of the SCiAMO project (grant no. MOSAIC-FKZ 03F0915A). The radiosonde program was funded by the AWI awards AFMOSAiC-1_00 and AWI_PS122_00, the US Department of Energy Atmospheric Radiation Measurement Program, and the German Weather Service. This project has also received funding from the European Union's Horizon 2020 Research and Innovation program “ACTRIS-2 Integrating Activities” (H2020-INFRAIA-2014–2015, grant no. 654109) as well as from the European Union's Horizon Europe program (CleanCloud, grant no. 101137639). The authors gratefully acknowledge funding from the Deutsche Forschungsgemeinschaft (DFG, German Research Foundation) – project no. 268020496 – TRR 172, within the Transregional Collaborative Research Center “ArctiC Amplification: Climate Relevant Atmospheric and SurfaCe Processes, and Feedback Mechanisms (AC)3”. Daniel A. Knopf was supported by the US Department of Energy's Atmospheric System Research program, Office of Biological and Environmental Research (grant no. DE-SC0021034).
This paper was edited by Martina Krämer and reviewed by two anonymous referees.
Ansmann, A., Wandinger, U., Wiedensohler, A., and Leiterer, U.: Lindenberg Aerosol Characterization Experiment 1998 (LACE 98): Overview, J. Geophys. Res.-Atmos., 107, LAC 11-1–LAC 11-12, https://doi.org/10.1029/2000JD000233, 2002. a
Ansmann, A., Ohneiser, K., Mamouri, R.-E., Knopf, D. A., Veselovskii, I., Baars, H., Engelmann, R., Foth, A., Jimenez, C., Seifert, P., and Barja, B.: Tropospheric and stratospheric wildfire smoke profiling with lidar: mass, surface area, CCN, and INP retrieval, Atmos. Chem. Phys., 21, 9779–9807, https://doi.org/10.5194/acp-21-9779-2021, 2021. a, b, c, d, e, f
Ansmann, A., Ohneiser, K., Engelmann, R., Radenz, M., Griesche, H., Hofer, J., Althausen, D., Creamean, J. M., Boyer, M. C., Knopf, D. A., Dahlke, S., Maturilli, M., Gebauer, H., Bühl, J., Jimenez, C., Seifert, P., and Wandinger, U.: Annual cycle of aerosol properties over the central Arctic during MOSAiC 2019–2020 – light-extinction, CCN, and INP levels from the boundary layer to the tropopause, Atmos. Chem. Phys., 23, 12821–12849, https://doi.org/10.5194/acp-23-12821-2023, 2023. a, b, c, d
Ansmann, A., Veselovskii, I., Ohneiser, K., and Chudnovsky, A.: Comment on “Stratospheric Aerosol Composition Observed by the Atmospheric Chemistry Experiment Following the 2019 Raikoke Eruption” by Boone et al., J. Geophys. Res.-Atmos., 129, e2022JD038080, https://doi.org/10.1029/2022JD038080, 2024. a, b
Ansmann, A., Jimenez, C., Roschke, J., Bühl, J., Ohneiser, K., Engelmann, R., Radenz, M., Griesche, H., Hofer, J., Althausen, D., Knopf, D. A., Dahlke, S., Gaudek, T., Seifert, P., and Wandinger, U.: Impact of wildfire smoke on Arctic cirrus formation – Part 1: Analysis of MOSAiC 2019–2020 observations, Atmos. Chem. Phys., 25, 4847–4866, https://doi.org/10.5194/acp-25-4847-2025, 2025. a, b, c, d, e, f, g, h, i, j, k, l, m, n, o, p, q, r, s, t, u, v
Cziczo, D. J., Ladino, L., Boose, Y., Kanji, Z. A., Kupiszewski, P., Lance, S., Mertes, S., and Wex, H.: Measurements of Ice Nucleating Particles and Ice Residuals, Meteorol. Monogr., 58, 8.1–8.13, https://doi.org/10.1175/AMSMONOGRAPHS-D-16-0008.1, 2017. a
DeMott, P. J., Prenni, A. J., Liu, X., Kreidenweis, S. M., Petters, M. D., Twohy, C. H., Richardson, M. S., Eidhammer, T., and Rogers, D. C.: Predicting global atmospheric ice nuclei distributions and their impacts on climate, P. Natl. Acad. Sci. USA, 107, 11217–11222, https://doi.org/10.1073/pnas.0910818107, 2010. a
Engelmann, R., Althausen, D., Baars, H., Griesche, H., Hofer, J., Radenz, M., and Seifert, P.: Custom collection of categorize data from RV Polarstern between 11 Oct 2019 and 30 Sep 2020, ACTRIS Cloud remote sensing data centre unit (CLU) [data set], https://doi.org/10.60656/00945b67503743f0, 2023. a
Haag, W. and Kärcher, B.: The impact of aerosols and gravity waves on cirrus clouds at midlatitudes, J. Geophys. Res.-Atmos., 109, D12202, https://doi.org/10.1029/2004JD004579, 2004. a
Heymsfield, A. J., Krämer, M., Luebke, A., Brown, P., Cziczo, D. J., Franklin, C., Lawson, P., Lohmann, U., McFarquhar, G., Ulanowski, Z., and Tricht, K. V.: Cirrus Clouds, Meteorol. Monogr., 58, 2.1–2.26, https://doi.org/10.1175/AMSMONOGRAPHS-D-16-0010.1, 2017. a
Kanji, Z. A., Florea, O., and Abbatt, J. P. D.: Ice formation via deposition nucleation on mineral dust and organics: dependence of onset relative humidity on total particulate surface area, Environ. Res. Lett., 3, 025004, https://doi.org/10.1088/1748-9326/3/2/025004, 2008. a, b
Kärcher, B. and Lohmann, U.: A parameterization of cirrus cloud formation: Homogeneous freezing of supercooled aerosols, J. Geophys. Res.-Atmos., 107, AAC4-1–AAC4-10, https://doi.org/10.1029/2001JD000470, 2002. a, b
Kärcher, B. and Podglajen, A.: A Stochastic Representation of Temperature Fluctuations Induced by Mesoscale Gravity Waves, J. Geophys. Res.-Atmos., 124, 11506–11529, https://doi.org/10.1029/2019JD030680, 2019. a, b
Kärcher, B., Jensen, E. J., and Lohmann, U.: The Impact of Mesoscale Gravity Waves on Homogeneous Ice Nucleation in Cirrus Clouds, Geophys. Res. Lett., 46, 5556–5565, https://doi.org/10.1029/2019GL082437, 2019. a
Kärcher, B., DeMott, P. J., Jensen, E. J., and Harrington, J. Y.: Studies on the Competition Between Homogeneous and Heterogeneous Ice Nucleation in Cirrus Formation, J. Geophys. Res.-Atmos., 127, e2021JD035805, https://doi.org/10.1029/2021JD035805, 2022. a, b, c, d
Kärcher, B., Jensen, E. J., Pokrifka, G. F., and Harrington, J. Y.: Ice Supersaturation Variability in Cirrus Clouds: Role of Vertical Wind Speeds and Deposition Coefficients, J. Geophys. Res.-Atmos., 128, e2023JD039324, https://doi.org/10.1029/2023JD039324, 2023. a, b, c
Khvorostyanov, V. I. and Curry, J. A.: Fall Velocities of Hydrometeors in the Atmosphere: Refinements to a Continuous Analytical Power Law, J. Atmos. Sci., 62, 4343–4357, https://doi.org/10.1175/JAS3622.1, 2005. a
Knopf, D. A. and Alpert, P. A.: A water activity based model of heterogeneous ice nucleation kinetics for freezing of water and aqueous solution droplets, Farad. Discuss., 165, 513–534, https://doi.org/10.1039/c3fd00035d, 2013. a
Knopf, D. A. and Alpert, P. A.: Atmospheric ice nucleation, Nat. Rev. Phys., 5, 203–217, https://doi.org/10.1038/s42254-023-00570-7, 2023. a
Knopf, D. A. and Rigg, Y. J.: Homogeneous Ice Nucleation From Aqueous Inorganic/Organic Particles Representative of Biomass Burning: Water Activity, Freezing Temperatures, Nucleation Rates, The J. Phys. Chem. A, 115, 762–773, https://doi.org/10.1021/jp109171g, pMID: 21235213, 2011. a, b
Knopf, D. A., Alpert, P. A., and Wang, B.: The role of organic aerosol in atmospheric ice nucleation: a review, ACS Earth Space Chem., 2, 168–202, https://doi.org/10.1021/acsearthspacechem.7b00120, 2018. a, b, c
Knopf, D. A., Silber, I., Riemer, N., Fridlind, A. M., and Ackerman, A. S.: A 1D Model for Nucleation of Ice From Aerosol Particles: An Application to a Mixed-Phase Arctic Stratus Cloud Layer, J. Adv. Model. Earth Syst., 15, e2023MS003663, https://doi.org/10.1029/2023MS003663, 2023a. a, b, c, d, e
Knopf, D. A., Wang, P., Wong, B., Tomlin, J. M., Veghte, D. P., Lata, N. N., China, S., Laskin, A., Moffet, R. C., Aller, J. Y., Marcus, M. A., and Wang, J.: Physicochemical characterization of free troposphere and marine boundary layer ice-nucleating particles collected by aircraft in the eastern North Atlantic, Atmos. Chem. Phys., 23, 8659–8681, https://doi.org/10.5194/acp-23-8659-2023, 2023b. a
Koop, T. and Zobrist, B.: Parameterizations for ice nucleation in biological and atmospheric systems, Phys. Chem. Chem. Phys., 11, 10839–10850, https://doi.org/10.1039/B914289D, 2009. a
Koop, T., Luo, B. P., Tsias, A., and Peter, T.: Water activity as the determinant for homogeneous ice nucleation in aqueous solutions, Nature, 406, 611–614, https://doi.org/10.1038/35020537, 2000. a, b
Krämer, M., Rolf, C., Luebke, A., Afchine, A., Spelten, N., Costa, A., Meyer, J., Zöger, M., Smith, J., Herman, R. L., Buchholz, B., Ebert, V., Baumgardner, D., Borrmann, S., Klingebiel, M., and Avallone, L.: A microphysics guide to cirrus clouds – Part 1: Cirrus types, Atmos. Chem. Phys., 16, 3463–3483, https://doi.org/10.5194/acp-16-3463-2016, 2016. a, b, c
Kuebbeler, M., Lohmann, U., Hendricks, J., and Kärcher, B.: Dust ice nuclei effects on cirrus clouds, Atmos. Chem. Phys., 14, 3027–3046, https://doi.org/10.5194/acp-14-3027-2014, 2014. a
Lohmann, U., Lüönd, F., and Mahrt, F.: An Introduction to Clouds: From the Microscale to Climate, Cambridge University Press, https://doi.org/10.1017/CBO9781139087513, 2016. a, b, c
Maturilli, M., Holdridge, D. J., Dahlke, S., Graeser, J., Sommerfeld, A., Jaiser, R., Deckelmann, H., and Schulz, A.: Initial radiosonde data from 2019-10 to 2020-09 during project MOSAiC, PANGAEA [data set], https://doi.org/10.1594/PANGAEA.928656, 2021. a
Maturilli, M., Sommer, M., Holdridge, D. J., Dahlke, S., Graeser, J., Sommerfeld, A., Jaiser, R., Deckelmann, H., and Schulz, A.: MOSAiC radiosonde data (level 3) [dataset publication series], Pangaea, https://doi.org/10.1594/PANGAEA.943870, 2022. a, b
Murray, B. J., Wilson, T. W., Dobbie, S., and Cui, Z.: Heterogeneous nucleation of ice particles on glassy aerosols under cirrus conditions, Nat. Geosci., 3, 233–237, https://doi.org/10.1038/ngeo817, 2010. a
Nixdorf, U., Dethloff, K., Rex, M., Shupe, M., Sommerfeld, A., Perovich, D., Nicolaus, M., Heuzé, C., Rabe, B., Loose, B., Damm, E., Gradinger, R., Fong., A, Maslowski, W., Rinke, A., Kwok, R., Spreen, G., Wendisch, M., Herber, A., Hirsekorn, M., Mohaupt, V., Frickenhaus, S., Immerz, A., Weiss-Tuider, K., König, B., Mengedoht, D., Regnery, J., Gerchow, P., Ransby, D., Krumpen, T., Morgenstern, A., Haas, C., Kanzow, T., Rack, F. R., Saitzev, V., Sokolov, V., Makarov, A., Schwarze, S., Wunderlich, T., Wurr, K., and Boetius, A.: MOSAiC extended acknowledgement, Zenodo, https://doi.org/10.5281/zenodo.5179738, 2021. a
Ohneiser, K., Ansmann, A., Baars, H., Seifert, P., Barja, B., Jimenez, C., Radenz, M., Teisseire, A., Floutsi, A., Haarig, M., Foth, A., Chudnovsky, A., Engelmann, R., Zamorano, F., Bühl, J., and Wandinger, U.: Smoke of extreme Australian bushfires observed in the stratosphere over Punta Arenas, Chile, in January 2020: optical thickness, lidar ratios, and depolarization ratios at 355 and 532 nm, Atmos. Chem. Phys., 20, 8003–8015, https://doi.org/10.5194/acp-20-8003-2020, 2020. a
Ohneiser, K., Ansmann, A., Chudnovsky, A., Engelmann, R., Ritter, C., Veselovskii, I., Baars, H., Gebauer, H., Griesche, H., Radenz, M., Hofer, J., Althausen, D., Dahlke, S., and Maturilli, M.: The unexpected smoke layer in the High Arctic winter stratosphere during MOSAiC 2019–2020, Atmos. Chem. Phys., 21, 15783–15808, https://doi.org/10.5194/acp-21-15783-2021, 2021a. a, b, c, d
Ohneiser, K., Ansmann, A., Engelmann, R., Griesche, H., Radenz, M., Hofer, J., and Althausen, D.: Optical aerosol profiles from the Raman Lidar Polly-XT during MOSAiC, Pangaea [data set], https://doi.org/10.1594/PANGAEA.935539, 2021b. a
Ohneiser, K., Ansmann, A., Kaifler, B., Chudnovsky, A., Barja, B., Knopf, D. A., Kaifler, N., Baars, H., Seifert, P., Villanueva, D., Jimenez, C., Radenz, M., Engelmann, R., Veselovskii, I., and Zamorano, F.: Australian wildfire smoke in the stratosphere: the decay phase in 2020/2021 and impact on ozone depletion, Atmos. Chem. Phys., 22, 7417–7442, https://doi.org/10.5194/acp-22-7417-2022, 2022. a
Podglajen, A., Hertzog, A., Plougonven, R., and Legras, B.: Lagrangian temperature and vertical velocity fluctuations due to gravity waves in the lower stratosphere, Geophys. Res. Lett., 43, 3543–3553, https://doi.org/10.1002/2016GL068148, 2016. a, b, c, d, e, f, g, h, i, j, k
Polly: PollyNET lidar data base, available at: http://polly.tropos.de/ (last access: 10 January 2024), 2024. a
Radenz, M., Bühl, J., Seifert, P., Baars, H., Engelmann, R., Barja González, B., Mamouri, R.-E., Zamorano, F., and Ansmann, A.: Hemispheric contrasts in ice formation in stratiform mixed-phase clouds: disentangling the role of aerosol and dynamics with ground-based remote sensing, Atmos. Chem. Phys., 21, 17969–17994, https://doi.org/10.5194/acp-21-17969-2021, 2021. a
Riechers, B., Wittbracht, F., Hütten, A., and Koop, T.: The homogeneous ice nucleation rate of water droplets produced in a microfluidic device and the role of temperature uncertainty, Phys. Chem. Chem. Phys., 15, 5873–5887, https://doi.org/10.1039/C3CP42437E, 2013. a
Rigg, Y. J., Alpert, P. A., and Knopf, D. A.: Immersion freezing of water and aqueous ammonium sulfate droplets initiated by humic-like substances as a function of water activity, Atmos. Chem. Phys., 13, 6603–6622, https://doi.org/10.5194/acp-13-6603-2013, 2013. a
Rolf, C., Krämer, M., Schiller, C., Hildebrandt, M., and Riese, M.: Lidar observation and model simulation of a volcanic-ash-induced cirrus cloud during the Eyjafjallajökull eruption, Atmos. Chem. Phys., 12, 10281–10294, https://doi.org/10.5194/acp-12-10281-2012, 2012. a
Schneider, J., Höhler, K., Wagner, R., Saathoff, H., Schnaiter, M., Schorr, T., Steinke, I., Benz, S., Baumgartner, M., Rolf, C., Krämer, M., Leisner, T., and Möhler, O.: High homogeneous freezing onsets of sulfuric acid aerosol at cirrus temperatures, Atmos. Chem. Phys., 21, 14403–14425, https://doi.org/10.5194/acp-21-14403-2021, 2021. a
Schröder, F., Kärcher, B., Fiebig, M., and Petzold, A.: Aerosol states in the free troposphere at northern midlatitudes, J. Geophys. Res.-Atmos., 107, LAC8-1–LAC8-8, https://doi.org/10.1029/2000JD000194, 2002. a
Shupe, M. D., Rex, M., Blomquist, B., Ola, P., Persson, G., Schmale, J., Uttal, T., Althausen, D., Angot, H., Archer, S., Bariteau, L., Beck, I., Bilberry, J., Bucci, S., Buck, C., Boyer, M., Brasseur, Z., Brooks, I. M., Calmer, R., Cassano, J., Castro, V., Chu, D., Costa, D., Cox, C. J., Creamean, J., Crewell, S., Dahlke, S., Damm, E., de Boer, G., Deckelmann, H., Dethloff, K., Dütsch, M., Ebell, K., Ehrlich, A., Ellis, J., Engelmann, R., Fong, A. A., Frey, M. M., Gallagher, M. R., Ganzeveld, L., Gradinger, R., Graeser, J., Greenamyer, V., Griesche, H., Griffiths, S., Hamilton, J., Heinemann, G., Helmig, D., Herber, A., Heuzé, C., Hofer, J., Houchens, T., Howard, D., Inoue, J., Jacobi, H.-W., Jaiser, R., Jokinen, T., Jourdan, O., Jozef, G., King, W., Kirchgaessner, A., Klingebiel, M., Krassovski, M., Krumpen, T., Lampert, A., Landing, W., Laurila, T., Lawrence, D., Lonardi, M., Loose, B., Lüpkes, C., Maahn, M., Macke, A., Maslowski, W., Marsay, C., Maturilli, M., Mech, M., Morris, S., Moser, M., Nicolaus, M., Ortega, P., Osborn, J., Pätzold, F., Perovich, D. K., Petäjä, T., Pilz, C., Pirazzini, R., Posman, K., Powers, H., Pratt, K. A., Preußer, A., Quéléver, L., Radenz, M., Rabe, B., Rinke, A., Sachs, T., Schulz, A., Siebert, H., Silva, T., Solomon, A., Sommerfeld, A., Spreen, G., Stephens, M., Stohl, A., Svensson, G., Uin, J., Viegas, J., Voigt, C., von der Gathen, P., Wehner, B., Welker, J. M., Wendisch, M., Werner, M., Xie, Z., and Yue, F.: Overview of the MOSAiC expedition: Atmosphere, Elementa: Sci. Anthrop., 10, 00060, https://doi.org/10.1525/elementa.2021.00060, 2022. a
Skrotzki, J., Connolly, P., Schnaiter, M., Saathoff, H., Möhler, O., Wagner, R., Niemand, M., Ebert, V., and Leisner, T.: The accommodation coefficient of water molecules on ice – cirrus cloud studies at the AIDA simulation chamber, Atmos. Chem. Phys., 13, 4451–4466, https://doi.org/10.5194/acp-13-4451-2013, 2013. a, b, c, d, e, f
Spichtinger, P. and Cziczo, D. J.: Impact of heterogeneous ice nuclei on homogeneous freezing events in cirrus clouds, J. Geophys. Res.-Atmos., 115, D14208, https://doi.org/10.1029/2009JD012168, 2010. a, b, c
Spichtinger, P. and Gierens, K. M.: Modelling of cirrus clouds – Part 1a: Model description and validation, Atmos. Chem. Phys., 9, 685–706, https://doi.org/10.5194/acp-9-685-2009, 2009. a
Spichtinger, P., Gierens, K., and Dörnbrack, A.: Formation of ice supersaturation by mesoscale gravity waves, Atmos. Chem. Phys., 5, 1243–1255, https://doi.org/10.5194/acp-5-1243-2005, 2005. a
Spichtinger, P., Marschalik, P., and Baumgartner, M.: Impact of formulations of the homogeneous nucleation rate on ice nucleation events in cirrus, Atmos. Chem. Phys., 23, 2035–2060, https://doi.org/10.5194/acp-23-2035-2023, 2023. a, b, c
Wang, B. and Knopf, D. A.: Heterogeneous ice nucleation on particles composed of humic-like substances impacted by O3, J. Geophys. Res.-Atmos., 116, D03205, https://doi.org/10.1029/2010JD014964, 2011. a, b, c, d, e, f, g, h
Wang, B., Lambe, A. T., Massoli, P., Onasch, T. B., Davidovits, P., Worsnop, D. R., and Knopf, D. A.: The deposition ice nucleation and immersion freezing potential of amorphous secondary organic aerosol: Pathways for ice and mixed-phase cloud formation, J. Geophys. Res.-Atmos., 117, D16206, https://doi.org/10.1029/2012JD018063, 2012. a, b
Westbrook, C. D., Hogan, R. J., and Illingworth, A. J.: The Capacitance of Pristine Ice Crystals and Aggregate Snowflakes, J. Atmos. Sci., 65, 206–219, https://doi.org/10.1175/2007JAS2315.1, 2008. a
Wolf, M., Zhang, Y., Zawadowicz, M., Goodell, M., Froyd, K., Freney, E., Sellegri, K., Rösch, M., Cui, T., Winter, M., Lacher, L., Axisa, D., Axisa, D., DeMott, P. J., Levin, E., T., J., Gute, E., Abbatt, J., Koss, A., Kroll, J. H., Surratt, J. D., and Cziczo, D. J.: A biogenic secondary organic aerosol source of cirrus ice nucleating particles, Nat. Commun., 11, 4834, https://doi.org/10.1038/s41467-020-18424-6, 2020. a