the Creative Commons Attribution 4.0 License.
the Creative Commons Attribution 4.0 License.
 | 09 May 2025
Impact of wildfire smoke on Arctic cirrus formation – Part 1: Analysis of MOSAiC 2019–2020 observations
Cristofer Jimenez
Johanna Roschke
Johannes Bühl
Kevin Ohneiser
Ronny Engelmann
Martin Radenz
Hannes Griesche
Julian Hofer
Dietrich Althausen
Daniel A. Knopf
Sandro Dahlke
Tom Gaudek
Patric Seifert
Ulla Wandinger
The potential impact of wildfire smoke on Arctic cirrus formation is discussed based on lidar and radar observations during the winter half year of the 1-year MOSAiC (Multidisciplinary drifting Observatory for the Study of Arctic Climate) expedition. Aerosol and ice cloud observations were performed aboard the icebreaker Polarstern at latitudes > 85° N. Aged Siberian wildfire smoke polluted the tropopause region over the central Arctic during the entire winter half year of 2019–2020. The smoke particle surface area concentration at the tropopause was of the order of 5–15 µm2 cm−3 and indicated considerably enhanced levels of aerosol pollution for more than 6 months. Numerous cirrus systems with cloud-top temperatures between −60 and −75 °C developed in the polluted upper troposphere. We analyzed all MOSAiC winter cirrus layers with respect to their geometrical and optical properties and a subgroup of 20 cirrus events with respect to their ice water content (IWC) and ice crystal number concentration (ICNC). In individual ice fallstreaks that are connected to individual ice nucleation events, ICNCs typically ranged from 1 to 10 crystals L−1 but were frequently also as high as 20–50 L−1; however, observations > 100 L−1 were rare. Three observational facts corroborate our hypothesis that smoke significantly influenced Arctic cirrus formation: (1) the occurrence of a long-lasting, persistent smoke pollution layer in the upper troposphere so that favorable conditions for heterogeneous ice nucleation on smoke particles were always given and, at the same time, homogeneous freezing of background aerosol was probably widely suppressed; (2) the high smoke particle surface area concentrations, which were high enough to significantly trigger ice nucleation on smoke particles (as shown in Part 2, the companion paper to this article; Ansmann et al., 2025); and (3) the frequently found maximum cirrus ice saturation ratios of 1.3–1.5, which point to the dominance of heterogeneous ice nucleation processes, initiated by inefficient ice-nucleating particles (INPs), as expected when aged smoke particles (i.e., organic aerosol particles) serve as INPs. The studies are continued in the simulation portion of this work (Part 2; Ansmann et al., 2025).
- Article
(10363 KB) - Full-text XML
- Companion paper
- BibTeX
- EndNote


A significant increase in the occurrence frequency of wildfire smoke layers in the upper troposphere–lower stratosphere (UTLS) region has been observed in the Northern Hemisphere since 2017 (Baars et al., 2019; Ohneiser et al., 2021a; Kloss et al., 2019; Trickl et al., 2024). The increase may be linked to climate change (Jolly et al., 2015; Abatzoglou et al., 2019; Kirchmeier-Young et al., 2019; Cunningham et al., 2024). In order to adequately consider smoke particles in atmospheric modeling, the role of wildfire smoke in the climate system and respective impact pathways need to be explored in detail. A relevant, climate-sensitive pathway is ice formation in the upper troposphere. Two ice nucleation modes have to be distinguished: heterogeneous ice nucleation on the solid surfaces of ice-nucleating particles (INPs), such as glassy smoke particles, and homogeneous ice nucleation of liquid background aerosol particles, such as sulfate particles. Heterogeneous ice nucleation starts at lower ice saturation ratios than homogeneous freezing. The different nucleation modes may lead to different cirrus properties (crystal size and number concentration) and, thus, may influence the radiation field and seeder–feeder and precipitation features in the troposphere in different ways (DeMott et al., 2010). Therefore, aerosol conditions, including wildfire smoke and long-range transport of the pollution, must be well considered in cloud formation parameterizations in regional and global models to allow more accurate weather and climate predictions (Lohmann and Neubauer, 2018; Beer et al., 2022, 2024).
Clear evidence for the ability of aged wildfire smoke particles (organic particles) to initiate heterogeneous ice nucleation was recently provided by Mamouri et al. (2023). Heterogeneous ice nucleation in Californian wildfire smoke was observed with lidar in the upper troposphere over the eastern Mediterranean in October 2020. During the 1-year MOSAiC (Multidisciplinary drifting Observatory for the Study of Arctic Climate) expedition (Shupe et al., 2022), we also observed a large number of cirrus systems developing in the wildfire-smoke-polluted upper troposphere over the central Arctic. A first MOSAiC case study of smoke–cirrus interaction was presented by Engelmann et al. (2021). The wildfire smoke originated from record-breaking forest fires in central and eastern Siberia in the summer of 2019 (Ohneiser et al., 2021a; Ansmann et al., 2024). The aerosol pollution spread all over the Arctic in August 2019 (Xian et al., 2022a, b) and even reached the lower stratosphere, where the aerosol particles probably contributed to polar ozone depletion in the spring of 2020 (Ohneiser et al., 2021a; Voosen, 2021; Ansmann et al., 2022). The UTLS wildfire smoke layer was observable until May 2020 at high northern latitudes.
In this paper, which is Part 1 of a series of two articles, we present an extended analysis of the entire MOSAiC cirrus data set. The goal of our MOSAiC cirrus studies is to provide observational evidence that aged wildfire smoke (organic aerosol particles) significantly influenced cirrus formation in the central Arctic during the winter half year of 2019–2020. The aim of the simulations, presented in Part 2 (Ansmann et al., 2025), is to gain a detailed insight into the ability of smoke particles to cause ice nucleation under the observed meteorological and environmental conditions (temperature, relative humidity, updraft speed and amplitude, and smoke INP number concentration). The vertical movements, required to initiate ice nucleation, may be caused by factors such as gravity wave activity (Haag and Kärcher, 2004; Spichtinger et al., 2005; Podglajen et al., 2016; Kärcher and Podglajen, 2019; Kärcher et al., 2019). For the first time, observations of aerosol and cirrus properties are closely combined with comprehensive modeling of cirrus evolution processes to explore smoke–cirrus interaction. Similar studies based on the combination of observations and simulations were conducted after the Eyjafjallajökull eruption in 2010 to investigate the impact of fresh volcanic ash on cirrus formation (Seifert et al., 2011; Rolf et al., 2012).
The MOSAiC smoke and cirrus observations were performed with lidar and radar instruments (Engelmann et al., 2021) aboard the German research ice breaker Polarstern (Knust, 2017). The Polarstern was trapped in the pack ice and drifted through the Arctic Ocean from 4 October 2019 to 16 May 2020, mostly at latitudes > 85° N. The remote-sensing instruments were continuously operated (around the clock) side by side to collect tropospheric and stratospheric aerosol and cloud profile data up to 30 km height throughout the entire expedition period. Accompanying radiosondes, launched every 6 h, provided dense sets of observations of the atmospheric state in terms of temperature, relative humidity, and wind profiles (Maturilli et al., 2021, 2022).
Smoke particles (or, more generally, organic aerosol particles) seem to be rather inefficient INPs (Knopf et al., 2018; Knopf and Alpert, 2023). However, they can influence ice nucleation in very different ways. If the particles are in a glassy state, they can act as INPs in deposition ice nucleation (DIN) processes (Murray et al., 2010; Wang and Knopf, 2011; Wang et al., 2012). DIN is defined as ice formation occurring on the INP surface by water vapor deposition from the supersaturated gas phase. When the smoke particles can take up water and a liquid surface around the particles develops, immersion freezing can proceed (Wang et al., 2012; Knopf and Alpert, 2013; Knopf et al., 2018). According to classical nucleation theory and observations, DIN INPs are expected to be more efficient in warm cirrus with cloud-top temperatures around −50 °C than in cold cirrus with top temperatures of −70 °C (Trainer et al., 2009; Pruppacher and Klett, 2010; Alpert et al., 2011; Wang and Knopf, 2011; Wang et al., 2012; Primm et al., 2017). The ice nucleation onset ice saturation ratio (Si,on) decreases with increasing temperature. Strong, burst-like ice nucleation sets in when the ice saturation ratio (Si) > Si,on and is terminated by ice crystal growth which leads to Si < Si,on, again within a short time period. Theses ice nucleation processes are discussed in the simulation study (Part 2; Ansmann et al., 2025). Because of the complex chemical, microphysical, and morphological properties of aged fire smoke particles, the development of smoke INP parameterization schemes is generally a crucial task (Knopf et al., 2018).
The particles and released vapors in biomass-burning plumes undergo chemical and physical aging processes on their way up to the tropopause and during long-range transport in the UTLS over weeks and months. These aging processes change the chemical composition of the smoke particles, their morphological characteristics (size, shape, and internal structure), and the internal mixing state of the smoke particles. After finalizing the aging process, the smoke particle may show a core–shell structure with a black-carbon-containing core and an organic-carbon-rich shell, and the ability to serve as an INP mainly depends on the material in the shell and, thus, on the organic material of the particles. Biomass-burning particles also contain humic-like substances which represent large macromolecules that could serve as INPs at low temperatures of −50 to −70 °C (Kanji et al., 2008; Wang and Knopf, 2011; Wang et al., 2012; Knopf et al., 2018). Jahn et al. (2020) and Jahl et al. (2021) hypothesized that aged smoke particles contain minerals and that these components may determine the smoke INP efficacy.
This article is organized as follows. In Sect. 2, the field campaign, the instrumentation used, and the applied lidar and radar data analysis methods are outlined. The key findings of our MOSAiC cirrus studies, which include a cirrus statistical analysis and discussions of case studies, based on the observed smoke and cirrus optical and microphysical properties, are presented in Sect. 3. Section 4 provides a summary and concluding remarks.
The MOSAiC expedition began at the end of September 2019 and lasted until the beginning of October 2020. In this article, we focus on the cirrus observations during the winter half year from the beginning of October 2019 to end of March 2020. Figure 1 shows the track of the drifting Polarstern from 1 October 2019 to 1 April 2020. Each of the red circles along the Polarstern track indicates the beginning of a new month. Most of the time, the observations were performed between 85 and 88.5° N during the first 6 months of the MOSAiC campaign.
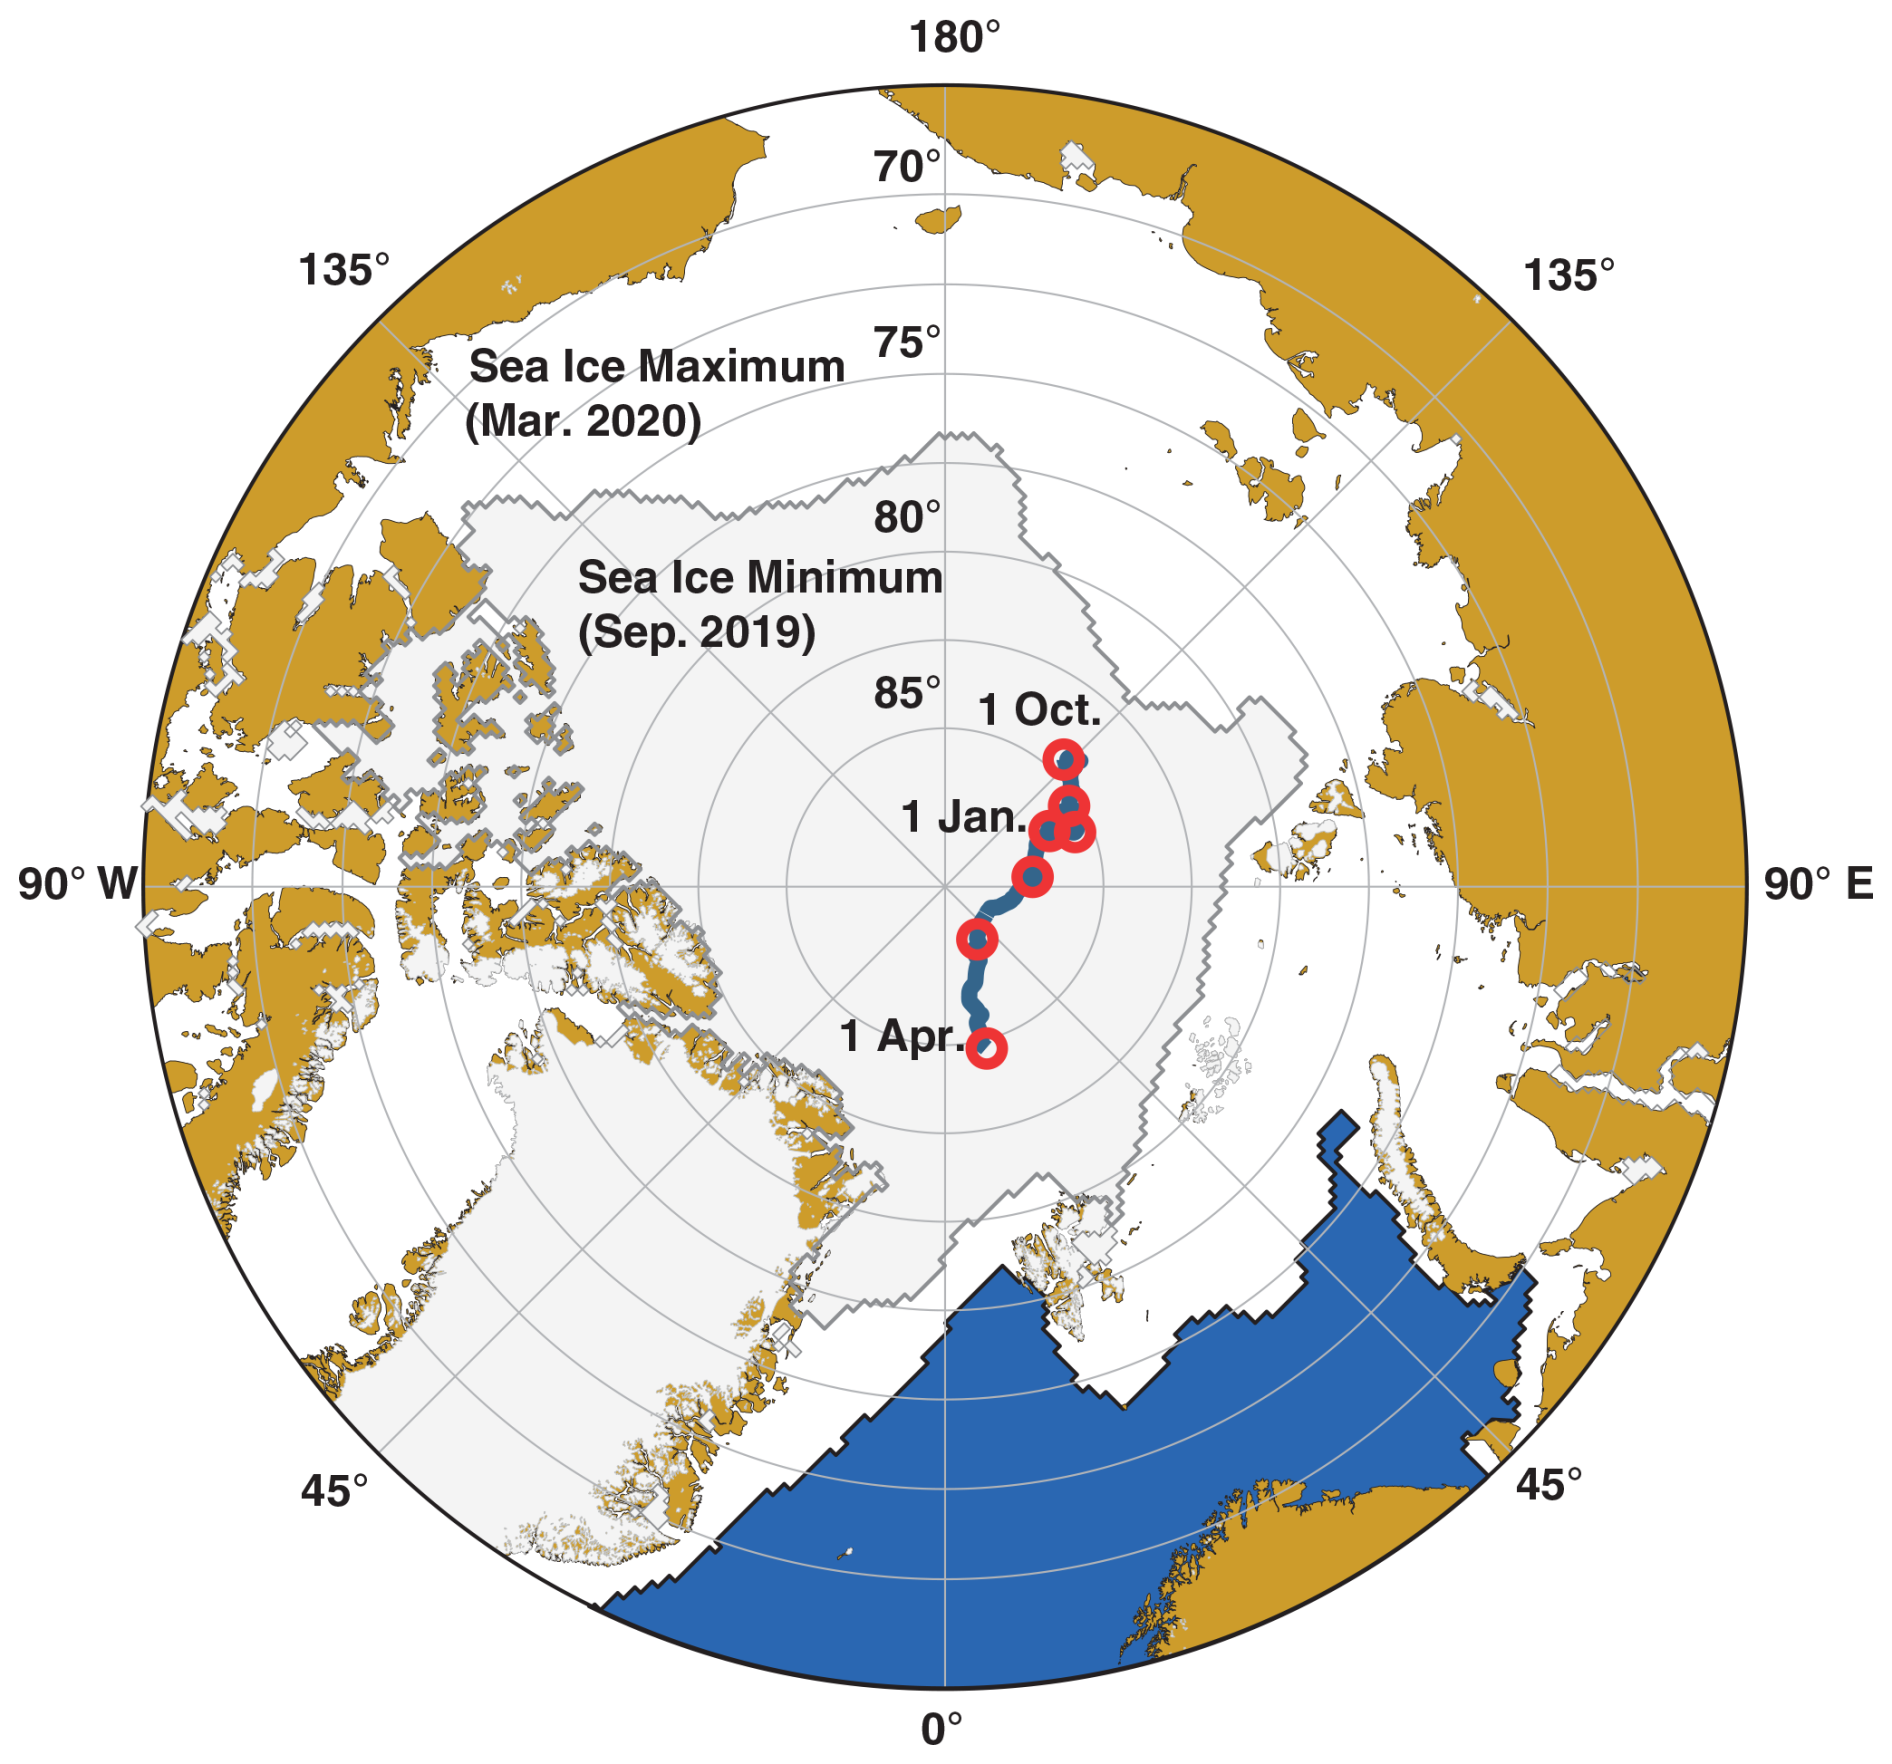
Figure 1Drifting route of the ice breaker Polarstern from 1 October 2019 to 1 April 2020. Each of the seven red circles marks the beginning of the next month. The map was produced with “ggOceanMaps” (Vihtakari, 2020) using Sea Ice Index Version 3 data (Fetterer et al., 2017).
The remote-sensing instrumentation aboard Polarstern mainly consisted of the Atmospheric Radiation Measurement (ARM) mobile facility 1 (AMF-1) of the US Department of Energy (http://www.arm.gov, last access: 22 January 2024) and the OCEANET-Atmosphere container of the Leibniz Institute for Tropospheric Research (TROPOS) (Engelmann et al., 2016). These containers were deployed on the bow (front deck) of the Polarstern. Photographs of the main ship-based MOSAiC atmospheric measurement platforms aboard Polarstern are shown in Fig. 3 in Shupe et al. (2022) and Fig. 2 in Engelmann et al. (2021).
Two lidars transmitting laser beams at 532 nm (visible green light) into the atmosphere were operated continuously aboard Polarstern throughout the 1-year expedition. Figure 2 shows the two beams above Polarstern. The picture was taken with a drone overflying Polarstern on 31 October 2019.
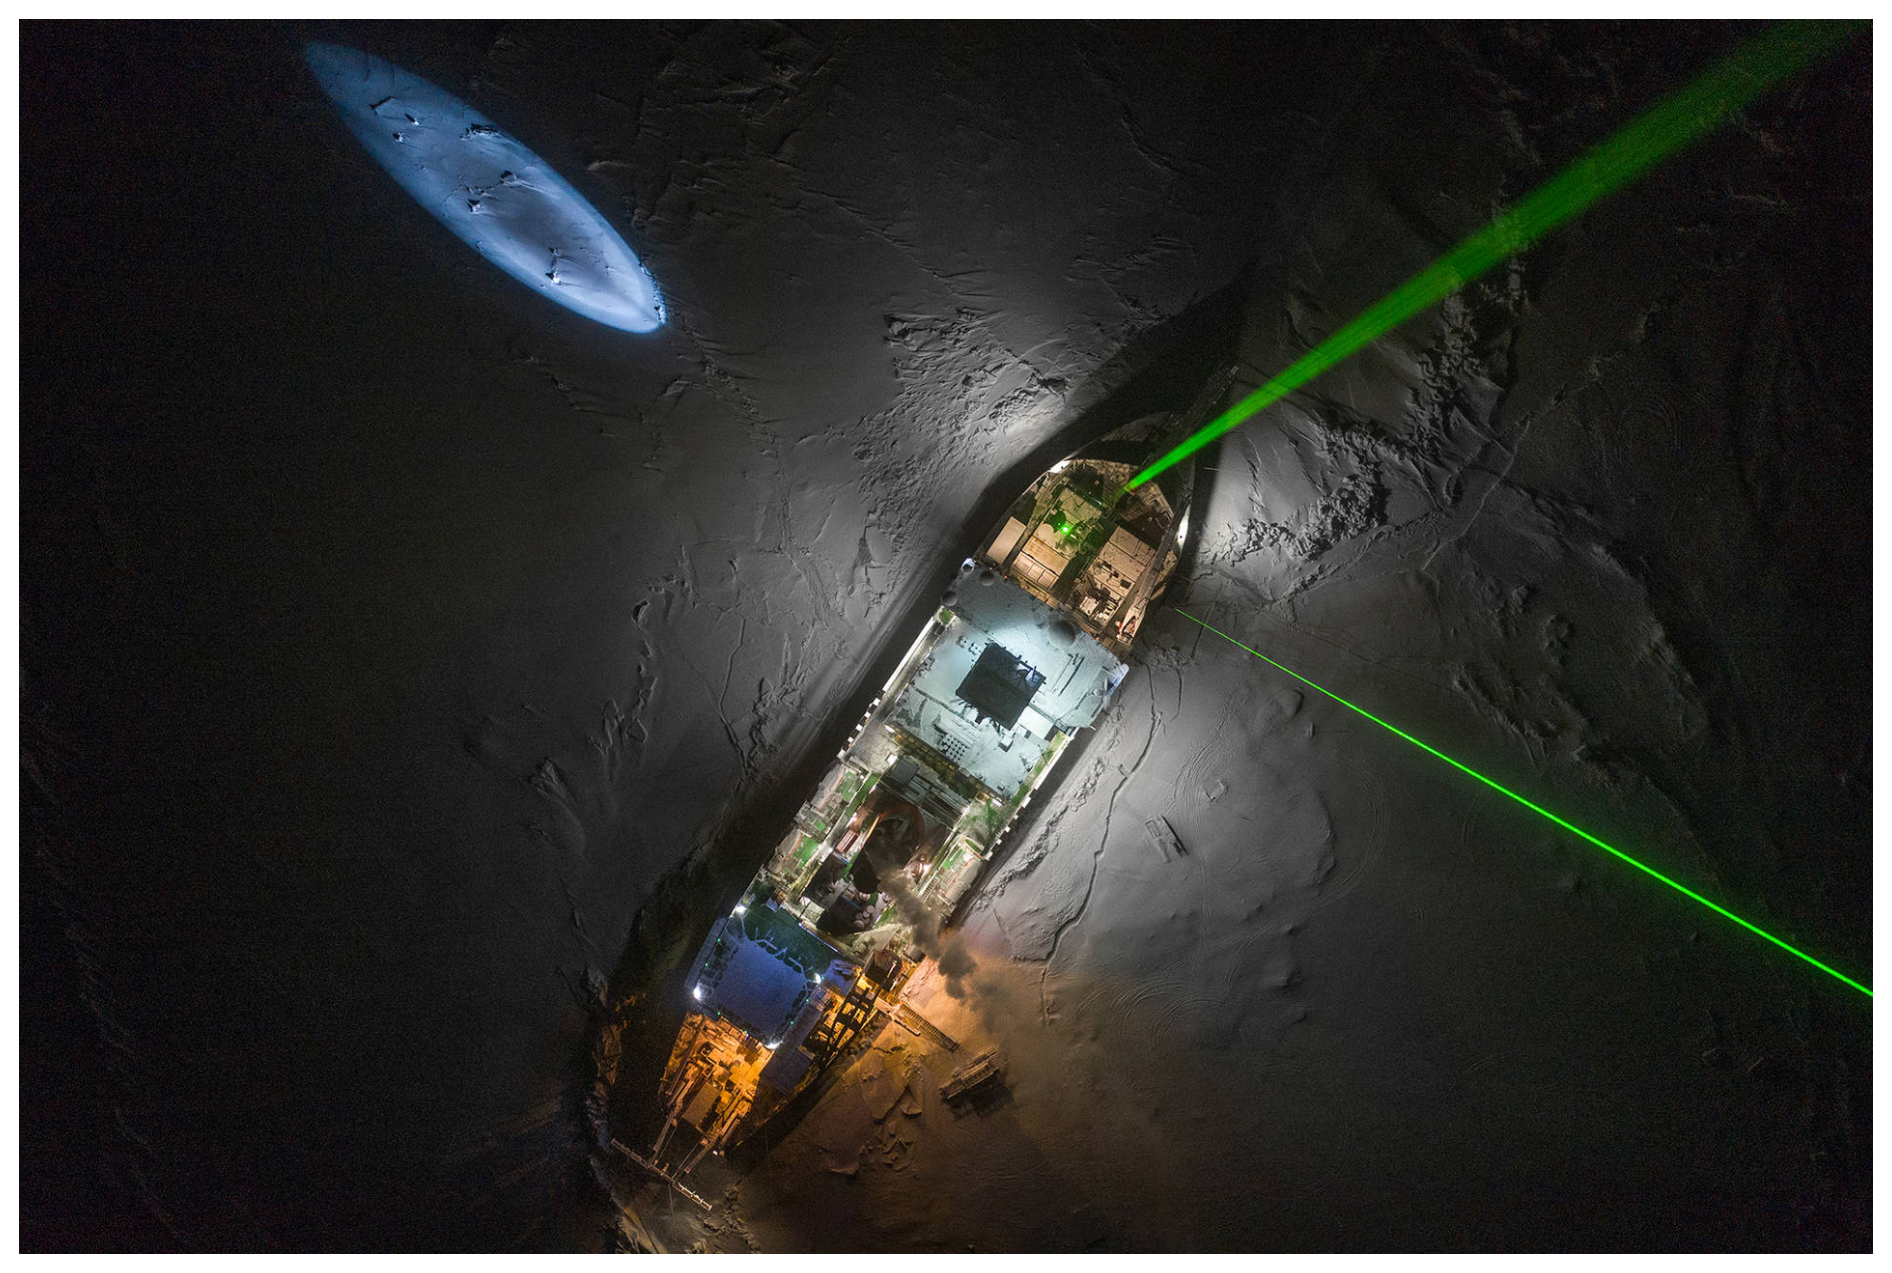
Figure 2Drone-based photograph of Polarstern, drifting with the pack ice, along the route shown in Fig. 1. The two green laser beams are produced by the ARM lidar (left beam, exactly vertically pointing) and the TROPOS lidar (right beam, 5° off-zenith pointing to avoid strong specular reflection by falling, horizontally aligned ice crystals). The picture was taken on 31 October 2019, authorship: Alfred Wegener Institute – Esther Horvath and Jakob Stark (CC-BY 4.0).
2.1 Polly lidar
The multiwavelength polarization Raman lidar Polly (POrtabLe Lidar sYstem) (Engelmann et al., 2016) performed measurements from 26 September 2019 to 2 October 2020 (Polly, 2024). A detailed description of the Polly instrument can be found in Hofer et al. (2017) and Jimenez et al. (2020). The basic aerosol observations comprise height profiles of the particle backscatter coefficient at 355, 532, and 1064 nm; the particle extinction coefficient at 355 and 532 nm; the respective extinction-to-backscatter ratio (lidar ratio) at 355 and 532 nm; and the particle linear polarization ratio at 355 and 532 nm (Baars et al., 2016; Hofer et al., 2017; Ohneiser et al., 2021a). The retrieval of smoke microphysical properties is outlined in Ansmann et al. (2021) and Ansmann et al. (2023). By means of the measured upper-tropospheric smoke backscatter coefficients, the particle surface area concentration (PSAC); the mass concentration; and the number concentrations n50 and n250, considering particles with a radius > 50 and > 250 nm, respectively, can be estimated. The PSAC is the aerosol input in the retrieval of the DIN INP number concentration for organic particles (Wang and Knopf, 2011). n250 is interpreted as the reservoir of potential INPs. More details on the conversion of optical into microphysical properties are given in Sect. 3.2. The data analysis regarding the microphysical properties of ice crystals is described in Sect. 2.3.
2.2 ARM cloud radar
We used the 35 GHz cloud Doppler radar measurements (Ka-band ARM Zenith Radar, KAZR) of the ARM (Atmospheric Radiation Measurement) mobile facility 1 (AMF-1) (Engelmann et al., 2023). KAZR measures the radar moments, including reflectivity, mean Doppler velocity, and spectrum width, which provide insight into the mass, size, and fall speed of cloud and precipitation particles (Shupe et al., 2022). Additionally, the vertically pointing radar recorded the full Doppler spectrum, which offers further insight into the cloud particle populations and processes.
2.3 Cirrus-related lidar data analysis
The classical Raman lidar technique is used to obtain cirrus optical properties (Ansmann et al., 1992). In the determination of the backscatter coefficient at 532 nm, no assumption of the extinction-to-backscatter ratio (lidar ratio) is required. Furthermore, the solutions are not affected by any multiple-scattering effect. After multiplication of the backscatter coefficients with a typical single-scattering lidar ratio of 32 sr at 532 nm, the desired cirrus extinction coefficient profile is revealed. The 532 nm cirrus lidar ratio is in the range of 28–35 sr (Seifert et al., 2007; Giannakaki et al., 2007; Garnier et al., 2015; Josset et al., 2012; Haarig et al., 2016; Voudouri et al., 2020). Integration from cirrus base to top yields the 532 nm cirrus optical thickness. To avoid a strong bias in the extinction profiles caused by specular reflection by horizontally oriented falling ice crystals (Thomas et al., 1990), the laser beam was directed to an off-zenith angle of 5°. In the case of zenith-pointing lidars, the backscatter and extinction coefficients and related cirrus optical thickness can be easily overestimated by a factor of 10. More details on this problem can be found in Mamouri et al. (2023).
An automated (unsupervised) data analysis was applied to the entire MOSAiC lidar data set collected from 1 October 2019 to 31 March 2020. In the first step, we calculated 1 h mean signal profiles. About 4300 of these 1 h profiles are theoretically possible within 180 d. We obtained 1716 of the 1 h profiles showing atmospheric backscatter up to the stratosphere. These profiles were not influenced by low-level clouds and fog and could, thus, be considered in the cirrus statistics. In addition, 220 signal profiles, averaged over 2 h, could be considered. These 220 profiles also covered the entire troposphere with backscatter data. However, a longer averaging period was needed because of the low signal-to-noise ratio in the case of 1 h signal averaging. All in all, 1936 lidar profiles were available for further use. A total of 30 % of these profiles showed cirrus signatures (652 h, 587 profiles). The months October, November, and December 2019 contributed 54, 48, and 124 h to the 652 cirrus hours. In January, February, and March 2020, we collected 197, 109, and 120 h of cirrus data.
The following criteria were applied to identify cirrus layers and to determine the base and top heights of the cirrus layer. First of all, we checked the radiosonde profile of the temperature and restricted the cirrus identification to heights above the −28 °C temperature level. Then, we used two criteria to identify the cirrus layer. The volume depolarization ratio must coherently (over a vertical range > 300 m) exceed the 10 % level and the particle backscatter coefficient must concurrently exceed 0.1 . Identified cirrus layers with a vertical depth of < 300 m were thus reject. As the majority of ice clouds formed in the uppermost part of the troposphere, we included the tropopause information from the radiosonde observations in our cirrus studies. The tropopause height was determined following the NASA procedure described in Ohneiser et al. (2021a). The results of the cirrus statistical analysis are presented and discussed in Sect. 3.1.
2.4 ICNC and IWC retrieval from lidar–radar synergy
The retrieval of the ice crystal number concentration (ICNC) and ice water content (IWC) is based on the synergy of 35 GHz KAZR and 532 nm backscatter lidar observations. The LIRAS-ice (LIdar RAdar Synergy – retrieval of ICE microphysical properties) analysis scheme (Bühl et al., 2019) was originally developed to investigate the impact of Saharan dust on mixed-phase and ice clouds over the eastern Mediterranean (Ansmann et al., 2019).
LIRAS-ice makes use of the measured profiles of the radar reflectivity factor Z (8.5 mm wavelength) and of the cirrus (single-scattering) particle extinction coefficient E at a 532 nm wavelength. A careful and accurate determination of the E profile is of fundamental importance for a trustworthy inversion of the combined lidar–radar observations. The optimum, most robust E profiles are obtained by means of the Raman lidar method described in Sect. 2.3.
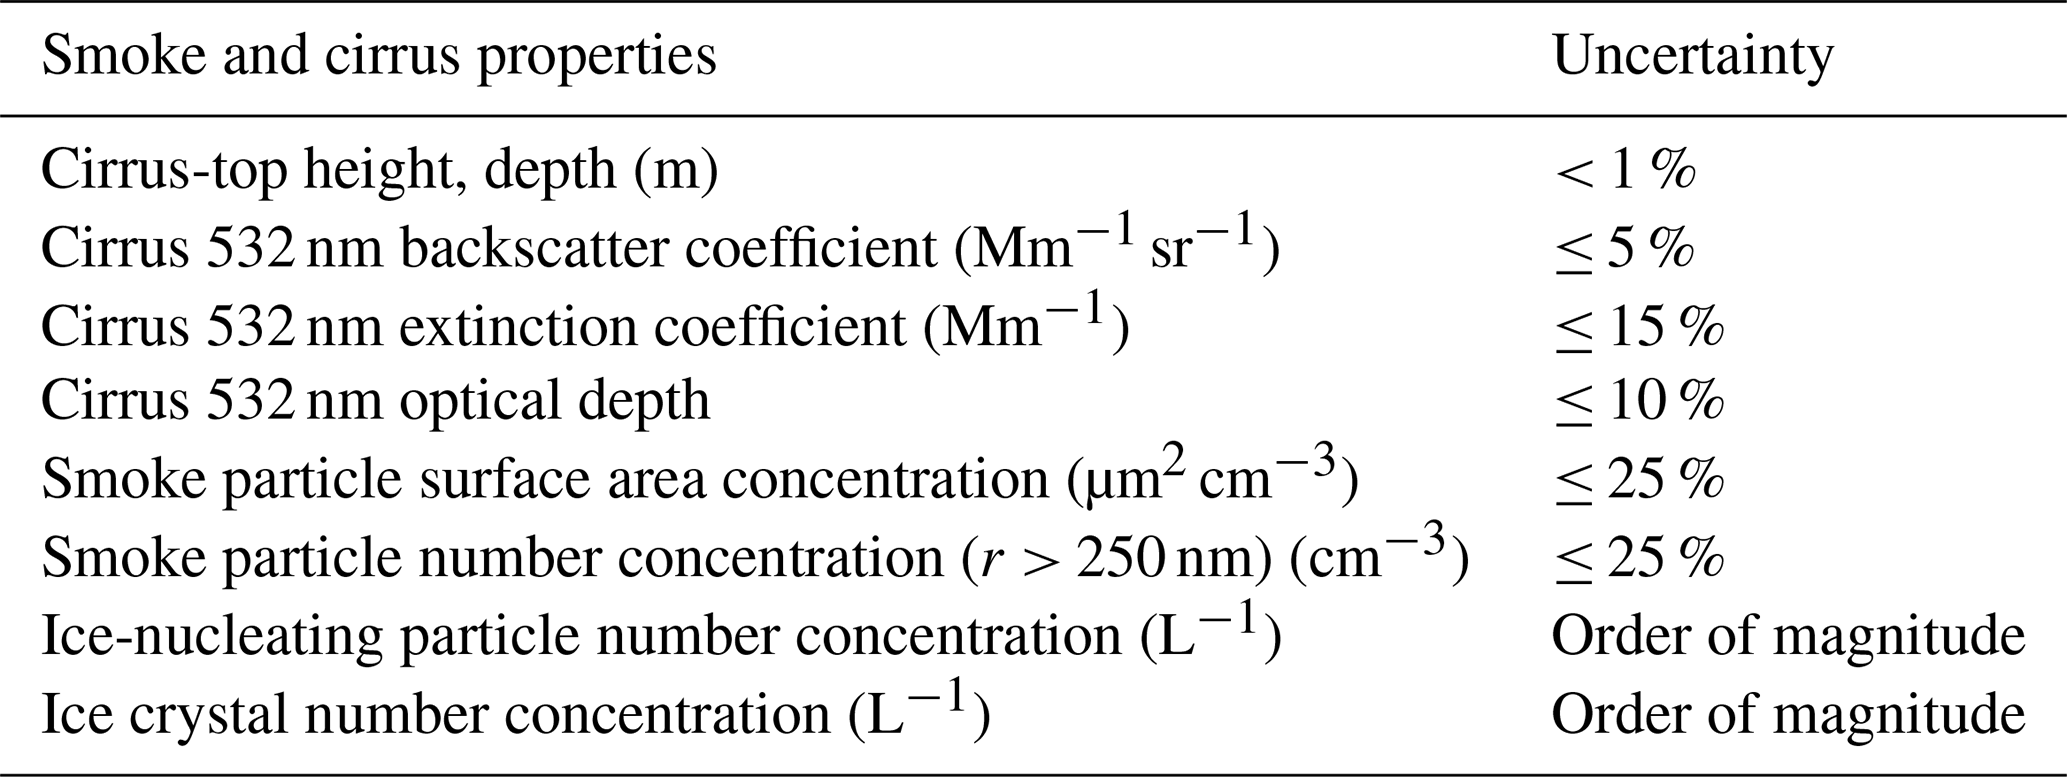
Table 1Overview of the Polly observational products used in this study and of typical relative uncertainties in the determined and retrieved properties. r denotes the aerosol particle radius.
The applied numerical inversion technique LIRAS-ice (Bühl et al., 2019) is based on a look-up table (LUT) that contains the properties of the particle size distribution (PSD; assumed to be a monomodal gamma size distribution) (Hogan et al., 2003; Sekelsky et al., 1999; Ulbrich, 1983) and values of Z and E. The PSD (i.e., the ice crystal number concentration N(D) as function of diameter D), Z, and E are computed with Eqs. (1), (2), and (5) in Bühl et al. (2019), respectively. The PSD is a function of the median particle maximum diameter (Dm) and the shape parameter μ (describing the tilt of the gamma size distribution). More details are given below. In our MOSAiC-related modeling effort (LUT computations), we follow Bühl et al. (2019): Z is a function of crystal particle mass (Eq. B1) with parameters α=0.012 and β=2.4 in the case of the MOSAiC data analysis. E depends on the crystal surface area or geometrical cross section (Eq. 2) with parameters γ=0.17 and σ=1.8. The parameters , and σ are given in Tables A1 and A2 in Bühl et al. (2019). For the crystal shape assumption (defined in Table A2), we assume hexagonal plates for the diameter range from 15 to 600 µm and an aggregate mixture for the sizes from 600 µm to 5 mm.
The ice crystal diameter range from 100 µm to 5 mm is considered in the inversion procedure. This assumption reflects realistic characteristics of the crystal size distribution in (aged) ice crystal virga in the case of the synoptic cirrus category (Lynch et al., 2002). The number concentration and size of the crystals in the virga depend on ice crystal growth and collision and aggregation processes. The nucleation of new ice crystals and, thus, a potential occurrence of a second mode in the size distribution can be ignored at a relative humidity over ice of around 100 % (i.e., in the absence of strong ice supersaturation), as typically observed with MOSAiC radiosondes in the cirrus virga. The assumption of a monomodal gamma size distribution of the crystals is in agreement with other Arctic cirrus observations (Wolf et al., 2018, 2019; De La Torre Castro et al., 2023). In Sect. 3.5, we will show a comparison with disdrometer-derived ICNC values that corroborate that our approach is fully justified. Our extended sensitivity analysis revealed that the selected size range (e.g., from 10, 25, or 100 µm up to 5000 µm) does not play a role in the ICNC retrieval when assuming a monomodal gamma size distribution for the well-developed crystal size distributions in ice virga.
In the next step, we estimated the median diameter (Dm) of the PSD from Z and by comparison with simulated cloud radar spectra and lidar parameters (stored in the LUT). A fixed shape parameter of μ=2 of the gamma size distribution is used (Eq. 1 in Bühl et al., 2019). Finally, we scaled the results with the observed values of E to obtain ICNC and IWC profiles. The main goal of the retrieval is, thus, to find a PSD that leads to the same variables as the measured ones (Z and E). The method developed by Bühl et al. (2019) was well tested and applied to cirrus observations over the eastern Mediterranean (Ansmann et al., 2019).
We applied the recently published CAPTIVATE (Cloud, Aerosol and Precipitation from mulTiple Instruments using a VAriational TEchnique) algorithm (Mason et al., 2023) to the combined MOSAiC lidar–radar cirrus data sets as well. We found generally good agreement between our LIRAS-ice and the CAPTIVATE results for the IWC. However, the ICNC solutions deviate, as the ICNC retrieval is rather sensitive to the lidar and radar input data and assumptions on the crystal shape characteristics. CAPTIVATE uses the directly measured attenuated-backscatter coefficients (i.e., calibrated range-corrected backscatter signals) as input and derives the required single-scattering extinction coefficients as part of the data analysis. Our experience with CAPTIVATE shows that the estimation of the single-scattering extinction profile can be a source of significant uncertainty.
As discussed in Bühl et al. (2019), the uncertainty in the ICNC estimation is roughly characterized by a factor of 3 (around the most reasonable solution). Thus, LIRAS-ice allows us to determine the order of magnitude of occurring ICNCs in cirrus fallstreaks. This uncertainty margin holds in general for all ICNC lidar–radar retrievals. Table 1 provides an overview of the uncertainties in the observed and retrieved aerosol and cirrus products.
It should mentioned that cloud radar observations up to cirrus top were, in most cases, not possible during the MOSAiC expedition. High-quality radar observations could be realized in cirrus virga up to 8 km height, while the top of the cirrus layer was frequently at 9–10 km height. Thus, in order to compare simulated and observation-based ICNCs in Part 2 (Ansmann et al., 2025), we were forced to estimate ICNC values for the main ice nucleation zone in the cirrus-top region from the ICNC values available for heights up to 8 km. Aggregation processes can lead to a considerable reduction in the ICNC with decreasing height. ICNCs at 8 km may be a factor of 2–5 lower than respective values in the ice nucleation zone close to cirrus top as a result of crystal–crystal collision and aggregation events. Aggregation effects are discussed in Sect. 3.3.
2.5 Two-dimensional video disdrometer (2DVD)
The two-dimensional video disdrometer (2DVD) is a ground-based precipitation gauge that detects single precipitation particles within a certain measuring area (Kruger and Krajewski, 2002; Gaudek, 2024). The 2DVD was originally designed to measure rain drop size distributions. However, the investigation of solid hydrometeors with such devices has been the subject of research in recent years. The instrument was developed by JOANNEUM RESEARCH, Graz, Austria (https://www.joanneum.at/, last access: 23 March 2025). During the MOSAiC expedition, it was operated on the roof of the TROPOS OCEANET-Atmosphere container. The 2DVD, including a product characterization, is described in detail in Gaudek (2024).
The 2DVD allowed us to measure ICNCs on a calm day (23 November 2019) and to compare the values with respective numbers from the lidar–radar retrieval. Furthermore, the 2DVD observations provided information on the ice crystal sizes, terminal velocities of ice crystals, and whether the ice crystals were compact or rather complex in shape; thus, these observations provide hints with respect to crystal–crystal collision and aggregation processes.
2.6 Polarstern radiosonde
Vaisala radiosondes (type RS41) were launched regularly every 6 h throughout the entire duration of MOSAiC, including periods when Polarstern was in transit (Maturilli et al., 2021, 2022). The radiosondes provide vertical profiles of temperature, relative humidity, pressure, and winds from 12 m (the altitude of the helideck from which they were launched) up to an altitude of about 30 km, thus covering both the troposphere and lower stratosphere (Shupe et al., 2022). Quality control for appropriate physical ranges has been applied.
The MOSAiC observations and retrieval products are presented and discussed in several subsections. In Sect. 3.1, we begin with the results of a statistical analysis of the observed cirrus geometrical and optical properties. In Sect. 3.2, we provide an overview of the MOSAiC aerosol pollution conditions at the tropopause level where ice formation usually started. In Sect. 3.3–3.5, we present our findings regarding the microphysical properties of 12 cirrus systems (20 profile data sets) observed in the winter months (November 2019–February 2020) and discuss the potential impact of smoke on the evolution of the observed cirrus systems. This also includes a discussion on the importance of observations of ice crystal number concentrations (ICNCs) in the cirrus virga. These virga ICNC observations connect Part 1 and the simulations in Part 2 (Ansmann et al., 2025), as will be explained in Sect. 3.4.
3.1 Cirrus statistics for the winter half year of 2019–2020
Figure 3 presents the statistical results of the cirrus observations from 1 October 2019 to 31 March 2020. Although the observations cover the winter half year only, the comparison with other studies (discussed below) suggest that they are representative of the entire year. During the summer half year, less than 20 cirrus profiles (1 h mean profiles) could be collected. Low clouds and fog prohibited upper-tropospheric measurements most of the time during spring and summer months. According to the cirrus classification of Lynch et al. (2002), all of the observed Arctic winter cirrus clouds belong to the synoptic cirrus category (top-down generation of cirrus structures). Ice nucleation starts at cloud top, where the highest values of the ice saturation ratio are usually observed, and extended virga of falling ice crystals later evolve and reach lower and lower heights. An example is discussed in the next section. De La Torre Castro et al. (2023) reported that 86 % of the cirrus layers that they observed during a summer campaign in June and July 2021 at latitudes from 60 to 76° N belonged to the synoptic cirrus category. A total of 14 % of the ice clouds were orographically induced cirrus or anvil cirrus.
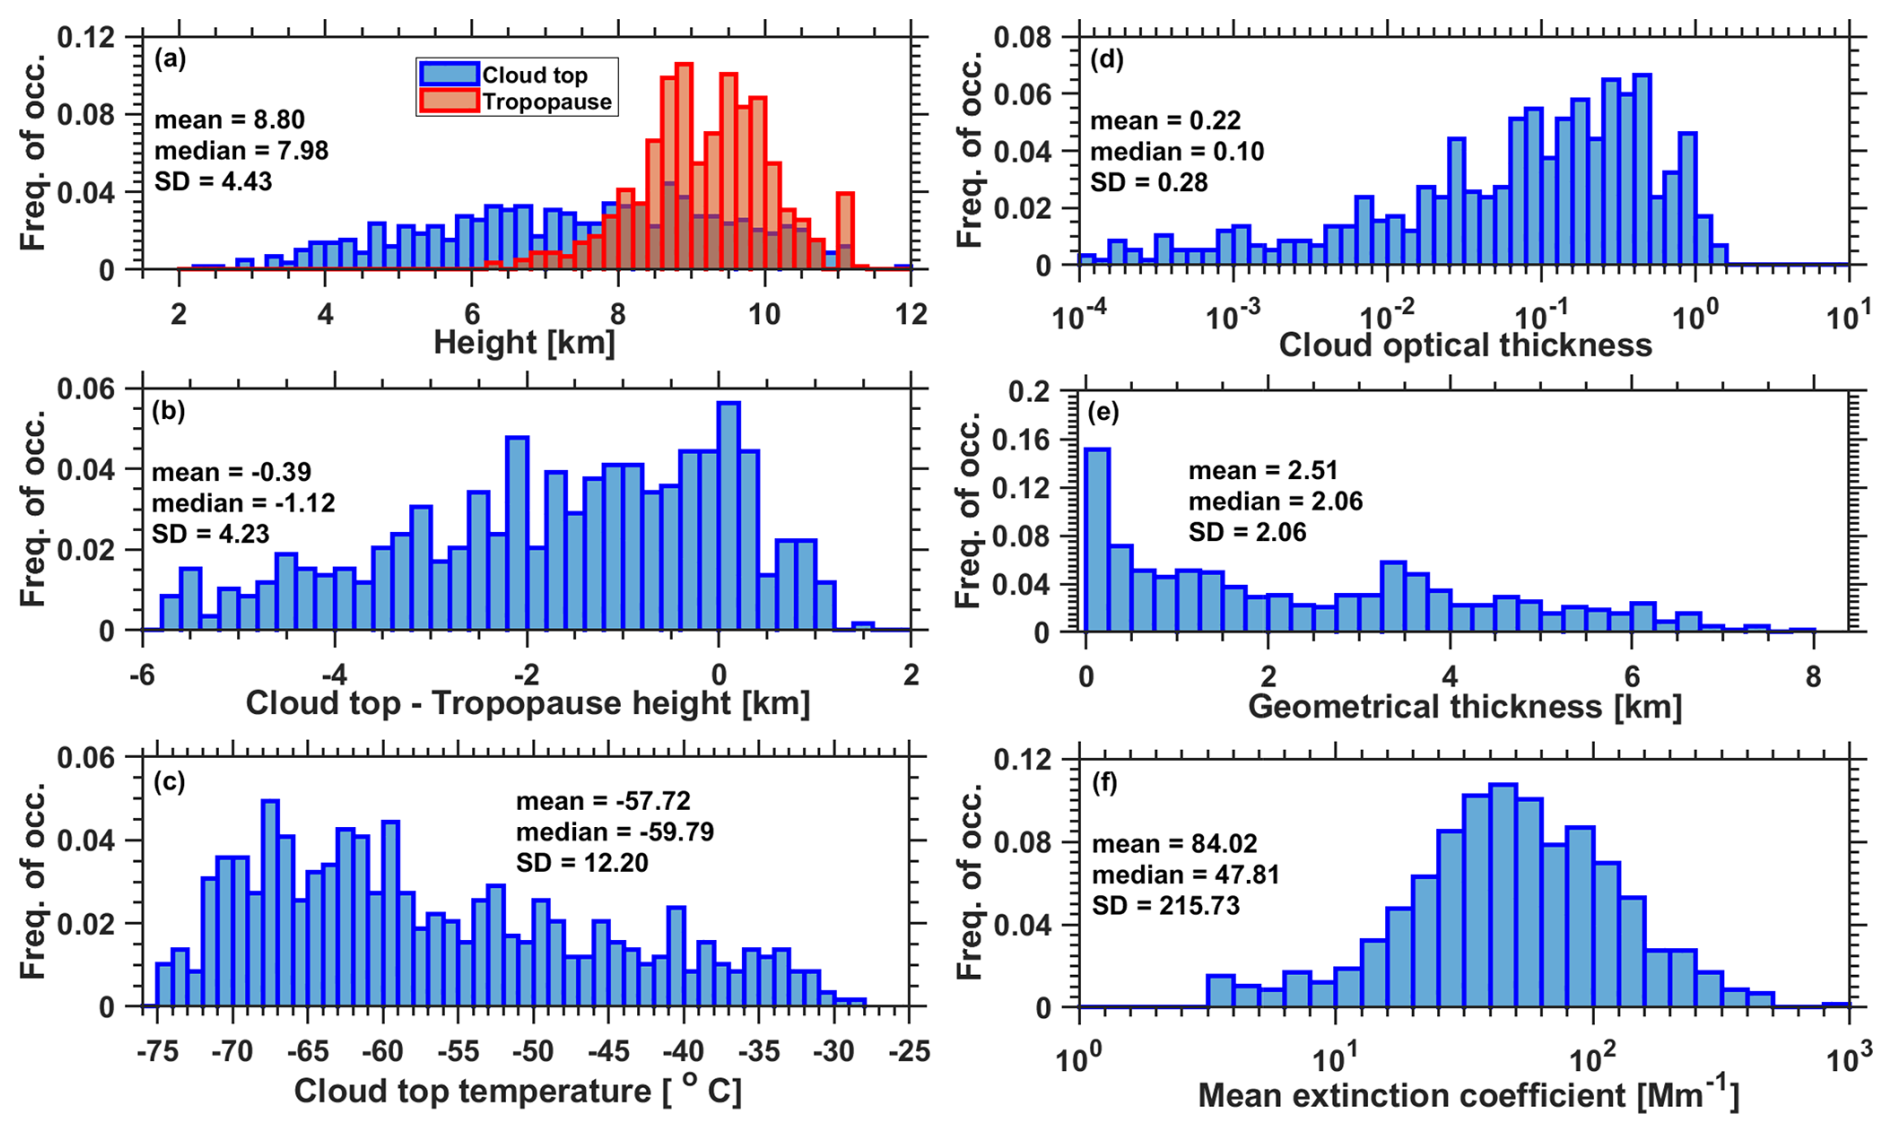
Figure 3MOSAiC cirrus statistics considering all available lidar observations from 1 October 2019 to 31 March 2020. The normalized frequency of occurrence is shown. The panels present the (a) cirrus-top and tropopause height, (b) vertical distance of the cirrus-top height from the tropopause, (c) cirrus-top temperature, (d) cirrus optical thickness (532 nm), (e) cirrus vertical extent (from cirrus-top to virga-base height), and (f) cirrus mean extinction coefficient at 532 nm. Median, mean, and SD values are given as numbers.
As outlined in Sect. 2.3, the MOSAiC cirrus statistics in Fig. 3 is based on 1716 cirrus profiles, averaged over 1 h, and 220 cirrus profiles, averaged over 2 h. These 1936 cirrus profiles cover 2156 h and, thus, almost 50 % of the 4320 h of the winter half year. All profiles showing cirrus signatures and cloud-top temperatures < −28 °C are considered in the statistics. In more than 90 % of the cases, the cirrus-top temperature was < −40 °C.
The main findings can be summarized as follows: more than 30 % of the 1936 profiles showed cirrus signatures (652 h, 587 profiles). For comparison, the typical cirrus occurrence frequency was of the order of < 10 % according the space lidar observation with CALIOP (Cloud-Aerosol LIdar with Orthogonal Polarization) at latitudes of around 80° N in 2006–2007 (Sassen et al., 2009; Heymsfield et al., 2017). Most cirrus clouds developed at or close to the tropopause (Fig. 3a, b). The tropopause height distribution, derived from the radiosonde observations, is shown in Fig. 3a. Many detected cirrus features far below the tropopause are related to virga fragments (Fig. 3b). Most ice nucleation occurred at temperatures from −60 to −75 °C, or from 198 to 213 K (radiosonde observations in Fig. 3c). The values for the cirrus optical thickness accumulate in the range from 0.08 to 0.6 (Fig. 3d). Sassen and Cho (1992) classified cirrus clouds as subvisible cirrus when the cirrus optical thickness (COT) was < 0.03, as visible cirrus when the COT ranged from 0.03 to 0.3, and as opaque cirrus when the COT was > 0.3. According to this classification, 25 % of the observed central Arctic cirrus clouds were subvisible, 40 % were visible, and 35 % were opaque cirrus. The broad distribution of the cirrus vertical depth in Fig. 3e indicates the impact of the strongly varying virga-base height, interpreted as the cirrus-base height. The cirrus mean extinction coefficient in Fig. 3f shows a Gaussian distribution (on a logarithmic scale) with typical extinction values from 30 to 300 Mm−1 (or from 0.03 to 0.3 km−1.).
Our statistical results are in good agreement with other studies of Arctic cirrus properties. Heymsfield et al. (2017) stated that typical cirrus-top temperatures are between 200 and 213 K and that the cirrus-top height ranges from 8 to 14 km in the Arctic. Schäfer et al. (2022) analyzed ground-based lidar observations at the ALOMAR site in northern Norway (69.1° N) and compared the findings with respective results from CALIOP overflights (2011–2017). Typical cirrus-top temperatures were in the range of 210–220 K (fall and winter) and 220–230 K (spring and summer). The cirrus top was mostly at heights from 8.5 to 10.5 km. The cirrus-base heights (i.e., in most cases virga-base heights) ranged from 4 to 11 km over the ALOMAR lidar site. Nakoudi et al. (2021) analyzed lidar data collected over Ny Ålesund, Svalbard, Norway (78.6° N), from 2011 to 2020, and they also found cirrus-top heights mainly between 8.5 and 10.5 km (throughout the year) and cirrus-top temperatures of between 203 and 213 K. Voudouri et al. (2020) analyzed long-term observations (2011–2016) in Finland (Kuopio, 62.7° N). Cirrus-top heights were mostly between 9 and 10 km in winter and between 10 and 10.5 km in summer. The mean COT at 532 nm was found to be 0.24 ± 0.2, with 3 % contributing to the subvisible cirrus fraction, 71 % to the visible cirrus fraction, and 26 % to the opaque cirrus fraction. These numbers are very different from the MOSAiC values of 25 % subvisible, 40 % visible, and 35 % opaque ice clouds. Orographically forced waves generated by the Scandinavian mountains probably have a strong impact on the cirrus characteristics over Finland. It should be mentioned that the statistical results in Fig. 3 do not provide any hints with respect to the dominating ice nucleation mode (homogeneous vs. heterogeneous ice nucleation).
3.2 Upper-tropospheric aerosol conditions during the winter of 2019–2020
During the MOSAiC winter half year, the UTLS in the central Arctic was covered by a thick layer of aged Siberian wildfire smoke (Ohneiser et al., 2021a; Ansmann et al., 2023, 2024). In terms of optical properties, the MOSAiC smoke 532 nm extinction coefficients in the UTLS height range were (with values of 3–5 Mm−1) about a factor of 20 higher than the respective extinction coefficients for the UTLS background sulfate aerosol of 0.1–0.25 Mm−1 (Jäger, 2005; Baars et al., 2019). The measured smoke extinction coefficients were used to estimate ice-nucleation-relevant quantities such as the particle number concentrations n250 (considering particles with radius r > 250 nm) and the particle surface area concentrations (PSACs), as described in Ansmann et al. (2021) and also in Ansmann et al. (2025).
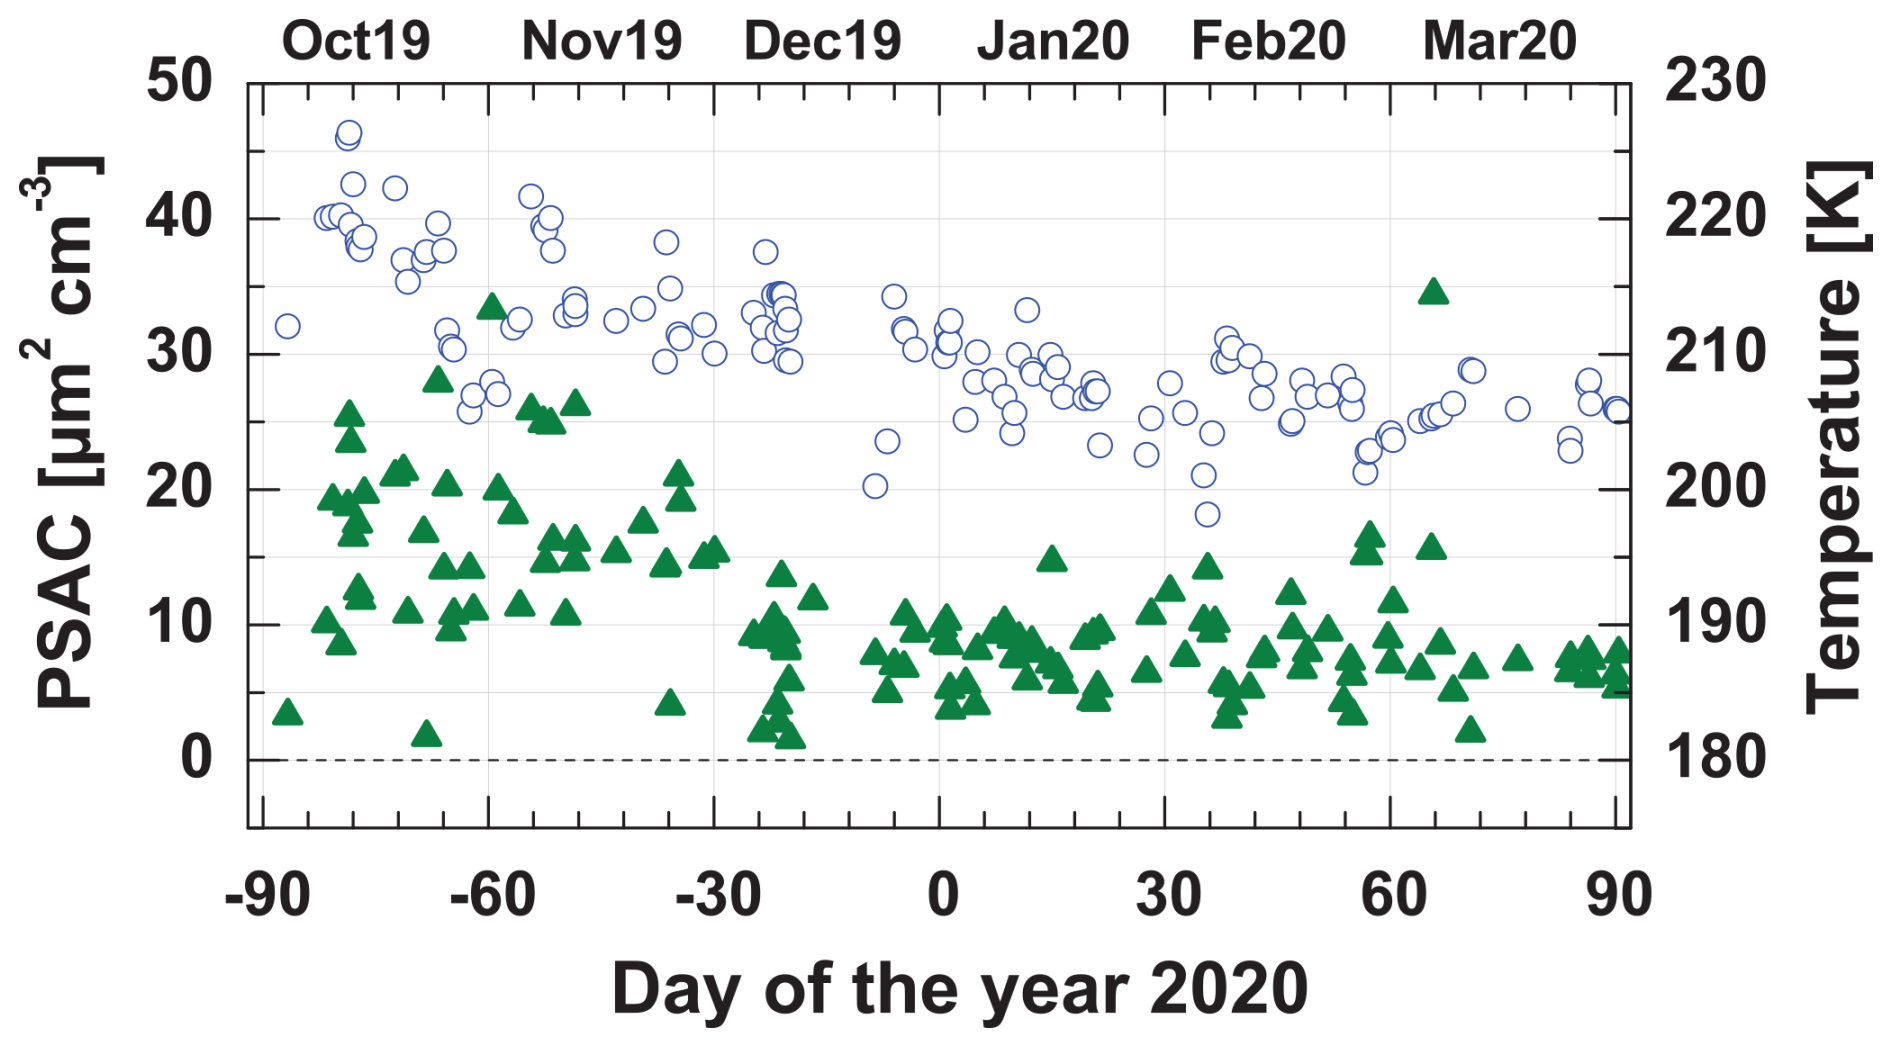
Figure 4The smoke particle surface area concentration (PSAC) at the tropopause height level (green triangles) together with the tropopause temperature (open blue circles) from the beginning of October 2019 to the beginning of April 2020. The lidar observations of the PSAC and the radiosonde temperature observations were performed during cirrus-free periods.
In Fig. 4, the PSAC time series at tropopause level from October 2019 to March 2020 is shown. The PSAC values are used as input in the INP parameterization within the simulation studies in Part 2 (Ansmann et al., 2025). The corresponding particle number concentration n250 can be interpreted as an INP reservoir, containing all particles that can eventually be activated as INPs (Knopf et al., 2023). The PSAC values of 10 µm2 cm−3 corresponds to n250 values of about 2000 L−1. According to Schröder et al. (2002), the liquid background sulfate particle number concentration, i.e., the INP reservoir in the case of homogeneous freezing processes, is of the order of 250 cm−3 (or 250 000 L−1) in the upper troposphere. The respective particle volume concentration of the background aerosol is around 1 µm3 cm−3. The particle volume concentration serves as aerosol input in homogeneous ice nucleation computations (Koop et al., 2000).
As can be seen in Fig. 4, the smoke layer was continuously observed from the beginning of the MOSAiC expedition, and the pollution level did not change from December 2019 to March 2020. The tropopause temperatures decreased slowly from November 2019 to March 2020. The PSAC values accumulated in the range of 5–15 µm2 cm−3. A rather strong and long-living polar vortex controlled the weather and vertical and horizontal aerosol transport conditions from December 2019 to April 2020 (Ohneiser et al., 2021a). As a consequence, almost constant smoke particle concentration levels were observed during this time period. A depletion of the smoke particle reservoir by frequently occurring cirrus formation events is not visible. The INP reservoir in the upper troposphere was permanently refilled from above. According to Ohneiser et al. (2021a) and Ansmann et al. (2024), the smoke layer extended from 5–7 km height up to about 12–13 km height, and thus up to several kilometers above the tropopause.
The PSAC observations in Fig. 4 were conducted during cirrus-free periods to avoid contamination of the aerosol backscattering by cirrus backscattering. We assume that the observed PSAC values also describe the pollution conditions during cirrus ice nucleation processes at cirrus-top heights. An impressive example of cirrus formation in the smoke-polluted tropopause region was observed from 25 to 29 February 2020, as shown in Fig. 14 in Ansmann et al. (2023).
3.3 The 22 January 2020 cirrus case study
A midwinter MOSAiC cirrus case study is presented in Figs. 5–8. The measurement was performed on 21–22 January 2020 at 87.5° N. From 12:00 UTC on 21 January to 20:00 UTC on 26 January (and thus over 6 d), cirrus and virga formation continuously occurred over Polarstern. The evolution of two cirrus systems is highlighted in Fig. 5. Ice nucleation was probably initiated mainly at heights > 10 km and at temperatures of −70 to −74 °C. Nucleated ice particles grow fast by water vapor deposition on the available crystal surfaces. The respective reduction in the ice saturation ratio Si below the ice nucleation onset value Si,on terminates the ice nucleation event (as will be shown in Part 2; Ansmann et al., 2025). The growing and falling crystals form vertically extended and coherent virga structures. According to Bailey and Hallett (2004, 2012), crystals grow by 0.01–0.05 µm s−1 (diameter growth per second) at temperatures from −50 to −30 °C (3–7 km height range in Fig. 5) and ice supersaturation levels of around 1.1. In the case of the virga observed between 1.5 and 7.5 km height from 08:00 to 12:00 UTC, crystals probably grew to sizes of 150–750 µm in the 4 h (14 400 s) period. Different crystal nucleation times and different growth rates at different heights and temperatures (Bailey and Hallett, 2004, 2012) lead to a broad spectrum of ice crystal sizes. The resulting fall speed spectrum may foster crystal–crystal collision and subsequent aggregation processes and may lead to a considerable number of crystals with diameters even exceeding 1 mm in the lower half of the virga height range before the sublimation of the crystals in the lowest part of the virga starts to dominate. The strong increase in the lidar backscatter signal strength with decreasing height in Fig. 5 is a clear sign of the increasing size of ice crystals. The ice particles moved downward from heights of 7.5 to 1.5 km within the time period from 08:00 to 12:00 UTC and, thus, with an apparent mean falling speed of about 40 cm s−1. The Doppler radar observations indicated falling velocities of around 50 cm s−1.
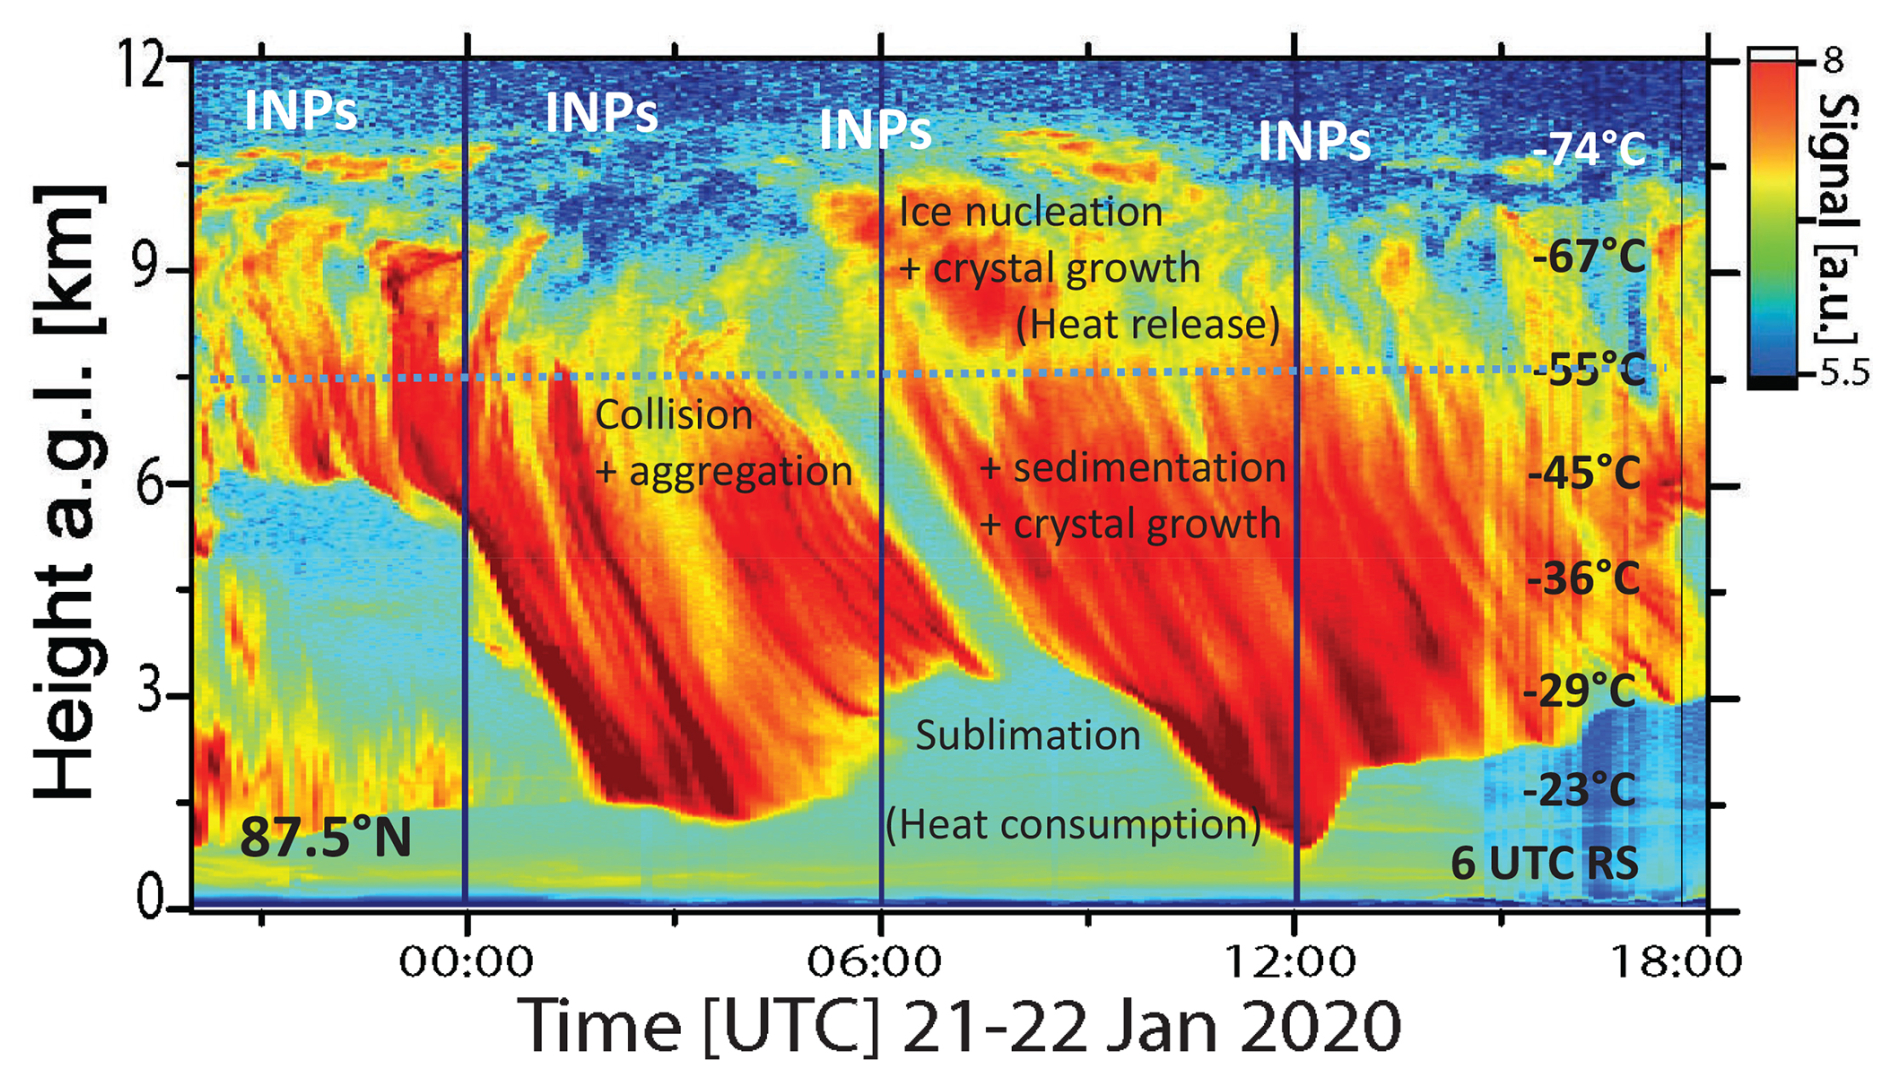
Figure 5Life cycles of two cirrus systems – the first one from about 21:00 UTC on 21 January to 07:00 UTC on 22 January and the second one from 06:00 UTC to 16:00 UTC on 22 January 2020. Cirrus structures are mainly given in yellow and red colors. The Polarstern lidar observation (in terms of the calibrated range-corrected 1064 nm backscatter signal) was performed at 87.5° N. The cirrus clouds belong to the synoptic cirrus category (top-down generation of cirrus structures). Cirrus generation cells were mainly above 9 km height, and the virga zone extended from about 9 km down to 1 km above Polarstern. Temperatures (given as numbers on the right side) were measured with the 06:00 UTC radiosonde. The vertical black lines indicate the 00:00, 06:00, and 12:00 UTC radiosondes (launched at 23:00, 05:00, and 11:00 UTC, respectively). All relevant processes are indicated, such as nucleation, growth, sedimentation, and aggregation. The dotted blue line shows the maximum height up to which cloud radar reflectivity was available to retrieve microphysical properties. Smoke particle INPs showed a maximum at the tropopause level around 10.5–11 km height.
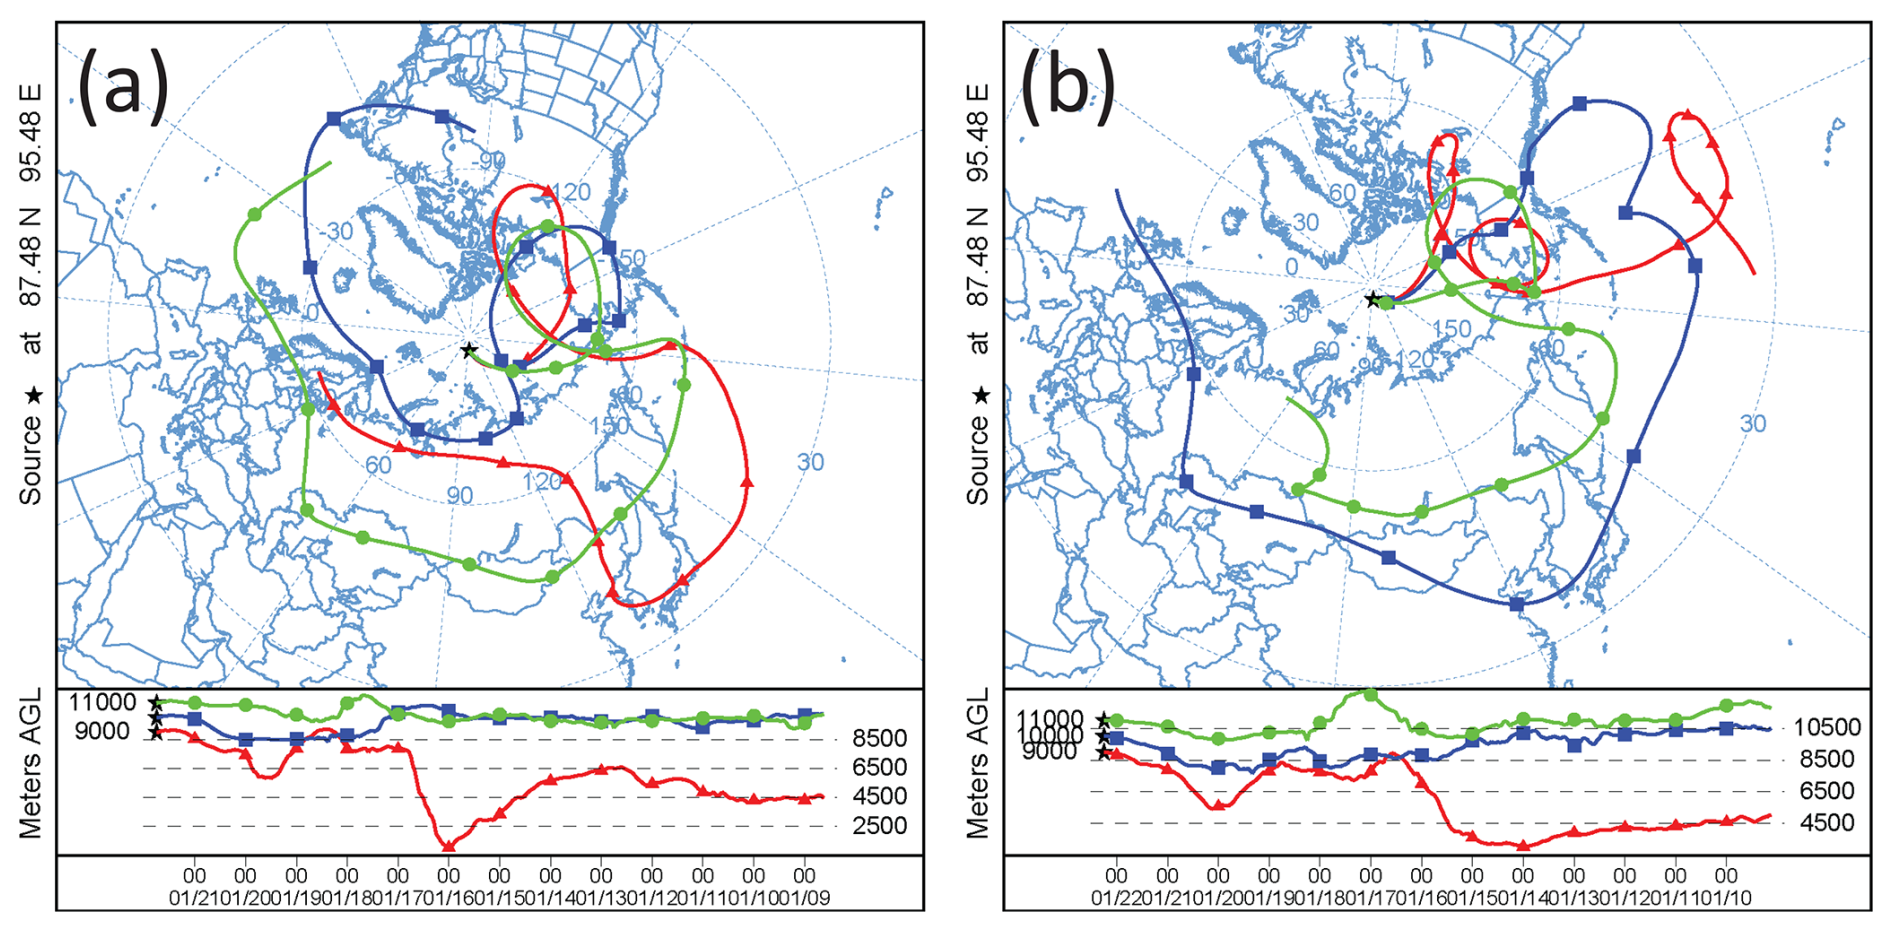
Figure 6HYSPLIT 10 d backward trajectories arriving over Polarstern (indicated by a star) (a) at 18:00 UTC on 21 January 2020 and (b) at 06:00 UTC on 22 January 2020 (HYSPLIT, 2024; Stein et al., 2015; Rolph et al., 2017). Arrival heights are at 9000 m (red), 10 000 m (blue), and 11 000 m (green).
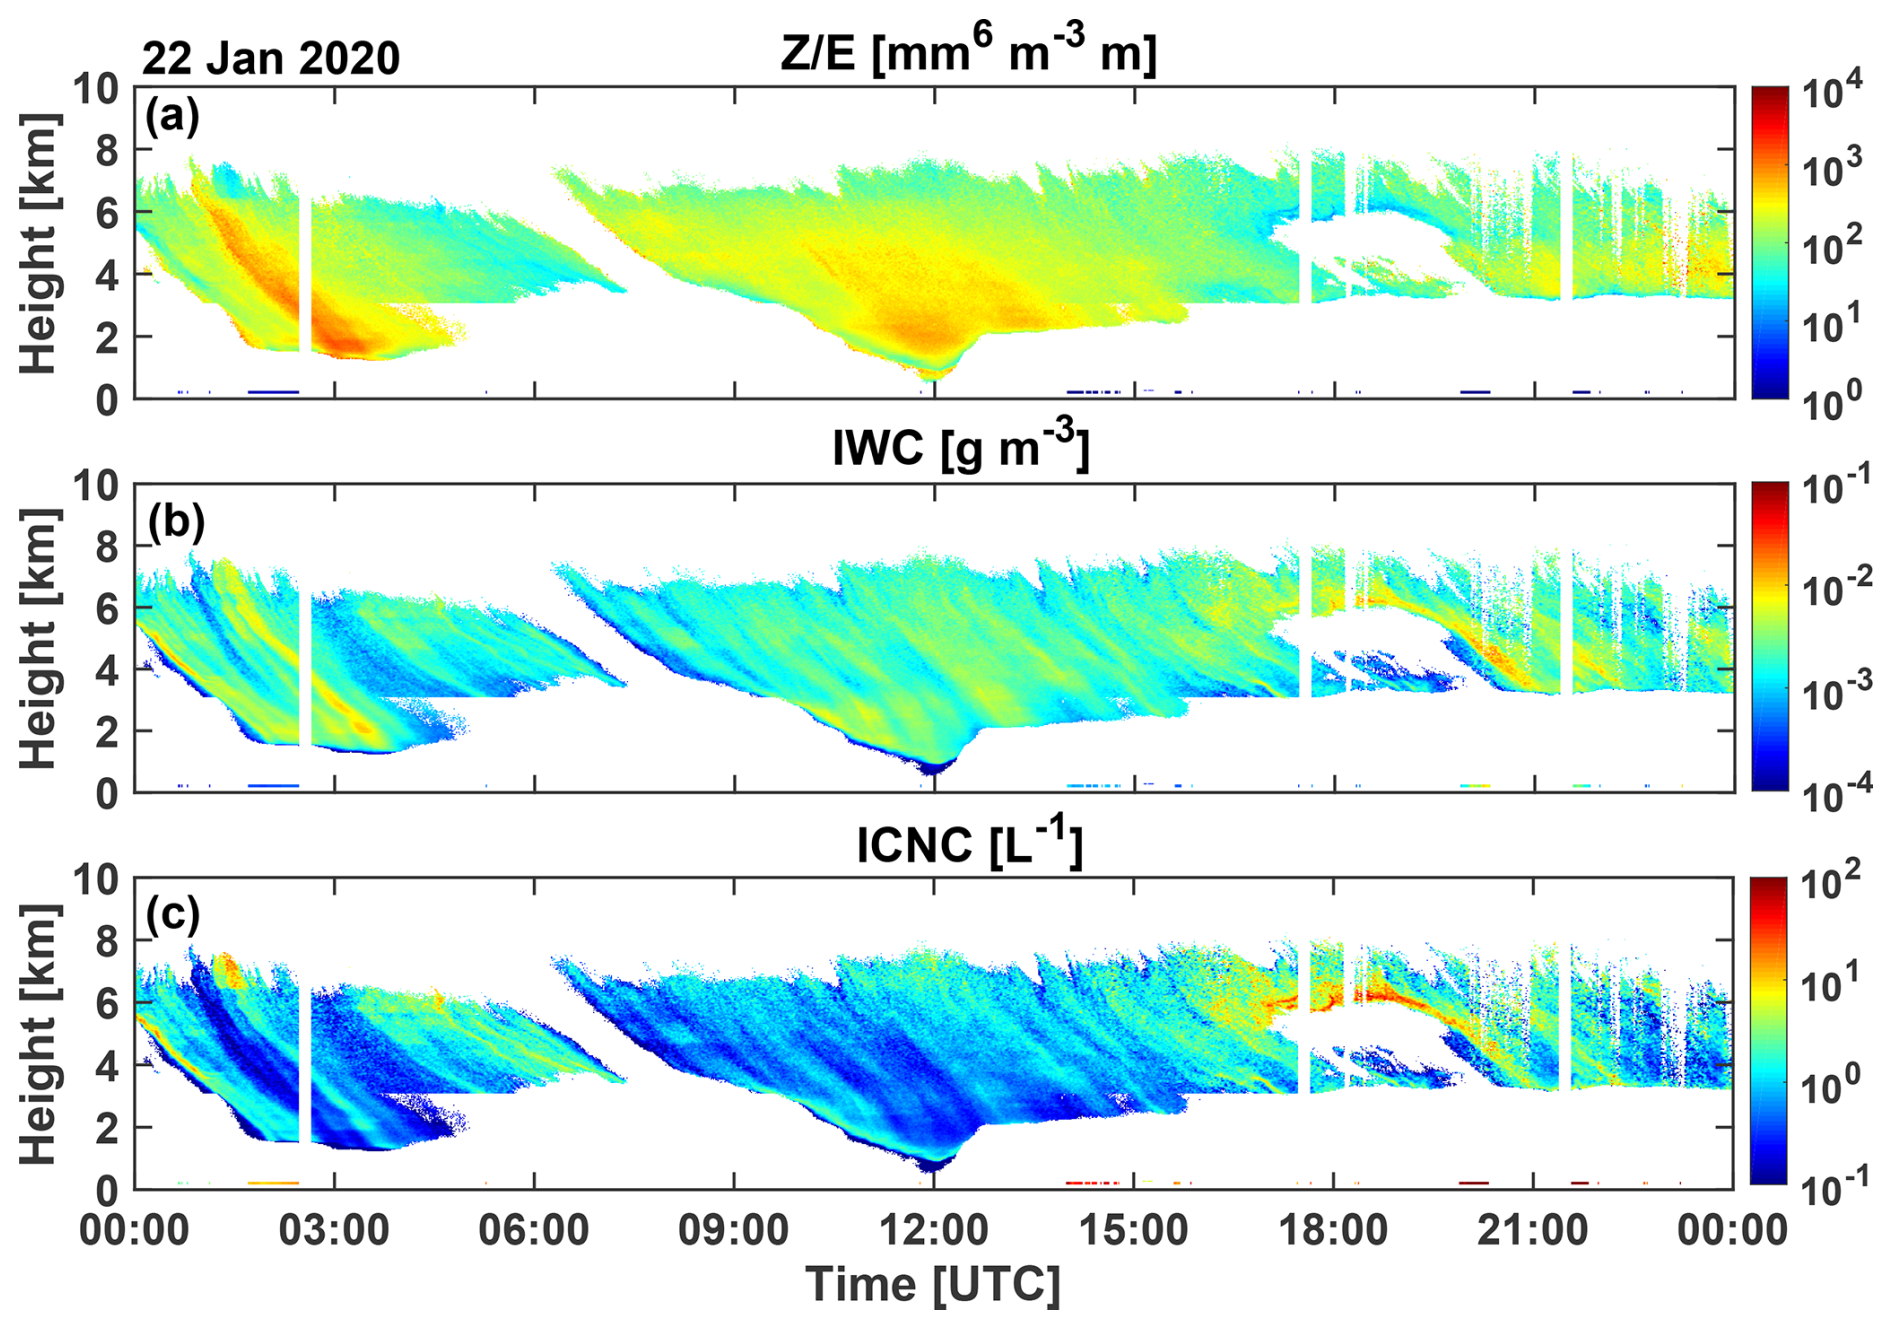
Figure 7(a) The ratio, with the radar reflectivity (Z) and the 532 nm cirrus extinction coefficient (E) observed on 22 January 2020, and (b) the LIRAS-ice retrieval of the ice water content (IWC) and (c) the LIRAS-ice retrieval of the ice crystal number concentration (ICNC).
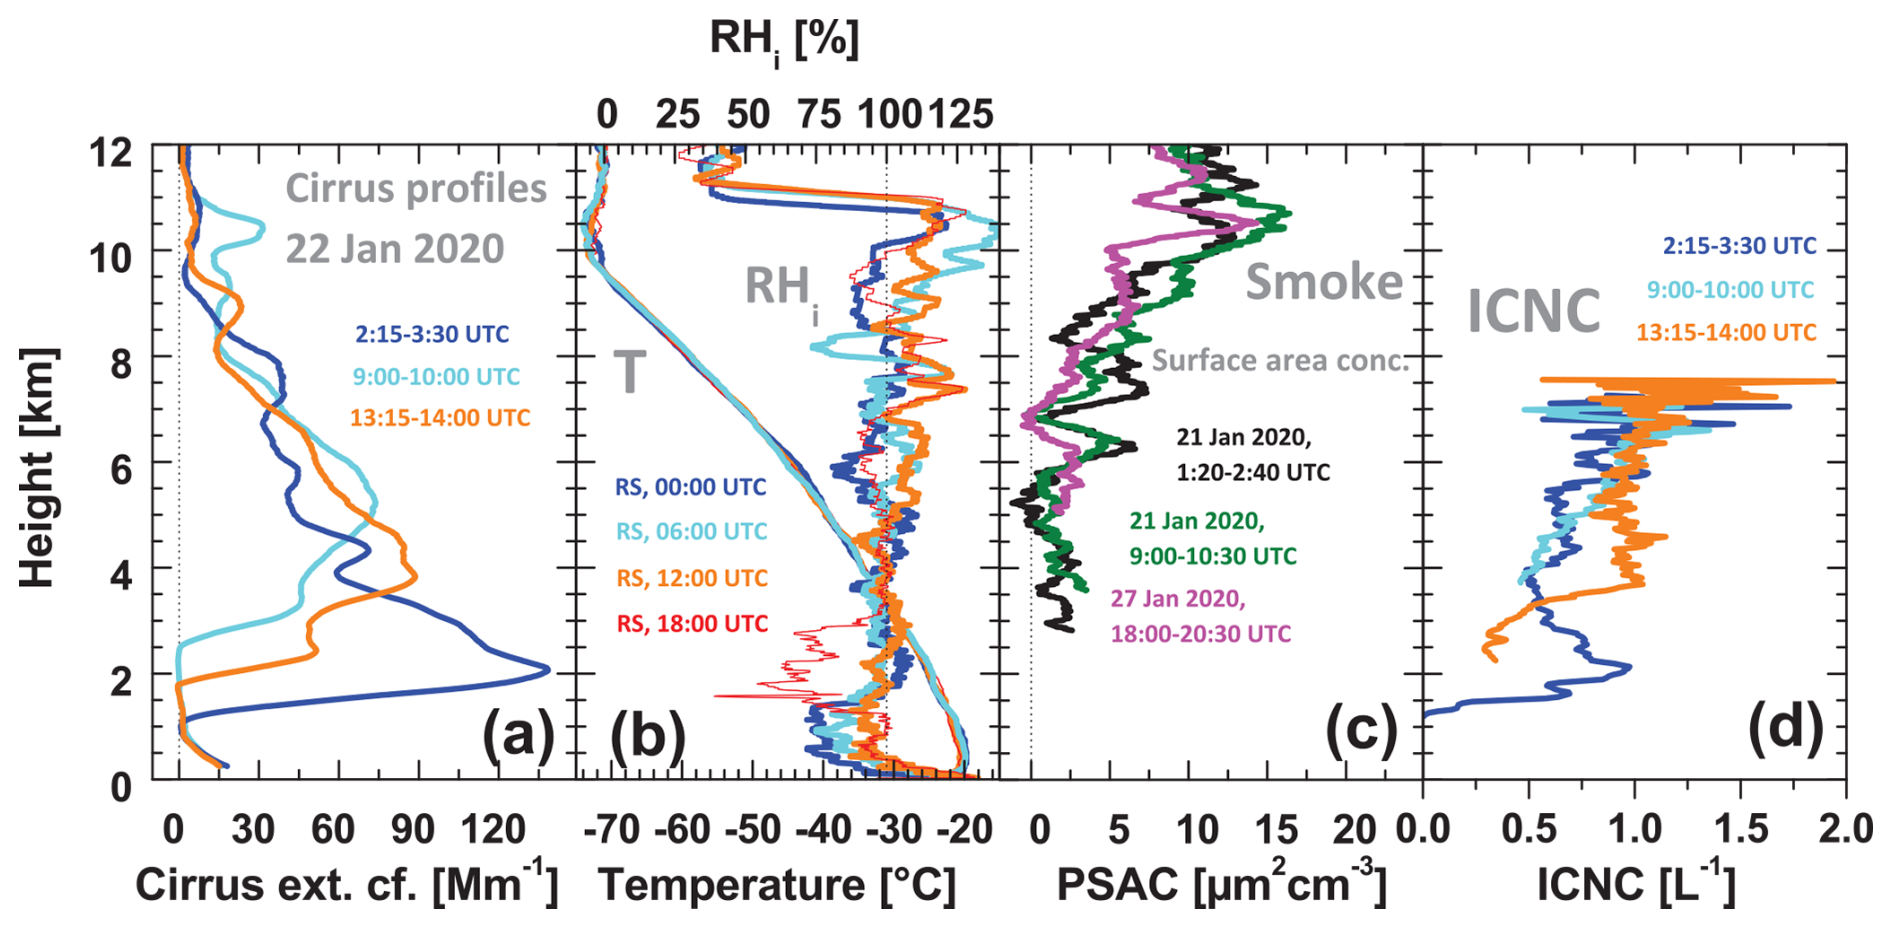
Figure 8Synergistic overview of (a) cirrus geometrical and optical properties, (b) meteorological conditions in terms of temperature (T) and relative humidity over ice (RHi) measured with four radiosondes (RSs), (c) smoke pollution levels in terms of the PSAC, and (d) ice crystal number concentrations (ICNCs) in the ice virga, obtained from combined lidar–radar observations.
According to the HYSPLIT (HYbrid Single-Particle Lagrangian Integrated Trajectory) backward trajectories in Fig. 6, the humid air mass, in which the cirrus formed, originated from the Pacific Ocean. The air mass spent 4–5 d in the polluted upper troposphere over the Arctic before the first cirrus were detected above Polarstern on 21 January 2020. During these 4–5 d, there was sufficient time for the entrainment of aged wildfire smoke particles into the moist air from above, i.e., from the main smoke reservoir in the lower stratosphere (Ohneiser et al., 2021a). As mentioned in Sect. 3.2, the aerosol observations suggest that the smoke INP reservoir was permanently refilled from above during the cirrus evolution processes on 21–22 January 2019. This is highlighted in Fig. 5 (see “INPs” written in the figure above and within the cirrus-top region).
As can be seen in Fig. 5, the lidar is able to detect any cirrus structure from the top of the cirrus (ice generation cells) at 10.5 km height to the base of the virga. In contrast, the cloud radar reflectivity was useful for further analysis up to heights of 7.5 km only. The dashed blue line in Fig. 5 marks the height up to which radar reflectivity data were available for the derivation of cirrus microphysical properties.
The microphysical properties in the virga height range in Fig. 7 were derived from the combined lidar and radar observations by means of our LIRAS-ice analysis scheme (Sect. 2.4). Figure 7a shows the data field that served as measured input in the retrieval. The derived IWC mostly shows values from 0.0001 to 0.01 g m−3, while the ICNC ranged from 0.1 to about 50 L−1. The analysis of the lidar–radar observations, performed from 17:00 to 24:00 UTC, became difficult and is less trustworthy. The vertical white columns and the white areas in Fig. 7 indicate fields without retrieval products. In addition, the results at the boundaries of analyzed data fields must be interpreted with caution, as lidar and radar do not see exactly the same air volumes; thus, Z and E can frequently no longer be combined without introducing significant uncertainties into the products.
Many ice virga show up as pronounced coherent structures in the height–time plots of IWC and ICNC in Fig. 7b and c, respectively. We assume that each well-resolved virga is linked to a singular, individual ice nucleation event so that the virga occurrence frequency is equal or almost equal to the occurrence frequency of updraft and ice nucleation events. The retrieved ICNC values and the observed temporal width and structural complexity of the virga contain information about updraft strength, duration, and complexity (from single events to complex clusters of updrafts) and respective ice nucleation intensity. The short-term updraft periods during which the nucleation events develop occur randomly and are omnipresent in the upper troposphere as a result of gravity wave activity (Podglajen et al., 2016), wind-shear-induced turbulence production, and orographic influences. More details on the origin of updrafts and their role in ice nucleation processes are given in Sects. 3.4 and 3.5 and in Part 2 (Ansmann et al., 2025).
The temporal width of the virga in Fig. 7 ranged from about 10 to 20 min and sometimes even up to 30 min. The corresponding horizontal extent was about 3–10 km when considering the radiosonde observations of wind speeds of around 5 m s−1 in the height range from 4 to 8 km on that day. In well-resolved virga, ICNC ranged from 1 to 10 L−1 in most cases, but values of up to about 50 L−1 were also sometimes visible. When considering that the measured INP reservoir in the upper troposphere contained about 2000 potential smoke INPs per liter and was permanently refilled from above according to the discussion in Sect. 3.2, even numerous short-term lofting events, experienced by a given smoke-filled air parcel, would not lead to an empty or almost depleted INP reservoir; thus, favorable conditions for homogeneous freezing were not given and freezing of the liquid background aerosol particles could not start and dominate ice nucleation. This aspect is further discussed in the simulation study in Part 2 (Ansmann et al., 2025). We may, therefore, conclude that heterogeneous ice nucleation on the smoke particles in the upper troposphere was widely responsible for the observed cirrus fields. However, even in the case of a highly polluted UTLS, we cannot completely rule out that situations occasionally occurred in which almost smoke-free conditions were given in a number of air parcels after the consumption of all or most of the smoke INPs; hence, homogeneous freezing became an additional ice nucleation option. As shown by Rolf et al. (2012), Krämer et al. (2016), and Kärcher et al. (2022), homogeneous ice nucleation is possible in the presence of a low number of INPs when the updrafts are strong enough so that the diffusional growth of the few heterogeneously nucleated ice crystals by water vapor deposition is not sufficient to reduce the relative humidity in the ascending air parcel significantly and to prevent that the ice saturation ratio (Si) in the lofted air parcel reaches and exceeds the onset ice saturation ratio (Si,on) for homogeneous freezing.
Figure 8, finally, compiles measured cirrus geometrical and optical properties, meteorological conditions, cirrus relevant smoke properties, and ICNC values. Figure 8a shows mean height profiles (1–2.5 h mean profiles) of the cirrus extinction coefficient, indicating the cirrus height range from top to bottom. Three different periods of cirrus evolution on 22 January (02:00–14:00 UTC) are selected. Figure 8b indicates rather constant meteorological conditions in terms of temperature and relative humidity over ice (RHi), as measured with radiosondes launched at 23:00 UTC on 21 January and at 05:00, 11:00, and 17:00 UTC on 22 January. The ice saturation ratio (Si) varied around 1.0 (equilibrium conditions, RHi = 100 %) in the more than 6–8 km deep virga height range and showed values up to 1.2–1.35 at the top of the cirrus system (in the ice nucleation zone).
The high Si value of 1.35 at cirrus top, observed with the 06:00 UTC radiosonde at the beginning of the evolution of a new cirrus complex, represents a frequently observed MOSAiC cirrus-top ice saturation ratio. This value is significantly lower than the values of Si > 1.47 reported by Dekoutsidis et al. (2024) for the Arctic cirrus-top region. High Si values above 1.47 indicate the dominance of homogeneous freezing, whereas values around 1.35 point to the dominance of heterogeneous ice nucleation by inefficient INPs, as expected when smoke particles (organic particles) serve as INPs. Si values > 1.25 would probably not be observable if efficient INPs such as mineral dust particles were present in the cirrus-top region (Ansmann et al., 2019; Dekoutsidis et al., 2024).
Figure 8c shows profiles of the particle surface area concentration (PSAC) of the smoke particles as estimated from lidar observations under clear-sky conditions in the morning of 21 January 2020 and on 27 January 2020 after the long-lasting 6 d period with strong cirrus development. The PSAC maximum was found around and just above the tropopause, as always during the winter months from November 2019 to March 2020 (Ohneiser et al., 2021a). The PSAC profiles, observed before and after the period with strong cirrus formation from 21 to 26 January 2020 (further discussed in Part 2; Ansmann et al., 2025), do not indicate any decrease in the PSAC values. As mentioned already, we assume that the upper-tropospheric smoke INP reservoir was permanently refilled by a downward flux of particles from the lower stratosphere to the upper troposphere. Figure 8d finally presents mean ICNC profiles (mean values for approximately 1 h) for the virga height range from 7.5 km down to about 1.5 km. The retrieved mean ICNC values are mostly between 0.5 and 1 L−1. Note that the hourly mean profiles cover both virga events as well as virga-free time periods. The obtained hourly mean ICNC numbers are, thus, lower than the ones in the pronounced virga in Fig. 7.
3.4 ICNC observations in virga: the link to the simulations in Part 2
Figure 9 shows further ICNC height–time plots for cirrus events observed on 23 November 2019, 6 December 2019, and 24 January 2020. The 6 December case was partly discussed in Engelmann et al. (2021). Typical ICNC values in the virga ranged again from 1 to 10 L−1. Moreover, a virga pattern with ICNC values from 10 to 50 L−1 occurred. Radar observations almost up to cirrus top (at 8.5 km height) were possible on 6 December; thus, ICNC values up to the ice nucleation zone could be retrieved on this day. As mentioned in the prior section, the ICNC color displays suggest that the observed virga structures and virga ICNCs contain information about the strength of updraft events (lofting amplitude and lofting duration) and the corresponding ice nucleation intensity in the cirrus generation cells close to cloud top. The virga ICNCs were used as a guide in the development of our simulation strategy in Part 2 (Ansmann et al., 2025) and as orientation in the design of realistic simulation scenarios.
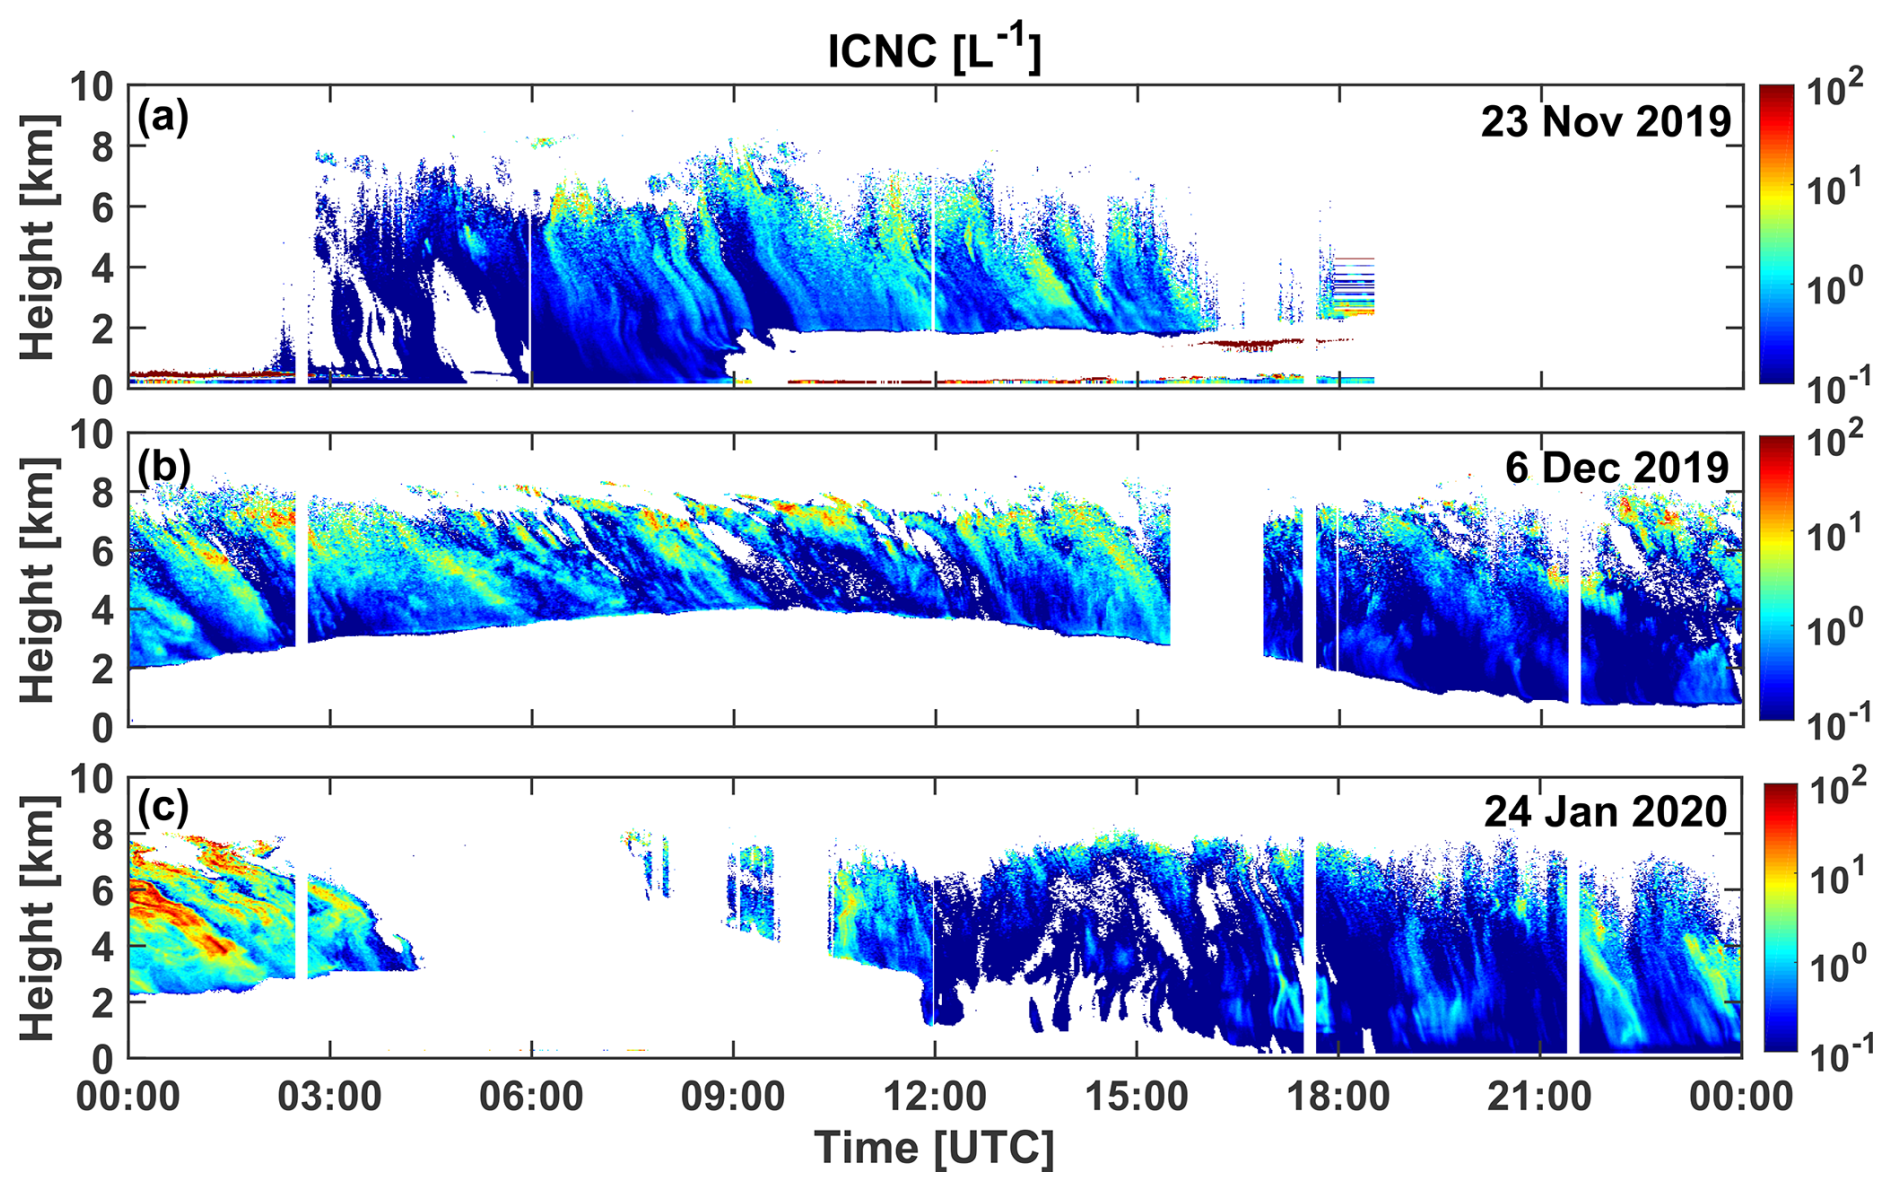
Figure 9ICNC height–time plots obtained by means of the LIRAS-ice retrieval scheme in the virga zones for (a) 23 November 2019 (at 85.7° N, 120°E), (b) 6 December 2019 (at 86.1° N, 122°E), and (c) 24 January 2020 (at 87.4° N, 93°E). The cirrus-top height was at about (a) 9 km on 23 November, (b) 8.5 km on 6 December, and (c) 10 km on 24 January.
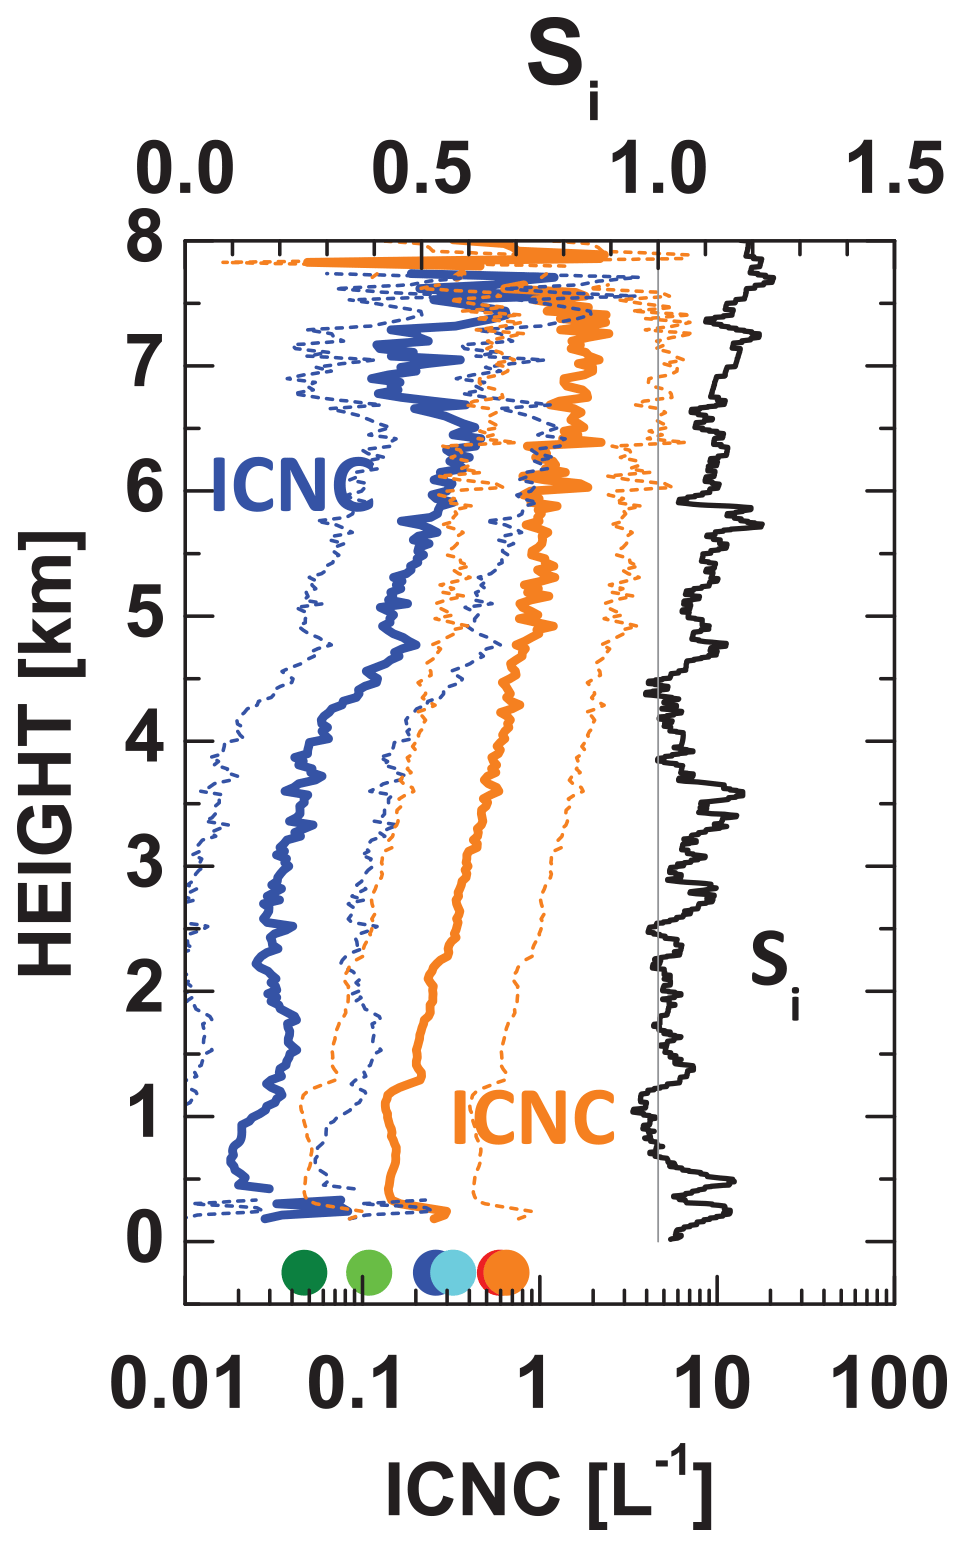
Figure 10Comparison of hourly mean values of ICNC measured with a 2DVD aboard Polarstern (circles at the bottom of the panel – blue: 03:00–4:00 UTC; cyan: 04:00–05:00 UTC; olive 05:00–06:00 UTC; green: 06:00–07:00 UTC; red: 07:00–08:00 UTC; orange: 08:00–09:00 UTC) with ICNC profiles retrieved from the lidar–radar observations (2 h mean profiles – blue: 03:00–05:00 UTC; orange: 07:00–09:00 UTC). The dashed curves show the uncertainty margin (mean profile multiplied and divided by 3). The ice saturation ratio (Si) measured with the radiosonde launched at 05:00 UTC is shown in black. The Si profile indicates that the evaporation of ice crystals did not occur over the entire sedimentation height range.
Figure 9 also provides an impression about a possible impact of crystal–crystal collisions and aggregation events on the ICNC height dependence. In many cases, the ICNC decreases with decreasing height within the virga. Besides aggregation effects, the sublimation of crystals also contributes to the reduction in the ICNC with decreasing height. According to Kienast-Sjögren et al. (2013), aggregation processes are of minor importance at −60 to −75 °C. Furthermore, aggregation effects seem to be of low importance when ICNC < 10 L−1. Wolf et al. (2018) showed balloon-borne ICNC profile observations in an Arctic cirrus deck performed on 12 February 2016. The cirrus vertical structures were similar to the ones measured on 22 January 2020, discussed in the prior section. The ICNC values ranged from 1 to 10 L−1 in the height range from 6 to 11 km on 12 February 2016. A decrease in the ICNC from cirrus top to base was not visible in the shown data. In contrast, the studies of Field and Heymsfield (2003) and Mitchell et al. (2018) indicate that an underestimation of the ICNC at cirrus top from ICNC values in the upper part of the main observable virga zone by a factor of 2 (moderate impact) or even by a factor of 5 (strong impact) may occur and should be considered in the interpretation of ICNC profiles. Field and Heymsfield (2003) studied midlatitude cirrus with ICNC values of the order of 200 L−1 in the nucleation zone.
In the case of the MOSAiC observations, we assume that the virga ICNC values at 7.5–8 km height can be well used as ICNC estimates for the ice nucleation zones, as long as the retrieved ICNC are < 10 L−1, and that the cirrus-top ICNCs may be a factor of 2 higher than the observed virga ICNC values when the virga values are > 50 L−1.
3.4.1 ICNC comparison: 2DVD observations vs. lidar–radar retrievals
To check the overall quality of our virga ICNC retrievals, we used the opportunity of simultaneous 2DVD, lidar, and radar observations of ice virga reaching the ground on 23 November 2019 (Fig. 10). On this day, favorable calm and almost windless conditions were given with wind speeds of 0–3 m s−1 in the lowermost 400 m of the atmosphere, according to the radiosondes launched at 05:00 and 11:00 UTC. The cirrus virga reached the ground (Fig. 9a) so that the 2DVD aboard Polarstern could measure the incoming ice crystal flux. As can be seen in Fig. 10, the ice saturation ratio was > 1.0 down to the ground at 05:00–06:00 UTC so that the sublimation of ice crystals during falling is widely suppressed at that time. The temperature at ground was around −20 °C.
In Fig. 10, we compare 1 h mean disdrometer values with 2 h mean ICNC profiles. The agreement between the in situ observations and the remote-sensing products is reasonably good when considering an uncertainty of a factor 3 in the LIRAS-ice products. Both approaches show low ICNC values < 1 L−1 near the ground. The lowest remote-sensing height bin is 250 m above Polarstern. The decrease in the ICNC with decreasing height mainly reflects the increasing influence of the sublimation of ice crystals in the inhomogeneous virga fields below 4–5 km height, especially during the time period from 03:00 to 05:00 UTC (see Fig. 9a), before the 06:00 UTC sonde was launched at 05:00 UTC showing ice saturation ratios close to 1.0. Time periods without pronounced virga structures and, thus, with background-like conditions increased with decreasing height (below 5 km height), which was probably also the result of an increasing influence of sublimation processes with decreasing height. A significant aggregation impact is not very likely. The ICNC values in the uppermost part of the virga in Fig. 9a are between 0.1 and 10 L−1, whereas the respective 2 h mean values are between 0.1 and 2 L−1 in Fig. 10.
The 2DVD observations indicated crystal diameters clearly larger than 150 µm, and most crystals showed sizes of around 500 µm and bullet-rosette-like crystal shapes. Assuming a sedimentation velocity of around 50 cm s−1, the ice particle reached the ground after about 18 000 s when starting from the ice nucleation zone at 9 km height. The crystals could permanently grow over 5 h by water vapor uptake.
3.5 Microphysical properties of Arctic winter cirrus clouds: overview
Figure 11 provides an overview of the microphysical properties of 12 individual cirrus events (1 in November, 2 in December, 5 in January, and 4 in February). A total of 20 data sets of lidar and radar observations (averaged over 1–2 h), performed during the 12 cirrus events, were selected and analyzed. The 20 respective profiles of the ICNC, IWC, and cirrus extinction coefficient are shown in Fig. 11. Note again that the 1–2 h mean profiles cover virga and virga-free time periods. The values are, thus, lower than pure virga values, as discussed before.
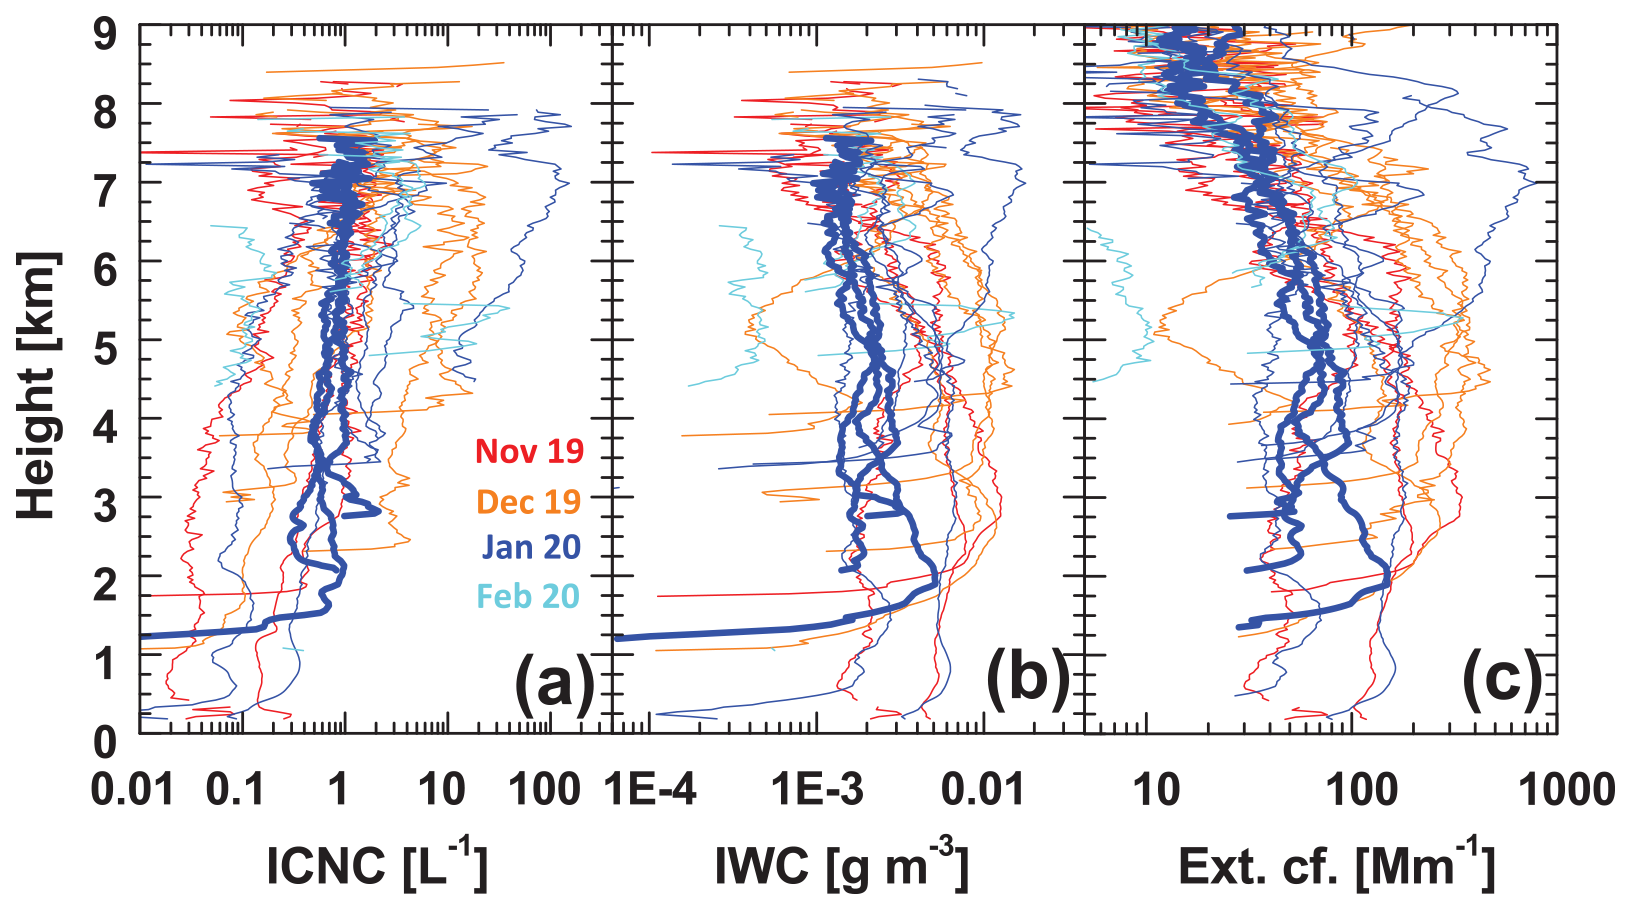
Figure 11Height profiles of (a) ice crystal number concentration (ICNC), (b) ice water content (IWC), and (c) cirrus extinction coefficient (532 nm). A total of 20 cirrus profiles are shown (mean profiles average over 1–2 h). November 2019 profiles are given in red, December 2019 profiles are given in orange, January 2020 profiles are given in blue, and February 2020 profiles are given in cyan. The three profiles measured on 22 January (see Fig. 8) are shown using thick blue lines.
The ICNC values in Fig. 11 cover a wide range, from 0.1 to more than 100 L−1, in the upper part of the retrieval height range. However, most values were between 0.1 and 10 L−1. The IWC showed values from 0.001 to 0.02 g m−3, while the cirrus extinction values accumulated between 30 and 300 Mm−1; these values are in good agreement with the statistical results shown in Fig. 3f in Sect. 3.1.
Rather similar values to those shown in Fig. 11 were obtained during an airborne field campaign at high northern latitudes (60–76° N, between Scandinavia and Greenland) in June and July 2021 (De La Torre Castro et al., 2023). The airborne in situ observations revealed median values of 1 L−1 (0.01–9 L−1, 25th–75th percentile) for the ICNC, and 0.0019 g m−3 (0.0002–0.011 g m−3, 25th–75th percentile) for the IWC. Cirrus extinction coefficients accumulated between 1 and 500 Mm−1.
At the end of our MOSAiC cirrus data analysis, the following question remains: “Why were the ICNC values in the central Arctic cirrus clouds, on average, so low?”. We hypothesize that the amplitudes of the omnipresent updrafts may have an important impact on the ICNC levels. The updraft amplitude defines the height range available for an air parcel to ascend. If the amplitude is sufficiently large so that the steadily increasing ice saturation ratio (Si) in the rising air parcel can reach and exceed the ice nucleation onset value (Si,on), ice crystals can form. The lower the amplitude, the lower the remaining lofting range for ice nucleation and, therefore, the lower the total number of ice crystals formed during an updraft event. More details on the dependence of the ICNC on the updraft amplitude are given in Part 2 (Ansmann et al., 2025).
Podglajen et al. (2016) quantified wave-induced Lagrangian fluctuations in temperature, vertical displacement of air parcels, and vertical velocity in the lower stratosphere (in the 15–18 km height range) over polar regions by using measurements with superpressure balloons (SPBs). Observations recorded every minute along SPB flights allowed the whole gravity wave spectrum (up- and downdraft events) to be described and provided unprecedented information on both the intrinsic frequency spectrum and the probability distribution function of wave fluctuations.
The observed vertical displacement of the balloons, i.e., the recorded updraft and downdraft events, was randomly distributed and mainly the result of the interference of gravity waves. These up and downdraft events showed a wide spectrum of amplitudes and updraft velocities. An important finding of Podglajen et al. (2016) is that updraft events with an amplitude of, e.g., 100 m occur an order of magnitude more frequently than updraft events with an amplitude of around 200 m. The following conclusion can be drawn from the balloon observations. The most frequently occurring rather shallow updrafts do not produce any ice. Their amplitudes are too low. The ice saturation ratio (Si,on), necessary for ice nucleation, is not reached. The most frequently occurring updraft events that contribute to ice production are those with low amplitudes. However they lead to low numbers of ice crystals. Thus, the ice nucleation events caused by frequently occurring shallow updrafts dominate the cirrus characteristics, including the ICNC levels. The strong updraft events with large amplitude, leading to large ICNC values of 300–1000 L−1, are seldom, but they do occur from time to time. Another aspect of the strong decrease in the updraft occurrence frequency with increasing updraft amplitude is that the conditions for heterogeneous ice nucleation are much more favorable than for homogeneous freezing events, as the onset values of Si,on are lower in the case of heterogeneous ice nucleation, compared with homogeneous freezing onset values, so that lower amplitudes are sufficient to initiate heterogeneous ice nucleation. Hence, there are many opportunities (updraft events) to start heterogeneous ice nucleation but only a few opportunities to initiate homogeneous freezing. As long as INPs are available in rising air parcels, they control ice formation and heterogeneous ice nucleation dominates.
For the first time, an observational Arctic cirrus data set was presented that covers the entire winter half year from October to March. Lidar and cloud radar observations of aerosol and cloud profiles were performed aboard the German ice breaker Polarstern at latitudes > 85° N as part of the MOSAiC expedition in 2019–2020. The winter cirrus clouds were characterized in terms of their geometrical, optical, and microphysical properties. The ice clouds were optically thin with cloud mean extinction coefficients mostly ranging from about 30 to 300 Mm−1, while IWC and ICNC values were frequently between 0.001 and 0.02 g m−3 and between 0.01 and 10 L−1, respectively. In ice virga, typical ICNC values accumulated between 1 and 10 L−1, and values of up to 50 L−1 occurred in many cases; however, ICNC values rarely exceeded 100 L−1. We hypothesized that short-term updrafts with shallow amplitudes were the reason for the observed low ICNC values.
The cirrus layers, observed from October 2019 to March 2020, developed in a wildfire-smoke-polluted environment. The main goal of the data analysis in this paper (Part 1) was to provide observational evidence that the Siberian wildfire smoke (organic aerosol particles) significantly influenced ice nucleation in the upper troposphere during the MOSAiC winter months. Three observational findings support our hypothesis that the smoke pollution contributed or even dominated cirrus formation. These arguments are summarized in Fig. 12. First, we observed a highly polluted upper troposphere throughout the entire winter half year. A total of 101 clear-sky PSAC observations from November 2019 to February 2020 are shown in Fig. 12. The observation of an enhanced upper-tropospheric aerosol load suggested that the INP reservoir was permanently refilled from above, i.e., from the lower stratosphere, so that a large number of INPs was available to control ice nucleation processes in the upper troposphere throughout the MOSAiC winter half year. The respective 532 nm particle extinction coefficients were 20 times higher than the extinction coefficients for background aerosol conditions. Second, the observed smoke PSAC values of 10 ± 5 µm2 cm−3 in the upper troposphere were high enough to dominate ice nucleation and widely suppress homogeneous freezing events. The simulations in Part 2 (Ansmann et al., 2025) will provide more details. Third, the frequently observed maximum cirrus ice saturation ratios of 1.3–1.5, observed with radiosondes in extended cirrus fields at temperatures from −60 to −75 °C, point to the dominance of heterogeneous ice nucleation on inefficient INPs, as is expected when glassy smoke particles serve as INPs. This is an important finding and corroborates the assumption that aged wildfire smoke alone was responsible for heterogeneous ice nucleation. In the presence of efficient INPs, such as mineral dust particles, the maximum ice saturation ratios would probably have been below 1.25 (Ullrich et al., 2017; Ansmann et al., 2019; Dekoutsidis et al., 2024). On the other hand, in cases with dominant homogeneous freezing, the maximum ice saturation ratios should have been found mostly between 1.5 and 1.6 (Dekoutsidis et al., 2024).
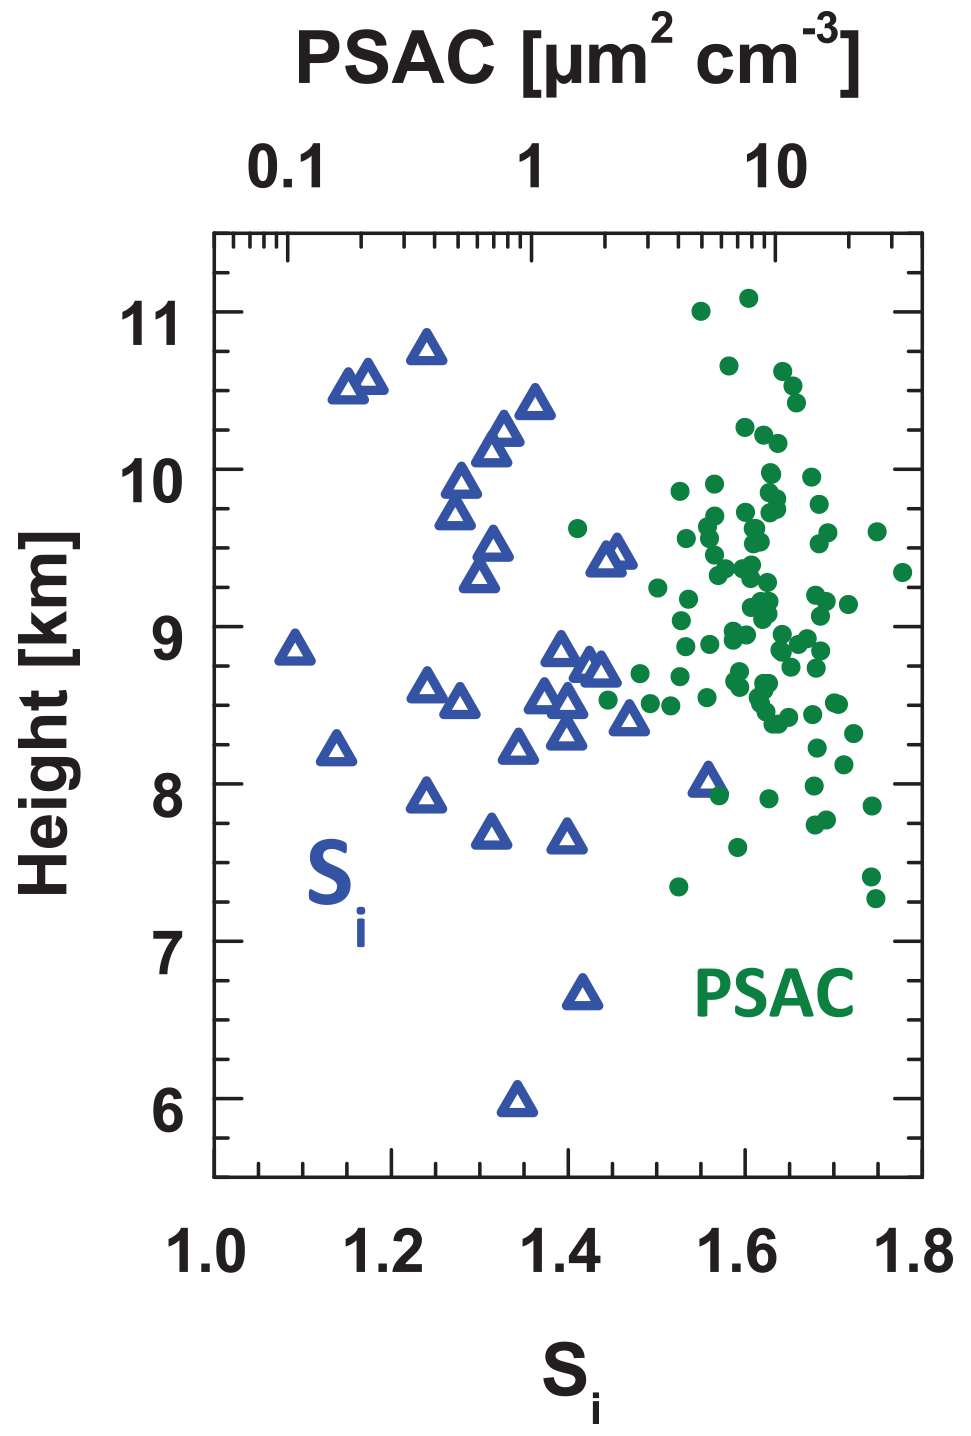
Figure 12Maximum cirrus ice saturation ratios (Si,max(z); open blue triangles). Si(z) profiles measured with radiosondes that ascended through 30 extended cirrus fields were analyzed. In addition, particle surface area concentrations (PSACs; green circles) for the tropopause region, obtained from 101 clear-sky lidar observations (November 2019–February 2020), are shown.
Disregarding all of these facts pointing to a strong impact of wildfire smoke on cirrus formation over the North Pole region in the winter of 2019–2020, we cannot rule out that homogeneous freezing also contributed to cirrus formation. It is a reasonable option that a certain number of air parcels were free or almost free of smoke INPs after numerous updraft events so that conditions became favorable for homogeneous ice nucleation on background aerosol particles. In Part 2 (Ansmann et al., 2025), we will continue our Arctic cirrus studies and present the key findings of the MOSAiC-related simulation studies.
Polly lidar observations (level-0 data, measured signals) are available from the PollyNet database (Polly, 2024). All of the analysis products are available from TROPOS upon request (polly@tropos.de) and from https://doi.org/10.1594/PANGAEA.935539 (Ohneiser et al., 2021b). Cloud radar data were downloaded from the Cloudnet database at https://doi.org/10.60656/00945b67503743f0 (Engelmann et al., 2023). MOSAiC radiosonde data are available from https://doi.org/10.1594/PANGAEA.928656 (Maturilli et al., 2021, 2022). Backward-trajectory analysis has been performed by air mass transport computation with the NOAA (National Oceanic and Atmospheric Administration) HYSPLIT (HYbrid Single-Particle Lagrangian Integrated Trajectory) model (http://ready.arl.noaa.gov/HYSPLIT_traj.php, HYSPLIT, 2024). LIRAS-ice products are available from the corresponding author upon request.
The paper was written and designed by AA and CJ. The aerosol and cloud data analyses were performed by CJ, JR, JB, KO, HG, JH, DA, TG, and PS. RE, HGr, MR, JH, and DA took care of the lidar observations aboard Polarstern during the 1-year MOSAiC expedition. SD was responsible for the data analysis of the Polarstern radiosonde observations and related quality assurance efforts. DAK and UW were involved in the interpretation of the findings. All co-authors were actively involved in the extended discussions and the elaboration of the final design of the manuscript.
At least one of the (co-)authors is a member of the editorial board of Atmospheric Chemistry and Physics. The peer-review process was guided by an independent editor, and the authors also have no other competing interests to declare.
Publisher's note: Copernicus Publications remains neutral with regard to jurisdictional claims made in the text, published maps, institutional affiliations, or any other geographical representation in this paper. While Copernicus Publications makes every effort to include appropriate place names, the final responsibility lies with the authors.
Data used in this article were produced as part of the international “Multidisciplinary drifting Observatory for the Study of the Arctic Climate” (MOSAiC) expedition with the tag MOSAiC20192020 and the project ID AWI_PS122_00. The authors would like to thank everyone who contributed to the measurements used here (Nixdorf et al., 2021). Radiosonde data were obtained through a partnership between the leading Alfred Wegener Institute; the Atmospheric Radiation Measurement user facility, a US Department of Energy facility managed by the Biological and Environmental Research Program; and the German Weather Service (DWD). We would like to thank the RV Polarstern crew for their perfect logistical support during the 1-year MOSAiC expedition. We also wish to thank Esther Horvath and Jakob Stark for taking so many nice pictures during the MOSAiC expedition.
The “Multidisciplinary drifting Observatory for the Study of the Arctic Climate” (MOSAiC) program was supported by the German Federal Ministry for Education and Research (BMBF) via funding to the Alfred-Wegener-Institut Helmholtz-Zentrum für Polar- und Meeresforschung (AWI) and the Polarstern expedition PS122 (under grant no. N-2014-H-060_Dethloff). The lidar analysis on smoke–cirrus interaction was further supported by BMBF funding of the SCiAMO project (grant no. MOSAIC-FKZ 03F0915A). The radiosonde program was funded by the AWI awards AFMOSAiC-1_00 and AWI_PS122_00, the US Department of Energy Atmospheric Radiation Measurement Program, and the German Weather Service. This project has also received funding from the European Union's Horizon 2020 Research and Innovation program “ACTRIS-2 Integrating Activities” (H2020-INFRAIA-2014 – 2015, grant no. 654109) as well as from the European Union's Horizon Europe program (CleanCloud, grant agreement no. 101137639). The authors were supported by funding from the Deutsche Forschungsgemeinschaft (DFG, German Research Foundation) – project no. 268020496 – TRR 172, within the Transregional Collaborative Research Center “ArctiC Amplification: Climate Relevant Atmospheric and SurfaCe Processes, and Feedback Mechanisms (AC)3”. Daniel A. Knopf was supported by the US Department of Energy's Atmospheric System Research program, Office of Biological and Environmental Research (grant no. DE-SC0021034).
This paper was edited by Martina Krämer and reviewed by two anonymous referees.
Abatzoglou, J. T., Williams, A. P., and Barbero, R.: Global emergence of anthropogenic climate change in fire weather indices, Geophys, Res. Lett., 46, 326–336, https://doi.org/10.1029/2018GL080959, 2019. a
Alpert, P. A., Aller, J. Y., and Knopf, D. A.: Initiation of the ice phase by marine biogenic surfaces in supersaturated gas and supercooled aqueous phases, Phys. Chem. Chem. Phys., 13, 19882–19894, https://doi.org/10.1039/C1CP21844A, 2011. a
Ansmann, A., Wandinger, U., Riebesell, M. A., Weitkamp, C., and Michaelis, W.: Independent measurement of extinction and backscatter profiles in cirrus clouds by using a combined Raman elastic-backscatter lidar, Appl. Optics, 31, 7113–7131, https://doi.org/10.1364/AO.31.007113, 1992. a
Ansmann, A., Mamouri, R.-E., Bühl, J., Seifert, P., Engelmann, R., Hofer, J., Nisantzi, A., Atkinson, J. D., Kanji, Z. A., Sierau, B., Vrekoussis, M., and Sciare, J.: Ice-nucleating particle versus ice crystal number concentrationin altocumulus and cirrus layers embedded in Saharan dust:a closure study, Atmos. Chem. Phys., 19, 15087–15115, https://doi.org/10.5194/acp-19-15087-2019, 2019. a, b, c, d
Ansmann, A., Ohneiser, K., Mamouri, R.-E., Knopf, D. A., Veselovskii, I., Baars, H., Engelmann, R., Foth, A., Jimenez, C., Seifert, P., and Barja, B.: Tropospheric and stratospheric wildfire smoke profiling with lidar: mass, surface area, CCN, and INP retrieval, Atmos. Chem. Phys., 21, 9779–9807, https://doi.org/10.5194/acp-21-9779-2021, 2021. a, b
Ansmann, A., Ohneiser, K., Chudnovsky, A., Knopf, D. A., Eloranta, E. W., Villanueva, D., Seifert, P., Radenz, M., Barja, B., Zamorano, F., Jimenez, C., Engelmann, R., Baars, H., Griesche, H., Hofer, J., Althausen, D., and Wandinger, U.: Ozone depletion in the Arctic and Antarctic stratosphere induced by wildfire smoke, Atmos. Chem. Phys., 22, 11701–11726, https://doi.org/10.5194/acp-22-11701-2022, 2022. a
Ansmann, A., Ohneiser, K., Engelmann, R., Radenz, M., Griesche, H., Hofer, J., Althausen, D., Creamean, J. M., Boyer, M. C., Knopf, D. A., Dahlke, S., Maturilli, M., Gebauer, H., Bühl, J., Jimenez, C., Seifert, P., and Wandinger, U.: Annual cycle of aerosol properties over the central Arctic during MOSAiC 2019–2020 – light-extinction, CCN, and INP levels from the boundary layer to the tropopause, Atmos. Chem. Phys., 23, 12821–12849, https://doi.org/10.5194/acp-23-12821-2023, 2023. a, b, c
Ansmann, A., Veselovskii, I., Ohneiser, K., and Chudnovsky, A.: Comment on “Stratospheric Aerosol Composition Observed by the Atmospheric Chemistry Experiment Following the 2019 Raikoke Eruption” by Boone et al., J. Geophys. Res.-Atmos., 129, e2022JD038080, https://doi.org/10.1029/2022JD038080, 2024. a, b, c
Ansmann, A., Jimenez, C., Knopf, D. A., Roschke, J., Bühl, J., Ohneiser, K., and Engelmann, R.: Impact of wildfire smoke on Arctic cirrus formation – Part 2: Simulation of MOSAiC 2019–2020 cases, Atmos. Chem. Phys., 25, 4867–4884, https://doi.org/10.5194/acp-25-4867-2025, 2025. a, b, c, d, e, f, g, h, i, j, k, l, m, n, o, p
Baars, H., Kanitz, T., Engelmann, R., Althausen, D., Heese, B., Komppula, M., Preißler, J., Tesche, M., Ansmann, A., Wandinger, U., Lim, J.-H., Ahn, J. Y., Stachlewska, I. S., Amiridis, V., Marinou, E., Seifert, P., Hofer, J., Skupin, A., Schneider, F., Bohlmann, S., Foth, A., Bley, S., Pfüller, A., Giannakaki, E., Lihavainen, H., Viisanen, Y., Hooda, R. K., Pereira, S. N., Bortoli, D., Wagner, F., Mattis, I., Janicka, L., Markowicz, K. M., Achtert, P., Artaxo, P., Pauliquevis, T., Souza, R. A. F., Sharma, V. P., van Zyl, P. G., Beukes, J. P., Sun, J., Rohwer, E. G., Deng, R., Mamouri, R.-E., and Zamorano, F.: An overview of the first decade of PollyNET: an emerging network of automated Raman-polarization lidars for continuous aerosol profiling, Atmos. Chem. Phys., 16, 5111–5137, https://doi.org/10.5194/acp-16-5111-2016, 2016. a
Baars, H., Ansmann, A., Ohneiser, K., Haarig, M., Engelmann, R., Althausen, D., Hanssen, I., Gausa, M., Pietruczuk, A., Szkop, A., Stachlewska, I. S., Wang, D., Reichardt, J., Skupin, A., Mattis, I., Trickl, T., Vogelmann, H., Navas-Guzmán, F., Haefele, A., Acheson, K., Ruth, A. A., Tatarov, B., Müller, D., Hu, Q., Podvin, T., Goloub, P., Veselovskii, I., Pietras, C., Haeffelin, M., Fréville, P., Sicard, M., Comerón, A., Fernández García, A. J., Molero Menéndez, F., Córdoba-Jabonero, C., Guerrero-Rascado, J. L., Alados-Arboledas, L., Bortoli, D., Costa, M. J., Dionisi, D., Liberti, G. L., Wang, X., Sannino, A., Papagiannopoulos, N., Boselli, A., Mona, L., D'Amico, G., Romano, S., Perrone, M. R., Belegante, L., Nicolae, D., Grigorov, I., Gialitaki, A., Amiridis, V., Soupiona, O., Papayannis, A., Mamouri, R.-E., Nisantzi, A., Heese, B., Hofer, J., Schechner, Y. Y., Wandinger, U., and Pappalardo, G.: The unprecedented 2017–2018 stratospheric smoke event: decay phase and aerosol properties observed with the EARLINET, Atmos. Chem. Phys., 19, 15183–15198, https://doi.org/10.5194/acp-19-15183-2019, 2019. a, b
Bailey, M. and Hallett, J.: Growth Rates and Habits of Ice Crystals between −20° and −70 °C, J. Atmos. Sci., 61, 514–544, https://doi.org/10.1175/1520-0469(2004)061<0514:GRAHOI>2.0.CO;2, 2004. a, b
Bailey, M. and Hallett, J.: Ice Crystal Linear Growth Rates from −20° to −70 °C: Confirmation from Wave Cloud Studies, J. Atmos. Sci., 69, 390–402, https://doi.org/10.1175/JAS-D-11-035.1, 2012. a, b
Beer, C. G., Hendricks, J., and Righi, M.: A global climatology of ice-nucleating particles under cirrus conditions derived from model simulations with MADE3 in EMAC, Atmos. Chem. Phys., 22, 15887–15907, https://doi.org/10.5194/acp-22-15887-2022, 2022. a
Beer, C. G., Hendricks, J., and Righi, M.: Impacts of ice-nucleating particles on cirrus clouds and radiation derived from global model simulations with MADE3 in EMAC, Atmos. Chem. Phys., 24, 3217–3240, https://doi.org/10.5194/acp-24-3217-2024, 2024. a
Bühl, J., Seifert, P., Radenz, M., Baars, H., and Ansmann, A.: Ice crystal number concentration from lidar, cloud radar and radar wind profiler measurements, Atmos. Meas. Tech., 12, 6601–6617, https://doi.org/10.5194/amt-12-6601-2019, 2019. a, b, c, d, e, f, g, h
Cunningham, C., Williamson, G., and Bowman, D.: Increasing frequency and intensity of the most extreme wildfires on Earth, Nat. Ecol. Evol., 12, 1420–1425, https://doi.org/10.1038/s41559-024-02452-2, 2024. a
De La Torre Castro, E., Jurkat-Witschas, T., Afchine, A., Grewe, V., Hahn, V., Kirschler, S., Krämer, M., Lucke, J., Spelten, N., Wernli, H., Zöger, M., and Voigt, C.: Differences in microphysical properties of cirrus at high and mid-latitudes, Atmos. Chem. Phys., 23, 13167–13189, https://doi.org/10.5194/acp-23-13167-2023, 2023. a, b, c
Dekoutsidis, G., Wirth, M., and Groß, S.: The effects of warm-air intrusions in the high Arctic on cirrus clouds, Atmos. Chem. Phys., 24, 5971–5987, https://doi.org/10.5194/acp-24-5971-2024, 2024. a, b, c, d
DeMott, P. J., Prenni, A. J., Liu, X., Kreidenweis, S. M., Petters, M. D., Twohy, C. H., Richardson, M. S., Eidhammer, T., and Rogers, D. C.: Predicting global atmospheric ice nuclei distributions and their impacts on climate, P. Natl. Acad. Sci. USA, 107, 11217–11222, https://doi.org/10.1073/pnas.0910818107, 2010. a
Engelmann, R., Kanitz, T., Baars, H., Heese, B., Althausen, D., Skupin, A., Wandinger, U., Komppula, M., Stachlewska, I. S., Amiridis, V., Marinou, E., Mattis, I., Linné, H., and Ansmann, A.: The automated multiwavelength Raman polarization and water-vapor lidar PollyXT: the neXT generation, Atmos. Meas. Tech., 9, 1767–1784, https://doi.org/10.5194/amt-9-1767-2016, 2016. a, b
Engelmann, R., Ansmann, A., Ohneiser, K., Griesche, H., Radenz, M., Hofer, J., Althausen, D., Dahlke, S., Maturilli, M., Veselovskii, I., Jimenez, C., Wiesen, R., Baars, H., Bühl, J., Gebauer, H., Haarig, M., Seifert, P., Wandinger, U., and Macke, A.: Wildfire smoke, Arctic haze, and aerosol effects on mixed-phase and cirrus clouds over the North Pole region during MOSAiC: an introduction, Atmos. Chem. Phys., 21, 13397–13423, https://doi.org/10.5194/acp-21-13397-2021, 2021. a, b, c, d
Engelmann, R., Althausen, D., Baars, H., Griesche, H., Hofer, J., Radenz, M., and Seifert, P.: Custom collection of categorize data from RV Polarstern between 11 Oct 2019 and 30 Sep 2020, ACTRIS Cloud remote sensing data centre unit (CLU) [data set], https://doi.org/10.60656/00945b67503743f0, 2023. a, b
Fetterer, F., Knowles, K., Meier, W. N., Savoie, M., and Windnagel, A. K.: Sea Ice Index, Version 3, Monthly Sea Ice Extent, NSIDC: National Snow and Ice Data Center, Boulder, Colorado, USA [data set], https://doi.org/10.7265/N5K072F8, 2017. a
Field, P. R. and Heymsfield, A. J.: Aggregation and Scaling of Ice Crystal Size Distributions, J. Atmos. Sci., 60, 544–560, https://doi.org/10.1175/1520-0469(2003)060<0544:AASOIC>2.0.CO;2, 2003. a, b
Garnier, A., Pelon, J., Vaughan, M. A., Winker, D. M., Trepte, C. R., and Dubuisson, P.: Lidar multiple scattering factors inferred from CALIPSO lidar and IIR retrievals of semi-transparent cirrus cloud optical depths over oceans, Atmos. Meas. Tech., 8, 2759–2774, https://doi.org/10.5194/amt-8-2759-2015, 2015. a
Gaudek, T.: Co-located observations of liquid and ice precipitation hydrometeors with a two-dimensional video disdrometer, a holographic cloud in-situ sonde, and active remote sensing, MS thesis, Leipzig University, 65 pp., https://nbn-resolving.org/urn:nbn:de:bsz:15-qucosa2-941957 (last access: 22 April 2025) 2024. a
Giannakaki, E., Balis, D. S., Amiridis, V., and Kazadzis, S.: Optical and geometrical characteristics of cirrus clouds over a Southern European lidar station, Atmos. Chem. Phys., 7, 5519–5530, https://doi.org/10.5194/acp-7-5519-2007, 2007. a
Haag, W. and Kärcher, B.: The impact of aerosols and gravity waves on cirrus clouds at midlatitudes, J. Geophys. Res.-Atmos., 109, D12202, https://doi.org/10.1029/2004JD004579, 2004. a
Haarig, M., Engelmann, R., Ansmann, A., Veselovskii, I., Whiteman, D. N., and Althausen, D.: 1064 nm rotational Raman lidar for particle extinction and lidar-ratio profiling: cirrus case study, Atmos. Meas. Tech., 9, 4269–4278, https://doi.org/10.5194/amt-9-4269-2016, 2016. a
Heymsfield, A. J., Krämer, M., Luebke, A., Brown, P., Cziczo, D. J., Franklin, C., Lawson, P., Lohmann, U., McFarquhar, G., Ulanowski, Z., and Tricht, K. V.: Cirrus Clouds, Meteor. Mon., 58, 2.1–2.26, https://doi.org/10.1175/AMSMONOGRAPHS-D-16-0010.1, 2017. a, b
Hofer, J., Althausen, D., Abdullaev, S. F., Makhmudov, A. N., Nazarov, B. I., Schettler, G., Engelmann, R., Baars, H., Fomba, K. W., Müller, K., Heinold, B., Kandler, K., and Ansmann, A.: Long-term profiling of mineral dust and pollution aerosol with multiwavelength polarization Raman lidar at the Central Asian site of Dushanbe, Tajikistan: case studies, Atmos. Chem. Phys., 17, 14559–14577, https://doi.org/10.5194/acp-17-14559-2017, 2017. a, b
Hogan, R. J., Francis, P., Flentje, H., Illingworth, A., Quante, M., and Pelon, J.: Characteristics of mixed-phase clouds. I: Lidar, radar and aircraft observations from CLARE'98, Q. J. Roy. Meteor. Soc., 129, 2089–2116, https://doi.org/10.1256/rj.01.208, 2003. a
HYSPLIT: HYbrid Single-Particle Lagrangian Integrated Trajectory model, backward trajectory calculation tool, NOAA [data set], https://www.ready.noaa.gov/hypub-bin/trajtype.pl?runtype=archive, last access: 20 January 2024. a, b
Jahl, L. G., Brubaker, T. A., Polen, M. J., Jahn, L. G., Cain, K. P., Bowers, B. B., Fahy, W. D., Graves, S., and Sullivan, R. C.: Atmospheric aging enhances the ice nucleation ability of biomass-burning aerosol, Sci. Adv., 7, eabd3440, https://doi.org/10.1126/sciadv.abd3440, 2021. a
Jahn, L. G., Polen, M. J., Jahl, L. G., Brubaker, T. A., Somers, J., and Sullivan, R. C.: Biomass combustion produces ice-active minerals in biomass-burning aerosol and bottom ash, P. Natl. Acad. Sci. USA, 117, 21928–21937, https://doi.org/10.1073/pnas.1922128117, 2020. a
Jimenez, C., Ansmann, A., Engelmann, R., Donovan, D., Malinka, A., Seifert, P., Wiesen, R., Radenz, M., Yin, Z., Bühl, J., Schmidt, J., Barja, B., and Wandinger, U.: The dual-field-of-view polarization lidar technique: a new concept in monitoring aerosol effects in liquid-water clouds – case studies, Atmos. Chem. Phys., 20, 15265–15284, https://doi.org/10.5194/acp-20-15265-2020, 2020. a
Jolly, W. M., Cochrane, M. A., Freeborn, P. H., Holden, Z. A., Brown, T. J., Williamson, G. J., and Bowman, D. M. J. S.: Climate-induced variations in global wildfire danger from 1979 to 2013, Nat. Commun., 6, 7537, https://doi.org/10.1038/ncomms8537, 2015. a
Josset, D., Pelon, J., Garnier, A., Hu, Y., Vaughan, M., Zhai, P.-W., Kuehn, R., and Lucker, P.: Cirrus optical depth and lidar ratio retrieval from combined CALIPSO-CloudSat observations using ocean surface echo, J. Geophys. Res.-Atmos., 117, D05207, https://doi.org/10.1029/2011JD016959, 2012. a
Jäger, H.: Long-term record of lidar observations of the stratospheric aerosol layer at Garmisch-Partenkirchen, J. Geophys. Res.-Atmos., 110, D08106, https://doi.org/10.1029/2004JD005506, 2005. a
Kanji, Z. A., Florea, O., and Abbatt, J. P. D.: Ice formation via deposition nucleation on mineral dust and organics: dependence of onset relative humidity on total particulate surface area, Environ. Res. Lett., 3, 025004, https://doi.org/10.1088/1748-9326/3/2/025004, 2008. a
Kienast-Sjögren, E., Spichtinger, P., and Gierens, K.: Formulation and test of an ice aggregation scheme for two-moment bulk microphysics schemes, Atmos. Chem. Phys., 13, 9021–9037, https://doi.org/10.5194/acp-13-9021-2013, 2013. a
Kirchmeier-Young, M. C., Gillett, N. P., Zwiers, F. W., Cannon, A. J., and Anslow, F. S.: Attribution of the influence of human-induced climate change on an extreme fire season, Earths Future, 7, 2–10, https://doi.org/10.1029/2018EF001050, 2019. a
Kloss, C., Berthet, G., Sellitto, P., Ploeger, F., Bucci, S., Khaykin, S., Jégou, F., Taha, G., Thomason, L. W., Barret, B., Le Flochmoen, E., von Hobe, M., Bossolasco, A., Bègue, N., and Legras, B.: Transport of the 2017 Canadian wildfire plume to the tropics via the Asian monsoon circulation, Atmos. Chem. Phys., 19, 13547–13567, https://doi.org/10.5194/acp-19-13547-2019, 2019. a
Knopf, D. A. and Alpert, P. A.: A water activity based model of heterogeneous ice nucleation kinetics for freezing of water and aqueous solution droplets, Faraday Discuss., 165, 513–534, https://doi.org/10.1039/c3fd00035d, 2013. a
Knopf, D. A. and Alpert, P. A.: Atmospheric ice nucleation, Nature Reviews Physics, 5, 203–217, https://doi.org/10.1038/s42254-023-00570-7, 2023. a
Knopf, D. A., Alpert, P. A., and Wang, B.: The role of organic aerosol in atmospheric ice nucleation: a review, ACS Earth and Space Chemistry, 2, 168–202, https://doi.org/10.1021/acsearthspacechem.7b00120, 2018. a, b, c, d
Knopf, D. A., Silber, I., Riemer, N., Fridlind, A. M., and Ackerman, A. S.: A 1D Model for Nucleation of Ice From Aerosol Particles: An Application to a Mixed-Phase Arctic Stratus Cloud Layer, J. Adv. Model. Earth Sy., 15, e2023MS003663, https://doi.org/10.1029/2023MS003663, 2023. a
Knust, R.: Polar Research and Supply Vessel POLARSTERN operated by the Alfred-Wegener-Institute, Journal of Large-scale Research Facilities JLSRF, 3, A119, https://doi.org/10.17815/jlsrf-3-163, 2017. a
Koop, T., Luo, B. P., Tsias, A., and Peter, T.: Water activity as the determinant for homogeneous ice nucleation in aqueous solutions, Nature, 406, 611–614, https://doi.org/10.1038/35020537, 2000. a
Krämer, M., Rolf, C., Luebke, A., Afchine, A., Spelten, N., Costa, A., Meyer, J., Zöger, M., Smith, J., Herman, R. L., Buchholz, B., Ebert, V., Baumgardner, D., Borrmann, S., Klingebiel, M., and Avallone, L.: A microphysics guide to cirrus clouds – Part 1: Cirrus types, Atmos. Chem. Phys., 16, 3463–3483, https://doi.org/10.5194/acp-16-3463-2016, 2016. a
Kruger, A. and Krajewski, W. F.: Two-Dimensional Video Disdrometer: A Description, J. Atmos. Ocean. Tech., 19, 602–617, https://doi.org/10.1175/1520-0426(2002)019<0602:TDVDAD>2.0.CO;2, 2002. a
Kärcher, B. and Podglajen, A.: A Stochastic Representation of Temperature Fluctuations Induced by Mesoscale Gravity Waves, J. Geophys. Res.-Atmos., 124, 11506–11529, https://doi.org/10.1029/2019JD030680, 2019. a
Kärcher, B., Jensen, E. J., and Lohmann, U.: The Impact of Mesoscale Gravity Waves on Homogeneous Ice Nucleation in Cirrus Clouds, Geophys. Res. Lett., 46, 5556–5565, https://doi.org/10.1029/2019GL082437, 2019. a
Kärcher, B., DeMott, P. J., Jensen, E. J., and Harrington, J. Y.: Studies on the Competition Between Homogeneous and Heterogeneous Ice Nucleation in Cirrus Formation, J. Geophys. Res.-Atmos., 127, e2021JD035805, https://doi.org/10.1029/2021JD035805, 2022. a
Lohmann, U. and Neubauer, D.: The importance of mixed-phase and ice clouds for climate sensitivity in the global aerosol–climate model ECHAM6-HAM2, Atmos. Chem. Phys., 18, 8807–8828, https://doi.org/10.5194/acp-18-8807-2018, 2018. a
Lynch, D. K., Sassen, K., Starr, D. O., and Stephens, G.: Cirrus, Oxford University Press, New York, https://doi.org/10.1093/oso/9780195130720.003.0019, 2002. a, b
Mamouri, R.-E., Ansmann, A., Ohneiser, K., Knopf, D. A., Nisantzi, A., Bühl, J., Engelmann, R., Skupin, A., Seifert, P., Baars, H., Ene, D., Wandinger, U., and Hadjimitsis, D.: Wildfire smoke triggers cirrus formation: lidar observations over the eastern Mediterranean, Atmos. Chem. Phys., 23, 14097–14114, https://doi.org/10.5194/acp-23-14097-2023, 2023. a, b
Mason, S. L., Hogan, R. J., Bozzo, A., and Pounder, N. L.: A unified synergistic retrieval of clouds, aerosols, and precipitation from EarthCARE: the ACM-CAP product, Atmos. Meas. Tech., 16, 3459–3486, https://doi.org/10.5194/amt-16-3459-2023, 2023. a
Maturilli, M., Holdridge, D. J., Dahlke, S., Graeser, J., Sommerfeld, A., Jaiser, R., Deckelmann, H., and Schulz, A.: Initial radiosonde data from 2019–10 to 2020–09 during project MOSAiC, PANGAEA [data set], https://doi.org/10.1594/PANGAEA.928656, 2021. a, b, c
Maturilli, M., Sommer, M., Holdridge, D. J., Dahlke, S., Graeser, J., Sommerfeld, A., Jaiser, R., Deckelmann, H., and Schulz, A.: MOSAiC radiosonde data (level 3) [dataset publication series], PANGAEA [data set], https://doi.org/10.1594/PANGAEA.943870, 2022. a, b, c
Mitchell, D. L., Garnier, A., Pelon, J., and Erfani, E.: CALIPSO (IIR–CALIOP) retrievals of cirrus cloud ice-particle concentrations, Atmos. Chem. Phys., 18, 17325–17354, https://doi.org/10.5194/acp-18-17325-2018, 2018. a
Murray, B. J., Wilson, T. W., Dobbie, S., and Cui, Z.: Heterogeneous nucleation of ice particles on glassy aerosols under cirrus conditions, Nat. Geosci., 3, 233–237, https://doi.org/10.1038/ngeo817, 2010. a
Nakoudi, K., Ritter, C., and Stachlewska, I.: Clouds over the European Arctic (Ny-Ålesund, Svalbard), Remote Sens.-Basel, 13, 4555, https://doi.org/10.3390/rs13224555, 2021. a
Nixdorf, U., Dethloff, K., Rex, M., Shupe, M., Sommerfeld, A., Perovich, D., Nicolaus, M., Heuzé, C., Rabe, B., Loose, B., Damm, E., Gradinger, R., Fong., A, Maslowski, W., Rinke, A., Kwok, R., Spreen, G., Wendisch, M., Herber, A., Hirsekorn, M., Mohaupt, V., Frickenhaus, S., Immerz, A., Weiss-Tuider, K., König, B., Mengedoht, D., Regnery, J., Gerchow, P., Ransby, D., Krumpen, T., Morgenstern, A., Haas, C., Kanzow, T., Rack, F. R., Saitzev, V., Sokolov, V., Makarov, A., Schwarze, S., Wunderlich, T., Wurr, K., and Boetius, A.: MOSAiC extended acknowledgement, Zenodo, https://doi.org/10.5281/zenodo.5179738, 2021. a
Ohneiser, K., Ansmann, A., Chudnovsky, A., Engelmann, R., Ritter, C., Veselovskii, I., Baars, H., Gebauer, H., Griesche, H., Radenz, M., Hofer, J., Althausen, D., Dahlke, S., and Maturilli, M.: The unexpected smoke layer in the High Arctic winter stratosphere during MOSAiC 2019–2020, Atmos. Chem. Phys., 21, 15783–15808, https://doi.org/10.5194/acp-21-15783-2021, 2021a. a, b, c, d, e, f, g, h, i, j
Ohneiser, K., Ansmann, A., Engelmann, R., Griesche, H., Radenz, M., Hofer, J., and Althausen, D.: Optical aerosol profiles from the Raman Lidar Polly-XT during MOSAiC, PANGAEA [data set], https://doi.org/10.1594/PANGAEA.935539, 2021b. a
Podglajen, A., Hertzog, A., Plougonven, R., and Legras, B.: Lagrangian temperature and vertical velocity fluctuations due to gravity waves in the lower stratosphere, Geophys. Res. Lett., 43, 3543–3553, https://doi.org/10.1002/2016GL068148, 2016. a, b, c, d
Polly: PollyNET lidar data base [data set], http://polly.tropos.de/ (last access: 10 January 2024), 2024. a, b
Primm, K., Schill, G., Veghte, D., Freedman, M. A., and Tolbert, M. A.: Depositional ice nucleation on NX illite and mixtures of NX illite with organic acids, J. Atmos. Chem., 74, 55–69, https://doi.org/10.1007/s10874-016-9340-x, 2017. a
Pruppacher, H. R. and Klett, J. D.: Microphysics of Clouds and Precipitation, Springer Netherlands, Dordrecht, https://doi.org/10.1007/978-0-306-48100-0, 2010. a
Rolf, C., Krämer, M., Schiller, C., Hildebrandt, M., and Riese, M.: Lidar observation and model simulation of a volcanic-ash-induced cirrus cloud during the Eyjafjallajökull eruption, Atmos. Chem. Phys., 12, 10281–10294, https://doi.org/10.5194/acp-12-10281-2012, 2012. a, b
Rolph, G., Stein, A., and Stunder, B.: Real-time Environmental Applications and Display sYstem: READY, Environ. Model. Softw., 95, 210–228, https://doi.org/10.1016/j.envsoft.2017.06.025, 2017. a
Sassen, K. and Cho, B. S.: Subvisual-thin cirrus lidar dataset for satellite verification and climatological research, J. Appl. Meteorol., 31, 1275–1285, https://doi.org/10.1175/1520-0450(1992)031<1275:STCLDF>2.0.CO;2, 1992. a
Sassen, K., Wang, Z., and Liu, D.: Cirrus clouds and deep convection in the tropics: Insights from CALIPSO and CloudSat, J. Geophys. Res.-Atmos., 114, D00H06, https://doi.org/10.1029/2009JD011916, 2009. a
Schäfer, B., Carlsen, T., Hanssen, I., Gausa, M., and Storelvmo, T.: Observations of cold-cloud properties in the Norwegian Arctic using ground-based and spaceborne lidar, Atmos. Chem. Phys., 22, 9537–9551, https://doi.org/10.5194/acp-22-9537-2022, 2022. a
Schröder, F., Kärcher, B., Fiebig, M., and Petzold, A.: Aerosol states in the free troposphere at northern midlatitudes, J. Geophys. Res.-Atmos., 107, LAC 8-1–LAC 8-8, https://doi.org/10.1029/2000JD000194, 2002. a
Seifert, P., Ansmann, A., Müller, D., Wandinger, U., Althausen, D., Heymsfield, A. J., Massie, S. T., and Schmitt, C.: Cirrus optical properties observed with lidar, radiosonde, and satellite over the tropical Indian Ocean during the aerosol-polluted northeast and clean maritime southwest monsoon, J. Geophys. Res.-Atmos., 112, D17205, https://doi.org/10.1029/2006JD008352, 2007. a
Seifert, P., Ansmann, A., Groß, S., Freudenthaler, V., Heinold, B., Hiebsch, A., Mattis, I., Schmidt, J., Schnell, F., Tesche, M., Wandinger, U., and Wiegner, M.: Ice formation in ash-influenced clouds after the eruption of the Eyjafjallajökull volcano in April 2010, J. Geophys. Res.-Atmos., 116, D00U04, https://doi.org/10.1029/2011JD015702, 2011. a
Sekelsky, S., Ecklund, W., Firda, J., Gage, K., and R., M.: Particle Size Estimation in Ice-Phase Clouds Using Multifrequency Radar Reflectivity Measurements at 95, 33, and 2.8 GHz, J. Appl. Meteorol. Clim., 38, 5–28, https://doi.org/10.1175/1520-0450(1999)038<0005:PSEIIP>2.0.CO;2, 1999. a
Shupe, M. D., Rex, M., Blomquist, B., Ola, P., Persson, G., Schmale, J., Uttal, T., Althausen, D., Angot, H., Archer, S., Bariteau, L., Beck, I., Bilberry, J., Bucci, S., Buck, C., Boyer, M., Brasseur, Z., Brooks, I. M., Calmer, R., Cassano, J., Castro, V., Chu, D., Costa, D., Cox, C. J., Creamean, J., Crewell, S., Dahlke, S., Damm, E., de Boer, G., Deckelmann, H., Dethloff, K., Dütsch, M., Ebell, K., Ehrlich, A., Ellis, J., Engelmann, R., Fong, A. A., Frey, M. M., Gallagher, M. R., Ganzeveld, L., Gradinger, R., Graeser, J., Greenamyer, V., Griesche, H., Griffiths, S., Hamilton, J., Heinemann, G., Helmig, D., Herber, A., Heuzé, C., Hofer, J., Houchens, T., Howard, D., Inoue, J., Jacobi, H.-W., Jaiser, R., Jokinen, T., Jourdan, O., Jozef, G., King, W., Kirchgaessner, A., Klingebiel, M., Krassovski, M., Krumpen, T., Lampert, A., Landing, W., Laurila, T., Lawrence, D., Lonardi, M., Loose, B., Lüpkes, C., Maahn, M., Macke, A., Maslowski, W., Marsay, C., Maturilli, M., Mech, M., Morris, S., Moser, M., Nicolaus, M., Ortega, P., Osborn, J., Pätzold, F., Perovich, D. K., Petäjä, T., Pilz, C., Pirazzini, R., Posman, K., Powers, H., Pratt, K. A., Preußer, A., Quéléver, L., Radenz, M., Rabe, B., Rinke, A., Sachs, T., Schulz, A., Siebert, H., Silva, T., Solomon, A., Sommerfeld, A., Spreen, G., Stephens, M., Stohl, A., Svensson, G., Uin, J., Viegas, J., Voigt, C., von der Gathen, P., Wehner, B., Welker, J. M., Wendisch, M., Werner, M., Xie, Z., and Yue, F.: Overview of the MOSAiC expedition: Atmosphere, Elementa: Science of the Anthropocene, 10, 00060, https://doi.org/10.1525/elementa.2021.00060, 2022. a, b, c, d
Spichtinger, P., Gierens, K., and Dörnbrack, A.: Formation of ice supersaturation by mesoscale gravity waves, Atmos. Chem. Phys., 5, 1243–1255, https://doi.org/10.5194/acp-5-1243-2005, 2005. a
Stein, A. F., Draxler, R. R., Rolph, G. D., Stunder, B. J. B., Cohen, M. D., and Ngan, F.: NOAA's HYSPLIT Atmospheric Transport and Dispersion Modeling System, B. Am. Meteorol. Soc., 96, 2059–2077, https://doi.org/10.1175/BAMS-D-14-00110.1, 2015. a
Thomas, L., Cartwright, J. C., and Wareing, D. P.: Lidar observations of the horizontal orientation of ice crystals in cirrus clouds, Tellus B, 42, 211–216, https://doi.org/10.1034/j.1600-0889.1990.00001.x-i1, 1990. a
Trainer, M. G., Toon, O. B., and Tolbert, M. A.: Measurements of Depositional Ice Nucleation on Insoluble Substrates at Low Temperatures: Implications for Earth and Mars, J. Phys. Chem. C, 113, 2036–2040, https://doi.org/10.1021/jp805140p, 2009. a
Trickl, T., Vogelmann, H., Fromm, M. D., Jäger, H., Perfahl, M., and Steinbrecht, W.: Measurement report: Violent biomass burning and volcanic eruptions – a new period of elevated stratospheric aerosol over central Europe (2017 to 2023) in a long series of observations, Atmos. Chem. Phys., 24, 1997–2021, https://doi.org/10.5194/acp-24-1997-2024, 2024. a
Ulbrich, C. W.: Natural variations in the analytical form of the raindrop size distribution, J. Clim. Appl. Meteorol., 22, 1764–1775, https://doi.org/10.1175/1520-0450(1983)022<1764:NVITAF>2.0.CO;2, 1983. a
Ullrich, R., Hoose, C., Möhler, O., Niemand, M., Wagner, R., Höhler, K., Hiranuma, N., Saathoff, H., and Leisner, T.: A New Ice Nucleation Active Site Parameterization for Desert Dust and Soot, J. Atmos. Sci., 74, 699–717, https://doi.org/10.1175/JAS-D-16-0074.1, 2017. a
Vihtakari, M.: ggOceanMaps: Plot data on oceanographic maps using 'ggplot2', Github [code], https://github.com/MikkoVihtakari/ggOceanMaps (last access: 22 January 2024), 2020. a
Voosen, P.: High-flying wildfire smoke poses potential threat to ozone layer, Science, 374, 921–922, https://doi.org/10.1126/science.acx9655, 2021. a
Voudouri, K. A., Giannakaki, E., Komppula, M., and Balis, D.: Variability in cirrus cloud properties using a PollyXT Raman lidar over high and tropical latitudes, Atmos. Chem. Phys., 20, 4427–4444, https://doi.org/10.5194/acp-20-4427-2020, 2020. a, b
Wang, B. and Knopf, D. A.: Heterogeneous ice nucleation on particles composed of humic-like substances impacted by O3, J. Geophys. Res.-Atmos., 116, D03205, https://doi.org/10.1029/2010JD014964, 2011. a, b, c, d
Wang, B., Lambe, A. T., Massoli, P., Onasch, T. B., Davidovits, P., Worsnop, D. R., and Knopf, D. A.: The deposition ice nucleation and immersion freezing potential of amorphous secondary organic aerosol: Pathways for ice and mixed-phase cloud formation, J. Geophys. Res.-Atmos., 117, D16209, https://doi.org/10.1029/2012JD018063, 2012. a, b, c, d
Wolf, V., Kuhn, T., Milz, M., Voelger, P., Krämer, M., and Rolf, C.: Arctic ice clouds over northern Sweden: microphysical properties studied with the Balloon-borne Ice Cloud particle Imager B-ICI, Atmos. Chem. Phys., 18, 17371–17386, https://doi.org/10.5194/acp-18-17371-2018, 2018. a, b
Wolf, V., Kuhn, T., and Krämer, M.: On the Dependence of Cirrus Parametrizations on the Cloud Origin, Geophys. Res. Lett., 46, 12565–12571, https://doi.org/10.1029/2019GL083841, 2019. a
Xian, P., Zhang, J., O'Neill, N. T., Toth, T. D., Sorenson, B., Colarco, P. R., Kipling, Z., Hyer, E. J., Campbell, J. R., Reid, J. S., and Ranjbar, K.: Arctic spring and summertime aerosol optical depth baseline from long-term observations and model reanalyses – Part 1: Climatology and trend, Atmos. Chem. Phys., 22, 9915–9947, https://doi.org/10.5194/acp-22-9915-2022, 2022a. a
Xian, P., Zhang, J., O'Neill, N. T., Reid, J. S., Toth, T. D., Sorenson, B., Hyer, E. J., Campbell, J. R., and Ranjbar, K.: Arctic spring and summertime aerosol optical depth baseline from long-term observations and model reanalyses – Part 2: Statistics of extreme AOD events, and implications for the impact of regional biomass burning processes, Atmos. Chem. Phys., 22, 9949–9967, https://doi.org/10.5194/acp-22-9949-2022, 2022b. a