the Creative Commons Attribution 4.0 License.
the Creative Commons Attribution 4.0 License.
 | 07 May 2025
Measurement report: Size-resolved particle effective density measured by an AAC-SMPS and implications for chemical composition
Yao Song
Jing Wei
Wenlong Zhao
Jinmei Ding
Xiangyu Pei
Fei Zhang
Zhengning Xu
Ruifang Shi
Ya Wei
Lu Zhang
Lingling Jin
Zhibin Wang
The effective density (ρeff) is closely associated with the aging process and can serve as a tracer of chemical composition. Recently, studies investigating the effect of particle size on density have been limited. In this study, size-resolved ρeff was characterized using a tandem aerodynamic aerosol classifier (AAC) and scanning mobility particle sizer (SMPS) system during 1 month of observations in Hangzhou. The results indicate that the ρeff values of the particles exhibit a unimodal distribution, with average values ranging from 1.47 to 1.63 g cm−3, increasing as the particle diameter increases. The diurnal variation is more pronounced for small particles (dae < 350 nm), which generally exhibit lower density during the day and higher density at night. The relationship between ρeff and particle diameter varies under different pollution conditions due to differences in the chemical composition of the particles. The SHapley Additive exPlanations (SHAP) values revealed good relationships between ρeff and the bulk composition of particles with diameters smaller than 350 nm, while the relationship with larger particles was weak. As determining the size-resolved chemical composition of particles remains challenging, a new method to investigate the size-resolved chemical composition was proposed, in which the size-resolved composition can be derived from the ρeff and fixed material density of secondary inorganic aerosols (SIAs), organic aerosols (OAs), and black carbon (BC).
- Article
(4391 KB) - Full-text XML
-
Supplement
(1485 KB) - BibTeX
- EndNote


Atmospheric aerosols play important roles in human health, air quality, and climate change. The environmental and health impacts of aerosols are largely determined by their chemical and physical properties (Spencer et al., 2007). Density (ρ) is one of the most important physical properties of particles. Limited by techniques for measuring ρ for aspherical aerosol particles, ρeff has been commonly adopted as an alternative to aerosol density (Peng et al., 2021). It has been largely reported that ρeff is related to the particle optical properties (Zhao et al., 2019), aging process (Peng et al., 2016; Leskinen et al., 2023), and chemical composition (Spencer et al., 2007). Therefore, an understanding of size-resolved ρeff is important for accurately estimating the effects of particles on climate and health.
Currently, several systems have been developed to measure the size-resolved ρeff. The Micro-orifice Uniform Deposit Impactor (MOUDI), whose size distribution is measured simultaneously, is a commonly used offline instrument to measure size-resolved density (Hu et al., 2012). It collects size-segregated aerosols with different size ranges and subsequently analyses their mass and chemical components, but the temporal resolution of this offline method is relatively low, and the size range is limited (0.056–18 µm, depending on size stages of the MOUDI used). The most commonly used method is to measure the mobility diameter and mass simultaneously, after which the ρeff of the particles can be calculated directly, including the tandem differential mobility analyzer (DMA) and mass analyzer, i.e., the aerosol particle mass analyzer (APM) and centrifugal particle mass analyzer (CPMA) (McMurry et al., 2002; Zhou et al., 2022; Xie et al., 2024). However, the particles are required to be charged before classification for DMA and APM/CPMA, which introduces multiple-charging effects. Particles with higher-order charges can be selected, causing uncertainties in the ρeff calculation. Additionally, ρeff can be derived from the relationship between dm and the (vacuum) aerodynamic diameter (dae), such as the tandem aerodynamic aerosol classifier (AAC) and scanning mobility particle sizer (SMPS) system (Tavakoli and Olfert, 2014; Song et al., 2022b; Lu et al., 2024) and the tandem ultrafine aerosol time-of-flight mass spectrometry (UF-ATOFMS) and DMA system, with the latter also providing the size-resolved chemical composition (Spencer et al., 2007). AAC is a novel method that classifies particles on the basis of their relaxation time, which can avoid multiple-charging effects (Tavakoli and Olfert, 2013). Moreover, the transmission efficiency of AAC is 2.6–5.1 times higher than that of a combined Krypton-85 radioactive neutralizer and DMA (Johnson et al., 2018). Currently, the AAC-SMPS is commonly used for laboratory-generated particles, but studies on the aerodynamic size-dependent ρeff of ambient particles are still limited (Tavakoli and Olfert, 2014; Yao et al., 2020; Kazemimanesh et al., 2022; Lu et al., 2024).
The size dependence of particle ρeff has been reported in previous studies, and the variation in ρeff is associated with the chemical composition. Generally, the material densities of inorganic aerosols, such as (NH4)2SO4 and NH4NO3, are higher than those of organic aerosols (OAs). The ρeff of the particles is greater when secondary inorganic aerosol (SIA) is predominant than when OA is predominant. The ρeff increases with the addition of hygroscopic substances, particularly (NH4)2SO4 and NH4NO3 (Yin et al., 2015). The material density of OAs varies among different sources, but it is greater for secondary organic aerosols (SOAs) than for primary organic aerosols (POAs) (Zhou et al., 2022). The formation of SOAs during active photochemical reactions and the aging process also leads to an increase in ρeff (Lin et al., 2018; Xie et al., 2024). The material density of black carbon (BC) is 1.8 g cm−3, but ρeff can be much lower because of its fractal morphology. A decrease in ρeff was observed when primary emissions increased, which led to the accumulation of POA and BC (Lu et al., 2024; Xie et al., 2024).
However, how the chemical composition influences ρeff remains unclear because of the complexity of the species composing the particles. Currently, machine learning (ML) methods, such as the simulation of the ozone concentration and the reproduction of the aerosol number concentration, are widely used in atmospheric science research (Song et al., 2022a; Cheng et al., 2024; Zhang et al., 2024). ML can identify the complex and nonlinear relationships between input features and output predictor variables. Random forest (RF) is a commonly used ML algorithm. Compared to other ML models, such as deep learning models, it maintains a commendable balance between predictive performance and interpretability (Cheng et al., 2024). The SHapley Additive exPlanations (SHAP) value proposed by Lundberg and Lee (2017) is commonly used to explain the outputs of ML models, which can be used to understand the drivers of variations in ρeff.
In this study, we present the characteristics of ambient aerosols ρeff based on 1 month of online measurements in Hangzhou. The diurnal variation in ρeff and the influences of the pollution level and air mass transport are discussed. ML and SHAP were applied to analyze the relationship between ρeff and the chemical composition of aerosols. The material densities of OA and BC were determined from the mean ρeff and bulk chemical composition, and the size-resolved chemical composition was inferred from ρeff and compared with the bulk chemical composition.
2.1 Sampling site and instrumentation
The 1-month continuous observations were conducted from the 9 September 2023 to the 8 October 2023 at the Central Air Quality Assurance Monitoring Station (CASA site) for the 19th Asian Games in Hangzhou. The CASA site (30.25° N, 120.24° E) is located in the western region of Hangzhou, which is one of the most developed cities in the Yangtze River Delta (YRD) (Supplement Fig. S1), and near the Qiantang River (located just 100 m away). There is an elevated road 1.9 km northeast of the site and another 3.2 km southwest of the site. The surrounding area is mainly residential and commercial, with no significant sources of pollution. The local influence at the site is primarily from residential activities and traffic emissions.
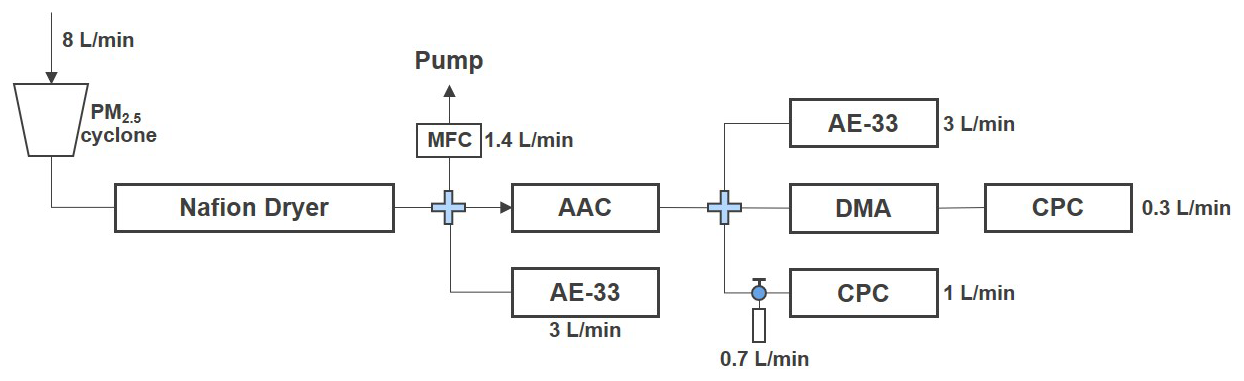
Figure 1Instrumental setup used in this study. MFC represents the mass flow controller, AAC is the aerodynamic aerosol classifier, AE-33 is the Aethalometer, DMA is the differential mobility analyzer, and CPC is the condensation particle counter.
A schematic diagram of the measurement settings is shown in Fig. 1. The particles were sampled with a PM2.5 (particulate matter with an aerodynamic diameter of ≤ 2.5 µm) cyclone inlet (8 L min−1) and then passed through a Nafion dryer to reduce the relative humidity (RH) to less than 30 %. The sampling flow was split into three lines. One line was fed to an AAC-SMPS to determine the effective densities of particles with different diameters. Another line was connected to a seven-wavelength Aethalometer (Model AE-33, Magee Scientific, USA; sample flow rate of Q= 3 L min−1) to measure the mass concentration of BC. The remaining flow was maintained as a bypass flow with an extra pump to ensure an accurate cutoff size. Particles with 12 logarithmically equally distributed aerodynamic sizes ranging from 200 to 1000 nm were selected by an AAC (Cambustion Ltd., UK; sheath flow rate Qsh= 9 L min−1 and relaxation time resolution Rt= 2.5), and each size was sampled for 5 min. After the AAC classification, the aerosol flow was then split into three parallel lines. One line led to a condensation particle counter (CPC, Model 3772, TSI Inc., USA) to determine the concentration of the dae-selected particles. The flow rate of the CPC was decreased to 0.3 L min−1, with a bypass flow of 0.7 L min−1. The second line directed the flow to an AE-33. The results of the CPC and AE-33 downstream of the AAC will be discussed in other studies. In the remaining line, the particle number size distribution (PNSD) of each dae-selected particle was acquired using an SMPS, which consisted of a soft X-ray neutralizer (Model 3088, TSI Inc., USA), a DMA (Model 3081, TSI Inc., USA; sheath flow rate Qsh= 3 L min−1), and a CPC (Model 3756, TSI Inc., USA; sample flow rate Qa= 0.3 L min−1). The mobility diameter range was 13.8–749.9 nm with a total scan time of 4 min. The modal mobility diameter of the dae-selected particles, denoted as dm, was determined by fitting the PNSD to a lognormal distribution (Eq. S4 in the Supplement). However, owing to the low concentrations of larger particles selected by the AAC and the inability to fit the mode ρeff from ρeff distributions scanned by the SMPS, only particles with mobility diameters smaller than 600 nm were fitted to lognormal distributions. The bulk chemical composition of nonrefractory aerosols, i.e., the mass concentrations of OA, nitrate, sulfate, ammonium, and chloride, was measured via an aerosol chemical speciation monitor (ACSM; Aerodyne Research, Inc., USA). Combined with the BC mass concentration, the effective density (ρeff,cal) can be calculated as follows (Levy et al., 2013):
where ρi and fi denote the effective density and mass fraction of chemical component i, respectively. The values of the effective density of BC and OA are discussed in Sect. 3.4.
The AAC and SMPS used in this study were calibrated with certified polystyrene latex (PSL) spheres (Thermo Fisher Scientific Inc., USA) with sizes of 152±5, 203±5, 303±8, and 508±8 nm (Fig. S2). The dae measured by the AAC was compared with the aerodynamic diameter of the PSL (dae,PSL), which was calculated from the nominal diameter (dm,PSL) and material density of the PSL (1.05 g cm−3). The dm determined by the SMPS was compared to the nominal diameter of the PSL. The deviations between the measured dae (dm) and dae,PSL (dm,PSL) were 3.19 % and 2.48 %, respectively. The performance of the AAC-SMPS tandem system was first validated with PSL particles, and the average effective density of 1.045 g cm−3 was determined, which is consistent with the material density of PSL (1.05 g cm−3) (Fig. S3). Then, the system was validated by ammonium sulfate (AS) and ammonium nitrate (AN) particles generated with an atomizer (Model 3079A, TSI, Inc., USA). The effective densities of the size-resolved AS and AN particles are shown in Fig. S2c. The effective densities of AS particles of different sizes are within the range of 1.68–1.82 g cm−3, which is consistent with previous studies (Yao et al., 2020; Lu et al., 2024). The measured average ρeff of AN particles was 1.80 g cm−3, which is slightly higher than the mean ρeff of 1.69±0.17 g cm−3 measured via DMA and a quartz crystal microbalance (QCM) (Sarangi et al., 2016).
2.2 Machine learning
The RF models were built with the “RandomForestRegressor” function provided by “scikit-learn” in a Python environment (Pedregosa et al., 2011). In the RF models, the independent variables are the size-resolved effective densities of particles with different diameters. The explanatory variables are the mass fractions of the main components of PM2.5, i.e., OA, (NH4)2SO4, NH4NO3, NH4Cl, and BC. The RF model was trained with a portion of the samples drawn from the whole dataset, while the remaining samples were used for model validation. To obtain an optimal RF model, the hyperparameters for the RF model were tuned via the “GridSearchCV” function from the scikit-learn library (Song et al., 2022a). The coefficient of determination (R2) was used to evaluate the performance of the ML model. The best hyperparameters (n_estimators, min_samples_split, max_features, bootstrap, and max-samples) of the RF model and R2 values for particles of different sizes are listed in Table S1 in the Supplement. The SHAP approach was implemented via the “shap” Python package.
2.3 Back trajectories
The regional-scale transport patterns were investigated via back-trajectory calculations with the open-source MeteoInfo software developed by Wang (2019). The model was run 48 h backward every hour from an altitude of 5 m above the site. The NCEP Global Data Assimilation System (GDAS) model with a grid resolution of 1° × 1° and a run time of 48 h each day from August to October 2023 was used in the calculations, followed by K-means clustering to investigate sources of air masses, which has been widely used in previous studies (Xu et al., 2023). All of the data in this study are shown in Beijing time (BJT).
3.1 Size-resolved effective densities
The average ρeff values for particles with aerodynamic diameters of 200, 235, 277, 326, 384, 452, and 531 nm were 1.47±0.09, 1.50±0.09, 1.52±0.08, 1.55±0.08, 1.58±0.08, 1.60±0.08, and 1.63±0.10 g cm−3, respectively (Fig. 2). The distribution of ρeff was fitted to a unimodal Gaussian distribution, whereas some previous studies have reported a bimodal distribution, i.e., a mode with a higher peak value and larger effective density, denoted as the main-density mode and another mode with lower peak value and lower effective density denoted as the sub-density mode. The unimodal distribution denotes an internally mixed aerosol composition, whereas the bimodal distribution with a second, below-unity density peak indicates externally mixed BC (Qiao et al., 2018; Ma et al., 2020; Zhou et al., 2022; Xie et al., 2024). In many studies, the frequency of the bimodal distribution is not comparable and largely depends on the distance between the observation points and the emission sources (Zhou et al., 2022; Wu et al., 2023; Xie et al., 2024). The occurrence of the sub-density mode is greater at sites close to the emission source. The sub-density particles predominated near the street with higher traffic emissions, whereas the main-density particles dominated in the rural background (Rissler et al., 2014). A lower frequency of sub-density events indicates that the particles are more likely to be in an internal mixing state. BC, a major product of fossil fuel and biomass combustion, is a tracer of primary emissions (Briggs and Long, 2016). On the one hand, the bimodal distribution may not have been detected due to the absence of fresh BC. The diameter of fresh BC mainly ranges from 50 to 120 nm (Bond et al., 2013), which is much smaller than the selected particles in our study. On the other hand, a previous study indicated that when the ratio of the mass concentration of BC to PM2.5 is less than 20 %, particles with diameters of between 50 and 350 nm are predominantly in an internal mixing state (Wu et al., 2023). Moreover, the relatively low number concentration of soot particles may be masked by the overwhelming abundance of dominant-mode particles, making them difficult to detect in the number size distribution (Yin et al., 2015). Unfortunately, we did not measure the chemical composition of particles of different sizes, and the bulk chemical composition revealed that the average proportion of BC to PM2.5 was only 11 % in our study. Therefore, only a unimodal Gaussian fit of ρeff was identified, indicating that the particles in Hangzhou tend to be internally mixed.
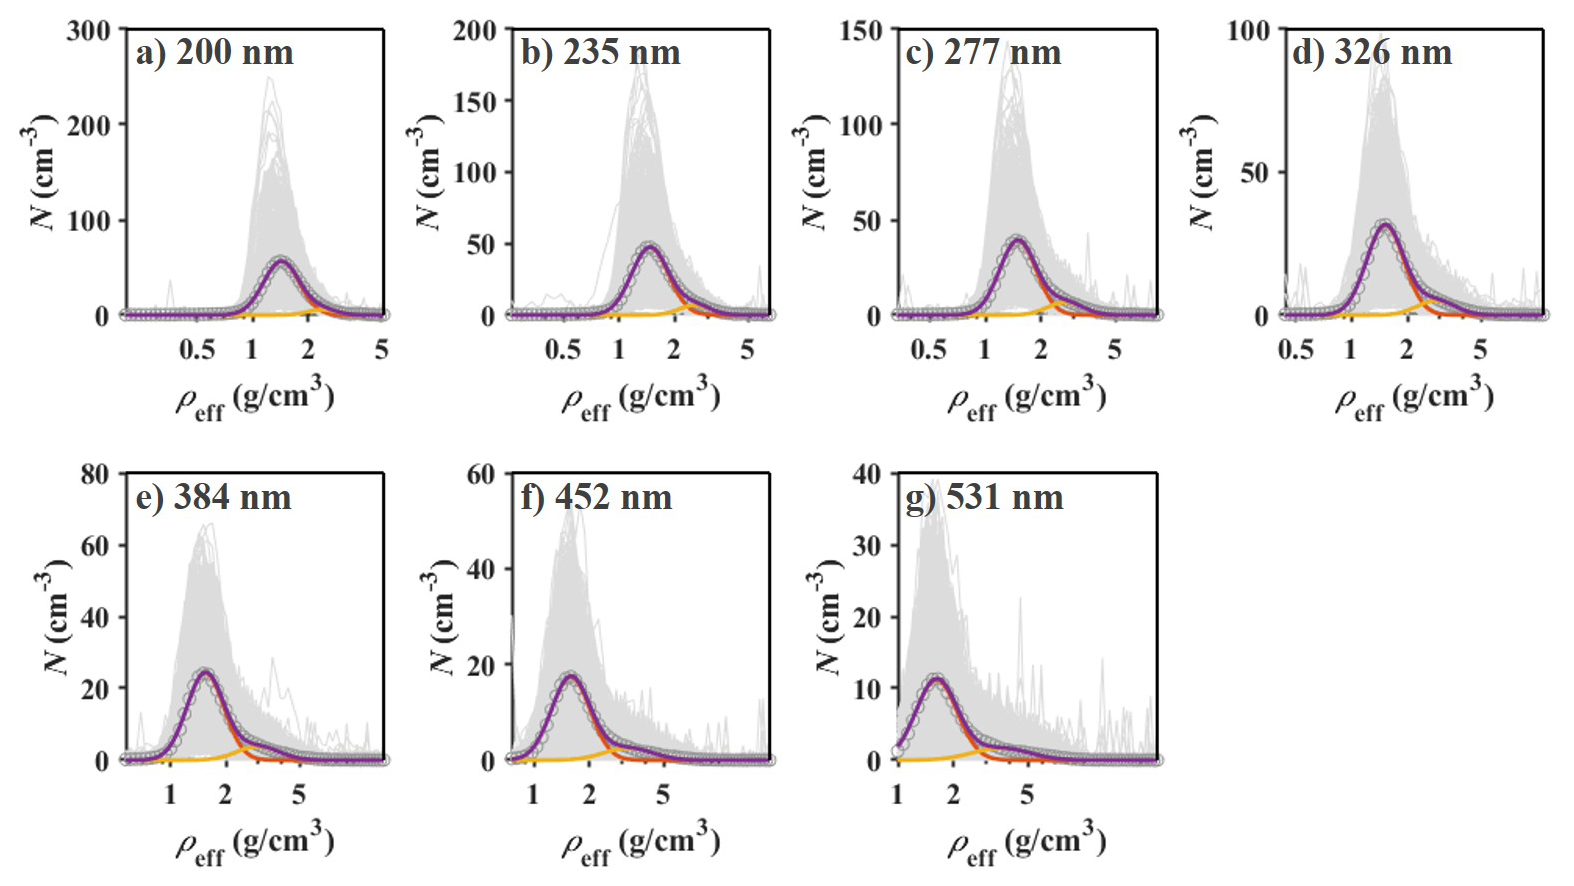
Figure 2Averaged particle ρeff distributions at (a) 200 nm, (b) 235 nm, (c) 277 nm, (d) 326 nm, (e) 384 nm, (f) 452 nm, and (g) 531 nm. The gray lines represent the measured ρeff distributions. The red and yellow lines are the Gaussian fits of the average ρeff and the Gaussian fits of doubly charged particles, respectively. The purple line represents the sum of Gaussian fits.
We also compared the ρeff values of the particles with those reported in other studies (Fig. 3). Notably, in this study, particles with aerodynamic diameters were selected by the AAC; however, generally, the particle mobility diameter has been selected in previous studies. Therefore, the mobility diameters reported in previous studies were first converted to aerodynamic diameters for comparison with the results of our study. The results revealed that the particle ρeff in most urban regions has a unimodal distribution, with relatively high densities ranging from 1.2 to 1.8 g cm−3 (Yin et al., 2015; Xie et al., 2017; Lin et al., 2018; Lu et al., 2024). The bimodal distribution of particle ρeff was found primarily in remote areas and near highways (Rissler et al., 2014; Ma et al., 2017; Ma et al., 2020; Zhou et al., 2022; Xie et al., 2024). Specifically, in the bimodal distribution, the main-density mode corresponds to a higher ρeff and increases with increasing particle size, which is similar to that in urban areas. In contrast, the ρeff of the sub-density mode was generally less than 1 g cm−3 and decreased with increasing particle diameter. The difference between urban and rural sites can be attributed to differences in the mixing state of the particles. Due to effective secondary organic aerosol formation and emissions from various sources, particles tend to mix internally in urban areas (Ching et al., 2019), leading to a unimodal distribution. Additionally, traffic emissions promote the occurrence of bimodal distributions, and it has been reported that particles are more externally mixed in street canyons and near highways (Rissler et al., 2014; Riemer et al., 2019). At rural sites, the high frequency of the bimodal distribution was determined when the observation site was influenced by local emissions (Zhou et al., 2022).
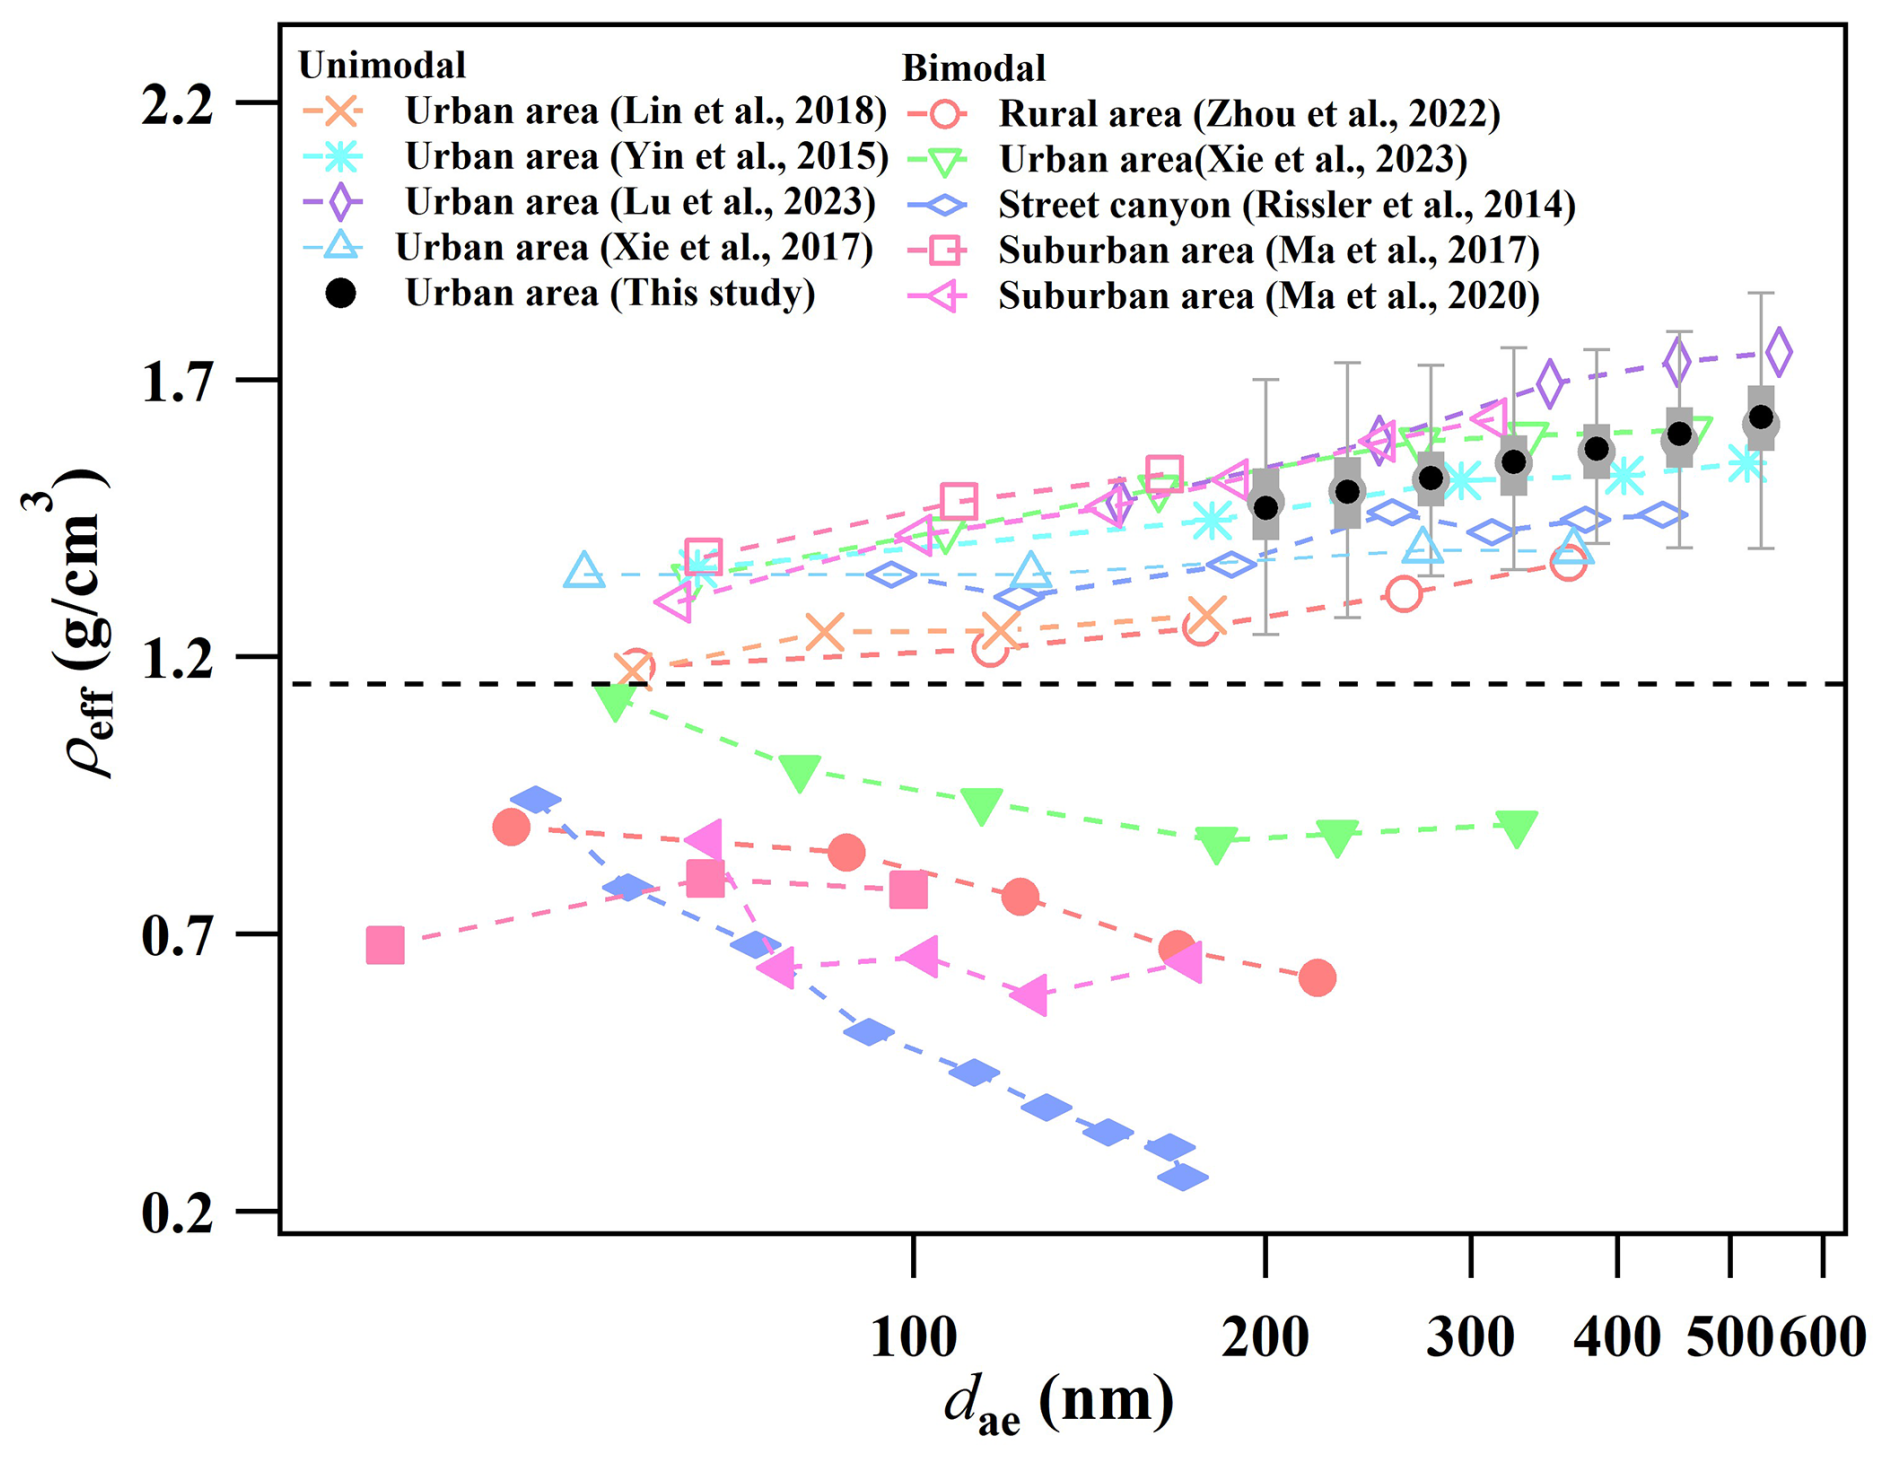
Figure 3Size dependency of ρeff during the observations in this study. The boxes contain the 25th (Q1) and 75th (Q3) percentiles. The distance between Q3 and Q1 is the interquartile range (IQR), and the whiskers extend from each quartile to the minimum or maximum. The dots inside the box represent the mean value of ρeff. The size dependency of the effective densities from previous studies is also included for comparison. The dashed black line is drawn to guide the eye.
3.2 Diurnal variations in the effective density
Figure 4 shows the diurnal cycle of ρeff for particles with diameters of 200 and 531 nm, along with the meteorological parameters and mass fractions of different chemical compositions of bulk particles. The diurnal variations in ρeff of the seven dae-selected particles are shown in Fig. S4. The results indicated that, in comparison with larger particles, smaller particles (dae < 350 nm) exhibit more pronounced diurnal variations in ρeff, typically showing lower values during the day and higher values at night (Fig. 4a). From 07:00 to 09:00 BJT, with increasing fresh BC and hydrocarbon-like organic aerosols (HOAs) from vehicle emissions (Fig. 4b), the ρeff of small particles decreases significantly. The volatile and gas–particle partitioning properties of (NH4)2SO4 and NH4Cl are dependent on the ambient temperature and RH (Sun et al., 2012). Although the atmospheric oxidative capacity increases later (Fig. S5), the photochemical production of HNO3 cannot compensate for evaporative loss under relatively high temperatures (Zhang et al., 2015). The mass fraction of nitrate decreased continuously from 07:00 to 13:00 BJT. Moreover, SOA formation increased significantly during this period. As a result, the fraction of the high material component decreased, whereas OAs with low material density accumulated, leading to a decrease in ρeff. Although the mass fraction of secondary inorganic particles subsequently remained relatively low, ongoing atmospheric aging may cause more small particles to have a spherical morphology (Wang et al., 2017, 2021). This explains why the ρeff of fine particles gradually increased between 13:00 and 17:00 BJT, even though the proportion of high-density components, such as secondary inorganic components, did not significantly increase. After 17:00 BJT, the ρeff values of the small particles did not decrease with increasing BC (Fig. S6f) and POA (Fig. S6g) emissions. Instead, it continued to rise, reaching a peak at 23:00 BJT, after which it remained relatively stable. During this period, the increasing RH and decreasing temperature facilitated the redistribution of HNO3 into the particulate phase (Sun et al., 2018; Kuang et al., 2021) and promoted the liquid-phase formation of nitrates on aerosol surfaces (Wang et al., 2020). This led to a dramatic increase in the proportion of SIA, especially for nitrates (Fig. S6d); therefore, the ρeff of the small particles did not decrease despite the decrease in the concentration of primary emitted particles such as BC and HOA.
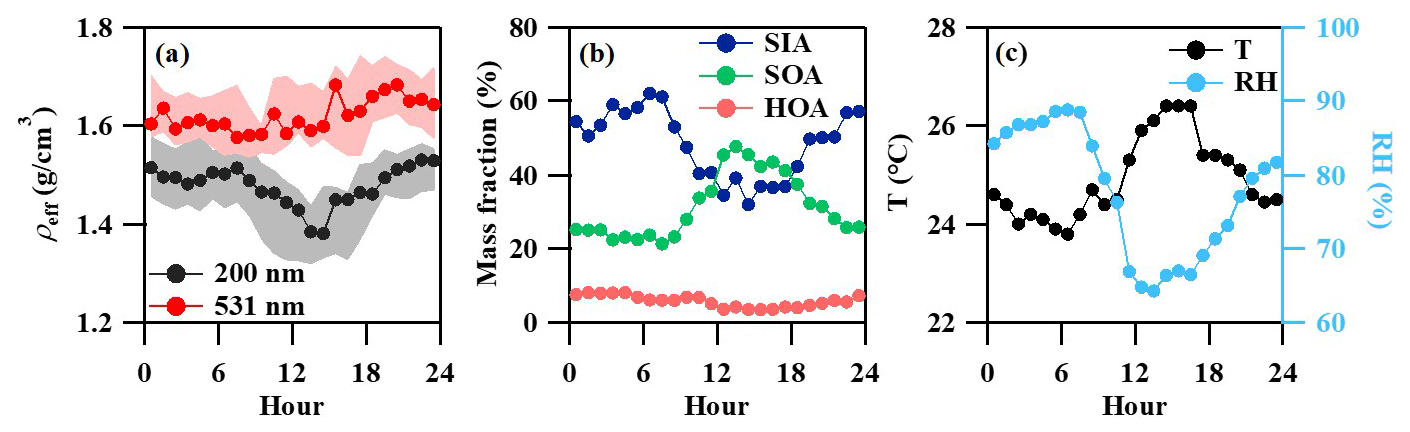
Figure 4Diurnal variations in (a) size-resolved ρeff, (b) mass fractions of the main components, and (c) metrological parameters during the whole observation period.
In addition, compared to small particles, the diurnal variation in the effective density of large particles is less pronounced (Fig. S4). The decreasing trend during the period from 07:00 to 13:00 BJT becomes less obvious, primarily because larger particles have longer residence times in the atmosphere and are less influenced by fresh emissions, resulting in a more stable chemical composition (Zhai et al., 2017; Xie et al., 2024). Overall, the effective density of large particles shows a slight increase throughout the day. This may be related to the increase in RH at night. which facilitates the formation of SIA, as has been discussed before. However, compared with smaller particles, larger particles exhibit reduced surface reactions and a decreased adsorption capacity due to their lower specific surface area (Okuda, 2013). As a result, the ρeff of larger particles was less sensitive to changes in temperature and RH.
3.3 Influence of different pollution levels on the particle effective density
In general, the ρeff values of particles are influenced mainly by their chemical composition and morphology, which are driven by their atmospheric oxidative capacity, RH, and temperature. Two episodes were identified to further explore the evolution of the particle ρeff (Fig. S7). Episode 1 (EP1) and episode 2 (EP2) occurred from 18:00 BJT on the 9 September to 18:00 BJT on the 12 September and from 17:00 BJT on the 23 September to 12:00 BJT on the 30 September, respectively, with the remaining period defined as the clean period (CP). The PM2.5 concentrations of EP1 and EP2 were significantly greater than that of CP (11.4 µg m−3), with average concentrations of 27.9 and 44.7 µg m−3, respectively. EP1 was dominated solely by organic components, which accounted for 64.1±8.0 % on average, whereas EP2 was dominated by organic and nitrate components, which accounted for 40.0±13.5 % and 29.4±12.9 %, respectively.
The average size-resolved effective densities and bulk chemical compositions under different pollution conditions are shown in Fig. 5. The ρeff values of all of the particles increased with increasing particle size except during EP2. Interestingly, the ρeff of the particles during EP1 (1.47–1.61 g cm−3) was smaller than that during CP, which is similar to previous observations in the North China Plain (Zhou et al., 2022), indicating that the compositions of particles of the same size are different under different pollution levels. The proportion of OAs reached 64.1 %, significantly higher than that during CP (49.3%). Previous studies have reported that the effective density of organic materials is between 1.2 and 1.4 g cm−3, which is lower than that of inorganic materials (Levy et al., 2013). Therefore, the small ρeff values of all of the particles during EP1 could be attributed to the high proportion of OAs. Additionally, air mass cluster analysis indicated that the pollution during EP1 was influenced primarily by regional transport, with a shorter transportation distance than that during CP (Fig. 5d). As a result, the particles had not fully aged and remained in a relatively fractal structure, leading to a lower effective particle density during EP1.
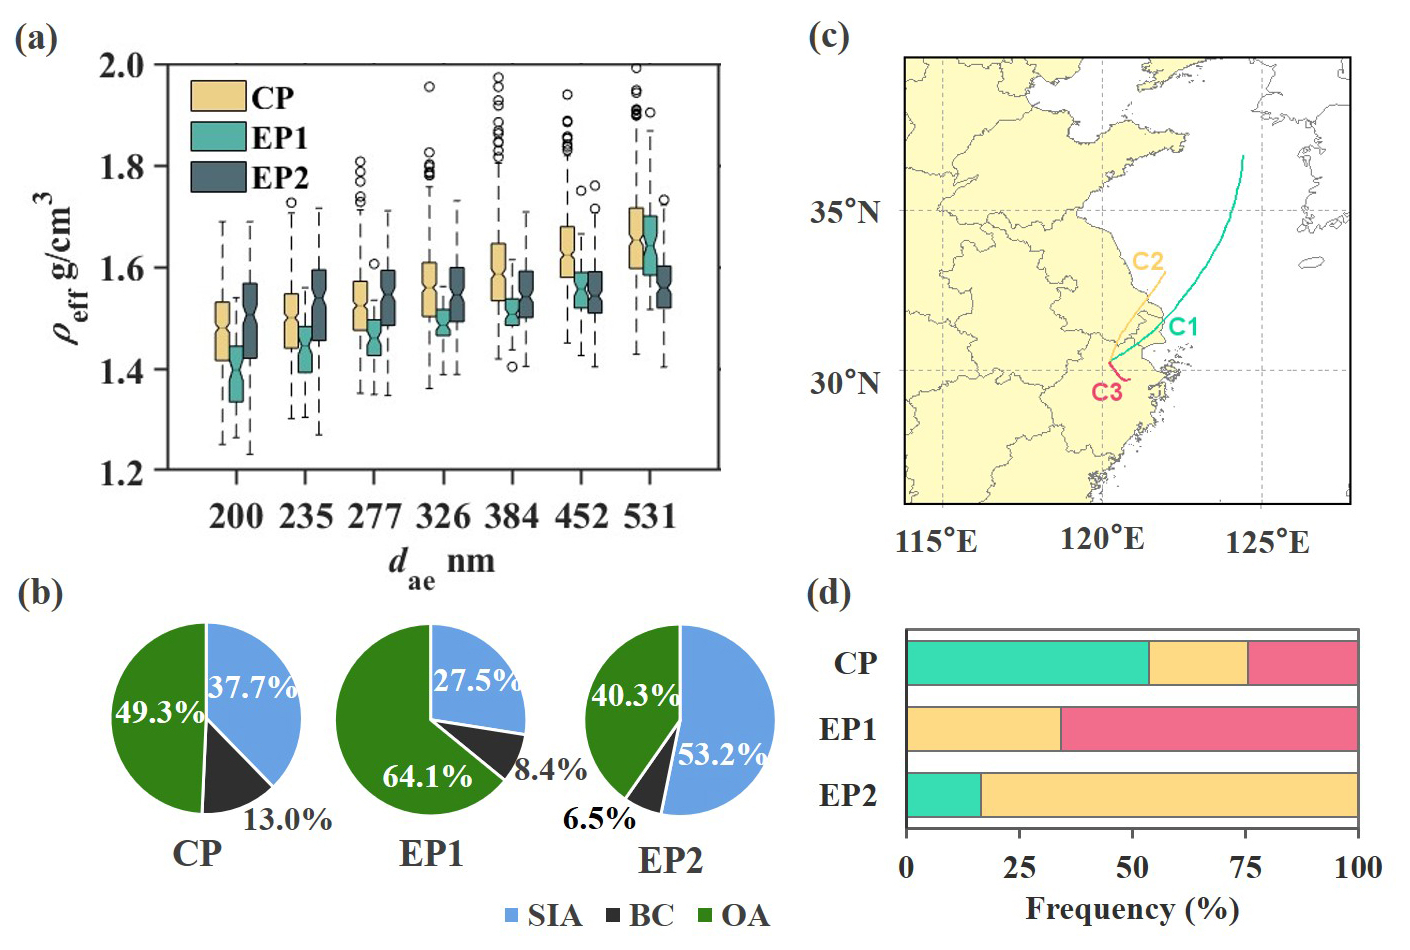
Figure 5(a) Size-resolved ρeff of particles with different diameters and (b) chemical composition of PM2.5 at different pollution levels. (c) Mean 48 h back trajectories of clusters during the measurement period. (d) Proportion of different clusters at different pollution levels.
Another interesting phenomenon is that the ρeff of the particles did not increase with increasing particle size during EP2. For particles smaller than 400 nm, the average ρeff (1.51–1.55 g cm−3) was greater than that of CP (1.40–1.51 g cm−3), whereas for particles larger than 400 nm, the average ρeff (1.54–1.56 g cm−3) was lower than that of CP (1.56–1.64 g cm−3). We attempt to explain this phenomenon from two perspectives. First, a small particle size results in a large specific surface area, which promotes the formation of secondary inorganic components. As shown in Fig. 5b, the proportion of secondary inorganic compounds during EP2 was as high as 53.2 %, which was much higher than the 37.3 % observed during CP. Secondary nitrate was the most prominent component, contributing 29.2 %. The diurnal variations in size-resolved particles during different periods are shown in Fig. S8. During EP2, from 13:00 to 19:00 BJT, the ρeff of small particles was significantly greater than that during CP. This difference gradually decreased over time, from a peak of 7.3 % at 13:00 BJT to 4.7 % at 07:00 BJT. This suggests that nitrate formation on small particles was more pronounced during EP2. A previous study revealed that the formation of atmospheric nitrate under high temperatures was due to enhanced heterogeneous processes associated with the aerosol water concentration (Wang et al., 2020). The heterogeneous hydrolysis of N2O5 was the main mechanism of nitrate formation at night, which was also promoted by high RH and low temperature (Liu et al., 2020). Our observations revealed that the RH and temperature were 81.6 % and 26.4 °C, respectively, during EP2, which were significantly higher than the respective values of 78.3 % and 23.8 °C during CP. These results are favorable for nitrate formation on small particles during EP2. Additionally, during EP2, the air mass passing over regions such as Jiangsu and northern Zhejiang carried a high load of anthropogenic pollutants, including SO2 (Fig. 5c). All of these factors resulted in higher precursor concentrations and enhanced the formation of secondary inorganic compounds, particularly on smaller particles. Consequently, the ρeff of the particles during EP2 remained relatively unchanged with increasing particle size.
3.4 The influence of chemical composition on the particle effective density
The chemical composition of a particle is the main factor affecting its ρeff. Inorganic components, such as NH4NO3 and (NH4)2SO4, have higher densities than organic compounds and BC. Therefore, variations in aerosol chemical composition can partly explain the observed trend in effective densities. Typically, the size-resolved chemical composition is measured via an aerosol mass spectrometer (Zhang et al., 2005) and single-particle mass spectrometry (Zhai et al., 2017). Due to limitations in the measurement techniques, the size-resolved chemical composition of particles is not accurately measured in most studies. Here, the SHAP method was used to explore the response of different chemical components at every measured particle size on the ρeff of the particles. A cross-validation was used to evaluate the model performance, and the results suggested that the RF model performed well for particles smaller than 350 nm, with an overall R2 score of greater than 0.55 (Table S1). In contrast, the correlation for larger particles was weaker, possibly because the chemical component variability in larger particles was smaller, resulting in inadequate modeling of these particles. For small particles, organics, NH4NO3, and NH4Cl are the most important chemical components affecting their ρeff values (Fig. 6). Specifically, the contribution of the organic proportion was the greatest, with an average contribution of 42.9 %. However, this response is negative, indicating that the ρeff of smaller particles decreases with an increasing proportion of organics. NH4NO3 and NH4Cl, which account for 32.2 % and 12.7 %, respectively, were positively correlated with ρeff, suggesting that the increase in the proportion of these components mainly leads to a significant increase in the ρeff of the small particles.
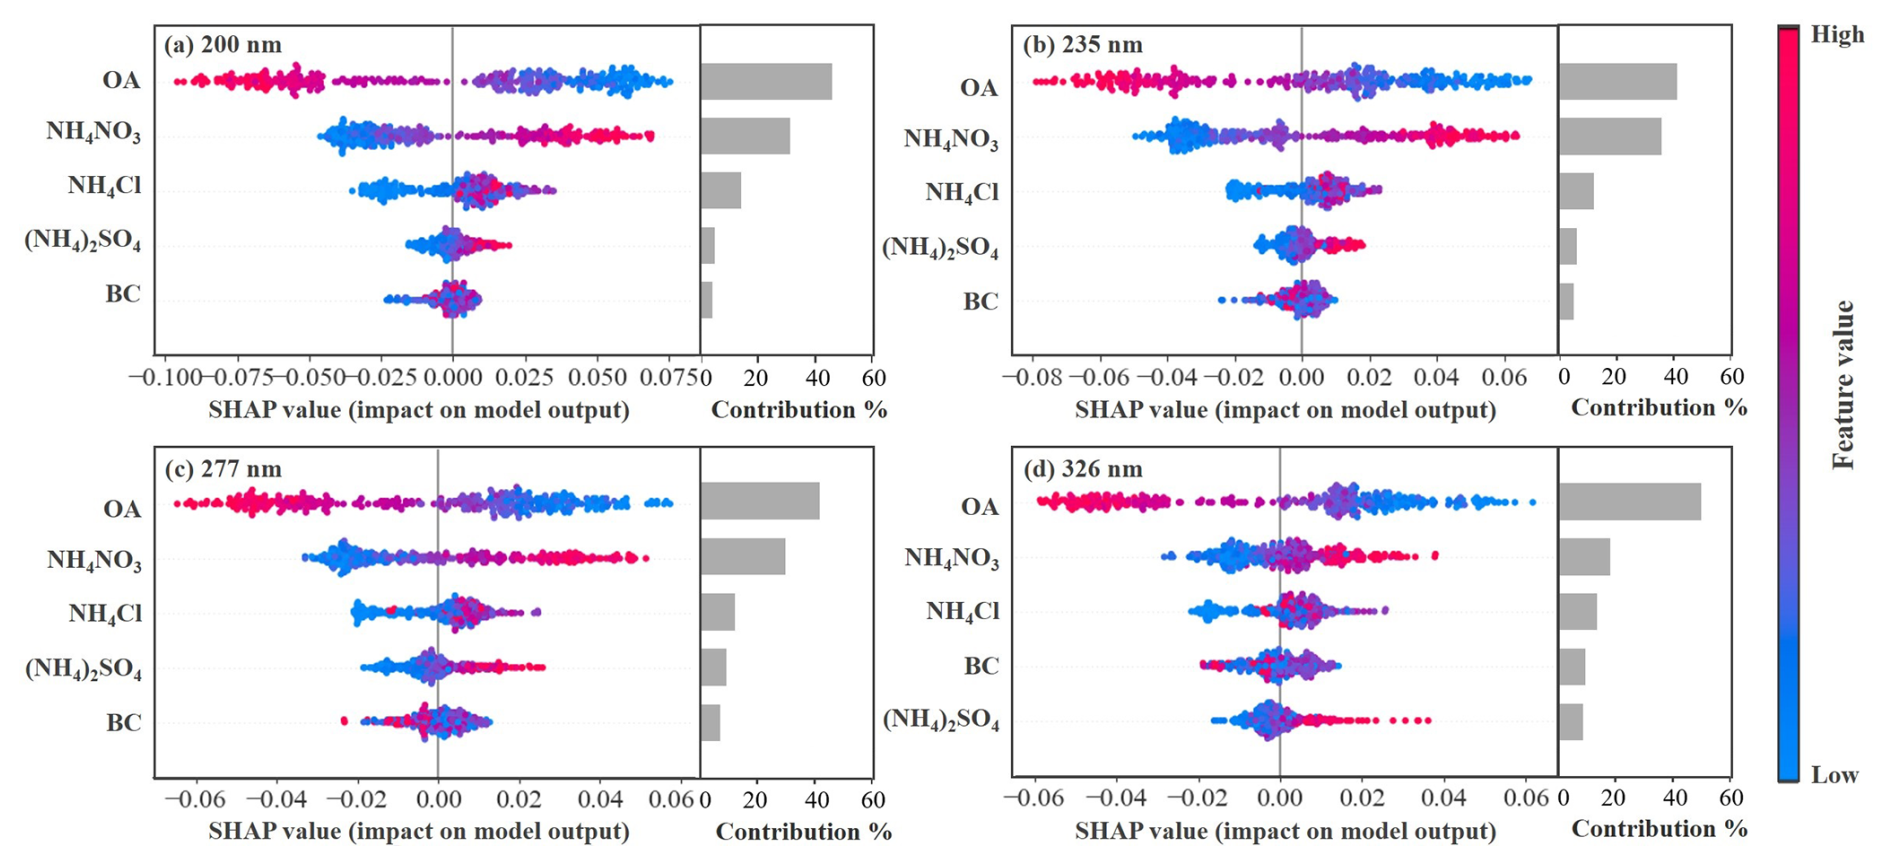
Figure 6SHAP values of the aerosol composition for particles with diameters of (a) 200 nm, (b) 235 m, (c) 277 nm, and (d) 326 nm. The left bar plots attached to each panel describe the contribution of each species.
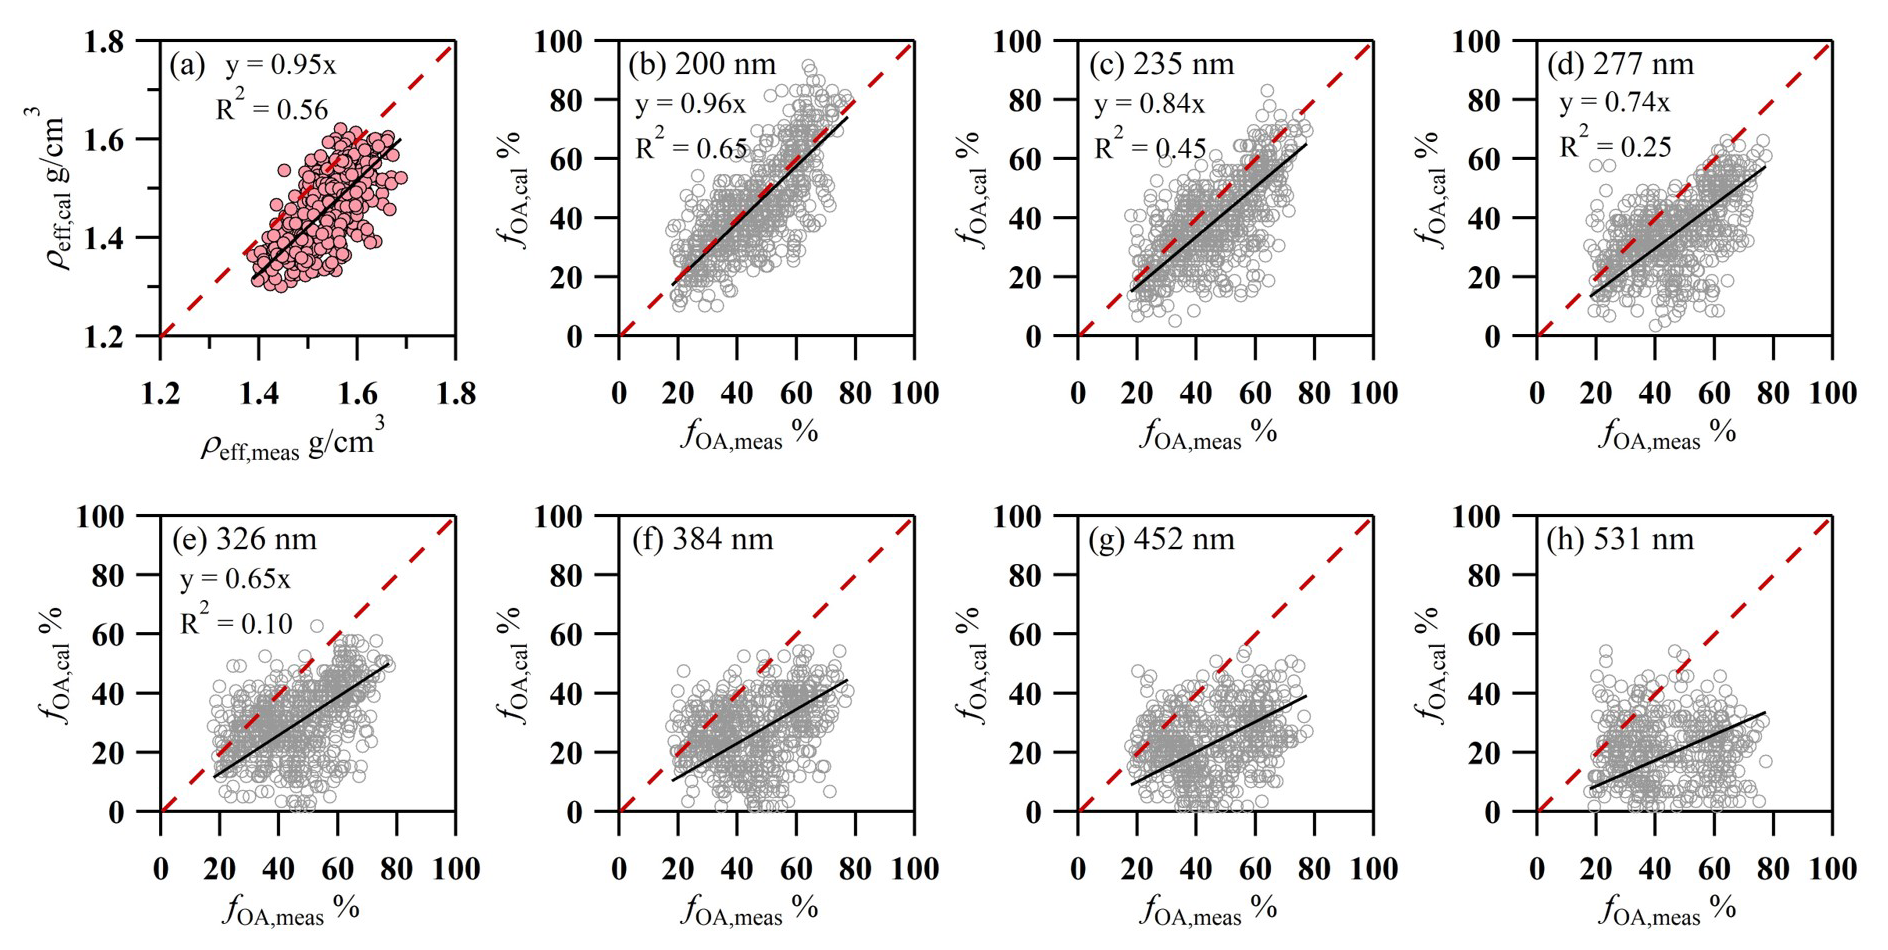
Figure 7(a) Comparison of ρeff calculated from the ACSM aerosol composition (ρeff,cal) and the mean ρeff measured by the AAC-SMPS (ρeff,meas). Comparison of the calculated mass fraction of OAs from the measured ρeff and the measured mass fraction of OAs with an ACSM for particles with diameters of (b) 200 nm, (c) 235 nm, (d) 277 nm, (e) 326 nm, (f) 384 nm, (g) 452 nm, and (h) 531 nm. The red lines denote the 1:1 line.
Considering the difficulty of measuring the size-resolved chemical components of particles, this study attempted to calculate the size-resolved composition according to the size-resolved ρeff. According to Eq. (1), the effective densities of the ambient OA and BC are needed. For simplicity, the particles were assumed to consist of three components, e.g., OA, SIA, and BC. The value of 1.77 g cm−3 for SIA was adopted in this study. Material density values in the range of 0.3–2 g cm−3 for BC and 1.2–1.8 g cm−3 for OA were used in the sensitivity test. A step length of 0.02 g cm−3 was adopted for both the BC density and OA density. The mean ρeff is the number-concentration-weighted average density of particles of different sizes. The optimal values of OA and BC were determined by comparing the calculated bulk ρeff with the average ρeff for particles with diameters in the range of 200–532 nm. As a result, density values of 1.20 g cm−3 for OA and 1.77 g cm−3 for BC were determined. The BC density of 1.77 g cm−3 can be attributed to the coating of nitrate, as nitrate contributed the most to the mass fraction of PM2.5. The ρeff values of BC were reported to be in the range of 1.62–1.77 g cm−3 for particles with aerodynamic diameters of 200, 350, and 500 nm in Shanghai, indicating a coating of NH4NO3 and/or (NH4)2SO4 (Wang et al., 2021). The mean ρeff can be fitted well by applying the results of OA and BC, with an R2 of 0.56 (Fig. 7a).
We apply the fitted densities of OA and BC to Eq. (1). Then, the equation is expressed as follows:
where ρOA is 1.2 g cm−3, ρBC is 1.77 g cm−3, and ρSIA is 1.77 g cm−3. ρeff is the size-resolved ρeff measured by the AAC-SMPS. A series of fractions of OA, BC, and SIA were set to calculate ρeff via Eq. (2), and the fractions of OA, BC, and SIA were adjusted until the difference between the calculated and measured ρeff values was the minimum value and within an acceptable range (0.5 %). Consequently, the scatterplots and time series of the size-resolved proportions of OAs during the observation were determined, as shown in Fig. 7. The slope between the measured and calculated mass fractions of OAs reaches 0.65 for particles with dae < 350 nm, indicating that this method can be used to deduce the chemical composition effectively. However, for larger particles (dae > 350 nm), the OA and SIA fractions can be reproduced well only during EP2 (Fig. S9), indicating that this simplified method to deduce the chemical composition is not suitable for particles with diameters larger than 350 nm unless the pollution process is dominated by OA and nitrate. We must acknowledge that this calculation would be more rigorous if size-resolved chemical composition data were available. Here, we propose this method, which remains applicable if size-resolved chemical composition measurements become available in future studies. Moreover, we also conducted a sensitivity analysis, which revealed that the fitting results are more sensitive to the density of BC than to that of OA (Fig. S10). For 200 nm particles, when the BC density was 1.77 g cm−3, the fitting results exhibited a higher tolerance to variations in the OA density. However, as the particle size increased, this tolerance decreased. Therefore, when inferring the chemical composition from effective density, it is more important to accurately constrain the densities of OA and BC for larger particles.
The effective density is one of the most important physical properties and is associated with the aging process and chemical composition of aerosols. In this study, an AAC-SMPS was used to characterize the size-resolved ρeff in autumn in Hangzhou. The measured ρeff distributions were fitted to unimodal lognormal distributions, and the size dependency of ρeff was determined. The ρeff varied from 1.47±0.09 to 1.63±0.10 g cm−3 as the diameter increased from 200 to 531 nm. The ρeff of small particles (dae < 350 nm) shows more pronounced diurnal variation due to changes in the chemical composition and particle morphology, with lower values during the day and higher values at night, whereas the ρeff of larger particles shows no significant diurnal cycle. Moreover, ρeff is associated with pollution levels and air mass transport. During the clean period, ρeff is relatively high and clearly depends on size. However, during pollution episodes, the size dependence of ρeff is significantly weakened. Particularly when the pollutant components are dominated by organics and secondary nitrates, the ρeff of the particles does not increase with increasing particle size.
ML and the SHAP method were used to analyze the relationship between ρeff and the chemical composition of aerosols. OA, NH4NO3, and NH4Cl have the strongest effects on ρeff. ρeff has a negative correlation with OA and positive correlations with NH4NO3 and NH4Cl. Assuming that the particles consisted of OA, SIA, and BC, the material density values of 1.2 g cm−3 for OA and 1.7 g cm−3 for BC were derived from the mean ρeff and bulk chemical composition. Using the derived material, the size-resolved chemical composition was inferred from the size-resolved ρeff. The composition can be reproduced well for small particles, but this simplified method is not suitable for particles with diameters larger than 350 nm unless the pollution process is dominated by OA and nitrate.
The data are available from Zenodo: https://doi.org/10.5281/zenodo.13981448 (Song et al., 2024).
The supplement related to this article is available online at https://doi.org/10.5194/acp-25-4755-2025-supplement.
ZW determined the main goal of this study and designed the research. YS, JW, and XP conducted the field measurements with support from RS, YW, WZ, and JD. YS and JW performed the data analysis. JW, XP, FZ, ZX, LZ, and LJ contributed to the data analysis and interpretation. The written article was prepared by YS, JW, and ZW with input from all co-authors.
At least one of the (co-)authors is a member of the editorial board of Atmospheric Chemistry and Physics. The peer-review process was guided by an independent editor, and the authors also have no other competing interests to declare.
Publisher’s note: Copernicus Publications remains neutral with regard to jurisdictional claims made in the text, published maps, institutional affiliations, or any other geographical representation in this paper. While Copernicus Publications makes every effort to include appropriate place names, the final responsibility lies with the authors.
This work was supported by the National Key Research and Development Program of China (grant no. 2022YFC3703505), the National Natural Science Foundation of China (grant nos. 42005086 and 42305098), the China Postdoctoral Science Foundation (grant no. 2023M733028), the Postdoctoral Fellowship Program of CPSF (grant no. GZC20232276), and the “Pioneer” and “Leading Goose” R&D Program of Zhejiang (grant no. 2022C03065).
This paper was edited by Guangjie Zheng and reviewed by two anonymous referees.
Bond, T. C., Doherty, S. J., Fahey, D. W., Forster, P. M., Berntsen, T., DeAngelo, B. J., Flanner, M. G., Ghan, S., Kärcher, B., Koch, D., Kinne, S., Kondo, Y., Quinn, P. K., Sarofim, M. C., Schultz, M. G., Schulz, M., Venkataraman, C., Zhang, H., Zhang, S., Bellouin, N., Guttikunda, S. K., Hopke, P. K., Jacobson, M. Z., Kaiser, J. W., Klimont, Z., Lohmann, U., Schwarz, J. P., Shindell, D., Storelvmo, T., Warren, S. G., and Zender, C. S.: Bounding the role of black carbon in the climate system: A scientific assessment, J. Geophys. Res.-Atmos., 118, 5380–5552, https://doi.org/10.1002/jgrd.50171, 2013.
Briggs, N. L. and Long, C. M.: Critical review of black carbon and elemental carbon source apportionment in Europe and the United States, Atmos. Environ., 144, 409–427, https://doi.org/10.1016/j.atmosenv.2016.09.002, 2016.
Cheng, Y., Peng, Y., Cao, L.-M., Huang, X.-F., and He, L.-Y.: Identifying the geospatial relationship of surface ozone pollution in China: Implications for key pollution control regions, Sci. Total Environ., 930, 172763, https://doi.org/10.1016/j.scitotenv.2024.172763, 2024.
Ching, J., Adachi, K., Zaizen, Y., Igarashi, Y., and Kajino, M.: Aerosol mixing state revealed by transmission electron microscopy pertaining to cloud formation and human airway deposition, npj Climate and Atmospheric Science, 2, 22, https://doi.org/10.1038/s41612-019-0081-9, 2019.
Hu, M., Peng, J., Sun, K., Yue, D., Guo, S., Wiedensohler, A., and Wu, Z.: Estimation of Size-Resolved Ambient Particle Density Based on the Measurement of Aerosol Number, Mass, and Chemical Size Distributions in the Winter in Beijing, Environ. Sci. Technol., 46, 9941–9947, https://doi.org/10.1021/es204073t, 2012.
Johnson, T. J., Irwin, M., Symonds, J. P. R., Olfert, J. S., and Boies, A. M.: Measuring aerosol size distributions with the aerodynamic aerosol classifier, Aerosol Sci. Tech., 52, 655–665, https://doi.org/10.1080/02786826.2018.1440063, 2018.
Kazemimanesh, M., Rahman, M. M., Duca, D., Johnson, T. J., Addad, A., Giannopoulos, G., Focsa, C., and Boies, A. M.: A comparative study on effective density, shape factor, and volatile mixing of non-spherical particles using tandem aerodynamic diameter, mobility diameter, and mass measurements, J. Aerosol Sci., 161, 105930, https://doi.org/10.1016/j.jaerosci.2021.105930, 2022.
Kuang, Y., Huang, S., Xue, B., Luo, B., Song, Q., Chen, W., Hu, W., Li, W., Zhao, P., Cai, M., Peng, Y., Qi, J., Li, T., Wang, S., Chen, D., Yue, D., Yuan, B., and Shao, M.: Contrasting effects of secondary organic aerosol formations on organic aerosol hygroscopicity, Atmos. Chem. Phys., 21, 10375–10391, https://doi.org/10.5194/acp-21-10375-2021, 2021.
Leskinen, J., Hartikainen, A., Väätäinen, S., Ihalainen, M., Virkkula, A., Mesceriakovas, A., Tiitta, P., Miettinen, M., Lamberg, H., Czech, H., Yli-Pirilä, P., Tissari, J., Jakobi, G., Zimmermann, R., and Sippula, O.: Photochemical Aging Induces Changes in the Effective Densities, Morphologies, and Optical Properties of Combustion Aerosol Particles, Environ. Sci. Technol., 57, 5137–5148, https://doi.org/10.1021/acs.est.2c04151, 2023.
Levy, M. E., Zhang, R., Khalizov, A. F., Zheng, J., Collins, D. R., Glen, C. R., Wang, Y., Yu, X.-Y., Luke, W., Jayne, J. T., and Olaguer, E.: Measurements of submicron aerosols in Houston, Texas during the 2009 SHARP field campaign, J. Geophys. Res.-Atmos., 118, 10518–510534, https://doi.org/10.1002/jgrd.50785, 2013.
Lin, Y., Bahreini, R., Zimmerman, S., Fofie, E. A., Asa-Awuku, A., Park, K., Lee, S.-B., Bae, G.-N., and Jung, H. S.: Investigation of ambient aerosol effective density with and without using a catalytic stripper, Atmos. Environ., 187, 84–92, https://doi.org/10.1016/j.atmosenv.2018.05.063, 2018.
Liu, L., Bei, N., Hu, B., Wu, J., Liu, S., Li, X., Wang, R., Liu, Z., Shen, Z., and Li, G.: Wintertime nitrate formation pathways in the north China plain: Importance of N2O5 heterogeneous hydrolysis, Environ. Pollut., 266, 115287, https://doi.org/10.1016/j.envpol.2020.115287, 2020.
Lu, J., Shen, X., Ma, Q., Yu, A., Hu, X., Zhang, Y., Liu, Q., Liu, S., Che, H., Zhang, X., and Sun, J.: Size-resolved effective density of ambient aerosols measured by an AAC–SMPS tandem system in Beijing, Atmos. Environ., 318, 120226, https://doi.org/10.1016/j.atmosenv.2023.120226, 2024.
Lundberg, S. M. and Lee, S.-I.: A unified approach to interpreting model predictions, in: Advances in Neural Information Processing Systems, Vol. 30, edited by: Guyon, I., von Luxburg, U., Bengio, S., Wallach, H., Fergus, R., Vishwanathan, S., and Garnett, R., Curran Associates, Inc., Red Hook, NY, USA, 4765–4774, ISBN 9781510860964, 2017.
Ma, Y., Li, S., Zheng, J., Khalizov, A., Wang, X., Wang, Z., and Zhou, Y.: Size-resolved measurements of mixing state and cloud-nucleating ability of aerosols in Nanjing, China, J. Geophys. Res.-Atmos., 122, 9430–9450, https://doi.org/10.1002/2017jd026583, 2017.
Ma, Y., Huang, C., Jabbour, H., Zheng, Z., Wang, Y., Jiang, Y., Zhu, W., Ge, X., Collier, S., and Zheng, J.: Mixing state and light absorption enhancement of black carbon aerosols in summertime Nanjing, China, Atmos. Environ., 222, 117141, https://doi.org/10.1016/j.atmosenv.2019.117141, 2020.
McMurry, P. H., Wang, X., Park, K., and Ehara, K.: The Relationship between Mass and Mobility for Atmospheric Particles: A New Technique for Measuring Particle Density, Aerosol Sci. Tech., 36, 227–238, https://doi.org/10.1080/027868202753504083, 2002.
Okuda, T.: Measurement of the specific surface area and particle size distribution of atmospheric aerosol reference materials, Atmos. Environ., 75, 1–5, https://doi.org/10.1016/j.atmosenv.2013.04.033, 2013.
Pedregosa, F., Varoquaux, G., Gramfort, A., Michel, V., Thirion, B., Grisel, O., Blondel, M., Louppe, G., Prettenhofer, P., Weiss, R., Weiss, R. J., Vanderplas, J., Passos, A., Cournapeau, D., Brucher, M., Perrot, M., and Duchesnay, E.: Scikit-learn: Machine Learning in Python, J. Mach. Learn. Res. 12, 2825–2830, https://dl.acm.org/doi/10.5555/1953048.2078195, 2011.
Peng, J., Hu, M., Guo, S., Du, Z., Zheng, J., Shang, D., Levy Zamora, M., Zeng, L., Shao, M., Wu, Y. S., Zheng, J., Wang, Y., Glen, C. R., Collins, D. R., Molina, M. J., and Zhang, R.: Markedly enhanced absorption and direct radiative forcing of black carbon under polluted urban environments, P. Natl. Acad. Sci. USA, 113, 4266–4271, https://doi.org/10.1073/pnas.1602310113, 2016.
Peng, L., Li, Z., Zhang, G., Bi, X., Hu, W., Tang, M., Wang, X., Peng, P., and Sheng, G.: A review of measurement techniques for aerosol effective density, Sci. Total Environ., 778, 146248, https://doi.org/10.1016/j.scitotenv.2021.146248, 2021.
Qiao, K., Wu, Z., Pei, X., Liu, Q., Shang, D., Zheng, J., Du, Z., Zhu, W., Wu, Y., Lou, S., Guo, S., Chan, C. K., Pathak, R. K., Hallquist, M., and Hu, M.: Size-resolved effective density of submicron particles during summertime in the rural atmosphere of Beijing, China, J. Environ. Sci., 73, 69–77, https://doi.org/10.1016/j.jes.2018.01.012, 2018.
Riemer, N., Ault, A. P., West, M., Craig, R. L., and Curtis, J. H.: Aerosol Mixing State: Measurements, Modeling, and Impacts, Rev. Geophys., 57, 187–249, https://doi.org/10.1029/2018RG000615, 2019.
Rissler, J., Nordin, E. Z., Eriksson, A. C., Nilsson, P. T., Frosch, M., Sporre, M. K., Wierzbicka, A., Svenningsson, B., Londahl, J., Messing, M. E., Sjogren, S., Hemmingsen, J. G., Loft, S., Pagels, J. H., and Swietlicki, E.: Effective density and mixing state of aerosol particles in a near-traffic urban environment, Environ. Sci. Technol., 48, 6300–6308, https://doi.org/10.1021/es5000353, 2014.
Sarangi, B., Aggarwal, S. G., Sinha, D., and Gupta, P. K.: Aerosol effective density measurement using scanning mobility particle sizer and quartz crystal microbalance with the estimation of involved uncertainty, Atmos. Meas. Tech., 9, 859–875, https://doi.org/10.5194/amt-9-859-2016, 2016.
Song, C., Becagli, S., Beddows, D. C. S., Brean, J., Browse, J., Dai, Q., Dall'Osto, M., Ferracci, V., Harrison, R. M., Harris, N., Li, W., Jones, A. E., Kirchgäßner, A., Kramawijaya, A. G., Kurganskiy, A., Lupi, A., Mazzola, M., Severi, M., Traversi, R., and Shi, Z.: Understanding Sources and Drivers of Size-Resolved Aerosol in the High Arctic Islands of Svalbard Using a Receptor Model Coupled with Machine Learning, Environ. Sci. Technol., 56, 11189–11198, https://doi.org/10.1021/acs.est.1c07796, 2022a.
Song, Y., Pei, X., Liu, H., Zhou, J., and Wang, Z.: Characterization of tandem aerosol classifiers for selecting particles: implication for eliminating the multiple charging effect, Atmos. Meas. Tech., 15, 3513–3526, https://doi.org/10.5194/amt-15-3513-2022, 2022b.
Song, Y., Wei, J., Zhao, W., Ding, J., Pei, X., Zhang, F., Xu, Z., Shi, R., Wei, Y., Zhang, L., Jin, L., and Wang, Z.: Data of measurement report: size-resolved particle effective density measured by the AAC-SMPS and implications for chemical composition, Zenodo [data set], https://doi.org/10.5281/zenodo.13981448, 2024.
Spencer, M. T., Shields, L. G., and Prather, K. A.: Simultaneous Measurement of the Effective Density and Chemical Composition of Ambient Aerosol Particles, Environ. Sci. Technol., 41, 1303–1309, https://doi.org/10.1021/es061425+, 2007.
Sun, P., Nie, W., Chi, X., Xie, Y., Huang, X., Xu, Z., Qi, X., Xu, Z., Wang, L., Wang, T., Zhang, Q., and Ding, A.: Two years of online measurement of fine particulate nitrate in the western Yangtze River Delta: influences of thermodynamics and N2O5 hydrolysis, Atmos. Chem. Phys., 18, 17177–17190, https://doi.org/10.5194/acp-18-17177-2018, 2018.
Sun, Y., Wang, Z., Dong, H., Yang, T., Li, J., Pan, X., Chen, P., and Jayne, J. T.: Characterization of summer organic and inorganic aerosols in Beijing, China with an Aerosol Chemical Speciation Monitor, Atmos. Environ., 51, 250–259, https://doi.org/10.1016/j.atmosenv.2012.01.013, 2012.
Tavakoli, F. and Olfert, J. S.: An Instrument for the Classification of Aerosols by Particle Relaxation Time: Theoretical Models of the Aerodynamic Aerosol Classifier, Aerosol Sci. Tech., 47, 916–926, https://doi.org/10.1080/02786826.2013.802761, 2013.
Tavakoli, F. and Olfert, J. S.: Determination of particle mass, effective density, mass–mobility exponent, and dynamic shape factor using an aerodynamic aerosol classifier and a differential mobility analyzer in tandem, J. Aerosol Sci., 75, 35–42, https://doi.org/10.1016/j.jaerosci.2014.04.010, 2014.
Wang, S., Zhou, K., Lu, X., Chen, H., Yang, F., Li, Q., Yang, X., and Wang, X.: Measurement of Density and Shape for Single Black Carbon Aerosols in a Heavily Polluted Urban Area, Aerosol Air Quality Res., 21, 210162, https://doi.org/10.4209/aaqr.210162, 2021.
Wang, Y., Liu, F., He, C., Bi, L., Cheng, T., Wang, Z., Zhang, H., Zhang, X., Shi, Z., and Li, W.: Fractal Dimensions and Mixing Structures of Soot Particles during Atmospheric Processing, Environ. Sci. Tech. Lett., 4, 487–493, https://doi.org/10.1021/acs.estlett.7b00418, 2017.
Wang, Y., Chen, Y., Wu, Z., Shang, D., Bian, Y., Du, Z., Schmitt, S. H., Su, R., Gkatzelis, G. I., Schlag, P., Hohaus, T., Voliotis, A., Lu, K., Zeng, L., Zhao, C., Alfarra, M. R., McFiggans, G., Wiedensohler, A., Kiendler-Scharr, A., Zhang, Y., and Hu, M.: Mutual promotion between aerosol particle liquid water and particulate nitrate enhancement leads to severe nitrate-dominated particulate matter pollution and low visibility, Atmos. Chem. Phys., 20, 2161–2175, https://doi.org/10.5194/acp-20-2161-2020, 2020.
Wang, Y. Q.: An Open Source Software Suite for Multi-Dimensional Meteorological Data Computation and Visualisation, J. Open Res. Software, 7, 21, https://doi.org/10.5334/jors.267, 2019.
Wu, C.-A., Chen, Y.-T., Young, L.-H., Chang, P.-K., Chou, L.-T., Chen, A. Y., and Hsiao, T.-C.: Ultrafine particles in urban settings: A combined study of volatility and effective density revealed by VT-DMA-APM, Atmos. Environ., 312, 120054, https://doi.org/10.1016/j.atmosenv.2023.120054, 2023.
Xie, T., Cao, L., Zheng, J., Xuan, P., and Huang, X.: Characterization of size-resolved effective density of atmospheric particles in an urban atmosphere in Southern China, J. Environ. Sci., 141, 194–204, https://doi.org/10.1016/j.jes.2023.09.021, 2024.
Xie, Y., Ye, X., Ma, Z., Tao, Y., Wang, R., Zhang, C., Yang, X., Chen, J., and Chen, H.: Insight into winter haze formation mechanisms based on aerosol hygroscopicity and effective density measurements, Atmos. Chem. Phys., 17, 7277–7290, https://doi.org/10.5194/acp-17-7277-2017, 2017.
Xu, Z., Zou, Q., Jin, L., Shen, Y., Shen, J., Xu, B., Qu, F., Zhang, F., Xu, J., Pei, X., Xie, G., Kuang, B., Huang, X., Tian, X., and Wang, Z.: Characteristics and sources of ambient Volatile Organic Compounds (VOCs) at a regional background site, YRD region, China: Significant influence of solvent evaporation during hot months, Sci. Total Environ., 857, 159674, https://doi.org/10.1016/j.scitotenv.2022.159674, 2023.
Yao, Q., Asa-Awuku, A., Zangmeister, C. D., and Radney, J. G.: Comparison of three essential sub-micrometer aerosol measurements: Mass, size and shape, Aerosol Sci. Tech., 54, 1197–1209, https://doi.org/10.1080/02786826.2020.1763248, 2020.
Yin, Z., Ye, X., Jiang, S., Tao, Y., Shi, Y., Yang, X., and Chen, J.: Size-resolved effective density of urban aerosols in Shanghai, Atmos. Environ., 100, 133–140, https://doi.org/10.1016/j.atmosenv.2014.10.055, 2015.
Zhai, J., Lu, X., Li, L., Zhang, Q., Zhang, C., Chen, H., Yang, X., and Chen, J.: Size-resolved chemical composition, effective density, and optical properties of biomass burning particles, Atmos. Chem. Phys., 17, 7481–7493, https://doi.org/10.5194/acp-17-7481-2017, 2017.
Zhang, C., Xie, Y., Shao, M., and Wang, Q. g.: Application of machine learning to analyze ozone sensitivity to influencing factors: A case study in Nanjing, China, Sci. Total Environ., 929, 172544, https://doi.org/10.1016/j.scitotenv.2024.172544, 2024.
Zhang, Q., Canagaratna, M. R., Jayne, J. T., Worsnop, D. R., and Jimenez, J.-L.: Time- and size-resolved chemical composition of submicron particles in Pittsburgh: Implications for aerosol sources and processes, J. Geophys. Res.-Atmos., 110, D07S09, https://doi.org/10.1029/2004JD004649, 2005.
Zhang, Y. J., Tang, L. L., Wang, Z., Yu, H. X., Sun, Y. L., Liu, D., Qin, W., Canonaco, F., Prévôt, A. S. H., Zhang, H. L., and Zhou, H. C.: Insights into characteristics, sources, and evolution of submicron aerosols during harvest seasons in the Yangtze River delta region, China, Atmos. Chem. Phys., 15, 1331–1349, https://doi.org/10.5194/acp-15-1331-2015, 2015.
Zhao, G., Tan, T., Zhao, W., Guo, S., Tian, P., and Zhao, C.: A new parameterization scheme for the real part of the ambient urban aerosol refractive index, Atmos. Chem. Phys., 19, 12875–12885, https://doi.org/10.5194/acp-19-12875-2019, 2019.
Zhou, Y., Ma, N., Wang, Q., Wang, Z., Chen, C., Tao, J., Hong, J., Peng, L., He, Y., Xie, L., Zhu, S., Zhang, Y., Li, G., Xu, W., Cheng, P., Kuhn, U., Zhou, G., Fu, P., Zhang, Q., Su, H., and Cheng, Y.: Bimodal distribution of size-resolved particle effective density: results from a short campaign in a rural environment over the North China Plain, Atmos. Chem. Phys., 22, 2029–2047, https://doi.org/10.5194/acp-22-2029-2022, 2022.