the Creative Commons Attribution 4.0 License.
the Creative Commons Attribution 4.0 License.
 | 06 May 2025
AERO-MAP: a data compilation and modeling approach to understand spatial variability in fine- and coarse-mode aerosol composition
Longlei Li
Julius Vira
Marje Prank
Douglas S. Hamilton
Hitoshi Matsui
Ron L. Miller
P. Louis Lu
Ezgi Akyuz
Daphne Meidan
Peter Hess
Heikki Lihavainen
Christine Wiedinmyer
Jenny Hand
Maria Grazia Alaimo
Célia Alves
Andres Alastuey
Paulo Artaxo
Africa Barreto
Francisco Barraza
Silvia Becagli
Giulia Calzolai
Shankararaman Chellam
Ying Chen
Patrick Chuang
David D. Cohen
Cristina Colombi
Evangelia Diapouli
Gaetano Dongarra
Konstantinos Eleftheriadis
Johann Engelbrecht
Corinne Galy-Lacaux
Cassandra Gaston
Dario Gomez
Yenny González Ramos
Roy M. Harrison
Chris Heyes
Barak Herut
Philip Hopke
Christoph Hüglin
Maria Kanakidou
Zsofia Kertesz
Zbigniew Klimont
Katriina Kyllönen
Fabrice Lambert
Xiaohong Liu
Remi Losno
Franco Lucarelli
Willy Maenhaut
Beatrice Marticorena
Randall V. Martin
Nikolaos Mihalopoulos
Yasser Morera-Gómez
Adina Paytan
Joseph Prospero
Sergio Rodríguez
Patricia Smichowski
Daniela Varrica
Brenna Walsh
Crystal L. Weagle
Xi Zhao
Aerosol particles are an important part of the Earth climate system, and their concentrations are spatially and temporally heterogeneous, as well as being variable in size and composition. Particles can interact with incoming solar radiation and outgoing longwave radiation, change cloud properties, affect photochemistry, impact surface air quality, change the albedo of snow and ice, and modulate carbon dioxide uptake by the land and ocean. High particulate matter concentrations at the surface represent an important public health hazard. There are substantial data sets describing aerosol particles in the literature or in public health databases, but they have not been compiled for easy use by the climate and air quality modeling community. Here, we present a new compilation of PM2.5 and PM10 surface observations, including measurements of aerosol composition, focusing on the spatial variability across different observational stations. Climate modelers are constantly looking for multiple independent lines of evidence to verify their models, and in situ surface concentration measurements, taken at the level of human settlement, present a valuable source of information about aerosols and their human impacts complementarily to the column averages or integrals often retrieved from satellites. We demonstrate a method for comparing the data sets to outputs from global climate models that are the basis for projections of future climate and large-scale aerosol transport patterns that influence local air quality. Annual trends and seasonal cycles are discussed briefly and are included in the compilation. Overall, most of the planet or even the land fraction does not have sufficient observations of surface concentrations – and, especially, particle composition – to characterize and understand the current distribution of particles. Climate models without ammonium nitrate aerosols omit ∼ 10 % of the globally averaged surface concentration of aerosol particles in both PM2.5 and PM10 size fractions, with up to 50 % of the surface concentrations not being included in some regions. In these regions, climate model aerosol forcing projections are likely to be incorrect as they do not include important trends in short-lived climate forcers.
- Article
(15690 KB) - Full-text XML
-
Supplement
(9430 KB) - BibTeX
- EndNote


Intergovernmental Panel on Climate Change (IPCC) reports (IPCC, 2021; Gulev et al., 2021; Szopa et al., 2021) and other community assessments have highlighted the role of uncertainties in human-induced changes in aerosol concentration and composition in limiting our ability to project future climate. Aerosol particles are also a major contributor to air pollution, which reduces life expectancy and quality of life (Burnett et al., 2018). Aerosol particles are suspended liquids or solids in the atmosphere originating from diverse natural and anthropogenic sources and are composed of a wide variety of chemicals (e.g., sea salts, dust, sulfate, nitrate, black carbon, organic carbon). Particles interact with incoming solar radiation and outgoing longwave radiation, change cloud properties and lifetimes, and modify atmospheric photochemistry (Mahowald et al., 2011; Kanakidou et al., 2018; Bellouin et al., 2020). Once deposited on the surface, they can modify land and ocean biogeochemistry, as well as the albedo of snow and ice surfaces (Mahowald et al., 2017; Hansen and Nazarenko, 2004; Skiles et al., 2018). Satellite remote sensing retrievals provide important information about the temporal and spatial distribution of aerosol particles, but challenges remain in quantifying the aerosol size and chemical composition (Kahn et al., 2005; Tanré et al., 1997; Remer et al., 2005; Castellanos et al., 2024; Marshak et al., 2021). In addition, the AERONET surface remote sensing network provides some information about the loading, size, and absorption of aerosol properties in relation to composition (Holben et al., 2001; Dubovik et al., 2002; Schuster et al., 2016; Gonçalves Ageitos et al., 2023; Obiso et al., 2024). Both the magnitude of the aerosol effects on climate and, sometimes, their sign are dependent on the composition and size of particles (Mahowald et al., 2011, 2014; Bond et al., 2013; IPCC, 2021). In addition, one cannot understand the impact of humans on aerosol particles without identifying the sources of particles, which determine their chemical composition. Obtaining information about the composition and size of particles in many cases requires in situ observations, which are often limited in space and time (Hand et al., 2017; Philip et al., 2017; Yang et al., 2018; Collaud Coen et al., 2020).
The climate and aerosol modeling community, especially under the auspices of AeroCom, has compiled data sets and organized comparison projects that have provided substantial information to improve aerosol models (Huneeus et al., 2011; Textor et al., 2006; Dentener et al., 2006; Schulz et al., 2006, 2012; Gliß et al., 2021) or knowledge of aerosol impacts like cloud condensation nucleation (Laj et al., 2020; Fanourgakis et al., 2019). However, most of the available data come from North America and Europe (e.g., Szopa et al., 2021; Reddington et al., 2017). In addition, previous compilation studies have focused primarily on understanding fine-aerosol particles (here defined as particles with a diameter of less than 2.5 µm) and on improving model simulation of these particles because of their importance for air quality, respiratory health, cloud interactions, and shortwave forcing (Collaud Coen et al., 2020; Bellouin et al., 2020; Fanourgakis et al., 2019; Reddington et al., 2017). Coarse-mode particles (defined as those particles with a diameter larger than 2.5 µm) are important for longwave radiation interactions, cloud seeding, and biogeochemistry, but these interactions have received less attention (Jensen and Lee, 2008; Mahowald et al., 2011; Karydis et al., 2017; Chatziparaschos et al., 2023). In contrast to the many fine-aerosol compilations and comparisons (usually considering particles with aerodynamic diameters of less than 2.5 µm or PM2.5), there are fewer studies focusing on aerosol compilations for both fine and coarse particles and their comparison to models (Kok et al., 2014b; Albani et al., 2014; Huneeus et al., 2011; Gliß et al., 2021; Kok et al., 2021). Nonetheless, there are many observations of the coarse-particle mass with diameters of less than 10 µm (PM10) (e.g., Hand et al., 2017), and most climate models include these particles (e.g., Huneeus et al., 2011). Compilations of in situ data are available for dust and iron particles (Kok et al., 2014b; Albani et al., 2014; Mahowald et al., 2009) and for sea salts (Gong et al., 1997). Other studies have focused on the important topics of wet deposition (Vet et al., 2014) or trends in aerosol properties (e.g., AOD, surface PM) (Mortier et al., 2020; Aas et al., 2019). Observations of PM10 or coarse and fine particles are available for many regions and individual sites (e.g., Malm et al., 2007; Hand et al., 2019; Maenhaut and Cafmeyer, 1998; Artaxo and Maenhaut, 1990; McNeill et al., 2020) but have not previously been compiled into one database that would facilitate the evaluation of global climate models that are an important tool for projections of future climate change, air quality, and their impacts upon human society. Aerosol modelers need as much information as possible about the observed composition of the particles and their transport. Thus, there is a need to compile both PM2.5 and PM10 in situ concentration data into one database to make it easy for modelers to compare global model results with observations. One goal the aerosol community should work towards is making aerosol measurement data sets publicly and conveniently available while acknowledging the principal investigators who produced these data sets; we hope this paper serves as a step towards achieving this.
The current generation of Earth system models used for the IPCC simulations tends to include the dominant aerosol species (desert dust, sea spray, black carbon (BC), organic matter (OM), and sulfate) while omitting other potentially important aerosol constituents. For example, some Earth system models ignore ammonium nitrate particles despite the fact that these are known to be important for climate and biogeochemistry and are impacted by human activities (Paulot et al., 2016; Adams et al., 1999; Thornhill et al., 2021). In this study, we use available observations to compare to a global model estimate of the total PM10 and PM2.5, and we deduce the importance of these often-neglected aerosol species. We also propose a method for comparing species that are often not directly measured (such as dust or sea salts) using their elemental composition. Note that we exclude super-coarse (> PM10) particles here because of the sparsity of available measurements, although studies have suggested their importance for climate interactions (e.g., Adebiyi et al., 2023).
Climate modelers are constantly looking for multiple independent lines of evidence to verify their models, and in situ surface concentration data present a valuable source of information about aerosols that are often near human society. Understanding spatial variability in aerosols and the composition of those aerosols is key to understanding how aerosols in different regions have evolved in the past and how they will evolve in the future. Some regions are dominated by fossil-fuel-derived aerosols, which may have peaked in magnitude, even as greenhouse gas concentrations continue to increase, while, in other regions, aerosols are driven by agriculture or by natural aerosols (Bauer et al., 2016; Turnock et al., 2020; Kok et al., 2023). In addition, different aerosol species have different impacts on climate: for example, knowing whether aerosols are scattering or absorbing changes the sign of the interaction (Li et al., 2022). Some aerosols also serve as better cloud or ice nuclei than others, while biogeochemical impacts are very sensitive to composition (Mahowald et al., 2011). Knowing even the order of magnitude in regions with aerosols (e.g., contrasting 0.1 to 0.001) is important for aerosol–cloud interactions that can be non-linear, especially at low aerosol levels (Carslaw et al., 2013). Having surface concentration observational data sets with large spatial coverage based on independent data can be valuable for aerosol model comparisons, especially for models with a global domain. We focus most of this paper on the spatial distribution of the climatological mean as this is easily obtained from models and is the most important variable for many climate impacts like radiative effects or aerosol-0cloud interactions, except for aerosols dispersed by large infrequent events (e.g., Clark et al., 2015; Fasullo et al., 2022). Since aerosols are thought to cause between 2 and 10 million deaths per year (Landrigan et al., 2018; Lelieveld et al., 2019; Murray et al., 2020; Vohra et al., 2021), understanding and being able to model correctly the annual mean aerosol concentrations in the surface layer are vital; thus, this data set provides valuable information for understanding aerosol contributions to mortality. Nonetheless, there have been trends in emissions, especially of anthropogenic aerosols, over the last 40 years (Quaas et al., 2022; Bauer et al., 2022), and we consider these as well.
For this study we focus on the following: (a) identifying and compiling available PM2.5 and PM10 aerosol data, including aerosol composition, into a new publicly available database (AERO-MAP) for the modeling community across as much of the globe as possible; (b) presenting a methodology to compare the spatial distribution of the climatological mean observations to the aerosols in an Earth system model; (c) briefly presenting some temporal trends and comparisons available from this data set; and (d) identifying the measurement and modeling gaps from this comparison. While our model evaluation is not exhaustive, we hope that the convenience of this observational compilation enables an expansion and a more thorough set of comparisons by future investigators.
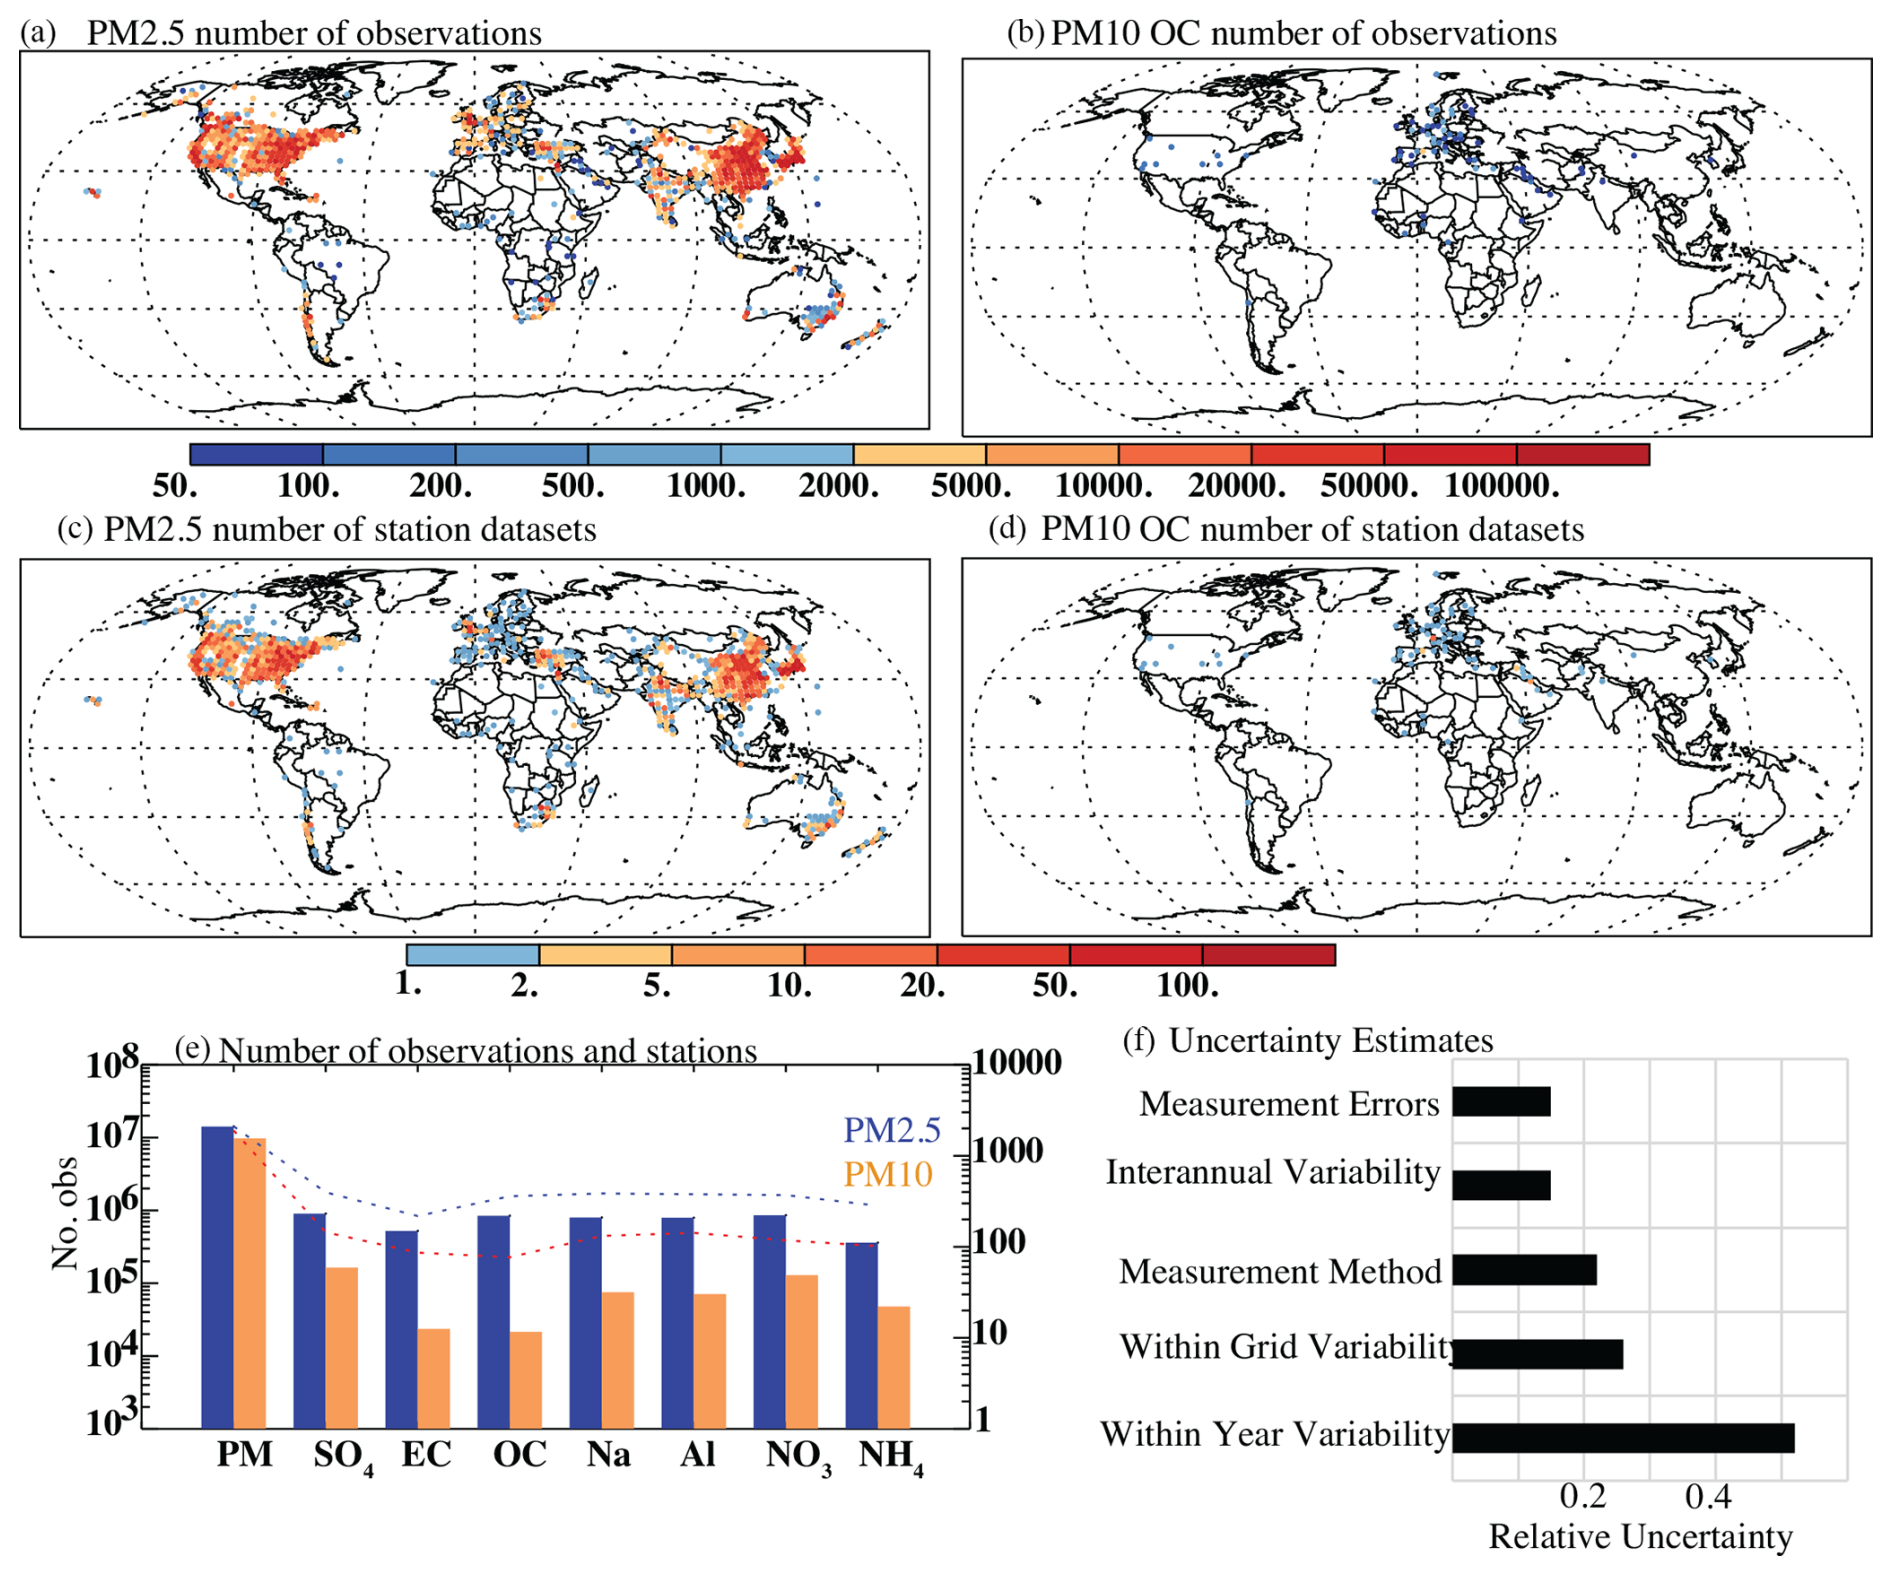
Figure 1Distribution of observations in the database showing the number of observations of PM2.5 (a) and PM10 organic carbon (OC) (b) (with the colors indicating different numbers according to the top color bar), as well as the number of stations within each 2×2 grid locations for PM2.5 (c) and PM10 OC (d) (using the second color bar), illustrating that there are much more PM2.5 or PM10 data compared to speciated data. (e) The number of observations (bars) for total particulate matter (PM) or speciated data is summarized for the PM2.5 (blue) and PM10 (orange) fraction using the left-hand-side y axis. The number of stations included in the study is shown as a dotted line (e) and uses the right-hand-size y axis. (f) Normalized (1 standard deviation over the mean) observational uncertainty for PM2.5 based on measurement errors, interannual variability, measurement method, within-grid variability, and within-year variability at the same station. Interannual variability and within-grid uncertainty are defined as the normalized standard deviation in the variability for stations that have more than 10 years of data. Within-grid variability is the normalized standard deviation of 2×2 grid cells that have more than 10 stations. Measurement errors are the normalized standard deviation of the reported measurement errors for PM2.5. Measurement method error is derived from the differences between different measurement methods (e.g., Prank et al., 2016; Burgos et al., 2020; Hand et al., 2017). The stations included are derived from the following sources (see the Supplement for more details): Alastuey et al. (2016), Almeida et al. (2005), Amato et al. (2016), Andreae et al. (2002), Arimoto et al. (2003), Artaxo et al. (2002), Barkley et al. (2019), Barraza et al. (2017), Bergametti et al. (1989), Bouet et al. (2019), Bozlaker et al. (2013), Chen et al. (2006), Chuang et al. (2005), Cipoli et al. (2023), Cohen et al. (2004), da Silva et al. (2008), Dongarrà et al. (2007, 2010), Engelbrecht et al. (2009), Formenti et al. (2003), Fuzzi et al. (2007), Hand et al. (2017), Heimburger et al. (2012), Herut and Krom (1996), Herut et al. (2001), Hsu et al. (2016), Hueglin et al. (2005), Furu et al. (2022, 2015), García et al. (2017), Gianini et al. (2012a, b), Kalivitis et al. (2007), Kaly et al. (2015), Kubilay et al. (2000), Kyllönen et al. (2020), Laing et al. (2014b, a), Lucarelli et al. (2014, 2019), Mackey et al. (2013), Maenhaut et al. (1996c, a, b, 1997a, b, 1999, 2000a, 2000b, 2002a, b, 2005, 2008, 2011), Maenhaut and Cafmeyer (1998), Malm et al. (2007), Marticorena et al. (2010), Mihalopoulos et al. (1997), Mirante et al. (2010, 2013), Mkoma (2008), Mkoma et al. (2009), Morera-Gómez et al. (2018, 2019), Nava et al. (2015, 2020), Nyanganyura et al. (2007), Oliveira (2009), Oliveira et al. (2010), Pérez et al. (2008), Pio et al. (2022), Prospero et al. (1989, 2012, 2020), Prospero (1996, 1990), Putaud et al. (2004, 20100), Rodríguez et al. (2011, 2015), Salma et al. (1997), Savoie et al. (1993), Silva et al. (2010), Smichowski et al. (2004), Swap et al. (1992), Tørseth et al. (2012), Uematsu et al. (1983), Vanderzalm et al. (2003), Virkkula et al. (1999), Xiao et al. (2014), and Zihan and Losno (2016). Data from several online networks are also included (e.g., https://www.airnow.gov/international/us-embassies-and-consulates/, last access: 10 June 2022, https://quotsoft.net/air/, last access: 10 August 2022; https://app.cpcbccr.com/ccr/#/caaqm-dashboard-all/caaqm-landing/data, last access: 20 September 2022, https://sinca.mma.gob.cl/index.php/, last access: 3 June 2022; https://tenbou.nies.go.jp/download/, last access: 25 November 2023). See the Supplement for more details and the DOI links for the data sets.
2.1 Observational data
PM observations are made by multiple networks or during specific field campaigns and for different size cut-offs, with and without a description of chemical composition. Data sets were identified by advertising at international meetings (Wiedinmyer et al., 2018), searching the literature, contacting principal investigators, and accessing publicly available data sets. As expected, most of the observations are over North America or Europe, with many of the rest of the land areas and most of the ocean being much more poorly observed (Fig. 1; Data set 1 in the Supplement). For this study, we include data sets of both PM2.5 and PM10 daily (or multi-day) averages that were made available by the investigators or that are available from public web sites (Fig. 1; Data set 1 in the Supplement). Some measurement sites measure PM2.5 and coarse (PM2.5 to PM10) aerosols. For those sites, we convert the latter to PM10 for comparison. Some measurement sites have only a few observations of composition or mass, while others have multiple years: we included less complete data sets for sites in regions with limited data (e.g., field data: these are identified as station data sets with less than 1 year of data in the data sets in the Supplement). In some poorly measured regions, we include total suspended particle (TSP) data sets (information on the size fraction measured is in the data set in the Supplement). The time period for different data sets is included in Data set 1 in the Supplement.
Detailed studies have shown that PM10 and PM2.5 samplers can differ in the sharpness of their size cut-off (Hand et al., 2019). As an example, comparisons between data from the US Environmental Protection Agency (EPA) Federal Reference Method sites and data from the Interagency Monitoring of Protected Visual Environments (IMPROVE) network show that the coarse matter from collocated sites in both networks was offset by 28 % (Hand et al., 2019). There was a bias when data were compared (slope of 0.9), but the correlation coefficient was high (0.9), suggesting good agreement overall. Here, we focus on surface station measurements of PM10 and PM2.5 since our model and most models only consider mass up to PM10. For that reason, our model deposition is not directly comparable to observational bulk and/or total atmospheric deposition since larger particles may dominate the deposition close to the source areas (Kok et al., 2017; Mahowald et al., 2014; Neff et al., 2013). Measuring absolute dry- and wet-deposition rates is also technically more challenging (especially for dry deposition since the particles can be re-entrained into the atmosphere) but worthwhile (Heimburger et al., 2012; Prospero et al., 1996). In regions with little data (e.g., outside of North America and Europe) we include measurements of total suspended particulates (TSPs) with the PM10 because of the lack of size-resolved data. Data from the Japanese air quality network use a different inlet for the PM10 cut-off as well, which will include a slightly larger size fraction (https://tenbou.nies.go.jp/download/, last access: 25 November 2023).
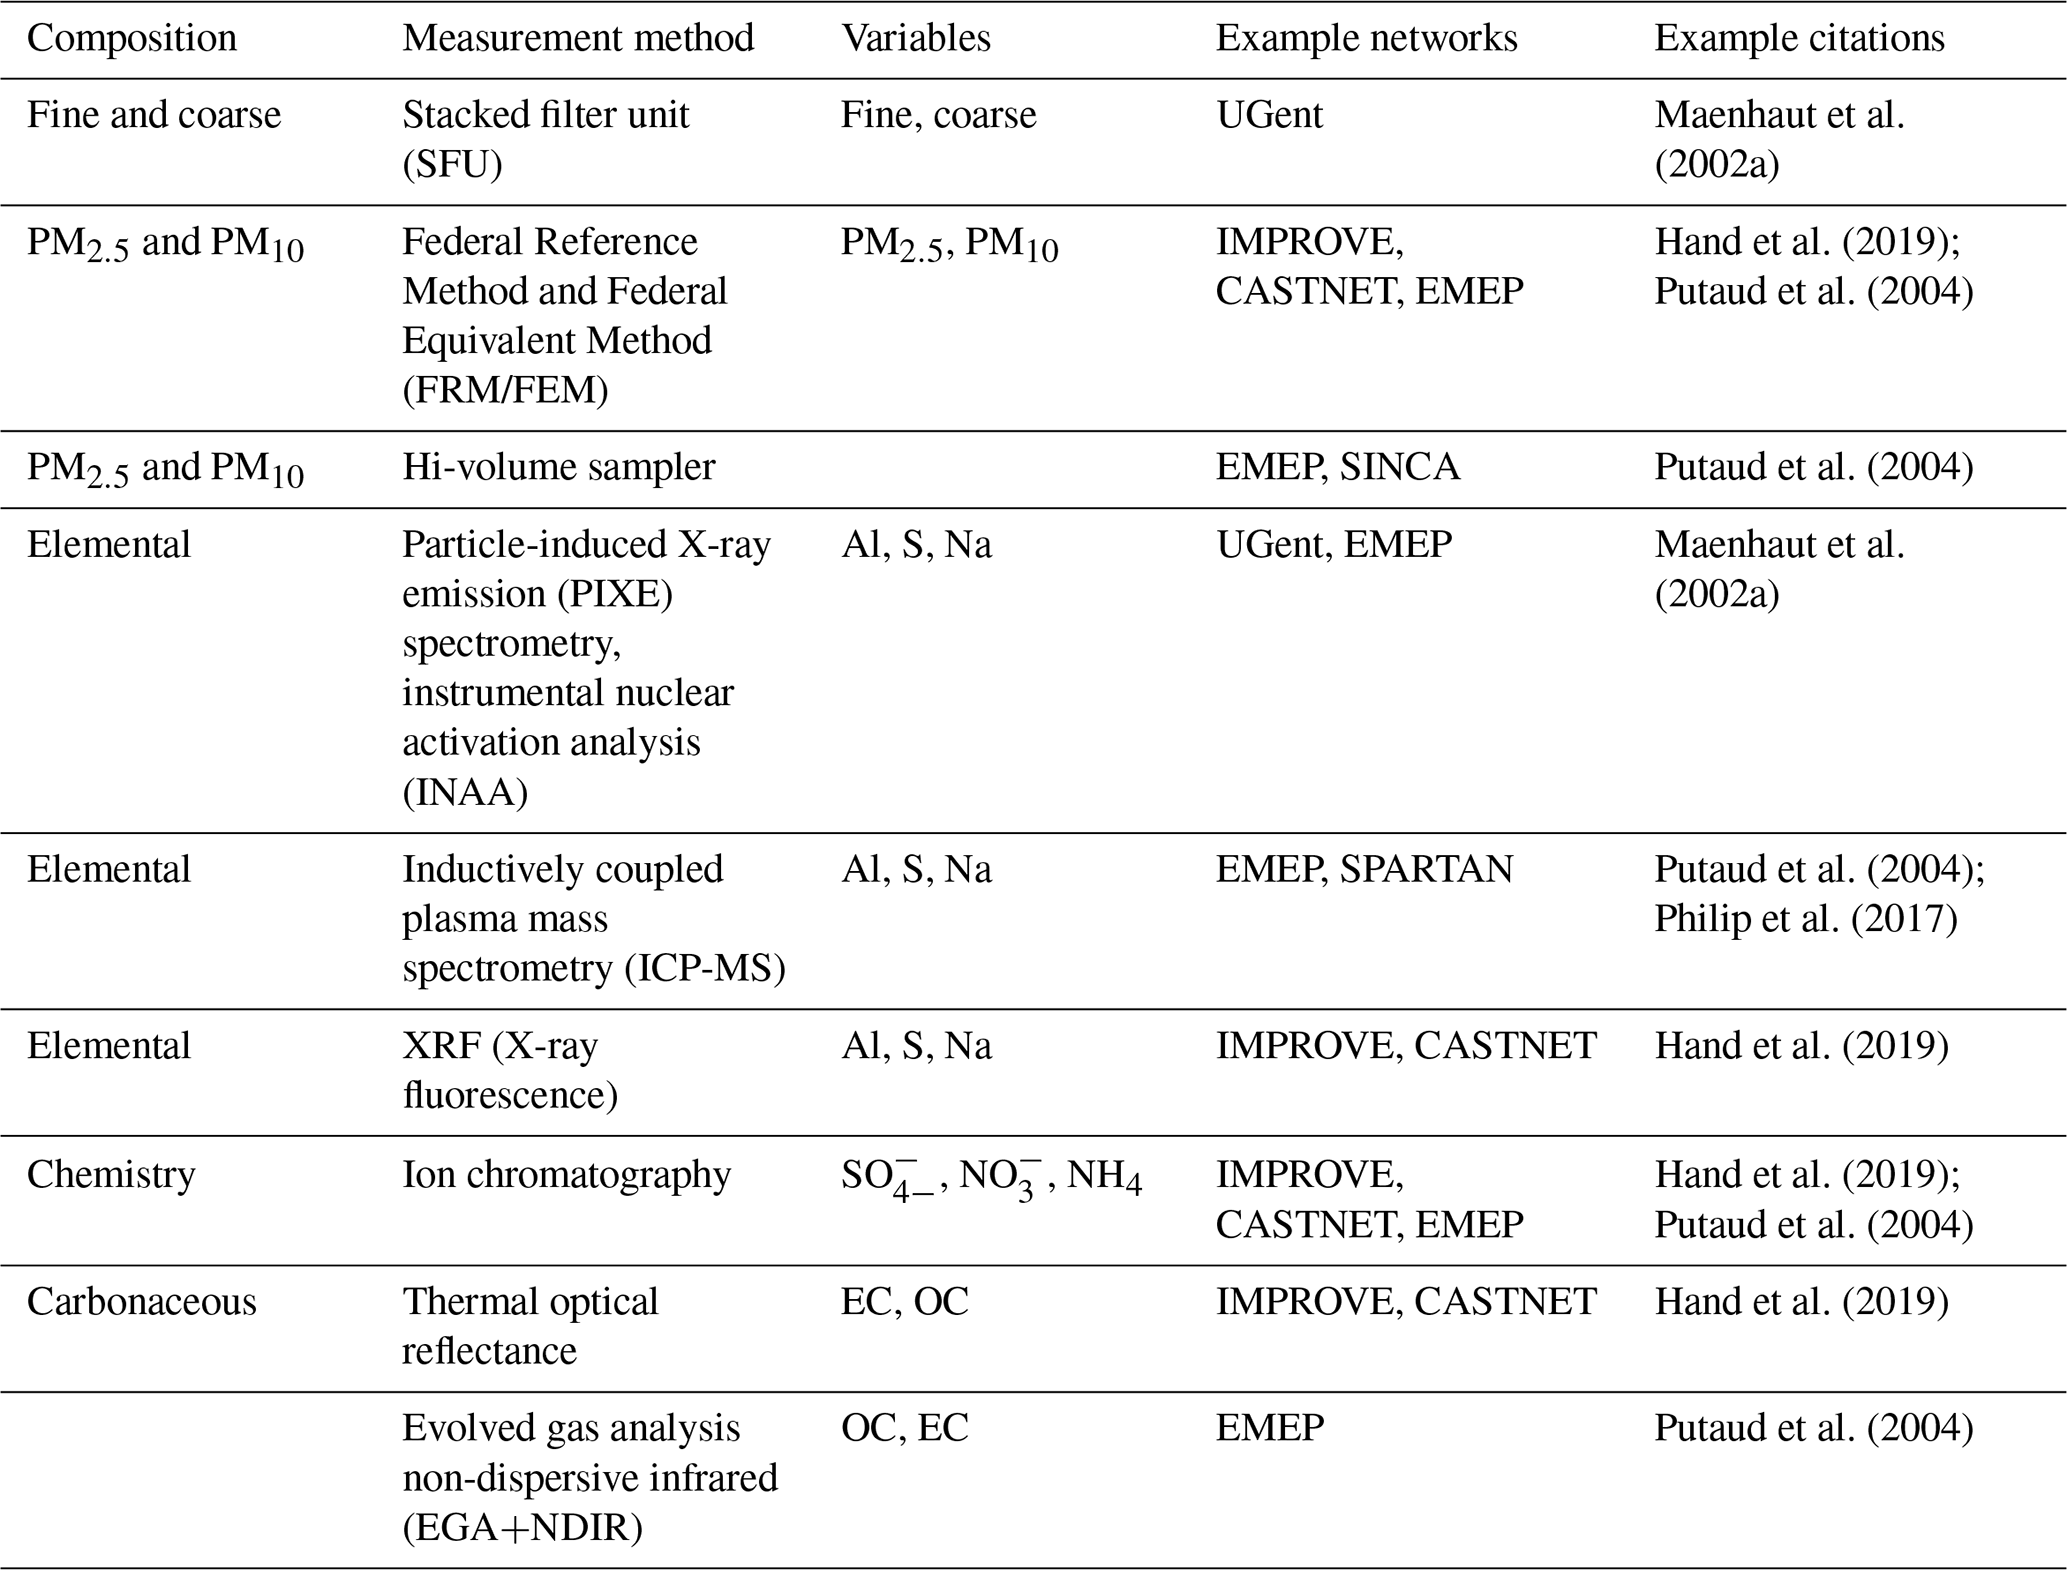
In addition to particulate matter in the PM10 and PM2.5 size fractions, we also compile the following observations to compare to the model: black carbon (BC), elemental carbon (EC), organic carbon (OC) (or particulate organic material or OM, which, here, is considered to be 1.8× OC in mass; Aiken et al., 2008; Font et al., 2024; Turpin and Lim, 2001), sulfate, nitrate, aluminum, sodium, and chloride. To include both BC (based on light absorption measurements) and EC (based on thermal-oxidation-induced combustion measurements) data is also a source of uncertainty; both are proxies of the soot combustion particles since they are based on different measurement techniques, and there is no accepted equivalence between them (Mbengue et al., 2021). Details on the measurement methods and types are shown in Table 1 and vary between measurements of fine and coarse versus PM2.5 and PM10, with different measurement types for elemental and chemical analysis (Table 1). Details on how the model is compared to data for different elements are in Sect. 2.3.
For this paper, we focus on the climatological means for 1986–2023 and the decadal means for 2010–2019. The first period is chosen as the full durations of the individual data sets comprising the compilation are available; the second is chosen to recognize decadal variations in anthropogenic emissions within the longer period and to isolate a particular decade when data are most plentiful. In addition, the annual means for each year the data are available are also calculated, as well as the climatological monthly means. The temporal means are calculated for all values at each station that are above the detection limit and are reported here. At some stations or times, concentrations can be below the detection limit, and excluding these data or time periods could bias our average values. We focus on the stations that have more than 50 % of the data above the detection limit and exclude other sites. For those included stations, if the values were reported to be below the detection limit, we include in the average one-third of the minimum detection limit. The reported detection limits should bound the upper limit of aerosol mass and allow us to include sites whose observations were otherwise too low to include while reducing the potential biasing of our compilation towards higher values (Data set 1 in the Supplement).
Our goal is to create easy-to-use data sets for model–data comparisons. Included in this data set are several files with different levels of description and analysis. One file provides traceability information, including a detailed citation; the types and numbers of measurements included; and the time period, climatological and decadal (2010–2019) means, and standard deviations for each time period (Data set 1 in the Supplement). For each station data set included in the database, there will be one line in this file. This means that, for some stations (for example, K-puszta), there are multiple lines in the file in the Supplement indicating the two different time periods where measurements were made, as well as the two sizes that are measured during each time period. For each station data set, there are latitude values, longitude values, annual mean values, the number of observations, the year extent of the observations, standard deviations, etc., along with the citation and where to obtain the data. There are also several NetCDF files available at https://doi.org/10.5281/zenodo.10459653 (Mahowald et al., 2024) for this data set. The most useful is likely to be the Allobservation.AEROMAP.nc file, which contains the same quantitative data for each station data set as the Supplement, except the data are processed to be only PM2.5 and PM10 (with some TSP data in places with little data, as discussed above). This means that PM2.5 and coarse aerosol mass are added together if the station data sets are collocated to create a PM10 data set (e.g., see Table 1). In addition, this file contains climatological monthly means and annual means for each year for each station data set so that temporal information is also easily available. Another file includes the climatological mean observations averaged for a 2°×2° grid that is used for plotting the figures shown in the paper (Allobservation.AEROMAP.2x2.nc). As indicated in the “Data availability” section, only the time means are available, and the underlying data for some data sets cannot be openly published; however, one should contact the authors (identified by the citation) if other time periods are desired.
The location of each site is as accurate as possible and, for most sites, is accurate to less than 1 km. Some data sets provided more limited information, and those locations are accurate only to less than 10 km (data downloaded from the following air quality networks: Mexico City – http://www.aire.cdmx.gob.mx/default.php?opc='aKBh', last access: 3 November 2022; South Africa – https://saaqis.environment.gov.za/, last access: 8 September 2022; India – https://app.cpcbccr.com/ccr/#/caaqm-dashboard-all/caaqm-landing/data, last access: 20 September 2022; and Chile – https://sinca.mma.gob.cl/index.php/, last access: 3 June 2022).
2.2 Model description
Most of the simulations of aerosol particles were conducted using the aerosol parameterizations within the Community Atmosphere Model version 6 (CAM6), the atmospheric component of the Community Earth System Model (CESM) developed at the National Center for Atmospheric Research (NCAR) (Hurrell et al., 2013; Scanza et al., 2015; Liu et al., 2012). The aerosol module in this version is closely related to the module used in the Energy Exascale Earth System Model (Golaz et al., 2019; Caldwell et al., 2019). Simulations were conducted at approximately 1°×1° horizontal resolution with 56 vertical layers for 4 years, with the last 3 years (2013–2015) being used for the analysis (Computational and Information Systems Laboratory, 2019). The model simulates three-dimensional transport and wet and dry deposition for gases and particles by nudging toward MERRA2 winds (Gelaro et al., 2017).
The model included prognostic dust, sea salts, BC, OM, and sulfate particles in the default version, using a modal scheme based on monthly mean emissions for the year 2010 (Liu et al., 2012, 2016; Li et al., 2021). The model includes separate primary and secondary organic species which are both emitted directly, but the primary organic- and black-carbon aerosols are allowed to age in the model from hydrophobic to hydroscopic, and their optical properties also change (Liu et al., 2016). The coarse mode is included for sulfate, dust, and sea salts. For this study, the coarse size mode (mode 3) was returned to the size parameters used in the previous version of the model, CAM5 (geometric standard deviation of 1.8), to better simulate coarse-mode particles and to improve the dry-deposition scheme and optics used in the model for simulating coarse-mode particles like dust as described in Li et al. (2022).
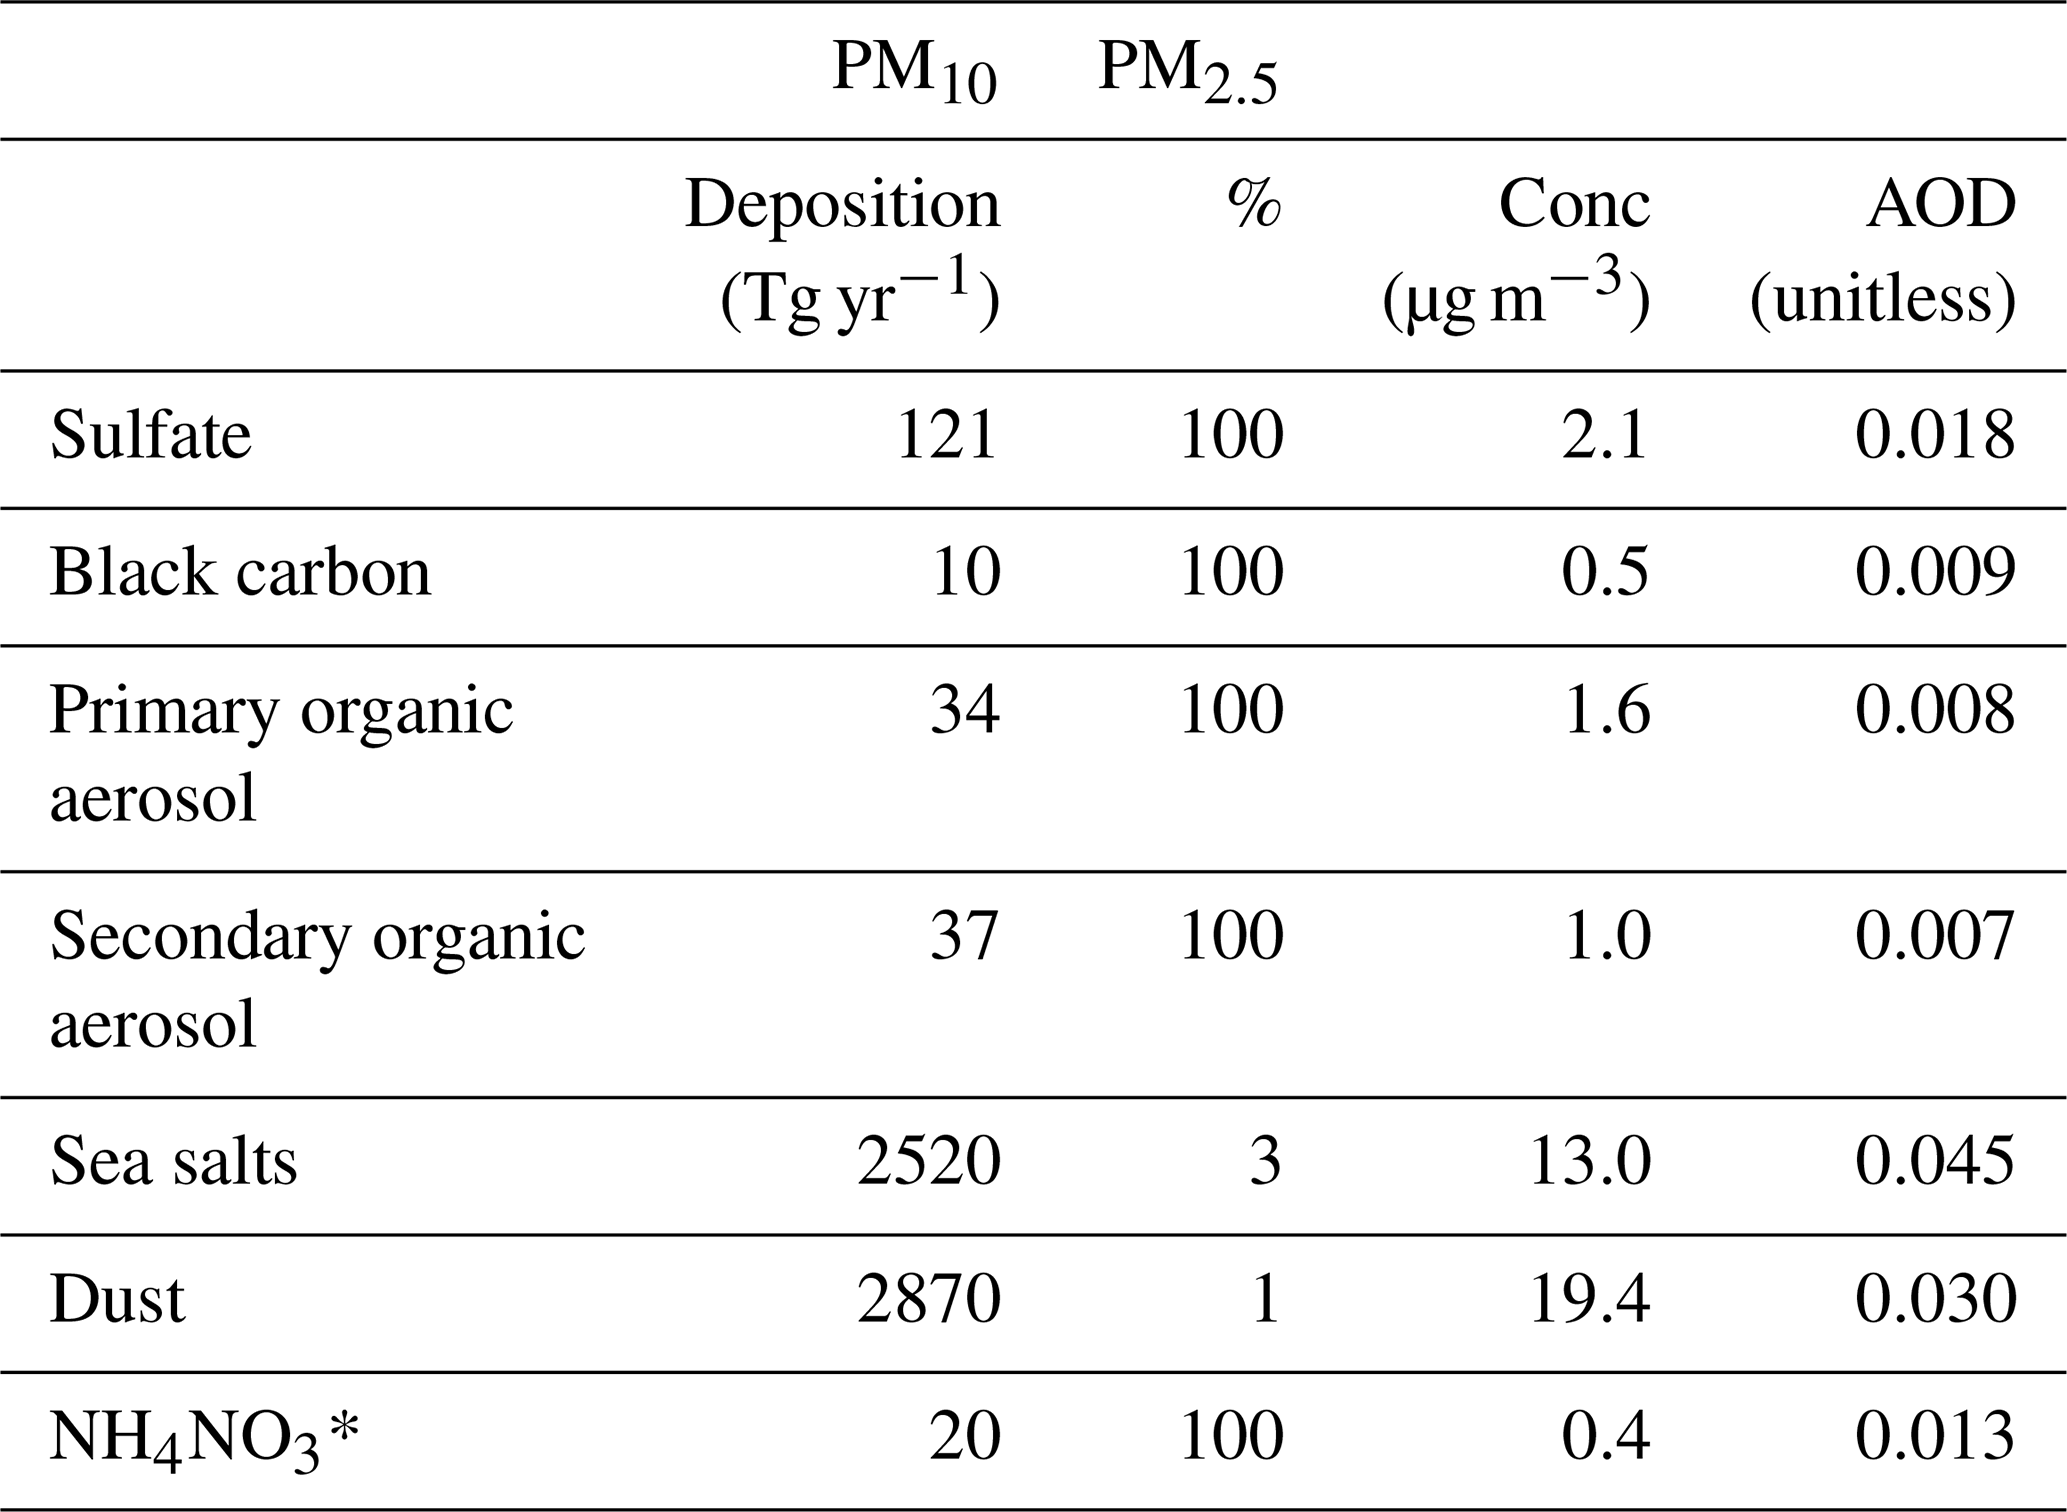
Desert dust is entrained into the atmosphere in dry, sparsely vegetated regions subject to strong winds. We use the Dust Entrainment and Deposition scheme (Zender et al., 2003), with the emitted size distribution given by the updated brittle fragmentation theory (Kok et al., 2014b, a) and with improved incorporation of aspherical particles for optics and deposition (Li et al., 2022; Huang et al., 2021; Kok et al., 2017). Anthropogenic emissions of sulfate, OM, and BC follow the Climate Model Intercomparison Project 6 historical data for 2010 (Gidden et al., 2019). Emissions and mean concentrations for each of these constituents are included in Table 2.
Table 2Global aerosol modeling budgets. Global modeled deposition (Tg yr−1), percentage of aerosols that are PM2.5, and globally and annually averaged surface concentration (µg m−3) and aerosol optical depth for each of the sources used in the model. An asterisk indicates that there are additions to the model from the default CAM6.
Modeling of additional aerosol sources and types
Ammonium nitrate aerosol particles are not included in the standard CAM6 but are thought to be important for aerosol optical depth and surface concentrations (Paulot et al., 2016; Adams et al., 1999; Thornhill et al., 2021; Bauer et al., 2007, 2016), and so they are included in this study. Nitrate can also react with dust particles, for example, but that is ignored in this study (Dentener et al., 1996). Ammonium nitrate particles require tropospheric chemistry interactions because the nitrogen-containing particles are both a source and a sink for gaseous nitrogen species, which are key elements of tropospheric photochemistry, and the particles are in chemical equilibrium with the gas phase (e.g., Nenes et al., 2021; Baker et al., 2021; Bauer et al., 2007, 2016), and so simulations using the CAM-CHEM model with tropospheric photochemistry are used, covering the same time period (Vira et al., 2022). Simulations with chemistry were conducted at 2°×2° resolution and are linearly interpolated to 1°×1° resolution as used for the other modeled particles. Sulfate in the CAM6 is assumed to be in the form of ammonium sulfate, and the nitrate is assumed to be in the form of ammonium nitrate for these studies, and so, as a rough approximation, only the model ammonium nitrate is compared to the observed nitrogenous aerosol optical depth. Ammonium nitrate is assumed to only form when there is surplus ammonium (and nitrate) after the ammonium sulfate is formed. While aerosol amounts are simulated, ammonium nitrate aerosol optical depth is not calculated within the model but rather is calculated offline. The model does calculate sulfate aerosol optical depth, which has a roughly similar increase in size with humidity compared to nitrates and similar optical properties as long as the nitrates and sulfates are in similar size fractions (Paulot et al., 2016; Bellouin et al., 2020). Therefore, the aerosol optical depth from ammonium nitrate (per unit mass) is assumed to be proportional to the sulfate aerosol optical depth per unit mass in each grid box at each time interval. A detailed comparison of the nitrate and ammonia particles and other species was conducted in Vira et al. (2022). Overall, the model can simulate some of the spatial distribution but overestimates the nitrate aerosol amounts (Vira et al., 2022).
2.3 Model–observation comparison methodology
Comparisons of the observations to model concentrations were done using BC, OC, SO, Al, NO, NH, and Na composition measurements. Some of these elements or compounds map directly onto model constituents (BC, OC, SO, NO, and NH), while others serve as proxies for modeled constituents (Al for dust, Na for sea salts, S for sulfate, etc.). We summarize the relationships used to obtain the values from the model (Table S1 in the Supplement) and to establish what observations should be combined to include as much information as possible from the observations. (Table S2). We use non-sea-salt sulfate in ocean regions for estimating sulfate. We use the mean Na amounts in sea salt (31 %; Schlesinger, 1997) to characterize the Na amounts, and we include the soluble-Na measurements as well (Na+), if available, when Na measurements are not available. Note that Cl cannot be used to evaluate sea salts as the Cl is degassed from aerosols, primarily due to sulfate interactions (e.g., Pio and Lopes, 1998). Some observing networks like IMPROVE use a composite of elements to deduce dust amounts (e.g., Hand et al., 2017). We do not choose to do this for two reasons: (1) at some sites, not all the elements are available, and (2) these elements are derived not only from desert dust but also from industrial sources. Note that model values come from the midpoint of the bottom level of the model (∼ 30 m), while the observations are usually taken at heights of 2 or 10 m. There are several sources of measurement differences between different networks, as well as between model and observations. Modeled values of PM content, which assume dry particles, are used here, while gravimetric measurements in some networks are equilibrated at 50 % relative humidity; thus, 5 %–25 % of the mass of measured PM can be water (Prank et al., 2016; Burgos et al., 2020). In addition, comparisons of coarse-mode composition at co-located sites in the US show that the inlet type can cause ∼ 30 % difference in measured mass (Hand et al., 2017). We include these differences in our error estimate in Sect. 3.2.
For the most part, we use model outputs for which there is a one-to-one relationship with what is being measured (BC, sulfate, etc.). However, for dust, this is not straightforward as dust is composed of multiple elements. Here, we use Al as a proxy for dust as it is relatively constant (∼ 7 %) in dust (as opposed to Ca, which varies highly, or Fe, which varies moderately) (Zhang et al., 2015). Al sources are primarily from dust (Mahowald et al., 2018). Assumptions about the model composition and how they are compared to observations are summarized in Table S1. For example, OM is assumed to be 1.8 times OC if OC measurements are available but not OM measurements. Different ratios of OM to OC appear in the literature, but 1.8 appears to be the best average for a mixture of aged and fresh plumes (Aiken et al., 2008; Font et al., 2024; Turpin and Lim, 2001).
Harmonizing models with different types of measurements is a critical and yet difficult task (Huang et al., 2021). Models operate with the geometric or aerodynamic particle diameter, whereas, in practice, the measurements are done with a variety of particle-equivalent diameters, e.g., optical, volume equivalent, projected-area equivalent, or aerodynamic diameter, depending on the instrument used (Hinds, 1999; Reid et al., 2003; Rodríguez et al., 2012). In the inlets of the samplers used for the mass measurements and collection of PM2.5 and PM10 particles for subsequent chemical analysis, a size cut-off such as at 2.5 and/or 10 µm is defined in terms of aerodynamic diameter (i.e., Stokes diameter (involving size and shape) weighed by the square root of the particle density; Hinds, 1999). The sharpness of the cut-off of such inlets influences the PM2.5 and PM10 mass concentration (Hand et al., 2019; Wilson et al., 2002). The PM10 size cut-off aerodynamic diameter is equivalent to the PM6.3 geometric diameter for spherical dust particles (Hinds, 1999; Rodríguez et al., 2012) and to PM6.9 in the case of dust elliptical particles (Huang et al., 2021). Similarly, for dust, PM2.5 (aerodynamic diameter) is equivalent to PM1.6 (geometric diameter). These differences are important to keep in mind, but the information is not available for all networks, and so we include the size cut-off as an uncertainty in the model–data comparisons as described in Sect. 3.2.
For ease of viewing the data from the densely sampled regions in this paper, as well as to compare model outputs to more representative spatial scales, observational records from different sites were combined into a mean within a grid cell that is 2 times the model resolution or approximately 2°×2°. This process averages the observations over a spatial scale appropriate for comparison with the chemistry model (Schutgens et al., 2016). We provide both the climatological annual average data at each site and the 2°×2° grid-averaged data (the modeled data can be found at the following DOI: https://doi.org/10.5281/zenodo.10459653, Mahowald et al., 2024). In this data set, the number of station data sets included in the average is included (stations), and the number of observations add up across all the station data sets included.
Notice that we include both urban regions and rural or remote sites in the same data set. Some of the original metadata did not include the resolution of the location to better than 0.1°, and so the coordinates of the locations provided here with the gridded data should not be used for finer-resolution studies. Because of the importance and size of megacities, which cross multiple grid boxes, as well as the difficulty in separating urban vs. rural sites, we include urban and rural air quality data in the same data set, and previous studies show the expected differences between urban and rural concentrations and trends (e.g., Hand et al., 2019).
Statistical comparisons across the globe and different regions are included in the tables in the Supplement. These include model and observational averages, Kendall correlation coefficients (rank correlations), linear regression slopes and uncertainties, and root mean squared differences. We also include the fraction of the model–data comparison which is outside the error bounds defined in Sect. 3.2. These results are included in the tables in the Supplement and are referred to in the text as is appropriate.
There are multiple sources of uncertainties in the observations used in the model–data comparisons of PM concentrations at the global model grid scale: errors in the measurements, differences in measurement methods, variability in aerosol concentrations during events versus background conditions, spatial variability within a model grid box, and interannual variability. To assess the size of these uncertainties, we look at the normalized standard deviation (defined as the standard deviation over the mean) in the observations due to these factors for a year, within a 2°×2° degree grid, and for interannual variability. To evaluate within-year and between-year variability, we focus on stations that have more than 10 years of data. To evaluate spatial variability within grid boxes, we use grid boxes that have more than 10 stations within them. Notice that these grid boxes are likely to lie close to cities and fossil fuel source regions because the measurement network is more dense there, perhaps exaggerating the importance of spatial variability. In addition, different measurement methods (dry vs. moist aerosol mass, different inlet geometries) complicate the comparison of data. Here, we assume a measurement method uncertainty of 30 %, which is on the high side of that used in previous studies (Prank et al., 2016; Burgos et al., 2020; Hand et al., 2017). Many of the measurements also include an assessment of their uncertainty or of the minimum detected limit: we use that to assess the average uncertainty of individual measurements (measurement errors).
2.4 Temporal aerosol variability
While the main goal of this study is to highlight and compile in one place the many surface concentration observational data sets available to compare against models, and while we focus on the climatological annual mean, the data sets also include temporal variability. Annual means, standard deviations, and the number of observations for each station for each year are included to allow for the analysis of interannual variability or trends. In addition, the climatological monthly mean, standard deviation, and number of observations are also available in order to assess the seasonal cycle. These values are all available in the Allobservvations.AEROMAP.nc file available at https://doi.org/10.5281/zenodo.10459653 (Mahowald et al., 2024).
To illustrate the included data, the trends in the PM2.5 and PM10 aerosols are calculated over 2000–2023 over eight different regions: North America, South America, Africa, Europe, Asia, and the high latitudes. Only data after 2000 are included because there are much more data after 2000 than prior to 2000 (see Sect. 3.1). All station data sets with more than 8 years of data are included in the calculation. In order to decrease the bias and uncertainty due to the large temporal and spatial variability (similarly to Hand et al., 2024), we divide the annual mean at each station by the climatological annual mean over the two time periods, and we average this with the other stations within the region. We then use a Theil regression which calculates the slopes excluding different data points and takes the median slope to reduce dependence on outliers (Hand et al., 2024). The median and the 33rd- and 66th-percentile slopes are calculated to show the median and 1σ uncertainties for each region.
The seasonal cycle of aerosols can provide important information about the source strength and variability, as well as the meteorological constraints (Gui et al., 2021; Rasch et al., 2000). To illustrate the value of the evaluation of the seasonal cycle in models, we calculate the climatological monthly mean in the observations and model and compare the correlation of these values, as well as the standard deviation of the 12-month means in the model versus the observations. This method allows us to separately evaluate the seasonal cycle from the spatial distribution. The correlation is only calculated at stations where the seasonal cycle is large enough: in math terms, our criteria is where the observed standard deviation across months is larger than half of the average observed within-month variability.
3.1 AERO-MAP observational data set
First, we assessed the amount of data and the number of station data sets within each gridded area (Fig. 1). The observational data set provides coverage predominately over North America and Europe for PM2.5 and PM10, as noted by previous studies (e.g., Szopa et al., 2021); however, in addition, we provide here a synthesis of more air quality data in other regions, especially Asia (Fig. 1). This compilation data set comprises most of the individual observations (at daily or longer time periods) of total PM2.5 (Fig. 1a, e: blue bars) and most of the observing stations (Fig. 1e and blue line). Approximately 15 000 stations and over 20 million observations are included in this compilation.
Notice that there are more individual observations by 2 to 3 orders of magnitude for the total mass (PM) of particles compared to information about the composition of particles (Fig. 1e), which is also shown also by contrasting the spatial distribution of measurements between PM2.5 and measured amounts of OM (Fig. 1a versus b), as well as by the large difference between the number of station data sets measuring the total mass versus the speciated aerosol particles like OM (Fig. 1c versus d). While this data set presents a huge increase in the amount of data available to the aerosol modeling community (for example, an 8-fold increase compared to the data sets included in Reddington et al., 2017), still, the dominant proportion of the total PM2.5 or PM10 data are clustered over a few industrialized land regions, and there is little composition information over most of the globe (Fig. 1).
3.2 Uncertainties in model–data comparisons
Our goal in this study was to identify observational data sets and to compile them into one easy-to-use data set for climate and air quality modelers. To do that, we collected all available data sets, prioritizing long-term stations with composition data; however, in regions with few measurements, we include only PM data or data collected during field campaigns, which may last for only 1 or 2 months. Previous studies have shown that even 1 d average aerosol measurements, carried out on cruises, can constrain aerosol concentrations within 1 order of magnitude (1σ) for phosphorus in dust, which varies spatially by 4 orders of magnitude (Mahowald et al., 2008). Other studies have highlighted that, even for particles that have highly variable sources, such as dust, only a few months of observations are enough to characterize the mean and standard deviation in most places across the globe (Smith et al., 2017). However, the latter study highlighted that, for places where dust events do not occur every year or in varying numbers, like near South America, several years are required to characterize the mean (Smith et al., 2017).
Uncertainties in the observation–model comparisons can include both uncertainties in the observations and interannual variability in both the model and the observations that are temporally averaged. Uncertainties used in the comparisons of aerosols at the global model grid scale come from multiple sources, e.g., errors in the measurements, differences in measurement methods, variability in aerosol concentrations during events versus background conditions, spatial variability within a model grid box, and interannual variability, as discussed in Sect. 2.3. To assess the size of the variability contribution to the uncertainties, we look at the normalized standard deviation (defined as the standard deviation over the mean) in the observations due to these factors for within a year and within a grid and for interannual variability. Nonetheless, our estimate of spatial variability will underestimate the true value in the absence of sufficient spatial coverage. In addition, different measurement methods (dry vs. moist aerosol mass, different inlet geometries) complicate the comparison of data (Sect. 2.3 discusses sources of uncertainties in more detail). We assume here a measurement method uncertainty of 30 %, which is on the high side of that used in previous studies (Prank et al., 2016; Burgos et al., 2020; Hand et al., 2017). Many of the measurements also include an assessment of their uncertainty: we use this to assess the average uncertainty of individual measurements due to measurement errors.
We focus on the uncertainties in the PM2.5 measurements first. The largest uncertainties are associated with within-year variability (0.53) (Fig. 1f; Table S3). This is because most of the aerosol mass can sometimes come with a few pollution events. Uncertainties due to combining different measurement methods (0.3) and from spatial variability within a model grid cell (0.24) are also important (Fig. 1g). Both interannual variability (0.18) and measurement errors (0.08) are smaller but important contributions to uncertainty. The importance of within-year variability (which is similar to within-month variability; see Table S4) is consistent with studies showing that, in most places, there are a few pollution events carrying much of the mass with, otherwise, much lower background concentrations (Luo et al., 2003; Fiore et al., 2022). Obviously, interannual variability is important for secular trends (Gupta et al., 2022; Watson-Parris et al., 2020; Mahowald et al, 2010), but, in this compilation, the interannual variability is much smaller than the 2–4 orders of magnitude of the spatial variability across the globe and thus can be neglected for understanding global spatial distributions (Fig. 1f).
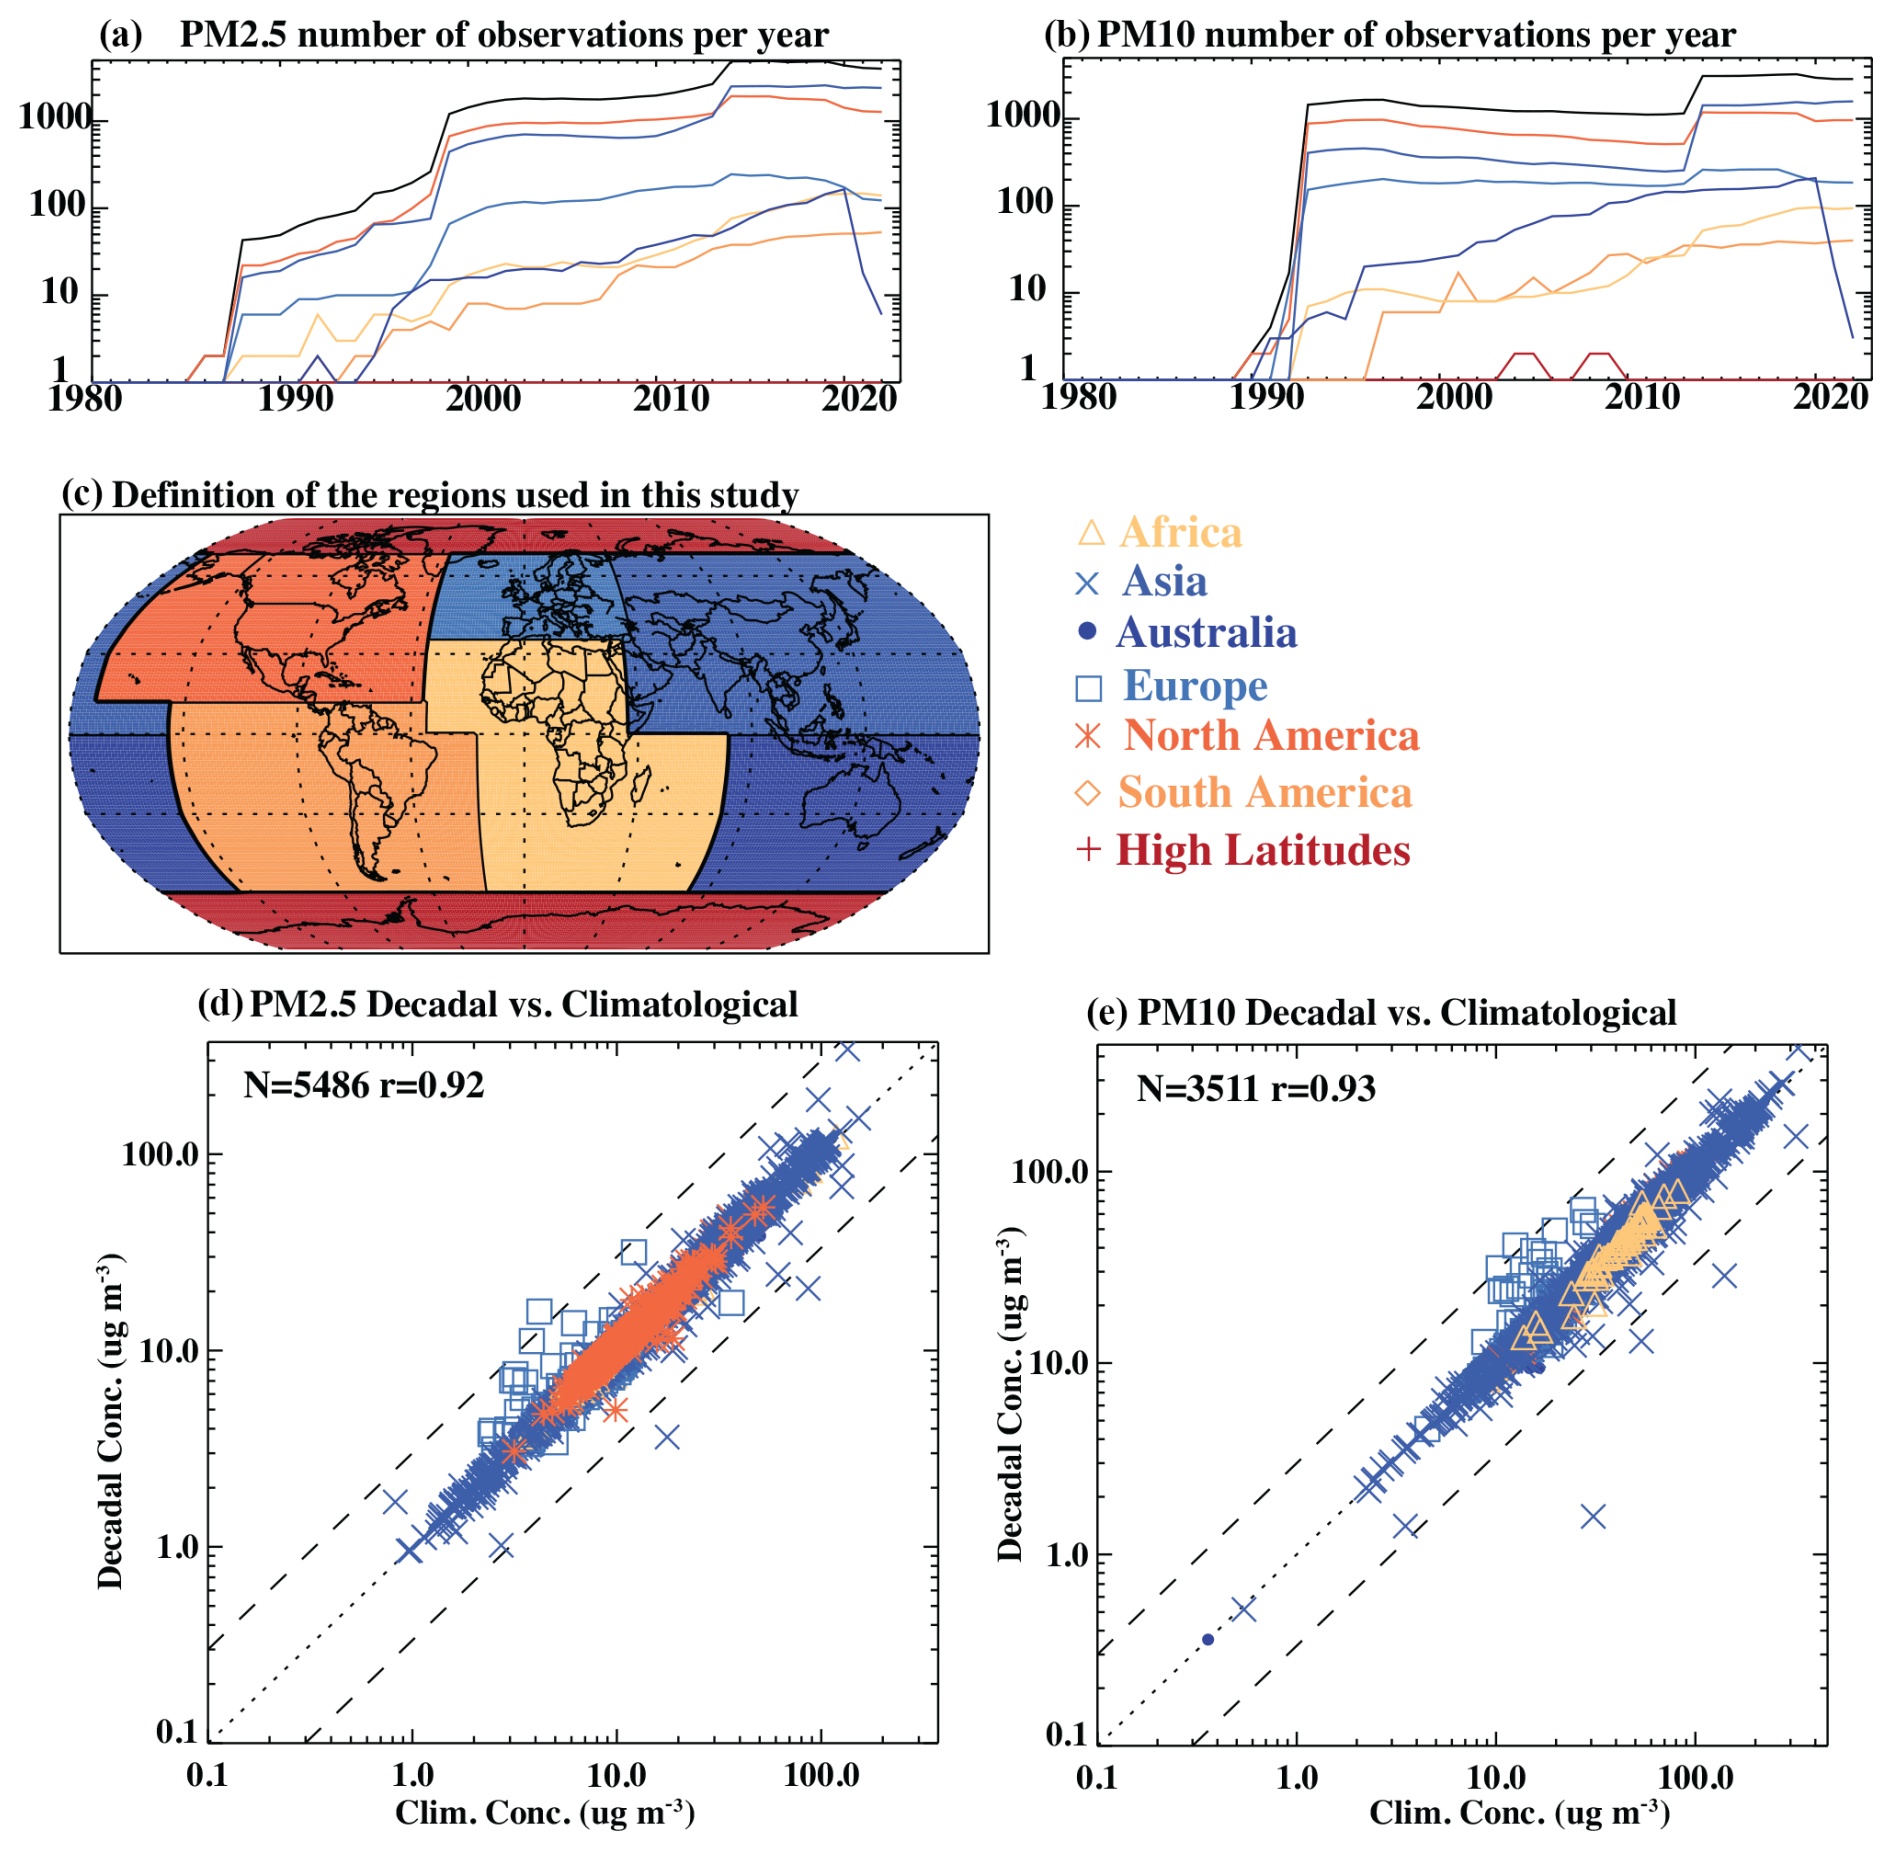
Figure 2The temporal change in the number of observations of PM2.5 (a) and PM10 (b) available in this study (black) and by region. Dark blue: Australia; blue: Asia; light blue: Europe; yellow: Africa; orange: South America; dark orange: North America; red: high latitudes. The regions are shown in (c) and are used throughout this study. Scatterplots compare the climatological mean versus the decadal (2010–2019) mean surface concentration for PM2.5 (d) and PM10 (e) using symbols which indicate the region of the data set point plotted.
These sources of uncertainty occur simultaneously, and, if we sum them assuming orthogonality, we obtain a normalized uncertainty of ∼ 0.68 (Table S3), which was interpreted as meaning that model–data comparisons within a factor or 3 should be considered to be adequate. To ease the visual evaluation of the comparison, we show in the following scatterplots both the 1:1 line and the range within a factor of 3. We discuss an example of uncertainties in more detail in Sect. 3.3. Notice that, if we use the same metric (normalized standard deviation) to evaluate the variability across the climatological concentrations measured in the observations at different locations (Fig. 3a) or across the grid averages in the model, we obtain 1.0 and 2.2, respectively, which are much larger than the uncertainties (0.6): there is much more variability across different grid boxes (4–5 orders of magnitude; see Fig. 2d) than across different years (up to 50 % normalized standard deviation; Fig. 2f). As expected, the model contains more spatial variability than the observations as the model reports concentrations in very high (North Africa) and very low (Antarctica) aerosol regions where we have no data, although, where we have data, the model simulates a similar range (Fig. 3a). For composition measurements, there is larger uncertainty in some individual species (e.g., BC and Al) than for PM. However, there are many fewer composition observations (Table S3). Since the statistics of the uncertainty calculations are likely to be more robust with the bulk PM measurements due to the fact that there are more data, by 1 order of magnitude, for the bulk PM data, we use the uncertainty estimate derived for PM for all of the composition data in this paper.
There is a time variation in how much data is available for both PM2.5 and PM10 data (Fig. 2a and b), with the most data being available between 2010 and 2020. Different regions have slightly different trends in terms of the amount of data (Fig. 2). For much of this paper, we will discuss global and regional comparisons, and the regions we focus on are Africa, Asia, Australia, Europe, North America, South America, and the high latitudes (Fig. 2c).
Trends in aerosols are an important scientific topic, although, for most of this paper, we use the climatological annual mean. What if there were strong trends in the aerosols? Would that lead to differences between our climatological means and what we expect for some decades? In order to assess this, we look at the individual annual means for each station with more than 8 years of data and see if the individual annual mean is ever outside of the 3× uncertainty calculated here. Out of the 13 320 station data sets for PM2.5 or PM10 which have more than 8 years of data, only 175 (1.3 %) have an annual average outside the uncertainty estimated here. Of those with a value outside the uncertainty, only 10 (<0.01 %) have a statistically significant trend. This suggests that, for the temporal interval we have chosen for the climatology, long-term trends are not a significant source of differences in the spatial climatological data set presented here. Nonetheless, we acknowledge that, in regions where aerosol emissions increase and then decrease over our multi-decadal observational records (e.g., China), our test for trends will not reveal where the climatology over the full period is less representative of individual decades. We also supply in the compiled data set a decadal mean for the time period of 2010–2019, which is made publicly available. A comparison of the climatological mean versus the decadal mean for the PM2.5 and PM10 concentrations shows that, for almost all locations, there is a small difference between the two values, and they lie on a one-to-one line (Fig. 2d and e; Table S4). There are a few station data sets (<5 %) which have a difference between the climatological mean and the decadal mean that is larger than 20 %, and very few (<0.05 %) have a difference which is larger than the uncertainties described in this section (factor of 3; Table S4). The biggest difference between the climatological and decadal average values is the number of station data sets and observations and, thus, the spatial coverage: we lose between 20 % and 100 % of the station data sets, depending on the size and composition, when we use the decadal means (Table S5). This is because, even though this is the most observed decade, still, some data sets are outside of this time period. In order to emphasize the spatial distribution of the data sets and because the climatological values are so similar to the decadal means, we will show just the climatological values in the next few sections, although both are available (Data set 1 in the Supplement; see also https://doi.org/10.5281/zenodo.10459653, Mahowald et al., 2024).
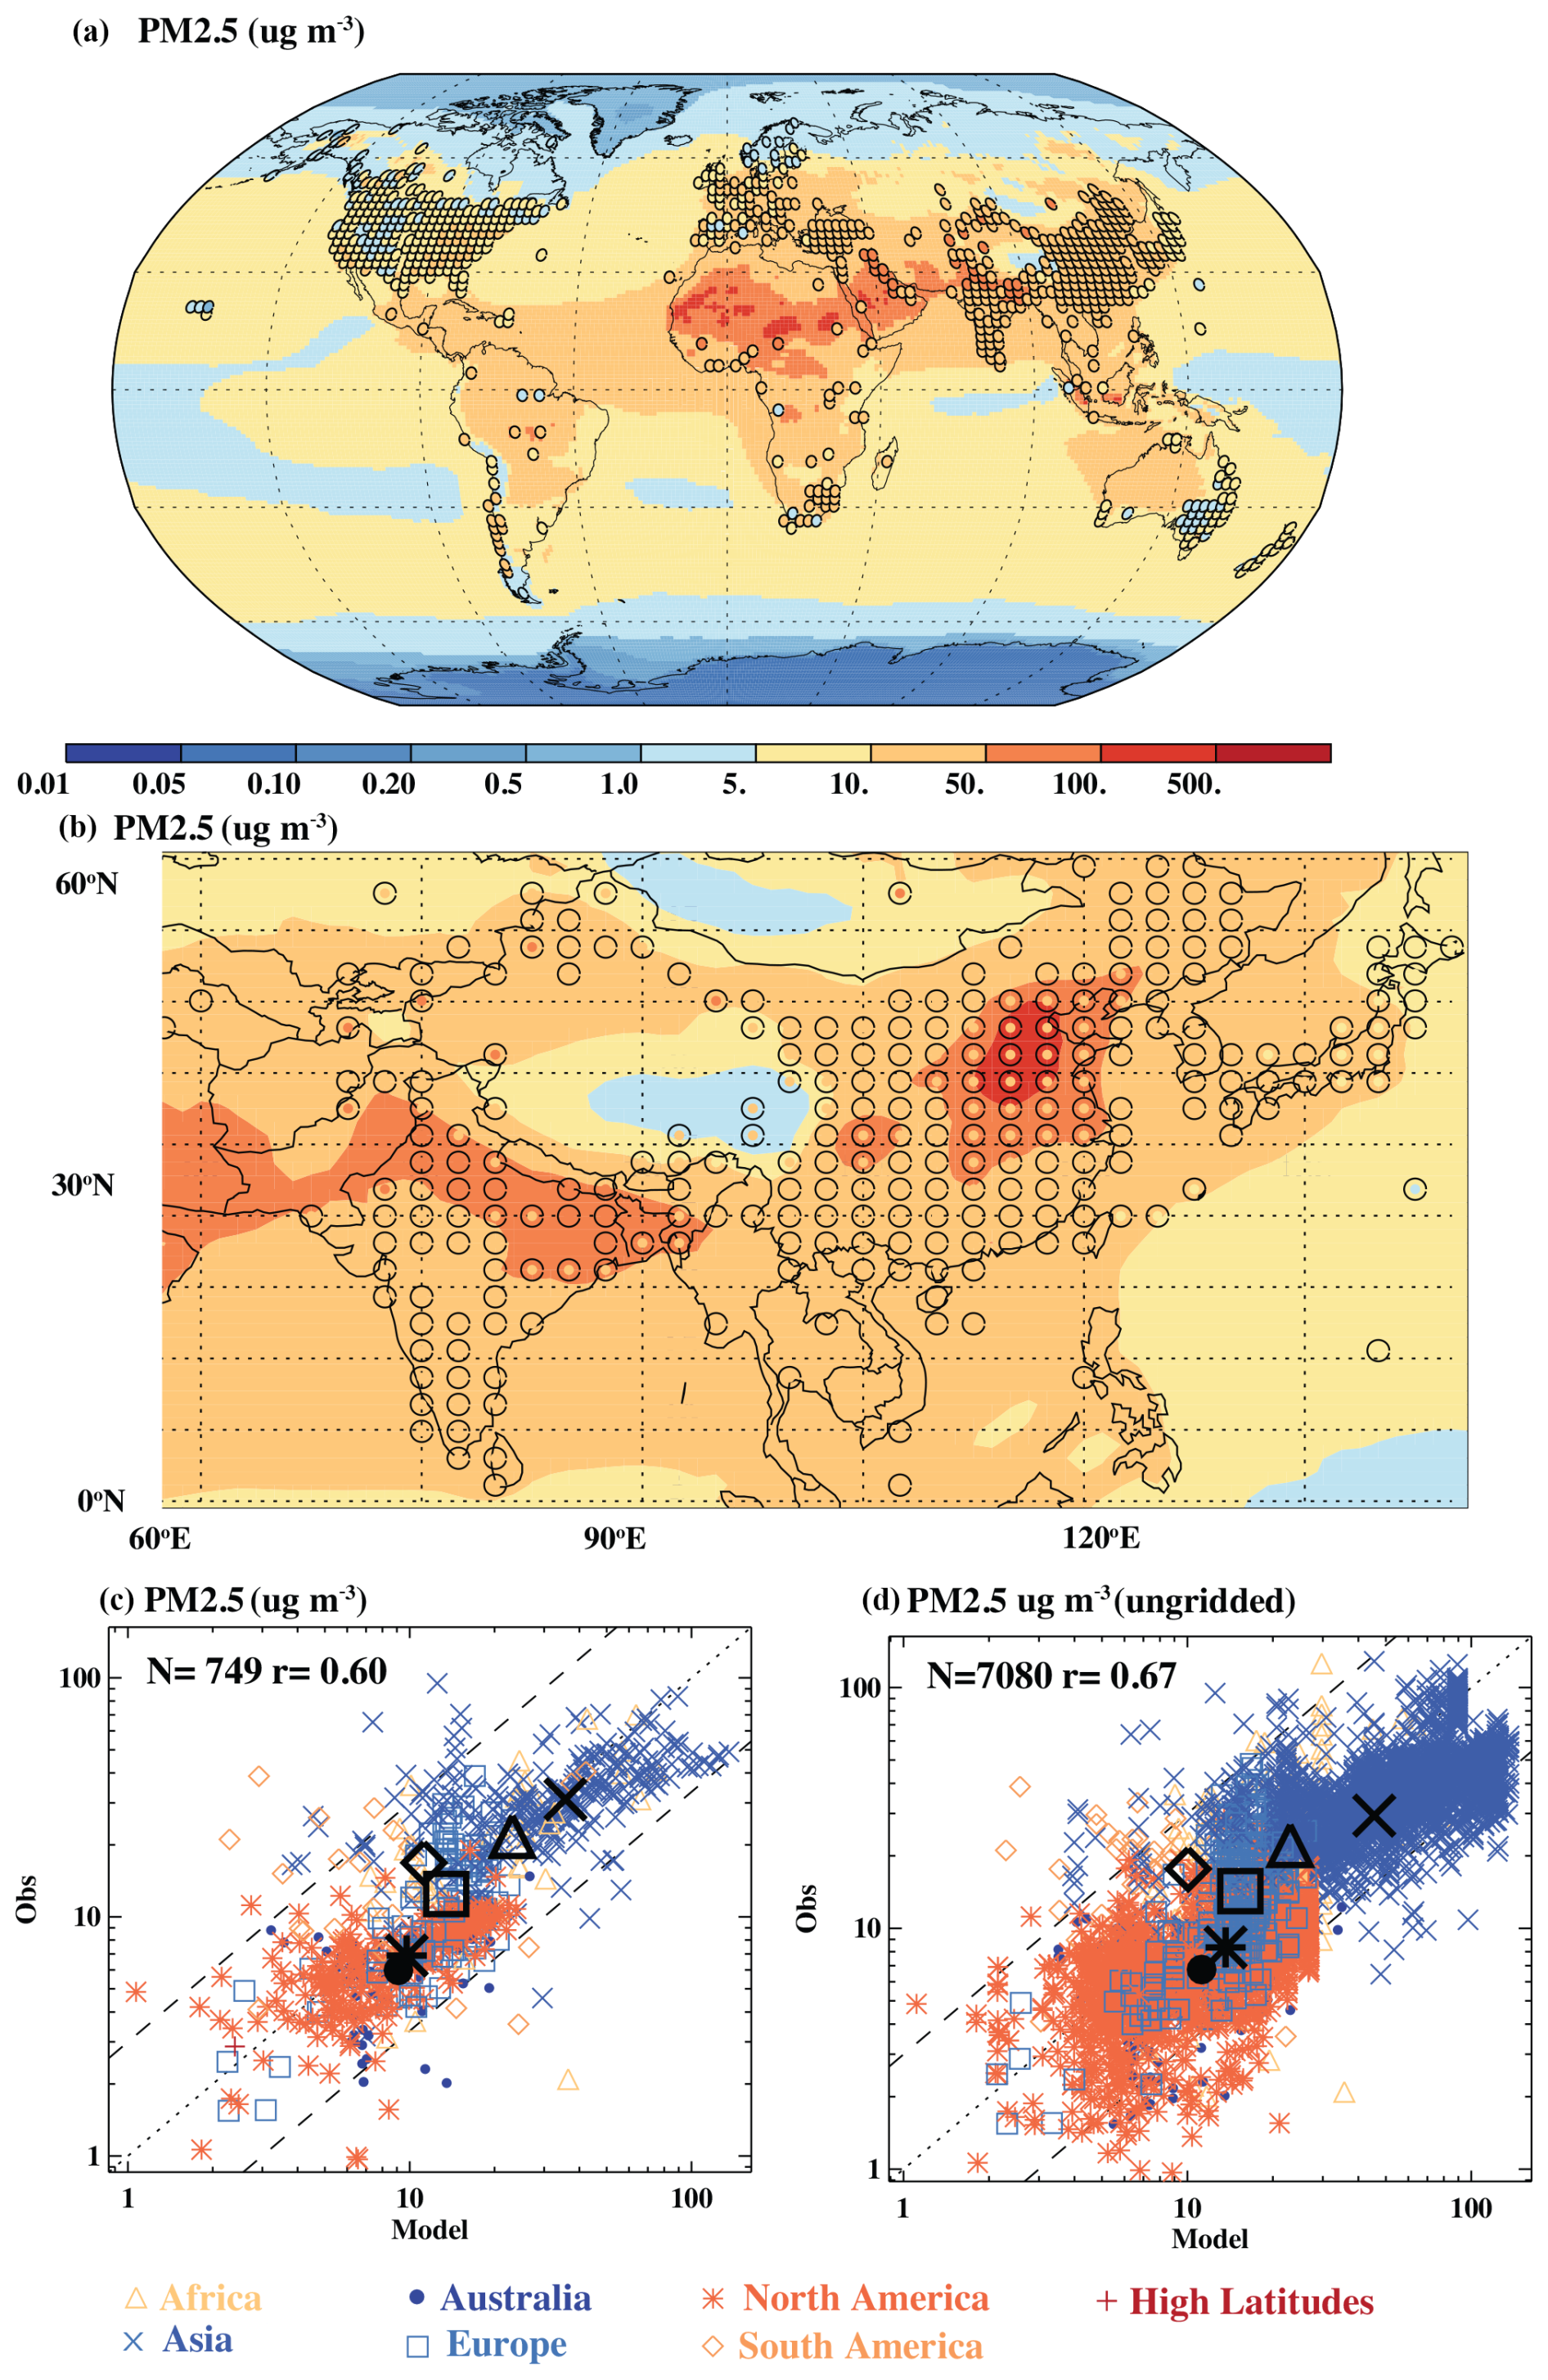
Figure 3Model results and gridded observations for PM2.5 in µg m−3: spatially mapped globally (a) and focused on only Asia (b); the model is plotted as the background, and the observations are circles, with the colors indicating the amount of PM2.5 using the same scale. A comparison of the model (x axis) to the observations (y axis) is shown for the gridded data (c) and including all stations (d). In the scatterplots, the colors and symbols indicate the regions, the bold black symbols are the average across each region (indicated by the symbol), the dotted line is the 1:1 line, and the dashed lines are the factor-of-3 uncertainty estimates. More statistics are shown in Table S7, and maps focused on different regions are available in Fig. S1 in the Supplement.
3.3 PM2.5 model–data comparison
Modeled concentrations of PM2.5 are compared against observations more often than for PM10 or other size fractions and comprise an important portion of the particulate matter associated with human activities. Therefore, we describe first the observational synthesis and comparison to model results for PM2.5. Because the high number of observations in some parts of the world would make the figures unreadable, the observations are gridded onto an approximately 2°×2° grid for comparisons with the model, although individual data points are still difficult to read (Fig. 3a). The maps illustrate where the observational comparison in the scatterplot is made, and focused maps of each major region are available in the Supplement (Fig. S1), along with global and regional statistics (Table S5). As expected, in the model, the highest concentrations are over the desert dust regions, such as North Africa, and over heavily industrialized regions in Asia. For the heavily industrialized regions in Asia, these high values are consistent with the observations, but the regions in North Africa with the highest modeled values do not have similar observational validation for high concentration values due to a lack of data (Fig. 3a).
Overall, the model is able to simulate much of the spatial variability in PM2.5 that is over 2 orders of magnitude (Fig. 3a and c); however, there is a tendency to overestimate the PM2.5 over India and China (Fig. 3b), although the mean over all the regions is within the factor-of-3 uncertainty (Fig. 3c, bold symbols). In addition, there are some observations (globally ∼ 6 %, Table S6) that are outside the factor-of-3 uncertainty estimates (Fig. 3c and d). The scatterplots show the comparisons of the model to the observations using the gridded data (Fig. 3c) and all original data (Fig. 3d), and the correlation coefficients are similar (0.60 vs. 0.67 in Fig. 3c and d, respectively). It is interesting that the correlation using the ungridded data (Fig. 3d) is slightly higher, perhaps because the model does better in regions with more data, although this is not a statistically significant result. The averages over different regions show that, on average, the model simulates the regions within the uncertainty (bold black symbols in Fig. 3d; Table S5).
As an example of the source of the uncertainties discussed in Sect. 3.2, we discuss the differences over India and China in the Asian region in more detail. It seems likely that at least some of these errors are due to an overestimation in the emission databases since satellite-based remote sensing has suggested that models overestimate SO2 over China (Luo et al., 2020). In addition, these discrepancies could be due to an error in the aerosol transport or chemical modeling, such as incorrect reaction rates or deposition rates, or, alternatively, could be due to differences in the time period: the observations are more recent, while the assumptions for the emissions are for the year 2010 (Quass et al., 2022). The comparison using the decadal averages (2010–2019) shows similar biases (Fig. S2), as expected, since the decadal averages are so similar to the climatological averages (Fig. 2d), which suggests that the time differences may not be the most important factor. In addition, notice that, once averaged over the 2°×2° grids, more observations are within a factor of 3, our uncertainty bound (contrast Fig. 3c and d). However, there could also be methodological and analytical differences relating to which group or network did the observations or the exact locations of the different monitors. Much of the data in those regions are not usually included in routinely used previous compilations of data (e.g., Reddington et al., 2017), and so the fact that previous model studies have not been able to assess emission data sets in these regions could also partially explain this discrepancy. Comparison between different observations in some cities (Fig. 4) shows that, in these grid boxes, there can be very large differences (∼ factor of 3) between the annually averaged values reported at nearby stations within 1° distance radially. Notice that the AirNow measurements (https://www.airnow.gov/international/us-embassies-and-consulates/, last access: 10 June 2022) tend to be higher than those reported from government air quality networks. The sites compared are in large cities and, thus, are likely to have strong local sources and intense gradients in pollutants. For now, we keep in mind this large difference but continue to use the observations. As indicated below, in these regions, we do not have measurements of composition, and so we do not know which constituents are poorly simulated in our emissions or transport modeling. More statistics describing the model data comparisons are shown in Table S5.
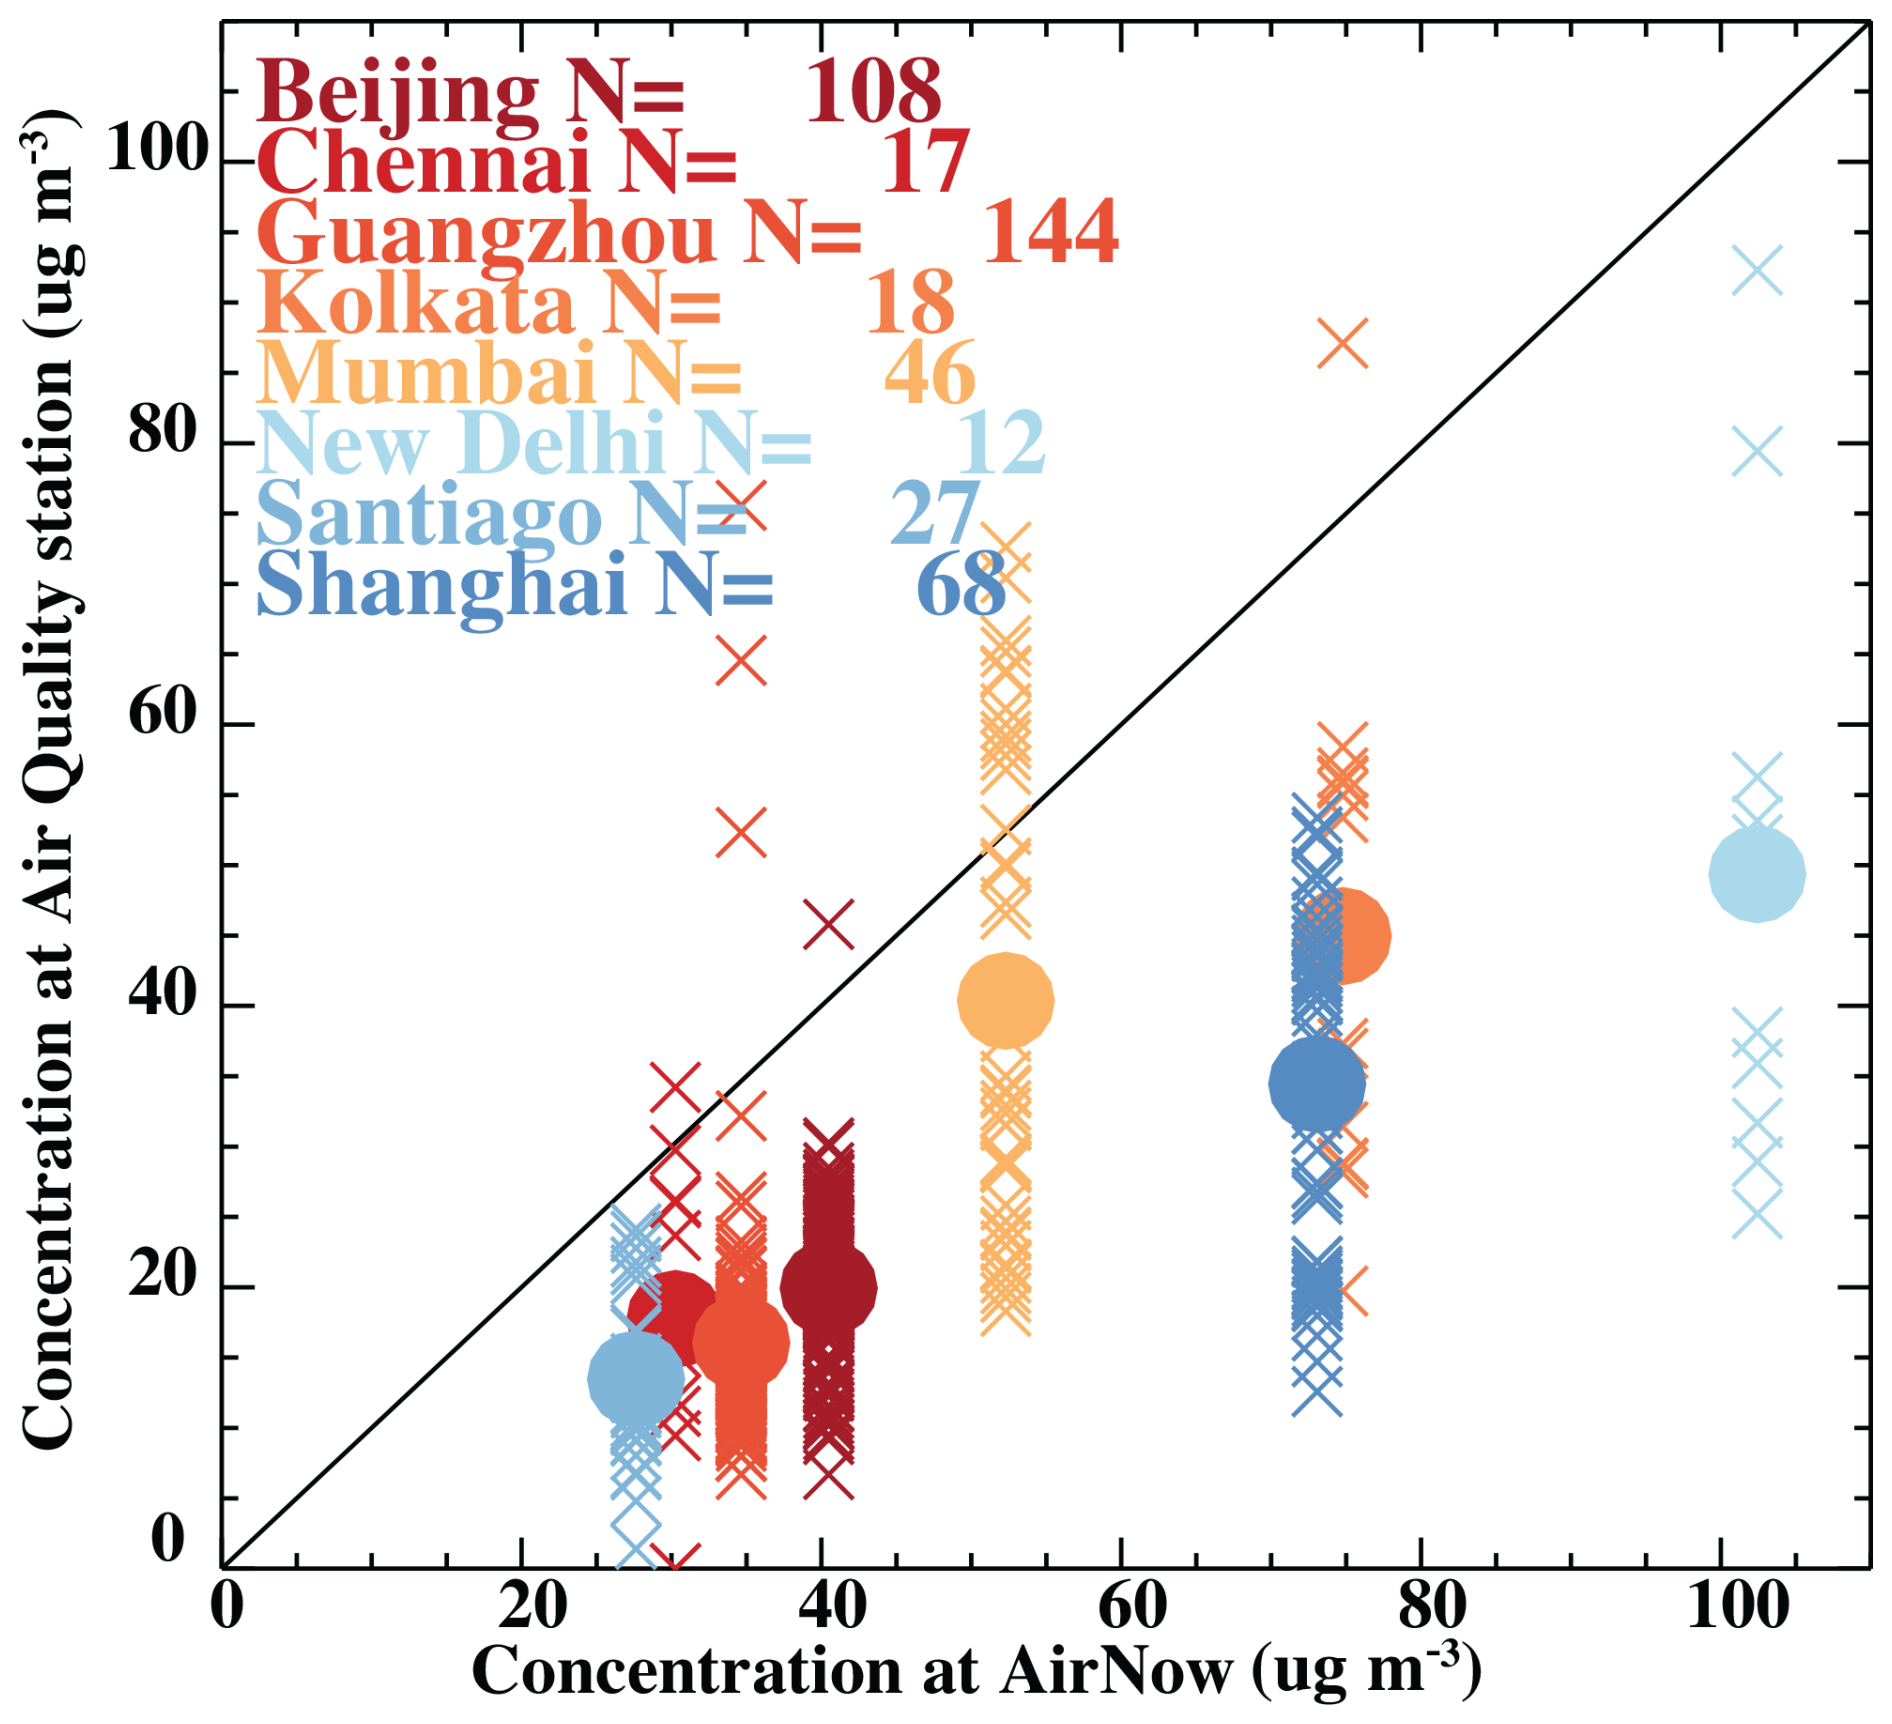
Figure 4Comparison of PM2.5 observations from the US Embassy's AirNow network (https://www.airnow.gov/international/us-embassies-and-consulates/, last access: 10 June 2022) versus observations from the Chinese air quality network (downloaded from https://quotsoft.net/air/, last access: 10 August 2022) (Beijing: 39.9° N, 116.4° E; Guangzhou: 23° N, 113° E; Shanghai: 31° N, 121° E); from the Indian network (https://app.cpcbccr.com/ccr/{#}/caaqm-dashboard-all/caaqm-landing/data, last access: 20 September 2022) (Chennai: 13° N, 80° E; Kolkata: 23° N, 88° E; New Delhi: 27° N, 77° E); and from Santiago, Chile (Barraza et al., 2017) (23.7° S, 70.4° W), from the Chilean air quality network (https://sinca.mma.gob.cl/index.php/, last access: 3 June 2022). The numbers after each city name are the number of stations found within 1° distance from the AirNow (or Chile observation) station.
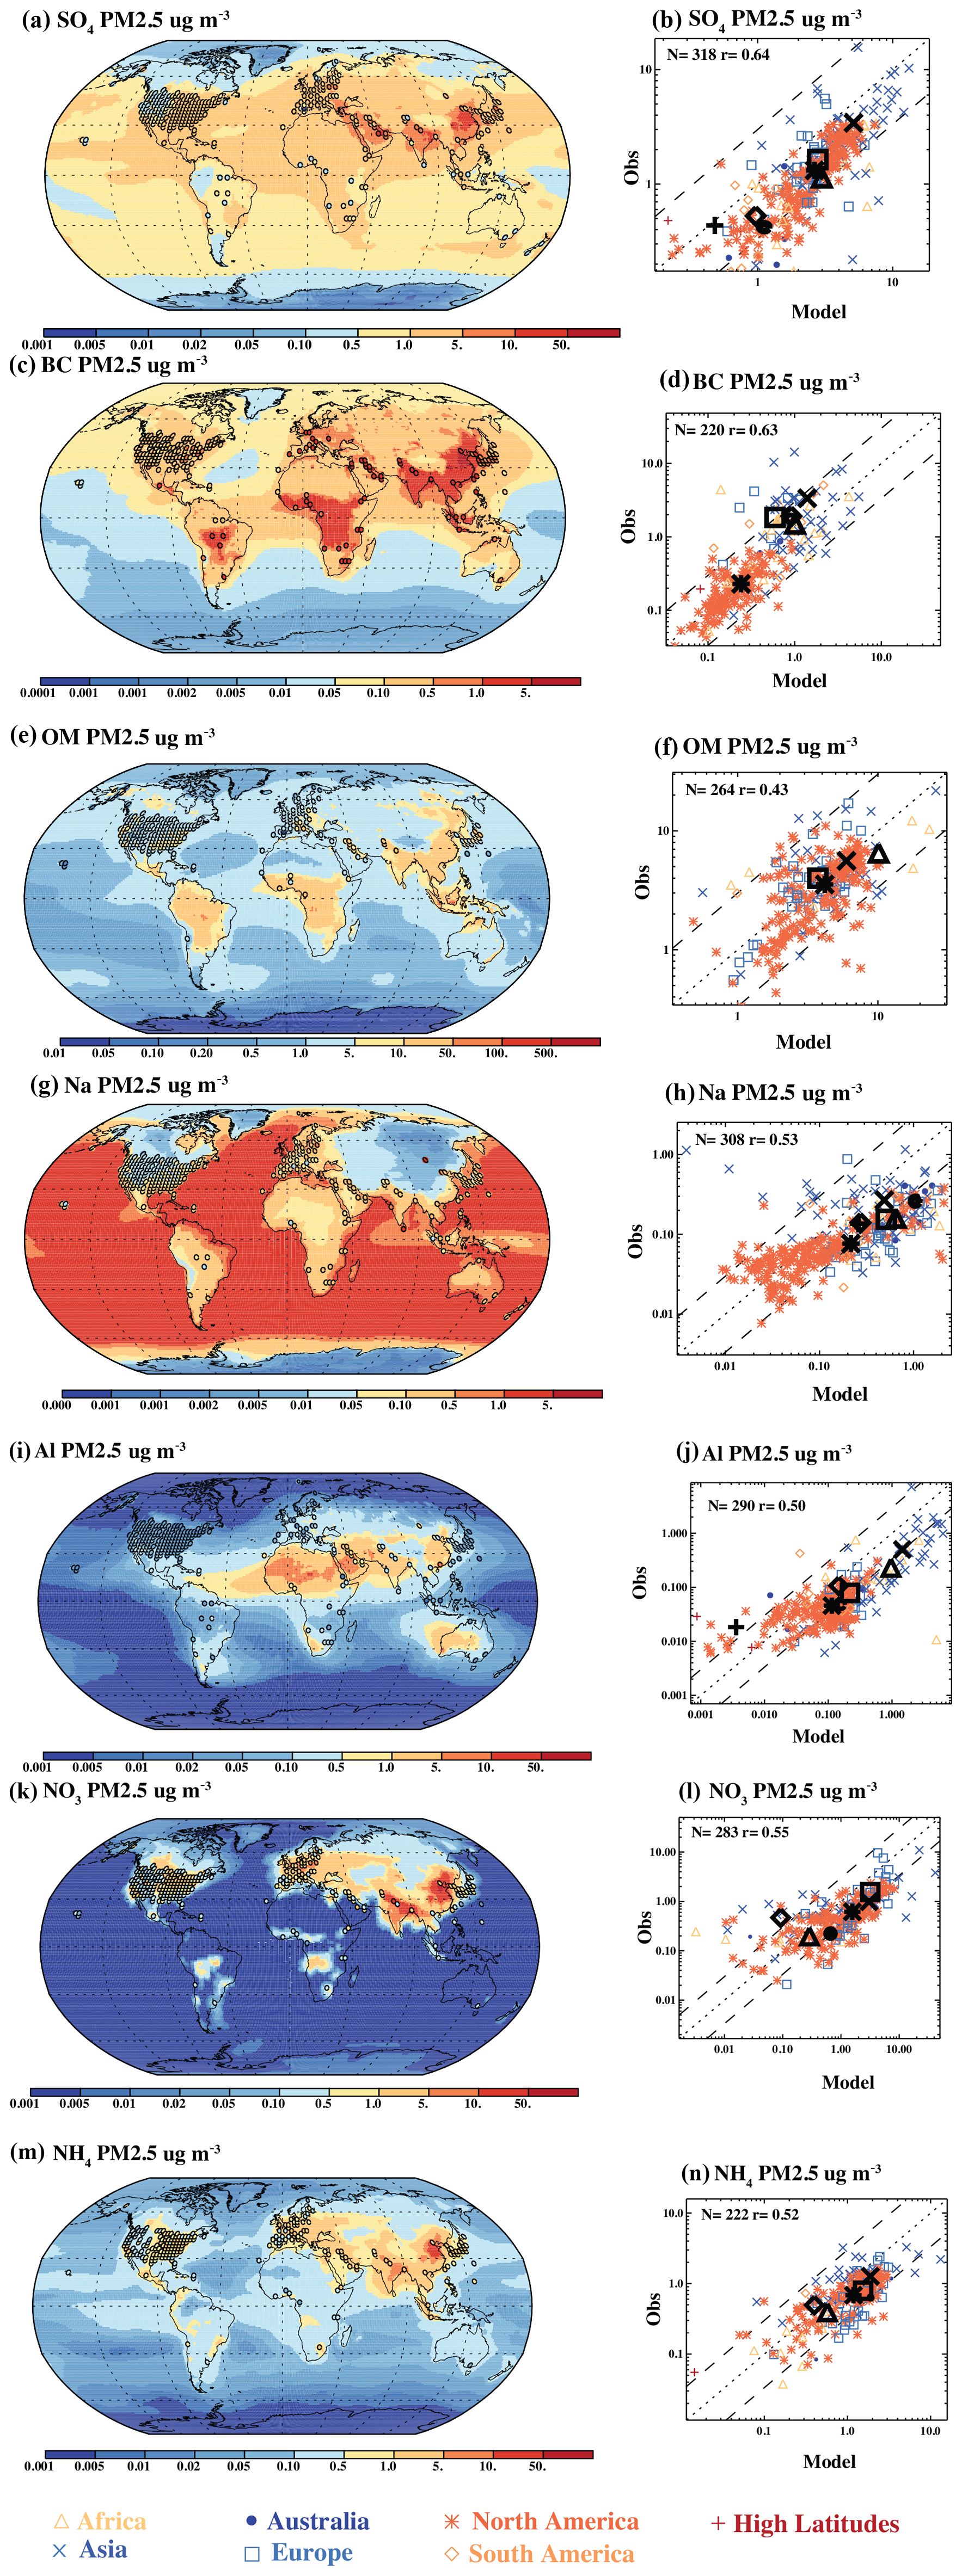
Figure 5Model results and gridded observations for different types of PM2.5 in µg m−3, spatially mapped globally, where the model is plotted as the background, and the observations are circles, with the colors indicating the amount of PM2.5 using the same scale for (a) SO, (c) BC (black carbon), (e) OM (organic material, equating to 1.8 times organic carbon (OC)), (g) Na, (i) Al, (k) NO, and (m) NH. A scatterplot comparison of the model (x axis) to the observations (y axis) is shown for the gridded observational data for (b) SO, (d) BC, (f) OM, (h) Na, (j) Al, (l) NO, and (n) NH. In the scatterplots, the colors and symbols indicate the regions, the bold black symbols are the average across each region (indicated by the symbol), the dotted line is the 1:1 line, and the dashed lines are the factor-of-3 uncertainty estimates. More statistics are shown in Table S5, and the maps focused on specific regions are available in Figs. S3–S9 for SO, BC, OM, Na, Al, NO, and NH, respectively.
Next, we consider the composition of the PM2.5 aerosol in the model versus the observations. The model simulates high and low values of sulfate, observed with a correlation coefficient of 0.64. Sulfate particle concentrations are on the high side in the model in several regions, more so in North America and Africa but less so for Europe and other regions (Figs. 5a and b; S3; Table S5), although all of the regional means are within the factor-of-3 uncertainty (bold symbols in Fig. 5b). Previous studies have compared SO aerosol observations to some model simulations and have not noted this bias (e.g., Barrie et al., 2001; Aas et al., 2019), but this bias was seen in this model and was attributed to the simple chemistry included in the model (Liu et al., 2012; Yang et al., 2018). About 18 % of the climatological mean model values are outside the factor-of-3 uncertainty, and a larger fraction is outside of the uncertainty for Africa, Australia, and South America, where there are less data (Table S5).
BC comparisons suggest that the model results are roughly able (r=0.63, within the factor-of-3 uncertainty) to capture the spatial dynamics of this aerosol across more than 2 orders of magnitude, although, in some regions, model values are on the low side (Europe and Asia) (Figs. 5c and d; S4; Table S5). This is similar to previous model intercomparisons (Koch et al., 2009; Bond et al., 2004, 2013; Liu et al., 2012, 2016). About 18 % of the model values are outside the uncertainty bounds, and many of these values come from Europe, where 36 % of the values are outside of the uncertainty bounds (Table S5). Simulations of OM in the default model (Fig. 5e) suggest that the model is within the uncertainty of most of the data, and the regional averages are close to the 1:1 line (Fig. 5f). Correctly modeling organic material is very difficult due to both the sparsity of data for comparison and the importance of both primary and secondary OM in PM (Heald et al., 2010; Kanakidou et al., 2005; Olson et al., 1997; Tsigaridis et al., 2014), and previous studies with this model have noted an overestimation in comparison with surface observations (Liu et al., 2012).
As a proxy for sea salts, we use the elemental data of the major component, Na, and we see the highest values over oceans and lower values over land, as expected and seen in the observations (Fig. 5g). Although most of the data are within the uncertainties (30 % are outside the uncertainties; Table S5), the model tends to be too high at low Na and too low at high Na in North America, where much of the data are available (Fig. 5g and h; also seen in the slopes in Table S5), which has been seen previously with this model (Liu et al., 2012). Notice that we do not include industrial emissions of Na, but the concentrations far inland include some Na, suggesting land-based natural or industrial sources. As a proxy for dust, we use Al amounts (Fig. 5i and j), which, globally and over dust regions, are dominated by dust, although there are few observational data sets in high-dust regions. The comparisons suggest the model is able to simulate dust (correlation coefficient of 0.5, Table S5) across 4 orders of magnitude, similarly to previous studies (Liu et al., 2012; Albani et al., 2014; Li et al., 2022; Huneeus et al., 2011), although there is a tendency towards a high bias in the models over low-dust regions and a low bias in high-dust regions, similarly to sea salts (Fig. 5i and j; also seen in the slopes in Table S5). One reason for this overestimate of PM2.5 aerosol mass for constituents like sea salt and dust, which are predominantly in the coarse mode, is that the coarse mode in this model has a wide enough standard deviation that it contributes significantly to the PM2.5 size fraction (Ke et al., 2022; Li et al., 2025). A better resolution of the coarse-mode aerosol may be required to better simulate these aerosols (Ke et al., 2022; Li et al., 2025).
Next, we consider the ammonium nitrate that requires complicated gas-phase–aerosol-phase equilibrium to be correctly simulated (e.g., Bauer et al., 2007; Thornhill et al., 2021; Adams et al., 2001; Regayre et al., 2018; Seinfeld and Pandis, 2006; Wolff, 1984). To summarize these complicated interactions, because SO is a stronger acid than NO in the atmosphere, the basic NH is preferentially found with SO. Thus, NO particles will only form if there is sufficient NH available. As described in the “Description of methods” section, to include these particles, we added the aerosol mass simulations from a different version of the same model which includes chemistry (Vira et al., 2022) and a more process-based source of ammonia (Vira et al., 2020) since the default CESM2 version used here does not include chemistry. Note that, even in the chemistry version of the model for CESM2, the complicated gas-phase–aerosol-phase thermodynamic equilibrium calculations are not included, which causes errors in the simulation of the amounts of nitrogen aerosols (e.g., Bauer et al., 2007; Thornhill et al., 2021; Adams et al., 2001; Regayre et al., 2018; Nenes et al., 2021). Thus, while the NH3 agricultural emission scheme used in this model is state of the art, the lack of an adequate gas-phase–aerosol-phase separation may lead to biases, as discussed in Vira et al. (2022). In addition, recent studies have suggested that emissions of NH4 from vehicles should be 1.8× higher than previously estimated (Toro et al., 2024), highlighting the difficulty of obtaining adequate emission data sets for nitrogenous aerosol precursors. NO particles compared against available observations show that, over 2 orders of magnitude, the model results are able to simulate the spatial variability (correlation coefficient =0.55), but the model tends to overestimate the observations by about a factor of 2 (except in South America), similarly to what was seen in Vira et al. (2022) (Fig. 5k and l, Table S5). The model surface concentration NO3 values are, with most of the data, within the uncertainties (Fig. 5k and l; 46 % are outside the uncertainty bounds in Table S6). The model and data distributions of NH show high values of NH over agricultural regions in particular (e.g., Vira et al., 2022), like the mid-western US or central Europe (Fig. 5m and n; correlation coefficient of 0.52). The NH in the simulation used here compares well to the available observations across the different regions, with the regional averages being close to the 1:1 line (Fig. 5n) and with most of the individual model–data comparisons being within the uncertainties at most observational sites (Fig. 5m and n; 16 % of the data are outside the uncertainty bounds in Table S5).
How would these comparisons change if we used the decadal 2010–2019 averages instead of the climatological averages of the observations? As expected from the similarity between the observations averaged over these two time periods (Sect. 3.2; Table S4), the results do not change substantially (>20 %) in most regions where there is a similar amount of data (Fig. S2a; Table S6). However, for some regions and composition data sets, there is much less data (>25 % less data), and, in those cases, there can be large differences between using the decadal averages versus the climatological averages (Table S6). This suggests that using the climatological averages for our comparisons for PM2.5 allows us to include more data and evaluate more regions without including much bias since interannual variability is a small source of uncertainty compared to other uncertainties (Table S4).
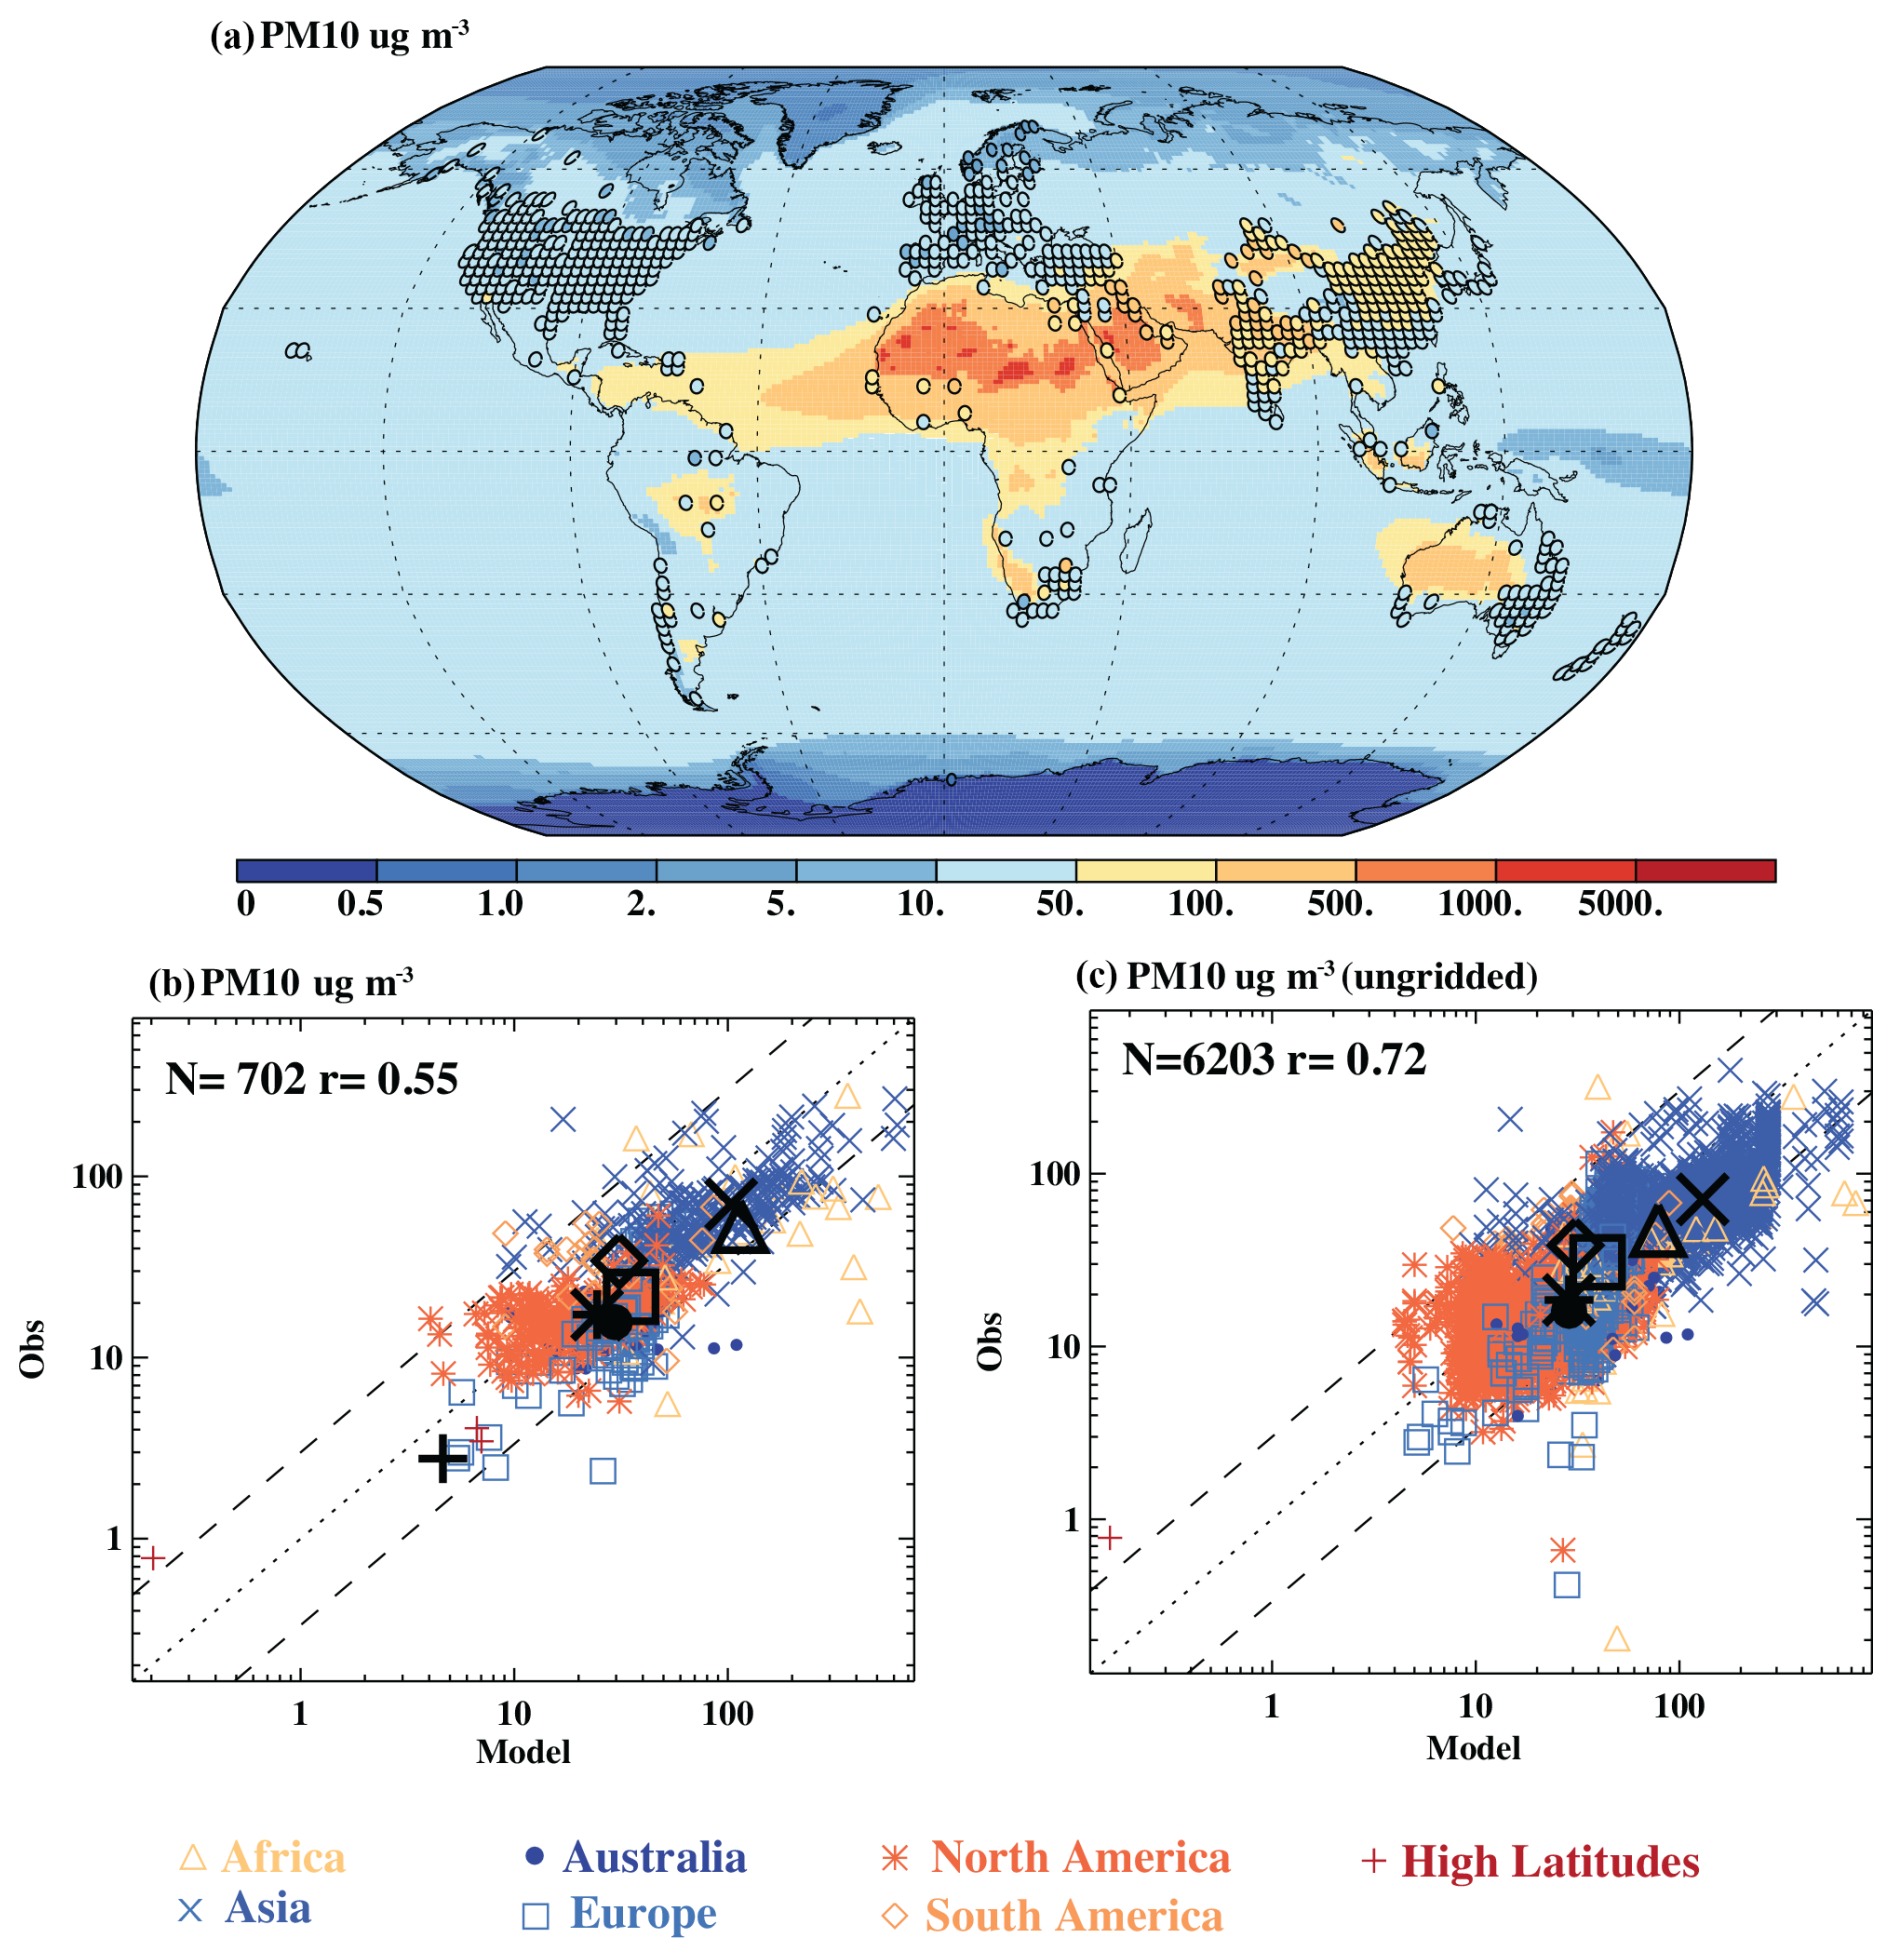
Figure 6Model results and gridded observations for PM10 in µg m−3, spatially mapped globally (a). A comparison of the model (x axis) to the observations (y axis) is shown for the gridded data (b) and including all stations (c). In the scatterplots, the colors and symbols indicate the regions, the bold black symbols are the average across each region (indicated by the symbol), the dotted line is the 1:1 line, and dashed lines are the factor-of-3 uncertainty estimates. More statistics are shown in Table S7, and maps focused on different regions are shown in Fig. S10.
3.4 PM10 model–data comparison
PM10 was the first size selective standard for particulate air quality until more studies showed that smaller particles (PM2.5 or PM1) were more relevant for health impacts, following which PM2.5 standards were added (e.g., https://www.epa.gov/pm-pollution/timeline-particulate-matter-pm-national-ambient-air-quality-standards-naaqs, last access: 4 October 2023). However, there are still many PM10 measurements being routinely made (Figs. 1d, 7a). The model is able to simulate PM10 concentrations across 2 orders of magnitude with some skill (correlation of 0.55; Figs. 7a and 6b) as most of the data are within the uncertainties (Fig. 5a, b, and c; 8 % of data are outside the uncertainty; see Table S7). Gridding the data before comparing to the model results in a slightly higher correlation across space with the inclusion of all data (0.55 vs. 0.72; Fig. 5b vs. c). More statistical comparisons are shown in Table S7. The regional averages are all within the uncertainty bounds for all regions.
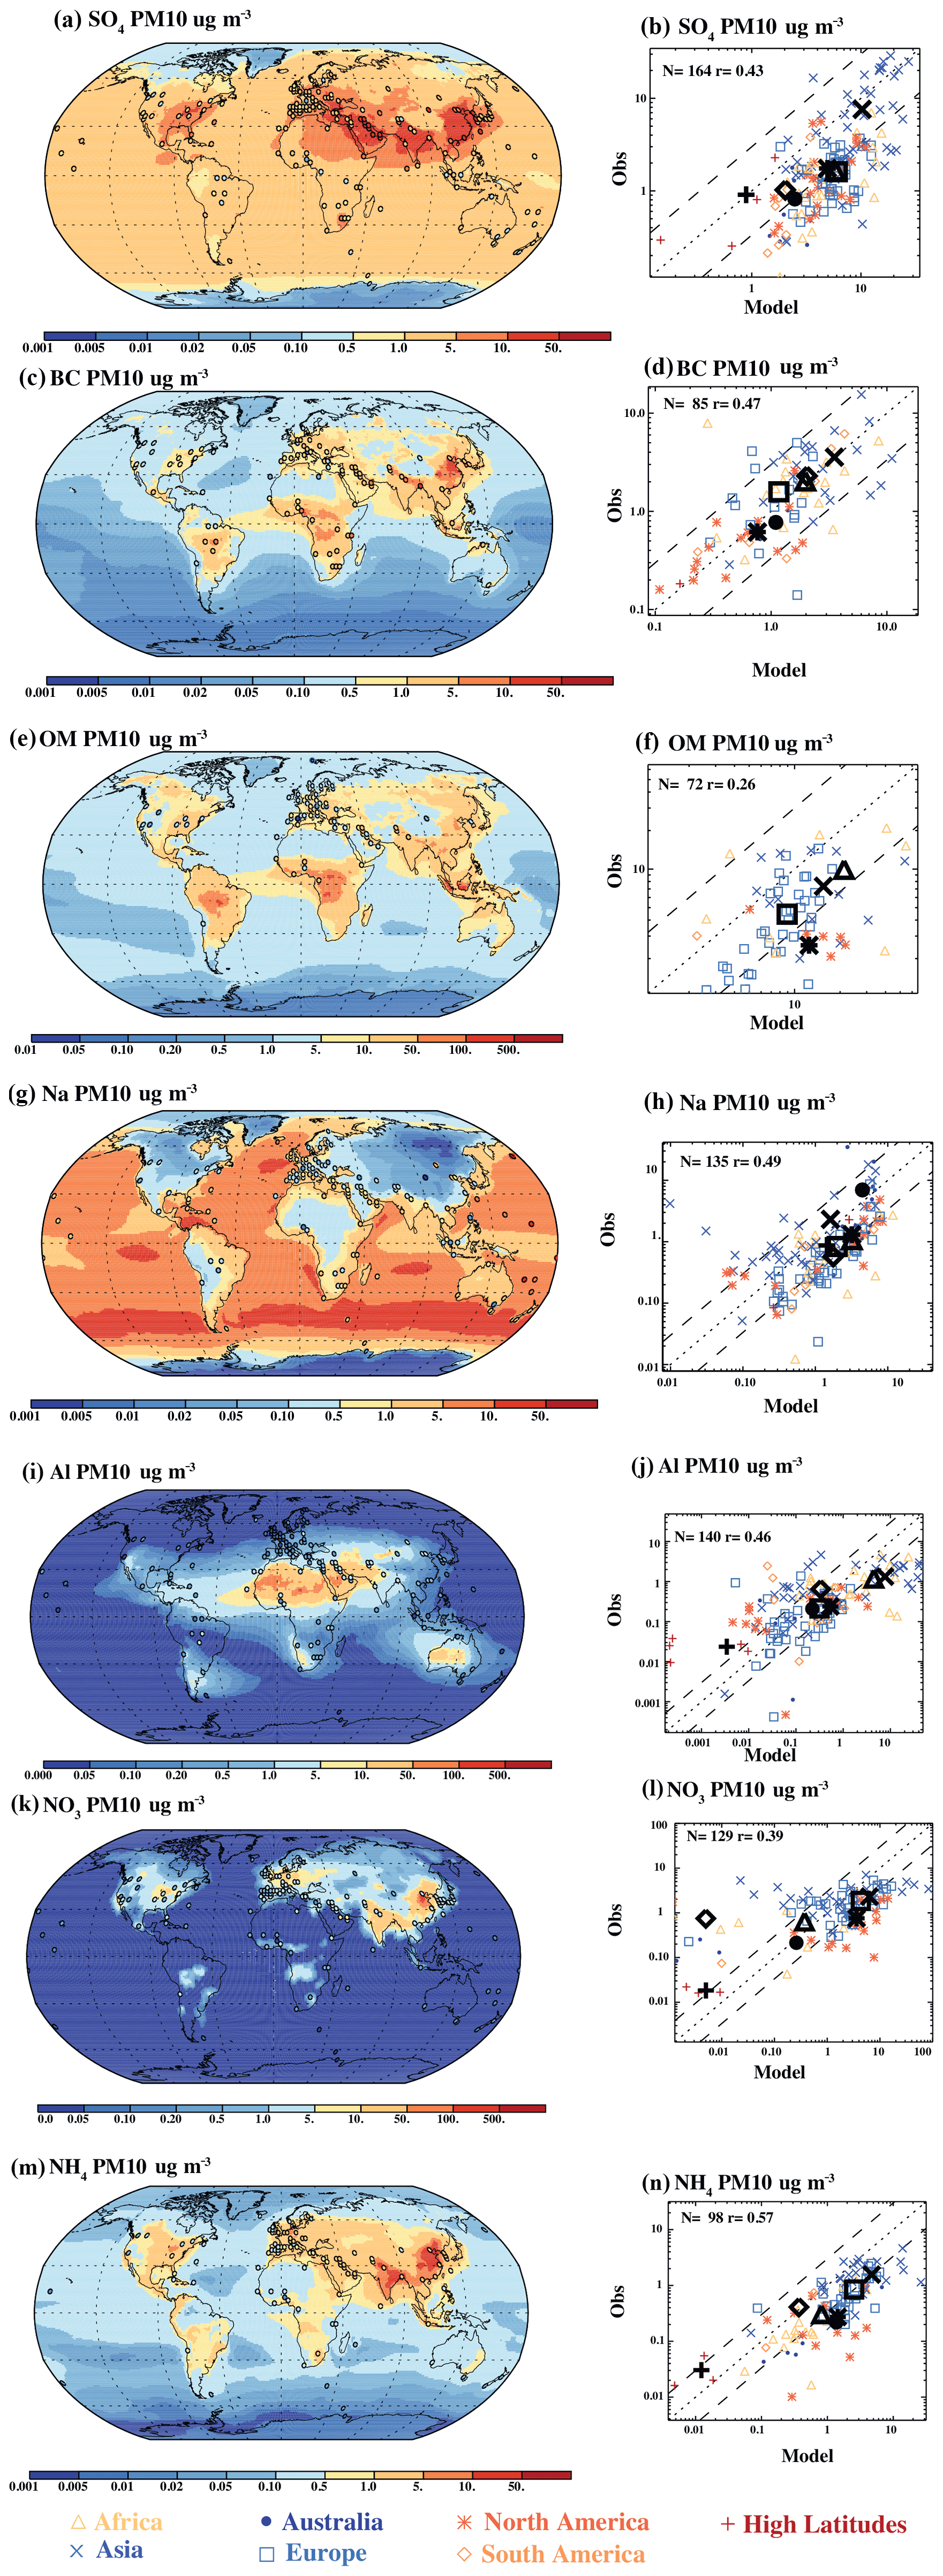
Figure 7Model results and gridded observations for different types of PM10 in µg m−3, spatially mapped globally, where the model is plotted as the background, and the observations are circles, with the colors indicating the amount of PM10 using the same scale for (a) SO, (c) BC (black carbon), (e) OM (organic material, equating to 1.8 times organic carbon (OC)), (g) Na, (i) Al, (k) NO, and (m) NH. A scatterplot comparison of the model (x axis) to the observations (y axis) is shown for the gridded observational data for (b) SO, (d) BC, (f) OM, (h) Na, (j) Al, (l) NO, and (n) NH. In the scatterplots, the colors and symbols indicate the regions, the bold black symbols are the average across each region (indicated by the symbol), the dotted line is the 1:1 line, and the dashed lines are the factor-of-3 uncertainty estimates. More statistics are shown in Table S7, and the maps focused on specific regions are available in Figs. S11–S17 for SO, BC, OM, Na, Al, NO, and NH, respectively.
There are fewer comparisons with PM10 composition data available in the literature: usually only sea salts and dust are compared to observations that include the coarse mode (Gong et al., 2003; Ginoux et al., 2001; Albani et al., 2014; Mahowald et al., 2006). Comparisons for SO suggest that the model can estimate the distribution of the high and low concentrations (correlation coefficient of 0.43) but tends to overpredict PM10 values across most regions (Africa, Australia, Europe, North America, and South America) as many observations are too high and are outside the uncertainty bounds (Fig. 7a and b; Table S7 indicates that 48 % of the model values are outside the uncertainty bounds). For BC, the PM10 simulation captures the range of values (correlation coefficient of 0.47), with most of the model results being within the uncertainty bounds of the observations across all the regions (Fig. 7c and d; 16 % outside the uncertainty bounds in Table S7). There is the suggestion in the observations that there may be some fraction of BC in the coarse model since there is more BC in PM10 than in PM2.5, but in the simulations used here, there is no mass in the coarse mode (compare Fig. 7c versus 5c). The model–data comparison simulations for OM suggest a good spatial distribution of OM (correlation coefficient of 0.43), and the modeled regional averages are similar to the observations. Again, the model currently does not simulate coarse-mode OM and does not include primary biogenics (Jaenicke, 2005; Mahowald et al., 2008), and, yet, it can match the observations. The limited Na (indicating sea salt) data suggest that the model can simulate the spatial distribution (correlation coefficient of 0.49) but tends to overestimate and has many observations outside the error bound (Fig. 7g and h; 50 % of the observations are outside the uncertainty bounds in Table S7), as was seen previously (Liu et al., 2012). Most of the regional averages, however, are just on the line of the uncertainty bounds (Fig. 7h). Comparisons with Al (used here as a proxy for dust) show that the spatial variability is correlated between the model and observations (correlation coefficient of 0.46), but the model overpredicts the concentrations in high-dust regions and underestimates them in low-dust region (Fig. 7i and j; 54 % of the observations are outside the uncertainty bounds in Table S7). The largest overestimates are in Asia and Africa (Fig. 7i and j). Dust models are compared against aerosol optical depth, deposition, and surface concentrations, and it is currently not possible to simulate all of these different types of measurements at the same time, consistently with previous studies with this model (Li et al., 2022; Kok et al., 2014b; Albani et al., 2014; Matsui and Mahowald, 2017; Zhao et al., 2022), and, indeed, across most dust models (Huneeus et al., 2011).
The model simulations of NO suggest too-high values in high-NO areas and too-low values in low-NO regions, especially in the limited data for the South American region (Fig. 7k and l; Table S7 shows that 69 % of the data are outside the uncertainty bounds). NH shows a slightly better comparison to the limited available data (Fig. 7m and n), as seen in Vira et al. (2022). As discussed earlier, the model does not include other forms of nitrate aerosols which may be important, such as the reaction of nitrate with dust aerosols (Wolff, 1984; Dentener et al., 1996; Xu and Penner, 2012).
If, instead, we compared to the decadal averages rather than the climatological averages, we would obtain similar results in many cases (Fig. 2b; Table S8), but being limited to decadal averages substantially reduces the number of observations available for comparison. The few regions which lose less than 25 % of the data sets when we temporally limit our comparison have similar statistics compared to the PM2.5 comparisons. Again, this suggests that using the climatological averages includes more regions in the comparisons without evidence to suggest that it increases bias because of the small amount of interannual variability in this data set (Sect. 3.2).
3.5 Temporal variability
This paper emphasizes the expanded spatial coverage in this compiled data set with the spatial comparisons in Sect. 3.2–3.5, but the data set also contains temporal variability as well. To illustrate the type of temporal data within this data set, we present briefly some common metrics. First, we consider what trends these data suggest in the surface concentrations for PM2.5 and PM10. Because most of these data come from after 2000 (Fig. 2a and b), we focus on the trends between 2000–2023. We also average by region in order to obtain a large-scale trend in surface concentrations (see details of methods in Sect. 2.5). Overall, the observations suggest that there is a statistically significant (1σ) decrease in aerosols over this time period of about 1 % yr−1 for PM2.5 in North America, South America, Africa, and Europe, but the changes over Asia and Australia are not statistically significant (Fig. 8a). These downward trends are similar to those seen in other studies including North America and Europe (Hand et al., 2024; Gui et al., 2021; Gupta et al., 2022; Mortier et al., 2020) and South America (Mortier et al., 2020), and the more ambivalent signals over Asia and Australia have also been seen (Gui et al., 2021; Gupta et al., 2020; Mortier et al., 2020). For PM10, there are different trends: North America and Europe have a statistically significant downward trend of about 1 % yr−1, while Asia has a larger downward trend of about 3 % yr−1, but the error bar overlaps the 0 line for the South American, African, and Australian regions, indicating that those regions do not have statistically significant downward trends. There are no other studies we know of that looked at trends in PM10 specifically. Note that we do not compare against the model results here as our example model simulation does not include emission trends, but these data sets include each station's annual average so that more detailed comparisons could be conducted. In addition, apparently, these trends do occur for a long enough time to cause a large bias in the climatology (Sect. 3.2).
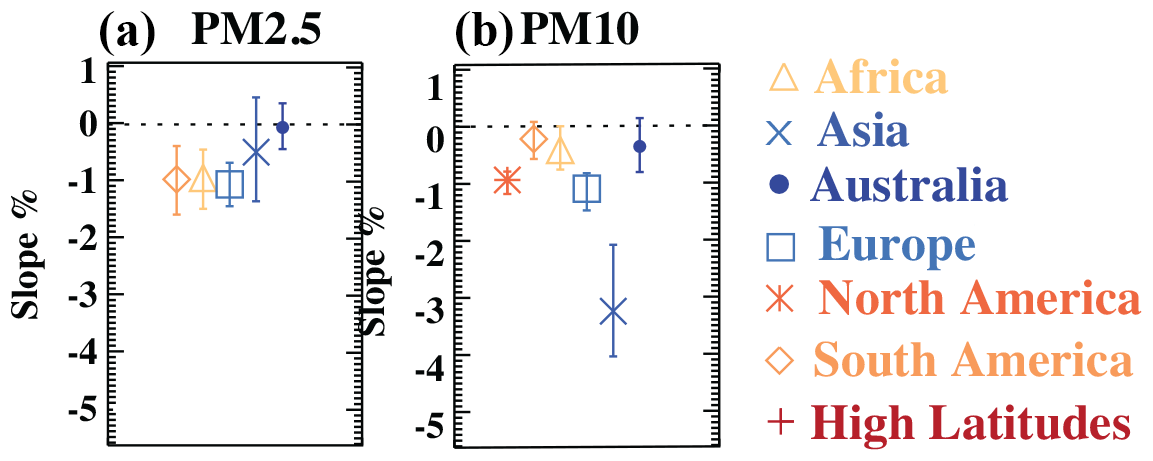
Figure 8Trends in the observations of aerosols in different regions during the 1980–2000 and 2000–2024 time periods for PM2.5 (a) and PM10 (b). Error bars indicate the 1σ uncertainty using a Theil regression approach.
Next, we use the climatological monthly mean data for PM2.5 and PM10 and compare against the model to see how well the models simulate the seasonal cycle. There are many ways to evaluate the seasonality in the literature (Gleckler et al., 2008; Henriksson et al., 2011; Huneeus et al., 2011; Rasch et al., 2000). We chose one way here, but this data set could be used in other ways as well. The models can simulate the timing of the seasonal cycle well across most regions, as seen in correlations between the climatological monthly mean in the model and observations (Fig. 9a and b), but there are several regions where the model does not capture the timing of the seasonal cycle (e.g., northern India, Türkiye, New Zealand). The spatial distribution of the size of the seasonal cycle (defined here as the standard deviation in the climatological monthly mean) is less well simulated than the annual mean (contrast Fig. 8d with Fig. 3c and Fig. 8f with Fig. 6c: the correlation coefficients are smaller, and there is more spread in the comparisons with the scatterplot). Examining whether this is a model-specific result or one that occurs more generally in the models would help discriminate between errors in the input emission data sets and meteorological errors in the model (e.g., Huneeus et al., 2011).
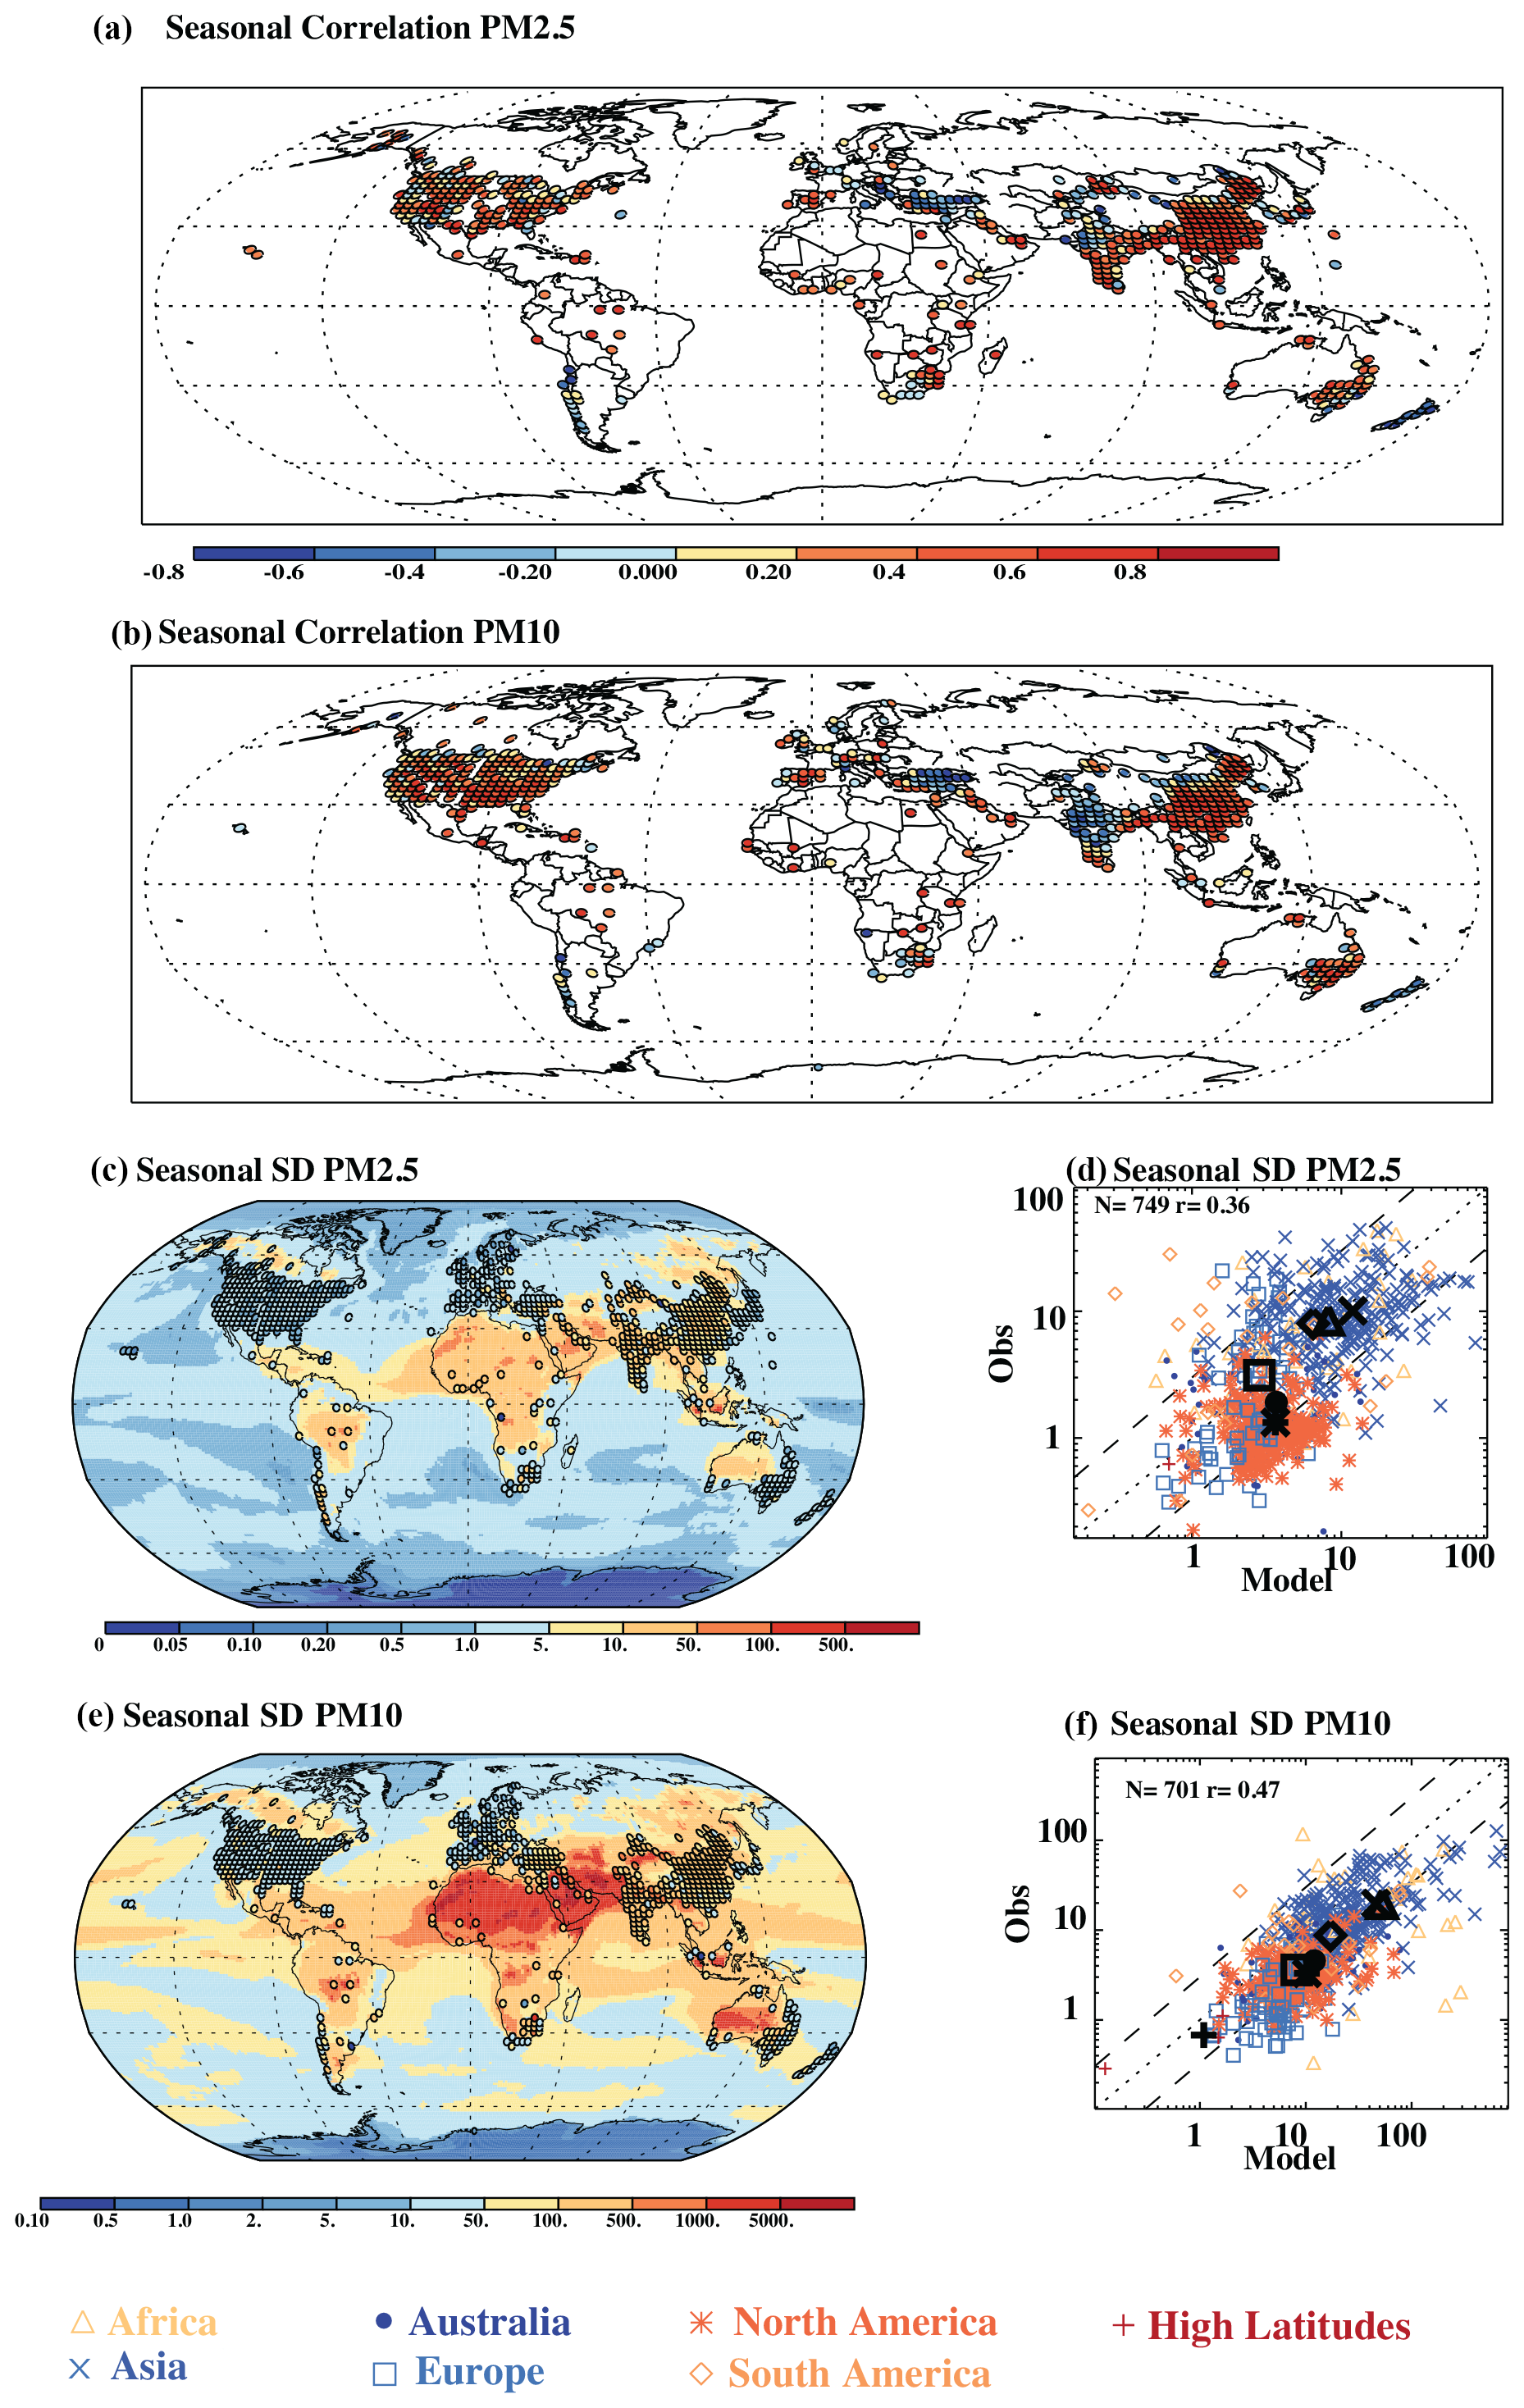
Figure 9Model data comparison for the seasonal cycle. The correlation coefficient between the 12 climatological monthly means in the observations and the model for those station data sets with a larger seasonal cycle than within-monthly variability (see Sect. 2.5 for more details) averaged to a 2°×2° grid for plotting for PM2.5 (a) and PM10 (b). A spatial comparison of the magnitude of the seasonal cycle in the observations versus the model (defined as the standard deviation of the 12 climatological monthly means) for (c) PM2.5 and (e) PM10 and a scatterplot for PM2.5 (d) and PM10 (f). The correlation coefficient is only calculated in locations where the standard deviation from the seasonal cycle is stronger than the within-month variability (see Sect. 2.5 for details).
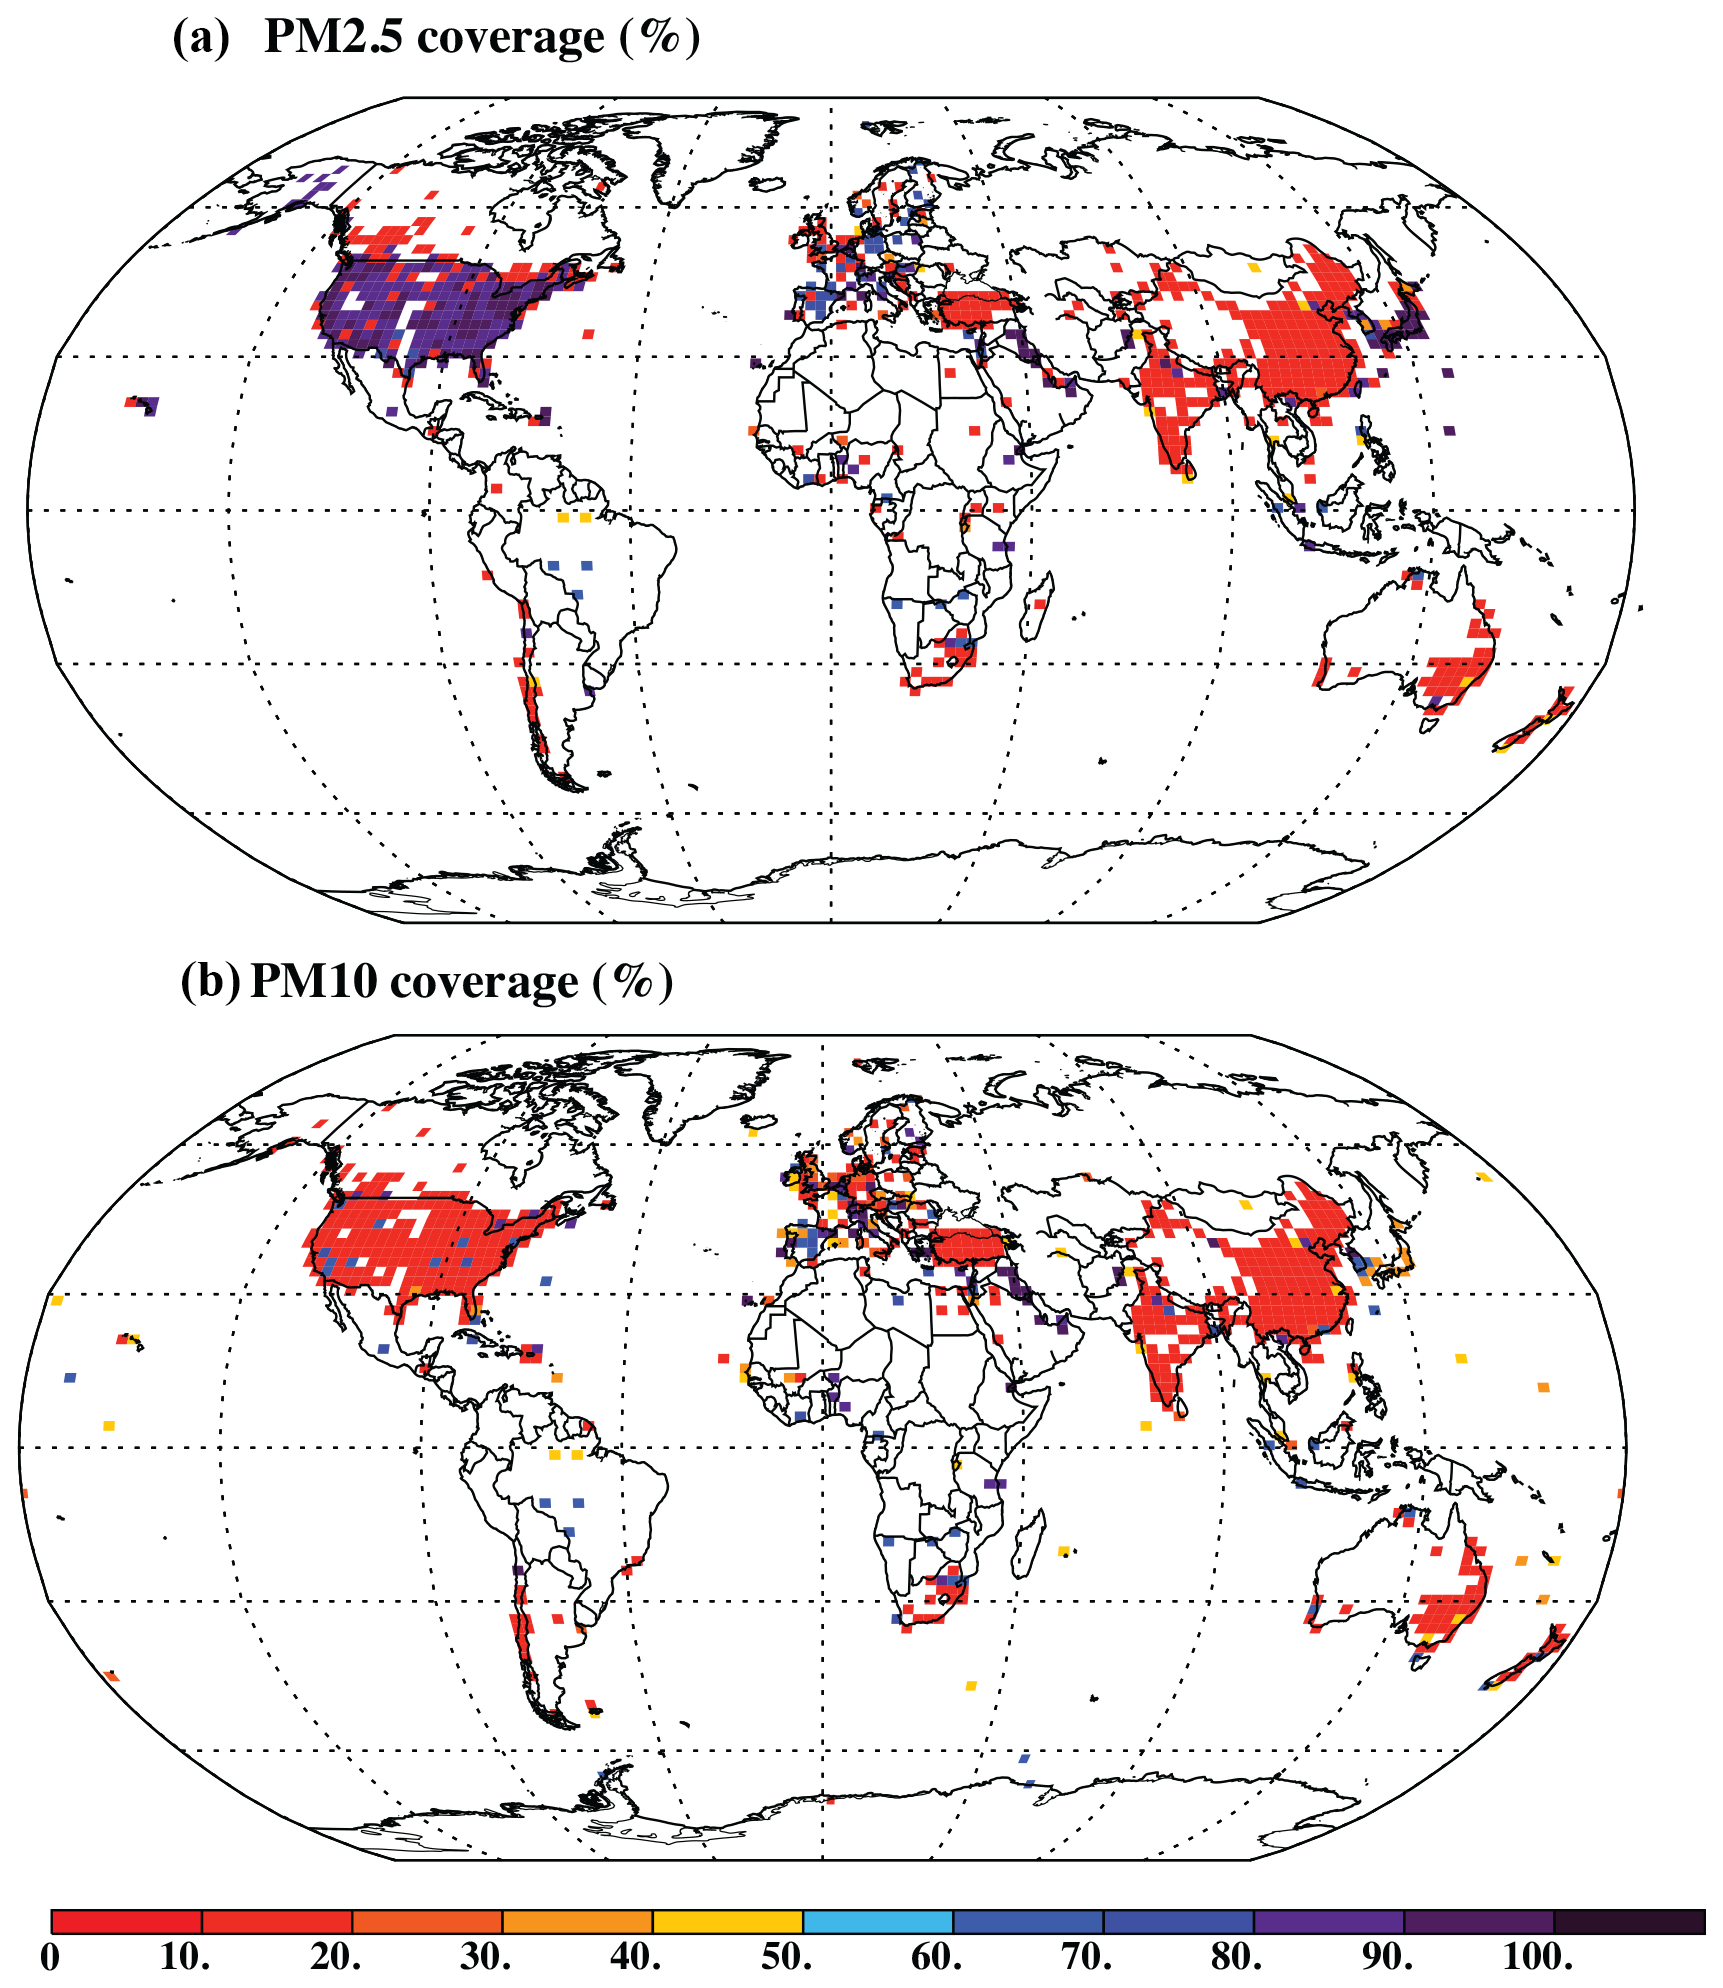
Figure 10Observational coverage (%) for gridded observations, showing within each grid box (2°×2°) the percentage of the constituents that are measured assuming that PM, SO, BC, OM, Na, Al, NO, and NH are required to constrain the PM distribution for (a) PM2.5 and (b) PM10.
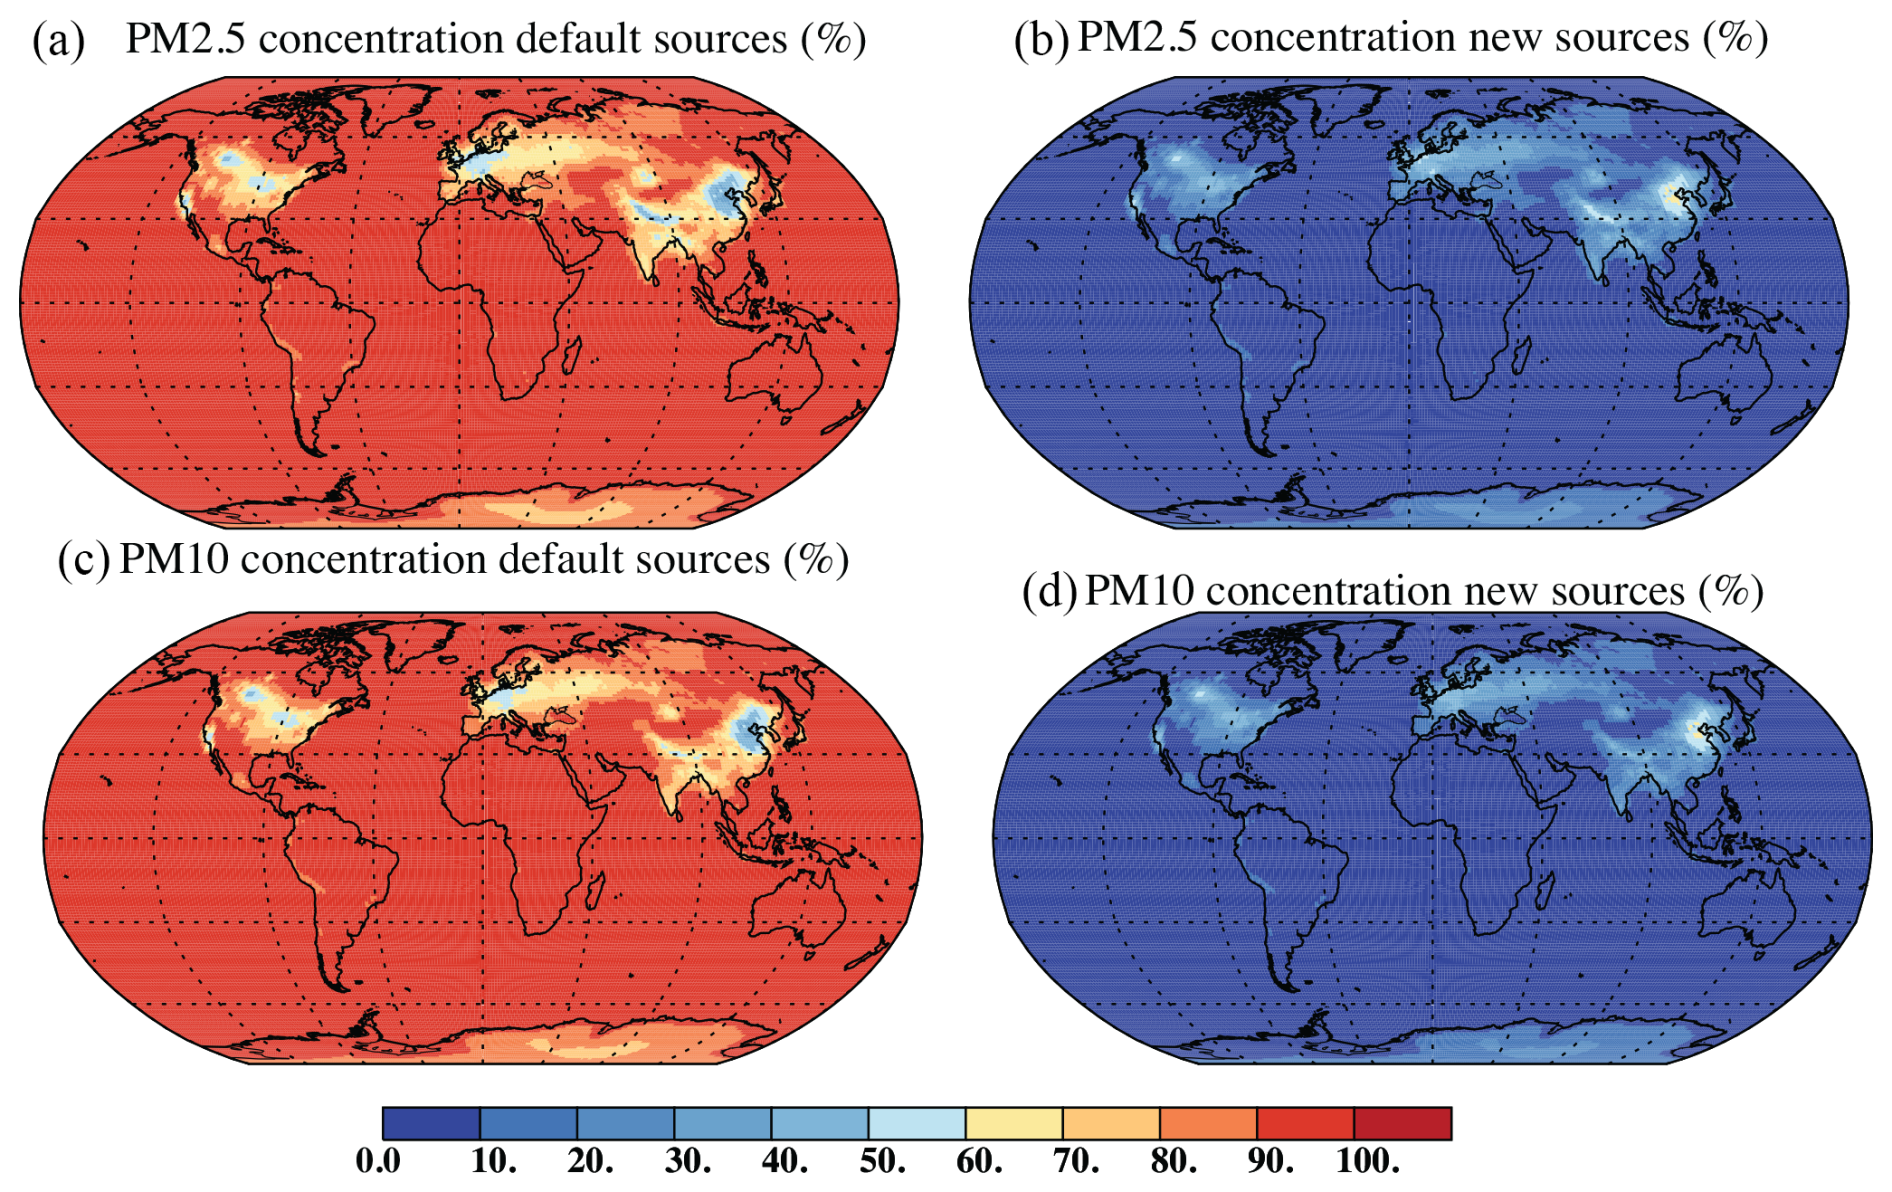
Figure 11Modeled estimates of what percentage of the surface concentration of PM2.5 is considered in the default CAM6 climate model (a) or is new in this study (b). Similarly PM10 is shown for the default model (c) and new sources in this study (d). The new sources added in this study are the nitrogen oxides as described in Sect. 2.3.
3.6 Data and model coverage
The compilation shown here is the most comprehensive one currently available for describing the spatial variability of the total mass and composition of in situ particulate surface concentration data, and yet it highlights the lack of sufficient data to constrain the current global distribution of particles and their composition (Fig. 10a and b). Only 3 % of the grid boxes (2°×2°) have PM2.5 data (about 10 % of land grid boxes), and only 0.3 % have sufficient data to constrain most of the composition (defined as having 90 % of the variables considered here: total mass, SO, BC, OM, Na or Cl, Al or dust, NO, and NH. There are even less data available to characterize PM10 (Fig. 10b), which is less important for air quality and aerosol–cloud interactions but more important for aerosol–biogeochemistry interactions and longwave interactions (Mahowald et al., 2011; Li et al., 2022; Lim et al., 2012; Kanakidou et al., 2018). Because of the high spatial and temporal variability of coarse aerosols and the lack of satellite or other remote sensing data to characterize coarse sizes, this lack of data is a severe handicap in constraining aerosol radiative forcing, its uncertainties, and other impacts of particles in the climate system. Indeed, many of these regions have also been identified as regions lacking sufficient remote sensing data for climate and air quality purposes (Millet et al., 2024).
In this paper, we included nitrate aerosols, which are not included in the default CESM simulations conducted for climate, and represent about 10 % of the globally averaged surface concentration mass (Table 2; Figs. S18 and S19). When we look spatially, the default particles are the dominant particles over most of the planet (Fig. 11), but, in many regions for both PM2.5 and PM10, the default aerosol scheme includes less than 50 % of the aerosol particles (Fig. 10a and c), with substantial contributions from the nitrate particles that we add to the simulation (Fig. 10b and d). The CESM2 (and some other climate models) does not include nitrogen particles (NO and NH) because of the substantial complexity and computational load of chemistry and gas–aerosol equilibrium (Bauer et al., 2007; Thornhill et al., 2021; Adams et al., 2001; Regayre et al., 2018). Previous studies have highlighted the importance of nitrogen particles for climate, air quality, and ecosystem impacts (e.g., Adams et al., 2001; Bauer et al., 2007, 2016; Kanakidou et al., 2016; Baker et al., 2021). Changes in nitrogen aerosol precursor emissions are likely to follow different future trajectories than SO, BC, or OC, whose anthropogenic sources are mostly fossil fuel derived and should decrease in the future as renewable energy resources expand (Gidden et al., 2019). Ammonia has substantial sources from agriculture, which is likely to stay constant or expand (Gidden et al., 2019; Klimont et al., 2017; Bauer et al., 2016). This suggests that there could be a substantial bias, especially regionally, in both historical and future aerosol forcings due to the exclusion of these important sources (e.g., Bauer et al., 2007; Thornhill et al., 2021; Adams et al., 2001; Regayre et al., 2018).
In this study, we collect aerosol surface concentration data sets and present a new aerosol compilation (AERO-MAP) designed to evaluate the spatial and temporal variability of particulate matter in Earth system and air quality models. The in situ surface measurements complement the column totals typically retrieved by satellites. This data set includes both total mass and composition, where available, including 15 000 station data sets and over 20 million daily to weekly averaged measurements. Climatological and decadal averages (2010–2019) are presented, and we recommend that the climatological averages be used because they include more data sets, and multi-decadal and decadal means are extremely similar when compared (Sect. 3.2). The spatial variability of aerosols (Fig. 1f and Sect. 3.2) is important to simulate accurately in models as a prerequisite to identifying the human impacts. In addition, we make available annual means across time, along with the climatological monthly means, so that temporal trends can be assessed. Here, we expand beyond the usual limited coverage of North America and Europe to present a more global view for observations of both PM2.5 and PM10 (Fig. 1). Unfortunately, there are still very limited data characterizing the surface concentration, size, and composition of aerosol particles (Fig. 10), and the locations where we lack data have also been identified as lacking sufficient remote sensing data (Millet et al., 2024). While satellite remote sensing can indicate the total atmospheric loading during cloud-free conditions, it cannot yet provide information about the size or composition of particles (Kahn et al., 2005; Tanré et al., 1997; Remer et al., 2005). Surface-based remote sensing may provide more information about size and absorption properties (Holben et al., 2001; Dubovik et al., 2002; Schuster et al., 2016; Gonçalves Ageitos et al., 2023; Obiso et al., 2024), but single scattering albedo, for example, is only available under very high (>0.4 AOD) aerosol-loading conditions and thus is not available most of the time and in space (Dubovik et al, 2002). Knowing the size and the composition of aerosols is key to knowing their impacts on air quality and climate (Mahowald et al., 2011). Knowing what particles are dominant in a region is required as fossil-fuel-derived aerosols will likely be reduced, while agriculturally based aerosols may well increase (Gidden et al., 2019). We also present a method that is generalizable to other models that use this data set to evaluate both mass and composition for intercomparison projects and improvements in air quality and Earth system models. The novel aspect of this paper is the presentation of this compilation in an easy-to-use NetCDF format and some example comparisons that can be used in the future to evaluate and improve model simulations for individual models or for AeroCom intercomparisons. The underlying data could also be used for data assimilation efforts or for estimating from the observations what the contributions are from different aerosols (e.g., similarly to Prank et al., 2016).
This study has highlighted the value of surface concentration data by showing that these data can identify where models do well or poorly, not just for total mass but also for different compositions and sizes, complementing other data sources, such as remote sensing. A recent, independent, and complementary effort collects all atmospheric composition data (not just aerosols) from many networks into one easy-to-use framework called GHOST (Globally Harmonised Observations in Space and Time; Bowdalo et al., 2024). The approach used in GHOST includes presenting the data in NetCDF format at the original resolution, with metadata regarding the measurement type and so on included, and is an important step forward (Bowdalo et al., 2024). At this point, GHOST only includes a subset of the data available in this study: we hope that the GHOST effort can be expanded to include more spatial variability and that it can be maintained into the future.
This study also highlights the importance of including all aerosol components into the models and shows that, in the CESM2, approximately 10 % are missing. In many places, there is 50 % of the particulate mass missing due to lack of the nitrate particles (Fig. 10; Paulot et al., 2016; Adams et al., 1999; Thornhill et al., 2021). Because these particles are largely driven by agricultural sources and not fossil fuels, their concentrations will hardly be affected by the transition to renewable energy and may increase if agricultural production expands with populations. Therefore, these nitrate aerosol particles represent important air quality and climate impacts that should be represented more accurately in future studies.
The model used here is a version of the Community Earth System Model, and the modifications and input files to that code are available at https://doi.org/10.5281/zenodo.10459653 (Mahowald et al., 2024).
The data compiled here are available as a CSV table, with citations as in the Supplement (Data set 1). This same file is available along with gridded data sets with the compiled observations and modeled data in NetCDF format at https://doi.org/10.5281/zenodo.10459653 (Mahowald et al., 2024). Additional underlying data sets are available upon request to mahowald@cornell.edu.
The supplement related to this article is available online at https://doi.org/10.5194/acp-25-4665-2025-supplement.
NMM designed and oversaw the implementation of the approach with the advice of HL, CW, RVM, and JL and wrote the first draft of the paper. JV, PH, LLi, ZK, CD, SR, TB, and DH assisted with the version of the model and the emission data sets used. EA, DM, HM, and LLu assisted in the compilation and conversion of the data. CH and ZKl contributed emission data sets. XL and XZ contributed model code. MGA, CA, AA, PA,AB, FB, SB, GC, SC, YC, PC, DC, CC, ED, GD, JE, KE, CGL, CG, DG, YGR, HH, RH, CH, BH, PH, CH, MK, ZKe, KK, FL XL, RL, RL, WM, BM, RLM, RVM, NM, YMG, AP, JP, SR, PS, DV, and BW contributed data. All the authors edited the paper.
At least one of the (co-)authors is a member of the editorial board of Atmospheric Chemistry and Physics. The peer-review process was guided by an independent editor, and the authors also have no other competing interests to declare.
Publisher's note: Copernicus Publications remains neutral with regard to jurisdictional claims made in the text, published maps, institutional affiliations, or any other geographical representation in this paper. While Copernicus Publications makes every effort to include appropriate place names, the final responsibility lies with the authors.
Natalie M. Mahowald and Longlei Li would like to acknowledge the support from Paul Ekhart (EBAS). The many freely available air quality websites and data sources used in this paper are as follows: EBAS (https://ebas.nilu.no/, last access: 5 April 2024); data affiliated with ACTRIS (Aerosol Clouds and Trace Gases Research Infrastructure), EMEP (European Monitoring and Evaluation Programme), and GAW-WDCA (Global Atmosphere Watch World Data Centre for Aerosols); EANET (Acid Deposition Monitoring Network in East Asia) All Indian Air Quality Management data (https://app.cpcbccr.com/ccr/#/caaqm-dashboard-all/caaqm-landing/data, last access: 20 September 2022); the Australian National Air Pollution Monitoring Database (https://osf.io/jxd98/, last access: 9 September 2022); the South African Air Quality Information System (https://saaqis.environment.gov.za/, last access: 8 September 2022); Mexico City air quality data (http://www.aire.cdmx.gob.mx/default.php?opc='aKBh', last access: 3 November 2022); Chile's Sistema de Informacion Nacional de Calidad del Aire (https://sinca.mma.gob.cl/index.php/, last access: 3 June 2022); Japan's NIES (National Institute for Environmental Studies – https://tenbou.nies.go.jp/download/, last access: 25 November 2023); Türkiye's National Air Quality Monitoring Network; Israel's air quality monitoring website; US EPA CASTNET and IMPROVE; US AirNow; New Zealand's Stats NZ website (https://www.stats.govt.nz/indicators, last access: 12 June 2022); Chinese air quality data collected together (https://osf.io/jxd98/, last access: 10 August 2022); and the Canadian National Air Quality Surveillance program (https://data.ec.gc.ca/data/air/monitor/national-air-pollution-surveillance-naps-program/Data-Donnees, last access: 14 September 2022).
Francisco Barraza and Fabrice Lambert were supported by the Ministerio del Medio Ambiente de Chile and FONDECYT (grant no. 1231682). Shankararaman Chellam is grateful for financial support from the Texas Air Research Center and the Texas Commission on Environmental Quality. Paulo Artaxo acknowledges funding from Fundação de Amparo à Pesquisa do Estado de São Paulo (FAPESP) under grant nos. 2017-17047-0 and 2023/04358-9. Randall V. Martin was funded by NSF grant no. 2020673. Maria Kanakidou and Nikolaos Mihalopoulos acknowledge support from Greece and the European Union (European Regional Development Fund) via the project PANhellenic infrastructure for Atmospheric Composition and climatE chAnge (PANACEA; grant no. MIS 5021516). Corinne Galy-Lacaux and Beatrice Marticorena acknowledge the support provided by CNRS, IRD, and ACTRIS-France to the International Network to study Deposition and Atmospheric composition in Africa (INDAAF) program. Hitoshi Matsui acknowledges support from MEXT/JSPS KAKENHI under grant nos. JP19H05699, JP19KK0265, JP20H00196, JP22H03722, JP22F22092, JP23H00515, JP23H00523, JP23K18519, JP23K24976, and JP24H02225; the MEXT Arctic Challenge for Sustainability Phase II (ArCS II; grant no. JPMXD1420318865) project; and the Environment Research and Technology Development Fund 2–2301 (grant no. JPMEERF20232001) of the Environmental Restoration and Conservation Agency. Barak Herut was supported by the Israel Science Foundation (grant no. 821/22). Ron L. Miller acknowledges support from the NASA Modeling, Analysis, and Prediction Program. We acknowledge the contributions by Sagar Rathod, Tami Bond, Giles Bergametti, Javier Miranda Martin del Campo, and Xavier Querol. The support provided to CESAM by FCT/MCTES (grant no. UIDP/50017/2020+UIDB/50017/2020+LA/P/0094/2020) is also acknowledged.
This research has been supported by the Biological and Environmental Research program (grant no. DOE-SC0006791), the Ministerio del Medio Ambiente de Chile and FONDECYT (grant no. 1231682), the Texas Air Research Center and the Texas Commission on Environmental Quality, Fundação de Amparo à Pesquisa do Estado de São Paulo (FAPESP, grant nos. 2017-17047-0 and 2023/04358-9), NSF (grant no. 2020673), European Regional Development Fund via the project PANhellenic infrastructure for Atmospheric Composition and climatE chAnge (PANACEA; grant no. MIS 5021516), the International Network to study Deposition and Atmospheric composition in Africa (INDAAF) program, MEXT/JSPS KAKENHI (grant nos. JP19H05699, JP19KK0265, JP20H00196, JP22H03722, JP22F22092, JP23H00515, JP23H00523, JP23K18519, JP23K24976, and JP24H02225), the MEXT Arctic Challenge for Sustainability Phase II (ArCS II; grant no. JPMXD1420318865) project, the Environment Research and Technology Development Fund 2–2301 (grant no. JPMEERF20232001) of the Environmental Restoration and Conservation Agency, the Israel Science Foundation (grant no. 821/22), the NASA Modeling, Analysis, and Prediction Program, and FCT/MCTES (grant no. UIDP/50017/2020+UIDB/50017/2020+LA/P/0094/2020).
This paper was edited by Gunnar Myhre and reviewed by two anonymous referees.
Aas, W., Mortier, A., Bowersox, V., Cherian, R., Faluvegi, G., Fagerli, H., Hand, J., Klimont, Z., Galy-Lacaux, C., Lehmann, C. M. B., Myhre, C. L., Myhre, G., Olivié, D., Sato, K., Quaas, J., Rao, P. S. P., Schulz, M., Shindell, D., Skeie, R. B., Stein, A., Takemura, T., Tsyro, S., Vet, R., and Xu, X.: Global and regional trends of atmospheric sulfur, Sci. Rep., 9, 953, https://doi.org/10.1038/s41598-018-37304-0, 2019.
Adams, P., Seinfeld, J., and Koch, D.: Global concentrations of tropospheric sulfate, nitrate and ammonium aerosol simulated in a general circulation model, J. Geophys. Res., 104, 13791–13823, 1999.
Adams, P., Seinfeld, J., Koch, D., Mickley, L., and Jacob, D.: General circulation model assessment of direct radiative forcing by sulfate-nitrate-ammonium-water inorganic aerosol system, J. Geophys. Res., 106, 1097–1111, 2001.
Adebiyi, A., Kok, J. F., Murray, B. J., Ryder, C. L., Stuut, J.-B. W., Kahn, R. A., Knippertz, P., Formenti, P., Mahowald, N. M., Pérez García-Pando, C., Klose, M., Ansmann, A., Samset, B. H., Ito, A., Balkanski, Y., Di Biagio, C., Romanias, M. N., Huang, Y., and Meng, J.: A review of coarse mineral dust in the Earth system, Aeolian Res., 60, 100849, https://doi.org/10.1016/j.aeolia.2022.100849, 2023.
Aiken, A. C., Decarlo, P. F., Kroll, J. H., Worsnop, D. R., Huffman, J. A., Docherty, K. S., Ulbrich, I. M., Mohr, C., Kimmel, J. R., Sueper, D., Sun, Y., Zhang, Q., Trimborn, A., Northway, M., Ziemann, P. J., Canagaratna, M. R., Onasch, T. B., Alfarra, M. R., Prevot, A. S. H., Dommen, J., Duplissy, J., Metzger, A., Baltensperger, U., and Jimenez, J. L.: O/C and OM/OC ratios of primary, secondary, and ambient organic aerosols with high-resolution time-of-flight aerosol mass spectrometry, Environ. Sci. Technol., 42, 4478–4485, https://doi.org/10.1021/es703009q, 2008.
Alastuey, A., Querol, X., Aas, W., Lucarelli, F., Pérez, N., Moreno, T., Cavalli, F., Areskoug, H., Balan, V., Catrambone, M., Ceburnis, D., Cerro, J. C., Conil, S., Gevorgyan, L., Hueglin, C., Imre, K., Jaffrezo, J.-L., Leeson, S. R., Mihalopoulos, N., Mitosinkova, M., O'Dowd, C. D., Pey, J., Putaud, J.-P., Riffault, V., Ripoll, A., Sciare, J., Sellegri, K., Spindler, G., and Yttri, K. E.: Geochemistry of PM10 over Europe during the EMEP intensive measurement periods in summer 2012 and winter 2013, Atmos. Chem. Phys., 16, 6107–6129, https://doi.org/10.5194/acp-16-6107-2016, 2016.
Albani, S., Mahowald, N. M., Perry, A. T., Scanza, R. A., Zender, C. S., Heavens, N. G., Maggi, V., Kok, J. F., and Otto-Bliesner, B. L.: Improved dust representation in the Community Atmosphere Model, J. Adv. Model. Earth Sy., 6, 541–570, https://doi.org/10.1002/2013MS000279, 2014.
Almeida, S. M., Pio, C. A., Freitas, M. C., Reis, M. A., and Trancoso, M. A.: Source apportionment of fine and coarse particulate matter in a sub-urban area at the Western European Coast, Atmos. Environ., 39, 3127–3138, https://doi.org/10.1016/j.atmosenv.2005.01.048, 2005.
Amato, F., Alastuey, A., Karanasiou, A., Lucarelli, F., Nava, S., Calzolai, G., Severi, M., Becagli, S., Gianelle, V. L., Colombi, C., Alves, C., Custódio, D., Nunes, T., Cerqueira, M., Pio, C., Eleftheriadis, K., Diapouli, E., Reche, C., Minguillón, M. C., Manousakas, M.-I., Maggos, T., Vratolis, S., Harrison, R. M., and Querol, X.: AIRUSE-LIFE+: a harmonized PM speciation and source apportionment in five southern European cities, Atmos. Chem. Phys., 16, 3289–3309, https://doi.org/10.5194/acp-16-3289-2016, 2016.
Andreae, T. W., Andreae, M. O., Ichoku, C., Maenhaut, W., Cafmeyer, J., Karnieli, A., and Orlovsky, L.: Light scattering by dust and anthropogenic aerosol at a remote site in the Negev desert, Israel, J. Geophys. Res., 107, AAC 3-1–AAC 33-18, https://doi.org/10.1029/2001JD900252, 2002.
Arimoto, R., Duce, R. A., Ray, B. J., and Tomza, U.: Dry deposition of trace elements to the western North Atlantic, Global Biogeochem. Cy., 17, https://doi.org/10.1029/2001GB001406, 2003.
Artaxo, P. and Maenhaut, W.: Aerosol characteristics and sources for the Amazon Basin during the west season, J. Geophys. Res., 95, 16971–16985, 1990.
Artaxo, P., Martins, J. V., Yamasoe, M. A., Procopio, A. S., Pauliquevis, T. M., Andrae, M. O., Guyon, P., Gatti, L. V, and Leal, A. M. C.: Physical and chemical properties of aerosol particles in the wet and dry seasons in Rondonia, Amazonia, J. Geophys. Res., 107, 8081, https://doi.org/10.1029/2001JD000666, 2002.
Baker, A. R., Kanakidou, M., Nenes, A., Myriokefalitakis, S., Croot, P. L., Duce, R. A., Yuan Gao, Y., Guieu, C, Ito, A., Jickells, T. D., Mahowald, M. A., Middag, R., Perron, M. M. G., Sarin, M. M., Shelley, R., and Turner D. R.: Changing atmospheric acidity as a modulator of nutrient deposition and ocean biogeochemistry, Sci. Adv., 2021, eabd8800, https://doi.org/10.1126/sciadv.abd8800, 2021.
Barkley, A. E., Prospero, J. M., Mahowald, N., Hamilton, D. S., Popendorf, K. J., Oehlert, A. M., Pourmand, A., Gatineau, A., Panechou-Pulcherie, K., Blackwelder, P., and Gaston, C. J.: African biomass burning is a substantial source of phosphorus deposition to the Amazon, Tropical Atlantic Ocean, and Southern Ocean, P. Natl. Acad. Scie. USA, 116, 16216–16221, https://doi.org/10.1073/pnas.1906091116, 2019.
Barraza, F., Lambert, F., Jorquera, H., Villalobos, A. M., and Gallardo, L.: Temporal evolution of main ambient PM2.5 sources in Santiago, Chile, from 1998 to 2012, Atmos. Chem. Phys., 17, 10093–10107, https://doi.org/10.5194/acp-17-10093-2017, 2017.
Barrie, L. A., Yi, Y., Leaitch, W. R., Lohmann, U., Kasibhatla, P., Roelofs, G. J., Wilson, J., McGovern, F., Benkovitz, C., Mélières, M. A., Law, K., Prospero, J., Kritz, M., Bergmann, D., Bridgeman, C., Chin, M., Christensen, J., Easter, R., Feichter, J., Land, C., Jeuken, A., Kjellström, E., Koch, D., and Rasch, P.: A comparison of large-scale atmospheric sulphate aerosol models (COSAM): Overview and highlights, Tellus B, 53, 615–645, https://doi.org/10.3402/tellusb.v53i5.16642, 2001.
Bauer, S. E., Koch, D., Unger, N., Metzger, S. M., Shindell, D. T., and Streets, D. G.: Nitrate aerosols today and in 2030: a global simulation including aerosols and tropospheric ozone, Atmos. Chem. Phys., 7, 5043–5059, https://doi.org/10.5194/acp-7-5043-2007, 2007.
Bauer, S. E., Tsigaridis, K., and Miller, R.: Significant atmospheric aerosol pollution caused by world food cultivation, Geophys. Res. Lett., 43, 5394–5400, https://doi.org/10.1002/2016GL068354, 2016.
Bauer, S. E., Tsigaridis, K., Faluvegi, G., Nazarenko, L., Miller, R. L., Kelley, M., and Schmidt, G.: The turning point of the aerosol era, J. Adv. Model. Earth Sy., 14, e2022MS003070, https://doi.org/10.1029/2022MS003070, 2022.
Bellouin, N., Quaas, J., Gryspeerdt, E., Kinne, S., Stier, P., Watson-Parris, D., Boucher, O., Carslaw, K. S., Christensen, M., Daniau, A. L., Dufresne, J. L., Feingold, G., Fiedler, S., Forster, P., Gettelman, A., Haywood, J. M., Lohmann, U., Malavelle, F., Mauritsen, T., McCoy, D. T., Myhre, G., Mülmenstädt, J., Neubauer, D., Possner, A., Rugenstein, M., Sato, Y., Schulz, M., Schwartz, S. E., Sourdeval, O., Storelvmo, T., Toll, V., Winker, D., and Stevens, B.: Bounding Global Aerosol Radiative Forcing of Climate Change, Rev. Geophys., 58, e2019RG000660, https://doi.org/10.1029/2019RG000660, 2020.
Bergametti, G., Gomes, L., Doude-Gaussen, G., Rognon, P., and Le Coustumer, M. N.: African dust observed over the Canary Islands: source-regions identification and the transport pattern for some summer situations, J. Geophys. Res., 94, 14855–14864, 1989.
Bond, T., Doherty, S. J., Fahey, D., Forster, P., Bernsten, T., DeAngelo, B., Flanner, M., Ghan, S., Karcher, B., Koch, D., Kinne, S., Kondo, Y., Quinn, P. K., Sarofim, M., Schultz, M., Venkataraman, C., Zhang, H., Zhang, S., Bellouin, N., Guttikunda, S., Hopke, P., Jacobson, M., Kaiser, J. W., Klimont, Z., Lohman, U., Schwartz, J., Shindel, D., Storelvmo, T., Warren, S., and Zender, C.: Bounding the role of black carbon in the climate system: A scientific assessment, J. Geophys. Res., D118, 5380–5552, https://doi.org/10.1002/jgrd.50171, 2013.
Bond, T. C., Streets, D. G., Yarber, K. F., Nelson, S. M., Woo, J.-H., and Klimont, Z.: A technology-based global inventory of black and organic carbon emissions from combustion, J. Geophys. Res., 109, https://doi.org/10.1029/2003JD003697, 2004.
Bouet, C., Labiadh, M. T., Rajot, J. L., Bergametti, G., Marticorena, B., des Tureaux, T. H., Ltifi, M., Sekrafi, S., and Féron, A.: Impact of desert dust on air quality: What is the meaningfulness of daily PM standards in regions close to the sources? The example of Southern Tunisia, Atmosphere, 10, 452, https://doi.org/10.3390/atmos10080452, 2019.
Bowdalo, D., Basart, S., Guevara, M., Jorba, O., Pérez García-Pando, C., Jaimes Palomera, M., Rivera Hernandez, O., Puchalski, M., Gay, D., Klausen, J., Moreno, S., Netcheva, S., and Tarasova, O.: GHOST: a globally harmonised dataset of surface atmospheric composition measurements, Earth Syst. Sci. Data, 16, 4417–4495, https://doi.org/10.5194/essd-16-4417-2024, 2024.
Bozlaker, A., Buzcu-Güven, B., Fraser, M. P., and Chellam, S.: Insights into PM10 sources in Houston, Texas: Role of petroleum refineries in enriching lanthanoid metals during episodic emission events, Atmos. Environ., 69, 109–117, https://doi.org/10.1016/j.atmosenv.2012.11.068, 2013.
Burnett, R., Chen, H., Szyszkowicz, M., Fann, N., Hubbell, B., Pope, C. A., Apte, J. S., Brauer, M., Cohen, A., Weichenthal, S., Coggins, J., Di, Q., Brunekreef, B., Frostad, J., Lim, S. S., Kan, H., Walker, K. D., Thurston, G. D., Hayes, R. B., Lim, C. C., Turner, M. C., Jerrett, M., Krewski, D., Gapstur, S. M., Diver, W. R., Ostro, B., Goldberg, D., Crouse, D. L., Martin, R. v., Peters, P., Pinault, L., Tjepkema, M., van Donkelaar, A., Villeneuve, P. J., Miller, A. B., Yin, P., Zhou, M., Wang, L., Janssen, N. A. H., Marra, M., Atkinson, R. W., Tsang, H., Thach, T. Q., Cannon, J. B., Allen, R. T., Hart, J. E., Laden, F., Cesaroni, G., Forastiere, F., Weinmayr, G., Jaensch, A., Nagel, G., Concin, H., and Spadaro, J. v.: Global estimates of mortality associated with longterm exposure to outdoor fine particulate matter, P. Natl. Acad. Sci. USA, 115, 9592–9597, https://doi.org/10.1073/pnas.1803222115, 2018.
Burgos, M. A., Andrews, E., Titos, G., Benedetti, A., Bian, H., Buchard, V., Curci, G., Kipling, Z., Kirkevåg, A., Kokkola, H., Laakso, A., Letertre-Danczak, J., Lund, M. T., Matsui, H., Myhre, G., Randles, C., Schulz, M., van Noije, T., Zhang, K., Alados-Arboledas, L., Baltensperger, U., Jefferson, A., Sherman, J., Sun, J., Weingartner, E., and Zieger, P.: A global model–measurement evaluation of particle light scattering coefficients at elevated relative humidity, Atmos. Chem. Phys., 20, 10231–10258, https://doi.org/10.5194/acp-20-10231-2020, 2020.
Caldwell, P. M., Mametjanov, A., Tang, Q., van Roekel, L. P., Golaz, J. C., Lin, W., Bader, D. C., Keen, N. D., Feng, Y., Jacob, R., Maltrud, M. E., Roberts, A. F., Taylor, M. A., Veneziani, M., Wang, H., Wolfe, J. D., Balaguru, K., Cameron-Smith, P., Dong, L., Klein, S. A., Leung, L. R., Li, H. Y., Li, Q., Liu, X., Neale, R. B., Pinheiro, M., Qian, Y., Ullrich, P. A., Xie, S., Yang, Y., Zhang, Y., Zhang, K., and Zhou, T.: The DOE E3SM Coupled Model Version 1: Description and Results at High Resolution, J. Adv. Model. Earth Sy., 11, 4095–4146, https://doi.org/10.1029/2019MS001870, 2019.
Carslaw, K. S., Lee, L., Reddington, C., Pringle, K., Rap, A., Forster, P., Mann, G., Spracklen, D., Woodhouse, M., Regayre, L., and Pierce, J.: Large contribution of natural aerosols to uncertainty in indirect forcing, Nature, 503, 67–71, 2013.
Castellanos, P., Colarco, P., Espinosa, W. R., Guzewich, S. D., Levy, R. C., Miller, R. L., Chin, M., Kahn, R. A., Kemppinen, O., Moosmüller, H., Nowottnick, E. P., Rocha-Lima, A., Smith, M. D., Yorks, J. E., and Yu, H.: Mineral dust optical properties for remote sensing and global modeling: A review, Remote Sens. Environ., 303, 113982, https://doi.org/10.1016/j.rse.2023.113982, 2024.
Chatziparaschos, M., Daskalakis, N., Myriokefalitakis, S., Kalivitis, N., Nenes, A., Gonçalves Ageitos, M., Costa-Surós, M., Pérez García-Pando, C., Zanoli, M., Vrekoussis, M., and Kanakidou, M.: Role of K-feldspar and quartz in global ice nucleation by mineral dust in mixed-phase clouds, Atmos. Chem. Phys., 23, 1785–1801, https://doi.org/10.5194/acp-23-1785-2023, 2023.
Chen, Y., Street, J., and Paytan, A.: Comparison between pure-water- and seawater-soluble nutrient concentrations of aerosol particles from the Gulf of Aqaba, Mar. Chem., 101, 141–152, https://doi.org/10.1016/j.marchem.2006.02.002, 2006.
Chuang, P., Duvall, R., Shafer, M., and Schauer, J.: The origin of water soluble particulate iron in the Asian atmospheric outflow, Geophys. Res. Lett., 32, https://doi.org/10.1029/2004GL021946, 2005.
Cipoli, Y. A., Alves, C., Rapuano, M., Evtyugina, M., Rienda, I. C., Kováts, N., Vicente, A., Giardi, F., Furst, L., Nunes, T., and Feliciano, M.: Nighttime–daytime PM10 source apportionment and toxicity in a remoteness inland city of the Iberian Peninsula, Atmos. Environ., 303, 119771, https://doi.org/10.1016/j.atmosenv.2023.119771, 2023.
Clark, S. K., Ward, D. S., and Mahowald, N. M.: The sensitivity of global climate to the episodicity of fire aerosol emissions, J. Geophys. Res.-Atmos., 120, 11589–11607, https://doi.org/10.1002/2015JD024068, 2015.
Cohen, D., Garton, D., Stelcer, E., Hawas, O., Wang, T., Pon, S., Kim, J., Choi, B., Oh, S., Shin, H.-J., Ko, M., and Uematsu, M.: Multielemental analysis and characterization of fine aerosols at several key ACE-Asia sites, J. Geophys. Res.-Atmos., 109, https://doi.org/10.1029/2003JD003569, 2004.
Collaud Coen, M., Andrews, E., Alastuey, A., Arsov, T. P., Backman, J., Brem, B. T., Bukowiecki, N., Couret, C., Eleftheriadis, K., Flentje, H., Fiebig, M., Gysel-Beer, M., Hand, J. L., Hoffer, A., Hooda, R., Hueglin, C., Joubert, W., Keywood, M., Kim, J. E., Kim, S.-W., Labuschagne, C., Lin, N.-H., Lin, Y., Lund Myhre, C., Luoma, K., Lyamani, H., Marinoni, A., Mayol-Bracero, O. L., Mihalopoulos, N., Pandolfi, M., Prats, N., Prenni, A. J., Putaud, J.-P., Ries, L., Reisen, F., Sellegri, K., Sharma, S., Sheridan, P., Sherman, J. P., Sun, J., Titos, G., Torres, E., Tuch, T., Weller, R., Wiedensohler, A., Zieger, P., and Laj, P.: Multidecadal trend analysis of in situ aerosol radiative properties around the world, Atmos. Chem. Phys., 20, 8867–8908, https://doi.org/10.5194/acp-20-8867-2020, 2020.
Computational and Information Systems Laboratory: Cheyenne: HPE/SGI ICE XA System (NCAR Community Computing), https://doi.org/10.5065/D6RX99HX, 2019.
da Silva, L. I. D., de Souza Sarkis, J. E., Zotin, F. M. Z., Carneiro, M. C., Neto, A. A., da Silva, A. dos S. A. G., Cardoso, M. J. B., and Monteiro, M. I. C.: Traffic and catalytic converter – Related atmospheric contamination in the metropolitan region of the city of Rio de Janeiro, Brazil, Chemosphere, 71, 677–684, https://doi.org/10.1016/j.chemosphere.2007.10.057, 2008.
Dentener, F., Kinne, S., Bond, T., Boucher, O., Cofala, J., Generoso, S., Ginoux, P., Gong, S., Hoelzemann, J. J., Ito, A., Marelli, L., Penner, J. E., Putaud, J.-P., Textor, C., Schulz, M., van der Werf, G. R., and Wilson, J.: Emissions of primary aerosol and precursor gases in the years 2000 and 1750 prescribed data-sets for AeroCom, Atmos. Chem. Phys., 6, 4321–4344, https://doi.org/10.5194/acp-6-4321-2006, 2006.
Dentener, F. J., Carmichael, G. R., Zhang, Y., Lelieveld, J., and Crutzen, P. J.: Role of mineral aerosol as a reactive surface in the global troposphere, J. Geophys. Res., 101, 22822–869889, 1996.
Dongarrà, G., Manno, E., Varrica, D., and Vultaggio, M.: Mass levels, crustal component and trace elements in PM10 in Palermo, Italy, Atmos. Environ., 41, 7977–7986, https://doi.org/10.1016/j.atmosenv.2007.09.015, 2007.
Dongarrà, G., Manno, E., Varrica, D., Lombardo, M., and Vultaggio, M.: Study on ambient concentrations of PM10, PM10−2.5, PM2.5 and gaseous pollutants. Trace elements and chemical speciation of atmospheric particulates, Atmos. Environ., 44, 5244–5257, https://doi.org/10.1016/j.atmosenv.2010.08.041, 2010.
Dubovik, O., Holben, B., Eck, T. F., Smirnov, A.., Kaufman, Y., King, M. D., Tanre, D., and Slutsker, I.: Variability of absorption and optical properties of key aerosol types observed in worldwide locations, J. Atmos. Sci., 590–608, 2002.
Engelbrecht, J., McDonald, E. V., Gillies, J. A., Jayanty, R. K. M., Casuccio, G., and Gertler, A. W.: Characterizing Mineral Dusts and Other Aerosols from the Middle East – Part 1: Ambient Sampling, Inhal. Toxicol., 21, 297–326, https://doi.org/10.1080/08958370802464273, 2009.
Fanourgakis, G. S., Kanakidou, M., Nenes, A., Bauer, S. E., Bergman, T., Carslaw, K. S., Grini, A., Hamilton, D. S., Johnson, J. S., Karydis, V. A., Kirkevåg, A., Kodros, J. K., Lohmann, U., Luo, G., Makkonen, R., Matsui, H., Neubauer, D., Pierce, J. R., Schmale, J., Stier, P., Tsigaridis, K., van Noije, T., Wang, H., Watson-Parris, D., Westervelt, D. M., Yang, Y., Yoshioka, M., Daskalakis, N., Decesari, S., Gysel-Beer, M., Kalivitis, N., Liu, X., Mahowald, N. M., Myriokefalitakis, S., Schrödner, R., Sfakianaki, M., Tsimpidi, A. P., Wu, M., and Yu, F.: Evaluation of global simulations of aerosol particle and cloud condensation nuclei number, with implications for cloud droplet formation, Atmos. Chem. Phys., 19, 8591–8617, https://doi.org/10.5194/acp-19-8591-2019, 2019.
Fasullo, J. T., Lamarque, J. F., Hannay, C., Rosenbloom, N., Tilmes, S., DeRepentigny, P., Jahn, A., and Deser, C.: Spurious Late Historical-Era Warming in CESM2 Driven by Prescribed Biomass Burning Emissions, Geophys. Res. Lett., 49, e2021GL097420, https://doi.org/10.1029/2021GL097420, 2022.
Fiore, A. M., Milly, G. P., Hancock, S. E., Quiñones, L., Bowden, J. H., Helstrom, E., Lamarque, J. F., Schnell, J., West, J. J., and Xu, Y.: Characterizing Changes in Eastern U.S. Pollution Events in a Warming World, J. Geophys. Res.-Atmos., 127, e2021JD035985, https://doi.org/10.1029/2021JD035985, 2022.
Font, A., de Brito, J. F., Riffault, V., Conil, S., Jaffrezo, J. L., and Bourin, A.: Calculations of the conversion factor from organic carbon to organic matter for aerosol mass balance, Atmos. Pollut. Res., 15, 102301, https://doi.org/10.1016/j.apr.2024.102301, 2024.
Formenti, P., Elbert, W., Maenhaut, W., Haywood, J., and Andreae, M. O.: Chemical composition of mineral dust aerosol during the Saharan Dust Experiment (SHADE) airborne campaign in the Cape Verde region, September 2000, J. Geophys. Res., 108, 8576, https://doi.org/10.1029/2002JD002648, 2003.
Furu, E., Katona-Szabo, I., Angyal, A., Szoboszlai, Z., Török, Z., and Kertész, Z.: The effect of the tramway track construction on the aerosol pollution in Debrecen, Hungary, Nucl. Instrum. Meth. B, 363, 124–130, https://doi.org/10.1016/j.nimb.2015.08.014, 2015.
Furu, E., Angyal, A., Szoboszlai, Z., Papp, E., Török, Z., and Kertész, Z.: Characterization of Aerosol Pollution in Two Hungarian Cities in Winter 2009–2010, Atmosphere, 13, 554, https://doi.org/10.3390/atmos13040554, 2022.
Fuzzi, S., Decesari, S., Facchini, M., Cavalli, F., Emblico, L., Mircea, M., Andreae, M., Trebs, I., Hoffer, A., Guyon, P., Artaxo, P., Rizzo, L., Lara, L., Pauliquevis, T., Maenhaut, W., Raes, N., Chi, X., Mayol-Bracero, O. L., Soto-García, L. L., Claeys, M., Kourtchev, I., Rissler, J., Swietlicki, E., Tagliavini, E., Schkolnik, G., Falkovich, A. H., Rudich, Y., Fisch, G., and Gatti, L. V.: Overview of the inorganic and organic composition of size-segregated aerosol in Rondonia, Brazil from the biomass-burning period to the onset of the wet season, J. Geophys. Res., 112, https://doi.org/10.1029/2005JD006741, 2007.
García, M. I., Rodríguez, S., and Alastuey, A.: Impact of North America on the aerosol composition in the North Atlantic free troposphere, Atmos. Chem. Phys., 17, 7387–7404, https://doi.org/10.5194/acp-17-7387-2017, 2017.
Gelaro, R., McCarty, W., Suárez, M. J., Todling, R., Molod, A., Takacs, L., Randles, C. A., Darmenov, A., Bosilovich, M. G., and Reichle, R.: The modern-era retrospective analysis for research and applications, version 2 (MERRA-2), J. Climate, 30, 5419–5454, 2017.
Gianini, M. F. D., Gehrig, R., Fischer, A., Ulrich, A., Wichser, A., and Hueglin, C.: Chemical composition of PM10 in Switzerland: An analysis for 2008/2009 and changes since 1998/1999, Atmos. Environ., 54, 97–106, https://doi.org/10.1016/j.atmosenv.2012.02.037, 2012a.
Gianini, M. F. D., Fischer, A., Gehrig, R., Ulrich, A., Wichser, A., Piot, C., Besombes, J. L., and Hueglin, C.: Comparative source apportionment of PM10 in Switzerland for 2008/2009 and 1998/1999 by Positive Matrix Factorisation, Atmos. Environ., 54, 149–158, https://doi.org/10.1016/j.atmosenv.2012.02.036, 2012b.
Gidden, M. J., Riahi, K., Smith, S. J., Fujimori, S., Luderer, G., Kriegler, E., van Vuuren, D. P., van den Berg, M., Feng, L., Klein, D., Calvin, K., Doelman, J. C., Frank, S., Fricko, O., Harmsen, M., Hasegawa, T., Havlik, P., Hilaire, J., Hoesly, R., Horing, J., Popp, A., Stehfest, E., and Takahashi, K.: Global emissions pathways under different socioeconomic scenarios for use in CMIP6: a dataset of harmonized emissions trajectories through the end of the century, Geosci. Model Dev., 12, 1443–1475, https://doi.org/10.5194/gmd-12-1443-2019, 2019.
Ginoux, P., Chin, M., Tegen, I., Prospero, J. M., Holben, B. N., Dubovik, O., and Lin, S.-J.: Sources and distribution of dust aerosol particles with the GOCART model, J. Geophys. Res., 106, 20255–20273, 2001.
Gleckler, P., Taylor, K. E., and Doutriaux, C.: Performance metrics for climate models, J. Geophys. Res., 113, D06104, https://doi.org/10.1029/2007JD008972, 2008.
Gliß, J., Mortier, A., Schulz, M., Andrews, E., Balkanski, Y., Bauer, S. E., Benedictow, A. M. K., Bian, H., Checa-Garcia, R., Chin, M., Ginoux, P., Griesfeller, J. J., Heckel, A., Kipling, Z., Kirkevåg, A., Kokkola, H., Laj, P., Le Sager, P., Lund, M. T., Lund Myhre, C., Matsui, H., Myhre, G., Neubauer, D., van Noije, T., North, P., Olivié, D. J. L., Rémy, S., Sogacheva, L., Takemura, T., Tsigaridis, K., and Tsyro, S. G.: AeroCom phase III multi-model evaluation of the aerosol life cycle and optical properties using ground- and space-based remote sensing as well as surface in situ observations, Atmos. Chem. Phys., 21, 87–128, https://doi.org/10.5194/acp-21-87-2021, 2021.
Golaz, J. C., Caldwell, P. M., van Roekel, L. P., Petersen, M. R., Tang, Q., Wolfe, J. D., Abeshu, G., Anantharaj, V., Asay-Davis, X. S., Bader, D. C., Baldwin, S. A., Bisht, G., Bogenschutz, P. A., Branstetter, M., Brunke, M. A., Brus, S. R., Burrows, S. M., Cameron-Smith, P. J., Donahue, A. S., Deakin, M., Easter, R. C., Evans, K. J., Feng, Y., Flanner, M., Foucar, J. G., Fyke, J. G., Griffin, B. M., Hannay, C., Harrop, B. E., Hoffman, M. J., Hunke, E. C., Jacob, R. L., Jacobsen, D. W., Jeffery, N., Jones, P. W., Keen, N. D., Klein, S. A., Larson, V. E., Leung, L. R., Li, H. Y., Lin, W., Lipscomb, W. H., Ma, P. L., Mahajan, S., Maltrud, M. E., Mametjanov, A., McClean, J. L., McCoy, R. B., Neale, R. B., Price, S. F., Qian, Y., Rasch, P. J., Reeves Eyre, J. E. J., Riley, W. J., Ringler, T. D., Roberts, A. F., Roesler, E. L., Salinger, A. G., Shaheen, Z., Shi, X., Singh, B., Tang, J., Taylor, M. A., Thornton, P. E., Turner, A. K., Veneziani, M., Wan, H., Wang, H., Wang, S., Williams, D. N., Wolfram, P. J., Worley, P. H., Xie, S., Yang, Y., Yoon, J. H., Zelinka, M. D., Zender, C. S., Zeng, X., Zhang, C., Zhang, K., Zhang, Y., Zheng, X., Zhou, T., and Zhu, Q.: The DOE E3SM Coupled Model Version 1: Overview and Evaluation at Standard Resolution, J. Adv. Model. Earth Sy., 11, 2089–2129, https://doi.org/10.1029/2018MS001603, 2019.
Gonçalves Ageitos, M., Obiso, V., Miller, R. L., Jorba, O., Klose, M., Dawson, M., Balkanski, Y., Perlwitz, J., Basart, S., Di Tomaso, E., Escribano, J., Macchia, F., Montané, G., Mahowald, N. M., Green, R. O., Thompson, D. R., and Pérez García-Pando, C.: Modeling dust mineralogical composition: sensitivity to soil mineralogy atlases and their expected climate impacts, Atmos. Chem. Phys., 23, 8623–8657, https://doi.org/10.5194/acp-23-8623-2023, 2023.
Gong, S. L., Barrie, L. A., Prospero, J. M., Savoie, D. L., Ayers, G. P., Blanchet, J.-P., and Spacek, L.: Modeling sea-salt aerosol particles in the atmosphere 2. Atmospheric concentrations and fluxes, J. Geophys. Res., 102, 3819–3830, 1997.
Gong, S. L., Zhang, X. Y., Zhao, T. L., McKendry, I. G., Jaffe, D. A., and Lu, N. M.: Characterization of soil dust aerosol in China and its transport and distribution during 2001 ACE-Asia: 2. Model simulation and validation, J. Geophys. Res., 108, 4262, https://doi.org/10.1029/2002JD002633, 2003.
Gui, K., Che, H., Zheng, Y., Wang, Y., Zhang, L., Zhao, H., Li, L., Zhong, J., Yao, W., and Zhang, X.: Seasonal variability and trends in global type-segregated aerosol optical depth as revealed by MISR satellite observations, Sci. Total Environ., 787, 147543, https://doi.org/10.1016/j.scitotenv.2021.147543, 2021.
Gulev, S. K., Thorne, P. W., Ahn, J., Dentener, F. J., Domingues, C. M., Gerland, S., Gong, D., Kaufman, D. S., Nnamchi, H. C., Quaas, J., Rivera, J. A., Sathyendranath, S., Smith, S. L., Trewin, B., von Schuckmann, K., and Vose, R. S.: Chapter 2: Changing State of the Climate System., in: Climate Change 2021: The Physical Science Basis. Contribution of Working Group I to the Sixth Assessment Report of the Intergovernmental Panel on Climate Change, edited by: Masson-Delmotte, V. , Zhai, P., Pirani, A., Connors, S. L., Péan, C., Berger, S., Caud, N., Chen, Y., Goldfarb, L., Gomis, M. I., Huang, M., Leitzell, K., Lonnoy, E., Matthews, J. B. R., Maycock, T. K., Waterfield, T., Yelekçi, O., Yu, R., and Zhou, B. Cambridge University Press, Cambridge, United Kingdom and New York, NY, USA, 287–422, https://doi.org/10.1017/9781009157896.004, 2021.
Gupta, G., Venkat Ratnam, M., Madhavan, B. L., and Narayanamurthy, C. S.: Long-term trends in Aerosol Optical Depth obtained across the globe using multi-satellite measurements, Atmos. Environ., 273, 118953, https://doi.org/10.1016/j.atmosenv.2022.118953, 2022.
Hand, J. L., Gill, T. E., and Schichtel, B. A.: Spatial and seasonal variability in fine mineral dust and coarse aerosol mass at remote sites across the United States, J. Geophys. Res., 122, 3080–3097, https://doi.org/10.1002/2016JD026290, 2017.
Hand, J. L., Gill, T. E., and Schichtel, B. A.: Urban and rural coarse aerosol mass across the United States: Spatial and seasonal variability and long-term trends, Atmos. Environ., 218, 117025, https://doi.org/10.1016/j.atmosenv.2019.117025, 2019.
Hand, J. L., Prenni, A. J., and Schichtel, B. A.: Trends in Seasonal Mean Speciated Aerosol Composition in Remote Areas of the United States From 2000 Through 2021, J. Geophys. Res.-Atmos., 129, e2023JD039902, https://doi.org/10.1029/2023JD039902, 2024.
Hansen, J. and Nazarenko, L.: Soot climate forcing via snow and ice albedos, P. Natl. Acad. Sci. USA, 101, 423–428, doi/10.1073/pnas.ss37157100, 2004.
Heald, C., Ridley, D., Kreidenweis, S., and Drury, E.: Satellite observations cap the atmospheric organic aerosol budget, Geophys. Res. Lett., 37, L24808, https://doi.org/10.1029/2010GL045095, 2010.
Heimburger, A., Losno, R., Triquet, S., Dulac, F., and Mahowald, N.: Direct measurement of atmospheric iron, cobalt and aluminum-derived dust deposition at Kerguelen Islands, Global Biogeochem. Cy., 26, https://doi.org/10.1029/2012GB004301, 2012.
Henriksson, S. V., Laaksonen, A., Kerminen, V.-M., Räisänen, P., Järvinen, H., Sundström, A.-M., and de Leeuw, G.: Spatial distributions and seasonal cycles of aerosols in India and China seen in global climate-aerosol model, Atmos. Chem. Phys., 11, 7975–7990, https://doi.org/10.5194/acp-11-7975-2011, 2011.
Herut, B. and Krom, M.: Atmospheric input of nutrients and dust to the SE Mediterranean, in: The Impact of Desert Dust Across the Mediterranean, edited by: Guerzoni, S. and Chester, R., 349–360, ISBN 9780792342946, 1996.
Herut, B., Nimmo, M., Medway, A., Chester, R., and Krom, M.D.: Dry atmospheric inputs of trace metals at the Mediterranean coast of Israel (SE Mediterranean): sources and fluxes, Atmos. Environ., 35, 803–813, 2001.
Hinds, W. C.: Aerosol Technology, Properties, Behavior and Measurement of Airborne Particles, John Wiley, New York, ISBN 9780471194101, 1999.
Holben, B. N., Tanre, D., Smirnov, A., ECK, T. F., Slutsker, I., Abuhassan, N., Newcomb, W. W., Schafer, J. S., Chatenet, B., Lavenu, F., Kaufman, Y. J., Vande Castle, J., O'Neill, N. T., Pietras, C., Pinker, R. T., Voss, K., and Zibordi, G.: An emerging ground-based aerosol climatology: Aerosol optical depth from AERONET, J. Geophys. Res., 106, 12067–12097, 2001.
Hsu, C. Y., Chiang, H. C., Lin, S. L., Chen, M. J., Lin, T. Y., and Chen, Y. C.: Elemental characterization and source apportionment of PM10 and PM2.5 in the western coastal area of central Taiwan, Sci. Total Environ., 541, 1139–1150, https://doi.org/10.1016/j.scitotenv.2015.09.122, 2016.
Huang, Y., Adebiyi, A. A., Formenti, P., and Kok, J. F.: Linking the Different Diameter Types of Aspherical Desert Dust Indicates That Models Underestimate Coarse Dust Emission, Geophys. Res. Lett., 48, e2020GL092054, https://doi.org/10.1029/2020GL092054, 2021.
Hueglin, C., Gehrig, R., Baltensperger, U., Gysel, M., Monn, C., and Vonmont, H.: Chemical characterisation of PM2.5, PM10 and coarse particles at urban, near-city and rural sites in Switzerland, Atmos. Environ., 39, 637–651, https://doi.org/10.1016/j.atmosenv.2004.10.027, 2005.
Huneeus, N., Schulz, M., Balkanski, Y., Griesfeller, J., Prospero, J., Kinne, S., Bauer, S., Boucher, O., Chin, M., Dentener, F., Diehl, T., Easter, R., Fillmore, D., Ghan, S., Ginoux, P., Grini, A., Horowitz, L., Koch, D., Krol, M. C., Landing, W., Liu, X., Mahowald, N., Miller, R., Morcrette, J.-J., Myhre, G., Penner, J., Perlwitz, J., Stier, P., Takemura, T., and Zender, C. S.: Global dust model intercomparison in AeroCom phase I, Atmos. Chem. Phys., 11, 7781–7816, https://doi.org/10.5194/acp-11-7781-2011, 2011.
Hurrell, J. W., Holland, M. M., Gent, P. R., Ghan, S., Kay, J. E., Kushner, P. J., Lamarque, J.-F., Large, W. G., Lawrence, D., Lindsay, K., Lipscomb, W. H., Long, M. C., Mahowald, N., Marsh, D. R., Neale, R. B., Rasch, P., Vavrus, S., Vertenstein, M., Bader, D., Collins, W. D., Hack, J. J., Kiehl, J., and Marshall, S.: The community earth system model: A framework for collaborative research, B. Am. Meteor. Soc., 94, 1339–1360, https://doi.org/10.1175/BAMS-D-12-00121.1, 2013.
IPCC: Summary for Policymakers, in: Climate Change 2021: The Physical Science Basis. Contribution of Working Group I to the Sixth Assessment Report of the Intergovernmental Panel on Climate Change, edited by: Masson-Delmotte, V. , P., Zhai, A., Pirani, S.L., Connors, C., Péan, S., Berger, N., Caud, Y,. Chen, L., Goldfarb, M. I., Gomis, M., Huang, K., Leitzell, E., Lonnoy, J. B. R., Matthews, T. B. R., Maycock, T. K., Waterfield, T., Yelekçi, O., Yu, R., and Zhou B., Cambridge University Press, Cambridge, UK, 3–32, https://doi.org/10.1017/9781009157896.001, 2021.
Jaenicke, R.: Abundance of cellular material and proteins in the atmosphere, Science, 308, 73, https://doi.org/10.1126/science.1106335, 2005.
Jensen, J. B. and Lee, S.: Giant sea-salt aerosols and warm rain formation in marine stratocumulus, J. Atmos. Sci., 65, 3678–3694, https://doi.org/10.1175/2008JAS2617.1, 2008.
Kahn, R. A., Gaitley, B., Martonchik, J., Diner, D. J., Crean, K., and Holben, B.: MISR global aerosol optical depth validation based on two years of coincident AERONET observations, J. Geophys. Res., 110, https://doi.org/10.1029/2004JD004706, 2005.
Kalivitis, N., Gerasopoulos, E., Vrekoussis, M., Kouvarakis, G., Kubilay, N., Hatzianastassiou, N., Vardavas, I., and Mihalopoulos, N.: Dust transport over the eastern Mediterranean derived from Total Ozone Mapping Spectrometer, Aerosol Robotic Network, and surface measurements, J. Geophys. Res., 112, D03202, https://doi.org/10.1029/2006JD007510, 2007.
Kaly, F., Marticorena, B., Chatenet, B., Rajot, J. L., Janicot, S., Niang, A., Yahi, H., Thiria, S., Maman, A., Zakou, A., Coulibaly, B. S., Coulibaly, M., Koné, I., Traoré, S., Diallo, A., and Ndiaye, T.: Variability of mineral dust concentrations over West Africa monitored by the Sahelian Dust Transect, Atmos. Res., 164–165, 226–241, https://doi.org/10.1016/j.atmosres.2015.05.011, 2015.
Kanakidou, M., Seinfeld, J. H., Pandis, S. N., Barnes, I., Dentener, F. J., Facchini, M. C., Van Dingenen, R., Ervens, B., Nenes, A., Nielsen, C. J., Swietlicki, E., Putaud, J. P., Balkanski, Y., Fuzzi, S., Horth, J., Moortgat, G. K., Winterhalter, R., Myhre, C. E. L., Tsigaridis, K., Vignati, E., Stephanou, E. G., and Wilson, J.: Organic aerosol and global climate modelling: a review, Atmos. Chem. Phys., 5, 1053–1123, https://doi.org/10.5194/acp-5-1053-2005, 2005.
Kanakidou, M., Myriokefalitakis, S., Daskalakis, N., Fanourgakis, G., Nenes, A., Baker, A., Tsigardis, K., and Mihalopoulos, N.: Past, present and future atmospheric nitrogen deposition, J. Atmos. Sci., 73, 2039–2047, https://doi.org/10.1175/JAS-D-15-0278.1, 2016.
Kanakidou, M., Myriokefalitakis S., and Tsigaridis K.: Aerosols in atmospheric chemistry and biogeochemical cycles of nutrients, Environ. Res. Lett., 13, 063004, https://doi.org/10.1088/1748-9326/aabcdb, 2018.
Karydis, V. A., Tsimpidi, A. P., Bacer, S., Pozzer, A., Nenes, A., and Lelieveld, J.: Global impact of mineral dust on cloud droplet number concentration, Atmos. Chem. Phys., 17, 5601–5621, https://doi.org/10.5194/acp-17-5601-2017, 2017.
Ke, Z., Liu, X., Wu, M., Shan, Y., and Shi, Y.: Improved Dust Representation and Impacts on Dust Transport and Radiative Effect in CAM5, J. Adv. Model. Earth Sy., 14, e2021MS002845, https://doi.org/10.1029/2021MS002845, 2022.
Klimont, Z., Kupiainen, K., Heyes, C., Purohit, P., Cofala, J., Rafaj, P., Borken-Kleefeld, J., and Schöpp, W.: Global anthropogenic emissions of particulate matter including black carbon, Atmos. Chem. Phys., 17, 8681–8723, https://doi.org/10.5194/acp-17-8681-2017, 2017.
Koch, D., Schulz, M., Kinne, S., McNaughton, C., Spackman, J. R., Balkanski, Y., Bauer, S., Berntsen, T., Bond, T. C., Boucher, O., Chin, M., Clarke, A., De Luca, N., Dentener, F., Diehl, T., Dubovik, O., Easter, R., Fahey, D. W., Feichter, J., Fillmore, D., Freitag, S., Ghan, S., Ginoux, P., Gong, S., Horowitz, L., Iversen, T., Kirkevåg, A., Klimont, Z., Kondo, Y., Krol, M., Liu, X., Miller, R., Montanaro, V., Moteki, N., Myhre, G., Penner, J. E., Perlwitz, J., Pitari, G., Reddy, S., Sahu, L., Sakamoto, H., Schuster, G., Schwarz, J. P., Seland, Ø., Stier, P., Takegawa, N., Takemura, T., Textor, C., van Aardenne, J. A., and Zhao, Y.: Evaluation of black carbon estimations in global aerosol models, Atmos. Chem. Phys., 9, 9001–9026, https://doi.org/10.5194/acp-9-9001-2009, 2009.
Kok, J. F., Mahowald, N. M., Fratini, G., Gillies, J. A., Ishizuka, M., Leys, J. F., Mikami, M., Park, M.-S., Park, S.-U., Van Pelt, R. S., and Zobeck, T. M.: An improved dust emission model – Part 1: Model description and comparison against measurements, Atmos. Chem. Phys., 14, 13023–13041, https://doi.org/10.5194/acp-14-13023-2014, 2014a.
Kok, J. F., Albani, S., Mahowald, N. M., and Ward, D. S.: An improved dust emission model – Part 2: Evaluation in the Community Earth System Model, with implications for the use of dust source functions, Atmos. Chem. Phys., 14, 13043–13061, https://doi.org/10.5194/acp-14-13043-2014, 2014b.
Kok, J. F., Ridley, D. A., Zhou, Q., Miller, R. L., Zhao, C., Heald, C. L., Ward, D. S., Albani, S., and Haustein, K.: Smaller desert dust cooling effect estimated from analysis of dust size and abundance, Nat. Geosci., 10, 274–278, https://doi.org/10.1038/ngeo2912, 2017.
Kok, J. F., Adebiyi, A. A., Albani, S., Balkanski, Y., Checa-Garcia, R., Chin, M., Colarco, P. R., Hamilton, D. S., Huang, Y., Ito, A., Klose, M., Leung, D. M., Li, L., Mahowald, N. M., Miller, R. L., Obiso, V., Pérez García-Pando, C., Rocha-Lima, A., Wan, J. S., and Whicker, C. A.: Improved representation of the global dust cycle using observational constraints on dust properties and abundance, Atmos. Chem. Phys., 21, 8127–8167, https://doi.org/10.5194/acp-21-8127-2021, 2021.
Kok, J. F., Storelvmo, T., Karydis, V. A., Adebiyi, A. A., Mahowald, N. M., Evan, A. T., He, C., and Leung, D. M.: Mineral dust aerosol impacts on global climate and climate change, Nat. Rev. Earth Environ., 4, 71–86, https://doi.org/10.1038/s43017-022-00379-5, 2023.
Kubilay, N., Nickovic, S., Moulin, C., and Dulac, F.: An illustration of the transport and deposition of mineral dust onto the eastern Mediterranean, Atmos. Environ., 34, 1293–1303, 2000.
Kyllönen, K., Vestenius, M., Anttila, P., Makkonen, U., Aurela, M., Wängberg, I., Nerentorp Mastromonaco, M., and Hakola, H.: Trends and source apportionment of atmospheric heavy metals at a subarctic site during 1996–2018, Atmos. Environ., 236, 117644, https://doi.org/10.1016/j.atmosenv.2020.117644, 2020.
Laing, J. R., Hopke, P. K., Hopke, E. F., Husain, L., Dutkiewicz, V. A., Paatero, J., and Viisanen, Y.: Long-term particle measurements in finnish arctic: Part I – Chemical composition and trace metal solubility, Atmos. Environ., 88, 275–284, https://doi.org/10.1016/j.atmosenv.2014.03.002, 2014a.
Laing, J. R., Hopke, P. K., Hopke, E. F., Husain, L., Dutkiewicz, V. A., Paatero, J., and Viisanen, Y.: Long-term particle measurements in finnish arctic: Part II - trend analysis and source location identification, Atmos. Environ., 88, 285–296, https://doi.org/10.1016/j.atmosenv.2014.01.015, 2014b.
Laj, P., Bigi, A., Rose, C., Andrews, E., Lund Myhre, C., Collaud Coen, M., Lin, Y., Wiedensohler, A., Schulz, M., Ogren, J. A., Fiebig, M., Gliß, J., Mortier, A., Pandolfi, M., Petäja, T., Kim, S.-W., Aas, W., Putaud, J.-P., Mayol-Bracero, O., Keywood, M., Labrador, L., Aalto, P., Ahlberg, E., Alados Arboledas, L., Alastuey, A., Andrade, M., Artíñano, B., Ausmeel, S., Arsov, T., Asmi, E., Backman, J., Baltensperger, U., Bastian, S., Bath, O., Beukes, J. P., Brem, B. T., Bukowiecki, N., Conil, S., Couret, C., Day, D., Dayantolis, W., Degorska, A., Eleftheriadis, K., Fetfatzis, P., Favez, O., Flentje, H., Gini, M. I., Gregorič, A., Gysel-Beer, M., Hallar, A. G., Hand, J., Hoffer, A., Hueglin, C., Hooda, R. K., Hyvärinen, A., Kalapov, I., Kalivitis, N., Kasper-Giebl, A., Kim, J. E., Kouvarakis, G., Kranjc, I., Krejci, R., Kulmala, M., Labuschagne, C., Lee, H.-J., Lihavainen, H., Lin, N.-H., Löschau, G., Luoma, K., Marinoni, A., Martins Dos Santos, S., Meinhardt, F., Merkel, M., Metzger, J.-M., Mihalopoulos, N., Nguyen, N. A., Ondracek, J., Pérez, N., Perrone, M. R., Petit, J.-E., Picard, D., Pichon, J.-M., Pont, V., Prats, N., Prenni, A., Reisen, F., Romano, S., Sellegri, K., Sharma, S., Schauer, G., Sheridan, P., Sherman, J. P., Schütze, M., Schwerin, A., Sohmer, R., Sorribas, M., Steinbacher, M., Sun, J., Titos, G., Toczko, B., Tuch, T., Tulet, P., Tunved, P., Vakkari, V., Velarde, F., Velasquez, P., Villani, P., Vratolis, S., Wang, S.-H., Weinhold, K., Weller, R., Yela, M., Yus-Diez, J., Zdimal, V., Zieger, P., and Zikova, N.: A global analysis of climate-relevant aerosol properties retrieved from the network of Global Atmosphere Watch (GAW) near-surface observatories, Atmos. Meas. Tech., 13, 4353–4392, https://doi.org/10.5194/amt-13-4353-2020, 2020.
Landrigan, P. J., Fuller, R., Acosta, N. J. R., Adeyi, O., Arnold, R., Basu, N., Baldé, A. B., Bertollini, R., Bose-O’Reilly, S., Boufford, J. I., Breysse, P. N., Chiles, T., Mahidol, C., Coll-Seck, A. M., Cropper, M. L., Fobil, J., Fuster, V., Greenstone, M., Haines, A., Hanrahan, D., Hunter, D., Khare, M., Krupnick, A., Lanphear, B., Lohani, B., Martin, K., Mathiasen, K. V., McTeer, M. A., Murray, C. J. L., Ndahimananjara, J. D., Perera, F., Potočnik, J., Preker, A. S., Ramesh, J., Rockström, J., Salinas, C., Samson, L. D., Sandilya, K., Sly, P. D., Smith, K. R., Steiner, A., Stewart, R. B., Suk, W. A., van Schayck, O. C. P., Yadama, G. N., Yumkella, K., and Zhong, M.: The Lancet Commission on pollution and health, Lancet, 391, 462–512, https://doi.org/10.1016/S0140-6736(17)32345-0, 2018.
Lelieveld, J., Klingmüller, K., Pozzer, A., Burnett, R. T., Haines, A., and Ramanathan, V.: Effects of fossil fuel and total anthropogenic emission removal on public health and climate, P. Natl. Acad. Sci. USA, 116, 7192–7197, https://doi.org/10.1073/pnas.1819989116, 2019.
Li, J., Carlson, B. E., Yung, Y. L., Lv, D., Hansen, J., Penner, J. E., Liao, H., Ramaswamy, V., Kahn, R. A., Zhang, P., Dubovik, O., Ding, A., Lacis, A. A., Zhang, L., and Dong, Y.: Scattering and absorbing aerosols in the climate system, Nat. Rev. Earth Environ., 3, 363–379, https://doi.org/10.1038/s43017-022-00296-7, 2022.
Li, L., Mahowald, N. M., Miller, R. L., Pérez García-Pando, C., Klose, M., Hamilton, D. S., Gonçalves Ageitos, M., Ginoux, P., Balkanski, Y., Green, R. O., Kalashnikova, O., Kok, J. F., Obiso, V., Paynter, D., and Thompson, D. R.: Quantifying the range of the dust direct radiative effect due to source mineralogy uncertainty, Atmos. Chem. Phys., 21, 3973–4005, https://doi.org/10.5194/acp-21-3973-2021, 2021.
Li, L., Mahowald, N. M., Kok, J. F., Liu, X., Wu, M., Leung, D. M., Hamilton, D. S., Emmons, L. K., Huang, Y., Sexton, N., Meng, J., and Wan, J.: Importance of different parameterization changes for the updated dust cycle modeling in the Community Atmosphere Model (version 6.1), Geosci. Model Dev., 15, 8181–8219, https://doi.org/10.5194/gmd-15-8181-2022, 2022.
Li, L., Mahowald, N. M., Liu, X., Ke, Z., Leung, D. M., Kok, F., Gonçalves Ageitos, M., Pérez García-Pando, C., Miller, R. L., Obiso, V., Formenti, P., Albani, S., Adebiyi, A. A., Di, C., Brodrick, P. G., Thompson, D. R., Green, R. O., and Clark, R. N.: Modeling Large Dust Aerosols in the Community Earth System Model, J. Adv. Model. Earth Sy., in preparation, 2025.
Lim, S. S., Vos, T., Flaxman, A. D., Danaei, G., Shibuya, K., Adair-Rohani, H., and AlMazroa, M.: A comparative risk assessment of burden of disease and injury attributable to 67 risk factors and risk factor clusters in 21 regions, 1990–2010: A systematic analysis for the Global Burden of Disease Study 2010, Lancet, 380, 2224–2260, 2012.
Liu, X., Easter, R. C., Ghan, S. J., Zaveri, R., Rasch, P., Shi, X., Lamarque, J.-F., Gettelman, A., Morrison, H., Vitt, F., Conley, A., Park, S., Neale, R., Hannay, C., Ekman, A. M. L., Hess, P., Mahowald, N., Collins, W., Iacono, M. J., Bretherton, C. S., Flanner, M. G., and Mitchell, D.: Toward a minimal representation of aerosols in climate models: description and evaluation in the Community Atmosphere Model CAM5, Geosci. Model Dev., 5, 709–739, https://doi.org/10.5194/gmd-5-709-2012, 2012.
Liu, X., Ma, P.-L., Wang, H., Tilmes, S., Singh, B., Easter, R. C., Ghan, S. J., and Rasch, P. J.: Description and evaluation of a new four-mode version of the Modal Aerosol Module (MAM4) within version 5.3 of the Community Atmosphere Model, Geosci. Model Dev., 9, 505–522, https://doi.org/10.5194/gmd-9-505-2016, 2016.
Lucarelli, F., Calzolai, G., Chiari, M., Giannoni, M., Mochi, D., Nava, S., and Carraresi, L.: The upgraded external-beam PIXE/PIGE set-up at LABEC for very fast measurements on aerosol samples, Nucl. Instrum. Meth. B, 318, 55–59, https://doi.org/10.1016/j.nimb.2013.05.099, 2014.
Lucarelli, F., Barrera, V., Becagli, S., Chiari, M., Giannoni, M., Nava, S., Traversi, R., and Calzolai, G.: Combined use of daily and hourly data sets for the source apportionment of particulate matter near a waste incinerator plant, Environ. Pollut., 247, 802–811, https://doi.org/10.1016/j.envpol.2018.11.107, 2019.
Luo, C., Mahowald, N. M., and del Corral, J.: Sensitivity study of meteorological parameters on mineral aerosol mobilization, transport, and distribution, J. Geophys. Res.-Atmos., 108, https://doi.org/10.1029/2003JD003483, 2003.
Luo, J., Han, Y., Zhao, Y., Liu, X., Huang, Y., Wang, L., Chen, K., Tao, S., Liu, J., and Ma, J.: An inter-comparative evaluation of PKU-FUEL global SO2 emission inventory, Sci. Total Environ., 722, 137755, https://doi.org/10.1016/j.scitotenv.2020.137755, 2020.
Mackey, K. R. M., Hunter, D., Fischer, E. V, Jiang, Y., Allen, B., Chen, Y., Liston, A., Reuter, J., Schladow, G., and Paytan, A.: Aerosol-nutrient-induced picoplankton growth in Lake Tahoe, J. Geophys. Res. Biogeo., 118, 1054–1067, https://doi.org/10.1002/jgrg.20084, 2013.
Maenhaut, W. and Cafmeyer, J.: Long-Term Atmospheric Aerosol Study at Urban and Rural Sites in Belgium Using Multi-Elemental Analysis by Particle-Induced X-Ray Emission Spectrometry and Short-Irradiation Instrumental Neutron Activation Analysis, X-Ray Spectrom., 27, 236–246, https://doi.org/10.1002/(SICI)1097-4539(199807/08)27:4<236::AID-XRS292>3.0.CO;2-F, 1998.
Maenhaut, W., Salomonovic, R., Cafmeyer, J., Ichoku, C., Karnieli, A., and Andreae, M. O.: Anthropogenic and natural radiatively active aerosol types at Sede Boker, Israel, J. Aerosol Sci., 27, 47–48, https://doi.org/10.1016/0021-8502(96)00096-1, 1996a.
Maenhaut, W., Koppen, G., and Artaxo, P.: Long-term atmospheric aerosol study in Cuiaba, Brazil: Multielemental composition, sources, and impact of biomass burning, in: Biomass Burning and Global Change, vol. 2, Biomass Burning in South America, Southeast Asia, and Temperate and Boreal Ecosystems, and the Oil Fires of Kuwait, edited by: Levine, J. S., MIT Press, Cambridge Massachusetts, 637–652, ISBN 978-0262122023, 1996b.
Maenhaut, W., Salma, I., Cafmeyer, J., Annegard, H., and Andreae, M.: Regional atmospheric aerosol composition and sources in the eastern Transvaal, South Africa and impact of biomass burning, J. Geophys. Res., 101, 23631–23650, 1996c.
Maenhaut, W., Francois, F., Cafmeyer, J., Gilot, C., and Hanssen, J. E.: Long-term aerosol study in southern Norway, and the relationship of aerosol components to source, in: Proceedings of EUROTRAC Symposium `96, vol. 1, Clouds, Aerosols, Modelling and Photo-oxidants, edited by: Borrell, P. M., Comput. Mech. Publ., South Hampton, UK, 277–280, ISBN 9781853124969, 1997a.
Maenhaut, W., Cafmeyer, J., Ptasinski, J., Andreae, M. O., Andreae, T. W., Elbert, W., Meixner, F. X., Karnieli, A., and Ichoku, C.: Chemical composition and light scattering of the atmospheric aerosol at a remote site in the Negev desert, Israel, J. Aerosol Sci., 28, 73–74, 1997b.
Maenhaut, W., Fernandez-Jimenez, M.-T., and Artaxo, P.: Long-term study of atmospheric aerosols in Cuiaba, Brazil: Multielemental composition, sources and source apportionment, J. Aerosol Sci., 30, 259–260, 1999.
Maenhaut, W., Fernandez-Jimenez, M.-T., Vanderzalm, J. L., Hooper, B., Hooper, M. A., and Tapper, N. J.: Aerosol composition at Jabiru, Australia, and impact of biomass burning, J. Aerosol Sci., 31, 745–746, https://doi.org/10.1016/S0021-8502(00)90755-9, 2000a.
Maenhaut, W., Fernandez-Jimenez, M.-T., Rajta, I., Dubtsov, S., Meixner, F. X., Andreae, M. O., Torr, S., Hargrove, J. W., Chimanga, P., and Mlambo, J.: Long-term aerosol composition measurements and source apportionment at Rukomechi, Zimbabwe, J. Aerosol Sci., 31, 228–229, https://doi.org/10.1016/S0021-8502(00)90237-4, 2000b.
Maenhaut, W., De Ridder, D. J. A., Fernandez-Jimenez, M.-T., Hooper, M. A., Hooper, B., and Nurhayati, M.: Long-term observations of regional aerosol composition at two sites in Indonesia, Nucl. Instrum. Meth. B., 189, 259–265, https://doi.org/10.1016/S0168-583X(01)01054-0, 2002a.
Maenhaut, W., Fernandez-Jimenez, M.-T., Rajta, I., and Artaxo, P.: Two-year study of atmospheric aerosol particles in Alta Floresta, Brazil: Multielemental composition and source apportionment, Nucl. Instrum. Meth. B, 189, 243–248, 2002b.
Maenhaut, W., Raes, N., Chi, X., Cafmeyer, J., Wang, W., and Salma, I.: Chemical composition and mass closure for fine and coarse aerosols at a kerbside in Budapest, Hungary, in spring 2002, X-Ray Spectrom., 34, 290–296, https://doi.org/10.1002/xrs.820, 2005.
Maenhaut, W., Raes, N., Chi, X., Cafmeyer, J., and Wang, W.: Chemical composition and mass closure for PM2.5 and PM10 aerosols at K-puszta, Hungary, in summer 2006, X-Ray Spectrom., 37, 193–197, https://doi.org/10.1002/xrs.1062, 2008.
Maenhaut, W., Nava, S., Lucarelli, F., Wang, W., Chi, X., and Kulmala, M.: Chemical composition, impact from biomass burning, and mass closure for PM2.5 and PM10 aerosols at Hyytiälä, Finland, in summer 2007, X-Ray Spectrom., 40, 168–171, https://doi.org/10.1002/xrs.1302, 2011.
Mahowald, N., Lamarque, J.-F., Tie, X., and Wolff, E.: Sea salt aerosol response to climate change: last glacial maximum, pre-industrial, and doubled-carbon dioxide climates, J. Geophys. Res., 111, D05303, https://doi.org/10.1029/2005JD006459, 2006.
Mahowald, N., Jickells, T. D., Baker, A. R., Artaxo, P., Benitez-Nelson, C. R., Bergametti, G., Bond, T. C., Chen, Y., Cohen, D. D., Herut, B., Kubilay, N., Losno, R., Luo, C., Maenhaut, W., McGee, K. A., Okin, G. S., Siefert, R. L., and Tsukuda, S.: Global distribution of atmospheric phosphorus sources, concentrations and deposition rates, and anthropogenic impacts, Global Biogeochem. Cy., 22, https://doi.org/10.1029/2008GB003240, 2008.
Mahowald, N. M., Engelstaedter, S., Luo, C., Sealy, A., Artaxo, P., Benitez-Nelson, C., Bonnet, S., Chen, Y., Chuang, P. Y., Cohen, D., Dulac, F., Herut, B., Johansen, A. M., Kubilay, N., Losno, R., Maenhaut, W., Paytan, A., Prospero, J. M., Shank, L. M., and Siefert, R. L.: Atmospheric Iron Deposition: Global Distribution, Variability, and Human Perturbations, Annu. Rev. Mar. Sci., 1, 245–278, https://doi.org/10.1146/annurev.marine.010908.163727, 2009.
Mahowald, N. M., Kloster, S., Engelstaedter, S., Moore, J. K., Mukhopadhyay, S., McConnell, J. R., Albani, S., Doney, S. C., Bhattacharya, A., Curran, M. A. J., Flanner, M. G., Hoffman, F. M., Lawrence, D. M., Lindsay, K., Mayewski, P. A., Neff, J., Rothenberg, D., Thomas, E., Thornton, P. E., and Zender, C. S.: Observed 20th century desert dust variability: impact on climate and biogeochemistry, Atmos. Chem. Phys., 10, 10875–10893, https://doi.org/10.5194/acp-10-10875-2010, 2010.
Mahowald, N., Ward, D. S., Kloster, S., Flanner, M. G., Heald, C. L., Heavens, N. G., Hess, P. G., Lamarque, J.-F., and Chuang, P. Y.: Aerosol Impacts on Climate and Biogeochemistry, Annu. Rev. Env. Resour., 36, 45–74, https://doi.org/10.1146/annurev-environ-042009-094507, 2011.
Mahowald, N., Albani, S., Kok, J. F., Engelstaeder, S., Scanza, R., Ward, D. S., and Flanner, M. G.: The size distribution of desert dust aerosols and its impact on the Earth system, Aeolian Res., 15, 53–71, https://doi.org/10.1016/j.aeolia.2013.09.002, 2014.
Mahowald, N. M., Scanza, R., Brahney, J., Goodale, C. L., Hess, P. G., Moore, J. K., and Neff, J.: Aerosol Deposition Impacts on Land and Ocean Carbon Cycles, Curr. Clim. Change Rep., 3, 16–31, https://doi.org/10.1007/s40641-017-0056-z, 2017.
Mahowald, N. M., Hamilton, D. S., Mackey, K. R. M., Moore, J. K., Baker, A. R., Scanza, R., and Zhang, Y.: Aerosol trace metal deposition dissolution and impacts on marine microorganisms and biogeochemistry, Nat. Commun., 81, 1–15, https://doi.org/10.1038/s41467-018-04970-7, 2018.
Mahowald, N., Li, L., Vira, J., Prank, M., Hamilton, D. S., Matsui, H., Miller, R. L., Lu, L., Akyuz, E. A., Daphne, M., Hess, P., Lihavainen, H., Wiedinmyer, C., Hand, J., Alaimo, M. G., Alves, C., Alastuey, A., Artaxo, P., Barreto, A., Barraza, F., Becagli, S., Calzolai, G., Chellam., S., Chen, Y., Chuang, P., Cohen, D. Colombi, C., Diapouli, E. Dongarra, G., Eleftheriadis, K., Galy-Lacaux, C., Gaston, C., Gomez, D., Gonzalez Ramos, Y., Hakola, H., Harrison, R., Heyes, C., Herut, B., Hopke, P., Huglin, C., Kanakidou, M., Kertesz, Z., Klimont, Z., Kyllonen, K., Lambert, F., Liu, X., Losno, R., Lucarelli, F., Maenhaut, W., Marticorena, B., Martin, R., Mihalopoulos, N., Morera-Gomez, Y. Paytan, A., Prospero, J., Rodriguez, S., Smichowski, P., Varrica, D., Walsh, B. Weagle, C., and Zhao, X.: Datasets for: AERO-MAP: A data compilation and modelling approach to understand the fine and coarse mode aerosol composition (January 4, 2024 version), Zenodo [data set], https://doi.org/10.5281/zenodo.10459653, 2024.
Malm, W., Pitchford, M., McDade, C., and Ashbaugh, L.: Coarse particle speciation at selected locations in the rural continental United States, Atmos. Environ., 41, 225–2239, 2007.
Marshak, A., Ackerman, A., da Silva, A. M., Eck, T., Holben, B., Kahn, R., Kleidman, R., Knobelspiesse, K., Levy, R., Lyapustin, A., Oreopoulos, L., Remer, L., Torres, O., Várnai, T., Wen, G., and Yorks, J.: Aerosol properties in cloudy environments from remote sensing observations. A review of the current state of knowledge. B. Am. Meteor. Soc., 102, E2177–E2197, https://doi.org/10.1175/BAMS-D-20-0225.1, 2021.
Mbengue, S., Zikova, N., Schwarz, J., Vodička, P., Šmejkalová, A. H., and Holoubek, I.: Mass absorption cross-section and absorption enhancement from long term black and elemental carbon measurements: A rural background station in Central Europe, Sci. Total Environ., 794, 148365, https://doi.org/10.1016/j.scitotenv.2021.148365, 2021.
Marticorena, B., Chatenet, B., Rajot, J. L., Traoré, S., Coulibaly, M., Diallo, A., Koné, I., Maman, A., NDiaye, T., and Zakou, A.: Temporal variability of mineral dust concentrations over West Africa: analyses of a pluriannual monitoring from the AMMA Sahelian Dust Transect, Atmos. Chem. Phys., 10, 8899–8915, https://doi.org/10.5194/acp-10-8899-2010, 2010.
Matsui, H. and Mahowald, N.: Development of a global aerosol model using a two-dimensional sectional method: 2. Evaluation and sensitivity simulations, J. Adv. Model. Earth Sy., 9, 1887–1920, https://doi.org/10.1002/2017MS000937, 2017.
McNeill, J., Snider, G., Weagle, C. L., Walsh, B., Bissonnette, P., Stone, E., Abboud, I., Akoshile, C., Anh, N. X., Balasubramanian, R., Brook, J. R., Coburn, C., Cohen, A., Dong, J., Gagnon, G., Garland, R. M., He, K., Holben, B. N., Kahn, R., Kim, J. S., Lagrosas, N., Lestari, P., Liu, Y., Jeba, F., Joy, K. S., Martins, J. V., Misra, A., Norford, L. K., Quel, E. J., Salam, A., Schichtel, B., Tripathi, S. N., Wang, C., Zhang, Q., Brauer, M., Gibson, M. D., Rudich, Y., and Martin, R. V.: Large global variations in measured airborne metal concentrations driven by anthropogenic sources, Sci. Rep., 10, 21817, https://doi.org/10.1038/s41598-020-78789-y, 2020.
Mihalopoulos, N., Stephanou, E., Kanakidou, M., Pilitsidis, S., and Bousquet, P.: Tropospheric aerosol ionic composition above the Eastern Mediterranean Area, Tellus B, 49B, 314–326, 1997.
Millet, D. B., Palmer, P. I., Levelt, P. F., Gallardo, L., and Shikwambana, L.: Coordinated Geostationary, Multispectral Satellite Observations Are Critical for Climate and Air Quality Progress, AGU Advances, John Wiley and Sons Inc., https://doi.org/10.1029/2024AV001322, 2024.
Mirante, F., Oliveira C., Martins N., Pio C., Caseiro A., Cerqueira M., Alves C., Oliveira C., Oliveira J., Camões F., Matos M., and Silva H.: Carbonaceous content of atmospheric aerosols in Lisbon urban atmosphere, European Geophysical Union General Assembly, 2–7 May, Vienna, Austria, 12, EGU2010-11552-2, 2010.
Mirante, F., Alves, C., Pio, C., Pindado, O., Perez, R., Revuelta, M. A., and Artiñano, B.: Organic composition of size segregated atmospheric particulate matter, during summer and winter sampling campaigns at representative sites in Madrid, Spain, Atmos. Res., 132–133, 345–361, https://doi.org/10.1016/j.atmosres.2013.07.005, 2013.
Mkoma, S. L.: Physico-chemical characterisation of atmospheric aerosols in Tanzania, with emphasis on the carbonaceous aerosol components and on chemical mass closure, Ghent University, Ghent, Belgium, ISBN 978-90-5989-230-9, 2008.
Mkoma, S. L., Maenhaut, W., Chi, X., Wang, W., and Raes, N.: Characterisation of PM10 atmospheric aerosols for the wet season 2005 at two sites in East Africa, Atmos. Environ., 43, 631–639, https://doi.org/10.1016/j.atmosenv.2008.10.008, 2009.
Morera-Gómez, Y., Elustondo, D., Lasheras, E., Alonso-Hernández, C. M., and Santamaría, J. M.: Chemical characterization of PM10 samples collected simultaneously at a rural and an urban site in the Caribbean coast: Local and long-range source apportionment, Atmos. Environ., 192, 182–192, https://doi.org/10.1016/j.atmosenv.2018.08.058, 2018.
Morera-Gómez, Y., Santamaría, J. M., Elustondo, D., Lasheras, E., and Alonso-Hernández, C. M.: Determination and source apportionment of major and trace elements in atmospheric bulk deposition in a Caribbean rural area, Atmos. Environ., 202, 93–104, https://doi.org/10.1016/j.atmosenv.2019.01.019, 2019.
Mortier, A., Gliß, J., Schulz, M., Aas, W., Andrews, E., Bian, H., Chin, M., Ginoux, P., Hand, J., Holben, B., Zhang, H., Kipling, Z., Kirkevåg, A., Laj, P., Lurton, T., Myhre, G., Neubauer, D., Olivié, D., von Salzen, K., Skeie, R. B., Takemura, T., and Tilmes, S.: Evaluation of climate model aerosol trends with ground-based observations over the last 2 decades – an AeroCom and CMIP6 analysis, Atmos. Chem. Phys., 20, 13355–13378, https://doi.org/10.5194/acp-20-13355-2020, 2020.
Murray, C. J. L., Aravkin, A. Y., Zheng, P., Abbafati, C., Abbas, K. M., Abbasi-Kangevari, M., et al.: Global burden of 87 risk factors in 204 countries and territories, 1990–2019: a systematic analysis for the Global Burden of Disease Study 2019, Lancet, 396, 1223–1249, https://doi.org/10.1016/S0140-6736(20)30752-2, 2020.
Nava, S., Lucarelli, F., Amato, F., Becagli, S., Calzolai, G., Chiari, M., Giannoni, M., Traversi, R., and Udisti, R.: Biomass burning contributions estimated by synergistic coupling of daily and hourly aerosol composition records, Sci. Total Environ., 511, 11–20, https://doi.org/10.1016/j.scitotenv.2014.11.034, 2015.
Nava, S., Calzolai, G., Chiari, M., Giannoni, M., Giardi, F., Becagli, S., Severi, M., Traversi, R., and Lucarelli, F.: Source apportionment of PM2.5 in Florence (Italy) by PMF analysis of aerosol composition records, Atmosphere, 11, 484, https://doi.org/10.3390/ATMOS11050484, 2020.
Neff, J., Reynolds, M. P., Munson, S., Fernandez, D., and Belnap, J.: The role of dust storms in total atmospheric particle concentration at two sites in the western U.S., J. Geophys. Res., 118, 11201–11212, 2013.
Nenes, A., Pandis, S. N., Kanakidou, M., Russell, A. G., Song, S., Vasilakos, P., and Weber, R. J.: Aerosol acidity and liquid water content regulate the dry deposition of inorganic reactive nitrogen, Atmos. Chem. Phys., 21, 6023–6033, https://doi.org/10.5194/acp-21-6023-2021, 2021.
Nyanganyura, D., Maenhaut, W., Mathutu, M., Makarau, A., and Meixner, F. X.: The chemical composition of tropospheric aerosol particles and their contributing sources to a continental background site in northern Zimbabwe from 1994 to 2000, Atmos. Environ., 41, 2644–2659, https://doi.org/10.1016/j.atmosenv.2006.11.015, 2007.
Obiso, V., Gonçalves Ageitos, M., Pérez García-Pando, C., Perlwitz, J. P., Schuster, G. L., Bauer, S. E., Di Biagio, C., Formenti, P., Tsigaridis, K., and Miller, R. L.: Observationally constrained regional variations of shortwave absorption by iron oxides emphasize the cooling effect of dust, Atmos. Chem. Phys., 24, 5337–5367, https://doi.org/10.5194/acp-24-5337-2024, 2024.
Oliveira, C.: PAHLIS Team: Atmospheric pollution in Lisbon urban atmosphere, European Geosciences Union General Assembly, 19–24 April, Vienna, Austria, 11, EGU2009-3108-3, 2009.
Oliveira, C., Pio, C., Caseiro, A., Santos, P., Nunes, T., Mao, H., Luahana, L., and Sokhi, R.: Road traffic impact on urban atmospheric aerosol loading at Oporto, Portugal, Atmos. Environ., 44, 3147–3158, https://doi.org/10.1016/j.atmosenv.2010.05.027, 2010.
Olson, J., Prather, M., Berntsen, T., Carmichael, G., Chatfield, R., Connell, P., Derwent, R., Horowitz, L., Jin, S., Kanakidou, M., Kasibhatla, P., Kotamarthi, R., Kuhn, M., Law, K., Penner, J., Perliski, L., Sillman, S., Stordal, F., Thompson, A., and Wild, O.: Results from the Intergovernmental Panel on Climatic Change Photochemical Model Intercomparison (PhotoComp), J. Geophys. Res.-Atmos., 102, 5979–5991, https://doi.org/10.1029/96JD03380, 1997.
Paulot, F., Ginoux, P., Cooke, W. F., Donner, L. J., Fan, S., Lin, M.-Y., Mao, J., Naik, V., and Horowitz, L. W.: Sensitivity of nitrate aerosols to ammonia emissions and to nitrate chemistry: implications for present and future nitrate optical depth, Atmos. Chem. Phys., 16, 1459–1477, https://doi.org/10.5194/acp-16-1459-2016, 2016.
Pérez, N., Pey, J., Querol, X., Alastuey, A., López, J. M., and Viana, M.: Partitioning of major and trace components in PM10-PM2.5-PM1 at an urban site in Southern Europe, Atmos. Environ., 42, 1677–1691, https://doi.org/10.1016/j.atmosenv.2007.11.034, 2008.
Philip, S., Martin, R. v., Snider, G., Weagle, C. L., van Donkelaar, A., Brauer, M., Henze, D. K., Klimont, Z., Venkataraman, C., Guttikunda, S. K., and Zhang, Q.: Anthropogenic fugitive, combustion and industrial dust is a significant, underrepresented fine particulate matter source in global atmospheric models, Environ. Res. Lett., 12, 1–46, 2017.
Pio, C., Rienda, I. C., Nunes, T., Gonçalves, C., Tchepel, O., Pina, N. K., Rodrigues, J., Lucarelli, F., and Alves, C. A.: Impact of biomass burning and non-exhaust vehicle emissions on PM10 levels in a mid-size non-industrial western Iberian city, Atmos. Environ., 289, 119293, https://doi.org/10.1016/j.atmosenv.2022.119293, 2022.
Pio, C. A. and Lopes, D. A.: Chlorine loss from marine aerosol in a coastal atmosphere, J. Geophys. Res.-Atmos., 103, 25263–25272, https://doi.org/10.1029/98JD02088, 1998.
Prank, M., Sofiev, M., Tsyro, S., Hendriks, C., Semeena, V., Vazhappilly Francis, X., Butler, T., Denier van der Gon, H., Friedrich, R., Hendricks, J., Kong, X., Lawrence, M., Righi, M., Samaras, Z., Sausen, R., Kukkonen, J., and Sokhi, R.: Evaluation of the performance of four chemical transport models in predicting the aerosol chemical composition in Europe in 2005, Atmos. Chem. Phys., 16, 6041–6070, https://doi.org/10.5194/acp-16-6041-2016, 2016.
Prospero, J.: The atmospheric transport of particles to the ocean, in: Particle Flux in the Ocean, edited by: Ittekkot, I., Schaffer, P., Honjo, S., and Depetris, P. J., John Wiley, New York, ISBN 978-0471960737, 1996.
Prospero, J., Bullard, J., and Hodkins, R.: High-Latitude Dust Over the North Atlantic: Inputs from Icelandic Proglacial Dust Storms, Science, 335, 1078–1082, 2012.
Prospero, J., Barkely, A., Gaston, C., Gatineau, A., Campos y Sanasano, A., and Pulcherie, K. P.: Data From: Characterizing and quantifying African dust transport and deposition to South America: Implications for the phosphorus budget in the Amazon Basin, Miami, https://doi.org/10.17604/vrsh-w974, 2020.
Prospero, J. M.: Long-range transport of mineral dust in the global atmosphere: Impact of African dust on the environment of the southeastern United States, P. Natl. Acad. Sci. USA, 96, 3396–3403, 1999.
Prospero, J. M., Uematsu, M., and Savoie, D. L.: Mineral Aerosol Transport to the Pacific Ocean, in: Chemical Oceanography, vol. 10, Academic Press Limited, 187–218, https://doi.org/10.1007/978-94-009, 1989.
Prospero, J. M., Barrett, K., Church, T., Dentener, F., Duce, R. A., Galloway, J. N., Levy, H., Moody, J., and Quinn, P.: Atmospheric deposition of nutrients to the North Atlantic Basin, Biogeochemistry, 35, 27–73, https://doi.org/10.1007/BF02179824, 1996.
Putaud, J.-P., Raes, F., Dingenen, R. Van, U. Baltensperger, Bruggemann, E., Facchini, M.-C., Decesari, S., Fuzzi, S., R. Gehrig, Huglin, C., Laj, P., Lorbeer, G., Maenhaut, W., N. Mihalopoulos, Muller, K., Querol, X., Rodriguez, S., Schneider, J., G. Spindler, ten Brink, H., Torseth, K., and Wiedensohler, A.: A European aerosol phenomenology. 2: chemical characteristics of particulate matter at kerbside, urban, rural and background sites in Europe, Atmos. Environ., 38, 2579–2595, 2004.
Putaud, J. P., Van Dingenen, R., Alastuey, A., Bauer, H., Birmili, W., Cyrys, J., Flentje, H., Fuzzi, S., Gehrig, R., Hansson, H. C., Harrison, R. M., Herrmann, H., Hitzenberger, R., Hüglin, C., Jones, A. M., Kasper-Giebl, A., Kiss, G., Kousa, A., Kuhlbusch, T. A. J., Löschau, G., Maenhaut, W., Molnar, A., Moreno, T., Pekkanen, J., Perrino, C., Pitz, M., Puxbaum, H., Querol, X., Rodriguez, S., Salma, I., Schwarz, J., Smolik, J., Schneider, J., Spindler, G., ten Brink, H., Tursic, J., Viana, M., Wiedensohler, A., and Raes, F.: A European aerosol phenomenology – 3: Physical and chemical characteristics of particulate matter from 60 rural, urban, and kerbside sites across Europe, Atmos. Environ., 44, 1308–1320, https://doi.org/10.1016/j.atmosenv.2009.12.011, 2010.
Quaas, J., Jia, H., Smith, C., Albright, A. L., Aas, W., Bellouin, N., Boucher, O., Doutriaux-Boucher, M., Forster, P. M., Grosvenor, D., Jenkins, S., Klimont, Z., Loeb, N. G., Ma, X., Naik, V., Paulot, F., Stier, P., Wild, M., Myhre, G., and Schulz, M.: Robust evidence for reversal of the trend in aerosol effective climate forcing, Atmos. Chem. Phys., 22, 12221–12239, https://doi.org/10.5194/acp-22-12221-2022, 2022.
Rasch, P. J. J., Feichter, J., Law, K., Mahowald, N., Penner, J., Benkovitz, C., Genthon, C., Giannakopoulos, C., Kasibhatla, P., Koch, D., Levy, H., Maki, T., Prather, M., Roberts, D. L. L., Roelofs, G.-J. G. J., Stevenson, D., Stockwell, Z., Taguchi, S., Kritz, M., Chipperfield, M., Baldocchi, D., McMurry, P., Barrie, L., Balkanski, Y., Chatfield, R., Kjellstrom, E., Lawrence, M., Lee, H. N. N., Lelieveld, J., Noone, K. J. J., Seinfeld, J., Stenchikov, G., Schwartz, S., Walcek, C., Williamson, D., Feichter, H., Law, K., Mahowald, N., Penner, J., Benkovitz, C., Genthon, C., Giannakopoulos, C., Kasibhatla, P., Koch, D., Levy, H., Maki, T., Prather, M., Roberts, D. L. L., Roelofs, G.-J. G. J., Stevenson, D., Stockwell, Z., Taguchi, S., Chipperfield, M., Baldocchi, D., McMurry, P., Barrie, L., Balkanski, Y., Chatfield, B., Jacob, D., Kritz, M., Lawrence, M., Lee, H. N. N., Leaitch, R., Lelieveld, J., Noone, K. J. J., Seinfeld, J., Stenchikov, G., Schwarz, S., Walcek, C., and Williamson, D.: An Assessment of Scavenging and Deposition Processes in Global Models: Results from the WCRP Cambridge Workshop of 1995, Tellus, 52B, 1025–1056, 2000.
Reddington, C. L., Carslaw, K. S., Stier, P., Schutgens, N., Coe, H., Liu, D., Allan, J., Browse, J., Pringle, K. J., Lee, L. A., Yoshioka, M., Johnson, J. S., Regayre, L. A., Spracklen, D. V., Mann, G. W., Clarke, A., Hermann, M., Henning, S., Wex, H., Kristensen, T. B., Leaitch, W. R., Pöschl, U., Rose, D., Andreae, M. O., Schmale, J., Kondo, Y., Oshima, N., Schwarz, J. P., Nenes, A., Anderson, B., Roberts, G. C., Snider, J. R., Leck, C., Quinn, P. K., Chi, X., Ding, A., Jimenez, J. L., and Zhang, Q.: The global aerosol synthesis and science project (GASSP): Measurements and modeling to reduce uncertainty, B. Am. Meteor. Soc., 98, 1857–1877, https://doi.org/10.1175/BAMS-D-15-00317.1, 2017.
Regayre, L. A., Johnson, J. S., Yoshioka, M., Pringle, K. J., Sexton, D. M. H., Booth, B. B. B., Lee, L. A., Bellouin, N., and Carslaw, K. S.: Aerosol and physical atmosphere model parameters are both important sources of uncertainty in aerosol ERF, Atmos. Chem. Phys., 18, 9975–10006, https://doi.org/10.5194/acp-18-9975-2018, 2018.
Reid, J. S., Jonson, H., Maring, H., Smirnov, A., Savoie, D., Cliff, S., Reid, E., Livingston, J., Meier, M., Dubovik, O., and Tsay, S.-C.: Comparison of size and morphological measurements of dust particles from Africa, J. Geophys. Res., 108, 8593, https://doi.org/10.1029/2002JD002485, 2003.
Remer, L., Kaufman, Y., Tanre, D., Mattoo, S., Chu, D., Martins, J., Li, R., Ichoku, C., Levy, R., Kleidman, R., Eck, T., Vermote, E., and Holbren, B.: The MODIS aerosol algorithm, products and validation, J. Atmos. Sci., 62, 947–973, 2005.
Rodríguez, S., Alastuey, A., Alonso-Pérez, S., Querol, X., Cuevas, E., Abreu-Afonso, J., Viana, M., Pérez, N., Pandolfi, M., and de la Rosa, J.: Transport of desert dust mixed with North African industrial pollutants in the subtropical Saharan Air Layer, Atmos. Chem. Phys., 11, 6663–6685, https://doi.org/10.5194/acp-11-6663-2011, 2011.
Rodríguez, S., Alastuey, A., and Querol, X.: A review of methods for long term in situ characterization of aerosol dust, Aeolian Res., 6, 55–74, https://doi.org/10.1016/j.aeolia.2012.07.004, 2012.
Rodríguez, S., Cuevas, E., Prospero, J. M., Alastuey, A., Querol, X., López-Solano, J., García, M. I., and Alonso-Pérez, S.: Modulation of Saharan dust export by the North African dipole, Atmos. Chem. Phys., 15, 7471–7486, https://doi.org/10.5194/acp-15-7471-2015, 2015.
Salma, I., Maenhaut, W., Annegarn, H. J., Andreae, M. O., Meixner, F. X., and Garstang, M.: Combined application of INAA and PIXE for studying the regional aerosol composition in Southern Africa, J. Geophys. Res., 101, 2361–23650, 1997.
Savoie, D. L., Prospero, J. M., Larsen, R. J., Huang, R., Izaguirre, M. A., Huang, T., Snowdon, T., Custals, L., and Sanderson, C.: Nitrogen and sulfur species in Antarctic aerosols at Mawson, Palmer Station, and Marsh (King George Island), J. Atmos. Chem., 17, 95–122, 1993.
Scanza, R. A., Mahowald, N., Ghan, S., Zender, C. S., Kok, J. F., Liu, X., Zhang, Y., and Albani, S.: Modeling dust as component minerals in the Community Atmosphere Model: development of framework and impact on radiative forcing, Atmos. Chem. Phys., 15, 537–561, https://doi.org/10.5194/acp-15-537-2015, 2015.
Schlesinger, W. H.: Biogeochemistry: an analysis of global change, 2nd ed., San Diego, Academic Press, ISBN 9780126251555, 1997.
Schulz, M., Textor, C., Kinne, S., Balkanski, Y., Bauer, S., Berntsen, T., Berglen, T., Boucher, O., Dentener, F., Guibert, S., Isaksen, I. S. A., Iversen, T., Koch, D., Kirkevåg, A., Liu, X., Montanaro, V., Myhre, G., Penner, J. E., Pitari, G., Reddy, S., Seland, Ø., Stier, P., and Takemura, T.: Radiative forcing by aerosols as derived from the AeroCom present-day and pre-industrial simulations, Atmos. Chem. Phys., 6, 5225–5246, https://doi.org/10.5194/acp-6-5225-2006, 2006.
Schulz, M., Prospero, J. M., Baker, A. R., Dentener, F., Ickes, L., Liss, P. S., Mahowald, N. M., Nickovic, S., García-Pando, C. P., Rodríguez, S., Sarin, M., Tegen, I., and Duce, R. A.: Atmospheric transport and deposition of mineral dust to the ocean: Implications for research needs, Environ. Sci. Technol., 46, 10390–10404, https://doi.org/10.1021/es300073u, 2012.
Schuster, G. L., Dubovik, O., and Arola, A.: Remote sensing of soot carbon – Part 1: Distinguishing different absorbing aerosol species, Atmos. Chem. Phys., 16, 1565–1585, https://doi.org/10.5194/acp-16-1565-2016, 2016.
Schutgens, N. A. J., Gryspeerdt, E., Weigum, N., Tsyro, S., Goto, D., Schulz, M., and Stier, P.: Will a perfect model agree with perfect observations? The impact of spatial sampling, Atmos. Chem. Phys., 16, 6335–6353, https://doi.org/10.5194/acp-16-6335-2016, 2016.
Seinfeld, J. H. and Pandis, S. N.: Atmospheric Chemistry and Physics: From Air Pollution to Climate Change, ISBN 978-0471720188, 2006.
Silva, H.F., Matos, M. J., Oliveira, C., Ferreira, A. F., Oliveira, J. C., Cantinho, P., Calado, M., Oliveira, C., Martins, N., Pio, C., and Camões M. F.: Effect of climate on PM concentration and size distribution in two sites in the city of Lisbon, Encontro de Jovens Químicos Portugueses, Conference Proceeding Encontro de Jovens, Quimicos Portugueses, Aveiro, 21–23 April, 2010.
Skiles, S. M. K., Flanner, M., Cook, J. M., Dumont, M., and Painter, T. H.: Radiative forcing by light-absorbing particles in snow, Nat. Clim. Change 8, 964–971, https://doi.org/10.1038/s41558-018-0296-5, 2018.
Smichowski, P., Gómez, D. R., Dawidowski, L. E., Giné, M. F., Bellato, A. C. S., and Reich, S. L.: Monitoring trace metals in urban aerosols from Buenos Aires city. Determination by plasma-based techniques, J. Environ. Monitor., 6, 286–294, https://doi.org/10.1039/b312446k, 2004.
Smith, M. B., Mahowald, N. M., Albani, S., Perry, A., Losno, R., Qu, Z., Marticorena, B., Ridley, D. A., and Heald, C. L.: Sensitivity of the interannual variability of mineral aerosol simulations to meteorological forcing dataset, Atmos. Chem. Phys., 17, 3253–3278, https://doi.org/10.5194/acp-17-3253-2017, 2017.
Swap, R., Garstang, M., Greco, S., Talbot, R., and Kallberg, P.: Saharan dust in the Amazon Basin, Tellus, 44B, 133–149, https://doi.org/10.3402/tellusb.v44i2.15434, 1992.
Szopa, S., Naik, V., Adhikary, B., Artaxo, P., Berntsen, T., Collins, W. D., Aas, W., Akritidis, D., Allen, R. J., Kanaya, Y., Prather, M. J., Kuo, C., Zhai, P., Pirani, A., Connors, S., Péan, C., Berger, S., Caud, N., Chen, Y., Goldfarb, L., Gomis, M., Huang, M., Leitzell, K., Lonnoy, E., Matthews, J., Maycock, T., Waterfield, T., Yelekçi, O., Yu, R., and Zhou, B.: Chapter 6: Short-lived Climate Forcers, in: Climate Change 2021: The Physical Science Basis. Contribution of Working Group I to the Sixth Assessment Report of the Intergovernmental Panel on Climate Change, edited by: Masson-Delmotte, V. , Zhai, P., A. Pirani, A., Connors, S. L., Péan, C. S., Berger, S., Caud, N., Chen, Y., Goldfarb, L., Gomis, M. I., Huang, M., Leitzell, K., Lonnoy, E., Matthews, J. B. R., Maycock, T. K., Waterfield, T., Yelekçi, O., Yu, R., and Zhou, B., Cambridge University Press, Cambridge, United Kingdom and New York, NY, USA, 816–921, https://doi.org/10.1017/9781009157896.008, 2021.
Tanré, D., Kaufman, Y. J., Herman, M., and Mattoo, S.: Remote sensing of aerosol properties over oceans using the MODIS/EOS spectral radiances, J. Geophys. Res., 102, 16916–971988, 1997.
Textor, C., Schulz, M., Guibert, S., Kinne, S., Balkanski, Y., Bauer, S., Berntsen, T., Berglen, T., Boucher, O., Chin, M., Dentener, F., Diehl, T., Easter, R., Feichter, H., Fillmore, D., Ghan, S., Ginoux, P., Gong, S., Grini, A., Hendricks, J., Horowitz, L., Huang, P., Isaksen, I., Iversen, I., Kloster, S., Koch, D., Kirkevåg, A., Kristjansson, J. E., Krol, M., Lauer, A., Lamarque, J. F., Liu, X., Montanaro, V., Myhre, G., Penner, J., Pitari, G., Reddy, S., Seland, Ø., Stier, P., Takemura, T., and Tie, X.: Analysis and quantification of the diversities of aerosol life cycles within AeroCom, Atmos. Chem. Phys., 6, 1777–1813, https://doi.org/10.5194/acp-6-1777-2006, 2006.
Thornhill, G., Collins, W., Olivié, D., Skeie, R. B., Archibald, A., Bauer, S., Checa-Garcia, R., Fiedler, S., Folberth, G., Gjermundsen, A., Horowitz, L., Lamarque, J.-F., Michou, M., Mulcahy, J., Nabat, P., Naik, V., O'Connor, F. M., Paulot, F., Schulz, M., Scott, C. E., Séférian, R., Smith, C., Takemura, T., Tilmes, S., Tsigaridis, K., and Weber, J.: Climate-driven chemistry and aerosol feedbacks in CMIP6 Earth system models, Atmos. Chem. Phys., 21, 1105–1126, https://doi.org/10.5194/acp-21-1105-2021, 2021.
Toro, C., Sonntag, D., Bash, J., Burke, G., Murphy, B. N., Seltzer, K. M., Simon, H., Shephard, M. W., and Cady-Pereira, K. E.: Sensitivity of air quality to vehicle ammonia emissions in the United States, Atmos. Environ., 327, 120484, https://doi.org/10.1016/j.atmosenv.2024.120484, 2024.
Tørseth, K., Aas, W., Breivik, K., Fjæraa, A. M., Fiebig, M., Hjellbrekke, A. G., Lund Myhre, C., Solberg, S., and Yttri, K. E.: Introduction to the European Monitoring and Evaluation Programme (EMEP) and observed atmospheric composition change during 1972–2009, Atmos. Chem. Phys., 12, 5447–5481, https://doi.org/10.5194/acp-12-5447-2012, 2012.
Tsigaridis, K., Daskalakis, N., Kanakidou, M., Adams, P. J., Artaxo, P., Bahadur, R., Balkanski, Y., Bauer, S. E., Bellouin, N., Benedetti, A., Bergman, T., Berntsen, T. K., Beukes, J. P., Bian, H., Carslaw, K. S., Chin, M., Curci, G., Diehl, T., Easter, R. C., Ghan, S. J., Gong, S. L., Hodzic, A., Hoyle, C. R., Iversen, T., Jathar, S., Jimenez, J. L., Kaiser, J. W., Kirkevåg, A., Koch, D., Kokkola, H., Lee, Y. H., Lin, G., Liu, X., Luo, G., Ma, X., Mann, G. W., Mihalopoulos, N., Morcrette, J.-J., Müller, J.-F., Myhre, G., Myriokefalitakis, S., Ng, N. L., O'Donnell, D., Penner, J. E., Pozzoli, L., Pringle, K. J., Russell, L. M., Schulz, M., Sciare, J., Seland, Ø., Shindell, D. T., Sillman, S., Skeie, R. B., Spracklen, D., Stavrakou, T., Steenrod, S. D., Takemura, T., Tiitta, P., Tilmes, S., Tost, H., van Noije, T., van Zyl, P. G., von Salzen, K., Yu, F., Wang, Z., Wang, Z., Zaveri, R. A., Zhang, H., Zhang, K., Zhang, Q., and Zhang, X.: The AeroCom evaluation and intercomparison of organic aerosol in global models, Atmos. Chem. Phys., 14, 10845–10895, https://doi.org/10.5194/acp-14-10845-2014, 2014.
Turnock, S. T., Allen, R. J., Andrews, M., Bauer, S. E., Deushi, M., Emmons, L., Good, P., Horowitz, L., John, J. G., Michou, M., Nabat, P., Naik, V., Neubauer, D., O'Connor, F. M., Olivié, D., Oshima, N., Schulz, M., Sellar, A., Shim, S., Takemura, T., Tilmes, S., Tsigaridis, K., Wu, T., and Zhang, J.: Historical and future changes in air pollutants from CMIP6 models, Atmos. Chem. Phys., 20, 14547–14579, https://doi.org/10.5194/acp-20-14547-2020, 2020.
Turpin, B. J. and Lim, H. J.: Species contributions to PM2.5 mass concentrations: Revisiting common assumptions for estimating organic mass, Aerosol Sci. Technol., 35, 602–610, https://doi.org/10.1080/02786820119445, 2001.
Uematsu, M., Duce, R. A., Prospero, J. M., Chen, L., Merrill, J. T., and McDonald, R. L.: Transport of Mineral Aerosol From Asia Over the North Pacific Ocean, J. Geophys. Res., 88, 5343–5352, 1983.
Vanderzalm, J. L., Hooper, M. A., Ryan, B., Maenhaut, W., P. Martin, P. R., Rayment, and Hooper, B. M.: Impact of seasonal biomass burning on air quality in the “`Top End”' of regional northern Australia, Clean Air Environ. Qual., 37, 28–34, 2003.
Vet, R., Artz, R. S. R. S., Carou, S., Shaw, M., Ro, C.-U. C.-U., Aas, W., Baker, A., Bowersox, V. C., Dentener, F., Galy-Lacaux, C., Hou, A., Pienaar, J. J., Gillett, R., Forti, M. C. C., Gromov, S., Hara, H., Khodzher, T., Mahowald, N. M. N. M., Nickovic, S., Rao, P. S. P., Reid, N. W. N. W., Dentener, F., Galy-Lacaux, C., Hou, A., Gillett, R., Forti, M. C. C., Gromov, S., Hara, H., Khodzher, T., Mahowald, N. M. N. M., Nickovic, S., Reid, N. W. N. W., Vet, R., Artz, R. S., Carou, S., Shaw, M., Ro, C.-U., Aas, W., Baker, A., Bowersox, V. C., Dentener, F., Galy-Lacaux, C., Hou, A., Pienaar, J. J., Gillett, R., Forti, M. C., Gromov, S., Hara, H., Khodzher, T.,. Mahowald, N. M., Nickovic, S., Rao, P. S. P., and Reid, N. W. N. W.: A global assessment of precipitation chemistry and depositoin of sulfur, nitrogen, sea salt , base cations, organic acids, acidity and pH and phosphorus, Atmos. Environ., 93, 3–100, 2014.
Vira, J., Hess, P., Melkonian, J., and Wieder, W. R.: An improved mechanistic model for ammonia volatilization in Earth system models: Flow of Agricultural Nitrogen version 2 (FANv2), Geosci. Model Dev., 13, 4459–4490, https://doi.org/10.5194/gmd-13-4459-2020, 2020.
Vira, J., Hess, P., Ossohou, M., and Galy-Lacaux, C.: Evaluation of interactive and prescribed agricultural ammonia emissions for simulating atmospheric composition in CAM-chem, Atmos. Chem. Phys., 22, 1883–1904, https://doi.org/10.5194/acp-22-1883-2022, 2022.
Virkkula, A., Aurela, M., Hillamo, R., Makela, T., Pakkanen, T., Kerminen, V. M., Maenhaut, W., Francois, F., and Cafmeyer, J.: Chemical composition of atmospheric aerosol in the European subarctic: Contribution of the Kola Peninsula smelter areas, central Europe and the Arctic Ocean, J. Geophys. Res., 104, 23681–23696, https://doi.org/10.1029/1999JD900426, 1999.
Vohra, K., Vodonos, A., Schwartz, J., Marais, E. A., Sulprizio, M. P., and Mickley, L. J.: Global mortality from outdoor fine particle pollution generated by fossil fuel combustion: Results from GEOS-Chem, Environ. Res., 195, 110754, https://doi.org/10.1016/j.envres.2021.110754, 2021.
Watson-Parris, D., Bellouin, N., Deaconu, L. T., Schutgens, N. A. J., Yoshioka, M., Regayre, L. A., Pringle, K. J., Johnson, J. S., Smith, C. J., Carslaw, K. S., and Stier, P.: Constraining Uncertainty in Aerosol Direct Forcing, Geophys. Res. Lett., 47, e2020GL087141, https://doi.org/10.1029/2020GL087141, 2020.
Wiedinmyer, C., Lihavainen, H., Mahowald, N., Alastuey, A., Albani, S., Artaxo, P., Bergametti, G., Batterman, S., Brahney, J., Duce, R., Feng, Y., Buck, C., Ginoux, P., Chen, Y., Guieu, C., Cohen, D., Hand, J., Harrison, R., Herut, B., and Zhang, Y.: COARSEMAP: synthesis of observations and models for coarse-mode aerosols, Fall American Geophysical Union, https://agu.confex.com/agu/fm17/meetingapp.cgi/Paper/234678 (last access: 29 April 2025), 2018.
Wilson, W. E., Chow, J. C., Claiborn, C., Fusheng, W., Engelbrecht, J., and Watson, J. G.: Monitoring of particulate matter outdoors, Chemosphere, 49, 1009–1043, https://doi.org/10.1016/S0045-6535(02)00270-9, 2002.
Wolff, G. T.: On the nature of nitrate in coarse continental aerosols, Atmos Environ, 18, 977–981, https://doi.org/10.1016/0004-6981(84)90073-8, 1984.
Xiao, Y. H., Liu, S. R., Tong, F. C., Kuang, Y. W., Chen, B. F., and Guo, Y. D.: Characteristics and sources of metals in TSP and PM2.5 in an urban forest park at Guangzhou, Atmosphere, 5, 775–787, https://doi.org/10.3390/atmos5040775, 2014.
Xu, L. and Penner, J. E.: Global simulations of nitrate and ammonium aerosols and their radiative effects, Atmos. Chem. Phys., 12, 9479–9504, https://doi.org/10.5194/acp-12-9479-2012, 2012.
Yang, Y., Wang, H., Smith, S. J., Zhang, R., Lou, S., Yu, H., Li, C., and Rasch, P. J.: Source Apportionments of Aerosols and Their Direct Radiative Forcing and Long-Term Trends Over Continental United States, Earths Future, 6, 793–808, https://doi.org/10.1029/2018EF000859, 2018.
Zender, C., Bian, H., and Newman, D.: Mineral Dust Entrainment and Deposition (DEAD) model: Description and 1990s dust climatology, J. Geophys. Res., 108, 4416, https://doi.org/10.1029/2002JD002775, 2003.
Zhang, Y., Mahowald, N., Scanza, R. A., Journet, E., Desboeufs, K., Albani, S., Kok, J. F., Zhuang, G., Chen, Y., Cohen, D. D., Paytan, A., Patey, M. D., Achterberg, E. P., Engelbrecht, J. P., and Fomba, K. W.: Modeling the global emission, transport and deposition of trace elements associated with mineral dust, Biogeosciences, 12, 5771–5792, https://doi.org/10.5194/bg-12-5771-2015, 2015.
Zhao, A., Ryder, C. L., and Wilcox, L. J.: How well do the CMIP6 models simulate dust aerosols?, Atmos. Chem. Phys., 22, 2095–2119, https://doi.org/10.5194/acp-22-2095-2022, 2022.
Zihan, Q. and Losno, R.: Chemical properties of continental aerosol transported over the Southern Ocean: Patagonian and Namibian sources, Paris, France, 215 pp., NNT: 2016PA066002, 2016.