the Creative Commons Attribution 4.0 License.
the Creative Commons Attribution 4.0 License.
 | 23 Apr 2025
Revisiting the high tropospheric ozone over southern Africa: role of biomass burning and anthropogenic emissions
Yufen Wang
Zhenjiang Yang
Minglong Tang
Pascoal M. D. Campos
Yang Yang
Hong Liao
Tropospheric ozone over southern Africa is particularly high and causes tremendous health risks and crop yield losses. It has been previously attributed to the influence by biomass burning (BB), with a neglected contribution from anthropogenic emissions. However, due to the lack of measurements for ozone and its precursors, the modeled impacts of BB and anthropogenic emissions on tropospheric ozone levels in southern Africa were not well evaluated. In this study, we combined the nested GEOS-Chem simulation with a horizontal resolution of 0.5°×0.625° with available multiple observations at the surface and from space to quantify tropospheric ozone and its main drivers in southern Africa. Firstly, BB emissions from current different inventories exhibit similar peaks in the summer season but also have large uncertainties in southern Africa (e.g., uncertainty of a factor of 2–3 in emitted NOx). The model–satellite comparison in the fire season (July–August) in 2019 shows that using the widely used Global Fire Emissions Database version 4.1 (GFED4.1) inventory, the model tends to overestimate by 87 % compared to OMI NO2, while the Quick Fire Emissions Dataset (QFED2) inventory can greatly reduce this model bias to only 34 %. Consequently, the modeled tropospheric column ozone (TCO) bias was reduced from 14 % by GFED4.1 to 2.3 % by QFED2. In addition, the QFED2 also has a much better spatial representativeness than GFED4.1. The simulated surface daily maximum 8 h mean (MDA8) ozone was decreased from 74 ppb by GFED4.1 to only 56 ppb by QFED2. This suggests a highly overestimated role of BB emissions in surface ozone if GFED4.1 is adopted. The model–observation comparison at the surface shows that the global Community Emissions Data System (CEDSv2) anthropogenic inventory tends to underestimate anthropogenic NOx emissions in typical southern African cities and likely misrepresented anthropogenic sources in some areas. That means that urban ozone and PM2.5 concentrations in southern Africa may be strongly underestimated. For example, a 10-fold increase in anthropogenic NOx emissions can change the ozone chemistry regime and increase PM2.5 by up to 50 µg m−3 at the city of Luanda. Furthermore, we also find that TROPOMI can already capture the urban NO2 column hotspots over low-emission regions like southern Africa, while this is unavailable from the OMI instrument, highlighting the critical role of high-resolution measurements in understanding atmospheric chemistry issues over southern Africa. Our study presents a deeper understanding of the key emission sources and their impacts over southern Africa that will be helpful not only to formulate targeted pollution controls, but also to enhance the capability to predict future air quality and climate change, which would be beneficial for achieving a healthy, climate-friendly, and resilient development in Africa.
- Article
(7299 KB) - Full-text XML
-
Supplement
(3179 KB) - BibTeX
- EndNote


Tropospheric ozone (O3) is an important trace gas in the atmosphere, posing multifaceted threatens to public health, crop yield, and the global environment (Xu et al., 2018; Bourgeois et al., 2021). Complex photochemical reactions of nitrogen oxides () and volatile organic compounds (VOCs) in the presence of sunlight are the main source of tropospheric ozone (Wang et al., 2022). These two ozone precursors are emitted from both anthropogenic and natural sources. Great efforts have been made to reduce anthropogenic emissions, but ozone pollution is still challenging in many urban regions across the globe (Gaudel et al., 2020; Lyu et al., 2023). Globally, it was estimated that ∼365 000 premature deaths could be attributed to ozone pollution in 2019 (Lyu et al., 2023). The urban population exposed to ozone was increased at a trend of 0.8 % per year from 2000 to 2019, and the largest increases of daily maximum 8 h mean (MDA8) ozone occurred in Africa and India (Sicard et al., 2023). However, due to the lack of comprehensive studies on tropospheric ozone pollution in southern Africa, it is urgent to explore the major source contributions driving ozone pollution over these less-studied regions. A better understanding of the major emission sources is not only helpful to formulate actionable targeted pollution controls and to reduce air pollution risks, but also important to predict future air quality in developing regions under the rapid changing of emissions and climate change.
Biomass burning (BB) emits large amounts of air pollutants that are important ozone precursors (Qin et al., 2024). Africa is frequently exposed to intense BB (Vernooij et al., 2021), contributing to 70 % of the global BB area and nearly 75 % of global infant deaths attributed to BB pollutants (Jiang et al., 2020; Hickman et al., 2021). Exposure to air pollution from BB has strong differences in socioeconomic levels (Yue et al., 2024), with the most heavily exposed populations being in southern Africa (Xu et al., 2023). Due to the complex climate types and unique lifestyles, BB in Africa during the months of June–August is concentrated over southern Africa (Meyer-Arnek et al., 2005; Williams et al., 2010), and this slash-and-burn agricultural activity could lead to very high ozone concentrations over southern Africa. As shown in Fig. S1 in the Supplement, surface ozone concentrations in southern Africa were simulated exceeding 100 ppb in July, making it to be the highest ozone level worldwide. This is consistent with the previous modeling findings that BB activities are the dominant driver of tropospheric ozone in this region (von Clarmann et al., 2007). At the country level, Rwanda with an observed daily ozone maximum of 70 ppb during the dry season (Dewitt et al., 2019) can be affected by the transport of BB from northern and southern Africa. The high ozone is mainly driven by BB NOx emissions; for example, the southern Africa BB can increase NOx concentrations by a factor of 2–5 in the months of July–August (Hoelzemann, 2006). Although BB has a great impact on ozone and its precursors in southern Africa, there are few quantitative studies on this issue.
The popular way of quantifying the role of BB is to conduct chemical transport modeling, e.g., using ECHAM5-MOZ (Aghedo et al., 2007), GEOS-Chem (Wang et al., 2022; Marvin et al., 2021), and WRF-Chem (Yang et al., 2022). The ECHAM5-MOZ model simulations show that BB can increase surface ozone by more than 50 ppb in central Africa in June–August during 1997–2001 (Aghedo et al., 2007). Williams et al. (2010) used the Tracer Model version 4 (AMMA version) to simulate June–August air pollution in 2006, and they showed that BB in southern Africa is the largest source of carbon monoxide and ozone precursor emissions in Africa. However, the model assessment is highly dependent on BB emission inventories, and there is a lack of comparative studies of different BB inventories over southern Africa. This is because existing BB emission inventories have large uncertainties in Africa (Petrenko et al., 2012; Shi et al., 2015). The most widely used inventory for global model simulations is the Global Fire Emissions Database (GFED) (Shi et al., 2020), and other BB inventories include the Quick Fire Emissions Dataset (QFED), the Global Fire Assimilation System (GFAS), and the Fire INventory from NCAR (FINN). There are large discrepancies with a factor of 2–10 among these inventories in estimated air pollutant emissions that may be due to biases in estimating burned area, emission factors, and vegetation types (Carter et al., 2020; Fu et al., 2022). Depending on how fire emissions are calculated, these inventories can be divided into two categories: the fuel-based bottom-up estimation (e.g., GFED and FINN) (Pechony et al., 2013; Nikonovas et al., 2017) and the satellite-derived top-down estimation (e.g., QFED and GFAS) (Nikonovas et al., 2017). In addition, the injected height of BB emissions is also a key factor in determining the residence time of pollutants in the atmosphere that would impact the spatiotemporal distribution of tropospheric ozone (Rémy et al., 2017). Therefore, it is urgent to take advantage of observational constraints to evaluate the current BB inventories and quantify their impacts on tropospheric ozone in Africa.
In addition to the effects of BB, tropospheric ozone can be also affected by anthropogenic emissions in Africa. Although the intensity of anthropogenic emissions is relatively low in Africa, their impact at the urban scale cannot be ignored. With the rapid urbanization (Liousse et al., 2014), mean concentrations of surface SO2, PM2.5, and PM10 in Luanda have exceeded European Union human health protection limits (Campos et al., 2021). More importantly, anthropogenic emissions (e.g., black carbon) are projected to be comparable with BB emissions by 2030 in Africa (Liousse et al., 2014). Projection studies also pointed out that 50 % of the population will be expected to live in cities by 2050 (Bello-Schünemann and Aucoin, 2016), resulting in a significant increase in the population exposure to ozone in Africa. With air pollution becoming a major cause of premature deaths in Africa (Bahino et al., 2018), urban air pollution will likely pose more challenges in the context of increasing anthropogenic emissions (Roy, 2016; Marais and Wiedinmyer, 2016; Zhang et al., 2021). However, whether the current anthropogenic emission inventories are reasonable in urban southern Africa remains unclear.
The lack of surface observations is a major challenge for assessment of emission inventories in Africa. About 66 % of African countries do not have regular air quality monitoring (Fajersztajn et al., 2014), with few in particular in southern Africa (Bahino et al., 2018). Recently, there have been continuous surface measurements available at several major cities over southern Africa (Fig. 1), together with the high-resolution satellite observations (e.g., TROPOMI), which could be very helpful to detect urban air pollution in this region. With the worsening air pollution in Africa (Sicard et al., 2023), it is particularly timely to take advantage of these valuable measurements to assess the key drivers of high tropospheric ozone in southern Africa.
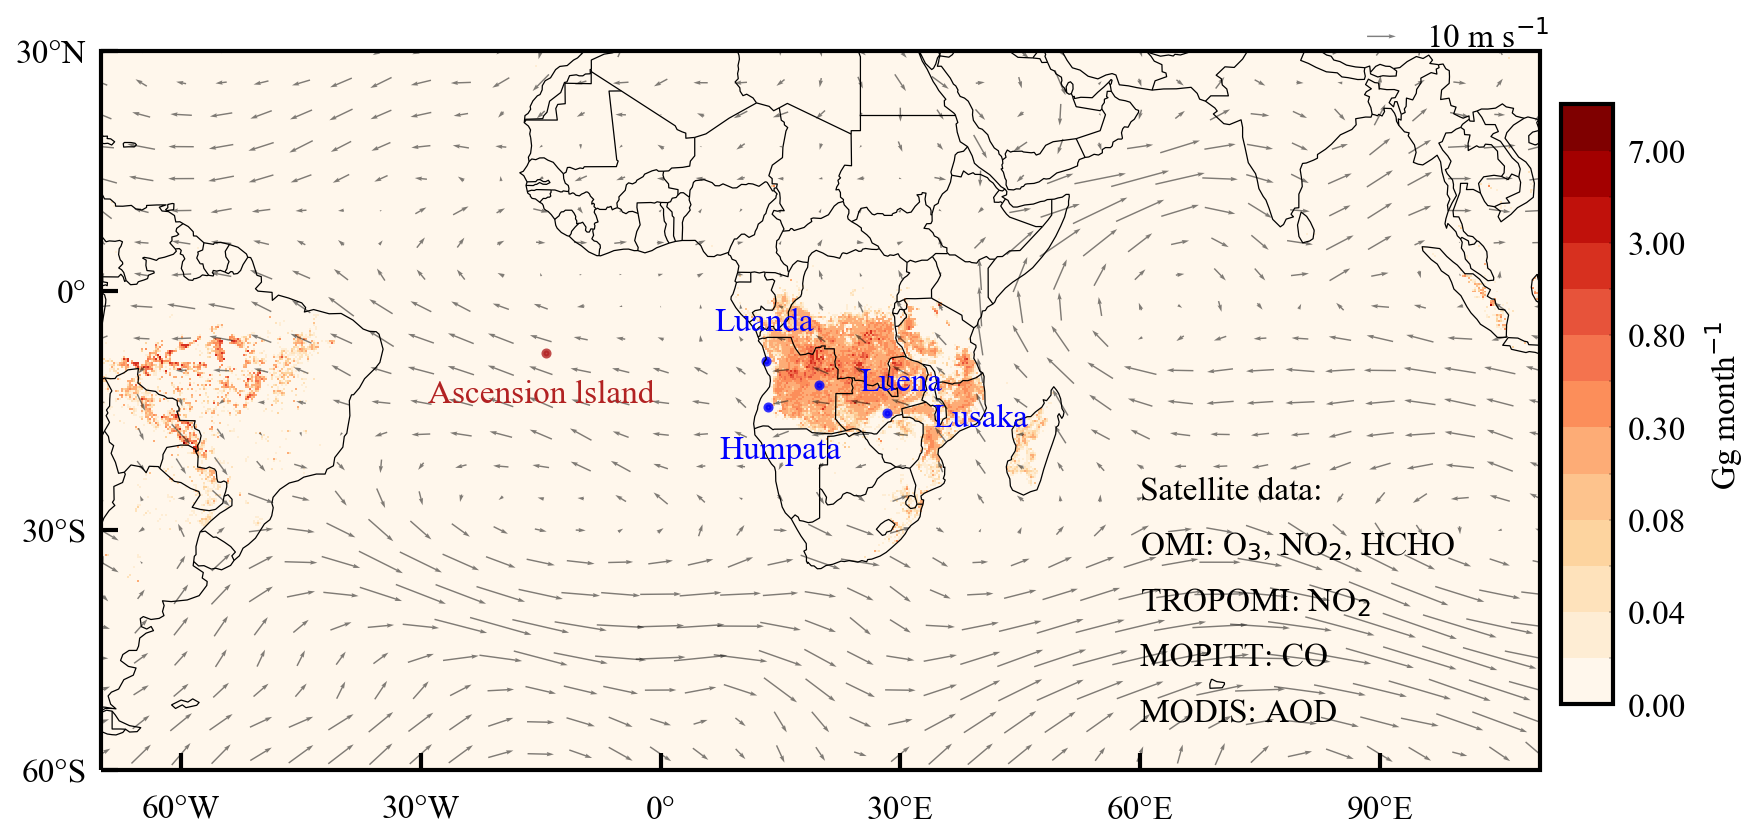
Figure 1The biomass burning NOx emissions (shaded) and 850 hPa wind fields. The BB NOx emissions are for July–August 2019 from the GFED4.1 inventory (unit: Gg per month). Blue dots represent the locations of surface observations and the red dot denotes the ozonesonde measurement; satellite data used in this study are listed in the lower-right corner.
As mentioned above, there are notable uncertainties in the estimation of major emission sources over southern Africa. Assessing and predicting the impacts of emissions on air quality and health risks rely heavily on model simulations, and these uncertainties in emission inventories can affect the development of effective control strategies. We therefore need to utilize surface and satellite observations to gain a comprehensive understanding of the emission source contributions in southern Africa. This will help to develop effective mitigation measures to realize the Sustainable Development Goals for having a healthy, climate-friendly, and resilient development in Africa.
Here we integrated the high-resolution GEOS-Chem model and newly available measurements to estimate the impact of biomass burning and anthropogenic emissions on tropospheric ozone over southern Africa. The aim of this study is (1) to quantify the role of BB emissions on regional tropospheric ozone over southern Africa and (2) to assess the representativeness of anthropogenic emission inventories in urban southern Africa and their impacts on urban ozone pollution. The observational data, model description, and experimental setup are presented in Sect. 2. Section 3.1 shows the major emission sources and the high-tropospheric-ozone issue over southern Africa. The estimated impacts of biomass burning and anthropogenic emissions on tropospheric ozone are analyzed in Sect. 3.2 and 3.3, respectively. Conclusions and discussion are given in Sect. 4.
2.1 Surface measurements
Figure 1 shows the locations of the four surface observation sites over southern Africa. Hourly and daily real-time air quality indexes (AQIs) for NO2 and PM2.5 were obtained from the Worldwide Air Quality Index (https://aqicn.org/station, last access: 1 November 2023). The AQI can be converted to pollutant concentrations based on the website's AQI Calculator. These four sites record continuous measurement data in the study area, namely Humpata in Angola (14°95′ S, 13°44′ E), Luanda in Angola (8°80′ S, 13°23′ E), Luena in Angola (11°76′ S, 19°91′ E), and Lusaka in Zambia (15°41′ S, 28°29′ E). The stations in Angola and Zambia have been operating since mid-May 2023 and February 2022, respectively, and data for June–August 2023 were selected for this study. To evaluate modeled ozone profiles, we adopted Ascension Island's ozonesonde data from the Southern Hemisphere ADditional OZonesondes (SHADOZ) network, which measured the ozone profile from 1998 (Thompson et al., 2000).
2.2 Satellite data
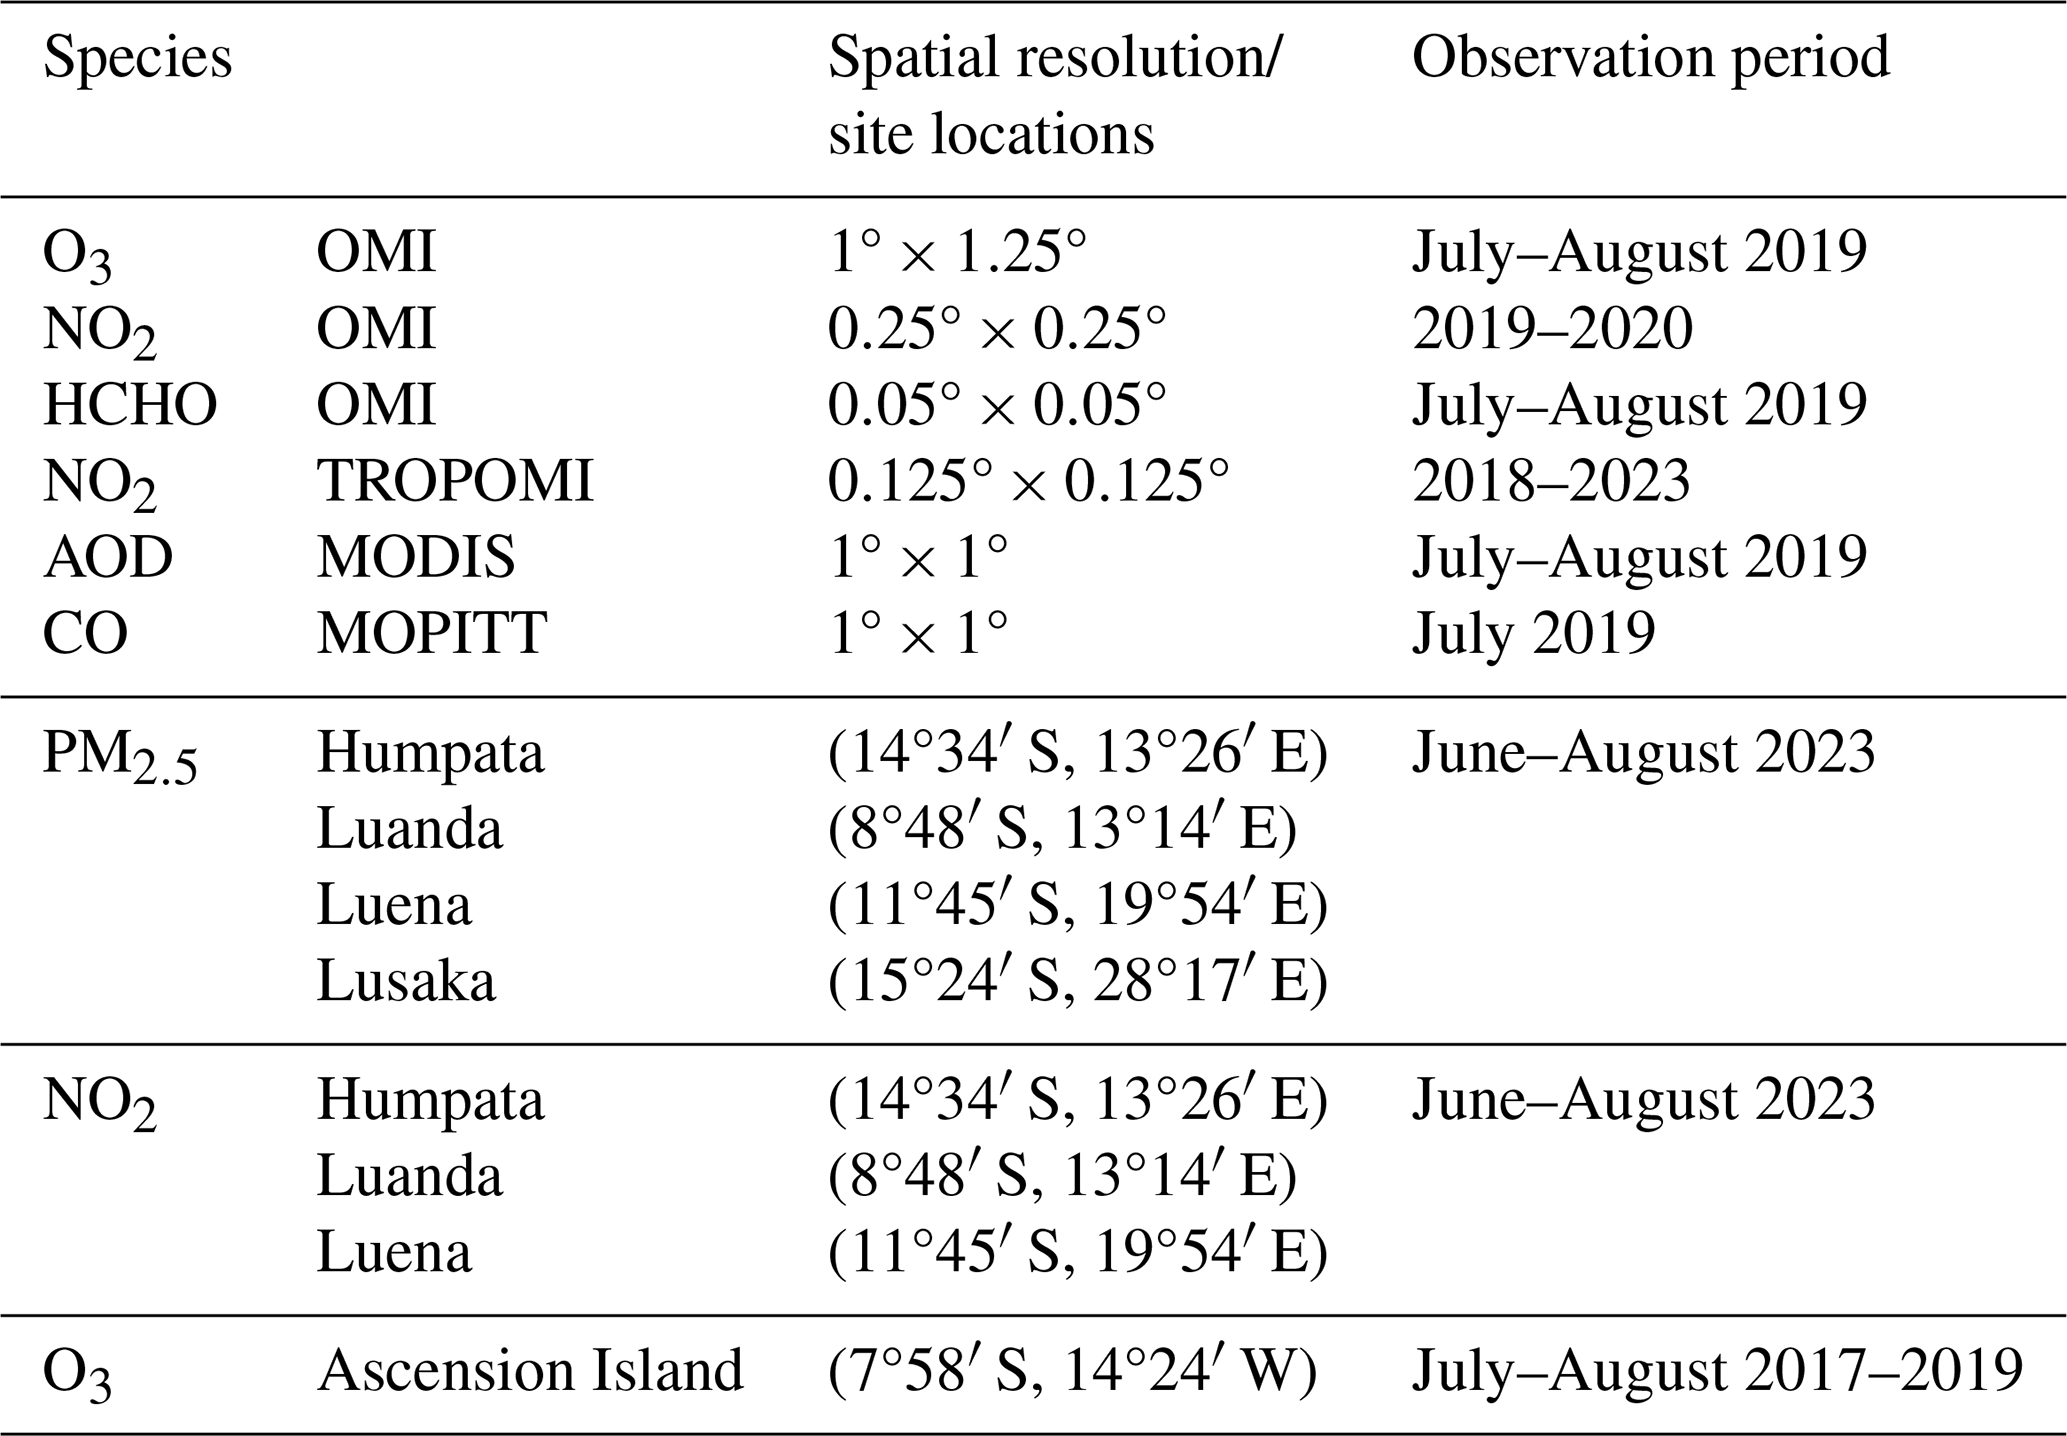
In order to investigate the model results driven by different BB emission inventories and the anthropogenic emission inventories, multiple observations from the OMI (https://disc.gsfc.nasa.gov/datasets/, last access: 29 October 2023), TROPOMI (https://www.earthdata.nasa.gov/sensors/tropomi, last access: 1 April 2025), MODIS (https://ladsweb.modaps.eosdis.nasa.gov/search/, last access: 1 April 2025), and MOPITT (https://giovanni.gsfc.nasa.gov/giovanni/, last access: 1 April 2025) satellite instruments were used (Table 1). The OMI sensor observes the globe once a day and is capable of obtaining the column concentration distributions of a variety of tropospheric trace gases (e.g., NO2 and O3). The TROPOMI sensor is a troposphere-specific observational instrument, and Wang et al. (2020) compared the NO2 concentrations of OMI and TROPOMI with observations. As for MODIS AOD, Shi et al. (2019) compared observations from 400 stations of the Aerosol Robotic Network (AERONET) with the MODIS AOD and demonstrated that MODIS was able to better capture the spatial and temporal variations of AERONET AOD (Zhang et al., 2024). MOPITT was launched in December 1999 on board the Earth observation satellite Terra with a 10:30 Equator crossing time (Kopacz et al., 2010). Here, as listed in Table 1, we used tropospheric ozone, NO2, and HCHO observations from OMI with resolutions of 1°×1.25°, 0.25°×0.25°, and 0.05°×0.05°, respectively, as well as NO2 observations from TROPOMI with a resolution of 0.125°×0.125°. AOD and CO observations with a resolution of 1°×1° are from MODIS and MOPITT, respectively. We sampled the model simulation results consistent with satellite overpass times in the following comparisons. Although these satellite datasets have been well employed to reflect emission changes (Bian et al., 2007; Zhao et al., 2022), their uncertainties are also notable due to biases in slant column density, air mass factor, and stratosphere–troposphere separation. For example, the reported uncertainties in NO2 columns from OMI and TROPOMI are 25 %–50 %, and they can be increased to 50 %–100 % in terms of OMI HCHO columns (Zhu et al., 2020).
2.3 Biomass burning emission inventories
In this study, six BB emission inventories were compared: GFED4.1, GFED5, GFAS, QFED2, FINNv1.5, and FINNv2.5. The GFED4.1 inventory provides dry matter emissions based on the area of BB and vegetation types from MODIS observations (Marvin et al., 2021; Zhang et al., 2018). GFED5 is an updated version of GFED4.1, and the GFED5 global burned area is 61 % higher than GFED4.1 (Chen et al., 2023). The GFAS inventory estimates the amount of dry matter burning based on fire radiative power (FRP) (Vongruang et al., 2017). The QFED2 inventory is based on the FRP method and draws on the cloud correction method developed in GFAS with the high spatiotemporal resolution. FINNv1.5 calculates dry matter combustion using fire hotspot (FHS) data to calculate the burned area, and FINNv2.5 builds on this with extensive updates to the burned area, vegetation types, and chemicals emitted. In particular, FINNv2.5 adopted the active fire detections from the Visible Infrared Imaging Radiometer Suite (VIIRS) to better capture small fires and used multiple satellite products for daily fire emission estimates (i.e., MODIS and VIIRS fire detections). The estimated BB NOx emissions from these inventories are further discussed in Sect. 3.2.1.
Table 2GEOS-Chem model simulations.
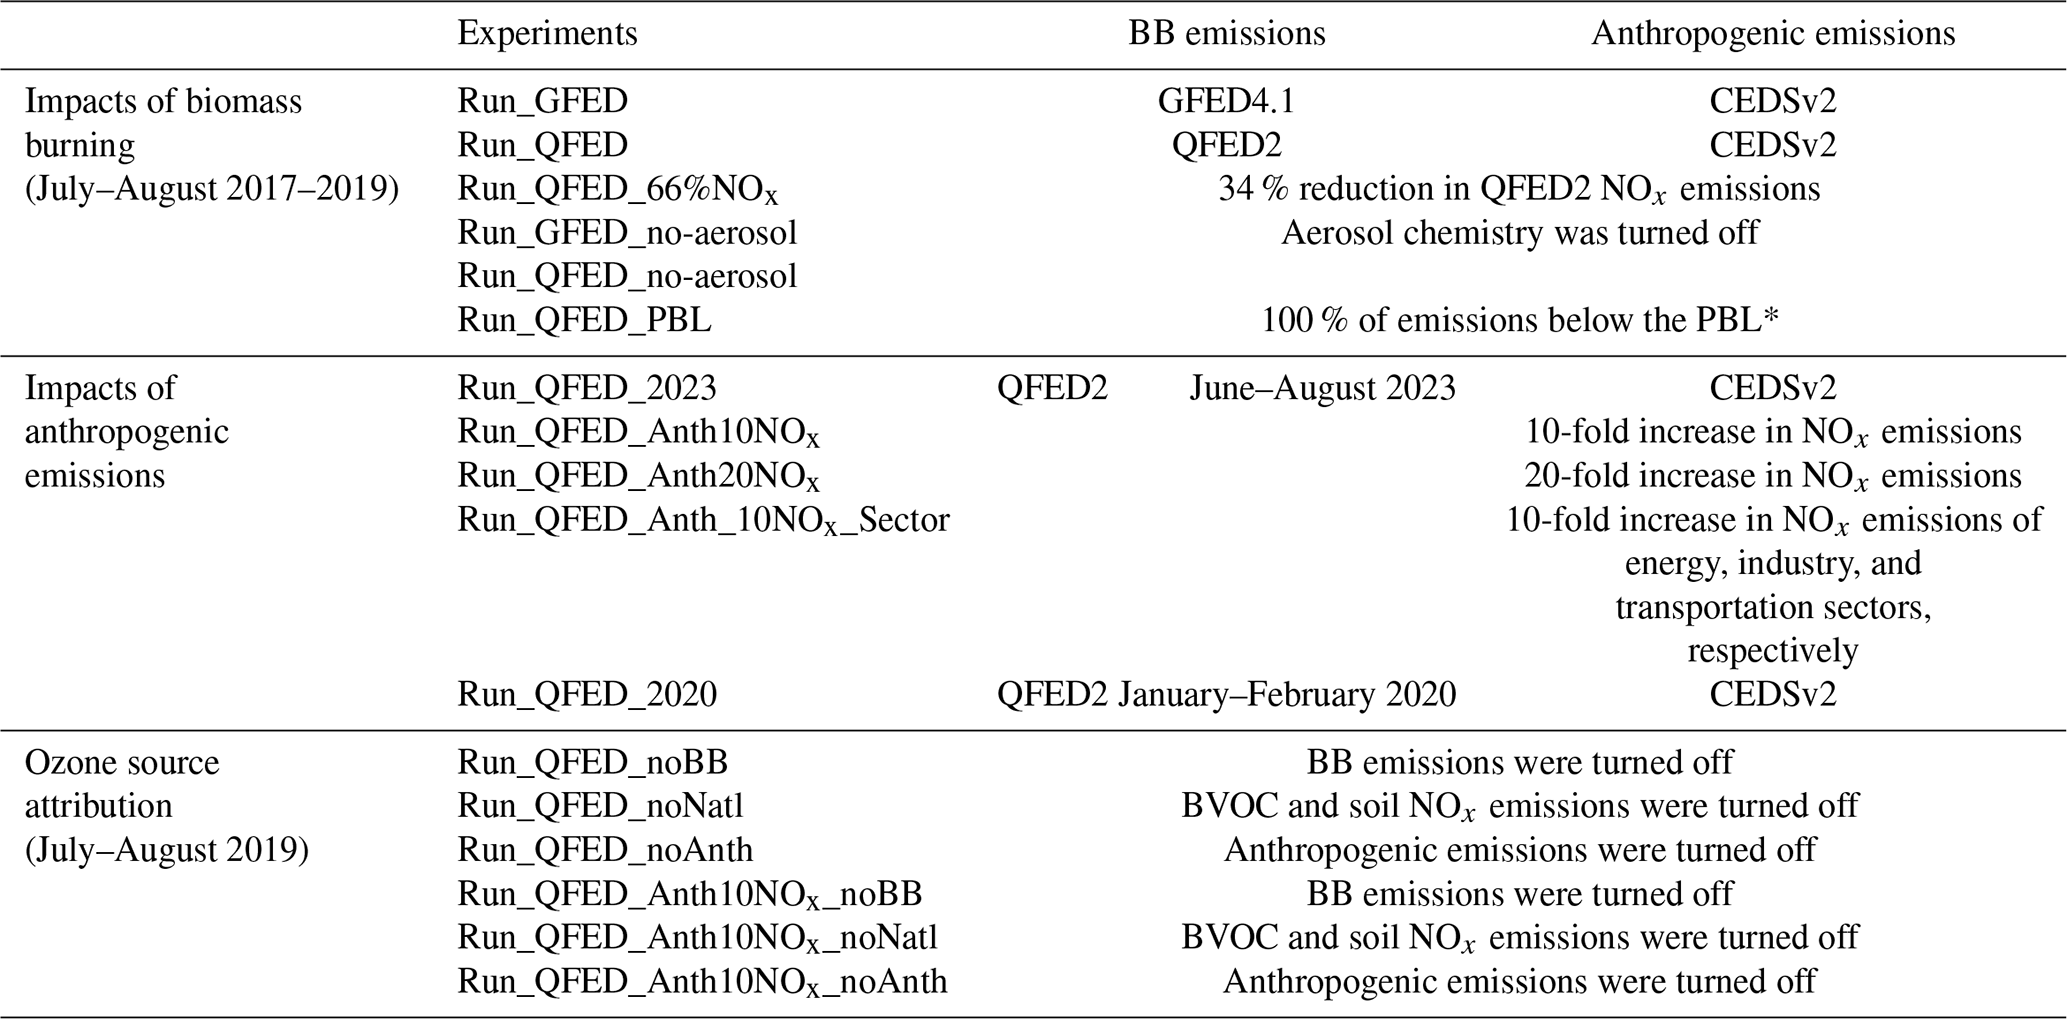
∗ The baseline simulation follows the vertical distribution of QFED2 emissions (i.e., 65 % of emissions below the PBL and 35 % of emissions into the free atmosphere).
2.4 GEOS-Chem model
The atmospheric composition in Africa was simulated by using the nested version of the three-dimensional global chemical transport model GEOS-Chem (version 13.3.3; https://wiki.seas.harvard.edu/geos-chem/, last access: 1 April 2025), which was driven by the Modern-Era Retrospective analysis for Research and Applications version 2 (MERRA-2) meteorological reanalysis dataset. The model domain was for Africa (35° S–30° N, 17° W–50° E) with a horizontal resolution of 0.5°×0.625° and a vertical configuration of 47 layers. The chemical boundary conditions for the nested simulation are provided by the global GEOS-Chem simulation with a horizontal resolution of 2°×2.5°, which was updated every 3 h. The GEOS-Chem model includes fully coupled ozone–NOx–hydrocarbon–aerosol chemistry mechanisms. PM2.5 components include sulfate, nitrate, ammonium, dust, sea salt, organic carbon (OC), and black carbon (BC) (Park et al., 2004).
In Africa, anthropogenic emissions are from the Community Emissions Data System (CEDS) (Hoesly et al., 2018), and biogenic emissions are from the Model of Emissions of Gases and Aerosols from Nature (MEGAN) version 2.1 (Guenther et al., 2012). We simulated hourly concentrations of ozone, NO2, and other pollutants in Africa using the nested GEOS-Chem model with a set of sensitivity simulations (Table 2). Here we focused our experiments on July–August 2019 for all sensitivity and benchmark simulations. In order to investigate the effect of BB on tropospheric ozone, we conducted three model experiments. Firstly, we used the GFED4.1 and QFED2 inventories to simulate the hourly air pollutant concentrations for July–August 2019 (Run_GFED and Run_QFED), respectively, and validated the model results with satellite observations. Then, we conducted a sensitivity experiment by scaling down the QFED NOx emissions to be consistent with satellite NO2 observation (Run_QFED_66%NOx). We used two different BB inventories and turned off aerosol chemistry to explore the effect of aerosols on ozone (Run_GFED_no-aerosol and Run_QFED_no-aerosol). We also explored the effect of emission height on simulated tropospheric ozone by emitting BB pollutants only within the PBL (Run_QFED_PBL).
After evaluating the BB emission inventories at the regional scale, we set up a series of experiments to explore the impact of anthropogenic emissions on tropospheric ozone in southern Africa. Considering that surface air pollutant measurements are only available for June–August 2023, we then used the up-to-date QFED inventory to simulate concentrations of NO2 and PM2.5 in June–August 2023 (Run_QFED_2023) and compared them with five surface air quality observations. We also conducted model simulations for January–February 2020 (Run_QFED_2020) to explore the effect of anthropogenic emissions on tropospheric ozone during the non-fire season. It is noted that we fixed the anthropogenic emissions from CEDS at 2019 in all these simulations due to the lack of up-to-date anthropogenic emission data. Based on the underestimation of surface NO2 observations in the model, we explored the sensitivity of ozone and PM2.5 concentrations to anthropogenic NOx changes by a factor of 10 or 20 over southern Africa (Run_QFED_Anth10NOx and Run_QFED_Anth20NOx); at the city scale, we explored the effects of perturbing anthropogenic NOx emissions in Luanda by a factor of 10 for difference sectors (i.e., power plant, industrial, and transportation) (Run_QFED_Anth_10NOx _Sector).
Finally, we conducted two set of sensitivity simulations to attribute ozone to different emission sources by turning off BB emissions, natural emissions (i.e., biogenic VOCs and soil NOx), and anthropogenic emissions, respectively (Table 2). In particular, we compared the ozone source attribution between the simulations by using the CEDS inventory and 10-fold CEDS NOx emission.
3.1 Emission sources and simulated high ozone over southern Africa
We compared the annual emissions of anthropogenic NOx, soil NOx, and BB NOx, as well as anthropogenic VOCs (AVOCs) and biogenic VOCs (BVOCs) over southern Africa in 2019, as presented in Fig. 2, which were estimated at 220, 914, 3551, 2586, and 32 232 Gg a−1, respectively. It should be noted that here BB NOx emissions are from the GFED4.1 inventory. In terms of NOx emissions, BB emissions are the largest contributor and are about 16 times the NOx emissions from anthropogenic sources. The regions with high anthropogenic emissions are mainly Luanda, Kinshasa, and Lusaka, which are the capitals of Angola, the Democratic Republic of the Congo (DRC), and Zambia, respectively. High vegetation cover in the southern African region leads to high BVOC emissions, which are about 12 times the AVOC emissions.
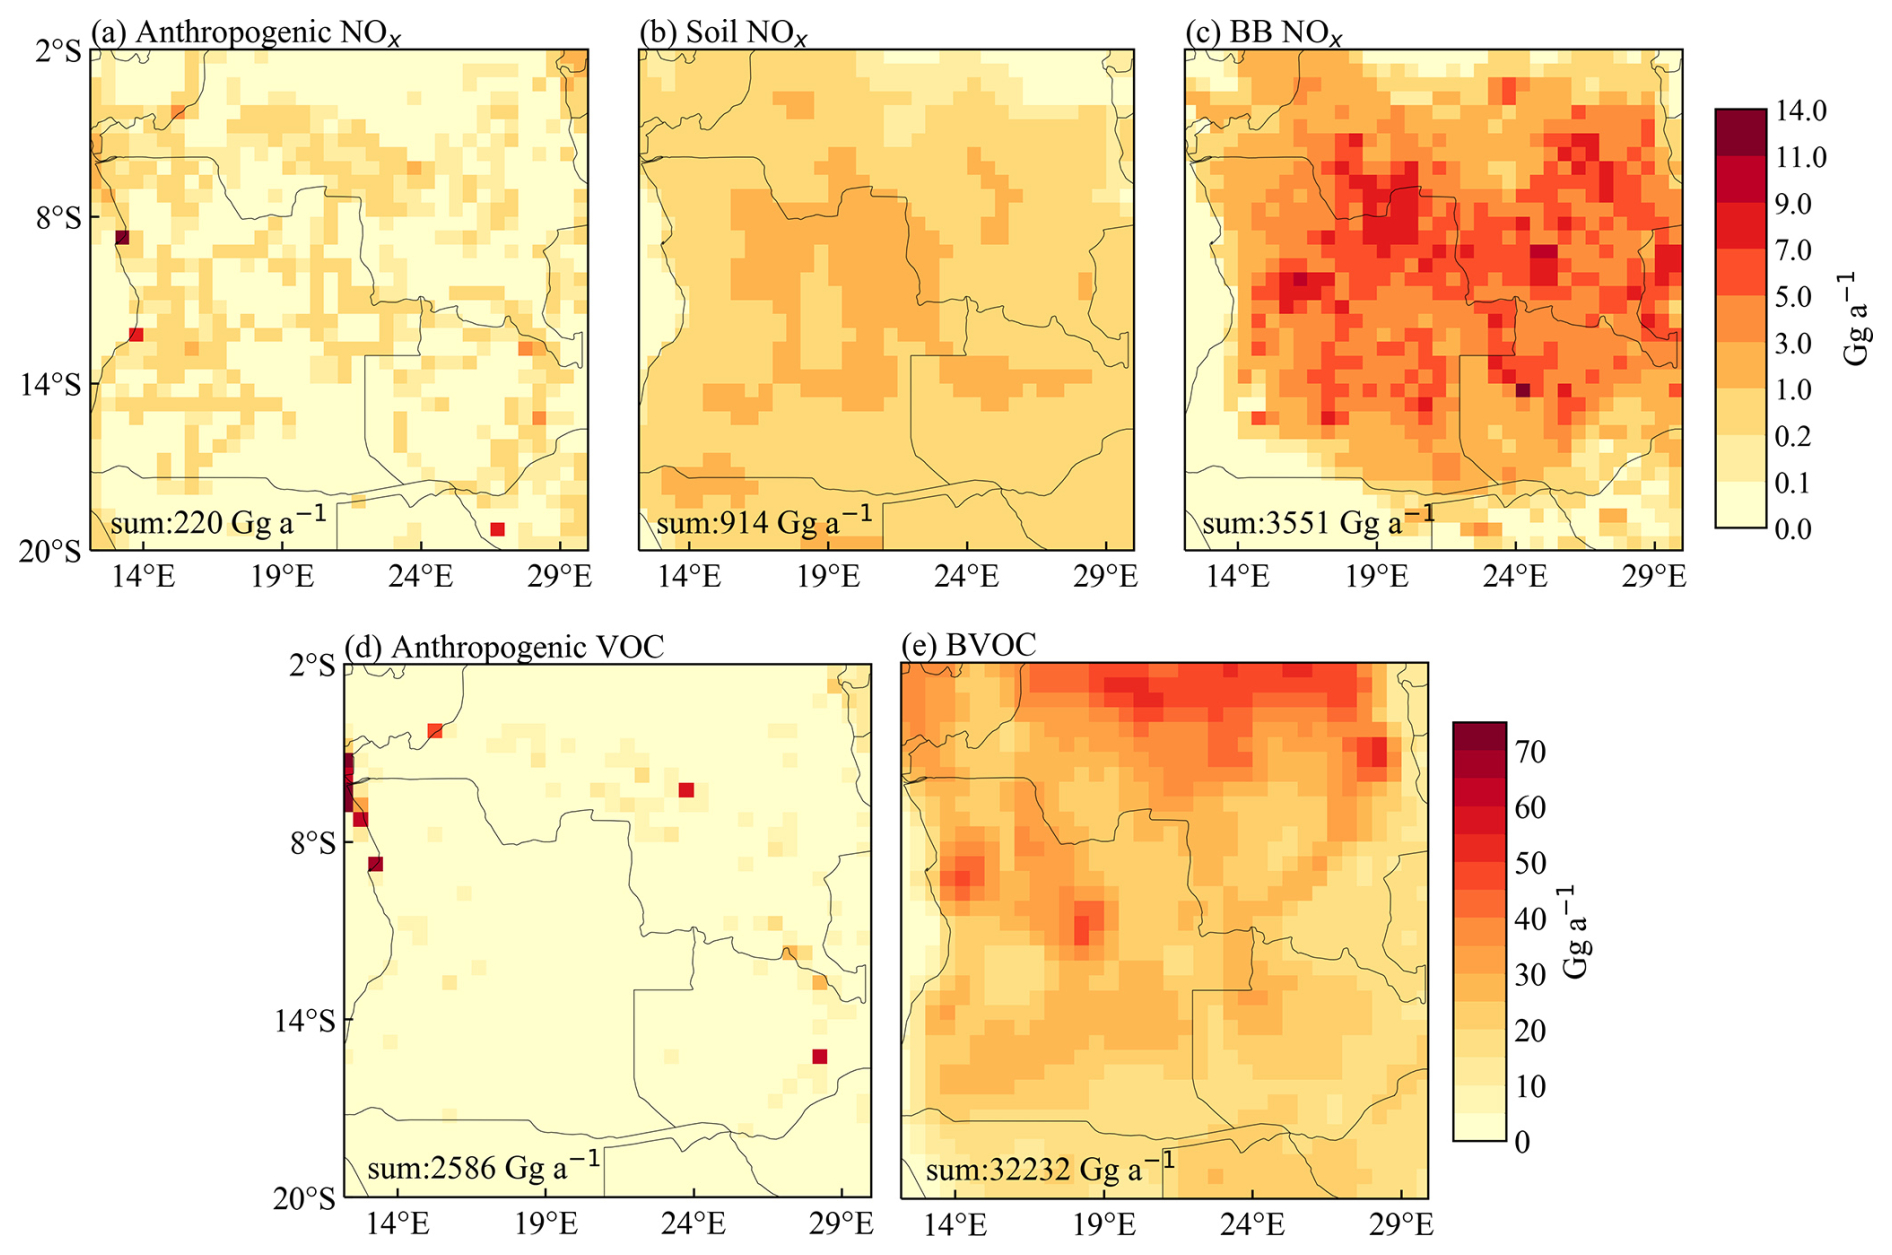
Figure 2Spatial distributions of annual emissions of anthropogenic NOx, soil NOx, biomass burning NOx, anthropogenic VOCs, and BVOCs in 2019 (unit: Gg a−1). Anthropogenic NOx and VOCs are from the CEDSv2 inventory, soil NOx and BVOCs are calculated by the GEOS-Chem model, and biomass burning NOx and VOCs are from the GFED4.1 inventory.
Seasonally, Fig. 3 presents the monthly variations of ozone precursor emissions averaged over southern Africa in 2019. The BVOC emission exhibits a strong seasonal pattern ranging from 2000 to 4000 Gg per month, and it peaks in March and then decreases to the minimum in July–August. This seasonality is consistent with the seasonal variation in isoprene emissions in southern Africa in 2006 as reported by Williams et al. (2009). We can also see that NOx from BB peaks during June–August, which is consistent with the results of Boschetti and Roy (2008). Emissions of BB NOx in January–April and November–December were relatively small. BB VOCs have similar seasonal variability in both inventories, but the GFED4.1 inventory emits 2–3 times as much as the QFED2 inventory in the fire season. The BVOC emissions are generally higher than BB VOC emissions except for those in the months of July–August from the GFED4.1 inventory. The seasonal contrast in BB NOx and BVOC emissions highlights the importance of BB in the production of high summer tropospheric ozone in this region (Vieira et al., 2023).
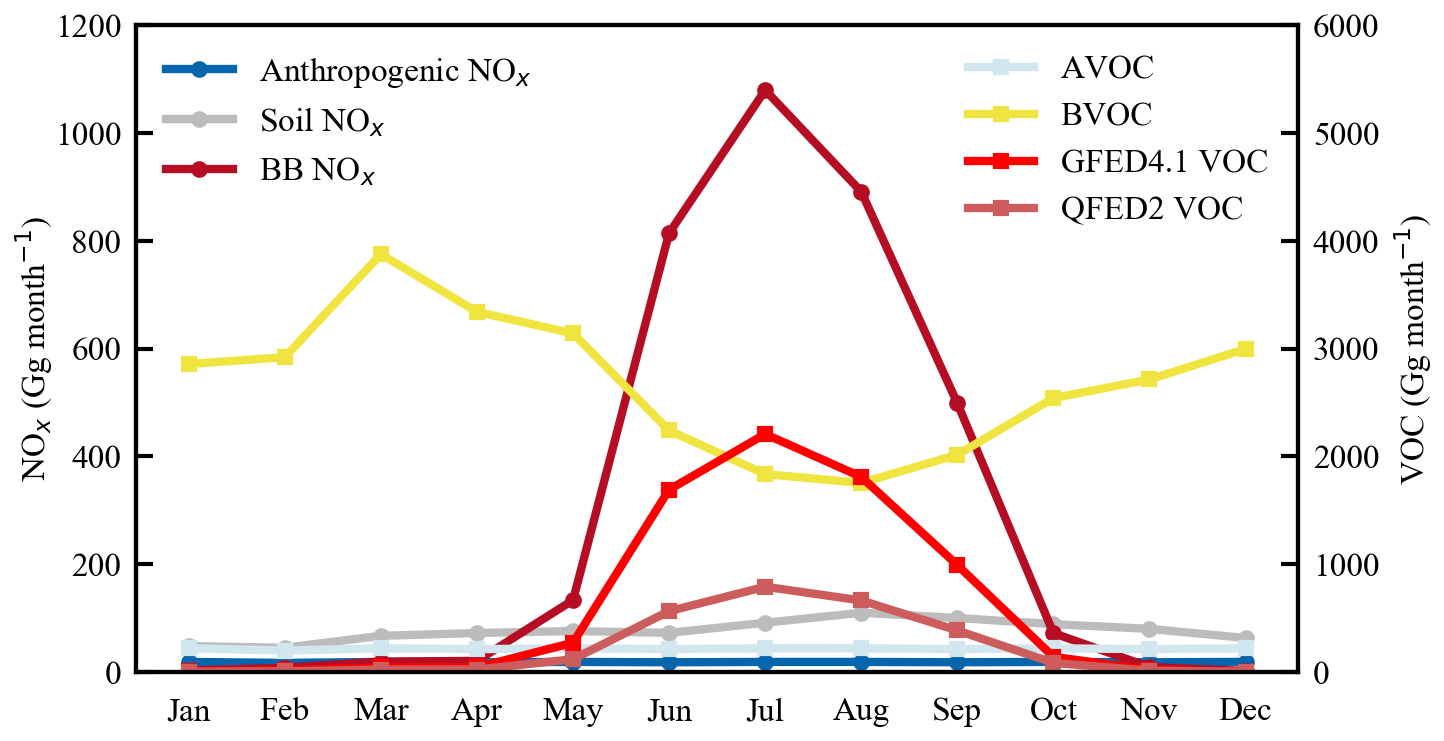
Figure 3Seasonal variations in anthropogenic NOx (deep blue), soil NOx (gray), biomass burning NOx (red), biomass burning VOC (red), anthropogenic VOC (blue), and biogenic VOC (yellow) emissions in 2019 (unit: Gg per month). Anthropogenic NOx and VOCs are from the CEDSv2 inventory, soil NOx and BVOCs are calculated by the GEOS-Chem model, and biomass burning NOx and VOCs are from the GFED4.1 and QFED2 inventory.
Simulated spatial distribution of MDA8 ozone in Africa from July to August 2019 obtained by using the GEOS-Chem model and the GFED4.1 inventory (Run_GFED) as in Fig. 4a. The regional average of MDA8 ozone in southern Africa is about 74 ppb, and the maximum can be up to 120 ppb in northern Angola and southwest Congo. Dewitt et al. (2019) observed a daily ozone maximum of 70 ppb during the dry season in Rwanda, which is adjacent to the DRC, in 2015–2017.
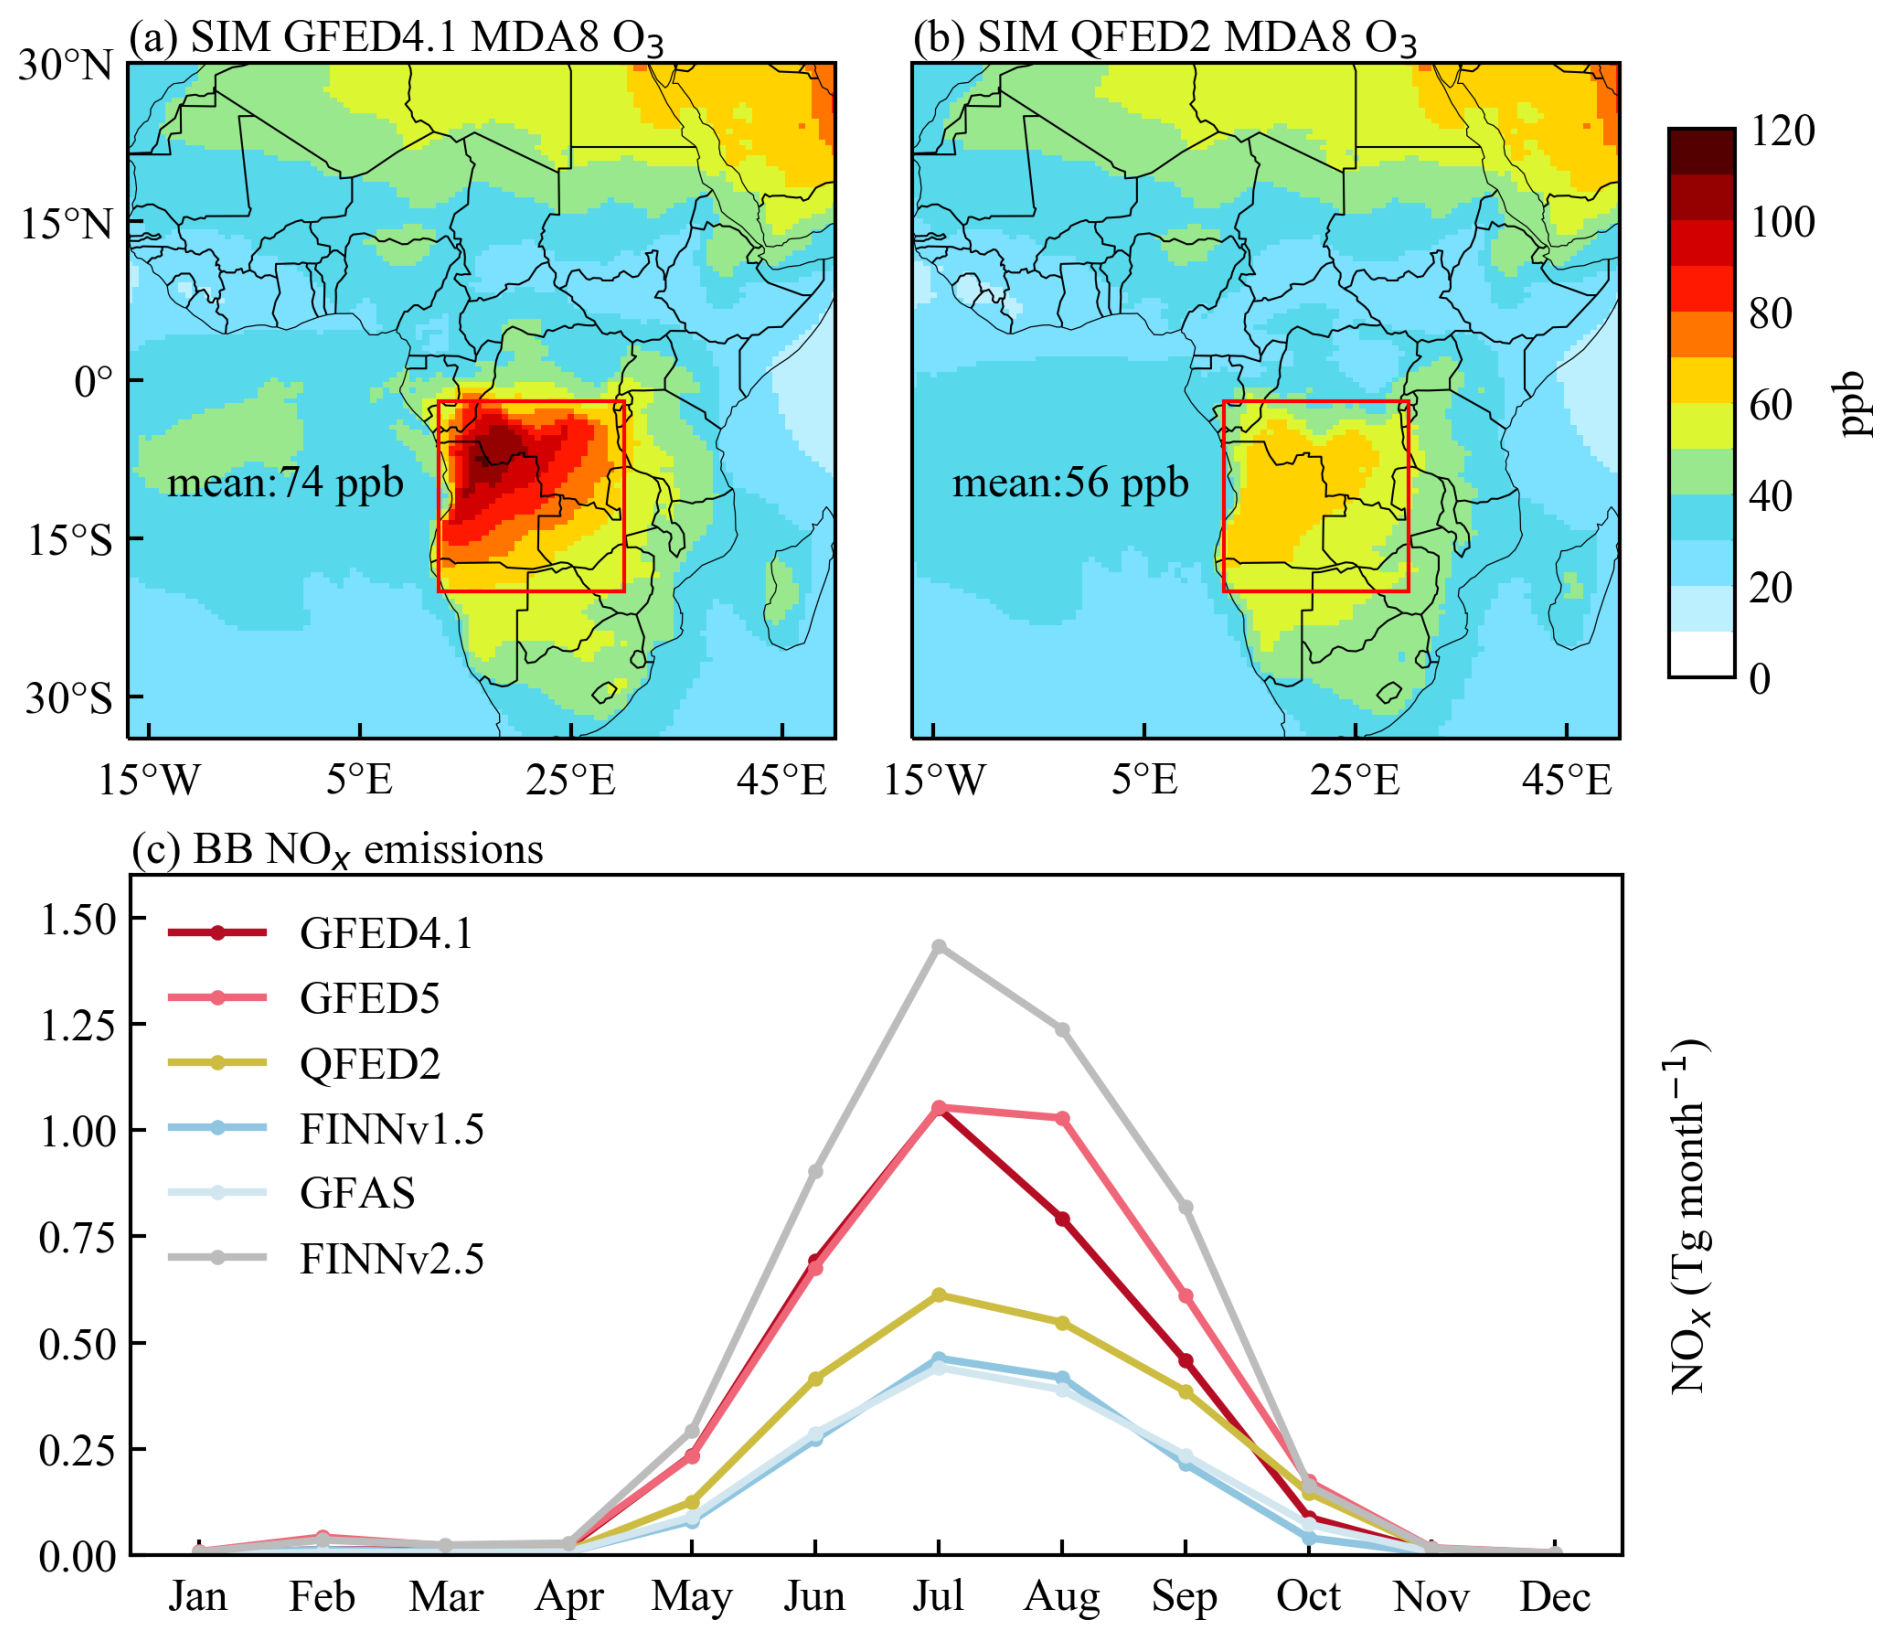
Figure 4Differences in BB NOx emissions and modeled surface ozone from different inventories. (a, b) Surface MDA8 ozone simulated by the GEOS-Chem model for July–August 2019 by the GFED4.1 and QFED2 inventories, respectively. (c) Monthly BB NOx emissions in 2014 averaged over the southern African region.
Based on our simulation results, it can be found that the daily maximum ozone during the BB season is 86 ppb for Rwanda in the Run_GFED run, compared to only 62 ppb in the Run_QFED run. Compared to the observed ozone in Rwanda, it may indicate an overestimation in the baseline simulation (Run_GFED). Figure 5a shows the spatial distribution of simulated tropospheric column ozone concentrations (TCO), with maximum values of up to 50 DU (Dobson unit; 1 DU represents a thickness of 0.01 mm of ozone under standard conditions) mainly in northern Angola and southwest Congo. Higher TCO levels are also seen over the Atlantic Ocean, which are mainly associated with long-range transport (Williams et al., 2010; Meyer-Arnek et al., 2005). Also, in Fig. S2, we find that the GEOS-Chem-simulated (Run_QFED) and OMI tropospheric ozone columns are in good agreement over the Atlantic Ocean after individually subtracting the background ozone values. Considering the strong seasonal variation of surface ozone in southern Africa (Fig. S3) and the estimated ozone precursors from different sources in Fig. 3, here the large differences in simulated surface ozone with different BB inventories demonstrate that BB contributes greatly to high ozone concentrations during the fire season in southern Africa. As such, a better understanding of the high ozone over southern Africa would depend on the accurate estimate of BB emissions.
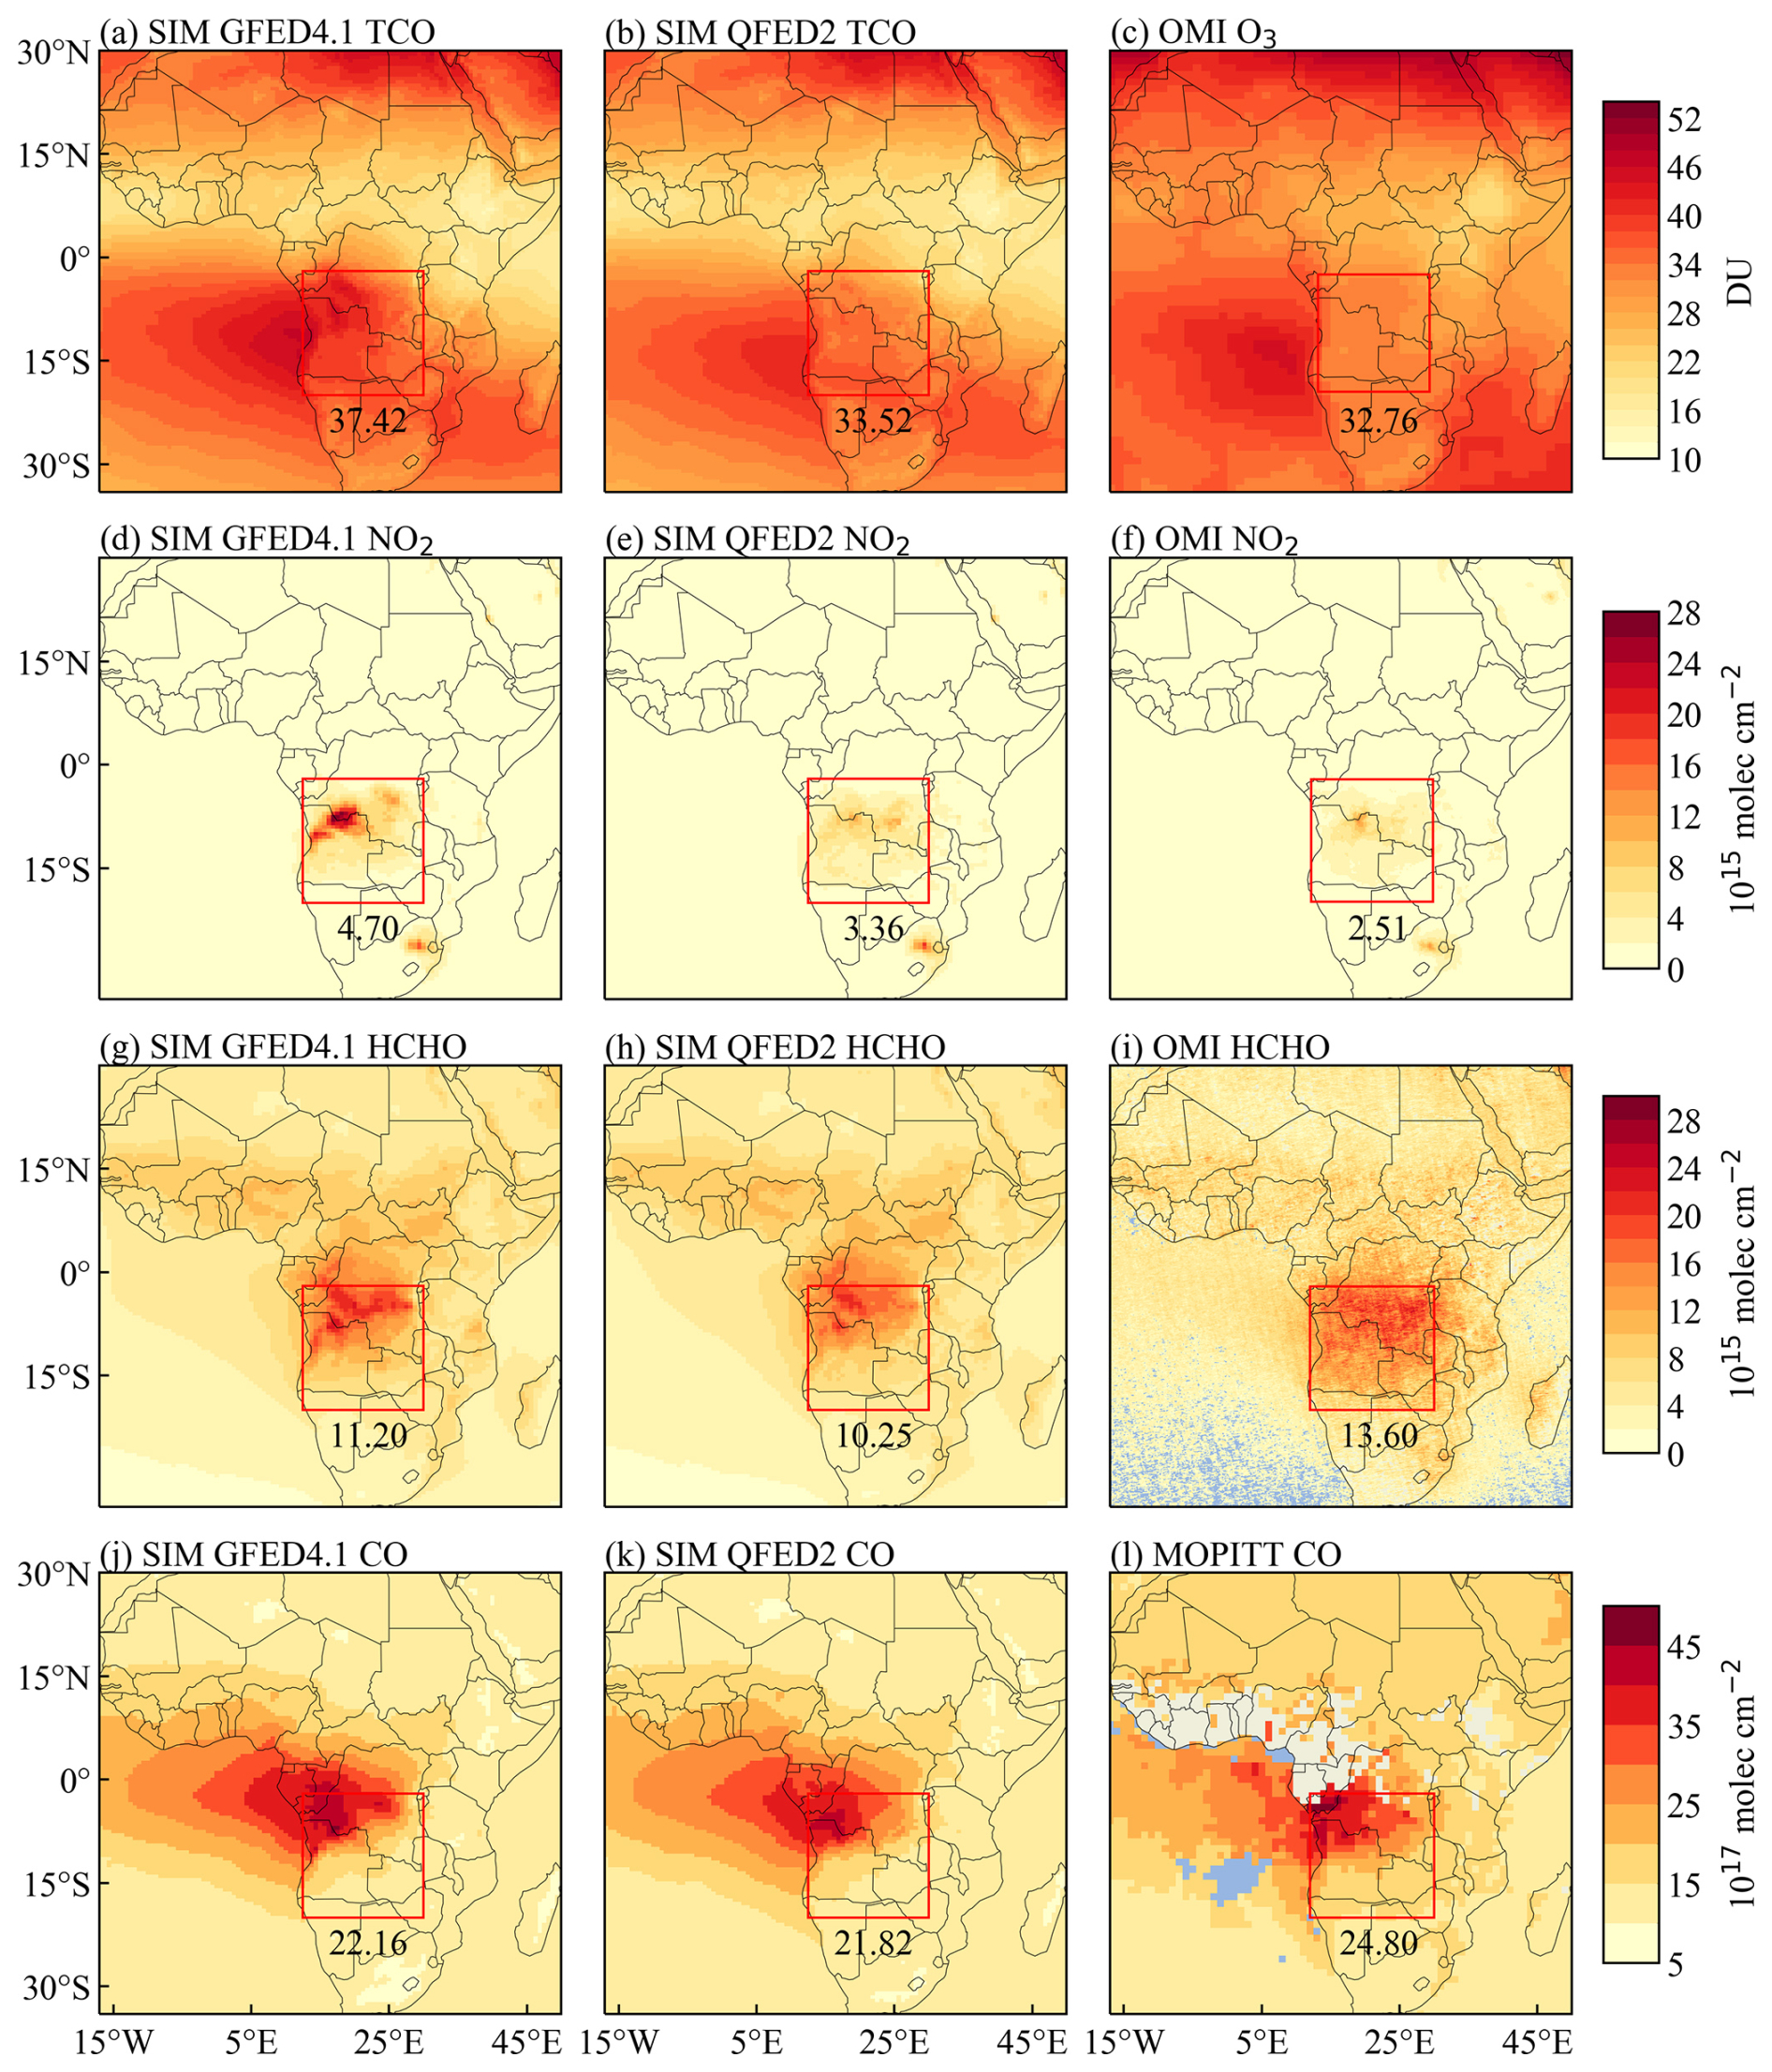
Figure 5The comparison of GEOS-Chem-simulated (left and middle panels) and satellite-based (right panels) tropospheric columns for ozone and its precursors. The simulated TCO, NO2, HCHO, and CO columns in Africa for July–August 2019 were driven by the GFED4.1 and QFED2 inventories, respectively. For CO satellite data, only the July value was used due to the large amount of missing measurements in August. The numbers in the plots are the mean values in the red boxed area.
3.2 Impacts of biomass burning (BB) on tropospheric ozone
3.2.1 Uncertainties in BB emission inventories
Although the GEOS-Chem model has been widely employed for modeling tropospheric ozone globally (Balamurugan et al., 2021; Li et al., 2023), its evaluation against measurements over southern Africa is very limited. In order to accurately evaluate the effects of BB emissions on tropospheric ozone, we need to take the uncertainties from different BB emissions into account (Wiedinmyer et al., 2023).
We compared the monthly emissions of BB NOx in 2014 for southern Africa from the six emission inventories (GFED4.1, GFED5, QFED2, GFAS, FINNv1.5, and FINNv2.5), as illustrated in Fig. 4c. All of the six BB inventories share the similar seasonality in NOx emissions, but there are large differences with a factor of 2–3 in estimated emission intensities, particularly in the dry season. The inventory was divided into two groups based on the level of emissions, with the high-emission groups being FINNv2.5, GFED5, and GFED4.1. FINNv2.5 shows the highest BB NOx emissions, which are 45 % higher than GFED4 emissions and 130 % higher than QFED2 emissions, but Wiedinmyer et al. (2023) also suggests that FINNv2.5 probably tends to overestimate NOx emissions in Africa. GFED5 is an updated version from GFED4.1, and their difference in NOx emissions is smallest in January–July and largest in August. The low-emission groups are QFED2, GFAS, and FINNv1.5. GFAS and FINNv1.5 resemble in the estimated NOx emissions, but both of them are significantly lower than the other inventories. This lower estimate in the bottom-up FINNv1.5 inventory may be attributed to the underestimated burned area and emissions (Wiedinmyer et al., 2011), and the lower top-down GFAS estimate could be due to the smaller emission factors (Liu et al., 2020a). Therefore, in the following, we will use the GFED4.1 and QFED2 inventories to represent the high estimate and low estimate of BB NOx emissions for southern Africa, respectively.
Spatially, there are also evident differences among different biomass burning inventories (Fig. S4). The spatial distribution of the high values in GFED4.1 and QFED2 is generally consistent with a spatial correlation coefficient of 0.76, with both showing high emissions in northeastern Angola. In contrast, the GFED5 inventory has high NOx emissions concentrated in southwestern Congo, and its spatial distribution differs considerably with QFED2. The GFAS inventory has a similar spatial distribution with QFED2 (a correlation coefficient of 0.84), but GFAS cannot capture the localized high emissions as shown in QFED2 and GFED4.1. However, FINNv1.5 and FINNv2.5 exhibit a very different spatial distribution compared to other inventories, with low emissions in Angola and high emissions in the Congo region. Their spatial correlation coefficients with the QFED2 inventory are 0.06 and 0.31, respectively.
In addition to NOx emissions, the VOC emissions are the highest in the GFED5 and FINNv2.5 inventories, and the other four inventories show much smaller VOC emissions. Each inventory adopts different specific ratios for emitted chemical species, but they also differ with each other. For example, there is a NOxOC ratio of 1:0.6 in GFED4.1; 1:1.5 in GFED5, GFAS, and FINNv1.5; 1:3 in QFED2; and 1:1 in FINNv2.5 (Fig. S5).
3.2.2 Simulated tropospheric ozone with different BB emissions
The simulated spatial distribution of MDA8 ozone in Africa during the fire season (July–August) in 2019 with the GFED4.1 and QFED2 inventories is given in Fig. 4a and b, respectively. The simulated surface MDA8 ozone by the GFED4.1 inventory is 74 ppb over southern Africa, which is 32 % higher than the value of 56 ppb by the QFED2 inventory. The maximum value of MDA8 ozone by the GFED4.1 inventory can reach up to 120 ppb, but the maximum value by the QFED2 inventory is only 70 ppb. This remarkable discrepancy suggests that the uncertainties in BB emissions could play an important role in simulating surface ozone over southern Africa. This is consistent with previous findings that BB emissions lead to strong ozone increases in southern Africa during the fire season (von Clarmann et al., 2007; Jaffe and Wigder, 2012). For the tropospheric ozone, Fig. 5a and b show the simulated spatial distribution of TCO by using the GFED4.1 and QFED2 inventories. In contrast to surface ozone, the regional average of TCO simulated by the GFED4.1 inventory is only 4 DU (11 %) higher than that simulated by the QFED2 inventory. We will show the simulated ozone difference between these two inventories is mainly caused by BB NOx emissions, while BB VOC emissions only impact ozone levels slightly (Fig. S6).
To evaluate the model performance in simulating the vertical profile of tropospheric ozone in Africa, we compared the model results with ozonesonde observations from Ascension Island, UK (7°96′ S, 14°91′ W), in Fig. 6. As shown in Fig. 1, Ascension Island is located downwind of the high-BB area, and ozone and its precursors from BB can be transported from southern Africa to the South Atlantic (Mari et al., 2008), leading to ozone enhancement in Ascension Island (Jenkins et al., 2021). The ozone concentrations modeled by GEOS-Chem respond well to the ozonesonde observations in terms of vertical distribution, and in particular the model captures the variation in observations with altitude well. The differences in ozone vertical distribution due to the two BB inventories are notable in the troposphere below 6 km, in particular at the altitude range of 3–6 km (Fig. S7). Compared to the ozonesonde observations, this bias can be also found while GEOS-Chem captures the vertical ozone variations well regardless of which inventory is used. This is consistent with the results of small TCO differences in Fig. 5.
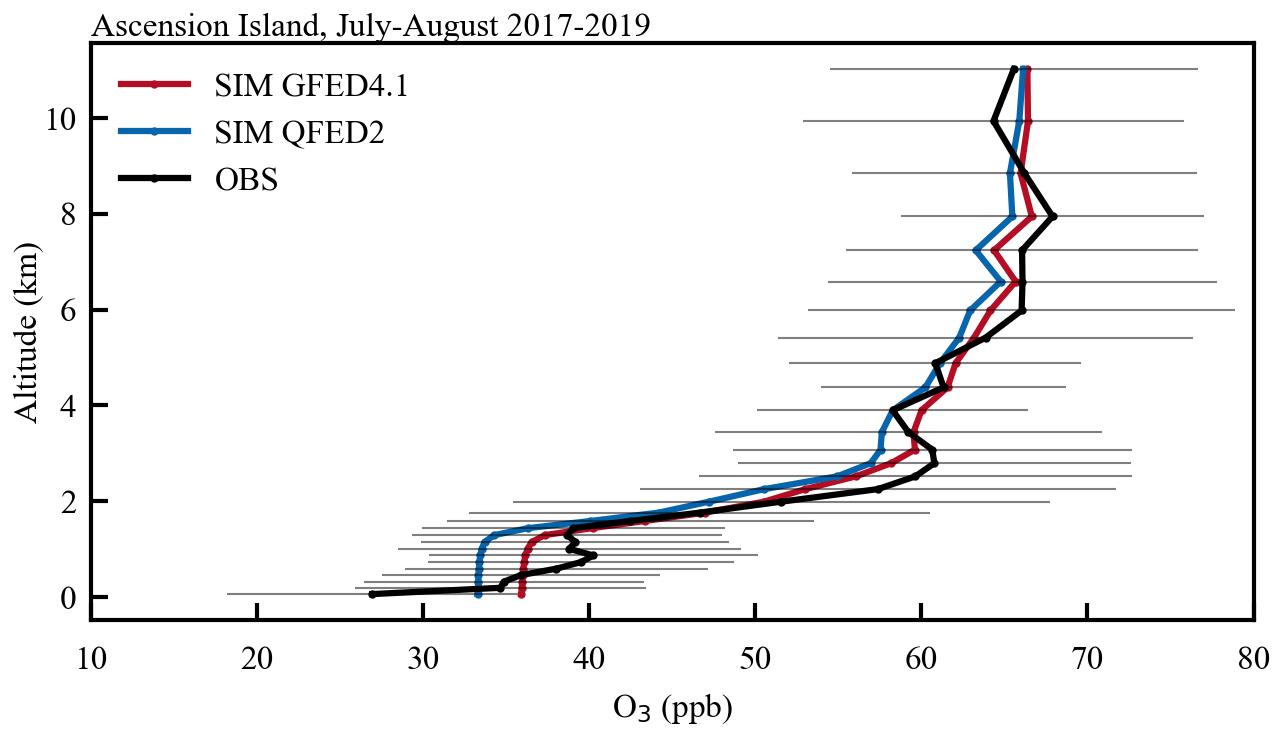
Figure 6The comparison of GEOS-Chem-simulated and measured vertical ozone distributions over Ascension Island, UK, for July–August 2017–2019. The model results by the GFED4.1 (red) and QFED2 (blue) inventories are both given.
3.2.3 Satellite constraints on BB emission estimates
In order to evaluate the tropospheric ozone simulation in the Africa region, in Fig. 5 and Table S1 in the Supplement we compared the simulated columns with the GFED4.1 and QFED2 inventories against satellite observations of TCO and ozone precursors (e.g., NO2, CO, and HCHO). The simulated TCO with GFED4.1 inventory shows high values of up to 50 DU near the fire source regions in northern Angola and southern DRC, as well as in the downwind region over the Atlantic Ocean. The OMI TCO has the regional average of 37.4 DU, suggesting an overestimation of 14 % in the GFED4.1 simulation relative to OMI. In contrast, the simulated TCO with QFED2 inventory is strongly spatially consistent with the OMI satellite, with a slight overestimation of 2.3 %.
We also compared the simulated and observed tropospheric NO2 columns in Fig. 5d and e. The GFED4.1 inventory simulation exhibits a high value of up to near the BB source region, but there is a large overestimation of 87 % with respect to the OMI satellite data. Anderson et al. (2021) reached similar conclusions – that the model using the GFED4.1 inventory can capture high NO2 in Africa, but the bias was as high as 100 %. This is in agreement with previous studies that model the simulation trend to produce a high bias towards BB activities in Africa (Souri et al., 2024). However, the QFED2 inventory simulation can greatly reduce this high bias, with an overestimation of only 34 %. In Fig. S8, we also compared the model results with the TROPOMI satellite data, and a similar high bias was also found in the modeled NO2 columns. If we further have QFED2 NOx emissions reduced by 34 %, as shown in Fig. S9, it can effectively reduce the bias for NO2 columns from 34 % to 0.4 % and reduce the overestimation of the TCO columns to 1.1 %. It is noted that this comparison between the simulated and satellite-based tropospheric columns could be biased due to their different representativeness in vertical profiles of chemical species. Anyway, this sensitivity simulation demonstrates the important role of BB NOx emissions in tropospheric ozone production. In contrast, we find that the BB VOC emissions from the GFED4.1 inventory are about 3 times the QFED2 inventory in the fire season, but the regional mean changes are only 2.5 ppb for MDA8 ozone and 0.94 DU for TCO for July–August 2019 in response to a tripled QFED2 VOC emissions (Fig. S6).
HCHO is one of the important VOCs in the troposphere, and a comparison of simulated and satellite-derived tropospheric HCHO columns is given in Fig. 5g–i. The HCHO column concentrations simulated by GEOS-Chem and the satellite observations exceeded in northern Angola and southwest DRC, and the underestimated HCHO columns in GEOS-Chem might be due to some missing VOC species (Zhao et al., 2024) and the lower anthropogenic NOx emissions in southern Africa that both affect the chemical production of HCHO. Simulated HCHO column concentrations between the GFED4.1 inventory and the QFED2 inventory were consistent spatially, with only a difference of on a regional basis. The levels and spatial distributions of HCHO are mainly influenced by BVOC and BB emissions. Firstly, the Congo Basin, as one of the largest tropical rainforests, emits a large amount of BVOCs that can be oxidized to generate high values of HCHO (Wells et al., 2020). It leads to a spatial distribution of HCHO similar to the distribution of BVOC sources. Secondly, BB is found to be one of the main sources of HCHO in the African continent (Liu et al., 2020b). Differences in VOC and NOx emissions between the GFED4 inventory and the QFED inventory (Van Der Werf et al., 2017) may account for the slightly different HCHO columns, e.g., BB VOC emissions in GFED4.1 being 2 times those of the QFED2 inventory in 2019.
Table 3Monthly anthropogenic NOx emissions in southern Africa and Luanda (unit: Gg per month).
The simulated CO columns in Fig. 5j–l are spatially similar to MOPITT retrievals, with high values in the downwind regions of fire sources. The regional average of CO column concentrations simulated by GEOS-Chem is underestimated by approximately 10 % compared to MOPITT, which reflects a long-lasting issue of CO underestimation in the GEOS-Chem model (David et al., 2019; Ni et al., 2018). Hoelzemann (2006) used a variety of BB emission inventories to drive the MOZART model to simulate CO concentrations in southern Africa in September–October 2000, and they showed that all simulations exhibited an underestimation against the MOPITT CO. In addition, we also found that the simulated spatial distributions of CO columns are similar to each other among different BB inventories, and their regional difference is only 1 %. This suggests that neither HCHO nor CO is the main reason for the overestimation of ozone production.
We compared the spatial distribution of modeled and satellite-based AOD as shown in Fig. 7. The simulation results by both inventories can capture the spatial variability of MODIS AOD. But simulated regional mean AOD by the QFED2 inventory overestimated MODIS AOD by 26 %, while the GFED4.1 inventory underestimated MODIS AOD by 37 %. Tian et al. (2019) used GFED4 as an input to drive the GEOS-Chem model and also showed that the model tended to underestimate the intensity and spatial distribution of AOD in the African region. The inconsistency between these two inventories may be attributed to the discrepancy in carbonaceous aerosol emissions, since the OC and BC emissions from GFED4 are only half of the QFED emissions (Chang et al., 2023). In addition, the difference between OC and BC in the biomass burning emission inventories could affect ozone simulation through aerosol chemistry, and the results are shown in Fig. S10. Aerosol chemistry mainly influences ozone formation by altering photolysis and heterogeneous processes. On the one hand, aerosol can change the shortwave radiation reaching the ground through scattering and absorption, which in turn affects the photolysis rate. On the other hand, aerosol can update reactive radicals (e.g., HO2, nitrogen radicals) that are critical for ozone formation. After turning off aerosol chemistry alone in the model, regional surface ozone was increased by 10 ppb and TCO by 2 DU using GFED4.1, while using the QFED2 regional ozone was increased by 14 ppb and TCO by 4 DU. As such, the lower level of aerosols in GFED4.1 may be a reason for the overestimation of simulated ozone concentrations.
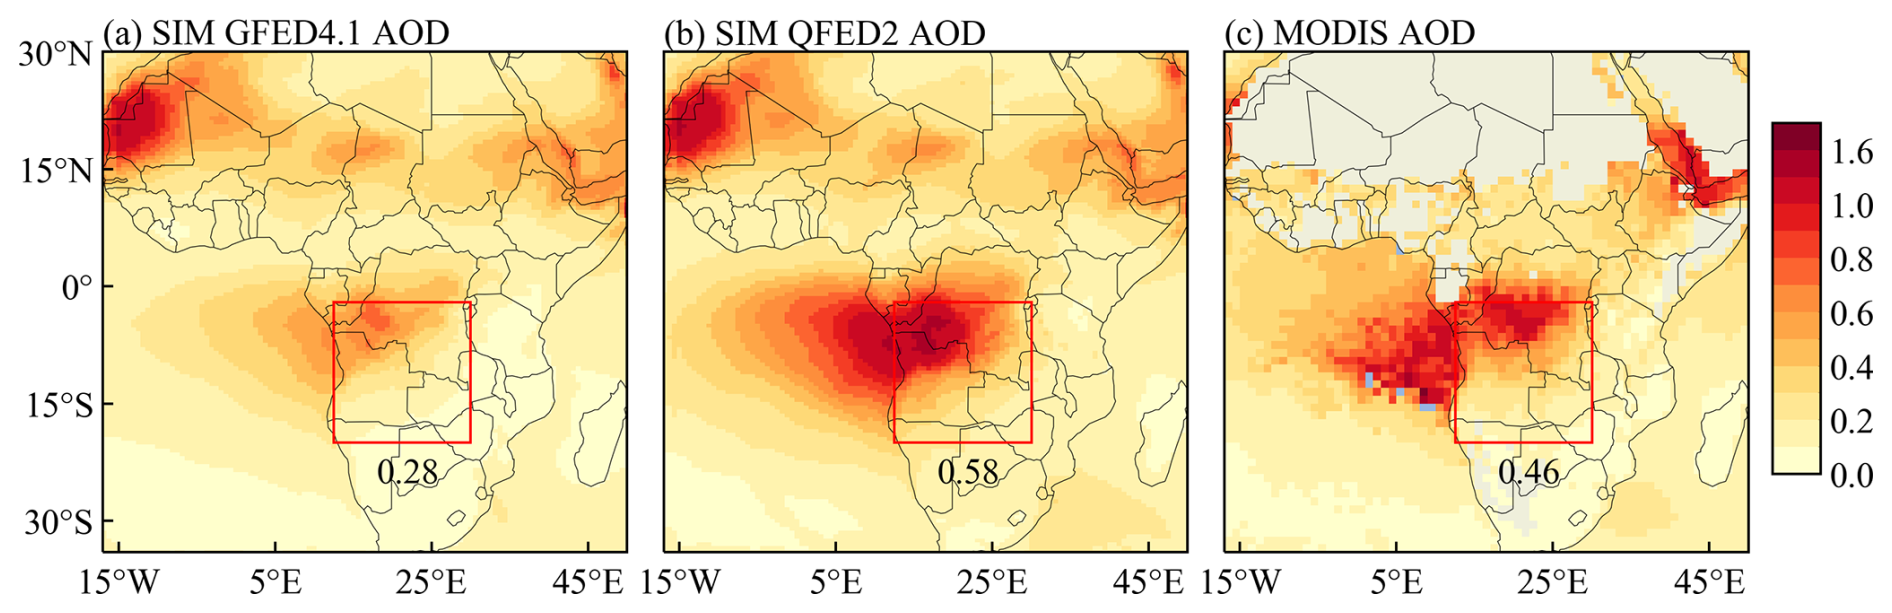
Figure 7The comparison of GEOS-Chem-simulated AOD in Africa in July–August 2019 with the MODIS AOD. The model results by the GFED4.1 (a) and QFED2 (b) inventories are both given.
In conclusion, the widely used GFED4.1 inventory has a large bias in simulating tropospheric ozone in southern Africa, and the QFED2 inventory exhibits much more consistent results with satellite observations in terms of simulated concentration levels and spatial distributions (Table S1). This bias is mainly due to the overestimation of NOx emissions in southern Africa in GFED4.1. Firstly, NOx emissions in GFED4.1 are 38 % higher than in QFED2 in southern Africa. Secondly, the modeled NO2 column in GFED4.1 shows a high bias compared to QFED2 and satellite observations, while the modeled HCHO and CO columns are generally consistent between the GFED4.1 inventory and the QFED2 inventory. Thus, we conclude that the overestimation of ozone in southern Africa simulated with GFED4.1 is due mainly to the overestimation of NOx, and the lower aerosol levels in GFED4.1 may be a minor reason for the overestimation of modeled ozone concentrations. We will use the QFED2 inventory for BB emissions in the following analysis.
3.2.4 Role of BB emission heights in ozone simulation
The representativeness of BB emission injection heights is also an important factor that can impact ozone simulations (Rémy et al., 2017). We conducted a sensitivity experiment using the QFED2 inventory and allowed all BB emissions emitting below the PBL. In Fig. 8, the impact of this vertical partitioning on surface ozone varies regionally. At the surface, the changes in MDA8 ozone were within ±2.4 ppb, and the BB source areas showed a decreased ozone. For TCO, the simulated mean values with this vertical partitioning were 0.2 DU higher than those without vertical partitioning, but the magnitude of this effect is smaller than the TCO changes (∼4 DU) caused by the difference in BB NOx emissions between the GFED4.1 inventory and the QFED2 inventory. Thus, our simulations demonstrate that the configuration of BB emission height has a limited effect on surface ozone level but a moderate influence on TCO columns in this region.
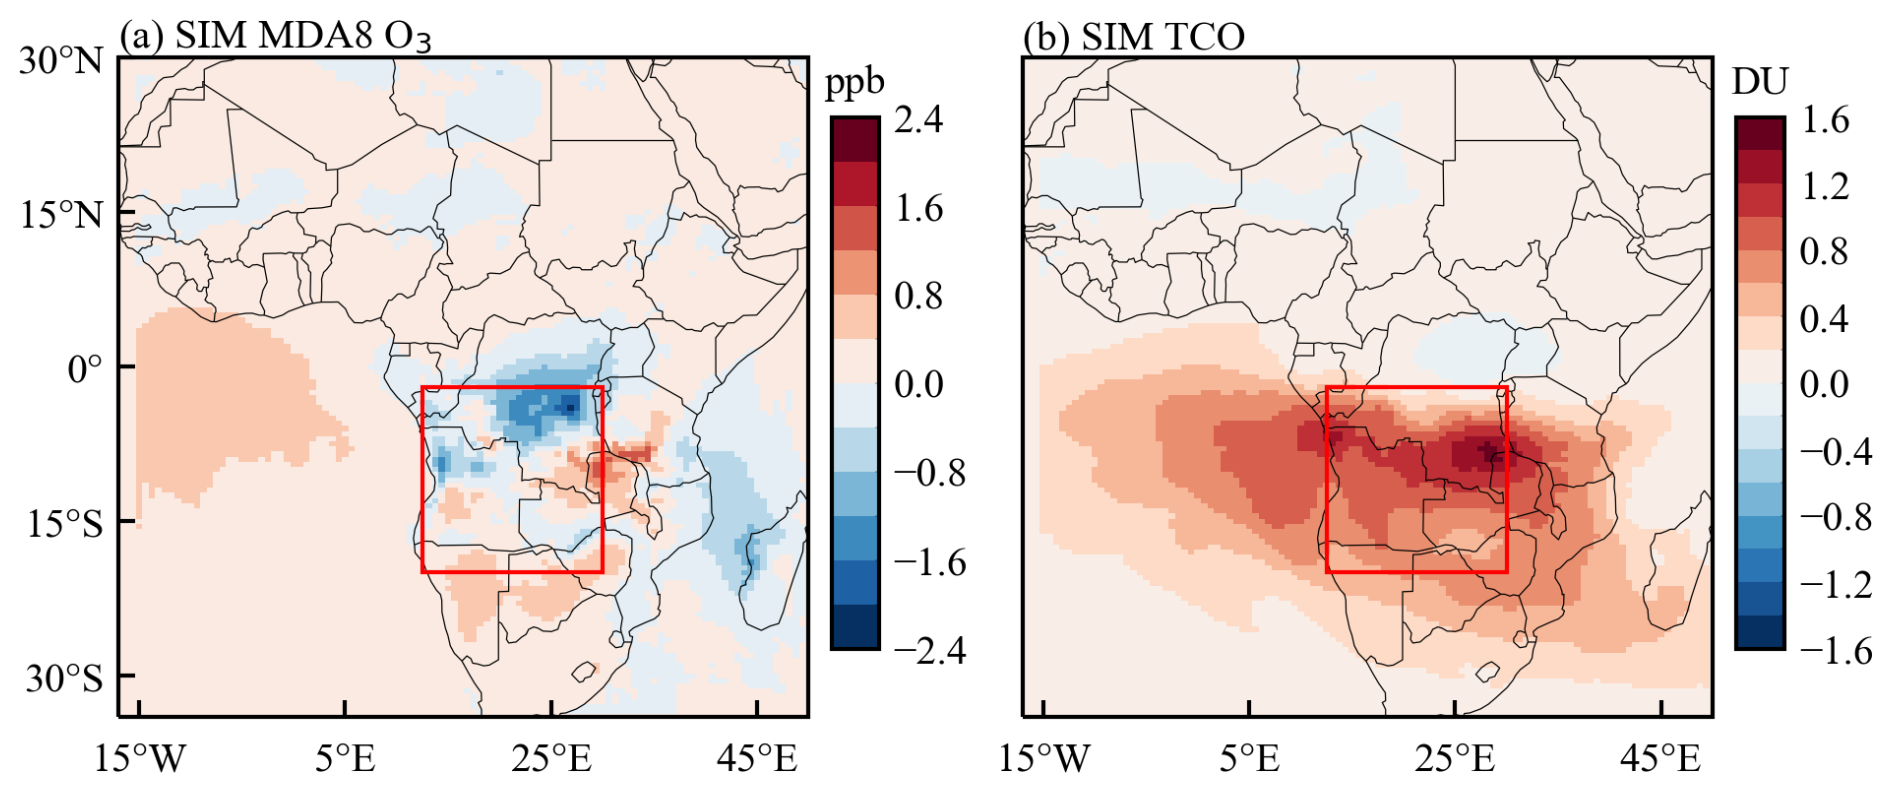
Figure 8Effects of vertical partitioning of model BB emissions in surface MDA8 ozone and tropospheric ozone columns. The baseline simulation follows the vertical distribution of QFED2 emissions (i.e., 65 % of emissions below the PBL and 35 % of emissions into the free atmosphere), and the sensitivity simulation allows 100 % of BB emissions emitted below the PBL. Here the plots are the differences between the baseline simulation (Run_QFED) and the sensitivity simulation (Run_QFED_PBL).
3.3 Impacts of anthropogenic emissions on tropospheric ozone
3.3.1 Uncertainties in anthropogenic emission inventories
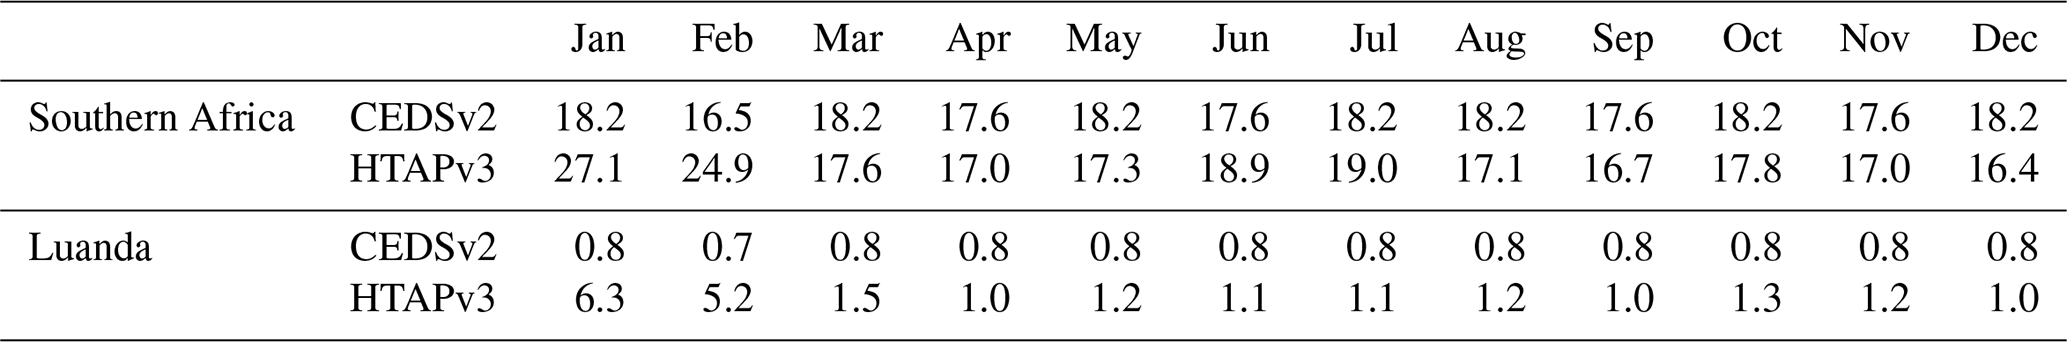
Uncertainties may exist in anthropogenic emissions from a regional scale to urban cities in southern Africa. For example, in Table 3 we compared the differences in NOx emissions between two widely used global inventories: the Community Emissions Data System (CEDSv2) and Hemispheric Transport of Air Pollution (HTAPv3). Whether in southern Africa or Luanda, there is a missing seasonality in NOx emissions in CEDSv2, whereas NOx emissions in HTAPv3 are much higher in January–February than in other months. Over southern Africa, monthly NOx emissions in the CEDSv2 are about 30 % lower than HTAPv3 in January–February. For Luanda, the CEDSv2 inventory is 87 % lower than HTAPv3 in January–February 2018 and 20 %–50 % lower in the other months. In addition, the validation of anthropogenic emission in global inventories was barely evaluated in this region, and we will take advantage of recently available surface measurements and satellite retrievals to fill this gap.
3.3.2 Model evaluation against surface measurements of NO2 and PM2.5
Currently, there are very few surface observations in southern Africa. However, in the study, there are three cities (Humpata, Luanda, and Luena) that have continuous surface measurements of NO2 during the period of June–August 2023 and four cities (Humpata, Luanda, Luena, and Lusaka) with surface measurements of PM2.5. These measurements are critical to understand the hotspots of urban anthropogenic emissions as indicated in Fig. 2a. Luanda is the capital of Angola with dense population, and the median surface NO2 concentrations observed at this station ranged from 10 to 30 ppb. The Humpata station is located at Universidade Privada de Angola, where the observed NO2 concentrations ranged from 5 to 25 ppb, with large day-to-day variations of up to 20 ppb. The Luena station is located in a residential area of Luena, where the observed NO2 concentrations were much higher than those of the previous two stations, with a maximum of 50 ppb. Figure 9 shows the comparison of the observed and simulated daily surface NO2 concentrations in Luanda, Humpata, and Luena, respectively. The modeled NO2 concentrations for all three cities are much lower than the observed values, which are underestimated by 90 %. There is also a large underestimation of surface NO2 in Luanda compared to the observations from Campos et al. (2021). This indicates that urban NOx emissions in our model are highly underestimated in southern Africa, although the lack of model resolution accuracy is also a reason for the underestimation at the station scale.
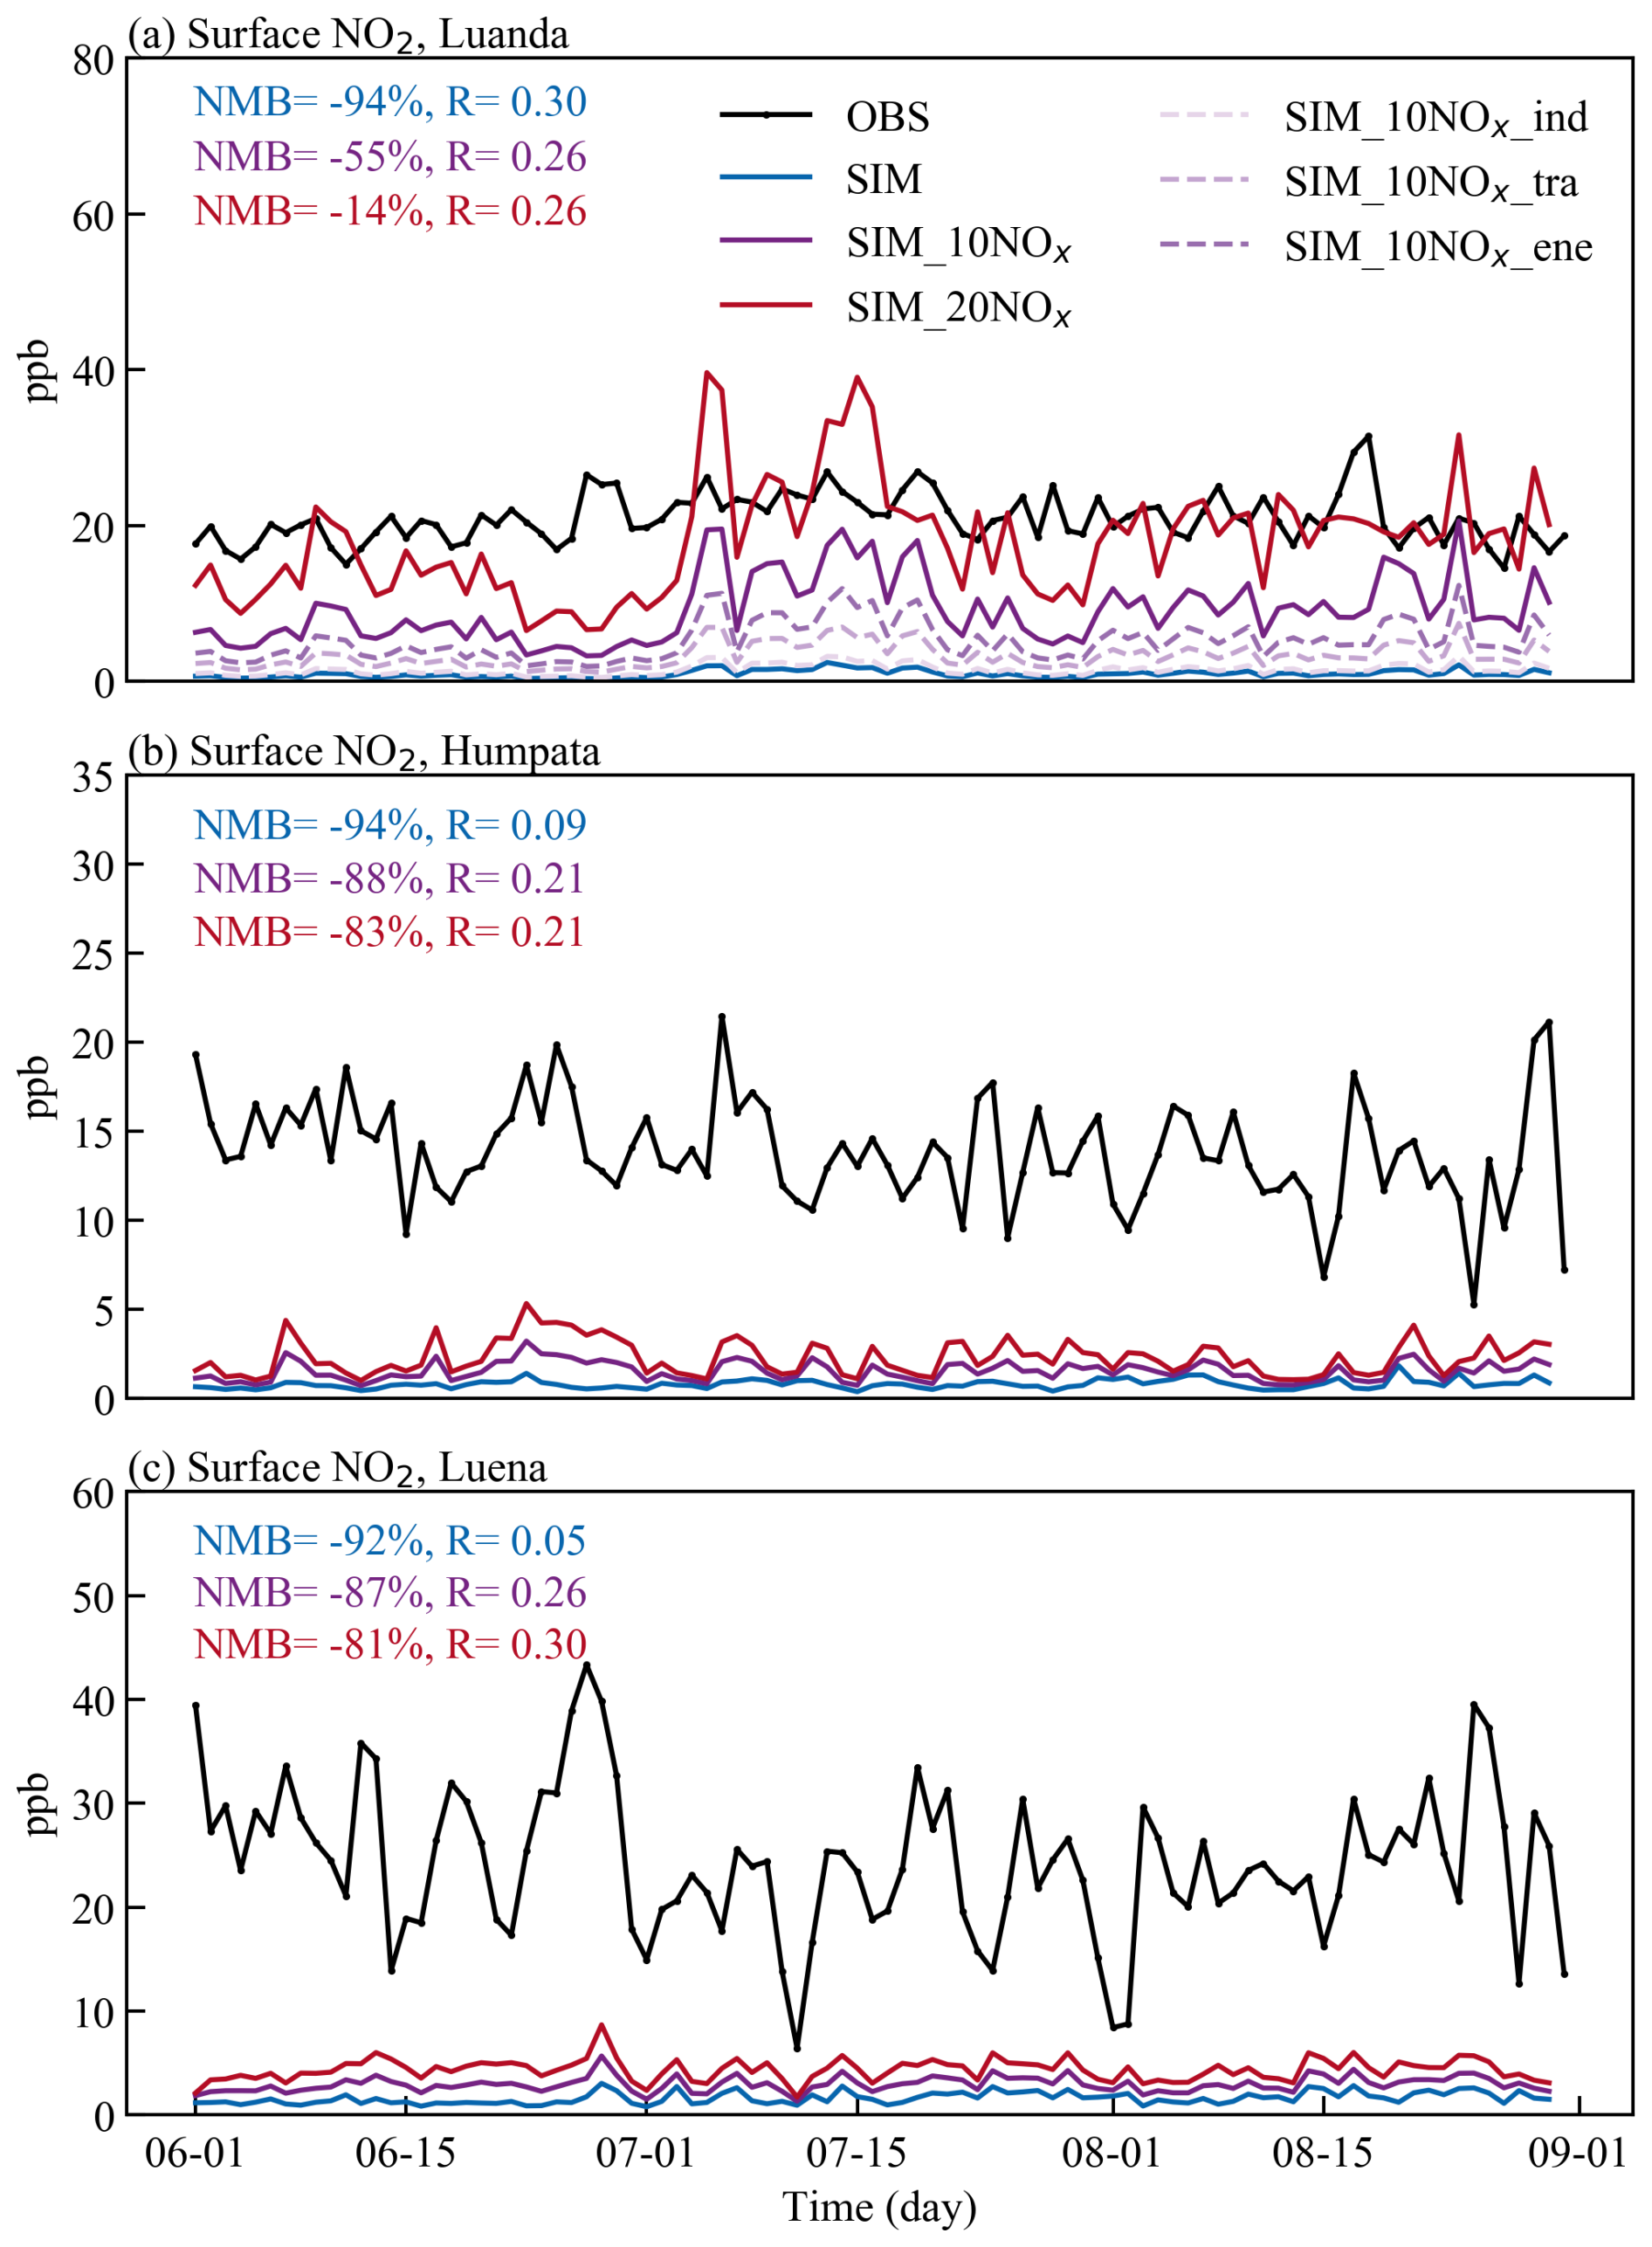
Figure 9Time series of simulated and observed daily median surface NO2 concentrations in southern African cities (Luanda, Humpata, Luena) in June–August 2023. The model was driven by the QFED2 inventory and fixed CEDSv2 inventory in 2019. “SIM” denotes the baseline simulation (Run_QFED_2023), and “SIM_10NOx” and “SIM_20NOx” denote the 10-fold and 20-fold increase in NOx emissions from CEDSv2. The dashed lines indicate a 10-fold increase in NOx emissions from the energy (ene), industry (ind), and transportation (tra) sectors, respectively, in the CEDSv2 inventory.
To test the sensitivity of simulated NO2 concentration to urban emissions, we increased the NOx emissions in the CEDSv2 inventory by a factor of 10, and the model results are shown in Fig. 9. In Luanda, the normalized mean bias (NMB) of simulated NO2 concentrations is decreased from −94 % in the baseline simulation to −55 %, while the changes in NO2 in Humpata and Luena are very limited, with an improvement of the NMB of only 5 %. Even when NOx emissions are scaled up by a factor of 20, the simulated NO2 concentrations in Humpata and Luena are increased by only 11 %–21 %. As such, for Luanda, there may be an underestimation of NOx emissions in the CEDSv2 inventory. But for Humpata and Luena, the CEDSv2 inventory is not capable of correctly estimating the anthropogenic sources, leading to the small sensitivity of simulated NO2 concentration to perturbed urban emissions.
Although this study focused on ozone simulation, the comparison of model results against the valuable PM2.5 measurements is also meaningful to understand urban emissions in this region. Figure 10 shows the time series of observed and simulated PM2.5 concentrations in June–August 2023. The PM2.5 concentrations observed at both the Humpata and Luanda sites were around 10 µg m−3. The PM2.5 concentrations at the Luena site were slightly higher compared to the other two sites, with median concentrations ranging from 10 to 70 µg m−3. Lusaka is the capital of Zambia, and the observed site is located within the urban area of Lusaka, where PM2.5 concentrations were about 10 µg m−3 in June–July and then suddenly increased to about 20 µg m−3 in August. Figure S11 shows the comparison of simulated and observed PM2.5 concentrations, and the model can capture the day-to-day variation in PM2.5 concentrations at Luena as well as Lusaka sites, with NMBs of −12 % and 24 % and correlation coefficients of 0.7 and 0.87, respectively. But in Luanda and Humpata, there is a large overestimation in simulated PM2.5 concentration, and a large proportion of PM2.5 components is contributed by dust, possibly due to the influence of the Namib and Kalahari deserts (Nyasulu et al., 2023). We excluded dust concentration in the calculation of total PM2.5 concentration for the time being, due to its large uncertainties in the GEOS-Chem simulation (Weagle et al., 2018). After removing dust concentration, the NMB in the model will be reduced from 149 % to 37 % in Luanda.
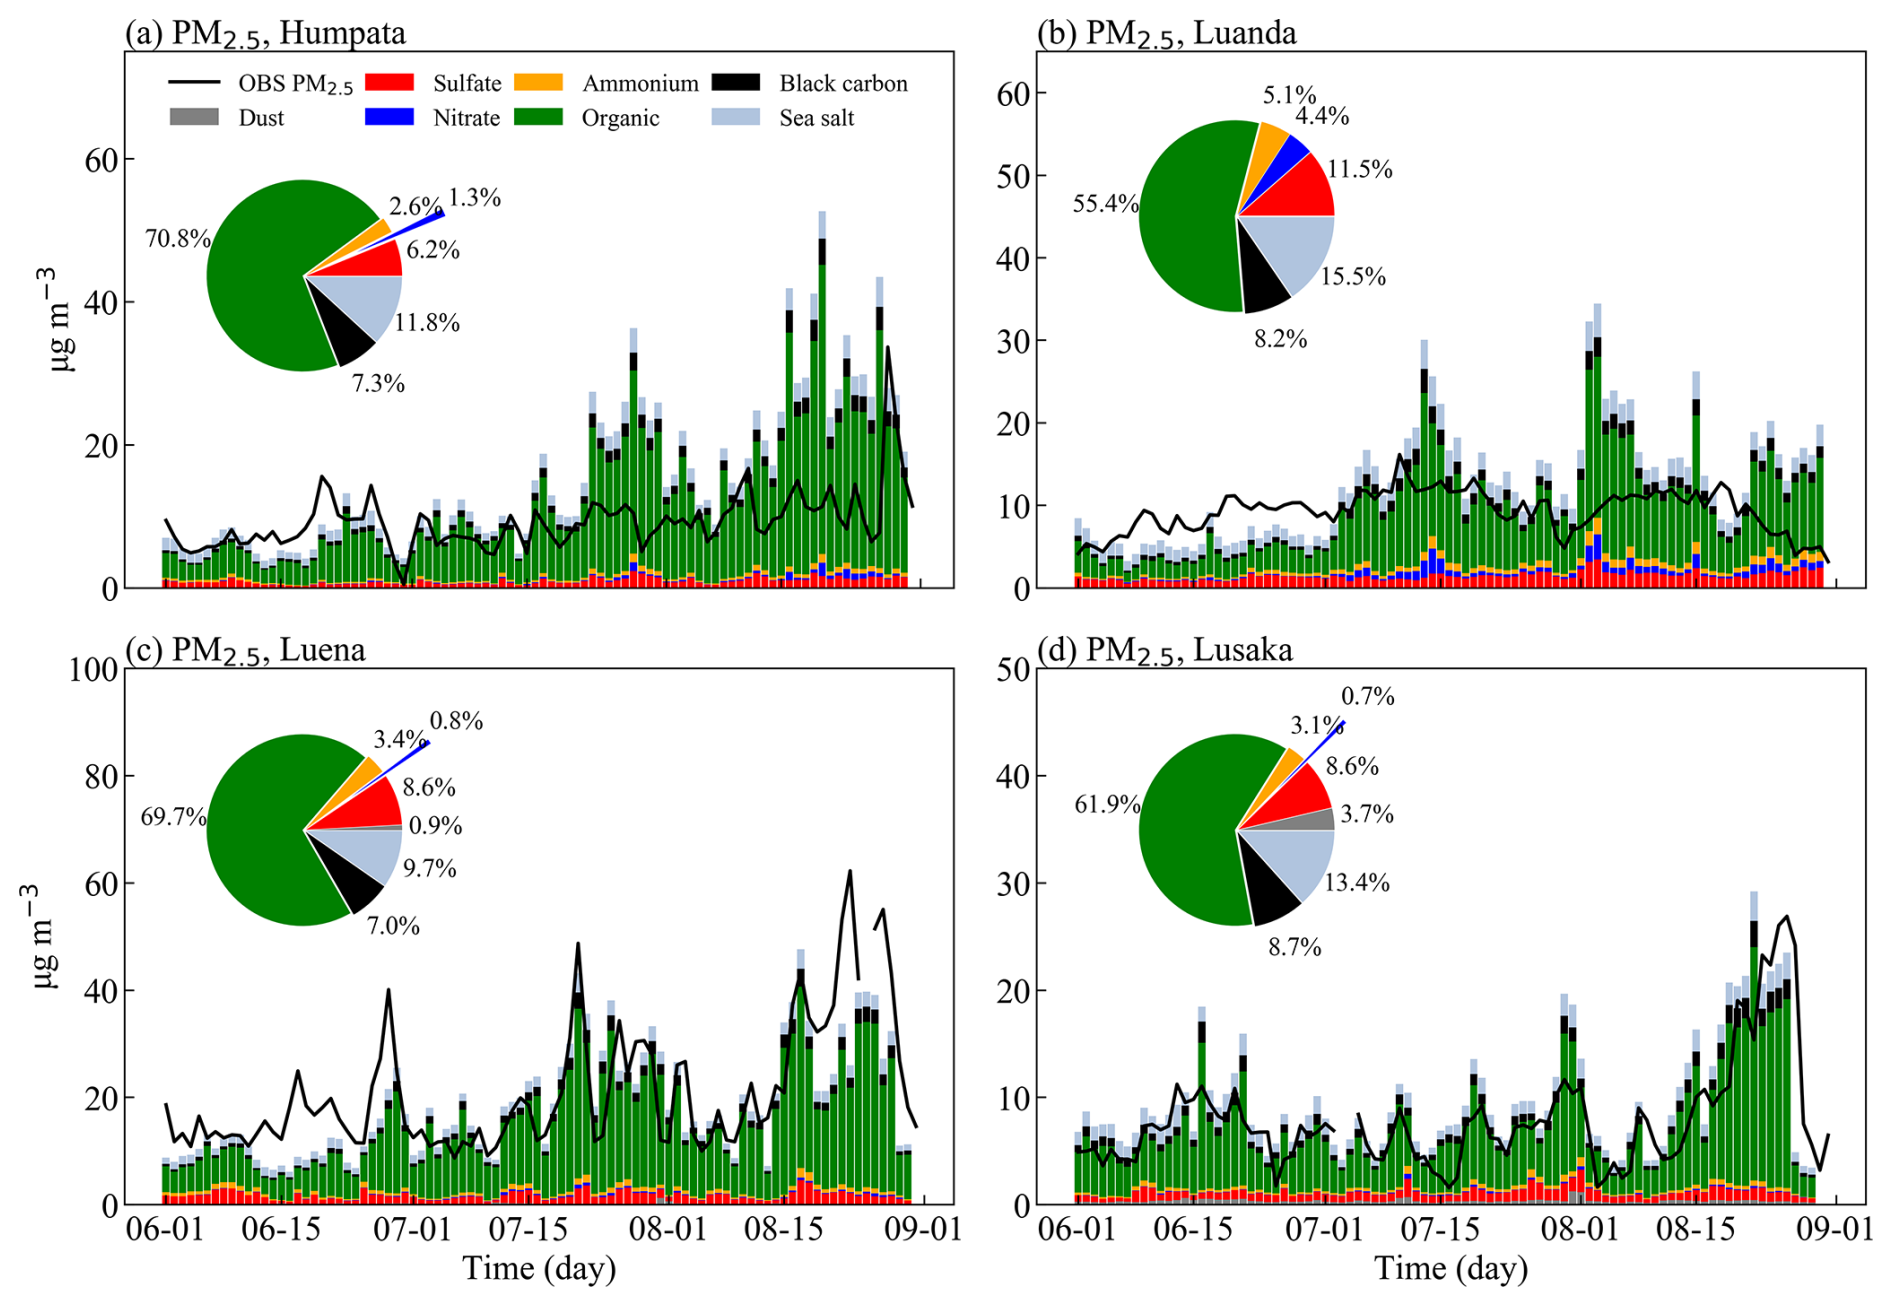
Figure 10Comparison of simulated time series of PM2.5 and its components against with the observed PM2.5 (black line) during June–August 2023. Panels (a) and (b) are for Humpata and Luanda, respectively, where we removed dust concentrations from the simulated PM2.5 due to the large uncertainties in the model, and panels (c) and (d) are for Luena and Lusaka, respectively. The pie charts show the percentage contributions of each component to total PM2.5 concentrations.
In terms of PM2.5 components, the highest contribution of OC to PM2.5 concentrations is found at all the four sites, which can be attributed to the effects from biomass burning (Nyasulu et al., 2023). Secondary inorganic aerosols account for about 20 % at Luanda and about 10 % at other sites. In addition, we also compared the changes in PM2.5 concentrations at each site after scaling up anthropogenic NOx emissions by a factor of 10 and found that PM2.5 at the Luanda site can increase by up to 50 µg m−3. In previous studies, changes in PM2.5 concentrations in southern Africa have often been attributed to BB (Nyasulu et al., 2023; Booyens et al., 2019). However, this study shows that anthropogenic emissions in Luanda could also have a great impact on PM2.5 concentrations, highlighting the underappreciated role of anthropogenic emissions in urban air quality over southern Africa.
We further explored the sensitivity of ozone concentration to perturbed NOx emissions. Figure S12 shows the response of ozone concentration at each site after anthropogenic NOx was increased by 10 times. Relative to the baseline run, the 10-fold increase in NOx simulation can increase ozone concentrations by 0–10 ppb in the Humpata and Luena regions. However, in Luanda there was increased ozone in June but decreased ozone in July–August in response to a 10-fold increase in NOx emissions, indicating that ozone chemistry in Luanda may be likely to shift into a transition regime with increasing emissions. Again, these results confirm that the underestimation of anthropogenic emissions in the urban areas of southern Africa now can have an important impact on local ozone assessment.
Although there is a lack of surface ozone observations in southern Africa that can be directly compared with our model results, we can conclude from the model evaluation against surface NO2 and PM2.5 measurements that (1) the large underestimation in modeled urban-scale NO2 in southern Africa is mainly due to large low biases of NOx emission in the CEDSv2 inventory, i.e., a strong underestimation in Luanda and the misrepresentation of anthropogenic emission estimates in Humpata and Luena; (2) the model is able to capture the observed variations in PM2.5 concentrations in the areas that are less affected by dust; and (3) the bias in anthropogenic emission inventories can strongly affect the assessment of PM2.5 and ozone concentrations in urban southern Africa.
3.3.3 Model evaluation against satellite measurements
Satellite observations were further used to support the deduction of the underestimated urban emissions. As the capital of Angola, Luanda has much higher anthropogenic emissions compared to other cities in southern Africa. In the following, we focused on Luanda, where satellite signals to detect NOx emissions could be stronger. Figure 11 shows the simulated and satellite-based NO2 columns for the fire season (July–August 2019) and non-fire season (January–February 2020), respectively. To minimize the effects from background levels, here the NO2 values are the columns at Luanda minus the mean columns averaged over the sea downwind. For July–August 2019, the urban NO2 enhancement in Luanda simulated by the model was 26 % lower than that observed by TROPOMI; for January–February 2020, the simulated NO2 enhancement was underestimated by 61 % compared to TROPOMI. Due to the decreased contribution from anthropogenic sources to NO2 columns during the fire season, the moderate underestimation during the fire season (July–August 2019) in Luanda may be due to the long-term transport of pollutants from biomass burning to urban areas. As suggested by TROPOMI satellite data, NOx emissions from CEDSv2 were underestimated by at least a factor of 2 in urban Luanda. At the same time, we find that the NO2 enhancement in Luanda observed by OMI was 70 % lower compared to TROPOMI, and the OMI instrument cannot detect the high emissions in Luanda, demonstrating the advantage of the TROPOMI instrument in observing regions with significant NOx spatial heterogeneity.
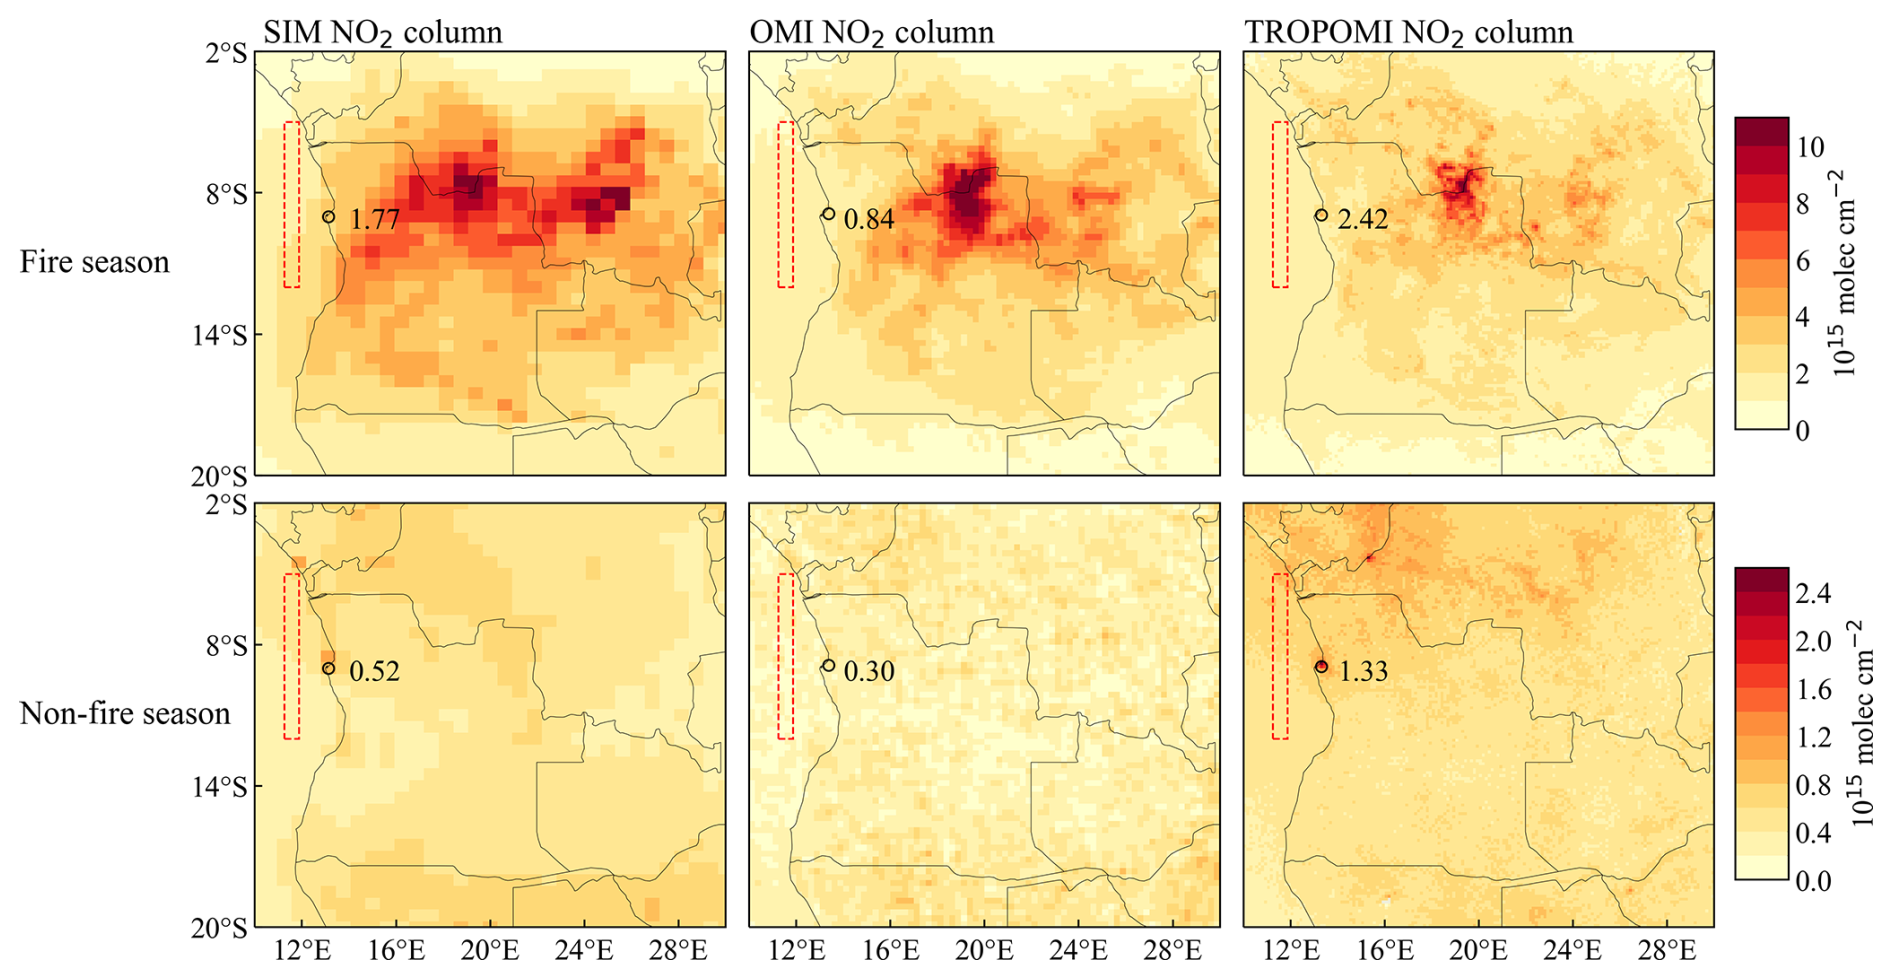
Figure 11Spatial distribution of NO2 columns from the model, OMI, and TROPOMI during the fire season (top, July–August 2019) and non-fire season (bottom, January–February 2020). Circles indicate the city of Luanda, and the numbers around them indicate NO2 column enhancement in the city of Luanda. The dashed boxes indicate the downwind ocean region whose concentrations were subtracted to obtain the NO2 column enhancement in Luanda.
To further identify the key emission sectors in Luanda, we perturbed the NOx emissions from three sectors (transportation, industrial, and energy) by a factor of 10 in Fig. 9a. Surface NO2 concentrations in Luanda responded better to changes in NOx emissions from the energy and transportation sectors, with NMB reduced by 20 % and 11 %, respectively. Figure S13 shows the NO2 column changes in response to the emission perturbations. When all sources of NOx emissions in the CEDSv2 inventory are increased by a factor of 10, the simulated NO2 column enhancement in Luanda are 3–4 times the TROPOMI measurement. Namely, although the NOx emissions are increased by 10-fold to ensure that the simulated NO2 concentration is consistent with the surface observations, the model will be inconsistent with the satellite observations. In addition, the response of NO2 column in Luanda to sectoral perturbations in NOx emissions is mainly linear (Fig. S13). These model–satellite comparisons suggest an underestimation of NOx emissions from CEDSv2 by at least a factor of 2 in urban Luanda.
To further explore the underestimation of anthropogenic emissions in southern Africa, we use Luanda as a baseline to show the difference between anthropogenic NOx emissions and satellite NO2 columns for other cities in Fig. 12. The selected cities are grid cells with high NOx emissions in the CEDSv2 inventory. The tropospheric NO2 during the non-fire season is dominantly contributed by the lower atmosphere (Fig. S14 in the Supplement), and we selected March–April 2018–2023 for comparison in order to exclude the effect of biomass burning. In Kinshasa (the capital of the DRC), anthropogenic NOx emissions are 76 % lower than those in Luanda, but the difference in satellite NO2 columns is only 4 %–12 %, suggesting that anthropogenic emissions from Kinshasa were also underestimated; in Lusaka (the capital of Zambia), the NO2 columns are 55 % lower than those in Luanda, while the difference in anthropogenic NOx emissions is 76 %. Combining satellite data with CEDSv2 NO2 emissions provides additional evidence of the prevalent underestimation in anthropogenic NOx emissions in major cities over southern Africa.
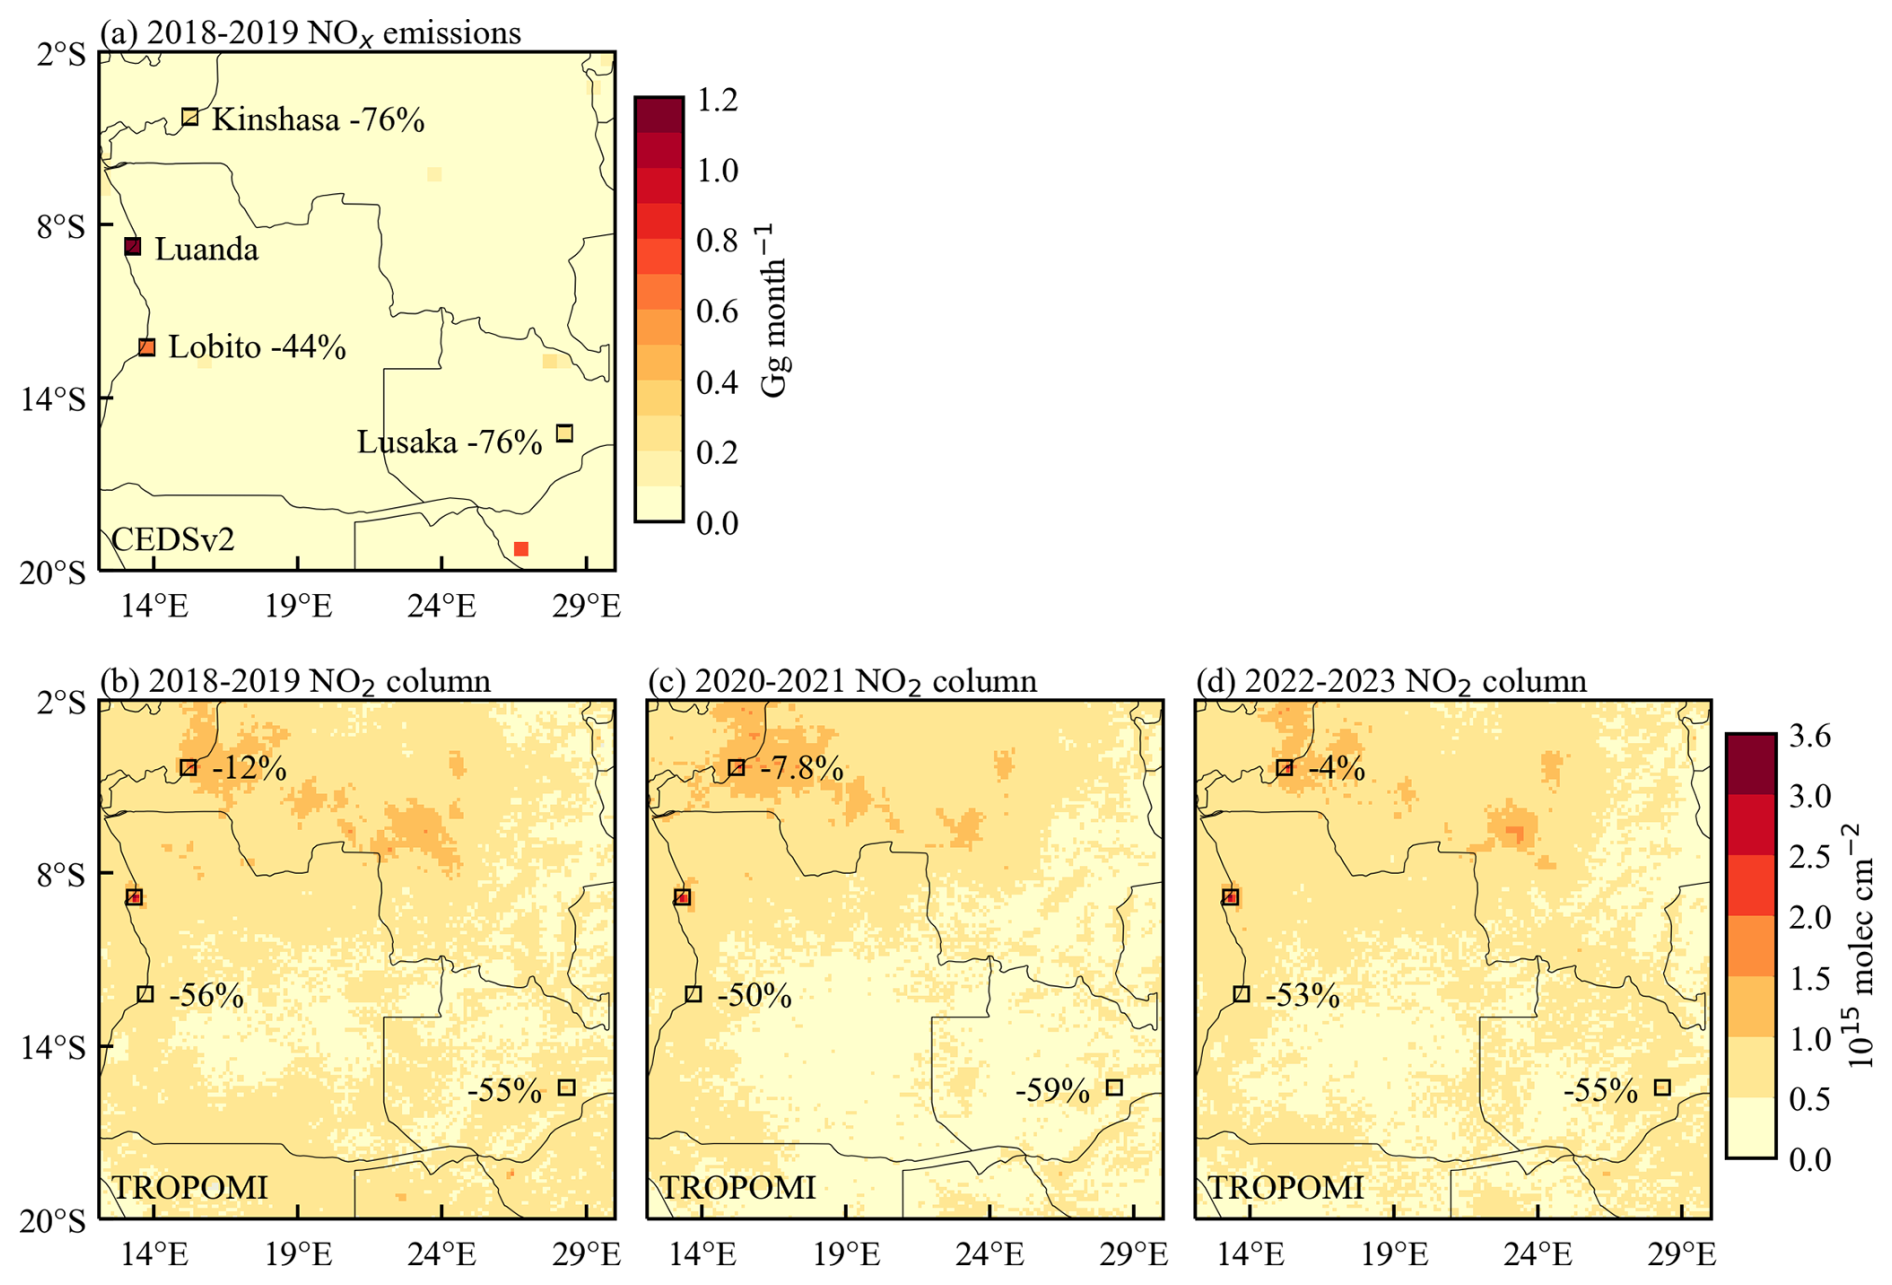
Figure 12Anthropogenic NOx emissions from CEDSv2 and NO2 columns from TROPOMI in typical cities in southern Africa. (a) Spatial distribution of NOx emissions from the CEDSv2 inventory in March–April of 2018–2019. (b–d) Spatial distribution of NO2 columns observed by TROPOMI in March–April of 2018–2023. All of the numbers in the plots are the percentage changes taking Luanda as a reference.
In this study, we focused on southern Africa, where tropospheric ozone levels were thought to be extremely high but have been less studied. By integrating the nested GEOS-Chem model with the newly available surface and satellite observations, we explored tropospheric ozone levels and their main drivers in southern Africa. In particular, we quantified the impact of biomass burning (BB) on tropospheric ozone at the regional scale in southern Africa and the effects of anthropogenic emissions in urban ozone levels. This study provides a better understanding of the impacts of key emission sources on air quality modeling in southern Africa, which will also be important for health risk assessment, climate change prediction, and sustainable strategy development.
The anomalously high values of dry-season tropospheric ozone in southern Africa are mainly caused by BB, but there is a large discrepancy of a factor of 2–3 in estimated BB emissions among different inventories. Comparison of model simulations against satellite NO2 observations revealed that the widely used GFED4.1 inventory tends to strongly overestimate NOx emissions in southern Africa, while model results with the QFED2 inventory were more consistent with observations. This is consistent with the finding by Anderson et al. (2021) that their model driven by the GFED4.1 inventory tended to overestimate NO2 concentrations in the Africa, with a bias of about 100 %. Consequently, the simulated regional surface MDA8 ozone was decreased from 74 ppb by the GFED4.1 inventory to 56 ppb by the QFED2 inventory, and accordingly the model bias in TCO was reduced from 14 % to 2.3 %. The modeled HCHO and CO columns were generally consistent between the GFED4.1 inventory and the QFED2 inventory. Using the QFED2 inventory, we explored the impact of BB emission heights on ozone simulations and found that the effect of the vertical emission distribution was in the range of ±2.4 ppb for surface MDA8 ozone and from −0.4 to 1.6 DU for TCO over southern Africa; in contrast, the difference in BB aerosol emissions between the inventories could affect ozone simulation strongly through aerosol chemistry.
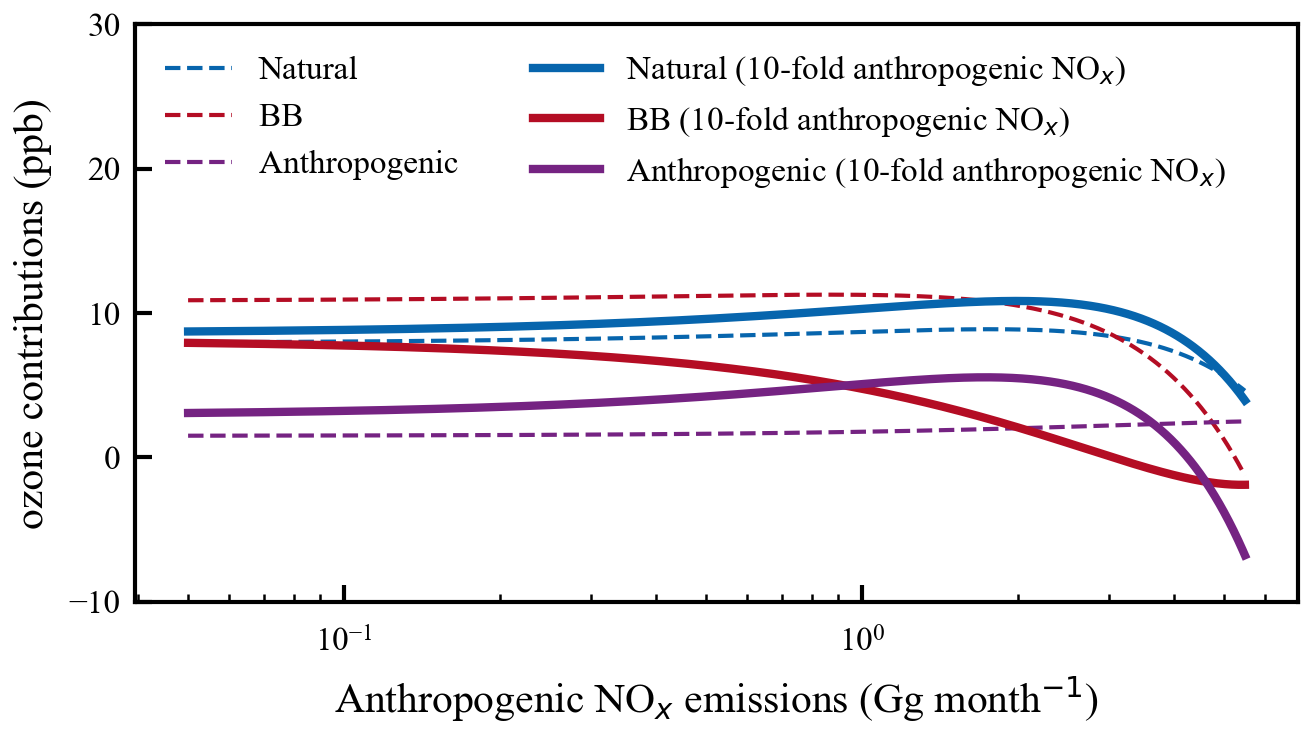
Figure 13The simulated source contributions to surface ozone in July–August 2019 using the CEDSv2 emissions (dash lines) and 10-fold CEDSv2 NOx emissions (solid lines). Here the natural emissions refer to the biogenic VOC and soil NOx emissions. The x axis represents the anthropogenic NOx emissions in each grid cell and the y axis the corresponding ozone contributions estimated from the sensitivity simulations.
We conducted further sensitivity experiments using the QFED2 inventory to explore the contribution of anthropogenic emissions. Compared with surface NO2 and PM2.5 observations, we found that the CEDSv2 anthropogenic inventory likely strongly underestimated anthropogenic emissions in typical southern African cities and even incorrectly represented anthropogenic sources in some areas. Our study also found that the TROPOMI instrument performs effectively in these low-emission areas where there is a lack of observational data, while the OMI is unable to capture urban-scale hotspots of NO2 columns over southern Africa. We also demonstrated that urban ozone and PM2.5 concentrations are strongly influenced by the underestimated anthropogenic emissions. For example, a 10-fold increase in anthropogenic NOx emissions can change ozone concentrations by up to 10 ppb and increase PM2.5 concentrations by up to 50 µg m−3 in some cities.
Although several studies examined high ozone levels in southern Africa (Meyer-Arnek et al., 2005; von Clarmann et al., 2007), they only highlighted the role of biomass burning but overlooked the role of anthropogenic emissions. Recent findings by Wiedinmyer et al. (2023) pointed out the large uncertainties in bottom-up BB emissions, but they failed to constrain the uncertainties due to the lack of observational data. Here we found that the difference among BB inventories can have a great impact on urban air quality assessment. In addition, with combined surface observations, satellite data, and model simulations, we demonstrated for the first time that anthropogenic emission inventories are strongly low-biased in urban southern Africa. This suggests the important impacts of anthropogenic emissions in Africa with increasing urbanization.
The rapid change in anthropogenic emissions is already affecting air pollution and health risks in southern Africa (Health Effects Institute, 2022) and might have impacts on regional climate change (Fotso-Nguemo et al., 2023). Assessing and predicting the impacts of different emission sources on air quality and human health rely heavily on model simulations. The performance of these model estimations is significantly influenced by the accuracy of emission inventories. For example, our finding of overestimated biomass burning emissions and underestimated anthropogenic emissions can strongly affect the ozone source attribution over southern Africa due to the nonlinear ozone chemistry. As shown in Fig. S15 in the Supplement, the estimated contributions from BB emissions, natural emissions (mainly biogenic VOCs), and anthropogenic emissions to surface MDA8 ozone are 11, 8.0, and 1.5 ppb, respectively, over southern Africa in the dry season of 2019. However, when anthropogenic NOx emissions are increased by a factor of 10, estimated contributions from natural and anthropogenic emissions will increase to 9.0 and 3.3 ppb, respectively. In particular, the ozone source attribution spatially varies depending on the levels of anthropogenic NOx emissions (Fig. 13). This suggests an ignored but critical role of anthropogenic emissions in ozone levels over southern Africa.
There are also some uncertainties and limitations in our assessment of the major drivers of high ozone levels over southern Africa. Firstly, due to the lack of observational data on surface ozone and VOCs, the effect of anthropogenic emissions on surface ozone over southern Africa was explored by only comparing surface NO2 concentrations, which may lead to biases in determining ozone chemical formation. Secondly, although we have used ozonesonde data from Ascension Island, located downwind of southern Africa, for comparison and the study by Jenkins et al. (2021) suggests that BB plumes in southern Africa can have an impact on downwind regions, the long-range effects of BB emission on downwind urban regions were also not well validated due to the lack of vertical ozone measurement. Thirdly, the comparison between the model and satellite data could be improved by correcting the vertical profiles of chemical species in the processing of satellite data. Fourthly, although the GEOS-Chem model has been shown to be able to capture spatial and temporal variations of ozone and its precursors over typical urban regions (Travis and Jacob, 2019), it is still challenging to capture the urban-scale air quality in southern Africa. Without accurate bottom-up anthropogenic inventories, we highlight the importance of high-resolution satellite observations for understanding air quality in developing regions such as southern Africa.
Overall, this work provides a comprehensive understanding of the drivers and uncertainties of tropospheric ozone in southern Africa, particularly the overestimation of BB emissions and the underestimation of anthropogenic emission inventories. More importantly, with more frequent BB and rising anthropogenic emissions in Africa, this study highlights the urgency of establishing the surface network for air quality measurement over southern Africa. The more accurate estimates of anthropogenic emission sources and more regular surface observations are the key to understanding atmospheric chemistry over southern Africa that is driven by rapidly changing anthropogenic and biomass burning emissions. The deepened understanding of major emission sources in southern Africa will not only help us to provide a solid scientific basis for policymakers to effectively address air quality issues, but will also enhance the model capability to predict future air quality and climate change. In the future, anthropogenic emissions of air pollutants (e.g., NOx emissions) in southern Africa under future scenarios are projected to increase all the way by 2060 (Fig. S16 in the Supplement); along with more fires under a warming future, southern Africa will be a hotspot suffering from complex atmospheric chemistry and climate issues, presenting a grand challenge to the realization of the Sustainable Development Goals for having a healthy, climate-friendly, and resilient development in Africa. Our study serves as a baseline understanding of these key emission sources which are key drivers for modeling future air quality, climate change, and their socioeconomic impacts.
Daily real-time air quality indexes for NO2 and PM2.5 were obtained from the Worldwide Air Quality Index (https://aqicn.org/station, WAQI, 2023). Ascension Island's ozonesonde data from the Southern Hemisphere ADditional OZonesondes network are available at https://tropo.gsfc.nasa.gov/shadoz/ (NASA, 2025c). The OMI satellite data for O3, NO2, and HCHO are available at https://disc.gsfc.nasa.gov/datasets/ (NASA, 2025d). The TROPOMI data for NO2 are available at https://www.earthdata.nasa.gov/sensors/tropomi (Copernicus Sentinel-5P, 2025). The MODIS data for AOD are available at https://ladsweb.modaps.eosdis.nasa.gov/search/ (NASA, 2025b). The MOPITT data for CO are available at https://giovanni.gsfc.nasa.gov/giovanni/ (NASA, 2025a).
The supplement related to this article is available online at https://doi.org/10.5194/acp-25-4455-2025-supplement.
KL designed the research and YW performed simulations and analyzed the results. XC, ZY, and MT helped the model simulations. PMDC, YY, XY, and HL contributed to the interpretation of the results. YW and KL wrote the paper with contributions from all co-authors.
The contact author has declared that none of the authors has any competing interests.
Publisher's note: Copernicus Publications remains neutral with regard to jurisdictional claims made in the text, published maps, institutional affiliations, or any other geographical representation in this paper. While Copernicus Publications makes every effort to include appropriate place names, the final responsibility lies with the authors.
We thank the Atmospheric Chemistry Modeling Group at Harvard University for developing and managing the GEOS-Chem model, as well as the high-performance computing cluster Xuanwu maintained by the Atmospheric Chemistry and Climate Group at NUIST.
This research has been supported by the National Natural Science Foundation of China (grant no. 42293323), the National Key Research and Development Program of China (grant no. 2022YFE0136100), and the Basic Research Program of Jiangsu Province (grant nos. BK20220031 and BK20240035).
This paper was edited by Amos Tai and reviewed by three anonymous referees.
Aghedo, A. M., Schultz, M. G., and Rast, S.: The influence of African air pollution on regional and global tropospheric ozone, Atmos. Chem. Phys., 7, 1193–1212, https://doi.org/10.5194/acp-7-1193-2007, 2007.
Anderson, D. C., Duncan, B. N., Fiore, A. M., Baublitz, C. B., Follette-Cook, M. B., Nicely, J. M., and Wolfe, G. M.: Spatial and temporal variability in the hydroxyl (OH) radical: understanding the role of large-scale climate features and their influence on OH through its dynamical and photochemical drivers, Atmos. Chem. Phys., 21, 6481–6508, https://doi.org/10.5194/acp-21-6481-2021, 2021.
Bello-Schünemann, J. and Aucoin, C.: African urban futures, Institute for Security Studies Papers, 2016, 1–36 pp., https://hdl.handle.net/10520/EJC-b07eee7c0 (last access: 1 April 2025), 2016.
Bahino, J., Yoboué, V., Galy-Lacaux, C., Adon, M., Akpo, A., Keita, S., Liousse, C., Gardrat, E., Chiron, C., Ossohou, M., Gnamien, S., and Djossou, J.: A pilot study of gaseous pollutants' measurement (NO2, SO2, NH3, HNO3 and O3) in Abidjan, Côte d'Ivoire: contribution to an overview of gaseous pollution in African cities, Atmos. Chem. Phys., 18, 5173–5198, https://doi.org/10.5194/acp-18-5173-2018, 2018.
Balamurugan, V., Chen, J., Qu, Z., Bi, X., Gensheimer, J., Shekhar, A., Bhattacharjee, S., and Keutsch, F. N.: Tropospheric NO2 and O3 Response to COVID-19 Lockdown Restrictions at the National and Urban Scales in Germany, J. Geophys. Res.-Atmos., 126, e2021JD035440, https://doi.org/10.1029/2021JD035440, 2021.
Bian, H., Chin, M., Kawa, S. R., Duncan, B., Arellano, A., and Kasibhatla, P.: Sensitivity of global CO simulations to uncertainties in biomass burning sources, J. Geophys. Res.-Atmos., 112, D23308, https://doi.org/10.1029/2006jd008376, 2007.
Booyens, W., Beukes, J. P., Van Zyl, P. G., Ruiz-Jimenez, J., Kopperi, M., Riekkola, M.-L., Josipovic, M., Vakkari, V., and Laakso, L.: Summary of research paper published in Journal of Atmosoheric Chemistry titled: Assessment of polar organic aerosols at a regional background site in southern Africa, Clean Air Journal, 29, 19, https://doi.org/10.17159/2410-972X/2019/v29n1a10, 2019.
Boschetti, L. and Roy, D. P.: Defining a fire year for reporting and analysis of global interannual fire variability, J. Geophys. Res.-Biogeo., 113, 1–11, https://doi.org/10.1029/2008JG000686, 2008.
Bourgeois, I., Peischl, J., Neuman, J. A., Brown, S. S., Thompson, C. R., Aikin, K. C., Allen, H. M., Angot, H., Apel, E. C., Baublitz, C. B., Brewer, J. F., Campuzano-Jost, P., Commane, R., Crounse, J. D., Daube, B. C., DiGangi, J. P., Diskin, G. S., Emmons, L. K., Fiore, A. M., Gkatzelis, G. I., Hills, A., Hornbrook, R. S., Huey, L. G., Jimenez, J. L., Kim, M., Lacey, F., McKain, K., Murray, L. T., Nault, B. A., Parrish, D. D., Ray, E., Sweeney, C., Tanner, D., Wofsy, S. C., and Ryerson, T. B.: Large contribution of biomass burning emissions to ozone throughout the global remote troposphere, P. Natl. Acad. Sci. USA, 118, e2109628118, https://doi.org/10.1073/pnas.2109628118, 2021.
Campos, P. M. D., Esteves, A. F., Leitão, A. A., and Pires, J. C. M.: Design of air quality monitoring network of Luanda, Angola: Urban air pollution assessment, Atmos. Pollut. Res., 12, 101128, https://doi.org/10.1016/j.apr.2021.101128, 2021.
Carter, T. S., Heald, C. L., Jimenez, J. L., Campuzano-Jost, P., Kondo, Y., Moteki, N., Schwarz, J. P., Wiedinmyer, C., Darmenov, A. S., da Silva, A. M., and Kaiser, J. W.: How emissions uncertainty influences the distribution and radiative impacts of smoke from fires in North America, Atmos. Chem. Phys., 20, 2073–2097, https://doi.org/10.5194/acp-20-2073-2020, 2020.
Chang, I., Gao, L., Flynn, C. J., Shinozuka, Y., Doherty, S. J., Diamond, M. S., Longo, K. M., Ferrada, G. A., Carmichael, G. R., Castellanos, P., da Silva, A. M., Saide, P. E., Howes, C., Xue, Z., Mallet, M., Govindaraju, R., Wang, Q., Cheng, Y., Feng, Y., Burton, S. P., Ferrare, R. A., LeBlanc, S. E., Kacenelenbogen, M. S., Pistone, K., Segal-Rozenhaimer, M., Meyer, K. G., Ryoo, J.-M., Pfister, L., Adebiyi, A. A., Wood, R., Zuidema, P., Christopher, S. A., and Redemann, J.: On the differences in the vertical distribution of modeled aerosol optical depth over the southeastern Atlantic, Atmos. Chem. Phys., 23, 4283–4309, https://doi.org/10.5194/acp-23-4283-2023, 2023.
Chen, Y., Hall, J., van Wees, D., Andela, N., Hantson, S., Giglio, L., van der Werf, G. R., Morton, D. C., and Randerson, J. T.: Multi-decadal trends and variability in burned area from the fifth version of the Global Fire Emissions Database (GFED5), Earth Syst. Sci. Data, 15, 5227–5259, https://doi.org/10.5194/essd-15-5227-2023, 2023.
Copernicus Sentinel-5P: https://www.earthdata.nasa.gov/sensors/tropomi, last access: 1 April 2025.
David, L. M., Ravishankara, A. R., Brewer, J. F., Sauvage, B., Thouret, V., Venkataramani, S., and Sinha, V.: Tropospheric ozone over the Indian subcontinent from 2000 to 2015: Data set and simulation using GEOS-Chem chemical transport model, Atmos. Environ., 219, 117039, https://doi.org/10.1016/j.atmosenv.2019.117039, 2019.
DeWitt, H. L., Gasore, J., Rupakheti, M., Potter, K. E., Prinn, R. G., Ndikubwimana, J. D. D., Nkusi, J., and Safari, B.: Seasonal and diurnal variability in O3, black carbon, and CO measured at the Rwanda Climate Observatory, Atmos. Chem. Phys., 19, 2063–2078, https://doi.org/10.5194/acp-19-2063-2019, 2019.
Fajersztajn, L., Veras, M., Barrozo, L. V., and Saldiva, P.: Air monitoring coverage in low-income countries: an observational study, Lancet, 384, S14, https://doi.org/10.1016/s0140-6736(14)61877-8, 2014.
Fotso-Nguemo, T. C., Weber, T., Diedhiou, A., Chouto, S., Vondou, D. A., Rechid, D., and Jacob, D.: Projected Impact of Increased Global Warming on Heat Stress and Exposed Population Over Africa, Earths Future, 11, e2022EF003268, https://doi.org/10.1029/2022ef003268, 2023.
Fu, Y., Li, R., Hu, J., Wang, Y., and Duan, J.: Investigating the impacts of satellite fire observation accuracy on the top-down nitrogen oxides emission estimation in northeastern Asia, Environ. Int., 169, 107498, https://doi.org/10.1016/j.envint.2022.107498, 2022.
Gaudel, A., Cooper, O. R., Chang, K.-L., Bourgeois, I., Ziemke, J. R., Strode, S. A., Oman, L. D., Sellitto, P., Nédélec, P., Blot, R., Thouret, V., and Granier, C.: Aircraft observations since the 1990s reveal increases of tropospheric ozone at multiple locations across the Northern Hemisphere, Science Advances, 6, eaba8272, https://doi.org/10.1126/sciadv.aba8272, 2020.
Guenther, A. B., Jiang, X., Heald, C. L., Sakulyanontvittaya, T., Duhl, T., Emmons, L. K., and Wang, X.: The Model of Emissions of Gases and Aerosols from Nature version 2.1 (MEGAN2.1): an extended and updated framework for modeling biogenic emissions, Geosci. Model Dev., 5, 1471–1492, https://doi.org/10.5194/gmd-5-1471-2012, 2012.
Health Effects Institute: The state of air quality and health impacts in Africa. A report from the state of global air initiative, 1–23, https://www.healthdata.org/sites/default/files/files/policy_report/2022/soga-africa-report.pdf (last access: 1 April 2025), 2022.
Hickman, J. E., Andela, N., Tsigaridis, K., Galy-Lacaux, C., Ossohou, M., Dammers, E., Van Damme, M., Clarisse, L., and Bauer, S. E.: Continental and Ecoregion-Specific Drivers of Atmospheric NO2 and NH3 Seasonality Over Africa Revealed by Satellite Observations, Global Biogeochem. Cy., 35, e2020GB006916, https://doi.org/10.1029/2020gb006916, 2021.
Hoelzemann, J. J.: Global wildland fire emission modeling for for atmospheric chemistry studies, PhD thesis, University of Hamburg Hamburg, Hamburg, 206 pp., https://doi.org/10.17617/2.994555, 2006.
Hoesly, R. M., Smith, S. J., Feng, L., Klimont, Z., Janssens-Maenhout, G., Pitkanen, T., Seibert, J. J., Vu, L., Andres, R. J., Bolt, R. M., Bond, T. C., Dawidowski, L., Kholod, N., Kurokawa, J.-I., Li, M., Liu, L., Lu, Z., Moura, M. C. P., O'Rourke, P. R., and Zhang, Q.: Historical (1750–2014) anthropogenic emissions of reactive gases and aerosols from the Community Emissions Data System (CEDS), Geosci. Model Dev., 11, 369–408, https://doi.org/10.5194/gmd-11-369-2018, 2018.
Jaffe, D. A. and Wigder, N. L.: Ozone production from wildfires: A critical review, Atmos. Environ., 51, 1–10, https://doi.org/10.1016/j.atmosenv.2011.11.063, 2012.
Jenkins, G. S., de Castro, V., Cunha, B., Fontanez, I., and Holzworth, R.: The Evolution of the Wave-One Ozone Maximum During the 2017 LASIC Field Campaign at Ascension Island, J. Geophys. Res.-Atmos., 126, e2020JD033972, https://doi.org/10.1029/2020jd033972, 2021.
Jiang, Y., Zhou, L., and Raghavendra, A.: Observed changes in fire patterns and possible drivers over Central Africa, Environ. Res. Lett., 15, 0940b0948, https://doi.org/10.1088/1748-9326/ab9db2, 2020.
Kopacz, M., Jacob, D. J., Fisher, J. A., Logan, J. A., Zhang, L., Megretskaia, I. A., Yantosca, R. M., Singh, K., Henze, D. K., Burrows, J. P., Buchwitz, M., Khlystova, I., McMillan, W. W., Gille, J. C., Edwards, D. P., Eldering, A., Thouret, V., and Nedelec, P.: Global estimates of CO sources with high resolution by adjoint inversion of multiple satellite datasets (MOPITT, AIRS, SCIAMACHY, TES), Atmos. Chem. Phys., 10, 855–876, https://doi.org/10.5194/acp-10-855-2010, 2010.
Li, M., Yang, Y., Wang, H., Li, H., Wang, P., and Liao, H.: Summertime ozone pollution in China affected by stratospheric quasi-biennial oscillation, Atmos. Chem. Phys., 23, 1533–1544, https://doi.org/10.5194/acp-23-1533-2023, 2023.
Liousse, C., Assamoi, E., Criqui, P., Granier, C., and Rosset, R.: Explosive growth in African combustion emissions from 2005 to 2030, Environ. Res. Lett., 9, 035003, https://doi.org/10.1088/1748-9326/9/3/035003, 2014.
Liu, T., Mickley, L. J., Marlier, M. E., DeFries, R. S., Khan, M. F., Latif, M. T., and Karambelas, A.: Diagnosing spatial biases and uncertainties in global fire emissions inventories: Indonesia as regional case study, Remote Sens. Environ., 237, 111557, https://doi.org/10.1016/j.rse.2019.111557, 2020a.
Liu, Y., Tang, Z., Abera, T., Zhang, X., Hakola, H., Pellikka, P., and Maeda, E.: Spatio-temporal distribution and source partitioning of formaldehyde over Ethiopia and Kenya, Atmos. Environ., 237, 117706, https://doi.org/10.1016/j.atmosenv.2020.117706, 2020b.
Lyu, X., Li, K., Guo, H., Morawska, L., Zhou, B., Zeren, Y., Jiang, F., Chen, C., Goldstein, A. H., Xu, X., Wang, T., Lu, X., Zhu, T., Querol, X., Chatani, S., Latif, M. T., Schuch, D., Sinha, V., Kumar, P., Mullins, B., Seguel, R., Shao, M., Xue, L., Wang, N., Chen, J., Gao, J., Chai, F., Simpson, I., Sinha, B., and Blake, D. R.: A synergistic ozone-climate control to address emerging ozone pollution challenges, One Earth, 6, 964–977, https://doi.org/10.1016/j.oneear.2023.07.004, 2023.
Marais, E. A. and Wiedinmyer, C.: Air Quality Impact of Diffuse and Inefficient Combustion Emissions in Africa (DICE-Africa), Environ. Sci. Technol., 50, 10739–10745, https://doi.org/10.1021/acs.est.6b02602, 2016.
Mari, C. H., Cailley, G., Corre, L., Saunois, M., Attié, J. L., Thouret, V., and Stohl, A.: Tracing biomass burning plumes from the Southern Hemisphere during the AMMA 2006 wet season experiment, Atmos. Chem. Phys., 8, 3951–3961, https://doi.org/10.5194/acp-8-3951-2008, 2008.
Marvin, M. R., Palmer, P. I., Latter, B. G., Siddans, R., Kerridge, B. J., Latif, M. T., and Khan, M. F.: Photochemical environment over Southeast Asia primed for hazardous ozone levels with influx of nitrogen oxides from seasonal biomass burning, Atmos. Chem. Phys., 21, 1917–1935, https://doi.org/10.5194/acp-21-1917-2021, 2021.
Meyer-Arnek, J., Ladstätter-Weißenmayer, A., Richter, A., Wittrock, F., and Burrows, J. P.: A study of the trace gas columns of O3, NO2 and HCHO over Africa in September 1997, Faraday Discuss., 130, 387–405, https://doi.org/10.1039/b502106p, 2005.
NASA: Giovanni, https://giovanni.gsfc.nasa.gov/giovanni/, last access: 1 April 2025a.
NASA: Level-1 and Atmosphere Archive & Distribution System Distributed Active Archive Center (LAADS DAAC), https://ladsweb.modaps.eosdis.nasa.gov/search/, last access: 1 April 2025b.
NASA: SHADOZ – Southern Hemisphere ADditional OZonesondes, https://tropo.gsfc.nasa.gov/shadoz/, last access: 1 April 2025c.
NASA: The L3 satellite data, https://disc.gsfc.nasa.gov/datasets/, last access: 1 April 2025d.
Ni, R., Lin, J., Yan, Y., and Lin, W.: Foreign and domestic contributions to springtime ozone over China, Atmos. Chem. Phys., 18, 11447–11469, https://doi.org/10.5194/acp-18-11447-2018, 2018.
Nikonovas, T., North, P. R. J., and Doerr, S. H.: Particulate emissions from large North American wildfires estimated using a new top-down method, Atmos. Chem. Phys., 17, 6423–6438, https://doi.org/10.5194/acp-17-6423-2017, 2017.
Nyasulu, M., Thulu, F. G. D., and Alexander, F.: An assessment of four decades atmospheric PM2.5 trends in urban locations over Southern Africa using MERRA-2 reanalysis, Air Qual. Atmos. Hlth., 16, 2063–2084, https://doi.org/10.1007/s11869-023-01392-3, 2023.
Park, R. J., Jacob, D. J., Field, B. D., and Yantosca, R. M.: Natural and transboundary pollution influences on sulfate-nitrate-ammonium aerosols in the United States: Implications for policy, J. Geophys. Res.-Atmos., 109, 1–17, https://doi.org/10.1029/2003jd004473, 2004.
Pechony, O., Shindell, D. T., and Faluvegi, G.: Direct top-down estimates of biomass burning CO emissions using TES and MOPITT versus bottom-up GFED inventory, J. Geophys. Res.-Atmos., 118, 8054–8066, https://doi.org/10.1002/jgrd.50624, 2013.
Petrenko, M., Kahn, R., Chin, M., Soja, A., Kucsera, T., and Harshvardhan: The use of satellite-measured aerosol optical depth to constrain biomass burning emissions source strength in the global model GOCART, J. Geophys. Res.-Atmos., 117, 1–26, https://doi.org/10.1029/2012jd017870, 2012.
Qin, Y., Wang, H., Wang, Y., Lu, X., Tang, H., Zhang, J., Li, L., and Fan, S.: Wildfires in Southeast Asia pollute the atmosphere in the northern South China Sea, Sci. Bull., 69, 1011–1015, https://doi.org/10.1016/j.scib.2024.02.026, 2024.
Rémy, S., Veira, A., Paugam, R., Sofiev, M., Kaiser, J. W., Marenco, F., Burton, S. P., Benedetti, A., Engelen, R. J., Ferrare, R., and Hair, J. W.: Two global data sets of daily fire emission injection heights since 2003, Atmos. Chem. Phys., 17, 2921–2942, https://doi.org/10.5194/acp-17-2921-2017, 2017.
Roy, R.: The cost of air pollution in Africa, OECD Development Center Working Paper No. 333, https://www.oecd-ilibrary.org/docserver/5jlqzq77x6f8-en.pdf (last access: 1 April 2025), 2016.
Shi, H., Xiao, Z., Zhan, X., Ma, H., and Tian, X.: Evaluation of MODIS and two reanalysis aerosol optical depth products over AERONET sites, Atmos. Res., 220, 75–80, https://doi.org/10.1016/j.atmosres.2019.01.009, 2019.
Shi, Y., Matsunaga, T., Saito, M., Yamaguchi, Y., and Chen, X.: Comparison of global inventories of CO2 emissions from biomass burning during 2002–2011 derived from multiple satellite products, Environ. Pollut., 206, 479–487, https://doi.org/10.1016/j.envpol.2015.08.009, 2015.
Shi, Y., Zang, S., Matsunaga, T., and Yamaguchi, Y.: A multi-year and high-resolution inventory of biomass burning emissions in tropical continents from 2001–2017 based on satellite observations, J. Clean. Prod., 270, 122511, https://doi.org/10.1016/j.jclepro.2020.122511, 2020.
Sicard, P., Agathokleous, E., Anenberg, S. C., De Marco, A., Paoletti, E., and Calatayud, V.: Trends in urban air pollution over the last two decades: A global perspective, Sci. Total Environ., 858, 160064, https://doi.org/10.1016/j.scitotenv.2022.160064, 2023.
Souri, A. H., Duncan, B. N., Strode, S. A., Anderson, D. C., Manyin, M. E., Liu, J., Oman, L. D., Zhang, Z., and Weir, B.: Enhancing long-term trend simulation of the global tropospheric hydroxyl (TOH) and its drivers from 2005 to 2019: a synergistic integration of model simulations and satellite observations, Atmos. Chem. Phys., 24, 8677–8701, https://doi.org/10.5194/acp-24-8677-2024, 2024.
Thompson, A. M., Doddridge, B. G., Witte, J. C., Hudson, R. D., Luke, W. T., Johnson, J. E., Johnson, B. J., Oltmans, S. J., and Weller, R.: A tropical Atlantic Paradox: Shipboard and satellite views of a tropospheric ozone maximum and wave-one in January–February 1999, Geophys. Res. Lett., 27, 3317–3320, https://doi.org/10.1029/1999GL011273, 2000.
Tian, R., Ma, X., Jia, H., Yu, F., Sha, T., and Zan, Y.: Aerosol radiative effects on tropospheric photochemistry with GEOS-Chem simulations, Atmos. Environ., 208, 82–94, https://doi.org/10.1016/j.atmosenv.2019.03.032, 2019.
Travis, K. R. and Jacob, D. J.: Systematic bias in evaluating chemical transport models with maximum daily 8 h average (MDA8) surface ozone for air quality applications: a case study with GEOS-Chem v9.02, Geosci. Model Dev., 12, 3641–3648, https://doi.org/10.5194/gmd-12-3641-2019, 2019.
van der Werf, G. R., Randerson, J. T., Giglio, L., van Leeuwen, T. T., Chen, Y., Rogers, B. M., Mu, M., van Marle, M. J. E., Morton, D. C., Collatz, G. J., Yokelson, R. J., and Kasibhatla, P. S.: Global fire emissions estimates during 1997–2016, Earth Syst. Sci. Data, 9, 697–720, https://doi.org/10.5194/essd-9-697-2017, 2017.
Vernooij, R., Giongo, M., Borges, M. A., Costa, M. M., Barradas, A. C. S., and van der Werf, G. R.: Intraseasonal variability of greenhouse gas emission factors from biomass burning in the Brazilian Cerrado, Biogeosciences, 18, 1375–1393, https://doi.org/10.5194/bg-18-1375-2021, 2021.
Vieira, I., Verbeeck, H., Meunier, F., Peaucelle, M., Sibret, T., Lefevre, L., Cheesman, A. W., Brown, F., Sitch, S., Mbifo, J., Boeckx, P., and Bauters, M.: Global reanalysis products cannot reproduce seasonal and diurnal cycles of tropospheric ozone in the Congo Basin, Atmos. Environ., 304, 119773, https://doi.org/10.1016/j.atmosenv.2023.119773, 2023.
von Clarmann, T., Glatthor, N., Koukouli, M. E., Stiller, G. P., Funke, B., Grabowski, U., Höpfner, M., Kellmann, S., Linden, A., Milz, M., Steck, T., and Fischer, H.: MIPAS measurements of upper tropospheric C2H6 and O3 during the southern hemispheric biomass burning season in 2003, Atmos. Chem. Phys., 7, 5861–5872, https://doi.org/10.5194/acp-7-5861-2007, 2007.
Vongruang, P., Wongwises, P., and Pimonsree, S.: Assessment of fire emission inventories for simulating particulate matter in Upper Southeast Asia using WRF-CMAQ, Atmos. Pollut. Res., 8, 921–929, https://doi.org/10.1016/j.apr.2017.03.004, 2017.
Wang, C., Wang, T., Wang, P., and Rakitin, V.: Comparison and Validation of TROPOMI and OMI NO2 Observations over China, Atmosphere-Basel, 11, 636, https://doi.org/10.3390/atmos11060636, 2020.
Wang, X., Fu, T. M., Zhang, L., Lu, X., Liu, X., Amnuaylojaroen, T., Latif, M. T., Ma, Y., Zhang, L., Feng, X., Zhu, L., Shen, H., and Yang, X.: Rapidly Changing Emissions Drove Substantial Surface and Tropospheric Ozone Increases Over Southeast Asia, Geophys. Res. Lett., 49, e2022GL100223, https://doi.org/10.1029/2022gl100223, 2022.
WAQI: Worldwide Air Quality Index, AirNet Sensor Network dataset, https://aqicn.org/station, last access: 1 December 2023.
Weagle, C. L., Snider, G., Li, C., van Donkelaar, A., Philip, S., Bissonnette, P., Burke, J., Jackson, J., Latimer, R., Stone, E., Abboud, I., Akoshile, C., Anh, N. X., Brook, J. R., Cohen, A., Dong, J., Gibson, M. D., Griffith, D., He, K. B., Holben, B. N., Kahn, R., Keller, C. A., Kim, J. S., Lagrosas, N., Lestari, P., Khian, Y. L., Liu, Y., Marais, E. A., Martins, J. V., Misra, A., Muliane, U., Pratiwi, R., Quel, E. J., Salam, A., Segev, L., Tripathi, S. N., Wang, C., Zhang, Q., Brauer, M., Rudich, Y., and Martin, R. V.: Global Sources of Fine Particulate Matter: Interpretation of PM2.5 Chemical Composition Observed by SPARTAN using a Global Chemical Transport Model, Environ. Sci. Technol., 52, 11670–11681, https://doi.org/10.1021/acs.est.8b01658, 2018.
Wells, K. C., Millet, D. B., Payne, V. H., Deventer, M. J., Bates, K. H., de Gouw, J. A., Graus, M., Warneke, C., Wisthaler, A., and Fuentes, J. D.: Satellite isoprene retrievals constrain emissions and atmospheric oxidation, Nature, 585, 225–233, https://doi.org/10.1038/s41586-020-2664-3, 2020.
Wiedinmyer, C., Akagi, S. K., Yokelson, R. J., Emmons, L. K., Al-Saadi, J. A., Orlando, J. J., and Soja, A. J.: The Fire INventory from NCAR (FINN): a high resolution global model to estimate the emissions from open burning, Geosci. Model Dev., 4, 625–641, https://doi.org/10.5194/gmd-4-625-2011, 2011.
Wiedinmyer, C., Kimura, Y., McDonald-Buller, E. C., Emmons, L. K., Buchholz, R. R., Tang, W., Seto, K., Joseph, M. B., Barsanti, K. C., Carlton, A. G., and Yokelson, R.: The Fire Inventory from NCAR version 2.5: an updated global fire emissions model for climate and chemistry applications, Geosci. Model Dev., 16, 3873–3891, https://doi.org/10.5194/gmd-16-3873-2023, 2023.
Williams, J. E., Scheele, M. P., van Velthoven, P. F. J., Cammas, J.-P., Thouret, V., Galy-Lacaux, C., and Volz-Thomas, A.: The influence of biogenic emissions from Africa on tropical tropospheric ozone during 2006: a global modeling study, Atmos. Chem. Phys., 9, 5729–5749, https://doi.org/10.5194/acp-9-5729-2009, 2009.
Williams, J. E., Scheele, M. P., van Velthoven, P. F. J., Thouret, V., Saunois, M., Reeves, C. E., and Cammas, J.-P.: The influence of biomass burning and transport on tropospheric composition over the tropical Atlantic Ocean and Equatorial Africa during the West African monsoon in 2006, Atmos. Chem. Phys., 10, 9797–9817, https://doi.org/10.5194/acp-10-9797-2010, 2010.
Xu, R., Ye, T., Yue, X., Yang, Z., Yu, W., Zhang, Y., Bell, M. L., Morawska, L., Yu, P., Zhang, Y., Wu, Y., Liu, Y., Johnston, F., Lei, Y., Abramson, M. J., Guo, Y., and Li, S.: Global population exposure to landscape fire air pollution from 2000 to 2019, Nature, 621, 521–529, https://doi.org/10.1038/s41586-023-06398-6, 2023.
Xu, Z., Huang, X., Nie, W., Shen, Y., Zheng, L., Xie, Y., Wang, T., Ding, K., Liu, L., Zhou, D., Qi, X., and Ding, A.: Impact of Biomass Burning and Vertical Mixing of Residual – Layer Aged Plumes on Ozone in the Yangtze River Delta, China: A Tethered-Balloon Measurement and Modeling Study of a Multiday Ozone Episode, J. Geophys. Res.-Atmos., 123, 11786–11803, https://doi.org/10.1029/2018jd028994, 2018.
Yang, J., Kang, S., Hu, Y., Chen, X., and Rai, M.: Influence of South Asian Biomass Burning on Ozone and Aerosol Concentrations Over the Tibetan Plateau, Adv. Atmos. Sci., 39, 1184–1197, https://doi.org/10.1007/s00376-022-1197-0, 2022.
Yue, X., Hu, Y., Tian, C., Xu, R., Yu, W., and Guo, Y.: Increasing impacts of fire air pollution on public and ecosystem health, The Innovation, 5, 100609, https://doi.org/10.1016/j.xinn.2024.100609, 2024.
Zhang, L., Wang, X., Huang, G., and Zhang, S.: Comprehensive Assessment and Analysis of the Current Global Aerosol Optical Depth Products, Remote Sens.-Basel, 16, 1425, https://doi.org/10.3390/rs16081425, 2024.
Zhang, T., Wooster, M., de Jong, M., and Xu, W.: How Well Does the “Small Fire Boost” Methodology Used within the GFED4.1s Fire Emissions Database Represent the Timing, Location and Magnitude of Agricultural Burning?, Remote Sens.-Basel, 10, 823, https://doi.org/10.3390/rs10060823, 2018.
Zhang, Y., West, J. J., Emmons, L. K., Flemming, J., Jonson, J. E., Lund, M. T., Sekiya, T., Sudo, K., Gaudel, A., Chang, K. L., Nédélec, P., and Thouret, V.: Contributions of World Regions to the Global Tropospheric Ozone Burden Change from 1980 to 2010, Geophys. Res. Lett., 48, e2020GL089184, https://doi.org/10.1029/2020gl089184, 2021.
Zhao, T., Mao, J., Simpson, W. R., De Smedt, I., Zhu, L., Hanisco, T. F., Wolfe, G. M., St. Clair, J. M., González Abad, G., Nowlan, C. R., Barletta, B., Meinardi, S., Blake, D. R., Apel, E. C., and Hornbrook, R. S.: Source and variability of formaldehyde (HCHO) at northern high latitudes: an integrated satellite, aircraft, and model study, Atmos. Chem. Phys., 22, 7163–7178, https://doi.org/10.5194/acp-22-7163-2022, 2022.
Zhao, T., Mao, J., Ayazpour, Z., González Abad, G., Nowlan, C. R., and Zheng, Y.: Interannual variability of summertime formaldehyde (HCHO) vertical column density and its main drivers at northern high latitudes, Atmos. Chem. Phys., 24, 6105–6121, https://doi.org/10.5194/acp-24-6105-2024, 2024.
Zhu, L., González Abad, G., Nowlan, C. R., Chan Miller, C., Chance, K., Apel, E. C., DiGangi, J. P., Fried, A., Hanisco, T. F., Hornbrook, R. S., Hu, L., Kaiser, J., Keutsch, F. N., Permar, W., St. Clair, J. M., and Wolfe, G. M.: Validation of satellite formaldehyde (HCHO) retrievals using observations from 12 aircraft campaigns, Atmos. Chem. Phys., 20, 12329–12345, https://doi.org/10.5194/acp-20-12329-2020, 2020.