the Creative Commons Attribution 4.0 License.
the Creative Commons Attribution 4.0 License.
 | 23 Apr 2025
Large reductions in satellite-derived and modelled European lower-tropospheric ozone during and after the COVID-19 pandemic (2020–2022)
Matilda A. Pimlott
Richard J. Pope
Brian J. Kerridge
Richard Siddans
Barry G. Latter
Lucy J. Ventress
Wuhu Feng
Martyn P. Chipperfield
Activity restrictions during the COVID-19 pandemic caused large-scale reductions in ozone (O3) precursor emissions, which in turn substantially reduced the abundance of tropospheric O3 in the Northern Hemisphere. Satellite records of lower-tropospheric column O3 (0–6 km) from the Rutherford Appleton Laboratory (RAL) highlight these large reductions in O3 during the COVID-19 period (2020), which persisted into 2021 and 2022. The European domain average O3 reduction ranged between 2.0 and 3.0 DU (where DU denotes Dobson units) (11.0 %–14.6 %). These satellite results were supported by the TOMCAT chemical transport model (CTM) through several model sensitivity experiments to account for changes in emissions and the impact of the meteorological conditions in 2020. Here, the business-as-usual (BAU) emissions were scaled by activity data (i.e. anonymized mobility data from big tech companies) to account for the reduction in O3 precursor emissions. The model simulated large O3 reductions (2.0–3.0 DU), similar to the satellite records, where approximately 66 % and 34 % of the O3 loss can be explained by emission changes and meteorological conditions, respectively. Our results also show that the reduced flux of stratospheric O3 into the troposphere accounted for a substantial component of the meteorological signal in the overall lower-tropospheric O3 levels during the COVID-19 period.
- Article
(999 KB) - Full-text XML
-
Supplement
(1101 KB) - BibTeX
- EndNote


-
The European satellite record shows large lower-tropospheric spring–summer ozone reductions in 2020–2022 (8.4 %–14.6 %).
-
Scaling precursor emissions based on activity data yields large model ozone reductions in the spring–summer of 2020 and 2021.
-
In 2020, meteorology contributed approximately one-third of the modelled reduction (low stratosphere–troposphere flux), with roughly two-thirds from emission reductions.
Tropospheric ozone (O3) is an important secondary atmospheric pollutant and short-lived climate forcer, formed in the presence of precursor gases, such as nitrogen oxides (NOx, referring to nitrogen dioxide (NO2) and nitric oxide (NO)); volatile organic compounds (VOCs); and sunlight (Monks et al., 2015). Tropospheric O3 is a persistent health problem in Europe, with 24 000 premature deaths attributed to acute O3 exposure in 2020 (European Environment Agency, 2022). O3 is also the third-most important greenhouse gas, with an estimated effective radiative forcing of 0.47 W m−2 (0.24–0.71 W m−2) between 1750 and 2019, dominated by changes in tropospheric O3 (IPCC, 2021; Skeie et al., 2020).
Due to a global pandemic caused by COVID-19 (disease from SARS-CoV-2, severe acute respiratory syndrome coronavirus-2), many countries worldwide implemented a “lockdown” of daily life activities to prevent the spread of the disease (Forster et al., 2020; WHO, 2020; Zhou et al., 2020). This resulted in a widespread reduction in anthropogenic surface emissions, including O3 precursor gases. Based on activity data, Forster et al. (2020) estimated a global reduction of ∼30 % for NOx, 25 % for carbon monoxide (CO), and 20 % for VOCs in April 2020, while Guevara et al. (2021) estimated reductions of ∼33 % for NOx and 8 % for VOCs in March–April 2020. Here, the changes in activity data reported by Forster et al. (2020) are based on changes in anonymized mobility data (e.g. from phone GPS information) provided by Apple and Google (see Forster et al., 2020, and references within). Typically, they found the mobility datasets used in their study to be within 20 % of each other and had a correlation of 0.8 or higher. Furthermore, Guevara et al. (2021) found that countries with the severest lockdowns had even higher average reductions (∼50 % for NOx and 14 % for VOCs).
Reductions in tropospheric O3 in the spring–summer across the Northern Hemisphere (NH) free troposphere (FT) were initially described by Steinbrecht et al. (2021). The timing of this reduction coincides with the introduction of lockdowns across Europe, beginning in the spring–summer of 2020 and continuing into 2021. Steinbrecht et al. (2021) found that measurements of the NH FT (mostly from ozonesondes) from April–August 2020 showed ∼7 % lower O3 values, compared with its climatology of 2000–2020. Such a widespread reduction occurring at so many stations had not occurred previously in this time period. Another notable event during winter–spring of 2019–2020 was the very large stratospheric Arctic O3 depletion caused by a very cold, strong, and long-lasting polar vortex (Feng et al., 2021; Weber et al., 2021; Wohltmann et al., 2020). Steinbrecht et al. (2021) suggested that this low-stratospheric-O3 event contributed to less than 25 % of this O3 negative anomaly, attributing most of the O3 reduction to emission reductions. Further studies have confirmed low FT O3 across Europe and the NH using aircraft and ozonesonde measurements (e.g. Chang et al., 2022; Clark et al., 2021; Putero et al., 2023). In contrast, Parrish et al. (2022) suggested that low 2020 tropospheric O3 could be largely due to a negative trend in baseline tropospheric O3 since around the mid-2010s, based on western European surface sites.
From a satellite perspective, Ziemke et al. (2022) found low NH spring–summer FT O3 from instruments aboard NASA satellites, using a merged instrument record. The tropospheric column O3 reduction of ∼7 %–8 % (3 DU) (compared with 2016–2019) was comparatively uniform between 20 and 60° N and repeated in the next year, 2021. They found a reduction in NH satellite-derived NO2 (∼10 %–20 %) in the spring–summer of 2020 and 2021, identifying this as the likely cause of the O3 reduction. Cuesta et al. (2022) found that satellite-derived O3 for the lowermost troposphere (<3 km altitude) in the spring (1–15 April) of 2020 was enhanced across central Europe and northern Italy (typically VOC-limited regions) compared with the previous year (2019) and reduced elsewhere in Europe (typically NOx-limited regions). An enhancement of O3 across central Europe in the spring–summer of 2020 was also found at surface monitoring sites (e.g. Ordóñez et al., 2020; Grange et al., 2021). Apart from Ziemke et al. (2022), there have been few studies of 2021 and onwards. One example is Pey and Cerro (2022), who found reduced background O3 values over southwestern Europe (∼15 % at most sites) in March–April 2020, which was also seen in 2021 but to a lesser extent. Similar results were found in the study by Dunn et al. (2024).
Modelling studies have investigated the impact of emission reductions on FT O3, using different methods to estimate the size of these emission reductions, which are still uncertain. Bouarar et al. (2021) modelled primary pollutant emission reductions, based on emission reductions from activity data by Doumbia et al. (2021), finding zonally averaged NH FT O3 to be reduced by 5 %–15 % (2001–2019 baseline). One-third of this reduction is attributed to reductions in air traffic; one-third is attributed to a reduction in surface emissions; and the final third is attributed to meteorology, including the low 2020 springtime Arctic stratospheric O3. Miyazaki et al. (2021) used data assimilation, finding a reduction in the global tropospheric O3 burden of ∼2 % in May and June 2020.
Here, we present an update to the European tropospheric O3 record using two satellite products, extending the record to mid-2023, and present the reductions in the lower FT compared with previous years. Using a 3-D chemical transport model (CTM), TOMCAT (Monks et al., 2017), we explore the impact of scaling the anthropogenic surface emissions (from activity data changes) on European tropospheric O3 in 2020 and 2021. Lastly, we quantify the relative contribution of emissions and meteorology to the modelled reduction in tropospheric O3.
2.1 Tropospheric ozone satellite datasets
We present satellite-derived O3 from two satellite instruments, the Infrared Atmospheric Sounding Interferometer (IASI) and the Global Ozone Monitoring Experiment-2 (GOME-2), both aboard the European Organisation for the Exploitation of Meteorological Satellites's MetOp-B satellite (Clerbaux et al., 2009; Munro et al., 2016). The MetOp series of satellites have a Sun-synchronous, near-polar orbit with an Equator-crossing time of 09:30 LST (local solar time). IASI has a swath width of 2200 km, and there are four circular fields of view across the track with a diameter of 12 km in the nadir-viewing mode, covering a square 50×50 km2 which is scanned across the swath. IASI measures in the infrared (IR) wavelengths (645–2760 cm−1) with a spectral resolution of 0.3–0.5 cm−1 (Clerbaux et al., 2009). GOME-2 measures in the ultraviolet–visible (UV–Vis) wavelengths (240–790 nm) with a spectral resolution of 0.26–0.51 nm, and it has a swath width of 1920 km. The field of view is scanned across the track, yielding 24 ground pixels with an 80 km (across-track) × 40 km (along-track) dimension (Callies et al., 2000; Munro et al., 2016). For quality assurance, the GOME-2B record was filtered for a geometric cloud fraction of <0.2 (e.g. Miles et al., 2015), and the IASI-IMS-Extended record was filtered for an effective cloud fraction of <0.5 (as in Pope et al., 2021). Here, the RAL Space GOME-2 and IASI Infrared and Microwave Sounding (IMS) retrieval schemes for lower-tropospheric ozone have been independently evaluated against ozonesonde data in Miles et al. (2015) and Pimlott et al. (2022).
Height-resolved O3 distributions are retrieved by the Rutherford Appleton Laboratory (RAL) using the IMS-Extended scheme for IASI (detailed in Pope et al., 2021) and the UV–Vis scheme for GOME-2 (detailed in Miles et al., 2015). Due to an underlying negative tendency in the GOME-2 record, likely from UV degradation of the instrument, we have detrended that record, as shown in Sect. S1 and Fig. S1 in the Supplement. To investigate the IASI-IMS record over a longer time period, we merged the IASI data from MetOp-A (2008–2017) and MetOp-B (2018–2023) to generate the IASI-IMS-Extended record (2008–2023). The MetOp-B record was adjusted according to monthly differences with the MetOp-A record in the overlap year of 2018, as described in Sect. S2 and Figs. S2 and S3. Here, we use lower-tropospheric sub-columns of the surface–450 hPa (∼6 km altitude) derived from the retrieved profiles, with a focus on Europe. As such, we use a land mask to extract a terrestrial European signal given the direct link between surface O3, precursor gases, and air pollution exposure (see Fig. S4).
2.2 Model simulations
We use the TOMCAT 3-D CTM to simulate tropospheric O3 between 2017 and 2021. The model control simulation is for 2017, 2018, and 2019. However, in 2020, the control simulation splits into two scenarios: (1) a business-as-usual scenario (BAU) and (2) a scaled emission scenario (COVID). For the BAU scenario, the control modelled emissions inventory is used, whereas we apply emission reduction factors for the COVID scenario (Forster et al., 2020) to model surface and aircraft emissions and account for changes in activity due to the pandemic in 2020 and 2021. However, COVID scaling for emissions is not available beyond 2021, so the model simulations are restricted to the period from 2017 to 2021. TOMCAT is an off-line model driven by 6-hourly ERA5 meteorological reanalyses (e.g. temperature, relative humidity, and winds; Hersbach et al., 2020), which are provided by the European Centre for Medium-Range Weather Forecasts (ECMWF). The ERA5 meteorological reanalyses are provided on 137 vertical levels (surface–1 hPa), which are interpolated onto the TOMCAT vertical grid (31 levels; see Monks et al., 2017, their Fig. 1). It has a horizontal a resolution of 2.8°×2.8° and 31 vertical levels between the surface and 10 hPa, coupled with the Global Model of Aerosol Processes (GLOMAP) (Chipperfield, 2006; Mann et al., 2010; Spracklen et al., 2005). The chemistry scheme includes approximately 80 advected tracers and over 200 chemical reactions (Monks et al., 2017).
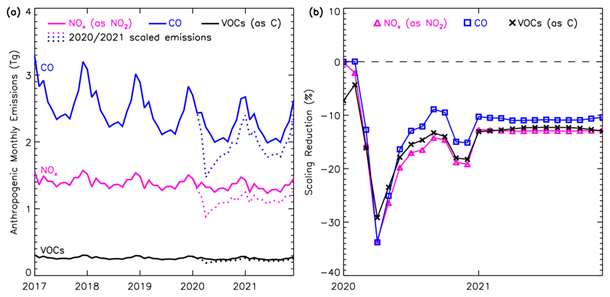
Figure 1European aggregated anthropogenic monthly emissions of NOx (as NO2), CO, and non-methane VOCs (as C) used in the TOMCAT simulations between 2017 and 2021. (a) BAU emissions (solid) and COVID emissions in 2020 and 2021 (dotted) (in Tg). (b) Percentage reduction in 2020 and 2021 for NOx, CO, and VOCs in the COVID emissions, relative to the BAU emissions.
Surface emission fields are described in detail in Sect. S4 and Table S1 in the Supplement. The anthropogenic emissions are from the Coupled Model Intercomparison Project Phase 6 (CMIP6) (Feng et al., 2020), whereby emissions after 2014 are based on Shared Socioeconomic Pathways (SSPs) (Gidden et al., 2019; Riahi et al., 2020). In this study, we have used the middle-of-the-road scenario, SSP2-4.5, for the TOMCAT control run between 2017 and 2019, before diverging into the BAU and COVID simulations. For the BAU simulation, the CMIP6 SSP2-4.5 emissions are used; however, for the COVID simulation, scaling factors for emission reductions from national lockdowns come from Forster et al. (2020) and were applied to the BAU emissions. Forster et al. (2020) used national mobility/activity data to estimate reductions in air pollutant emissions (i.e. NOx, CO, VOCs, black carbon (BC), and organic carbon (OC)). Figure 1a highlights the impacts of the scale factors, with substantial decreases evident in European emissions for NOx, CO, and VOCs. Figure 1b shows that the peak reductions were in April 2020, once most European lockdowns were in effect, with monthly reductions of 0.44 Tg (33 %), 0.75 Tg (34 %), and 0.06 Tg (29 %) of NOx (as NO2), CO, and non-methane VOCs (as carbon (C)), respectively. In 2020, a secondary emissions reduction (approximately 15 %–20 %) during the winter occurred, as further European lockdowns were imposed to reduce the spread of COVID-19. For 2021, the scaling factors from Forster et al. (2020) suggest that emissions were approximately 10 %–13 % lower than expected but remained consistent throughout the year, suggesting a potential “new normal” of lower precursor emissions. A tracer for stratosphere–troposphere exchange (STE) in the model (O3S) is used to understand the impact of O3 transport from the stratosphere. In the stratosphere, it is set equal to the model-calculated O3. The only tropospheric source of the tracer is transport from the stratosphere, whereas its sinks are via photolysis; surface deposition; and reactions with HO2, OH, and H2O through O(1D) produced from O3S (Monks et al., 2017).
Overall, TOMCAT is a robust and well-evaluated CTM, having been used in multiple studies of tropospheric O3 and compared with many types of observations (e.g. Richards et al., 2013; Pope et al., 2020, 2023, 2024). The simulated tropospheric ozone burden is a common metric to assess the skill of a model to simulate tropospheric ozone. Here, we derive a tropospheric O3 burden of 322 Tg (BAU 2020 simulation), which is consistent with that of Monks et al. (2017) who reported an equivalent of 331 Tg. Both estimates sit within the reported range of 337±23 Tg from the Atmospheric Chemistry and Climate Model Intercomparison Project (ACCMIP; Young et al., 2013), further demonstrating TOMCAT to be a suitable modelling framework. Highly relevant for this work, Pope et al. (2023) included a detailed comparison of lower-tropospheric ozone between TOMCAT and GOME-2 and IASI, where thorough consideration of the satellite averaging kernels (i.e. function of satellite vertical sensitivity when retrieving sub-column profiles of O3) was taken in conjunction with the model, generally displaying good agreement between them. Therefore, we are confident in using TOMCAT to directly investigate the impact of COVID-19 on lower-tropospheric ozone over Europe.
3.1 European tropospheric ozone satellite record (2008–2023)
We present two satellite-derived lower-tropospheric sub-column O3 records for continental Europe from 2008 to 2023 (Fig. 2). During the overlapping years of 2015–2019, the records show an average difference of 2.5 DU, but the variability is well correlated (Pearson's correlation coefficient of ∼ 0.80). Satellite record inconsistencies are likely due to differences between IR and UV–Vis instruments, the related retrieval schemes, and their vertical sensitivities, despite the instruments being aboard the same platform and having the same overpass time. Compared to a monthly baseline of 2015–2019 for GOME-2B and of 2008–2019 for IASI-IMS-Extended, the monthly anomalies (Fig. 2b) show good agreement through this overlap period, with the most notable disagreements in winter–spring of 2015 and spring–summer 2016. Both records show large negative anomalies in spring–summer 2020. GOME-2B shows peak negative anomalies of 2.4 DU (18.3 %) and 3.0 DU (21.4 %) in April and May 2020, respectively, and IASI-IMS-Extended shows slightly smaller negative anomalies of 1.7 DU (9.4 %) and 2.2 DU (11.0 %) in April and May, respectively. For the records shown in Fig. 2b, 2 standard deviations (2σ) across the entire monthly record is 2.1 DU for GOME-2B and 1.8 DU for IASI-IMS-Extended. Thus, ∼95 % of the data range between the average ± 2σ for the respective records. In both cases, April and May 2020 negative anomalies either match or surpass this range, signifying relatively substantial anomalies for these months and highlighting their unusual nature. The reductions continue into the summer of 2020, with both records showing large negative anomalies in July and August: respective values of 1.7 DU (9.2 %) and 1.4 DU (7.2 %) for GOME-2B and 1.8 DU (8.3 %) and 1.3 DU (6.3 %) for IASI-IMS-Extended.
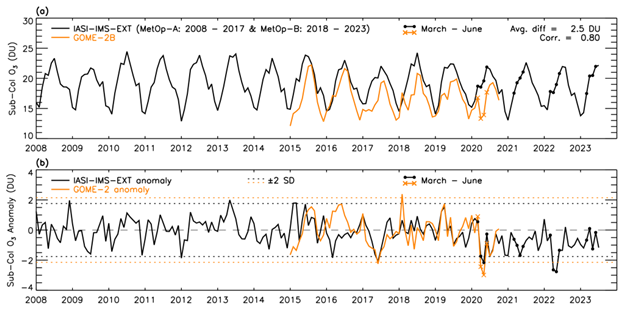
Figure 2European satellite-derived O3 from January 2008 to July 2023. (a) Monthly average sub-column (surface–450 hPa) O3 record (in DU) from IASI (IASI-IMS-Extended, January 2008–July 2023) and GOME-2B (January 2015–October 2020). (b) Monthly mean anomalies for the two records (2015–2019 baseline for GOME-2B, 2008–2019 for IASI-IMS-Extended) (in DU). Dotted lines indicate ±2σ from the average of the record. Filled circles (IASI-IMS-Extended) and crosses (GOME-2B) are shown for the months of March–June in 2020–2023, to highlight the relevant spring/summer periods. The average difference and correlation are based on the period from January 2015 to December 2019.
Tropospheric O3 reductions continue into the spring and summer period of 2021, with the IASI-IMS-Extended record showing negative anomalies in most months of 2021; however, these anomalies are slightly smaller than in 2020. The largest negative anomalies are in April, May, and June, at 1.0 DU (5.3 %), 1.7 DU (8.4 %), and 1.1 DU (5.2 %), respectively, with only the reduction in May being close to the average ± 2σ threshold. This 2021 recurrence of a tropospheric O3 reduction of similar magnitude to 2020 is consistent with the combined NASA satellite product tropospheric column O3 record for the 20–60° N latitude band reported by Ziemke et al. (2022), which is presented from January to August.
It is worth noting that there is approximately a 1-month lag between the IASI and GOME-2 time series in Fig. 2 which is likely due to the European domain (see Fig. S4) extending to high northern latitudes (approximately 70° N) where sampling of the GOME-2 UV sounder, but not IASI, is restricted in winter months by the absence of sunlight. While this could slightly influence the domain average annual cycle comparison, it does not affect the interannual variability subject of this study.
In 2022, the IASI-IMS-Extended record shows even larger negative anomalies in April and May, compared with 2020/2021, of 2.6 DU (15.0 %) and 2.8 DU (14.6 %), respectively, which are well beyond the average ± 2σ threshold. The negative anomalies continue in June and July, with values of 1.3 DU (6.5 %) and 1.3 DU (6.1 %). In 2023, the negative anomalies in spring–summer are smaller compared with 2020–2022, apart from in May, when the negative anomaly is 1.3 DU (6.1 %). Broadly, the years of 2020–2023 all show monthly anomalies that are more consistently negative than the previous 12 years. The question of the persistence of low European O3 values will become evident in future years through extension of these MetOp records.
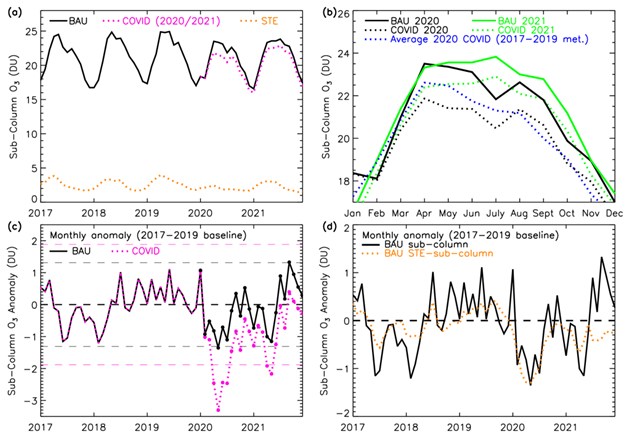
Figure 3TOMCAT European lower-tropospheric sub-column O3 (surface–450 hPa) between 2017 and 2021 (in DU). (a) Monthly sub-column O3 averages for the BAU sub-column (solid, black) and STE contribution sub-column (dotted, orange). The COVID scenario is shown in 2020 and 2021 (dotted, pink). (b) BAU (solid, black) and COVID scenario (dotted) records for 2020 (black), 2021 (green), and with the 2017–2019 average COVID scenario (2020 scaled emissions; dotted, dark blue). (c) BAU (solid, black) and COVID (dotted, pink) O3 anomalies (baseline of 2017–2019). Horizonal dashed lines indicate ±2σ from the average of the record. Panel (d) is the same as panel (c) with the inclusion of monthly O3 anomalies of the STE contribution sub-column (dotted, orange).
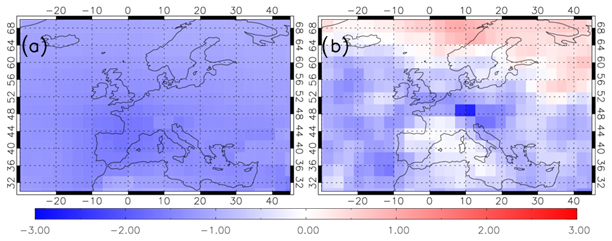
Figure 4TOMCAT lower-tropospheric ozone (in DU) differences (March–May 2020 average) between (a) the TOMCAT COVID and TOMCAT BAU simulations and (b) the TOMCAT COVID simulation with 2017–2019 average meteorology (TOMCAT run for 2017, 2018, and 2019 with 2020 COVID emissions and the three simulations averaged together) and the TOMCAT BAU simulation.
3.2 TOMCAT model experiments (2017–2021)
In 2020, scaling the emissions according to the mobility data estimates in Forster et al. (2020) (TOMCAT COVID scenario) caused a monthly reduction in tropospheric O3 from March to December (Fig. 3a). During January and February, the COVID and BAU scenarios are very similar; however, from March onwards, the COVID scenario shows a negative difference compared with the BAU scenario, which peaks at 2.0 DU (8.3 %) lower in May. This negative difference then reduces through the year until December (0.7 DU, 4.1 %). Figure 4a shows the spatial impact of COVID-19 on lower-tropospheric ozone simulated by TOMCAT. The March–May 2020 average is typically 1.0–2.0 DU lower across the whole European domain. In 2021, the COVID scenario in Fig. 3a shows consistent reductions in all months of the year, starting at 0.6 DU (3.4 %) in January, peaking at 1.0 DU (4.3 %) in May, and reducing towards the end of the year, ending with 0.6 DU (3.2 %) in December. The temporal pattern of the reduction is similar to that in surface emissions (Fig. 1), although with considerably smaller percentage decreases (peak of ∼30 % for surface emissions and ∼8 % for the resulting O3 sub-column). This highlights the large emission reductions required for a sizeable reduction in European lower-tropospheric O3. To identify the impact of meteorology in 2020, the scaled emissions in 2020 were used in three separate simulations with the meteorology of 2017, 2018, and 2019, with an average of these three scaled emission simulations shown in Fig. 3b. The 2020 COVID scenario record is broadly lower than the 2017–2019 average scaled emission scenario, despite using the same surface emissions, which indicates that the meteorology of 2020 had a large impact on the tropospheric O3 reduction. Here, we use the term “meteorology” to represent meteorological variables, such as temperature, pressure, and humidity, and the long-range transport (i.e. advection/convection) of air masses, which influence tropospheric chemistry. This is supported by Fig. 4b, which shows that, across most of Europe, 2020 meteorological conditions were more conducive to lower-tropospheric ozone loss (i.e. differences of −3.0 and −1.0 DU) than previous years. However, the domain average shown for March–May 2020 in Fig. 3b is buffered by the positive differences (up to 1.0–1.5 DU) above 60° N. The impact of meteorology in 2020 is greatest in the spring–summer (Fig. 3b), as the differences between these two time series are largest from February to July, peaking at a 1.1 DU difference in May. This demonstrates the importance of meteorology to the resulting O3 in the spring–summer of 2020. The records are much more consistent from August to the end of the year, with absolute differences below 0.6 DU, indicating a reduced impact from meteorology in the second half of the year.
In comparison with the previous 3 years (2017–2019), the BAU scenario in 2020 and 2021 has lower peak spring–summer values of O3, especially compared with the high O3 values in 2019 (Fig. 3a). The spring–summer of 2020 shows negative anomalies in the BAU scenario of up to 1.4 DU (−5.8 %) (Fig. 3c). April, May, and July show the largest reductions, which are around the value of the average ± 2σ threshold (±1.3 DU, 6.2 %). The spring–summer BAU scenario reductions are repeated in 2021 from January to June, peaking at 1.2 DU (4.9 %) in May. Any variation in the BAU scenario is due to meteorology and also variation in the BAU surface emissions used. As shown in Fig. 1, the BAU emissions only vary by a small amount from year to year; e.g. the average total annual anthropogenic emission difference between consecutive years across the simulation time period is 0.33 Tg (2.0 %) for NOx, 1.3 Tg (4.4 %) for CO, and 0.06 Tg (1.8 %) for VOCs. With consistent BAU emissions, meteorology is the dominant control in the BAU scenario and had a large impact on the simulated tropospheric O3 in the spring and summer of 2020.
The COVID scenario shows large negative anomalies in 2020, peaking at 3.3 DU (15.4 %) in May 2020 (Fig. 3c), which is much higher than the average ± 2σ threshold (±1.9 DU, 9.0 %). Comparing the BAU and COVID scenarios suggests that ∼1 DU of the negative anomaly is due to meteorology (and small variations in BAU emissions) and the remaining contribution (∼1–2 DU in spring–summer) of the negative anomaly is due to the scaled emissions for 2020. The contribution of O3 from STE to the troposphere in the model sub-column is calculated by TOMCAT as a tracer which represents stratospheric O3 that has entered the troposphere and is controlled by tropospheric sink processes. We calculate a sub-column based on this contribution (STE sub-column), shown in Fig. 3a, varying between 1.5 and 4.0 DU from 2017 to 2021. We find a large negative anomaly in model stratosphere–troposphere O3 exchange in the spring–summer of 2020 (Fig. 3d), of 1.3 DU in both April and May (52.5 % and 60.5 %, respectively). The STE sub-column absolute negative anomaly is a similar value or larger than the lower-tropospheric sub-column anomaly from March to August in 2020, suggesting that the low STE contribution during this period was a substantial factor in the BAU scenario lower-tropospheric sub-column O3 reduction. In the months when the STE sub-column absolute anomaly is larger than the BAU anomaly, the other controlling factors in the BAU simulation O3 are likely around neutral or even slightly positive. The stratospheric O3 used in the model simulation is a climatology; therefore, any variation on the STE contribution is from variation in the STE flux. In 2021, the negative anomaly in STE sub-column is smaller than for 2020, reaching a peak value of 0.7 DU (21.5 %) in April (Fig. 3d). The STE sub-column negative anomaly is also not larger than for the lower-tropospheric sub-column in 2021, suggesting that the STE reduction had a smaller impact on the negative lower-tropospheric sub-column anomalies seen in 2021, in comparison with 2020.
To further quantify the relative contributions, the difference between the anomalies for the BAU and COVID scenarios as a relative percentage of the COVID scenario for 2020 (i.e. ) is shown in Fig. 5a. We performed this quantification for spring–summer months and showed a negative anomaly in both scenarios (March–August 2020 and March–June 2021). These values represent the percentage contributions of the emission reductions (due to COVID-19) and meteorological conditions to the determined reduction in the lower-tropospheric column zone. The contribution of emissions to the COVID scenario in spring–summer 2020 is 53 % (March), 67 % (April), 59 % (May), 71 % (June), 55 % (July), and 87 % (August), with an average of 65 % across these months. Therefore, scaling the emissions is the dominant influence during this period. In 2021, the COVID scenario also shows large negative anomalies, peaking at 2.2 DU (9.6 %) in May. Scaling the emissions contributed towards 86 %, 48 %, 47 %, and 80 % for March, April, May, and June, respectively, of the scaled negative anomaly (average of 65 %), with the rest due to meteorology (and BAU emissions).
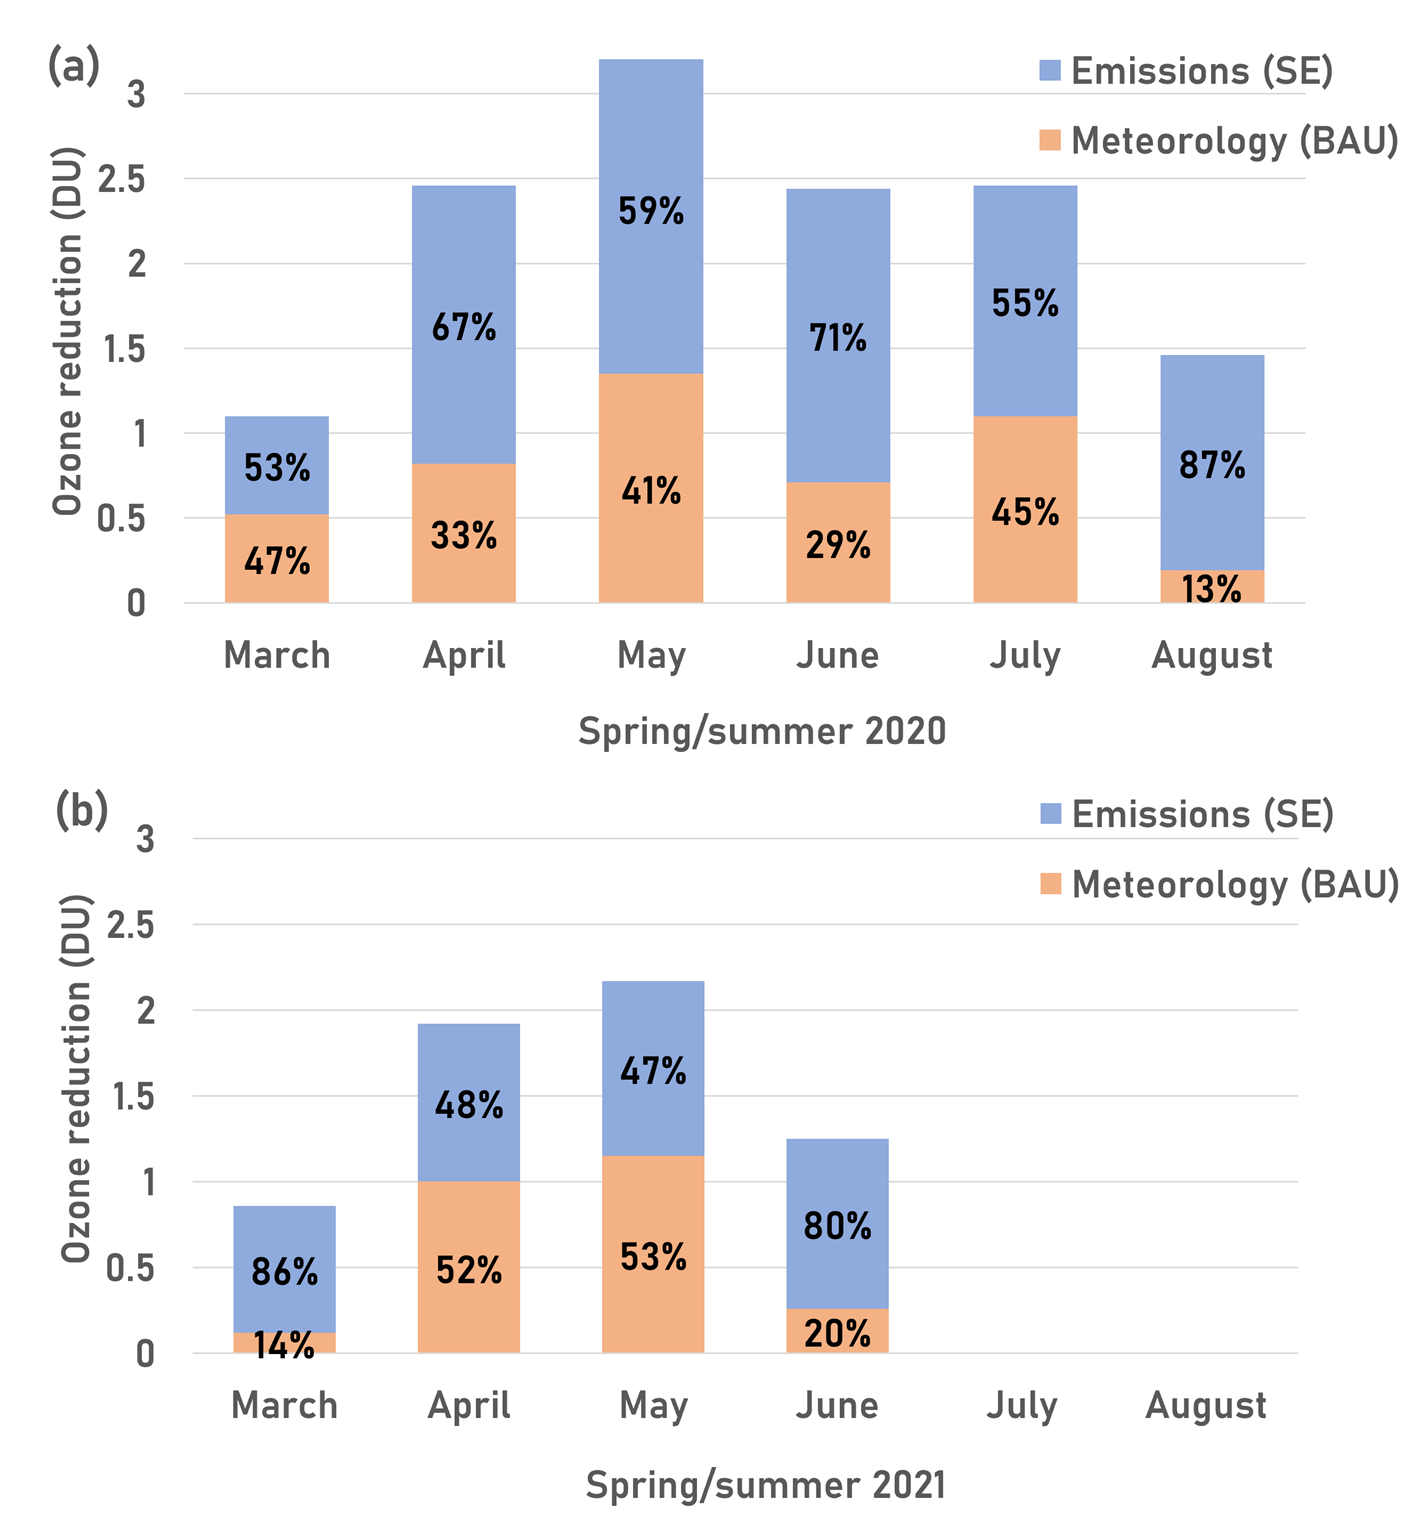
Figure 5Contribution of scaled emissions and meteorology/BAU emissions to the TOMCAT lower-tropospheric sub-column O3 reduction from March to August in (a) 2020 and (b) 2021. The total reduction (in DU) is the COVID scenario negative anomaly, with the relative contribution of meteorology/BAU emissions shown in orange and the contribution of scaled emissions shown in blue. The percentage relative contribution is labelled in each bar section.
Our study represents one of the first extended investigations of the COVID-19 pandemic impacts on European lower-tropospheric O3 (surface–450 hPa) using satellite observations and modelling. The records from the Global Ozone Monitoring Experiment (GOME-2) and the Infrared Atmospheric Sounding Interferometer (IASI) on MetOp-B show substantial decreases in European average spring–summertime lower-tropospheric ozone of typically 2.0–3.0 DU (or 11.0 %–14.6 %). While not the key focus of this paper, the 2022 decline in O3 is interestingly the largest between 2020 and 2023. Therefore, this would suggest that other factors not investigated in this study are driving a more substantial O3 decrease and that the reported COVID-19 response is within the more extreme variability in European ozone.
To investigate the drivers of the O3 decreases over Europe during the COVID-19 period (2020–2021), activity scaling factors (i.e. based on anonymized mobility data from big tech firms) were used to perturb the model's business-as-usual (BAU) emissions for 2020 and 2021 to quantify the COVID-19 impact on O3. Here, the TOMCAT simulations of lower-tropospheric O3 were reduced by 2.0–3.0 DU (comparable to the O3 reductions reported by the satellite records) in the COVID-19 simulation compared with the BAU baseline. Further model sensitivity experiments were able to diagnose the contribution of 2020 emissions changes (approximately 66 %) and 2020 meteorological conditions (approximately 34 %) to the overall TOMCAT-simulated O3 reduction in Europe. Therefore, the COVID-19-related reductions in O3 precursor emissions were instrumental in reducing 2020 European O3, but this was amplified by meteorological conditions that year. Investigation of the TOMCAT stratospheric O3 tagged tracer (i.e. a representation of the flux of O3-rich stratospheric air into the troposphere) suggested a substantial drop in its contribution to lower-tropospheric O3 (in the order of 1.0 DU), which was comparable to the meteorological signal. Thus, it was a likely cause of the amplified European O3 reduction in the COVID-19 period.
Therefore, our study has successfully quantified the impact of COVID-19 on European lower-tropospheric ozone and identified a useful methodology to isolate the impact of emission changes and, importantly, meteorological variability on observed changes in the tropospheric composition. Future work would focus on the large reduction in European O3 in 2022 (which is beyond the scope of this study), the production of a harmonized IASI O3 record from the three MetOp satellites, and a reprocessing of the RAL Space GOME-2 record to more accurately account for UV degradation in the instrument record.
The IASI-IMS and GOME-2 data are available via the UK Natural Environment Research Council (NERC) Centre for Environmental Data Analysis (CEDA) JASMIN platform, subject to data requests. However, the IASI-IMS data and TOMCAT simulations used in this study are available from Zenodo at https://doi.org/10.5281/zenodo.10424302 (Pimlott et al., 2024).
The supplement related to this article is available online at https://doi.org/10.5194/acp-25-4391-2025-supplement.
MAP and RJP conceptualized, planned, and undertook the research. BJK, RS, BGL, and LJV provided the data and advice on using the products. MAP performed the TOMCAT model simulations with support from MPC and WF. MAP prepared the manuscript with contributions from all co-authors.
The contact author has declared that none of the authors has any competing interests.
Publisher's note: Copernicus Publications remains neutral with regard to jurisdictional claims made in the text, published maps, institutional affiliations, or any other geographical representation in this paper. While Copernicus Publications makes every effort to include appropriate place names, the final responsibility lies with the authors.
This article is part of the special issue “Tropospheric Ozone Assessment Report Phase II (TOAR-II) Community Special Issue (ACP/AMT/BG/GMD inter-journal SI)”. It is a result of the Tropospheric Ozone Assessment Report, Phase II (TOAR-II, 2020–2024).
This work was supported by the UK Natural Environment Research Council (NERC) via funding for the National Centre for Earth Observation (NCEO, award reference NE/R016518/1) and the NERC Panorama Doctoral Training Partnership (DTP, award reference 580 NE/S007458/1). The TOMCAT runs were undertaken on ARC3, part of the high-performance computing facilities at the University of Leeds, UK.
This research has been supported by the National Centre for Earth Observation (grant no. NE/R016518/1) and the NERC Panorama Doctoral Training Partnership (DTP, award reference 580 NE/S007458/1).
This paper was edited by Suvarna Fadnavis and reviewed by two anonymous referees.
Bouarar, I., Gaubert, B., Brasseur, G. P., Steinbrecht, W., Doumbia, T., Tilmes, S., Liu, Y., Stavrakou, T., Deroubaix, A., Darras, S., Granier, C., Lacey, F., Müller, J-L., Shi, X., Elguindi, N., and Wang., T.: Ozone Anomalies in the Free Troposphere During the COVID-19 Pandemic, Geophys. Res. Lett., 48, 1–11, https://doi.org/10.1029/2021GL094204, 2021.
Callies, J., Corpaccioli, E., Eisinger, M., Hahne, A., and Lefebvre, A.: GOME-2-Metop's second-generation sensor for operational ozone monitoring, ESA Bulletin, 102, 28–36, https://www.esa.int/esapub/bulletin/bullet102/Callies102.pdf (last access: 1 May 2020), 2000.
Chang, K. L., Cooper, O. R., Gaudel, A., Allaart, M., Ancellet, G., Clark, H., Godin-Beekmann, S., Leblanc, T., Van Malderen, R., Nédélec, P., Petropavlovskikh, I., Steinbrecht, W., Stübi, R., Tarasick, D. W., and Torres, C.: Impact of the COVID-19 Economic Downturn on Tropospheric Ozone Trends: An Uncertainty Weighted Data Synthesis for Quantifying Regional Anomalies Above Western North America and Europe, AGU Adv., 3, 2, https://doi.org/10.1029/2021AV000542, 2022.
Chipperfield, M. P.: New version of the TOMCAT/SLIMCAT off-line chemical transport model: Intercomparison of stratospheric tracer experiments, Q. J. Roy. Meteorol. Soc., 132, 1179–1203, https://doi.org/10.1256/qj.05.51, 2006.
Clark, H., Bennouna, Y., Tsivlidou, M., Wolff, P., Sauvage, B., Barret, B., Le Flochmoën, E., Blot, R., Boulanger, D., Cousin, J.-M., Nédélec, P., Petzold, A., and Thouret, V.: The effects of the COVID-19 lockdowns on the composition of the troposphere as seen by In-service Aircraft for a Global Observing System (IAGOS) at Frankfurt, Atmos. Chem. Phys., 21, 16237–16256, https://doi.org/10.5194/acp-21-16237-2021, 2021.
Clerbaux, C., Boynard, A., Clarisse, L., George, M., Hadji-Lazaro, J., Herbin, H., Hurtmans, D., Pommier, M., Razavi, A., Turquety, S., Wespes, C., and Coheur, P.-F.: Monitoring of atmospheric composition using the thermal infrared IASI/MetOp sounder, Atmos. Chem. Phys., 9, 6041–6054, https://doi.org/10.5194/acp-9-6041-2009, 2009.
Cuesta, J., Costantino, L., Beekmann, M., Siour, G., Menut, L., Bessagnet, B., Landi, T. C., Dufour, G., and Eremenko, M.: Ozone pollution during the COVID-19 lockdown in the spring of 2020 over Europe, analysed from satellite observations, in situ measurements, and models, Atmos. Chem. Phys., 22, 4471–4489, https://doi.org/10.5194/acp-22-4471-2022, 2022.
Doumbia, T., Granier, C., Elguindi, N., Bouarar, I., Darras, S., Brasseur, G., Gaubert, B., Liu, Y., Shi, X., Stavrakou, T., Tilmes, S., Lacey, F., Deroubaix, A., and Wang, T.: Changes in global air pollutant emissions during the COVID-19 pandemic: a dataset for atmospheric modeling, Earth Syst. Sci. Data, 13, 4191–4206, https://doi.org/10.5194/essd-13-4191-2021, 2021.
Dunn, R. J. H., Blannin, J., Gobron, N., Miller, J. B., and Willett, K. M.: Global Climate [in “State of the Climate in 2023”], B. Am. Meteorol. Soc., 105, S12–S155, 2024.
European Environment Agency: Air quality in Europe 2022, https://doi.org/10.2800/488115, 2022.
Feng, L., Smith, S. J., Braun, C., Crippa, M., Gidden, M. J., Hoesly, R., Klimont, Z., van Marle, M., van den Berg, M., and van der Werf, G. R.: The generation of gridded emissions data for CMIP6, Geosci. Model Dev., 13, 461–482, https://doi.org/10.5194/gmd-13-461-2020, 2020.
Feng, W., Dhomse, S. S., Arosio, C., Weber, M., Burrows, J. P., Santee, M. L., and Chipperfield, M. P.: Arctic Ozone Depletion in 2019/20: Roles of Chemistry, Dynamics and the Montreal Protocol, Geophys. Res. Lett., 48, 1–10, https://doi.org/10.1029/2020GL091911, 2021.
Forster, P. M., Forster, H. I., Evans, M. J., Gidden, M. J., Jones, C. D., Keller, C. A., Lamboll, R. D., Le Quere, C., Rogelj, J., Rosen., D., Schleussner, C.-F., Richardson, T. B., Smith, C. J., and Turnock, S. T.: Current and future global climate impacts resulting from COVID-19, Nat. Clim. Change, 10, 913–919, https://doi.org/10.1038/s41558-020-0883-0, 2020.
Gidden, M. J., Riahi, K., Smith, S. J., Fujimori, S., Luderer, G., Kriegler, E., van Vuuren, D. P., van den Berg, M., Feng, L., Klein, D., Calvin, K., Doelman, J. C., Frank, S., Fricko, O., Harmsen, M., Hasegawa, T., Havlik, P., Hilaire, J., Hoesly, R., Horing, J., Popp, A., Stehfest, E., and Takahashi, K.: Global emissions pathways under different socioeconomic scenarios for use in CMIP6: a dataset of harmonized emissions trajectories through the end of the century, Geosci. Model Dev., 12, 1443–1475, https://doi.org/10.5194/gmd-12-1443-2019, 2019.
Grange, S. K., Lee, J. D., Drysdale, W. S., Lewis, A. C., Hueglin, C., Emmenegger, L., and Carslaw, D. C.: COVID-19 lockdowns highlight a risk of increasing ozone pollution in European urban areas, Atmos. Chem. Phys., 21, 4169–4185, https://doi.org/10.5194/acp-21-4169-2021, 2021.
Guevara, M., Jorba, O., Soret, A., Petetin, H., Bowdalo, D., Serradell, K., Tena, C., Denier van der Gon, H., Kuenen, J., Peuch, V.-H., and Pérez García-Pando, C.: Time-resolved emission reductions for atmospheric chemistry modelling in Europe during the COVID-19 lockdowns, Atmos. Chem. Phys., 21, 773–797, https://doi.org/10.5194/acp-21-773-2021, 2021.
Hersbach, H., Bell, B., Berrisford, P., Hirahara, S., Horányi, A., Muñoz-Sabater, J., Nicolas, J., Peubey, C., Radu, R., Schepers, D., Simmons, A., Soci, C., Abdalla, S., Abellan, X., Balsamo, G., Bechtold, P., Biavati, G., Bidlot, J., Bonavita, M., De Chiara, G., Dahlgren, P., Dee, D., Diamantakis, M., Dragani, R., Flemming, J., Forbes, R., Fuentes, M., Geer, A., Haimberger, L., Healy, S., Hogan, R. J., Holm, E., Janiskova, M., Keely, S., Laloyaux, P., Lopez, P., Lupu, C., Radnoti, G., Rosnay, P., Rozum, I., Vamborg, F., Villaume, S., and Thepaut, J.-N.: The ERA5 global reanalysis, Q. J. Roy. Meteorol. Soc., 146, 1999–2049, https://doi.org/10.1002/qj.3803, 2020.
IPCC: Climate Change 2021: The Physical Science Basis: Contribution of Working Group I to the Sixth Assessment Report of the Intergovernmental Panel on Climate Change, edited by: Masson-Delmotte, V., Zhai, P., Pirani, A., Connors, S. L., Péan, C., Berger, S., Caud, N., Chen, Y., Goldfarb, L., Gomis, M. I., Huang, M., Leitzell, K., Lonnoy, E., Matthews, J. B. R., Maycock, T. K., Waterfield, T., Yelekçi, O., Yu, R., and Zhou, B., Cambridge University Press, Cambridge, UK, https://doi.org/10.1017/9781009157896, 2021.
Mann, G. W., Carslaw, K. S., Spracklen, D. V., Ridley, D. A., Manktelow, P. T., Chipperfield, M. P., Pickering, S. J., and Johnson, C. E.: Description and evaluation of GLOMAP-mode: a modal global aerosol microphysics model for the UKCA composition-climate model, Geosci. Model Dev., 3, 519–551, https://doi.org/10.5194/gmd-3-519-2010, 2010.
Miles, G. M., Siddans, R., Kerridge, B. J., Latter, B. G., and Richards, N. A. D.: Tropospheric ozone and ozone profiles retrieved from GOME-2 and their validation, Atmos. Meas. Tech., 8, 385–398, https://doi.org/10.5194/amt-8-385-2015, 2015.
Miyazaki, K., Bowman, K., Sekiya, T., Takigawa, M., Neu, J. L., Sudo, K., Osterman, G., and Eskes, H.: Global tropospheric ozone responses to reduced NOx emissions linked to the COVID-19 worldwide lockdowns, Sci. Adv., 7, 1–15, https://doi.org/10.1126/sciadv.abf7460, 2021.
Monks, P. S., Archibald, A. T., Colette, A., Cooper, O., Coyle, M., Derwent, R., Fowler, D., Granier, C., Law, K. S., Mills, G. E., Stevenson, D. S., Tarasova, O., Thouret, V., von Schneidemesser, E., Sommariva, R., Wild, O., and Williams, M. L.: Tropospheric ozone and its precursors from the urban to the global scale from air quality to short-lived climate forcer, Atmos. Chem. Phys., 15, 8889–8973, https://doi.org/10.5194/acp-15-8889-2015, 2015.
Monks, S. A., Arnold, S. R., Hollaway, M. J., Pope, R. J., Wilson, C., Feng, W., Emmerson, K. M., Kerridge, B. J., Latter, B. L., Miles, G. M., Siddans, R., and Chipperfield, M. P.: The TOMCAT global chemical transport model v1.6: description of chemical mechanism and model evaluation, Geosci. Model Dev., 10, 3025–3057, https://doi.org/10.5194/gmd-10-3025-2017, 2017.
Munro, R., Lang, R., Klaes, D., Poli, G., Retscher, C., Lindstrot, R., Huckle, R., Lacan, A., Grzegorski, M., Holdak, A., Kokhanovsky, A., Livschitz, J., and Eisinger, M.: The GOME-2 instrument on the Metop series of satellites: instrument design, calibration, and level 1 data processing – an overview, Atmos. Meas. Tech., 9, 1279–1301, https://doi.org/10.5194/amt-9-1279-2016, 2016.
Ordóñez, C., Garrido-Perez, J. M., and García-Herrera, R.: Early spring near-surface ozone in Europe during the COVID-19 shutdown: Meteorological effects outweigh emission changes, Sci. Total Environ., 747, 141322, https://doi.org/10.1016/j.scitotenv.2020.141322, 2020.
Parrish, D. D., Derwent, R. G., Faloona, I. C., and Mims, C. A.: Technical note: Northern midlatitude baseline ozone – long-term changes and the COVID-19 impact, Atmos. Chem. Phys., 22, 13423–13430, https://doi.org/10.5194/acp-22-13423-2022, 2022.
Pey, J. and Cerro, J. C.: Reasons for the observed tropospheric ozone weakening over south-western Europe during COVID-19: Strict lockdown versus the new normal, Sci. Total Environ., 833, 155162, https://doi.org/10.1016/j.scitotenv.2022.155162, 2022.
Pimlott, M. A., Pope, R. J., Kerridge, B. J., Latter, B. G., Knappett, D. S., Heard, D. E., Ventress, L. J., Siddans, R., Feng, W., and Chipperfield, M. P.: Investigating the global OH radical distribution using steady-state approximations and satellite data, Atmos. Chem. Phys., 22, 10467–10488, https://doi.org/10.5194/acp-22-10467-2022, 2022.
Pimlott, M. A., Pope, R. J., Kerridge, B. J., Siddans, R., Latter, B. G., Ventress, L. J., Feng, W., and Chipperfield, M. P.: TOMCAT model data & IASI/GOME-2B satellite data of European ozone between 2008–2023, Zenodo [data set], https://doi.org/10.5281/zenodo.10424302, 2024.
Pope, R. J., Arnold, S. R., Chipperfield, M. P., Reddington, C. L. S., Butt, E. W., Keslake, T. D., Feng, W., Latter, B. G., Kerridge, B. J., Siddans, R., Rizzo, L., Artaxo, P., Sadiq, M., and Tai, A. P. K.: Substantial increases in Eastern Amazon and Cerrado biomass burning-sourced tropospheric ozone, Geophys. Res. Lett., 47, e2019GL084143, https://doi.org/10.1029/2019GL084143, 2020.
Pope, R. J., Kerridge, B. J., Siddans, R., Latter, B. G., Chipperfield, M. P., Arnold, S. R., Ventress, L. J., Pimlott, M. A., Graham, A. M., Knappett, D. S., and Rigby, R.: Large enhancements in southern hemisphere satellite-observed trace gases due to the 2019/2020 Australian wildfires, J. Geophys. Res.-Atmos., 126, e2021JD034892, https://doi.org/10.1029/2021jd034892, 2021.
Pope, R. J., Kerridge, B. J., Chipperfield, M. P., Siddans, R., Latter, B. G., Ventress, L. J., Pimlott, M. A., Feng, W., Comyn-Platt, E., Hayman, G. D., Arnold, S. R., and Graham, A. M.: Investigation of the summer 2018 European ozone air pollution episodes using novel satellite data and modelling, Atmos. Chem. Phys., 23, 13235–13253, https://doi.org/10.5194/acp-23-13235-2023, 2023.
Pope, R. J., Rap, A., Pimlott, M. A., Barret, B., Le Flochmoen, E., Kerridge, B. J., Siddans, R., Latter, B. G., Ventress, L. J., Boynard, A., Retscher, C., Feng, W., Rigby, R., Dhomse, S. S., Wespes, C., and Chipperfield, M. P.: Quantifying the tropospheric ozone radiative effect and its temporal evolution in the satellite era, Atmos. Chem. Phys., 24, 3613–3626, https://doi.org/10.5194/acp-24-3613-2024, 2024.
Putero, D., Cristofanelli, P., Chang, K.-L., Dufour, G., Beachley, G., Couret, C., Effertz, P., Jaffe, D. A., Kubistin, D., Lynch, J., Petropavlovskikh, I., Puchalski, M., Sharac, T., Sive, B. C., Steinbacher, M., Torres, C., and Cooper, O. R.: Fingerprints of the COVID-19 economic downturn and recovery on ozone anomalies at high-elevation sites in North America and western Europe, Atmos. Chem. Phys., 23, 15693–15709, https://doi.org/10.5194/acp-23-15693-2023, 2023.
Riahi, K., van Vuuren, D. P., Kriegler, E., Edmonds, J., O'Neill, B. C., Fujimori, S., Bauer, N., Calvin, K., Dellink, R., Fricko, O., Lutz, W., Popp, A., Cuaresma, J. C., KC, S., Leimbach, M., Jiang, L., Kram, T., Rao, S., Emmerling, J., Ebi, K., Hasegawa, T., Havlik, P, Humpenoder, F., Da Silva, L. A., Smith, S., Stehfest, E., Bosetti, V., Eom, J., Gernaat, D., Masui, T., Rogelj, J., Strefler, J., Drouet, L., Krey, V., Luderer, G., Harmsen, M., Takahashi, K., Baumstark, L., Doelman, J. C., Kainuma, M., Klimont, Z., Marangoni, G., Lotze-Campen, H., Obersteiner, M., Tabeu, A., and Tavoni, M.: The Shared Socioeconomic Pathways and their energy, land use, and greenhouse gas emissions implications: An overview, Global Environ. Change, 42, 153–168, https://doi.org/10.1016/j.gloenvcha.2016.05.009, 2020.
Richards, N. A. D., Arnold, S. R., Chipperfield, M. P., Miles, G., Rap, A., Siddans, R., Monks, S. A., and Hollaway, M. J.: The Mediterranean summertime ozone maximum: global emission sensitivities and radiative impacts, Atmos. Chem. Phys., 13, 2331–2345, https://doi.org/10.5194/acp-13-2331-2013, 2013.
Skeie, R. B., Myhre, G., Hodnebrog, Ø., Cameron-Smith, P. J., Deushi, M., Hegglin, M. I., Horowitz, L. W., Kramer, R. J., Michou, M., Mills, J. M., Olivie, D. J. L., O'Connor, F. M., Paynter, D., Samset, B. H., Sellar, A., Shindell, D., Takemura, T., Tilmes, S., and Wu, T.: Historical total ozone radiative forcing derived from CMIP6 simulations, Npj Clim. Atmos. Sci., 3, 1, https://doi.org/10.1038/s41612-020-00131-0, 2020.
Spracklen, D. V., Pringle, K. J., Carslaw, K. S., Chipperfield, M. P., and Mann, G. W.: A global off-line model of size-resolved aerosol microphysics: I. Model development and prediction of aerosol properties, Atmos. Chem. Phys., 5, 2227–2252, https://doi.org/10.5194/acp-5-2227-2005, 2005.
Steinbrecht, W., Kubistin, D., Plass-Dülmer, C., Davies, J., Tarasick, D. W., Von Der Gathen, P., Deckelmann, H., Kivi, R., Lyall, N., Palm, M., Notholt, J., Kois, B., Oelsner, P., Allaart, M., Piters, A., Gill, M., Malderen, R., Delcloo, A. W., Sussmann, R., Mahieu, E., Servais, C., Romanens, G., Stubi, R., Ancellet, G., Godin-Beekmann, S., Yamanouchi, S., Strong, K., Johnson, B., Cullis, P., Petropavloshkikh, I., Hannigan, W. J., Hernadnez, J.-L., Rodriguez, A. D., Nakano, T., Chouza, F., Leblanc, T., Torres, C., Garcia, O., Rohling, A. N., Schneider, M., Blumenstock, T., Tully, M., Paton-Walsh, A., Inness, A., Engelen, R., Chang, K.-L., and Cooper, O. R.: COVID-19 Crisis Reduces Free Tropospheric Ozone Across the Northern Hemisphere, Geophys. Res. Lett., 48, 1–11, https://doi.org/10.1029/2020GL091987, 2021.
Weber, M., Arosio, C., Feng, W., Dhomse, S. S., Chipperfield, M. P., Meier, A., Burrows, J. P., Eichmann, K.-U., Richter, A., and Rozanov, A.: The Unusual Stratospheric Arctic Winter 2019/20: Chemical Ozone Loss From Satellite Observations and TOMCAT Chemical Transport Model, J. Geophys. Res.-Atmos., 126, 1–14, https://doi.org/10.1029/2020JD034386, 2021.
WHO: Naming the coronavirus disease (COVID-19) and the virus that causes it, https://www.who.int/emergencies/diseases/novel-coronavirus-2019/technical-guidance/naming-the-coronavirus-disease-(covid-2019)-and-the-virus-that-causes-it (last access: 14 April 2023), 2020.
Wohltmann, I., von der Gathen, P., Lehmann, R., Maturilli, M., Deckelmann, H., Manney, G. L., Tarasick, D., Jepsen, N., Kivi, R., Lyall, N., and Rex, M.: Near-Complete Local Reduction of Arctic Stratospheric Ozone by Severe Chemical Loss in Spring 2020, Geophys. Res. Lett., 47, e2020GL089547, https://doi.org/10.1029/2020GL089547, 2020.
Young, P. J., Archibald, A. T., Bowman, K. W., Lamarque, J.-F., Naik, V., Stevenson, D. S., Tilmes, S., Voulgarakis, A., Wild, O., Bergmann, D., Cameron-Smith, P., Cionni, I., Collins, W. J., Dalsøren, S. B., Doherty, R. M., Eyring, V., Faluvegi, G., Horowitz, L. W., Josse, B., Lee, Y. H., MacKenzie, I. A., Nagashima, T., Plummer, D. A., Righi, M., Rumbold, S. T., Skeie, R. B., Shindell, D. T., Strode, S. A., Sudo, K., Szopa, S., and Zeng, G.: Pre-industrial to end 21st century projections of tropospheric ozone from the Atmospheric Chemistry and Climate Model Intercomparison Project (ACCMIP), Atmos. Chem. Phys., 13, 2063–2090, https://doi.org/10.5194/acp-13-2063-2013, 2013.
Zhou, P., Yang, X. Lou, Wang, X. G., Hu, B., Zhang, L., Zhang, W., Si, H.-R., Li, B., Huang, C.-L., Chen, H.-D., Chen, J., Luo, Y., Guo, H., Jiang, R.-D., Liu, M.-Q., Chen, Y., Shen, X.-R., Wang, X., Zheng, X.-S., Zhao, K., Chen, Q.-J, Deng, F., Liu, L.-L., Yan, B., Zhan, F.-X., Wang, Y.-Y., Xiao, G.-F., and Shi, Z.-L.: A pneumonia outbreak associated with a new coronavirus of probable bat origin, Nature, 579, 270–273, https://doi.org/10.1038/s41586-020-2012-7, 2020.
Ziemke, J. R., Kramarova, N. A., Frith, S. M., Huang, L. K., Haffner, D. P., Wargan, K., Lamsal, L. N., Labow, G. J., McPeters, R. D., and Bhartia, P. K.: NASA Satellite Measurements Show Global-Scale Reductions in Free Tropospheric Ozone in 2020 and Again in 2021 During COVID-19, Geophys. Res. Lett., 49, e2022GL098712, https://doi.org/10.1029/2022GL098712, 2022.