the Creative Commons Attribution 4.0 License.
the Creative Commons Attribution 4.0 License.
 | 22 Apr 2025
Protection without poison: why tropical ozone maximizes in the interior of the atmosphere
Aaron Match
Edwin P. Gerber
Stephan Fueglistaler
The number density of ozone, [O3], maximizes around 26 km in the tropics, protecting life from harmful ultraviolet (UV) light without poisoning it at the surface. Textbooks explain this interior maximum with two paradigms: (1) the source-controlled paradigm explains [O3] as maximizing where its source maximizes between abundant photons aloft and abundant [O2] below, and (2) the source sink competition paradigm, inspired by the Chapman cycle, explains ozone as scaling with [O2] and the photolytic source sink ratio. However, each paradigm's prediction for the altitude of peak [O3] is off by 10 km, reflecting their well-known omission of ozone sinks from catalytic cycles and transport. We present a minimal, steady-state theory for the tropical stratospheric [O3] maximum, accurate to within 1 km and formulated in terms of the dominant ozone sinks. These sinks are represented simply by augmenting the Chapman cycle with linear damping of O and O3, leading to the Chapman+2 model. The Chapman+2 model correctly simulates peak tropical [O3] at 26 km, yet this peak is not explained by either paradigm. Instead, the peak is newly explained by the transition from an O-damped regime aloft to an O3-damped regime below. An explicit analytical expression is derived for ozone under gray radiation. This theory accurately predicts an interior maximum of ozone and correctly predicts that an increase in top-of-atmosphere UV light will lead to a downward shift in the peak [O3] due to a downward shift in the regime transition, a result not even qualitatively predicted by the existing paradigms.
- Article
(3835 KB) - Full-text XML
- Companion paper
- BibTeX
- EndNote


Ozone's presence in the stratosphere protects life from harmful ultraviolet (UV) radiation. It was the absence of this high-energy radiation at the surface that enabled Hartley (1881) to deduce the existence of the ozone layer. In addition to protecting life from UV radiation, ozone is a strong oxidizing agent, making it poisonous to lungs and plant tissues. Thus, by maximizing well above the surface, around 26 km in the tropics, the ozone layer provides protection without poison.
This paper seeks to understand the tropical stratospheric maximum of ozone number density, denoted as [O3] (molec. cm−3). The tropical stratospheric peak in [O3] is robust across observational datasets. As an observational benchmark, this paper uses the homogenized satellite dataset SWOOSH (Davis et al., 2016), averaged over the tropics (30° S–30° N) and from 1984 to 2023. In SWOOSH, the monthly tropical [O3] peaks at 26 km, deviating only about 10 % of the time up or down from this altitude by at most one vertical level of roughly 1 km. The tropical stratospheric peak in [O3] is also robust in state-of-the-art chemistry-climate models, which successfully reproduce this interior maximum (e.g., Keeble et al., 2021). However, since these chemistry-climate models include a complex representation of the global atmospheric circulation and hundreds of chemical reactions, the reasons for this emergent structure can be hard to discern. Here, we seek to drastically reduce the apparent complexity by distilling the minimal set of physical and chemical processes required to explain this robust feature of observations and models.
Explaining the interior maximum of tropical ozone is an old problem, and the modern theory for the structure of the ozone layer began almost a century ago when Sydney Chapman demonstrated that the ozone layer is formed via UV photochemistry (Chapman, 1930). Chapman showed how a motionless atmospheric column illuminated by UV light could produce an ozone layer through photochemical cycles of O, O2, and O3. Explaining why ozone has an interior maximum is now a standard part of atmospheric chemistry curricula. We surveyed eight atmospheric radiation and chemistry textbooks that explain why ozone has an interior maximum (Dobson, 1963; Dütsch, 1968; Jacob, 1999; Liou, 2002; McElroy, 2002; Kump et al., 2011; Visconti, 2016; Seinfeld and Pandis, 2016) and found that, when explaining the structure of the ozone layer, all introduce the Chapman cycle, even as most subsequently note its important omissions of catalytic cycles and transport. What has not been previously noted is that, when explaining the interior maximum, textbooks invoke two qualitatively different paradigms, with half of the surveyed textbooks invoking each paradigm.
The first paradigm is the source-controlled paradigm. It asserts that the interior maximum of the tropical [O3] is dictated by the interior maximum of the ozone production rate (molec. cm−3 s−1), where is the photolysis rate of O2 (s−1) and [O2] is the number density of O2 (molec. cm−3). is large aloft but attenuates rapidly towards the surface, whereas [O2] increases exponentially towards the surface, so their product maximizes at a “sweet spot” where there are both enough photons and enough O2 molecules to yield a large [O3] production rate. The sweet spot suggests that the interior maximum of ozone is a fundamental consequence of radiative attenuation through an exponentially distributed absorber (Jacob, 1999), for which the radiative absorption rate (photons cm−3 s−1) maximizes where the optical depth equals 1. A cartoon version of this paradigm is shown in Fig. 1a.

Figure 1Two textbook paradigms for explaining the interior maximum of ozone. (a) In the source-controlled paradigm, ozone scales with its production rate given by the product of the photolysis rate (), which decreases towards the surface, and the number density of [O2], which increases exponentially towards the surface. Their product maximizes at a sweet spot. (b) In the source sink competition paradigm, ozone scales as in the Chapman cycle, with dependence on [O2] and the ratio of photolysis rates of O2 and O3. In the source sink competition paradigm, photolysis of O3 suppresses O3.
The second paradigm is the source sink competition paradigm (Fig. 1b). The source sink competition paradigm uses the precise functional form of ozone derived from the Chapman cycle, where the vertical structure of the ozone layer predominantly scales as . The photolysis rate of O3, , enters explicitly into the denominator of this expression because photolysis of ozone contributes to the sink of ozone in the Chapman cycle by liberating atomic oxygen that can then bond with O3 to destroy it. The source sink competition paradigm suggests that the interior maximum of tropical [O3] arises due to competition between a photolytic source and photolytic sink, playing out within the photochemical context of the Chapman cycle. A cartoon version of the source sink competition paradigm is shown in Fig. 1b.
Given that these paradigms yield different scaling relationships for the vertical structure of the ozone layer, the question arises: is this a theoretically ambiguous case where different paradigms yield a consistent, accurate prediction? This can be tested by evaluating the paradigmatic scalings, which we calculate based on the photolysis rates that result when incoming UV light is attenuated by O2 and observed O3, treating radiative attenuation as described in Sect. 2. The results are shown in Fig. 2. The source-controlled paradigm (blue) predicts [O3] to maximize at 38 km, and the source sink competition paradigm (red) predicts [O3] to maximize at 15 km. Thus, these paradigmatic scalings are neither consistent (they disagree with each other by more than three atmospheric scale heights) nor accurate (they both disagree with observations by more than 10 km).

Figure 2The vertical structure of the tropical ozone layer in observations (black) and from the scalings within the two paradigms (blue and red). Observations of O3 are from homogenized satellite data in the SWOOSH dataset (Davis et al., 2016) averaged from 1984 to 2023 and over the tropics from 30° S to 30° N. The photolysis rates and are calculated based on optical depth radiative transfer with an overhead Sun and absorption by O2 and O3 (using the observed profile) and following the methods in Sect. 2. All the profiles are normalized by their maximum value, whose altitude is starred and labeled.
The roots of these inconsistencies and inaccuracies can be hypothesized based on prior knowledge: these paradigms treat ozone sinks inconsistently and inaccurately, and both are known to neglect the dominant ozone sinks. The source-controlled paradigm neglects any structural contribution from the sink, tantamount to assuming a damping-like sink of the form , with an insignificant vertical structure in . The source sink competition paradigm only accounts for the Chapman cycle sink of ozone from the reaction of O and O3, which is known to be minor in observations. Neglected in these paradigms are the dominant observed sinks of ozone: catalytic cycles and transport (e.g., Bates and Nicolet, 1950; Crutzen, 1970; Brasseur and Solomon, 2005).
We seek a minimal, steady-state theory for the tropical stratospheric [O3] maximum that invokes realistic sinks from catalytic cycles and transport and yields a prediction for the interior maximum of ozone that is accurate to approximately 1 km. To develop a theory that invokes realistic sinks, we bridge the gap between simple theories and comprehensive simulations by augmenting the Chapman cycle with two linear damping reactions that represent the destruction of either O or O3 by catalytic cycles and transport. We call our resulting photochemical system the Chapman+2 model (in which sensitivities were recently analyzed in Match et al., 2024). The damping coefficients of O and O3 must be constrained by the known magnitudes of catalytic cycles and transport.
Whether the damping is primarily of O or O3 turns out to lead to qualitatively different mechanisms for ozone structure, a surprising result given that O and O3 are often treated as conceptually fungible within the chemical family of odd oxygen () (Sect. 2). In the O-damped regime, the destruction of ozone is rate-limited by the availability of atomic oxygen, which must be produced through photolysis of ozone. On its own, the O-damped regime produces an interior maximum at the same altitude as predicted by the source sink competition paradigm. The O3-damped regime produces an interior maximum at the same altitude as predicted by the source-controlled paradigm.
Today's tropical stratosphere occupies each regime at different altitudes, with the transition from an O-damped regime aloft to an O3-damped regime below at 26 km, co-located with the ozone maximum (Sect. 3). Although each paradigm is capable of producing an interior maximum of ozone, neither can successfully explain the observed altitude of the tropical ozone maximum, which is instead best explained by a new mechanism: the regime transition theory (Sect. 4). In the regime transition theory, peak [O3] occurs at an altitude around 26 km, precisely because this marks the transition from an O-damped regime aloft, within which ozone increases towards the surface, to an O3-damped regime below, within which ozone decreases towards the surface. We present an analytical expression for an idealized ozone profile under gray radiative transfer that produces an interior maximum of ozone in a self-consistent regime transition and improves intuition for the response of the Chapman+2 model to changes in UV light (Sect. 6).
A critical evaluation of the ozone maximum requires a model that can quantify the structural effects of ozone sinks arising from the Chapman cycle, catalytic cycles, and transport. We briefly introduce the Chapman cycle, which we then augment with two sinks representing catalytic cycles and transport. The Chapman cycle reactions are
Reactions (R2) and (R4) depend on collisions, where M is a third body whose number density is that of air (na). The collisional reactions proceed as the number density of the chemical reactants multiplied by a rate coefficient ki, i = 2,4. For example, Reaction (R2) has a rate of k2[O][O2][M], which in general depends on temperature. Reactions (R1) and (R3) are photolysis reactions and proceed as the number density of the photolyzed species multiplied by the photolysis rate ( or ). Photolysis rates couple chemistry and radiation together as follows:
with wavelength λ, quantum yield qi(λ) (molecules decomposed per photon absorbed by species i), absorption coefficient σi(λ) (cm2 molec.−1) (shown in Fig. 3b), and UV flux density with respect to wavelength I(z,λ) (photons cm−2 s−1 nm−1). The top-of-atmosphere UV flux (I(∞,λ)) is shown in Fig. 3a. Photolysis attenuates the UV flux:
where τ(z,λ) is the optical depth as a function of wavelength and θ is the solar zenith angle, hereafter taken to be the overhead Sun for simplicity, so cos θ = 1. Because both O2 and O3 absorb UV light, the optical depth at a given altitude depends on the column-integrated O2 and O3 above that level:
with giving the overhead column O2 () and giving the overhead column O3 ().
2.1 The Chapman+2 model reactions
The Chapman cycle neglects the dominant sinks of ozone from catalytic chemistry and transport (Bates and Nicolet, 1950; Crutzen, 1970; Jacob, 1999; Brasseur and Solomon, 2005). These sinks involve photochemical reactions and transport among a system of at least tens of significant constituents. The consequence of the additional sinks of ozone from these processes is that ozone is approximately halved compared to in the Chapman cycle. Thus, calculating accurate photolysis rates, which depend on overhead column ozone, requires an accurate representation of basic-state ozone as it is affected by these sinks. However, while the effects of these sinks are essential, many of their details are not thought to be part of a minimum essential explanation for the interior maximum of ozone. Therefore, we will parameterize the effects of these sinks on O and O3, facilitating a simple and tractable theory with a realistic basic-state ozone profile. These sinks are parameterized by augmenting the Chapman cycle with two linear damping reactions that destroy O and O3, respectively:
Representing these sinks as a linear damping is equivalent to adding an extra sink of O and O3 in the form of a first-order decomposition reaction (analogous to radioactive decay). These sinks represent two pathways for the destruction of odd oxygen: destruction of odd oxygen can scale with atomic oxygen, as in Reaction (R5) that proceeds at the rate κO[O], or it can scale with ozone, as in Reaction (R6) that proceeds at the rate .
These reactions can be incorporated into the Chapman cycle to yield a Chapman+2 model of tropical stratospheric ozone, with the following prognostic equations for O and O3:
When solving for the ozone profile in the Chapman+2 model, there is generally several orders of magnitude more O2 than odd oxygen (), so for simplicity O2 will be treated as external to the Chapman+2 model, with a fixed molar fraction of = 0.21. Under this assumption, it is possible to solve for [O] and [O3] in a steady state by setting = 0 in Eqs. (5) and (6) and solving for this system of two equations in two variables (O and O3):
where the square brackets indicate the number density (molec. cm−3) and na is the number density of the air. This equation is quadratic in [O3] and mathematically implicit in height due to the dependence of and on ozone aloft. Note that appears in the denominator as a photolytic sink of ozone.
An accompanying diagnostic equation for atomic oxygen is as follows:
In the absence of catalytic cycles and transport, i.e., = 0, Eqs. (7) and (8) reduce to the Chapman cycle (e.g., as analyzed in Craig, 1965). However, because the Chapman cycle is known to overestimate O3 by a factor of approximately 2, these damping rates will be crucial for correcting these biases and leading to a realistic basic state. These damping rates will be constrained based on prior knowledge of catalytic cycles and transport.
2.2 Constraining the Chapman+2 damping rates
Neither transport nor catalytic cycles generally act as a linear damping in all parts of the atmosphere or in all photochemical regimes. However, we will argue that the tropical stratosphere is in a regime where they can be fruitfully parameterized as such, facilitating theoretical insight.
Transport does not generally act as a linear damping, and indeed the Brewer–Dobson circulation is known to be a source of ozone in the extratropics (e.g., Dobson, 1956). However, in the tropical lower stratosphere, where transport might in principle be represented as a leaky tropical pipe (Neu and Plumb, 1999) such as in Match and Gerber (2022), its effects can be approximated as a linear damping in order to understand the peak [O3]. This linear damping results because ozone is constantly being upwelled from an ozone-poor region (the tropical tropopause layer) into a region over which it decays with a characteristic scale height (Brasseur and Solomon, 2005; Sect. 3.5.2). Also, because transport is only important for ozone in the tropical lower stratosphere and not farther aloft (e.g., Garcia and Solomon, 1985; Perliski et al., 1989), a fact that will emerge self-consistently in the Chapman+2 model, parameterizing the effects of transport as a constant damping throughout the tropical stratosphere can lead to an accurate representation in the tropical lower stratosphere without imposing significant errors farther aloft. We consider transport to lead to a relaxation rate that scales with = 0.3 mm s−1 divided by a reference vertical scale of approximately 2 km, leading to a damping rate of = (3 months)−1. For consistency, this damping will be applied to O and O3, although it is found to only significantly affect O3 given the short photochemical lifetime of O.
Like transport, catalytic cycles do not generally act as a linear damping. This is because they involve two- and sometimes three-body reactions whose rates depend on the abundance of the catalysts, which are often co-evolving with the overall photochemical state. Thus, in order to treat catalytic destruction of ozone as a linear damping with a steady, altitude-dependent damping rate, we assume that the number density of the catalysts and the temperature-dependent reaction rates are constant. We must then use these constant profiles of damping rates to damp O and O3. In order to determine these damping rate profiles and whether they damp O or O3, we distinguish catalytic cycles driven by some catalyst Z by their net effects, where the representative cycles leading to each net effect are shown in Table 1.
Table 1Representative catalytic cycles with distinct net effects.
The most significant catalysts driving each class of catalytic cycle are as follows (e.g., Brasseur and Solomon, 2005): destruction of 2 O3 is driven by Z = OH, destruction of 2 O is driven by Z = H, and destruction of O + O3 is driven by Z = H, OH, NO, Cl, and Br. In the tropical stratosphere, these latter reactions that destroy O + O3 tend to be rate-limited by the destruction of O. This rate limitation arises because the reaction Z + O3 produces ZO, which is often photolyzed to complete a null cycle, so only if ZO reacts with O does the catalytic cycle ultimately destroy two Ox. Therefore, such cycles are considered to damp odd oxygen at a rate of 2kZO+O[ZO]. The catalytic reaction rates are taken from Brasseur and Solomon (2005).
Combining the effects of transport and catalytic cycles leads to these estimates for the damping rates:
where we refer to the reaction rate coefficients (a5, a7, b3, etc.) in Brasseur and Solomon (2005).
As a link to existing frameworks, the catalytic component of these damping rates can be related to the budget of generalized odd oxygen (Oy), which was defined in Brasseur and Solomon (2005) as including a broader set of chemical constituents that can serve as reservoirs for odd oxygen under stratospheric photochemistry.1 Equations (9) and (10) include all of the dominant sinks of Oy that are linear in O or O3. These damping rates treat the concentrations of catalysts as constant and neglect conversions of generalized odd oxygen between reservoir species, and so they do not provide an exhaustive account of the Oy budget. Nonetheless, they will serve to effectively parameterize the sinks of O and O3.
Profiles for these damping rates κO and are estimated by using globally averaged vertical profiles for the chemical constituents from the chemistry-climate model SOCRATES (Brasseur et al., 1990), as tabulated in Brasseur and Solomon (2005). The damping rates are approximated crudely insofar as catalyst profiles in the tropics are approximated with their global average. The resulting profiles of damping rates are shown in Fig. 3c. These damping rate profiles can be validated against an independent estimate of the photochemical damping timescale from the chemical transport model MOBIDIC (as calculated for the Cariolle v2.9 linear ozone model; Daniel Cariolle, personal communication, 2023; dashed cyan curve in Fig. 3c). These linear ozone model coefficients are closely related to an effective damping rate of odd oxygen, excluding the effects of transport, analogous in our framework to the quantity (solid cyan curve in Fig. 3c). These two cyan curves of the photochemical damping timescale are approximately consistent in magnitude and vertical structure, building confidence in our damping rates.

Figure 3Boundary conditions and solutions to the Chapman cycle and Chapman+2 model for tropical ozone. (a) UV flux at the top of the atmosphere. (b) Absorption coefficients for O2 and O3. (c) Damping rates of O (red) and O3 (blue) estimated from Eqs. (9) and (10) using catalyst profiles from the chemistry-climate model SOCRATES, as tabulated in Brasseur and Solomon (2005). The effective damping rate of Ox (solid cyan) is comparable to the derived O3 relaxation rate in the chemical transport MOBIDIC as calculated in the Cariolle v2.9 linear ozone model (dashed cyan). (d) Ozone profile in numerical solutions to the Chapman cycle. Numerical solutions are compared to satellite-observed ozone from the SWOOSH dataset averaged from 1984 to 2023 and from 30° S to 30° N (black). (e) UV flux for the Chapman+2 experiment and (f) the Chapman cycle experiment , where we indicate the level of the unit optical depth (τ(λ) = 1) in gray. For clarity, the wavelength axes are restricted to 180–320 nm, although the numerical solution extends to 800 nm in the weakly absorbing Chappuis bands. A similar introductory figure appears in Match et al. (2024).
2.3 Evaluating O3 in the Chapman+2 model
Prescribing these damping rates κO and , it is then possible to solve Eqs. (7) and (8) by integrating from the top of the atmosphere downwards and solving jointly for O3 and the UV fluxes at each vertical level. Further details of our numerical approach are in Appendix A.
Figure 3 compares numerical solutions of the Chapman cycle and Chapman+2 model to the observed tropical [O3]. As is well known, the Chapman cycle overestimates ozone by a factor of approximately 2 (Fig. 3d; gray vs. black). These overestimations are significantly mitigated in the Chapman+2 model (Fig. 3d; magenta vs. black). The improved ozone magnitudes in the Chapman+2 model allow UV flux to penetrate more deeply than in the Chapman cycle (Fig. 3e, f), leading to more realistic photolysis rates.
Agreement between the Chapman+2 model and observations is imperfect, which is unsurprising given that this work employs many simplifying approximations. Many of these approximations are required to subsequently derive an explicit analytical expression for the Chapman+2 model ozone profile. For example, we will present results for the overhead Sun impinging on an isothermal atmosphere, although our model can also be run at other solar zenith angles or with vertically varying temperatures. We have also approximated transport and catalytic cycles as a linear damping, used globally averaged catalytic profiles, and neglected optical scattering. Despite these approximations, the Chapman+2 model produces a reasonable fit to the observed profile and a credible interior maximum of ozone. The remainder of the paper seeks to explain why the Chapman+2 model produces an interior maximum.
Understanding how the Chapman+2 model produces an interior maximum is challenging when considering the ozone number density in Eq. (7), so we perform a scale analysis to identify the dominant photochemical-transport regimes at different altitudes. Three limits can be defined based on whether the sink of odd oxygen is dominated by the Chapman cycle sink from the reaction O+O3, the damping of O, or the damping of O3. These limits correspond to different dominant terms in the six-term denominator of Eq. (7).
If the Chapman cycle sink of ozone dominates, then the dominant term in the denominator of Eq. (7) is , and ozone scales as
Equation (11) reproduces the well-known Chapman cycle limit, where the dominant reactions are Reactions (R1)–(R4), as presented in most textbook explanations for the shape of the ozone layer. The vertical structure of the ozone layer in Eq. (11) arises predominantly from the number density of air (assumed to be invariant under Chapman photochemistry) and from the ratio of photolysis rates . The presence of in the denominator indicates that photolysis of O3 is an effective sink of O3 by producing atomic oxygen that can then destroy O3 through Reaction (R4). We refer to this as a photolytic sink. The fact that photolysis of O3 acts as a photolytic sink might seem surprising since it is typically understood to not affect ozone due to the strong null cycle in Reactions (R2) ⇌ (R3). However, that null cycle has some leakage into Reaction (R4). Thus, even though most of the photolysis of ozone does not lead to the destruction of ozone (legitimizing the concept of odd oxygen), most of the destruction of ozone requires photolysis of ozone in order to supply atomic oxygen – hence suppresses ozone as a photolytic sink.
If the damping of O dominates through , the ozone number density scales as
Equation (12) corresponds to the limit where the dominant reactions are Reactions (R1)–(R3) and (R5). The Chapman cycle and O-damped regime (Eqs. 11 and 12) share key structural aspects, as ozone scales as , where in the Chapman cycle regime and n=1 in the O-damped regime. Note that, in both cases, photolysis of O3 appears in the denominator as a photolytic sink that is necessary for producing atomic oxygen that can either react with ozone (in the Chapman cycle) or be damped (in the O-damped regime). Thus, these regimes both derive their structure from a photolytic sink, and both satisfy the source sink competition paradigm.
If the damping of O3 dominates through , the ozone number density scales as
Equation (13) corresponds to the limit where the dominant reactions are Reactions (R1)–(R3) and (R6). In the O3-damped regime, ozone destruction does not depend on photolysis of ozone, which therefore does not appear in the ozone equation. With this sink that is independent of photolysis, ozone scales with the production rate divided by the damping rate of O3, consistent with the source-controlled paradigm. Note that, in this regime, Reaction (R3) can still be faster than the production of odd oxygen from Reaction (R1), but it has a negligible effect on ozone concentrations because, to leading order, it drives the null cycle Reactions (R2) ⇌ (R3); i.e., not only does most photolysis of ozone not lead to destruction of ozone, as is generally the case, but most destruction of ozone does not involve photolysis of ozone, which is not true in the Chapman cycle or O-damped regime.
Thus, the prevailing textbook paradigms for explaining the interior maximum of ozone correspond to well-defined limits of the Chapman+2 model corresponding to either the Chapman cycle regime, the O-damped regime (source sink competition paradigm; Fig. 1b), or the O3-damped regime (source-controlled paradigm; Fig. 1a). Which regime actually prevails is an empirical question. Figure 3c reveals that the damping of O is larger everywhere than the damping of O3, but this does not imply that the ozone layer is in an O-damped regime everywhere because the altitude-dependent partitioning between [O] and [O3] also matters. Determining the O-damped and O3-damped regimes requires evaluation of the dominant terms in the denominator of the catalytic ozone solution (Eq. 7), where the contribution of the Chapman cycle sink scales as , the damping of O scales as , and the damping of O3 scales as .

Figure 4(a) Odd oxygen sink regimes due to catalytic chemistry and transport based on the effective damping rates of O and O3 in the tropics. Above 26 km, the ozone layer is in an O-damped regime (red region). Below 26 km, the ozone layer is in an O3-damped regime (blue region). The Chapman cycle sink does not dominate anywhere. (b) Fraction of κO contributed by each component in Eq. (9). (c) Fraction of contributed by each component in Eq. (10).
The vertical profile of catalytic regimes can be categorized as follows (Fig. 4a):
-
Above 26 km, the stratosphere is dominated by O damping. If the interior maximum of ozone occurred well above 26 km, this would be explained by the source sink competition paradigm.
-
Below 26 km, the stratosphere is dominated by O3 damping. If the interior maximum of ozone occurred well below 26 km, this would be explained by the source-controlled paradigm.
However, the interior maximum of ozone in the Chapman+2 model occurs exactly at this transition at an altitude of 26 km, hinting at the need to consider both regimes.
The damping of O and O3 that establishes each regime can be decomposed further into additive contributions from the terms in Eqs. (9) and (10) (Fig. 4b and c). Throughout the stratosphere of the Chapman+2 model, the damping of O is dominated by NO2 (Fig. 4b, red curve). Towards the stratopause at 50 km, the stratosphere is in an O-damped regime, but our model overestimates the NOx sink and therefore fails to correctly identify that the HOx sink should dominate at these altitudes (as in, e.g., Brasseur and Solomon, 2005). Lower in the stratosphere, near the peak [O3], the Chapman+2 model correctly captures the dominance of the NOx sink, where the damping rate of O can be accurately approximated as κO≈2 b3[NO2]. The damping of O3 is dominated by H in the upper stratosphere, by OH lower down around 40 km, and by transport below 35 km. The dominance of transport in the lower stratosphere means that, in the O3-damped regime below 26 km, (Fig. 4c, black curve). Thus, the odd oxygen sink regimes can be interpreted as transitioning from an O-damped regime dominated by NOx above 26 km to an O3-damped regime dominated by transport below 26 km.
In the Introduction section, we showed that the interior maximum of the observed tropical [O3] could not be reproduced by the scaling relationships from either the source-controlled paradigm or the source sink competition paradigm. Now equipped with the Chapman+2 model and scaling relationships for ozone in each sink regime, we reaffirm that the interior maximum cannot be explained by either paradigm.
Figure 5 shows the observed [O3] profile (black) compared to ozone in the Chapman+2 model (magenta) and its limits in the O-damped regime (solid red) and O3-damped regime (solid blue). Above 26 km, [O3] closely follows the scaling from the O-damped regime (solid red). Below 26 km, [O3] closely follows the scaling from the O3-damped regime (solid blue). To examine where each regime predicts peak [O3], these theoretical scalings can be artificially extended beyond where they formally apply (dashed curves). When the O-damped regime is extended downwards (red dashed curve), it predicts an interior maximum at 15 km, far below the ozone maximum and its range of applicability. When the O3-damped regime is extended upwards (blue dashed curve), it predicts an interior maximum at 35 km, far above the ozone maximum and its range of applicability. These predictions for peak [O3] are similar to those shown in Fig. 2, except now they are formulated as quantitative limits of the Chapman+2 model, they use self-consistent photolysis rates as part of the Chapman+2 model solution, and they include (modest) altitude-dependent contributions from κO and . Figure 2 first suggested limitations of the prevailing paradigms, and Fig. 5 confirms that these limitations verge on being paradoxical: each textbook paradigm is capable of producing an interior maximum, but these maxima occur at the wrong altitude and in a region where they do not apply.

Figure 5The Chapman+2 model (magenta) compared to the observed tropical O3 from SWOOSH averaged from 1984 to 2023 and from 30° S to 30° N (black). Above 26 km, ozone follows the theoretical scaling for the O-damped regime (solid red curve). From 26 km down to the troposphere, ozone follows the theoretical scaling of the O3-damped regime (solid blue curve). Extending the theoretical scalings across the whole domain (dashed curves) reveals the apparent paradox that each scaling predicts ozone to maximize outside its region of applicability. This is resolved by the regime transition theory: ozone maximizes at the transition from an O-damped regime aloft to an O3-damped regime below.
We propose a new theory for the interior maximum: tropical [O3] peaks around 26 km because this marks the transition from an O-damped regime aloft, within which [O3] increases towards the surface, to an O3-damped regime below, within which [O3] decreases towards the surface. The regime transition theory is illustrated in Fig. 6.

Figure 6The source-controlled paradigm (right) predicts a peak [O3] that is too high and where it is inapplicable. The source sink competition paradigm predicts a peak [O3] that is too low and where it is inapplicable. The regime transition theory (center) explains that [O3] peaks at the transition between these two regimes.
Although it has not previously been invoked to explain peak [O3], it is well known that there is a regime transition in ozone photochemistry between 25 and 30 km from a photochemically-dominated regime aloft to a transport-dominated regime below (Garcia and Solomon, 1985; Perliski et al., 1989; Brasseur and Jacob, 2017). This regime transition has been fruitfully interpreted in terms of the equilibration timescale for odd oxygen. Aloft, odd oxygen equilibrates very rapidly with respect to photochemistry, quickly erasing any anomalies induced by the transport of odd oxygen. This equilibration timescale becomes more sluggish towards lower altitudes, where transport is then able to generate anomalies from photochemical equilibrium. This transition is closely analogous to the transition considered herein from an O-damped regime to an O3-damped regime. In order to understand either regime transition, the question becomes “why does the photochemical timescale become longer than the transport timescale below some altitude?” or, relatedly, “why does the O damping become weaker than the O3 damping?”.
This question can be answered by assessing the contributions to the structure of O damping versus that of O3 damping. Using the terms from the denominator of Eq. (7), we define γO as a non-dimensional ratio measuring the strength of O damping compared to O3 damping, defined as follows:
Under realistic conditions under which the ozone layer is either O-damped or O3-damped, i.e., where the Chapman cycle sink does not dominate, then, when γO > 1 the ozone layer is O-damped and when γO < 1 the ozone layer is O3-damped. The magnitude of γO generally declines from the upper stratosphere downward, and where it crosses below 1 is, by construction, the regime transition.
The terms that contribute most to the vertical structure of γO are plotted in Fig. 7. The dominant driver of the regime transition is the rise in air density towards lower altitudes. Higher air density contributes to the regime transition by speeding up Reaction (R2), thereby partitioning odd oxygen away from O and in favor of O3. Partitioning odd oxygen away from O reduces the magnitude of O damping (which scales as κO[O]) and strengthens O3 damping (which scales as ). The effects of the rising air density are quadratic because this partitioning scales with [O2] and [M], both of which are proportional to air density. There are also two smaller but still significant drivers of the regime transition. The decline in the photolysis rate of O3 towards lower altitudes helps drive the regime transition by repartitioning odd oxygen towards O3 and away from O, favoring O3 damping at the expense of O damping. The decline in κO from 35 km down to 26 km also favors the regime transition, reflecting the fact that [NO2] peaks at 35 km.
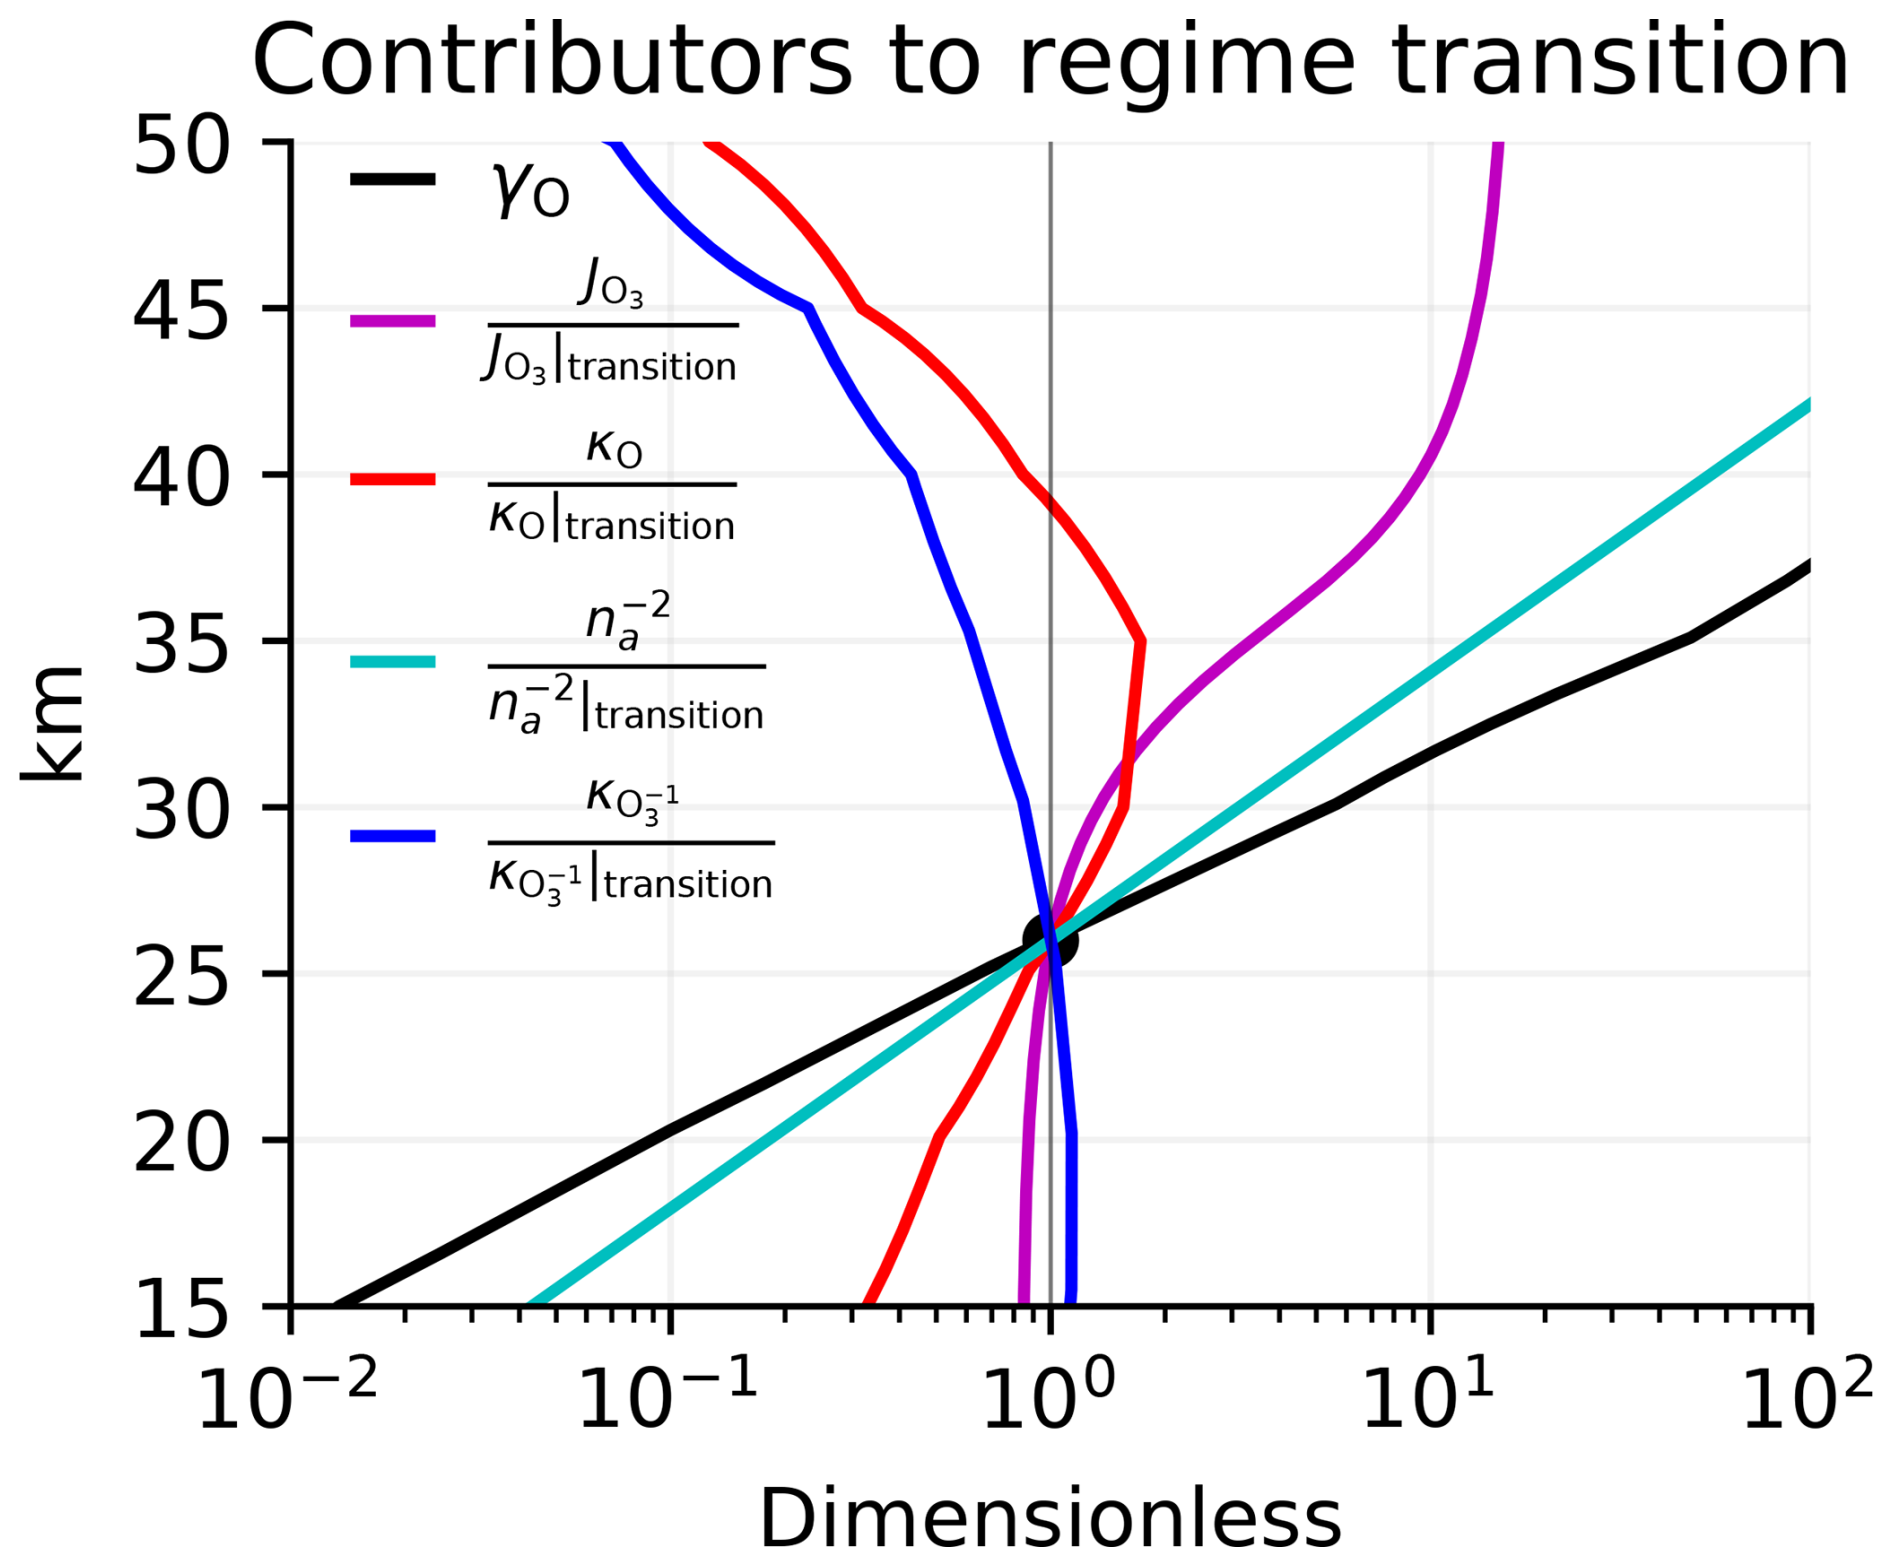
Figure 7Multiplicative factors contributing to the vertical structure of γO in the tropics (defined in the text and plotted in black) relative to where γO reaches unity at 26 km and therefore defines the regime transition. Factors that decrease from above 26 km to below 26 km drive the regime transition, so the dominant driver is air density (cyan). Smaller contributions come from the photolysis rates of O3 (magenta) and the damping rate of O (red). Modestly opposing the regime transition is the damping rate of O3 (blue).
The decline in towards lower altitudes modestly opposes the regime transition. Because we have assumed that the damping from transport is uniform, this decline must result from catalytic sinks, primarily the drop-off in [OH] and [H].
Thus, there is a transition from an O-damped regime aloft to an O3-damped regime below, primarily because, descending towards the ozone maximum, the atmosphere tends to repartition odd oxygen away from O and towards O3. This repartitioning inhibits damping of O and invigorates damping of O3, which eventually dominates. This repartitioning occurs primarily due to increasing air density but also due to attenuation of UV that photolyzes O3.
The regime transition theory suggests a two-regime conceptual model for tropical stratospheric ozone: ozone increases towards its interior maximum in an O-damped regime before reaching a transition altitude at which it maximizes, below which it decreases towards the tropopause in an O3-damped regime. Conceiving of the ozone layer in terms of an O-damped regime, a transition altitude, and an O3-damped regime can improve the conceptual understanding of its basic state and its sensitivity to perturbations. In this section, we focus on the basic state by showing that this conceptual understanding can be encoded in an explicit analytical expression for the ozone profile that produces an interior maximum at the regime transition. Then, in the following section, we will consider the sensitivity to perturbations.
We preface our derivation of an explicit expression for the profile of ozone under idealized boundary conditions by first noting that there are no previously published mathematically explicit expressions for the ozone profile under any set of assumptions, let alone those that would produce an interior maximum at a regime transition. This is due to two key obstacles: (1) ozone photochemistry is mathematically implicit, and (2) it relies on spectral integrals across non-analytical functions. The obstacle arising from spectral integrals across non-analytical functions is generic to radiative transfer problems. However, recent work has advanced understanding of the emergent effects of longwave radiative transfer by judiciously approximating non-analytical absorption spectra for CO2 or H2O with analytical functions, leading to simple spectral models (SSMs, following Jeevanjee and Fueglistaler, 2020) that can then be coupled to other aspects of climate dynamics (Jeevanjee and Fueglistaler, 2020; Jeevanjee et al., 2021; Pierrehumbert, 2011; Romps et al., 2022). Here, we develop simple spectral models for ozone photochemistry, where at certain limits the UV radiative transfer becomes mathematically explicit. Under these and other approximations, mathematically explicit ozone profiles can be derived under the regime transition theory (this section) for the source sink competition paradigm (Appendix B) and the source-controlled paradigm (Appendix C).
In each derivation, we begin by assuming gray radiation with uniform and fully overlapping absorption by O2 and O3 across a spectral window μ (nm) with absorption coefficients and . We also assume an overhead Sun, an isothermal atmosphere, uniform κO and , and unit quantum yields ().
6.1 Upper branch in an O-damped regime
To solve for an ozone profile under the regime transition theory, we must solve from the top down, beginning in the O-damped regime. Under gray radiation, the photolysis rates can be expressed implicitly as a function of ozone by substituting into Eqs. (1) and (2):
The photolysis rates depend on column ozone, so it would seem that the ozone profile should depend implicitly on ozone aloft. However, the O-damped regime is in a photolytic sink regime where ozone scales with the ratio , which under gray radiation reduces to the ratio of the absorption coefficients . This leads to an explicit solution for ozone in the O-damped regime (Eq. 12):
The only altitude dependence is that [O3] scales with . Thus, absent a transition to an O3-damped regime, the O-damped ozone layer would increase all the way down and have no interior maximum. Equation (17) can be integrated to yield the column ozone:
This expression for the column ozone under gray radiation and O damping can then be substituted back into the photolysis rates to solve explicitly for (Eq. 15) and (Eq. 16).
This derivation reveals a more general result, which is that [O3] does not have an interior maximum within a photolytic sink regime under gray radiation. This applies to both the O-damped regime and the Chapman cycle. In order to be correct, explanations for the interior maximum of [O3] within the Chapman cycle must invoke the spectral structure of absorption coefficients. To see how the spectral structure of absorption coefficients can lead to an interior maximum of ozone within the Chapman cycle or the O-damped limit, we present a two-band simple spectral model that supports an analytical expression for an interior maximum of ozone in the source sink competition paradigm in Appendix B.
6.2 Regime transition and peak [O3]
The O-damped regime continues downwards until it reaches a regime transition, which must be self-consistently calculated to occur where the dampings of O and O3 are exactly co-dominant, i.e., where the non-dimensional parameter γO defined in Eq. (14) equals unity. For Earth-like parameters, the regime transition also corresponds to the peak [O3]. To solve analytically for the regime transition, it must be assumed (realistically) that the dominant absorber of UV is ozone. Under that assumption and using the column ozone scaling for the O-damped regime, the ozone photolysis rate scales as follows:
Substituting this expression for the photolysis rate of ozone into the transition condition γO = 1 and solving for z yields the transition altitude:
where W is the Lambert W function, which when evaluated at x returns the value w such that wexp (w)=x, and we have defined the following three non-dimensional parameters for use in interpreting the transition altitude scaling:
The first non-dimensional parameter, αO, measures the strength of O damping compared to the rate at which atomic oxygen combines with O2 to form O3 (Reaction R2). The second non-dimensional parameter, , measures the strength of O3 damping compared to the photolysis rate of O3 at the top of the atmosphere (Reaction R3). The third non-dimensional parameter is the optical depth of O2 at the surface.
Substituting the expression for zt into the scaling for ozone in the O-damped regime (Eq. 17) yields an analytical expression for ozone at the transition altitude:
This is an explicit analytical expression for [O3] at the transition altitude, which for realistic parameters is also the peak [O3]. Below the regime transition, the ozone profile shifts to the O3-damped regime.
6.3 Lower branch in an O3-damped regime
To solve for the lower branch of the[O3] profile, we take advantage of the continuity of the UV flux across the regime transition. Thus, our approach considers an O3-damped region below zt with a constant .
In the O3-damped regime, ozone scales with its production rate, and we solve for by substituting the expression for O3 in the O3-damped regime (Eq. 13) into the column ozone integral:
Taking the natural logarithm of both sides of Eq. (25) and differentiating with respect to z leads to a differential equation for as a function of z:
This first-order nonlinear ordinary differential equation can be solved by separation of variables and integrated from the transition altitude zt downwards using the following boundary condition:
which leads to an equation for :
This expression for can be substituted into the equation for [O3] under O3 damping to yield the ozone profile.
In Appendix C, we present an analytical solution to the ozone layer under gray radiation and strong damping such that zt can be approximated as the top of the atmosphere. In the limit of large , this solution reproduces the sweet spot explanation for the ozone layer in the source-controlled paradigm.
6.4 Putting the pieces together
In summary, ozone in the upper branch is in an O-damped regime (Eq. 17) down to the altitude of the regime transition zt (Eq. 20), below which ozone is in an O3-damped regime (inferred from Eq. 28). Putting the pieces of these regimes together yields an explicit analytical profile of ozone in the Chapman+2 model under gray radiation:
where we used the non-dimensional parameters defined in Eqs. (21)–(23). The UV flux is continuous across the transition altitude, but ozone is not necessarily continuous across zt. Note that the [O3] at zt is consistent between the O-damped regime (first line of Eq. 29) and the explicit solution at zt (second line of Eq. 29).
Figure 8 shows successive approximations to the ozone profile, beginning with the full Chapman+2 model solution and ending with the analytical solution with constant damping rates and gray radiation. The assumptions that move the system towards its analytical solution can be seen to degrade the solution at each step. However, even the analytical profile retains a realistic structure, with its details notably dependent on parameters selected both for their plausibility and their post hoc agreement with the observed profile. Rather than the details of the fit, the advantage of the gray solution is that it is the first simple spectral model of ozone that affords an explicit solution to an ozone profile with an interior maximum. It provides a quantitative framework for considering the response to perturbations, as briefly considered next in the Discussion section.

Figure 8Beginning with observations compared to the full Chapman+2 model calculation with altitude-dependent κO and and spectrally varying radiative transfer, we make successive approximations in our numerical solutions until we reach the analytical solution from Eq. (29) with s−1 and = (3 months)−1 as well as gray radiation with cm2 molec.−1 and cm2 molec.−1.
7.1 Understanding the response to perturbations: the case of doubling UV light
Distinguishing between competing theories for the same phenomenon can be justified, in part, if those theories make different predictions for the response to perturbations. This is the case for the two textbook paradigms and our new theory. It is illustrated by considering the ozone response to a spectrally uniform doubling of top-of-atmosphere UV flux (holding κO, , and temperature fixed so as to consider only the consequences of the changes in and ).
The benchmark response to doubling of UV light in the Chapman+2 model is shown in Fig. 9d. Doubling UV light leads to minimal changes in [O3] in the O-damped regime. The regime transition shifts downwards, such that peak [O3] increases and [O3] also increases throughout the O3-damped regime. The textbook paradigms and our regime transition theory make qualitatively different predictions for this response.

Figure 9Response of the tropical [O3] to the doubling of UV light at the top of the atmosphere, which perturbs photolysis rates while holding all else fixed (e.g., temperature or catalyst concentrations). (a–c) Qualitative response in each conceptual framework (described in the main text) compared to a quantitative benchmark of (d) the Chapman+2 model. Only the regime transition theory correctly predicts that peak [O3] (circles) will shift downwards in altitude and become larger in amplitude.
If the ozone layer were thought to be explained by the source sink competition paradigm, then doubling UV light would be predicted to cause no change in odd oxygen (which is dominated by O3) (Fig. 9a), because it rescales the photolysis of O2 and O3 by the same factor, preserving .
If the ozone layer were thought to be explained by the source-controlled paradigm, then doubling UV light would be predicted to increase [O3] due to the increased source. The increased [O3] aloft would then absorb some of the doubled UV light, attenuating the UV perturbation towards the surface. This damping of the UV perturbation is a manifestation of photochemical stabilization, which is analyzed in depth in Match et al. (2024). Because of this photochemical stabilization, the steady-state [O3] response is predicted to be top-heavy, and the peak [O3] shifts upwards and increases in magnitude.
If the ozone layer is explained by the regime transition theory, as we have argued, then doubling UV light leads to a response that combines aspects of both paradigms. In the O-damped regime aloft, odd oxygen (which is dominated by ozone) does not change because the UV perturbation increases and by the same factor, preserving their ratio. The increase in repartitions odd oxygen in favor of [O], which strengthens the O damping and shifts the regime transition downwards. Because the O-damped regime extends farther down, ozone has more depth over which to increase towards its peak, which correspondingly shifts downwards in altitude and increases in magnitude. Below the regime transition, in the O3-damped regime, the enhanced UV light (from the doubling) drives a top-heavy increase in ozone. Thus, the regime transition theory is the only theory to correctly explain why the peak [O3] shifts downwards and increases in magnitude.
7.2 The Chapman cycle predicts the correct altitude of peak [O3] for the wrong reason
When the scaling for ozone structure from the Chapman cycle of is calculated from photolysis rates based on observed ozone, peak [O3] is predicted to occur at 15 km (Fig. 2), which is biased far too low. However, when the Chapman cycle is calculated with photolysis rates based on its own ozone profile, it predicts an interior maximum of 24 km, quite close to the observed maximum (Fig. 3d). The success of the Chapman cycle in predicting the altitude of peak [O3] underpins its reputation as the foundational model of ozone photochemistry, despite its known omission of dominant sinks. However, by comparing these two predictions, it is clear that underestimated sinks in the Chapman cycle sink cause it to overestimate ozone (by a factor of approximately 2), with the consequent biases in the photolysis rates leading it to predict the correct altitude of peak [O3] for the wrong reason.
This paper revisited the classic question of why tropical [O3] has an interior maximum in the stratosphere around 26 km. Previous explanations in textbooks were categorized into two paradigms, each yielding a quantitative scaling for the structure of the ozone layer in terms of photolysis rates and [O2]. Each paradigm omits the dominant sinks of ozone in its own way and, when tested quantitatively, predicts interior maxima of [O3] that are off by 10 km in either direction (Fig. 2).
Seeking a theory of the interior maximum that is accurate to within roughly 1 km, this paper analyzed the tropical stratospheric regime of photochemistry and transport by augmenting the Chapman cycle with linear damping of O and O3 to represent sinks from catalytic cycles and transport. From this Chapman+2 model, the textbook paradigms emerge as well-defined limits in an O-damped regime or O3-damped regime. However, as before, neither regime explains the interior maximum on its own. Instead, a new theory is offered: the interior maximum of tropical stratospheric [O3] occurs at the transition from an O-damped regime aloft to an O3-damped regime below.
This regime transition is closely related to the well-known transition from a photochemically-dominated regime aloft to a transport-dominated regime below (e.g., Garcia and Solomon, 1985; Perliski et al., 1989). Here, we interpreted this regime transition in terms of competition between O damping and O3 damping, although it has been relatedly interpreted in terms of competition between photochemistry and transport. The regime transition emerges primarily due to increasing air density and attenuation of UV light towards the surface, both of which repartition odd oxygen away from O and in favor of O3. The fact that peak [O3] occurs at the regime transition has not been noted previously or contextualized within a causal framework.
Under gray radiation (and other assumptions), the regime transition theory can be used to derive an analytical solution for the ozone profile (Sect. 6). Accompanying this analytical solution is an interpretive framework in which the ozone layer is conceived to begin aloft in an O-damped regime, where ozone increases towards the surface and scales as before transitioning to an O3-damped regime below in which ozone decreases towards the surface and scales as .
The value of a theory lies in its ability to correctly predict the response to perturbations. As shown in Sect. 7, the standard textbook explanations fail to even qualitatively predict the response of the ozone layer to changes in the incoming UV radiation. This is because perturbations can have distinct effects on the O-damped regime, the O3-damped regime, and the transition between them. In the case of doubling UV light, the regime transition shifts downwards, causing the peak [O3] to shift downwards and increase in magnitude. The regime transition theory could be useful for interpreting the ozone response to other perturbations.
We implement a numerical solution to the Chapman cycle by solving Eq. (7) iteratively from the top of the atmosphere downwards. At any given level, we first solve for the UV flux reaching that level, which constrains the photolysis rates and . These photolysis rates are then used to solve for O3 (Eq. 7), which (along with O2) constrains the UV flux reaching the level below. We consider the case of an overhead Sun. We consider damping by prescribed κO and , but, except as possibly accounted for by those damping rates, we do not explicitly account for advection, tropospheric chemistry, scattering, clouds, or surface reflection.
The vertical dimension is discretized into vertical levels (Δz = 100 m) ranging from the surface to 100 km. The idealized shortwave radiative transfer and photolysis rates are solved on a wavelength grid with 621 discretized wavelengths ranging from 180 to 800 nm, extending into the Chappuis bands of weak absorption. Simulated absorption in the weakly absorbing Chappuis bands (λ > 400 nm) is approximately molec. cm−3 s−1, consistent with that reported by Nicolet (1980). Spectrally resolved parameters are linearly interpolated to the wavelength grid. Top-of-atmosphere UV flux is calculated from the Solar Spectral Irradiance Climate Data Record (Coddington et al., 2015), based on the Naval Research Laboratory model for spectral and total irradiance and averaged over its full record from 1610 to 2020 (Fig. 3a). Our absorptions for O2 and O3 are taken from Burkholder et al. (2019), where as per their recommendation we use Kockarts (1976) for (Fig. 3b). The isothermal atmosphere has a default temperature of 240 K and a scale height of 7 km. The temperature-dependent parameters for the reaction rates are taken from Brasseur and Solomon (2005).
The interior maximum of ozone in the Chapman cycle is of theoretical and historical significance (Chapman, 1930), yet clarity can still be gained as to how exactly this interior maximum comes about. The Chapman cycle leads to an interior maximum explained by the source sink competition paradigm and is in a photolytic sink regime. We clarify the role of structure in the absorption coefficients in leading to this interior maximum by using two highly idealized SSMs (terminology following Jeevanjee and Fueglistaler, 2020), for which we replace the O2 and O3 absorption spectra with simple analytical functions. Once these analytical functions are embedded in the photochemical system, we elucidate how the interior maximum of the ozone layer emerges from spectral absorption features.
B1 No interior maximum under gray radiation
The Chapman cycle can be solved explicitly in the limit of gray radiative transfer, just as in the case of the O-damped regime (Sect. 6.1), which also occupies a photolytic sink regime. Under gray radiation, reduces to , yielding an explicit ozone profile:
This explicit ozone profile can be integrated to yield a column ozone:
This expression for column ozone can be substituted into explicit expressions for the photolysis rates ( and ). The resulting gray Chapman cycle solutions are shown in Fig. B1a–c. Because the production rate of ozone maximizes at a sweet spot in the interior of the atmosphere but [O3] maximizes at the surface, the Chapman cycle does not generally obey the source-controlled paradigm. The production rate of ozone () maximizes at even as [O3] maximizes at the surface. In the source sink competition paradigm, ozone can maximize arbitrarily far below the peak in its production rate. Lifting the ozone maximum into the interior of the atmosphere in the source sink competition paradigm requires spectral structure.
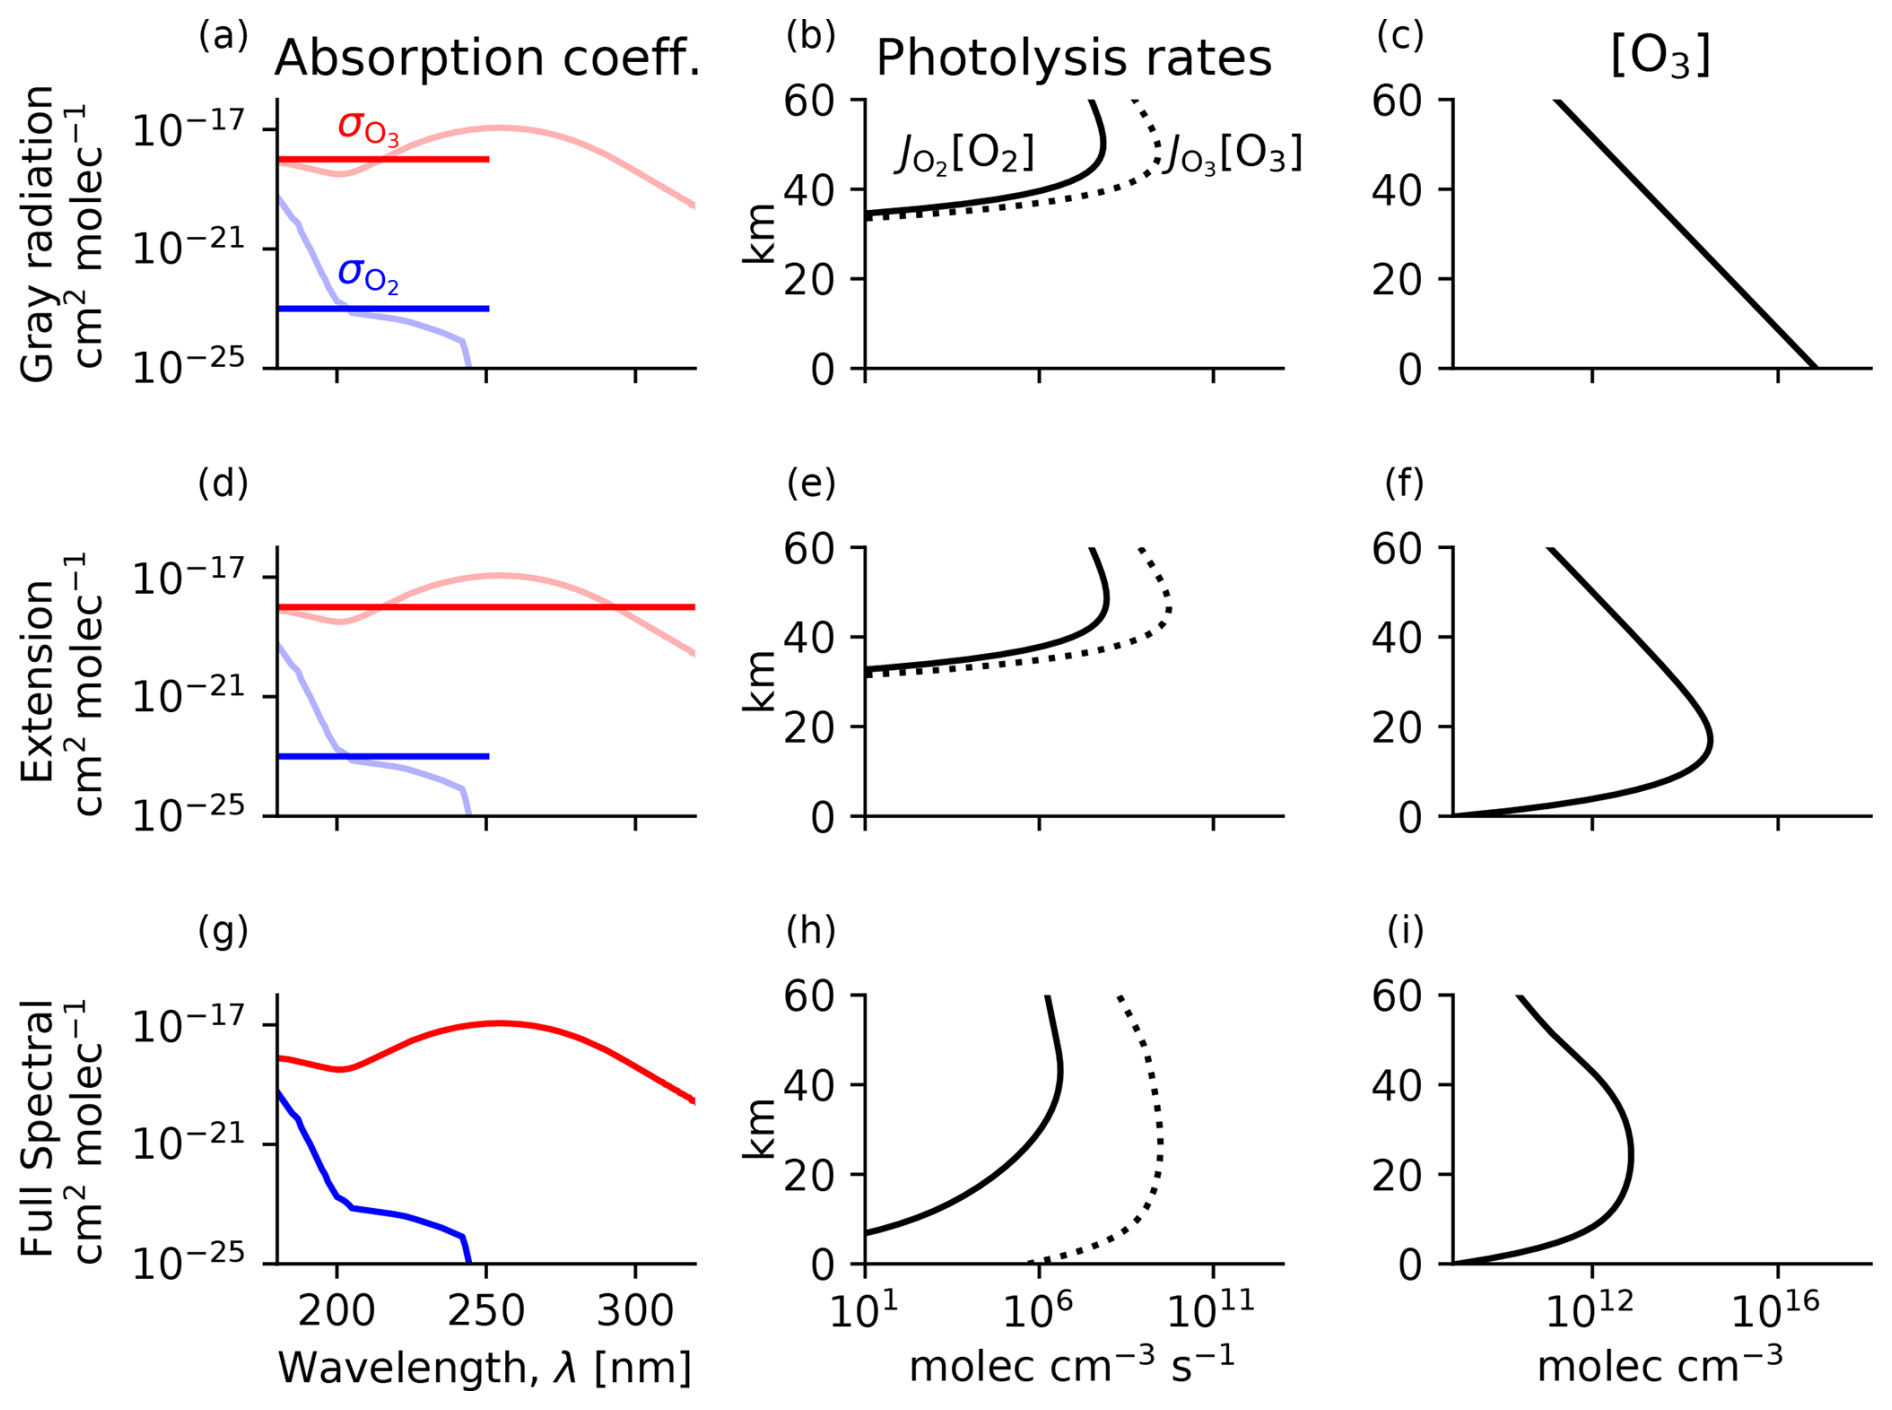
Figure B1Chapman cycle photochemical equilibrium in simple spectral models of the tropical ozone layer (a–f) and the full spectral model (g–i). (a, d, g) Absorption coefficients in each model (solid) compared to in reality (transparent). (b, e, h) O2 and O3 photolysis rates. (c, f, i) Ozone number density.
B2 A two-band model for peak [O]3 in the Chapman cycle
Spectral structure can be incorporated with minimal complexity into our simple spectral model by adding an extra window of UV radiation, making this a two-band model. The added spectral structure is the extension window of ozone absorption at higher wavelengths. The extension window results because O3 can be photolyzed by photons up to 1080 nm, whereas O2 can only be photolyzed up to 240 nm. This reflects the weaker bonds of O3 compared to O2. Thus, below 240 nm there is absorption by both O2 and O3 in an overlap window, whereas beyond 240 nm there is only absorption by O3 in the extension window.
We represent the extension window by extending O3 absorption to longer wavelengths where it no longer overlaps with O2 (Fig. B1d). Here, we assume that O3 has the same absorption coefficient in the overlap and extension window and that these two windows have an equal wavelength width. This additional absorption increases the photolysis rate of O3:
The second term on the right-hand side of Eq. (B4) is the additional photolysis in the extension window. Although has the same functional form as in the gray case, note that it will not take the same values because must refer to a self-consistent overhead column ozone profile. Plugging and into Eq. (11), the implicit terms again cancel out, leading to an explicit solution for ozone:
This is an explicit expression for an ozone profile with an interior maximum in the Chapman cycle using the two-band SSM. The solution depends on the overhead column O2 (assumed to be invariant). While the gray SSM had a constant with height, the extension SSM has decreasing towards the surface. In the limit where , the maximum number density of ozone occurs at = 3. For the parameters in Fig. B1f, this maximum occurs at 17 km. The altitude of peak [O3] depends only on O2 optical depth because, with a constant , absorption by O2 is what causes the photolytic source to attenuate more quickly than the photolytic sink.
Conceptually, in the source sink competition paradigm, ozone maximizes in the interior of the atmosphere due to competition between the exponentially increasing air density towards the surface and the declining ratio of the photolytic source to the photolytic sink (). The extension SSM reveals that the photolysis rate of O2 is attenuated more quickly than the photolysis rate of O3 due to the joint structure of the O2 and O3 absorption coefficients, which have a region of overlapping absorption that both produces and destroys ozone and a region of extended ozone absorption that only destroys ozone. Once the overlap window saturates with O2, its contribution to both the ozone source and sink begins to decline rapidly. Because the overlap window accounts for all of the source but only part of the sink, the sink being buttressed by contributions from the extension window, the source decreases relative to the sink.
The results from the extension SSM suggest that the interior maximum in the photolytic sink regime is explained by the source sink competition paradigm. These insights backstop previous explanations of ozone structure within the source sink competition paradigm. For example, Dütsch (1968) wrote (with adapted notation) that “The formation of a layer of maximum ozone content arises from the fact that below about 35 km the dissociation rate of molecular oxygen () drops off much more rapidly than that of ozone (), mainly because of the overlap of ozone and oxygen absorption around 210 nm”. McElroy (2002) wrote that O3 “is small at low altitudes, reflecting the comparative absence [emphasis added] of radiation with wavelengths sufficiently short to effect dissociation of O2”. “Comparative” refers to the difference between the ozone production and destruction. Although these explanations are cogent examples of the source sink competition paradigm, we reiterate that the peak [O3] is actually not explained by the Chapman cycle or its associated source sink competition paradigm but rather by the regime transition theory (Sect. 4).
In Sect. 6.3, we derived the ozone profile in the O3-damped regime below some transition altitude zt at which was known. Here, we derive an ozone profile for an atmosphere assumed to be everywhere in an O3-damped regime, whose structure is therefore explained by the source-controlled paradigm. Our derivation can be generalized from that in Sect. 6.3 by taking zt towards ∞ and substituting as dictated by the top-of-atmosphere UV flux, i.e., . This yields the following expression for ozone:
where the non-dimensional parameters and were defined by Eqs. (22) and (23). The values of must be restricted by the assumption that damping is strong enough to lead to an O3-damped regime, which rules out values of below a certain threshold that can be verified post hoc for a given solution.
By differentiating Eq. (C1), the ozone maximum can be found to be located at the following optical depth with respect to O2:
Equation (C2) reveals that, when damping is very strong, in the limit of going to ∞, the interior maximum of ozone is at = 1, i.e., at the sweet spot calculated from O2 absorption. This limit corresponds to the limit of vanishing ozone, in which O2 is the dominant absorber of UV light. This recovers a textbook problem on the shape of the ozone layer from Jacob (1999) (Chap. 10), which neglects absorption by O3. However, as damping weakens to the point where O3 increases enough to become the dominant absorber while still ensuring that the damping is strong enough to be in the O3-damped regime, absorption by ozone suppresses the production rate at lower altitudes and shifts the interior maximum in ozone production (and ozone itself) towards higher altitudes.

Figure C1Altitude of peak tropical [O3] under gray radiation with absorption by O2 and O3 and varying damping that modulates the non-dimensional O3-damping parameter . We compare numerical simulations (black) with analytical theory (red; Eq. C2). The theory reproduces the strongly damped limit where peak [O3] occurs at = 1. As damping is weakened, absorption by ozone aloft weakens the ozone source below and shifts the peak [O3] upwards. As damping is weakened further, the theoretical assumption of a non-photolytic sink regime breaks down as the Chapman cycle sink becomes important aloft, degrading the applicability of the strongly damped theory.
Figure C1 shows how the theoretical scaling compares with numerical solutions to the Chapman cycle under gray radiation with O3 damping. The theoretical scaling correctly captures the fact that, for strong damping, the ozone maximum approaches = 1, which is the gray O2-only limit. As damping is reduced, the theoretical scaling correctly captures the fact that the interior maximum shifts upwards as absorption by ozone aloft reduces the ozone production rate at lower altitudes. However, further reductions in damping lead to the violation of the underlying assumptions of the theoretical scaling, i.e., that ozone is everywhere in the O3-damped regime. Instead, the Chapman cycle sink of ozone can dominate in the upper atmosphere, leading to a photolytic sink regime aloft that is unaccounted for by this theory. Thus, the theory performs well in its range of applicability but does not explain the observed ozone maximum on Earth.
The Chapman+2 photochemical-transport model described in Sect. 2 is published on Zenodo at https://doi.org/10.5281/zenodo.13412268 (Match, 2024) .
AM and EPG acquired the funding. AM, EPG, and SF conceptualized the research. AM performed the formal analysis. AM wrote the original draft. EPG and SF reviewed and edited the paper.
The contact author has declared that none of the authors has any competing interests.
Publisher's note: Copernicus Publications remains neutral with regard to jurisdictional claims made in the text, published maps, institutional affiliations, or any other geographical representation in this paper. While Copernicus Publications makes every effort to include appropriate place names, the final responsibility lies with the authors.
The authors thank the editor Jens-Uwe Grooß, the reviewer Kris Wargan, and one anonymous reviewer for their valuable feedback. We also thank Daniel Cariolle for sharing the latest version (v2.9) of his linear ozone model. Aaron Match acknowledges constructive discussions with Benjamin Schaffer, Nadir Jeevanjee, and Nathaniel Tarshish at the Princeton Center for Theoretical Science workshop “From Spectroscopy to Climate”.
This research has been supported by the Directorate for Geosciences (grant no. 2120717), the Office of Advanced Cyberinfrastructure (grant no. OAC-2004572), and Schmidt Futures (Virtual Earth System Research Institute, VESRI).
This paper was edited by Jens-Uwe Grooß and reviewed by Kris Wargan and one anonymous referee.
Bates, D. R. and Nicolet, M.: The Photochemistry of Atmospheric Water Vapor, J. Geophys. Res., 55, 301–327, https://doi.org/10.1029/JZ055i003p00301, 1950. a, b
Brasseur, G., Hitchman, M. H., Walters, S., Dymek, M., Falise, E., and Pirre, M.: An Interactive Chemical Dynamical Radiative Two-Dimensional Model of the Middle Atmosphere, J. Geophys. Res.-Atmos., 95, 5639–5655, https://doi.org/10.1029/JD095iD05p05639, 1990. a
Brasseur, G. P. and Jacob, D. J.: Modeling of Atmospheric Chemistry, Cambridge University Press, 1–606, https://doi.org/10.1017/9781316544754, 2017. a
Brasseur, G. P. and Solomon, S.: Aeronomy of the Middle Atmosphere: Chemistry and Physics of the Stratosphere and Mesosphere, Springer, Dordrecht, Netherlands, https://doi.org/10.1007/1-4020-3824-0, 2005. a, b, c, d, e, f, g, h, i, j, k
Burkholder, J. B., Sander, S. P., Abbatt, J., Barker, J. R., Cappa, C., Crounse, J. D., Dibble, T. S., Huie, R. E., Kolb, C. E., Kurylo, M. J., Orkin, V. L., Percival, C. J., Wilmouth, D. M., and Wine, P. H.: Chemical Kinetics and Photochemical Data for Use in Atmospheric Studies, Evaluation No. 19, JPL Publication 19-5, Jet Propulsion Laboratory, Pasadena, http://jpldataeval.jpl.nasa.gov (last access: 16 February 2025), 2019. a
Chapman, S.: A Theory of Upper Atmospheric Ozone, Mem. R. Meteorol. Soc., III, 103–125, 1930. a, b
Coddington, O., Lean, J., Lindholm, D., Pilewskie, P., and Snow, M.: NOAA Climate Data Record (CDR) of Solar Spectral Irradiance (SSI), Version 2.1, NOAA National Centers for Environmental Information [data set], https://doi.org/10.7289/V53776SW, 2015. a
Craig, R. A.: The Upper Atmosphere: Meteorology and Physics, Academic Press, ISBN 978-0-12-194850-4, 1965. a
Crutzen, P. J.: The Influence of Nitrogen Oxides on the Atmospheric Ozone Content, Q. J. Roy. Meteor. Soc., 96, 320–325, https://doi.org/10.1002/qj.49709640815, 1970. a, b
Davis, S. M., Rosenlof, K. H., Hassler, B., Hurst, D. F., Read, W. G., Vömel, H., Selkirk, H., Fujiwara, M., and Damadeo, R.: The Stratospheric Water and Ozone Satellite Homogenized (SWOOSH) database: a long-term database for climate studies, Earth Syst. Sci. Data, 8, 461–490, https://doi.org/10.5194/essd-8-461-2016, 2016. a, b
Dobson, G. M. B.: Origin and Distribution of the Polyatomic Molecules in the Atmosphere, P. Roy. Soc. A-Math. Phy., 236, 187–193, https://doi.org/10.1098/rspa.1956.0127, 1956. a
Dobson, G. M. B.: Exploring the Atmosphere, by G.M.B. Dobson, Clarendon Press, Oxford, ISBN: 9781013469732, 1963. a
Dütsch, H. U.: The Photochemistry of Stratospheric Ozone, Q. J. Roy. Meteor. Soc., 94, 483–497, 1968. a, b
Garcia, R. R. and Solomon, S.: The Effect of Breaking Gravity Waves on the Dynamics and Chemical Composition of the Mesosphere and Lower Thermosphere, J. Geophys. Res., 90, 3850, https://doi.org/10.1029/JD090iD02p03850, 1985. a, b, c
Hartley, W. N.: XXI.–On the Absorption of Solar Rays by Atmospheric Ozone, Journal of the Chemical Society, Transactions, 39, 111–128, https://doi.org/10.1039/CT8813900111, 1881. a
Jacob, D.: Introduction to Atmospheric Chemistry, Princeton University Press, https://doi.org/10.1515/9781400841547, 1999. a, b, c, d
Jeevanjee, N. and Fueglistaler, S.: Simple Spectral Models for Atmospheric Radiative Cooling, J. Atmos. Sci., 77, 479–497, https://doi.org/10.1175/JAS-D-18-0347.1, 2020. a, b, c
Jeevanjee, N., Seeley, J. T., Paynter, D., and Fueglistaler, S.: An Analytical Model for Spatially Varying Clear-Sky CO2 Forcing, J. Climate, 34, 9463–9480, https://doi.org/10.1175/JCLI-D-19-0756.1, 2021. a
Keeble, J., Hassler, B., Banerjee, A., Checa-Garcia, R., Chiodo, G., Davis, S., Eyring, V., Griffiths, P. T., Morgenstern, O., Nowack, P., Zeng, G., Zhang, J., Bodeker, G., Burrows, S., Cameron-Smith, P., Cugnet, D., Danek, C., Deushi, M., Horowitz, L. W., Kubin, A., Li, L., Lohmann, G., Michou, M., Mills, M. J., Nabat, P., Olivié, D., Park, S., Seland, Ø., Stoll, J., Wieners, K.-H., and Wu, T.: Evaluating stratospheric ozone and water vapour changes in CMIP6 models from 1850 to 2100, Atmos. Chem. Phys., 21, 5015–5061, https://doi.org/10.5194/acp-21-5015-2021, 2021. a
Kockarts, G.: Absorption and Photodissociation in the Schumann-Runge Bands of Molecular Oxygen in the Terrestrial Atmosphere, Planet. Space Sci., 24, 589–604, https://doi.org/10.1016/0032-0633(76)90137-9, 1976. a
Kump, L. R., Kasting, J. F., and Crane, R. G.: The Earth System, Pearson Education, ISBN 978-0-321-73328-3, 2011. a
Liou, K.: An Introduction to Atmospheric Radiation, Academic Press, ISBN 978-0-12-451451-5, 2002. a
Match, A.: Chapman+2 Photochemical-Transport Model, Zenodo [code], https://doi.org/10.5281/zenodo.13412268, 2024. a
Match, A. and Gerber, E. P.: Tropospheric Expansion Under Global Warming Reduces Tropical Lower Stratospheric Ozone, Geophys. Res. Lett., 49, e2022GL099463, https://doi.org/10.1029/2022GL099463, 2022. a
Match, A., Gerber, E. P., and Fueglistaler, S.: Beyond self-healing: stabilizing and destabilizing photochemical adjustment of the ozone layer, Atmos. Chem. Phys., 24, 10305–10322, https://doi.org/10.5194/acp-24-10305-2024, 2024. a, b, c
McElroy, M. B.: The Atmospheric Environment, Princeton University Press, ISBN 9780691006918, 2002. a, b
Neu, J. L. and Plumb, R. A.: Age of Air in a “Leaky Pipe” Model of Stratospheric Transport, J. Geophys. Res., 104, 19243–19255, https://doi.org/10.1029/1999JD900251, 1999. a
Nicolet, M.: Solar UV Radiation and Its Absorption in the Mesosphere and Stratosphere, Pure Appl. Geophys., 118, 3–19, https://doi.org/10.1007/BF01586443, 1980. a
Perliski, L. M., Solomon, S., and London, J.: On the Interpretation of Seasonal Variations of Stratospheric Ozone, Planet. Space Sci., 37, 1527–1538, https://doi.org/10.1016/0032-0633(89)90143-8, 1989. a, b, c
Pierrehumbert, R. T.: Infrared Radiation and Planetary Temperature, Phys. Today, 64, 33–38, https://doi.org/10.1063/1.3541943, 2011. a
Romps, D. M., Seeley, J. T., and Edman, J. P.: Why the Forcing from Carbon Dioxide Scales as the Logarithm of Its Concentration, J. Climate, 35, 4027–4047, https://doi.org/10.1175/JCLI-D-21-0275.1, 2022. a
Seinfeld, J. H. and Pandis, S. N.: Atmospheric Chemistry and Physics: From Air Pollution to Climate Change, 3rd edn., Wiley, ISBN: 978-1-118-94740-1, 2016. a
Visconti, G.: Fundamentals of Physics and Chemistry of the Atmosphere, Springer International Publishing, 2nd edn., ISBN: 978-3319294476, 2016. a
On their p. 414, Oy is defined as O(3P) + O(1D) + O3 + NO2 + 2NO3 + HNO3 + HO2NO2 + 2N2O5 + ClO + 2Cl2O2 + 2OClO + 2ClONO2 + BrO + 2BrONO2.
- Abstract
- Introduction
- The Chapman+2 model with destruction by catalytic cycles and transport
- Understanding the ozone maximum
- A new theory for the tropical ozone maximum
- Why there is a regime transition
- An explicit solution for the ozone layer under gray radiation
- Discussion
- Conclusions
- Appendix A: Numerical details for solving the Chapman+2 model
- Appendix B: Simple spectral models for the Chapman cycle
- Appendix C: An explicit solution to the source-controlled paradigm under gray radiation
- Code and data availability
- Author contributions
- Competing interests
- Disclaimer
- Acknowledgements
- Financial support
- Review statement
- References