the Creative Commons Attribution 4.0 License.
the Creative Commons Attribution 4.0 License.
 | 11 Apr 2025
Measurement report: Aircraft observations of aerosol and microphysical quantities of stratocumulus in autumn over Guangxi Province, China – daylight variation, vertical distribution, and aerosol–cloud interactions
Sihan Liu
Honglei Wang
Delong Zhao
Wei Zhou
Yuanmou Du
Zhengguo Zhang
Peng Cheng
Tianliang Zhao
Zihao Wu
Mengyu Huang
Aerosols and clouds play essential roles in the global climate system, and aerosol–cloud interactions have a significant impact on the radiation balance, water cycle, and energy cycle of the Earth–atmosphere system. To understand the effect of aerosols on the vertical distribution of stratocumulus microphysical quantities in southwest China, we analyzed data from nine aircraft observations over Guangxi from 10 October to 3 November 2020. This analysis focused on the daylight variation characteristics and formation mechanisms of stratocumulus microphysical profiles, considering the influence of aerosol number concentration in relation to the source of air mass and individual cases. Aerosol number concentration (Na) and cloud droplet concentration (Nc) decreased gradually with an altitude increase below 1500 m and did not change with a height between 1500 and 3300 m. The temperature inversion layer at the top of the planetary boundary layer (PBL) hindered the increase in the cloud droplet particle size. The lower layer of the stratocumulus cloud in Guangxi mainly contained small-sized cloud droplets (effective diameter of a cloud droplet (Ed) < 15 µm), and the middle and upper layers of cloud droplets were large-particle-size cloud droplets (Ed > 20 µm). The vertical distribution of cloud microphysical quantity had apparent daylight variation. When aerosols in the PBL were transported to the upper air (14:00 to 20:00 Beijing time, BJT), Nc in the lower layer decreased, and the small-particle-size cloud droplets (Ed < 20 µm) in the middle layer and upper layer increased. Aerosols from the free atmosphere were transported into the PBL (10:00 to 13:00 BJT), providing an abundance of cloud condensation nuclei, which increased the number of small-particle-size cloud droplets in the lower layer of the cloud (near the top of the PBL). The characteristics of cloud microphysical quantities (Nc and Ed) were also affected by the source of air mass and the height of the PBL. Na and Nc were high under the influence of land air mass or aerosols within the PBL, and the cloud droplet number concentration spectrum was unimodal. Na and Nc were low under the influence of marine air mass or above the boundary layer, and the cloud droplet number concentration spectrum was bimodal. The relationship between stratocumulus and aerosol in this region is consistent with the Twomey effect. Ed and Na remain negatively correlated in different liquid water content ranges, and the FIE (aerosol first indirect effect) ranged from −0.07 to −0.58.
- Article
(6656 KB) - Full-text XML
- BibTeX
- EndNote


Clouds are an essential component of the Earth–atmosphere system, covering over 67 % of the Earth's surface (King et al., 2013), with stratocumulus clouds covering approximately 20 % of the Earth's surface in the annual mean. Stratocumulus typically occupies the upper few hundred meters of the planetary boundary layer (PBL) (Wood, 2012). These clouds can absorb atmospheric longwave radiation and reflect solar shortwave radiation to influence the radiation budget of the Earth's atmospheric system (Pyrina et al., 2015; Ramanathan et al., 1989; Zelinka et al., 2014). Additionally, they participate in the global water cycle through precipitation processes (Betts, 2007; Rosenfeld et al., 2014). Cloud microphysical characteristics are closely related to the climate effect and precipitation formation of stratocumulus clouds. Differences in cloud water content, cloud droplet number concentration and cloud droplet size in different regions will produce different radiative forcing and precipitation (de Boer et al., 2008; Waliser et al., 2011; Yuan et al., 2008).
Aerosols are an important source of cloud condensation nuclei (CCN), and thus, variations in aerosols can lead to significant changes in the microscopic characteristics of clouds (Chen et al., 2021; Dusek et al., 2006; Lance et al., 2004). Twomey (1977) suggested that, with the liquid water path (LWP) of clouds remaining constant, an increase in aerosol number concentration (Na) would lead to an increase in cloud droplet number concentration (Nc) and a decrease in cloud droplet size, thereby enhancing cloud albedo. Albrecht (1989) proposed that the decrease in cloud droplet particle size caused by the increase in aerosols would further inhibit the precipitation process of clouds and thus extend the lifetime of clouds.
Currently, aircraft observation, ground-based remote sensing, and satellite remote sensing are the main observation methods used to study the interaction between aerosols and clouds. Many scholars have confirmed the Twomey effect (the first indirect effect of aerosols) through observational data (Ferek et al., 1998; Han et al., 1994; Kleinman et al., 2012; Koren et al., 2005). Based on radar observation data, Kim et al. (2003) found that the aerosol optical depth in Oklahoma presents a linear proportional relationship with LWP on a completely cloudy day with a single-layer cloud, and the effective radius of cloud droplets is negatively correlated with the surface aerosol light scattering coefficient. For a given LWP, cloud albedo and radiative forcing are very sensitive to the effective radius. Li et al. (2019), using aircraft observation data over the Loess Plateau, found a negative correlation between Na and Nc in both vertical and horizontal directions. Under high aerosol loading (Na below the cloud base was 4573 cm−3), smaller cloud droplets with high Nc (Nc = 157 cm−3) were observed, while few large cloud droplets (Nc = 118 cm−3) were formed under low aerosol loading (Na below the cloud base was 982 cm−3). Cloud droplet number concentration was negatively correlated with cloud droplet diameter within a specific range of liquid water content (LWC). However, some scholars have also observed a positive correlation between Na and the effective diameter of a cloud droplet (Ed) (Harikishan et al., 2016; Jose et al., 2020; Liu et al., 2020), referred to as the anti-Twomey effect.
Aircraft observations with continuous vertical sampling are the most reliable source that can accurately characterize the vertical relationship between aerosol and cloud (Nakajima et al., 2005; Terai et al., 2014; Wehbe et al., 2021; Zaveri et al., 2022). McFarquhar et al. (2021) conducted aircraft observations in the Southern Ocean region. They found aerosols above clouds may originate from new particle formation and remote transport from continental air masses. This leads to variations in CCN and Nc near cloud tops. During the Aerosol and Cloud Experiments in the Eastern North Atlantic (ACE-ENA) campaign, the probability of aerosol transport interacting with marine boundary layer clouds over the ENA during summer was approximately 62.5 % (Wang et al., 2020).
Zhao et al. (2019) observed a stratus cloud (water cloud) in the Huanghua region of China by aircraft and found that in the PBL, the effective radius of cloud droplets and Na show a negative relationship, while they showed a clear positive relationship in the upper layer above the PBL with much less Na. It also shows that the relationship between the effective radius of cloud droplets and Na changes from negative to positive when LWC increases. Lu et al. (2007) compared the microphysical quantities of stratocumulus clouds influenced by aircraft flight tracks and those in undisturbed regions and found that the effective radius of cloud droplets in the flight path region was smaller, the number concentration of cloud drops was lower, and the cloud LWC was larger, providing observational evidence for the first indirect effect of aerosols.
The mechanism of interaction between aerosols and clouds still involves significant uncertainty, influenced by factors such as aerosol physicochemical properties, meteorological conditions, cloud types, and the relative positioning of aerosols and cloud layers (Almeida et al., 2014; Dusek et al., 2006; Wex et al., 2010; Zhang et al., 2011). Therefore, precise measurements of cloud microphysical properties are crucial as the first step in studying aerosol–cloud interactions. Multi-aircraft observations provide high-precision observational data, aiding in understanding the relationship between aerosols and cloud microphysical characteristics.
Our study on the vertical distribution of aerosol in the Guangxi region found that the vertical profile of Na in this region has prominent daylight variation characteristics under the influence of the PBL. In the morning, aerosols are mainly concentrated in the PBL. With the development of the PBL and the enhancement of turbulent activity, the aerosols near the ground are diluted in the afternoon, and aerosols can be transmitted to more than 2 km. At night, the rapid decline in the top of the PBL will increase Na near the surface. At the same time, some aerosols will stay above the top of the PBL, forming a high-concentration aerosol layer (Liu et al., 2024). Previous studies have shown that aerosols can affect cloud microphysical properties. When aerosol particles settle onto clouds or the cloud top is elevated, aerosols can alter the microphysical characteristics of clouds by being entrained into the cloud top (Lu et al., 2018; Painemal et al., 2014). This study used data from nine cloud-penetrating aircraft flights to investigate the vertical distribution and formation mechanisms of cloud microphysical properties in stratocumulus clouds over Guangxi. Additionally, we discussed the differences in the impact of aerosols from different sources on cloud microphysical properties. Our findings indicate that the interaction between aerosols and clouds in this region aligns with the Twomey effect. The ultimate goal is to provide observational constraints for the simulation of aerosol radiative forcing in global climate models.
2.1 Aircraft data and data processing
The Beijing Weather Modification Office (BJWMO) provided the data for this study, and nine flights of stratocumulus clouds and aerosols over Guangxi were conducted using the King Air 350 ER turbo aircraft. The aircraft is equipped with the Aircraft Integrated Meteorological Measurement System (AIMMS-20; AvenTech Inc., Canada), which provides meteorological elements such as temperature (T) and relative humidity (RH) with a time resolution of 1 s. A passive cavity aerosol spectrometer probe (PCASP-100X, DMT Inc, USA) was installed to provide aerosol number concentrations in the optical particle size range of 0.11 to 3 µm, with a time resolution of 1 s, particle size uncertainty of 20 %, and concentration uncertainty of 16 %. The Fast Cloud Droplet Probe (FCDP; SPEC Inc, USA) was used to observe the cloud droplet concentration, cloud particle concentration and cloud particle size distribution. Its principle is to detect particles with an optical diameter ranging from 2 to 50 µm using forward scattering technology with a time resolution of 1 s. The particle number concentration measured by the FCDP in the size range of less than 3 µm has significant uncertainty. In this study, the range of Nc is defined as 3–50 µm. Na and Nc are measured in volume units. All instruments were calibrated before observation. The detailed principles of the airborne instruments can be found in several studies (Collaud Coen et al., 2010; Strapp et al., 1992; Zhang et al., 2009).
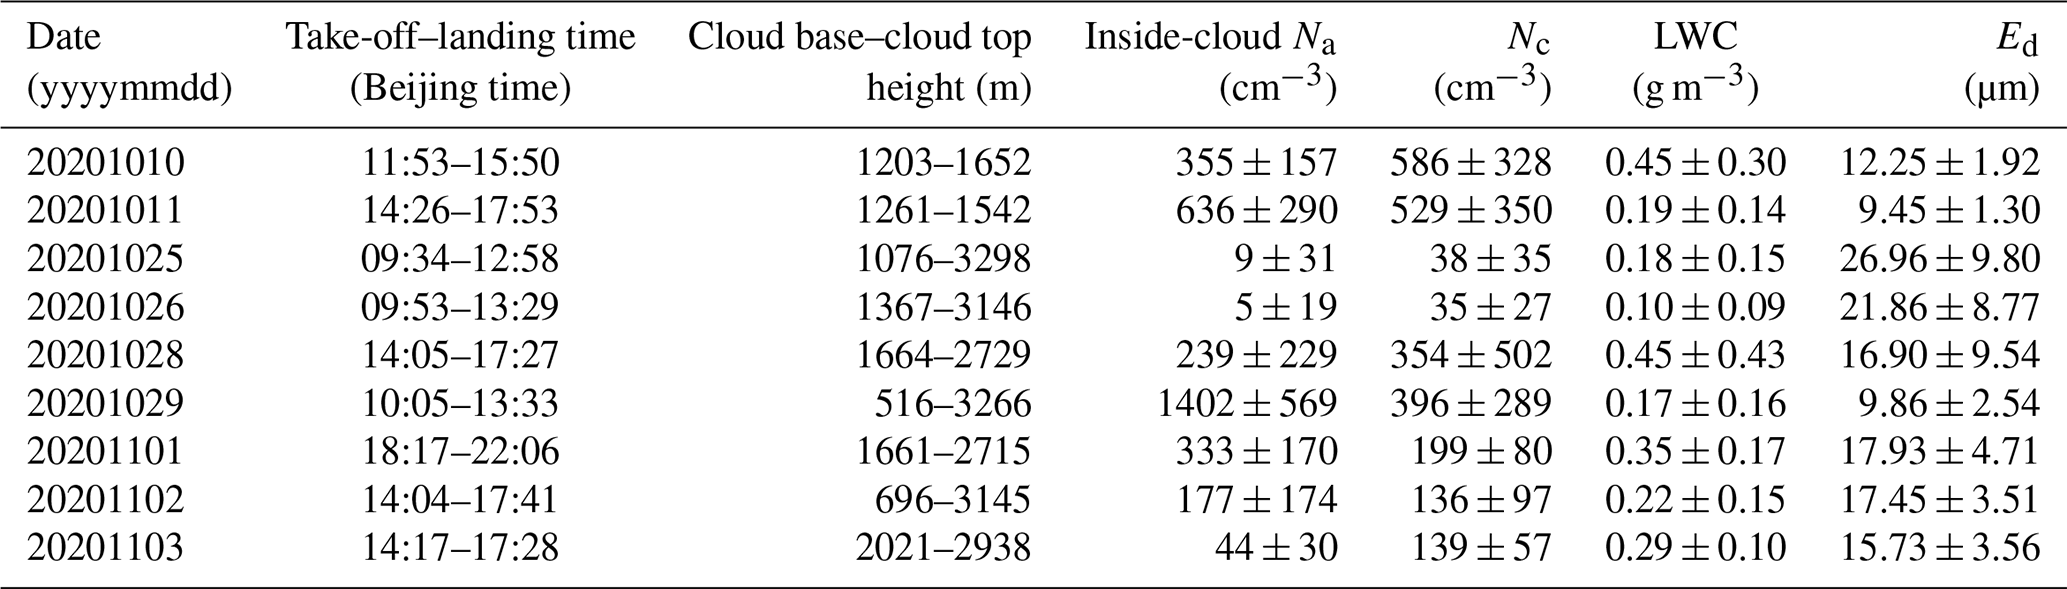
Detailed data of this aircraft observation activity, including observation date, time, cloud thickness, and microphysical quantities, are summarized in Table 1. Compared with aircraft observation data in other regions, the average LWC in Guangxi was higher, 5.33 times that in north China, and the average cloud droplet diameter was larger, 2.58 times that in north China (Zhao et al., 2011). Compared with the marine stratocumulus (Lu et al., 2011; Miles et al., 2000), the stratocumulus in Guangxi had higher cloud base height and greater cloud thickness. The cloud microphysical characteristics of the stratocumulus observed in this study are similar to those of previous observations. Compared with stratocumulus (non-precipitation warm cloud) over eastern China, the Nc, LWC, and Ed of stratocumulus in the Guangxi region were larger. According to previous studies (Liu et al., 2024), there were no special weather processes in the upper air and on the ground in Guangxi during the observation period, which ensured the quality of the data and the universality of the conclusions.
Table 1Flight information for the measurement campaign (Na, Nc, LWC, and Ed values are averages ± the standard deviations).
To ensure data quality, this study selected the data that met the following conditions and the flight macro record as the in-cloud data: Nc ≥ 10 cm−3, LWC ≥ 10−3 g m−3 (Gunthe et al., 2009; Zhang et al., 2011). The observation records show that the clouds during the observation period were stratocumulus clouds (non-precipitation warm clouds). Therefore, the aerosol and cloud microphysical data met the following conditions: observation height ≤ 4000 m, T > 0 °C. The height of the PBL is determined by applying the gradient method to the vertical distribution of potential temperature (Kim et al., 2007; Su et al., 2017).
The microphysical quantities such as Nc, LWC, and Ed are calculated from the cloud droplet spectrum data detected by the FCDP. The calculation formulas are as follows:
In the formulas, ni is the cloud number concentration for each bin, ri is the median particle size for each bin, and ρw is the density of water.
The relative heights of the cloud are defined as Zn:
In the formula, Zbase is the height of the cloud base, and Ztop is the height of the cloud top. The cloud heights have been normalized by setting the cloud base as 0 and the cloud top as 1.
Similar to previous studies, the first indirect effect (FIE) of aerosol or Twomey effect of aerosols and clouds is defined as
In the formula, α represents the physical quantity of aerosols, which can be quantified using aerosol optical depth (Feingold et al., 2001), aerosol extinction coefficient (Feingold et al., 2003), cloud condensation nuclei concentration, and aerosol number concentration (Che et al., 2021; Zhao et al., 2012, 2018). The FIE value may vary with the variables representing the aerosol amount.
2.2 Reanalysis data
The vertical pressure velocity (Pa s−1) was obtained from MERRA2, with a spatial resolution of 0.625° × 0.5° and 42 layers and a temporal resolution of 3 h. The data from the first to the 23rd layers, corresponding to pressure altitudes from 1000 to 200 hPa, were selected, covering the maximum altitude of aircraft observations. An average calculation was performed to obtain the vertical pressure velocity for the Guangxi region from 08:00 to 20:00 BJT during the observation period, reflecting the temporal variation characteristics of vertical airflow above the region. This dataset has been used in several studies (Ge et al., 2021; Kennedy et al., 2001; Painemal et al., 2021).
3.1 Vertical distribution characteristics of cloud microphysical quantities
Based on the criteria of Nc ≥ 10 cm−3 and LWC ≥ 10−3 g m−3, aerosol, cloud droplet, and meteorological data were distinguished between inside and outside the cloud. The vertical averages were calculated at 10 m height intervals, resulting in the vertical distributions of physical quantities from nine observation flights, covering a height range of 0–4000 m and ensuring consistent vertical resolution for each physical quantity. Subsequently, the average vertical distribution of physical quantities from the nine observation flights was calculated, leading to the vertical distribution diagrams of each physical quantity during the observation period, as shown in Fig. 1. The average vertical profiles of Na (interstitial aerosol, aerosol particles too small to activate to cloud droplets), Na (outside cloud) (Fig. 1a), cloud microphysical quantities (Fig. 1b), and meteorological elements (Fig. 1c–d) during the observation period were obtained. Na (interstitial aerosol) decreased gradually with height and was affected by aerosols in the atmospheric environment. Below 1500 m, Nc first decreased and then stabilized with increasing height, following a trend similar to that of Na. This indicates that the number of cloud condensation nuclei capable of activating cloud droplets diminishes as altitude increases. Compared to the upper atmosphere (above 1500 m), there were more cloud condensation nuclei in the lower atmosphere, resulting in an average Nc value of 407 cm−3. Between 1500 and 3300 m, Nc showed little variation with height, remaining concentrated around 100 cm−3 at each altitude (Fig. 1a). The low Nc observed at certain altitudes may be due to the observation area being close to the edge of the cloud.
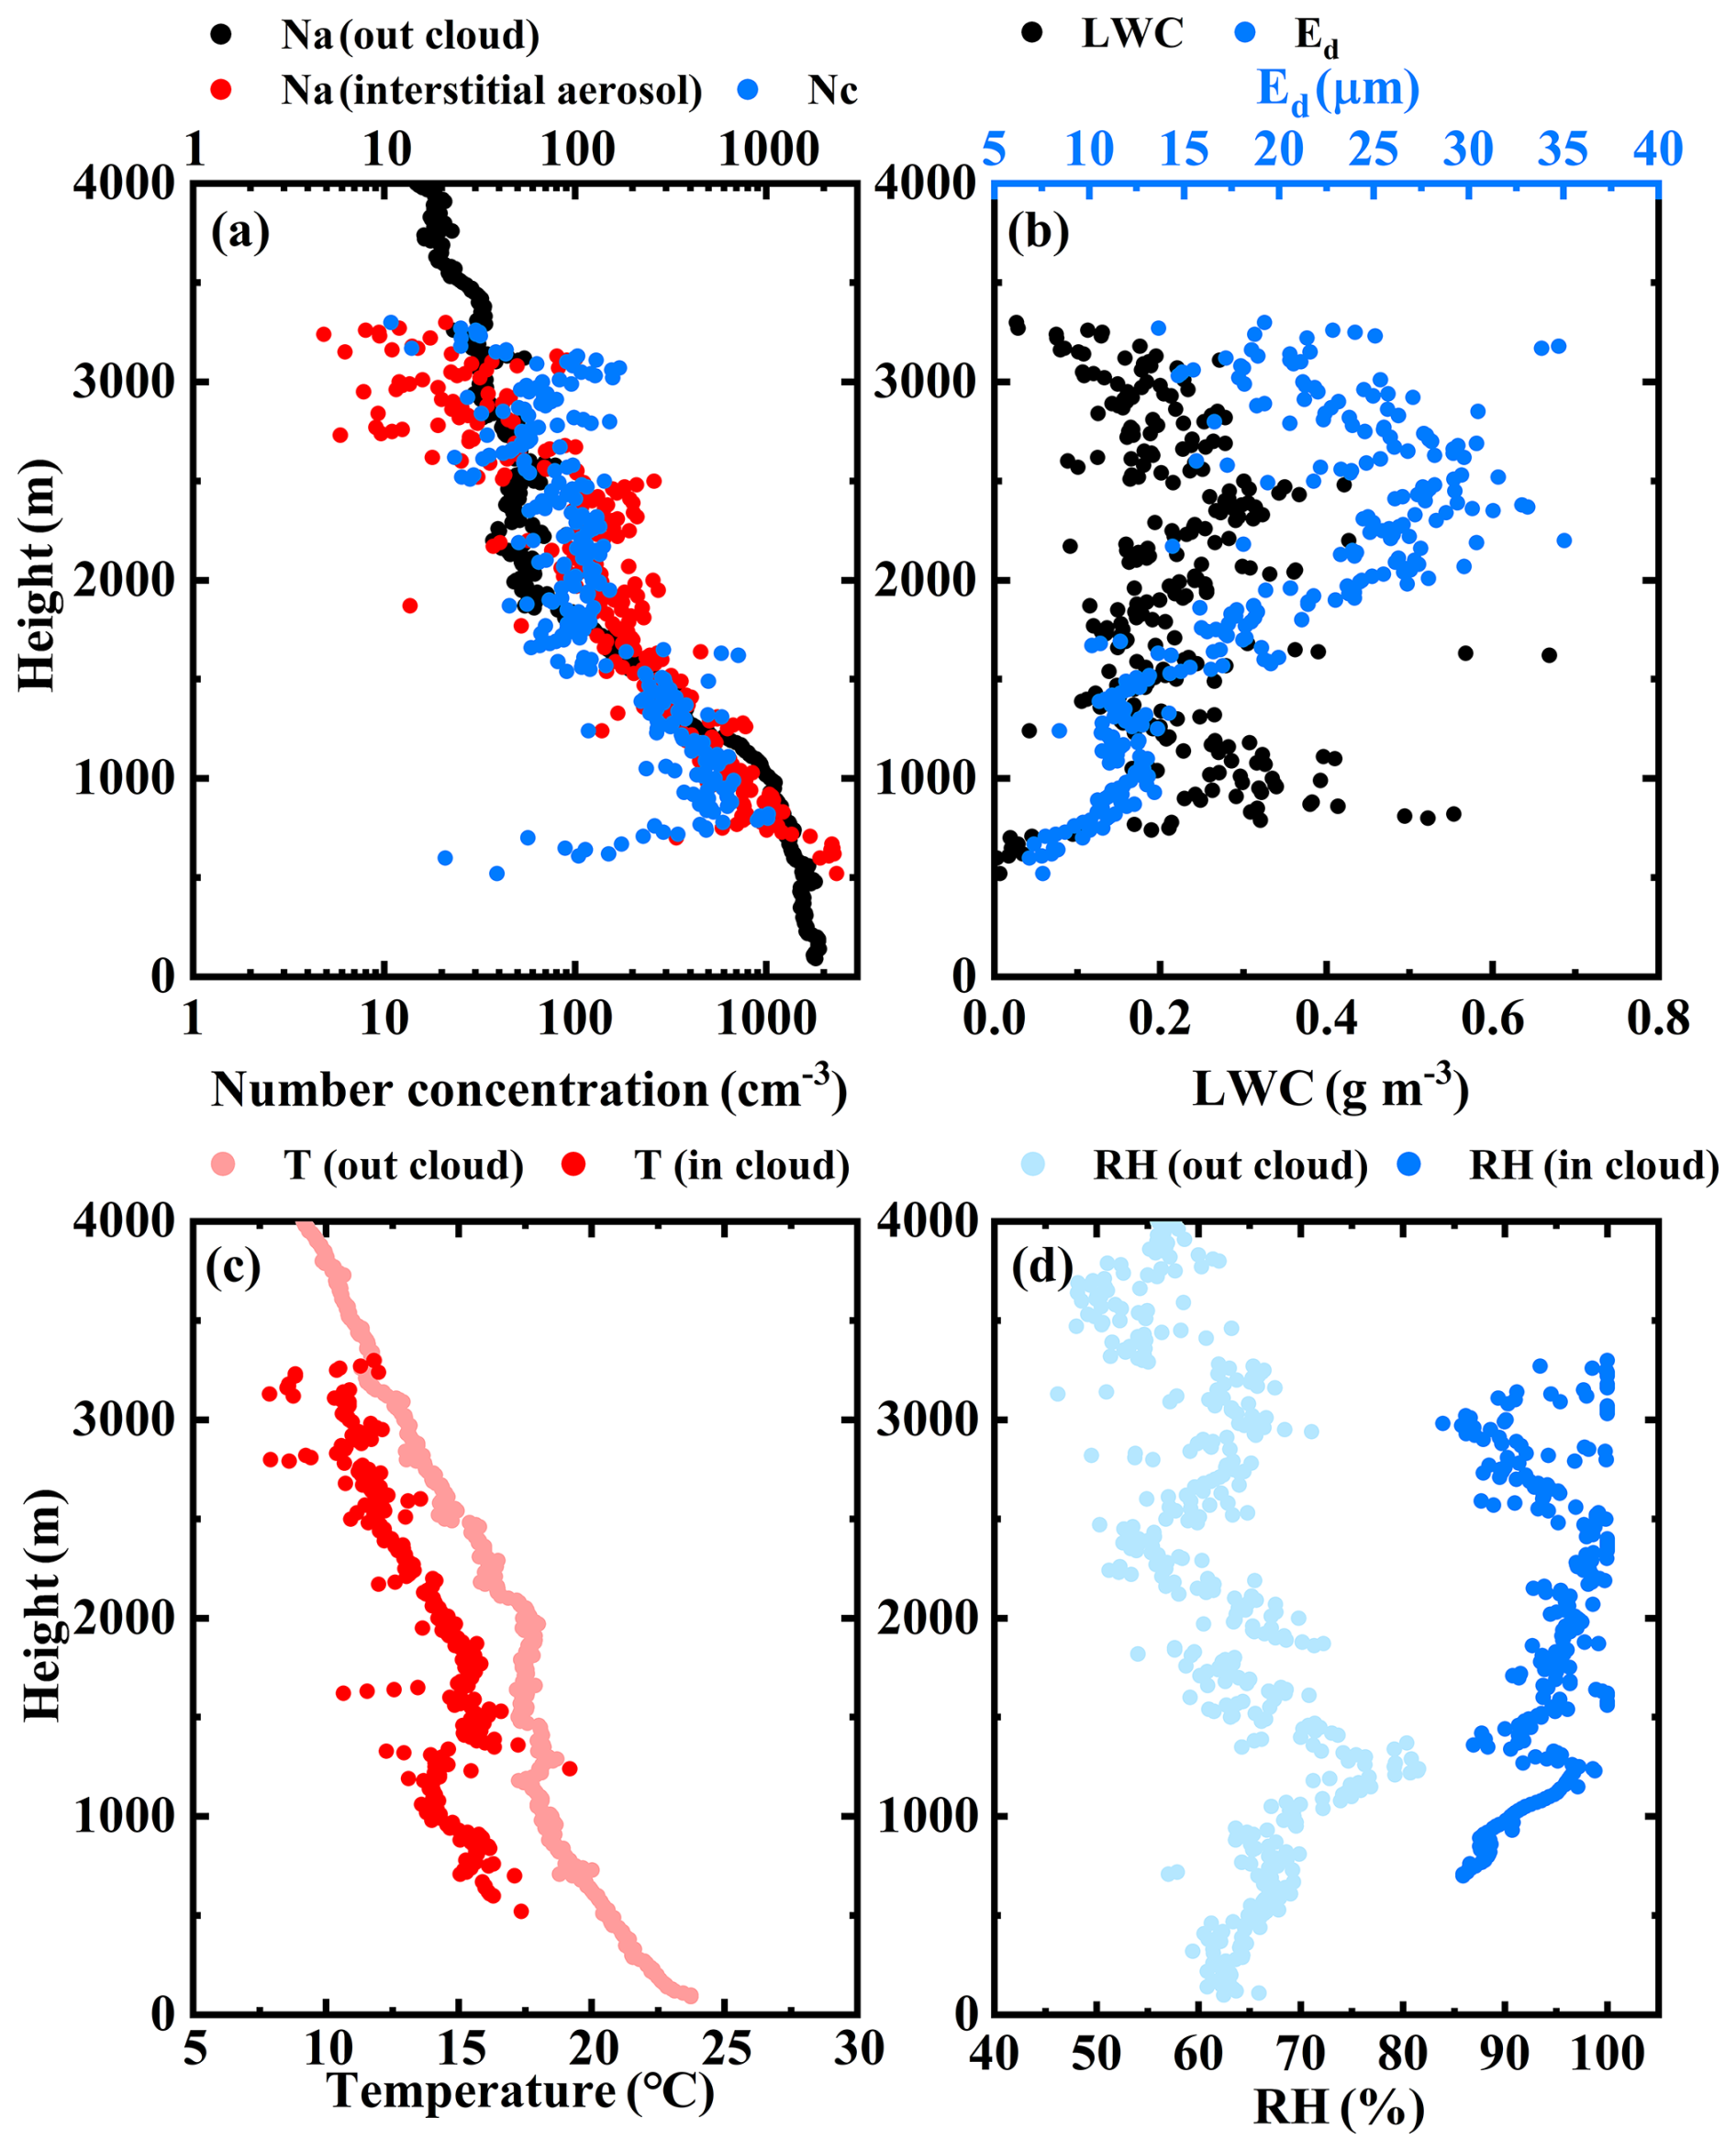
Figure 1Average vertical profiles of cloud interstitial aerosol concentration, outside aerosol number concentration, and cloud droplet concentration (a); LWC and effective diameter of cloud droplet (b); temperature inside and outside cloud (c); and relative humidity inside and outside cloud (d) during the observation period.
With the increase in height, Ed first increased and then remained unchanged and then increased (Fig. 1b). A large number of cloud droplets competed for water vapor below 1500 m, which is not conducive to the growth of cloud droplets, so the average Ed was only 11.21 µm. In Guangxi, the top of the PBL during autumn ranges from 1000 to 1500 m (Fig. 1c), where temperature inversion layers occur. This temperature structure increases the stability of the air, suppressing the formation of vertical airflow and hindering the growth of cloud droplets. Above 1500 m, Nc was lower than the near ground, and the lower atmospheric temperature was conducive to increasing cloud droplet particle size. The average value of Ed reached 22.78 µm. The value of LWC was independent of height, with an average value of 0.22 g m−3 in Guangxi (Fig. 1b). RH was consistently above 60 %, making it likely for the air to reach saturation and lead to cloud formation.
3.2 Time variation of the vertical distribution of cloud microphysical quantities
To understand the time variation of the vertical distribution of cloud microphysical quantities, the data were classified. Vertical profiles of interstitial aerosol (Na), Na outside the cloud (Fig. 2), cloud microphysical quantities (Fig. 3), and meteorological elements inside and outside the cloud (Fig. 4) were obtained at 10 times from 10:00 to 18:00 and at 20:00 BJT. The data collected inside the cloud were original, while the average values outside the cloud were calculated at 10 m intervals.
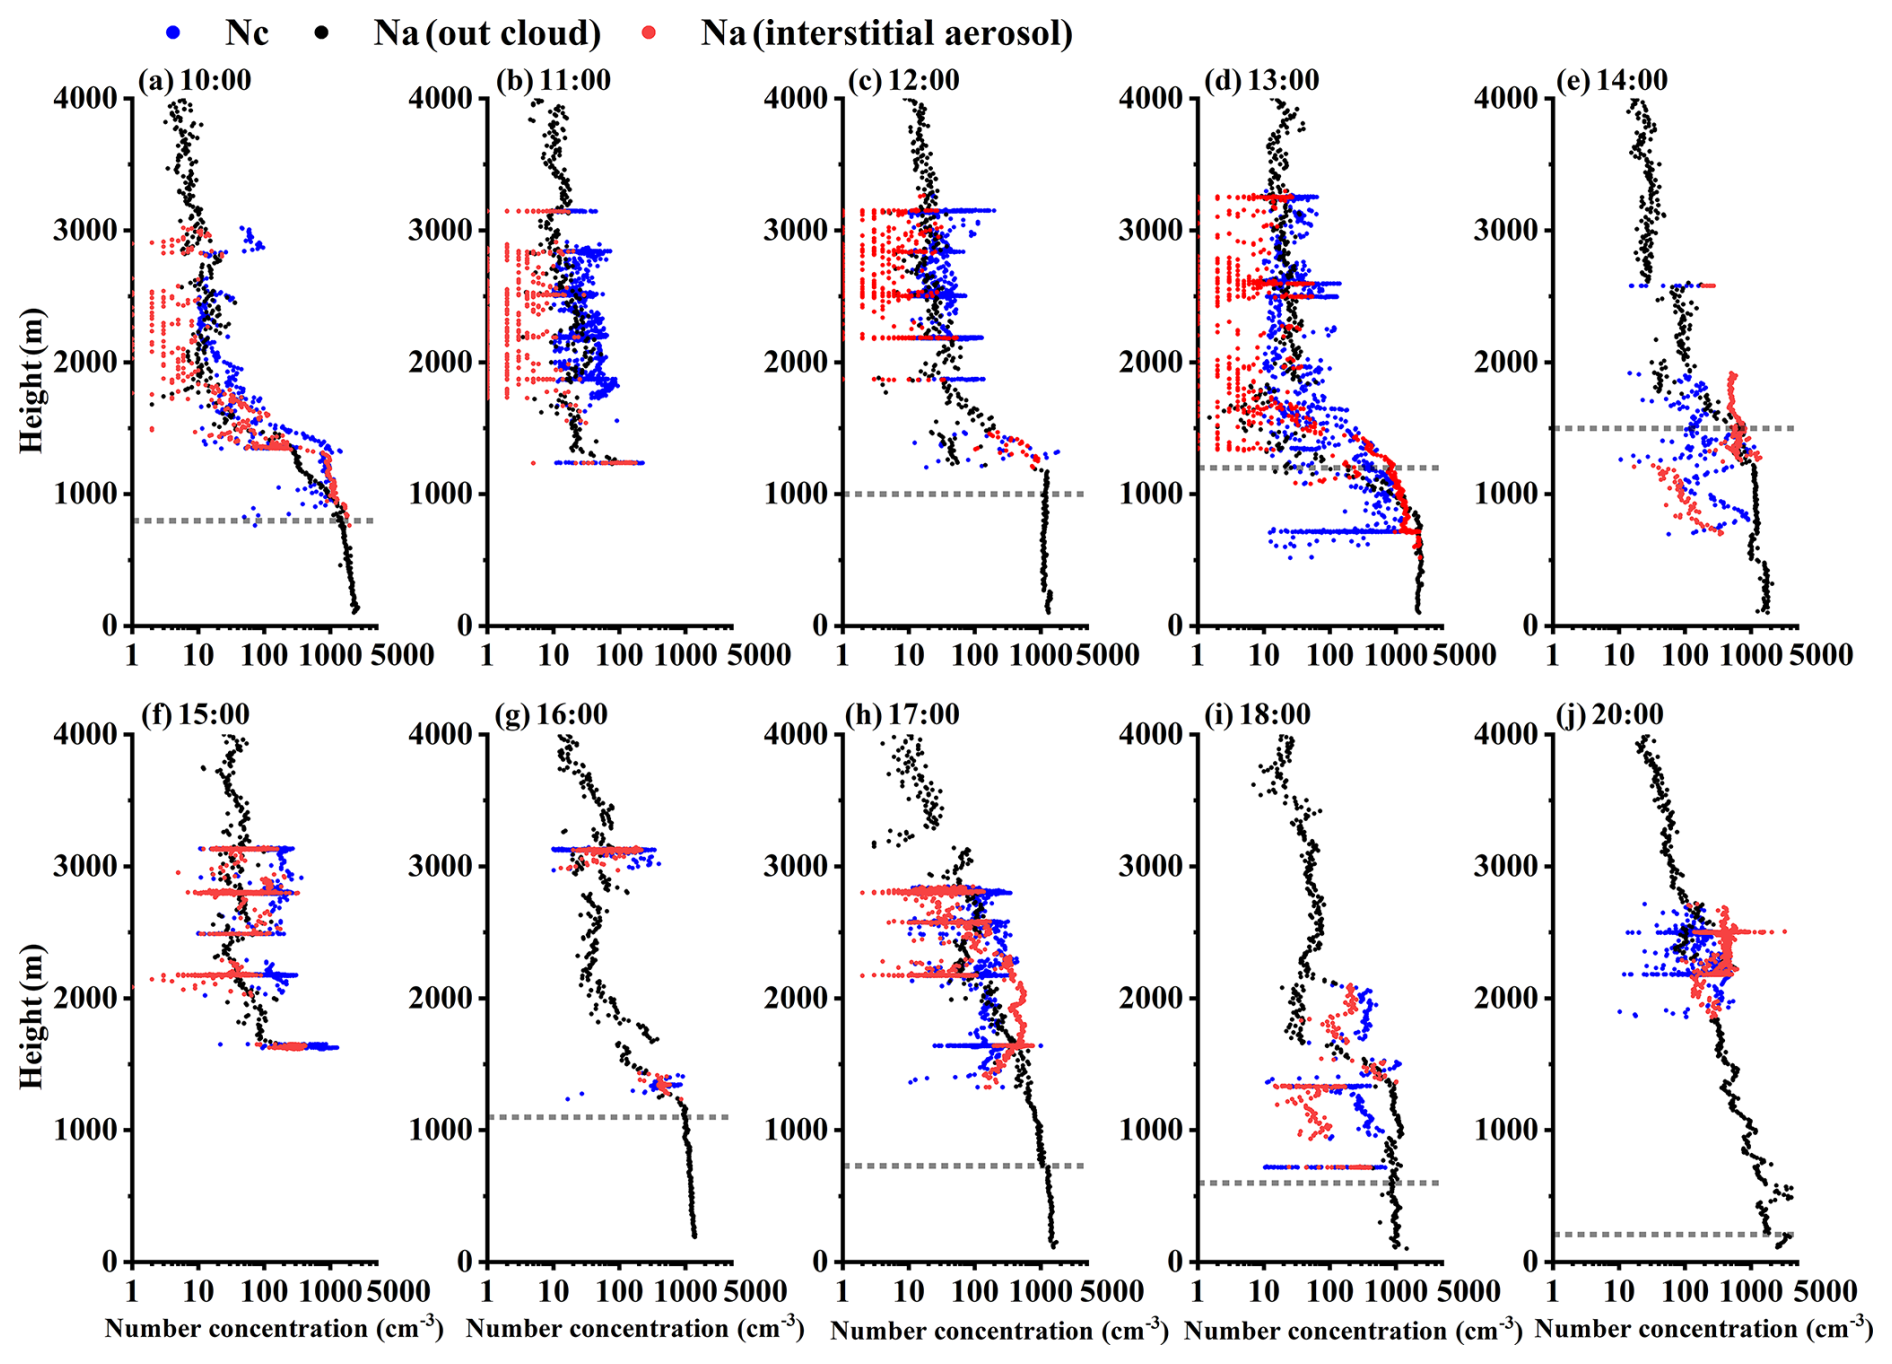
Figure 2Vertical profiles of cloud interstitial aerosol concentration, outside aerosol number concentration, and cloud droplet concentration at different times (BJT): (a) 10:00, (b) 11:00, (c) 12:00, (d) 13:00, (e) 14:00, (f) 15:00, (g) 16:00, (h) 17:00, (i) 18:00, and (j) 20:00. The dashed black line represents the height of the PBL.
At 10:00 BJT, Nc below 900 m was less than 100 cm−3, and Na in the PBL was high (Fig. 2a). Although there were sufficient aerosols that can be activated into cloud condensation nuclei, RH > 60 %, and the atmospheric temperature was high, which was not conducive to the activation of small-size aerosol particles (Fig. 3a). At the same time, LWC was low, and it was difficult for the condensed cloud droplets to grow; the average Ed was only 8.01 µm (Fig. 3a). Between 900 and 1500 m, there were not only sufficient cloud condensation nuclei but also sufficient water vapor and temperature conditions, which are conducive to the formation of cloud droplets. The average Nc and Ed increased to 430 cm−3 and 11.15 µm. Above 1500 m, although the water vapor condition was sufficient (LWC = 0.16 g m−3), the cloud condensation nuclei were few, resulting in an average Nc value of only 35 cm−3. However, sufficient LWC was conducive to the growth of cloud droplets, and Ed was significantly higher than clouds below 1500 m, with Ed ranging from 13.82 to 37.26 µm. At 1500 m, Na (interstitial aerosol) was 34 cm−3, increasing to 134 cm−3 at 1600 m. RH remained nearly constant in this range, while LWC rose from 0.16 to 0.19 g m−3, promoting the hygroscopic growth of aerosols. However, Nc did not show a significant increase. Thus, the temperature inversion layer (Fig. 4a) within the cloud may contribute to the rise in Na (interstitial aerosol). This increase suggests more aerosols are inactive or unable to activate within the cloud. These aerosols may result from mixing warm air from outside the cloud at the cloud base (Lu et al., 2011). Furthermore, the temperature inversion layer may hinder vertical airflow within the cloud, suppressing cloud droplet growth.
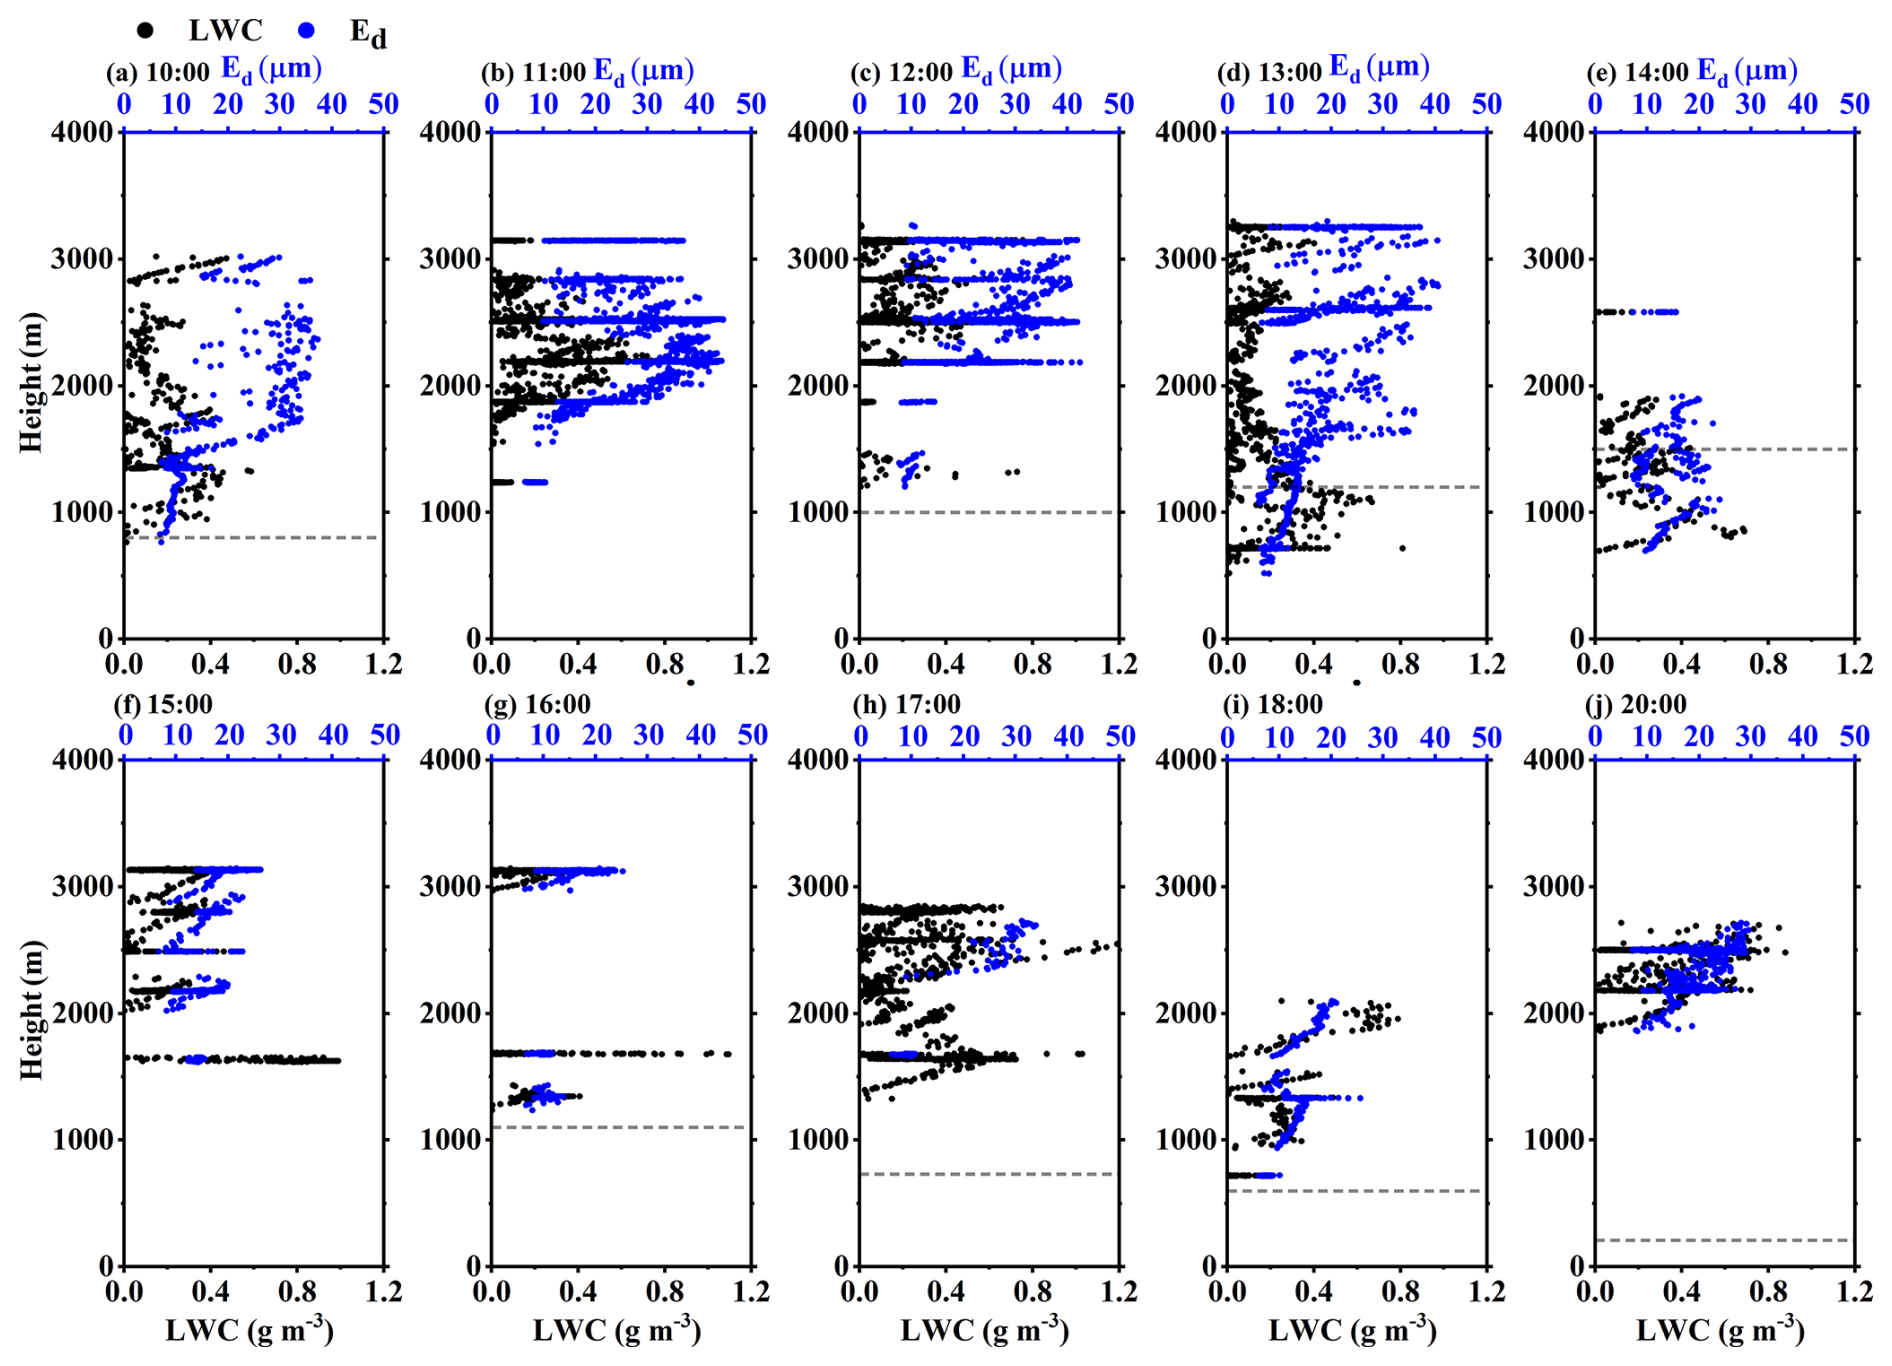
Figure 3Vertical profiles of liquid water content and effective diameter of cloud droplets at different times (BJT): (a) 10:00, (b) 11:00, (c) 12:00, (d) 13:00, (e) 14:00, (f) 15:00, (g) 16:00, (h) 17:00, (i) 18:00, and (j) 20:00. The dashed black line represents the height of the PBL).
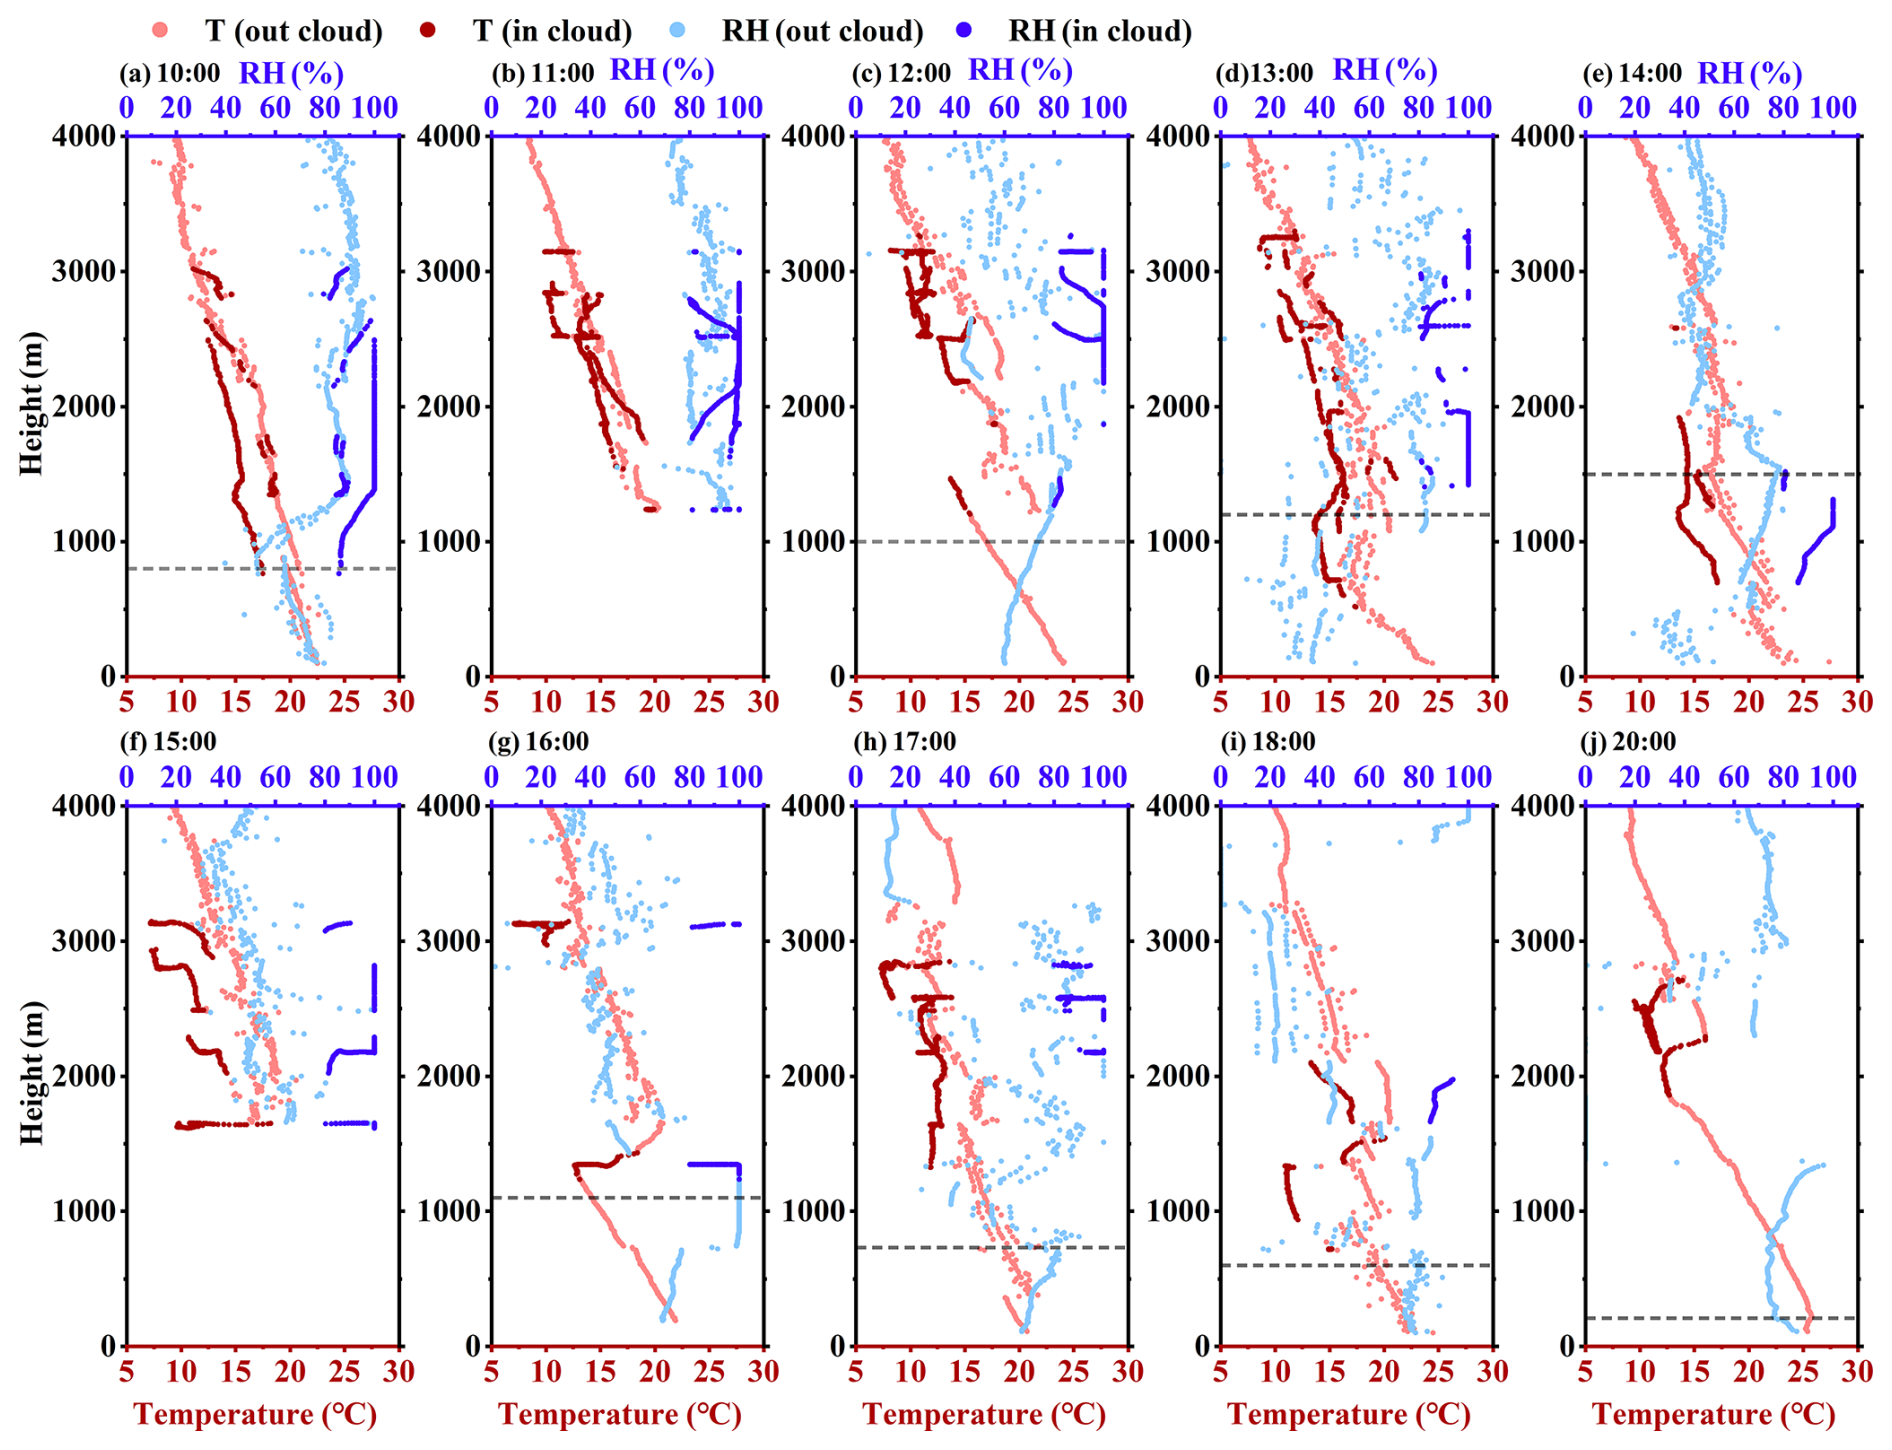
Figure 4Vertical profiles of temperature inside and outside the cloud, relative humidity inside and outside the cloud at different times (BJT): (a) 10:00, (b) 11:00, (c) 12:00, (d) 13:00, (e) 14:00, (f) 15:00, (g) 16:00, (h) 17:00, (i) 18:00, and (j) 20:00. The dashed black line represents the height of the PBL.
At 11:00 BJT, aerosols were transported by updrafts (Fig. 5a) to around 1500 m (near the top of the PBL) and activated into cloud condensation nuclei. Below 1500 m, the average Nc value was 102 cm−3 (Fig. 2b), while the average LWC value was only 0.03 g m−3 (Fig. 3b). Cloud droplets were competing for water vapor. The Ed value was only 8.20 µm, similar to the cloud microphysical characteristics near the PBL at 10:00. Between 1500 and 3150 m, Na was less than 10 cm−3, indicating insufficient CCN, and the average Nc was only 29 cm−3. Compared to 10:00 BJT, the LWC was higher (mean 0.19 g m−3), resulting in a larger Ed in the upper part of the cloud, with an average of 28.95 µm.
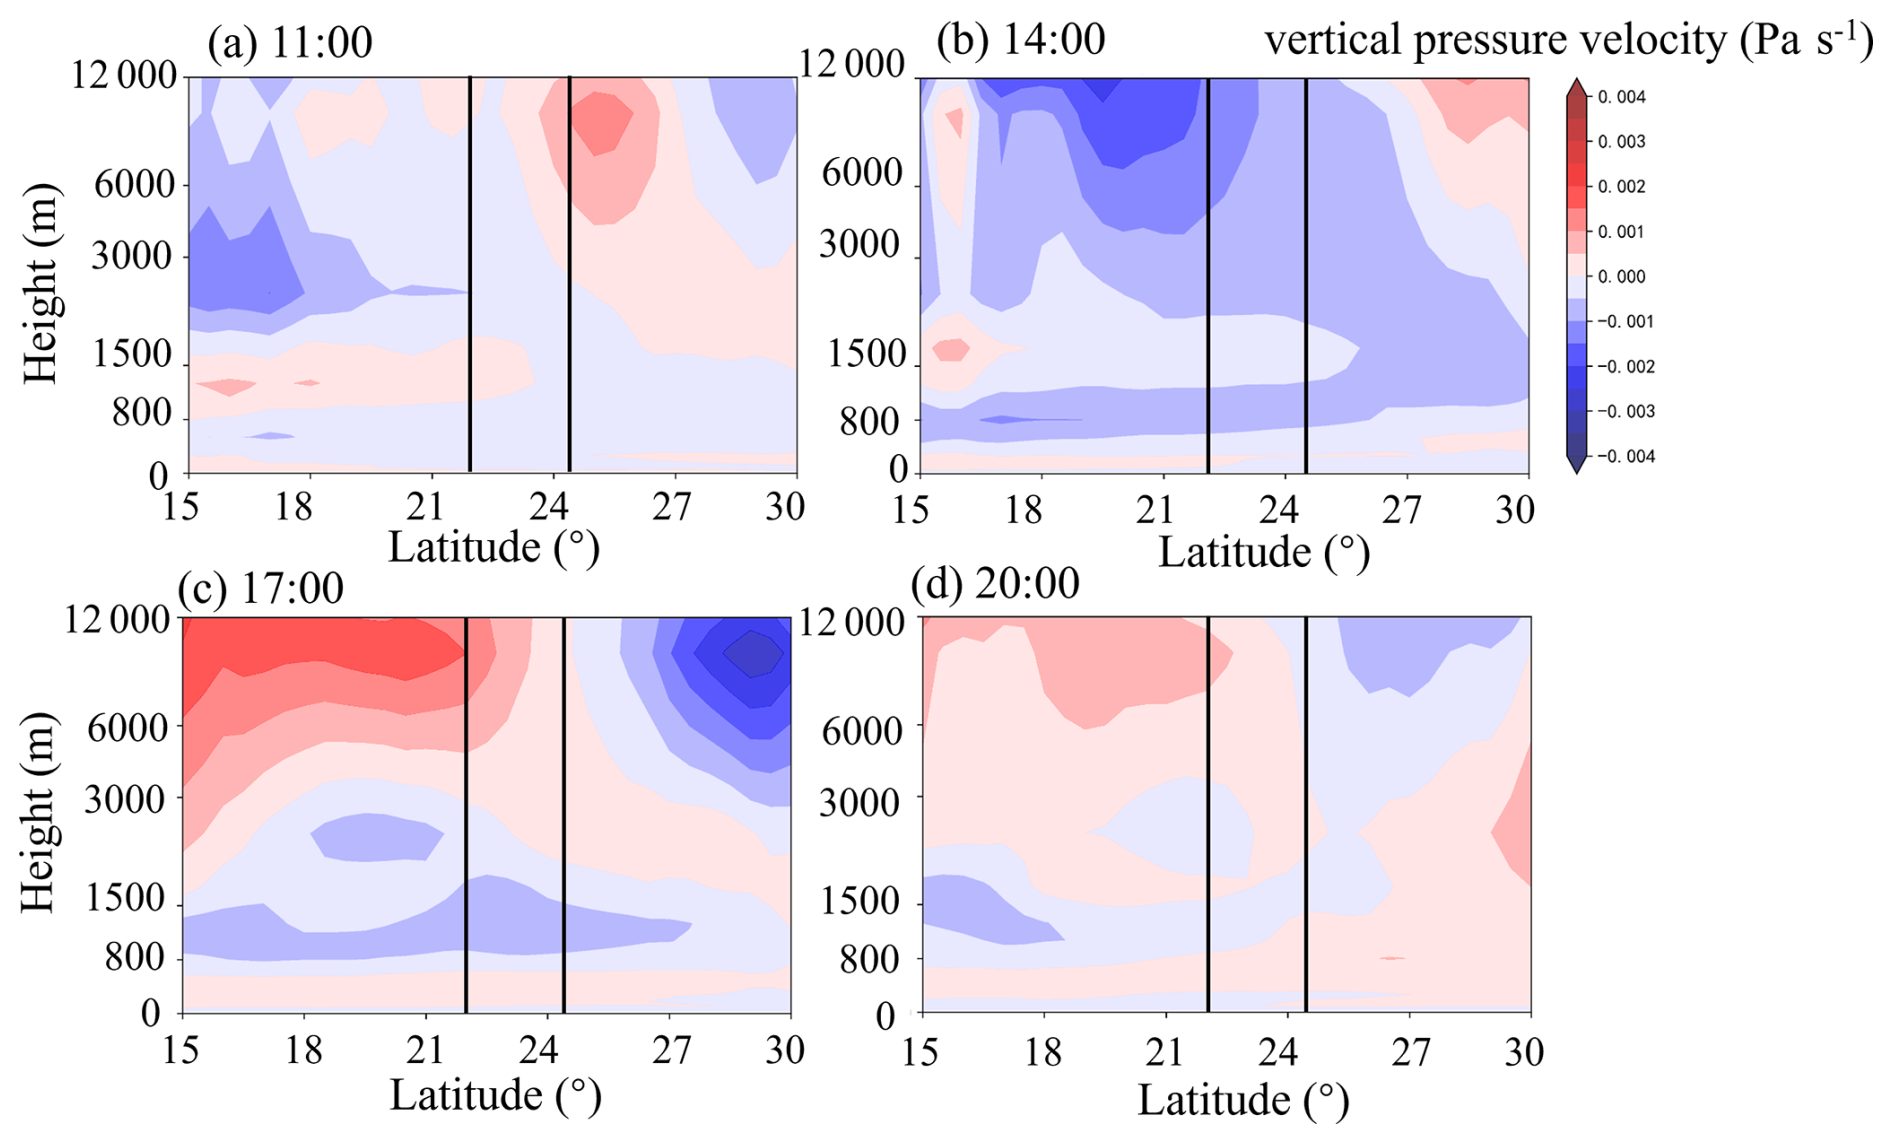
Figure 5Latitudinal profiles of vertical pressure velocity at different times in Guangxi. The solid black line is the latitude range observed by aircraft, where a positive value shows the downdraft, and a negative value shows the updraft: (a) 11:00, (b) 14:00, (c) 17:00, and (d) 20:00 BJT.
At 12:00 BJT, the height of the PBL top rose to 1000 m; the near-surface aerosol was transported to 1200–1500 m (Fig. 2c; the mean value of Na outside the cloud was 578 cm−3); the mean value of Nc reached 399 cm−3; and the mean value of Ed was only 9.41 µm (Fig. 3c), higher than at 11:00 BJT. Stratocumulus clouds above 1800 m had low Nc (mean 35 cm−3) and large Ed (mean 26.14 µm).
At 13:00 BJT, the Nc ranged from 13 to 2052 cm−3 below 1200 m (Fig. 2d), which may be attributed to the uneven development of clouds within the detection range. The increase in solar radiation leads to high near-surface temperatures (Fig. 4d, T > 25 °C), which enhances turbulent activity within the PBL and is favorable for cloud droplet formation. Therefore, Nc at 13:00 BJT was larger than that at 10:00 BJT, and many cloud droplets hindered their particle size growth, with an average Ed value of 9.23 µm (Fig. 3d). From 1200 to 1500 m, the mean values of Nc and Ed were 155 cm−3 and 12.29 µm. At this height, a strong temperature inversion layer appeared (Fig. 4d), and cloud droplet evaporation activity was enhanced (Li et al., 2003), resulting in a higher Na (interstitial aerosol) than Na (outside cloud). For stratocumulus clouds above 1500 m, the Nc varied little with height, and the average Ed was 21.45 µm.
At 14:00 BJT, the Nc range below 1500 m was 11 to 1109 cm−3 (Fig. 2e), with the highest PBL top height at 1500 m, which diluted the Na (out of the cloud) within the PBL, resulting in a decrease in the maximum Nc (Nc = 1109 cm−3). The average LWC was 0.29 g m−3 (Fig. 3e), higher than at 13:00 BJT, providing moisture conditions for cloud droplet growth, while the upward airflow was strong (Fig. 5b). Consequently, the average Ed was 13.75 µm. A temperature inversion layer was present at 2500 m (Fig. 4e), hindering aerosol diffusion and enhancing the evaporation of cloud droplets near the cloud top, leading to a peak in Na (interstitial aerosol) at that height.
At 15:00 BJT, the Nc and Na (interstitial aerosol) between 1600 and 2000 m were higher than those at 14:00 BJT with average values of 720 and 249 cm−3 (Fig. 2f). Due to the increase in Nc, the average Ed was only 13.72 µm (Fig. 3f). The increase in Na (outside cloud) above 2000 m provided CCN, resulting in an average Nc of 146 cm−3. Although the moisture conditions were sufficient, with an average LWC of 0.23 g m−3, which was higher than the 0.05 g m−3 recorded at 14:00 BJT (Fig. 3f), and RH was 52 % (Fig. 4f), the average Ed decreased to 16.73 µm. This decrease was due to the competition for moisture among cloud droplets, which led to an increase in small-particle-size cloud droplets.
At 16:00 BJT, Nc and Na (interstitial aerosol) below 2000 m were relatively large, 458 and 468 cm−3, respectively (Fig. 2g). The temperature inversion layer at the top of the PBL hinders the condensation growth of cloud droplets. The average Ed was only 11.00 µm (Fig. 3g). Similar to the observations at 15:00 BJT, Na (outside cloud) and Na (interstitial aerosol) near 3000 m were higher. The low temperature (T = 7.75 °C) and high humidity (RH = 70 %) of the cloud environment (Fig. 4g) were conducive to the activation of aerosol. The maximum value of Nc reached 395 cm−3. However, the average of Ed was only 17.13 µm due to water vapor contention between cloud droplets.
At 17:00 BJT, the height of the PBL decreased to 730 m. Aerosols were transported above the PBL (Fig. 2h), providing CCN above 2000 m. Nc remained constant with an average of 134 cm−3 (Fig. 2h), while Ed averaged 17.12 µm (Fig. 3h). Under the cooling of the atmosphere and the cooling of the cloud tops at sunset, the Ed near the cloud tops was greater than 30 µm. The temperature inversion layer of 1600–2000 m (Fig. 4h) enhanced cloud droplet growth and hindered aerosol diffusion, causing the Na (interstitial aerosol) to be higher than the Na outside cloud.
At 18:00 BJT, the height of the PBL decreased to 500 m, resulting in the accumulation of aerosols between 900 and 1400 m (Fig. 2i), which led to the formation of small-particle-size cloud droplets, with an average Nc of 273 cm−3 and an average Ed of 16.67 µm (Fig. 3i). Similar to the observations at 17:00 BJT, the atmospheric temperature above 1400 m was high (Fig. 4i), and cloud droplet evaporation caused Na (interstitial aerosol) to be close to or greater than Na (outside cloud).
At 20:00 BJT, there were upward flows between 1000 and 1500 m (Fig. 5d). The abundance of CCN and low temperature (Fig. 4j) promoted the formation and growth of cloud droplets. The average Nc was 194 cm−3 (Fig. 2j), higher than the Nc observed from 10:00 to 13:00 BJT. LWC and Ed gradually increased with height (Fig. 3j). LWC rose from 0.02 to 0.64 g m−3. Ed increased from 7.52 to 29.59 µm.
The cloud height is normalized, and the relative height of the cloud is set as Zn (0 ≤ Zn ≤ 1). Zn < 0.33 is the lower cloud layer, 0.33 ≤ Zn < 0.67 is the middle cloud layer, and Zn ≥ 0.67 is the upper cloud layer. The concentration spectra of cloud interstitial aerosol numbers (Fig. 6a–c) and cloud droplet numbers (Fig. 6d–f) at different locations at different times were obtained.
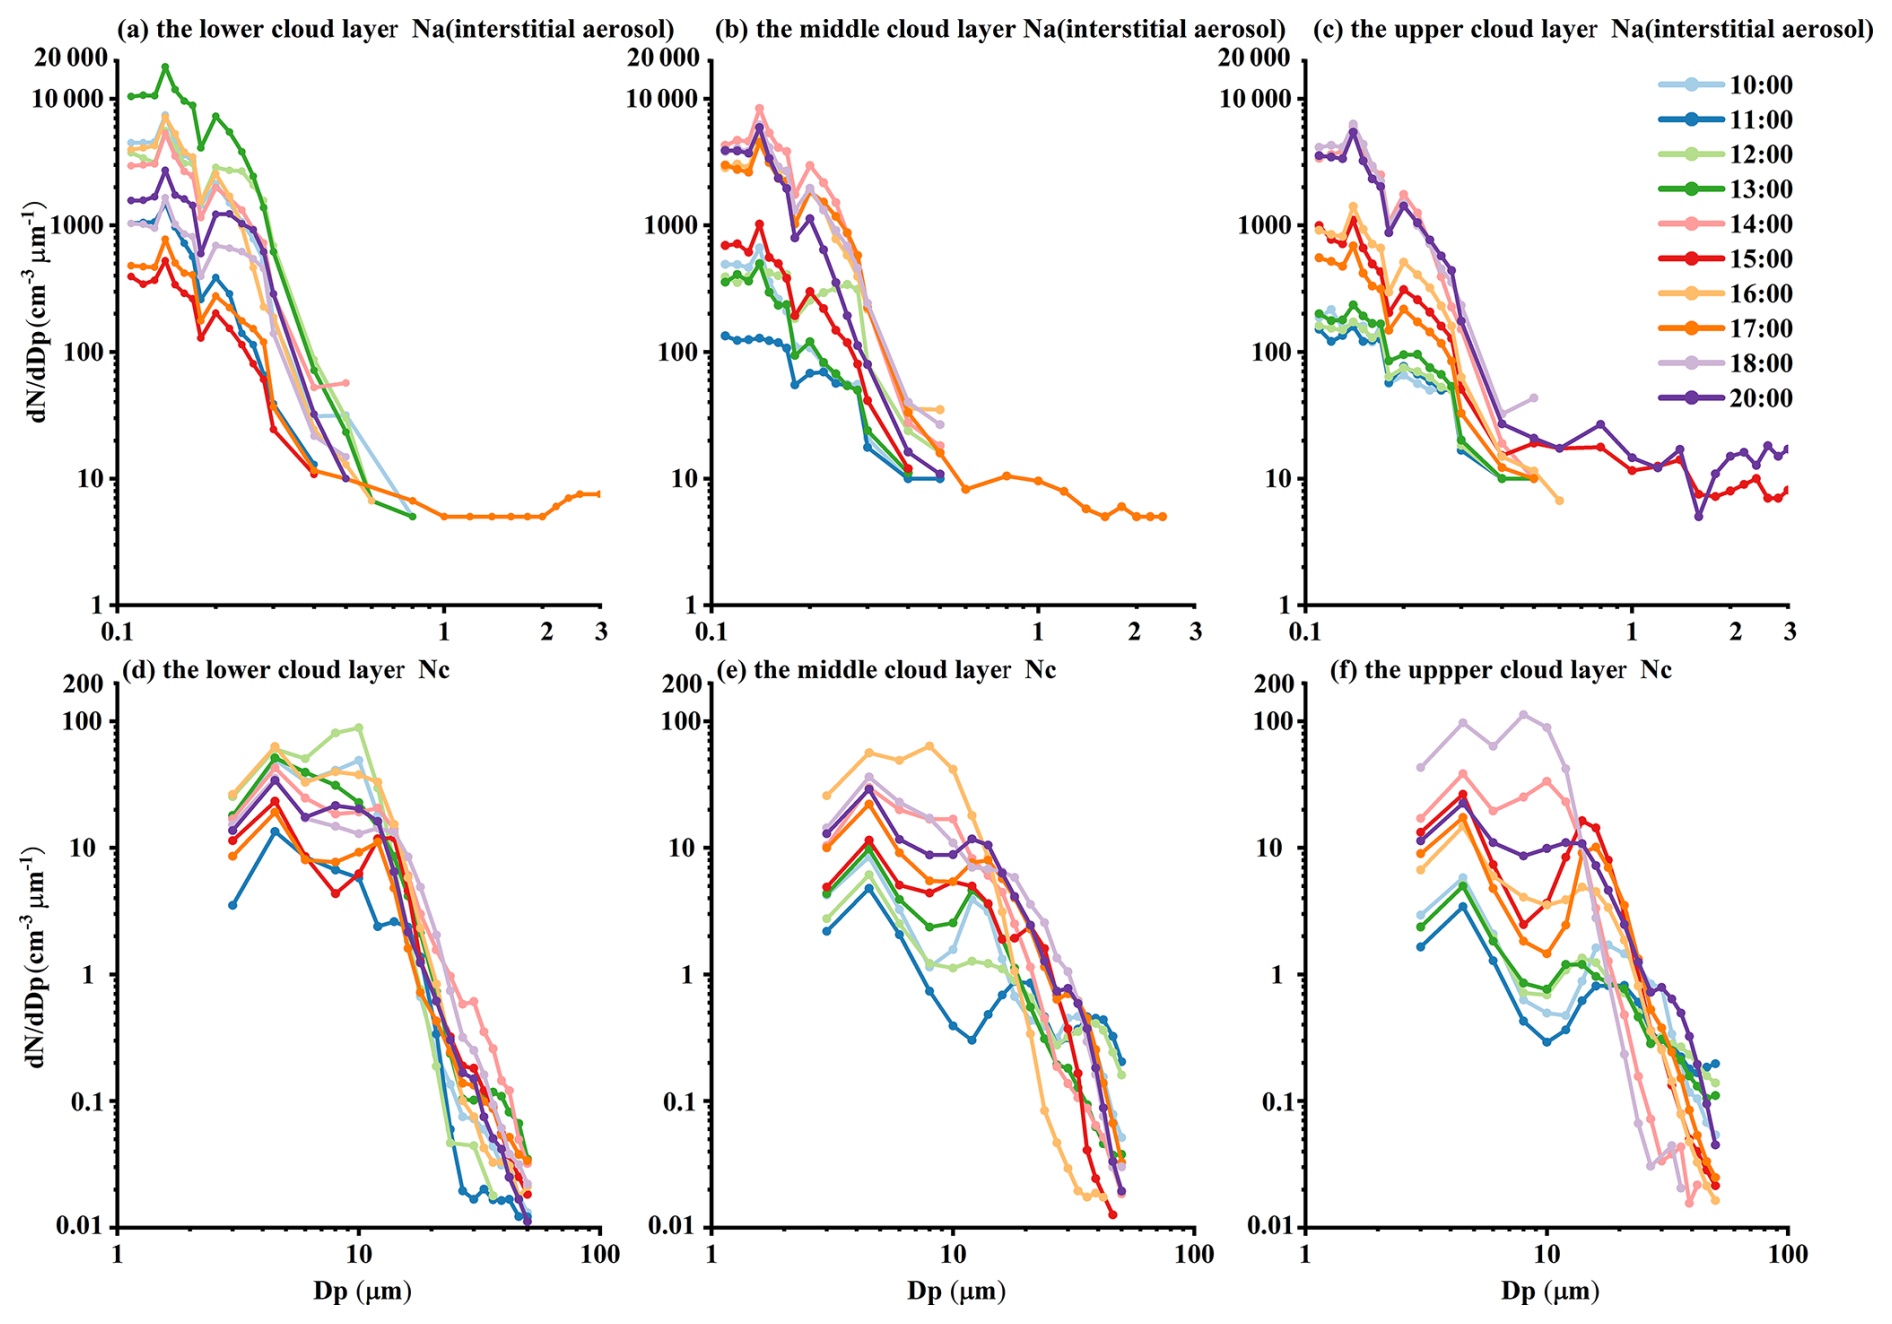
Figure 6Cloud interstitial aerosol number concentration spectrum and cloud droplet number concentration spectrum. Panels (a)–(c) show the aerosol spectrum of lower cloud, middle cloud, and upper cloud, and panels (d)–(f) show the cloud droplet spectrum of lower cloud, middle cloud, and upper cloud, respectively.
From 10:00 to 13:00 BJT, the interstitial aerosol particle size in the cloud's lower layer was concentrated below 0.4 µm. In comparison, the cloud droplet diameter was primarily concentrated below 20 µm, with few large-particle-size cloud droplets (Fig. 6a, d). In the middle cloud layer, Na across all particle size ranges had decreased to below 1000 . Nc for particles smaller than 20 µm has decreased, while Nc for particles larger than 20 µm exceeded 0.1 (Fig. 6b, e). Na in the upper cloud layer was minimal compared to the middle and lower layers. Sufficient water vapor (LWC = 0.14 g m−3, Fig. 3a–c) and low temperature (T = 11.72 °C, Fig. 4a–c) promote the growth of cloud droplets, resulting in fewer Nc for particles larger than 20 µm in the upper layer (Fig. 6c, f) compared to the middle layer.
From 14:00 to 16:00 BJT, aerosols diffused upward with the increase in the PBL, leading to a decrease in Na in the cloud's lower layer (Fig. 6a, d). The upward transport of aerosols caused the upper-level Na of the cloud to be higher than that observed from 10:00 to 13:00 BJT. This change increased the Nc of droplets with diameters greater than 20 µm (Fig. 6b–c, e–f). Newly formed cloud droplets competed for water vapor. Nc of droplets larger than 30 µm decreased, while Nc of smaller droplets increased.
From 17:00 to 20:00 BJT, the height of the PBL decreased. Na increased, and Nc of large droplets decreased. Aerosols retained at the top of the PBL provided CCN for the cloud's middle and upper layers (Fig. 6b–c, e–f). During this period, Nc was higher than observed from 10:00 to 13:00 BJT. The increase in Nc may be attributed to the rise in Nc of droplets smaller than 20 µm.
3.3 Verification of the Twomey effect
Previous studies have shown two sources of aerosols in Guangxi, namely the land and the ocean, where air masses from land will bring higher aerosol particle number concentrations (Liu et al., 2024). According to the classification of air mass sources, the frequency distributions of Na (interstitial aerosol), Nc, LWC, and Ed under the influence of land and ocean air masses were obtained (Fig. 7).
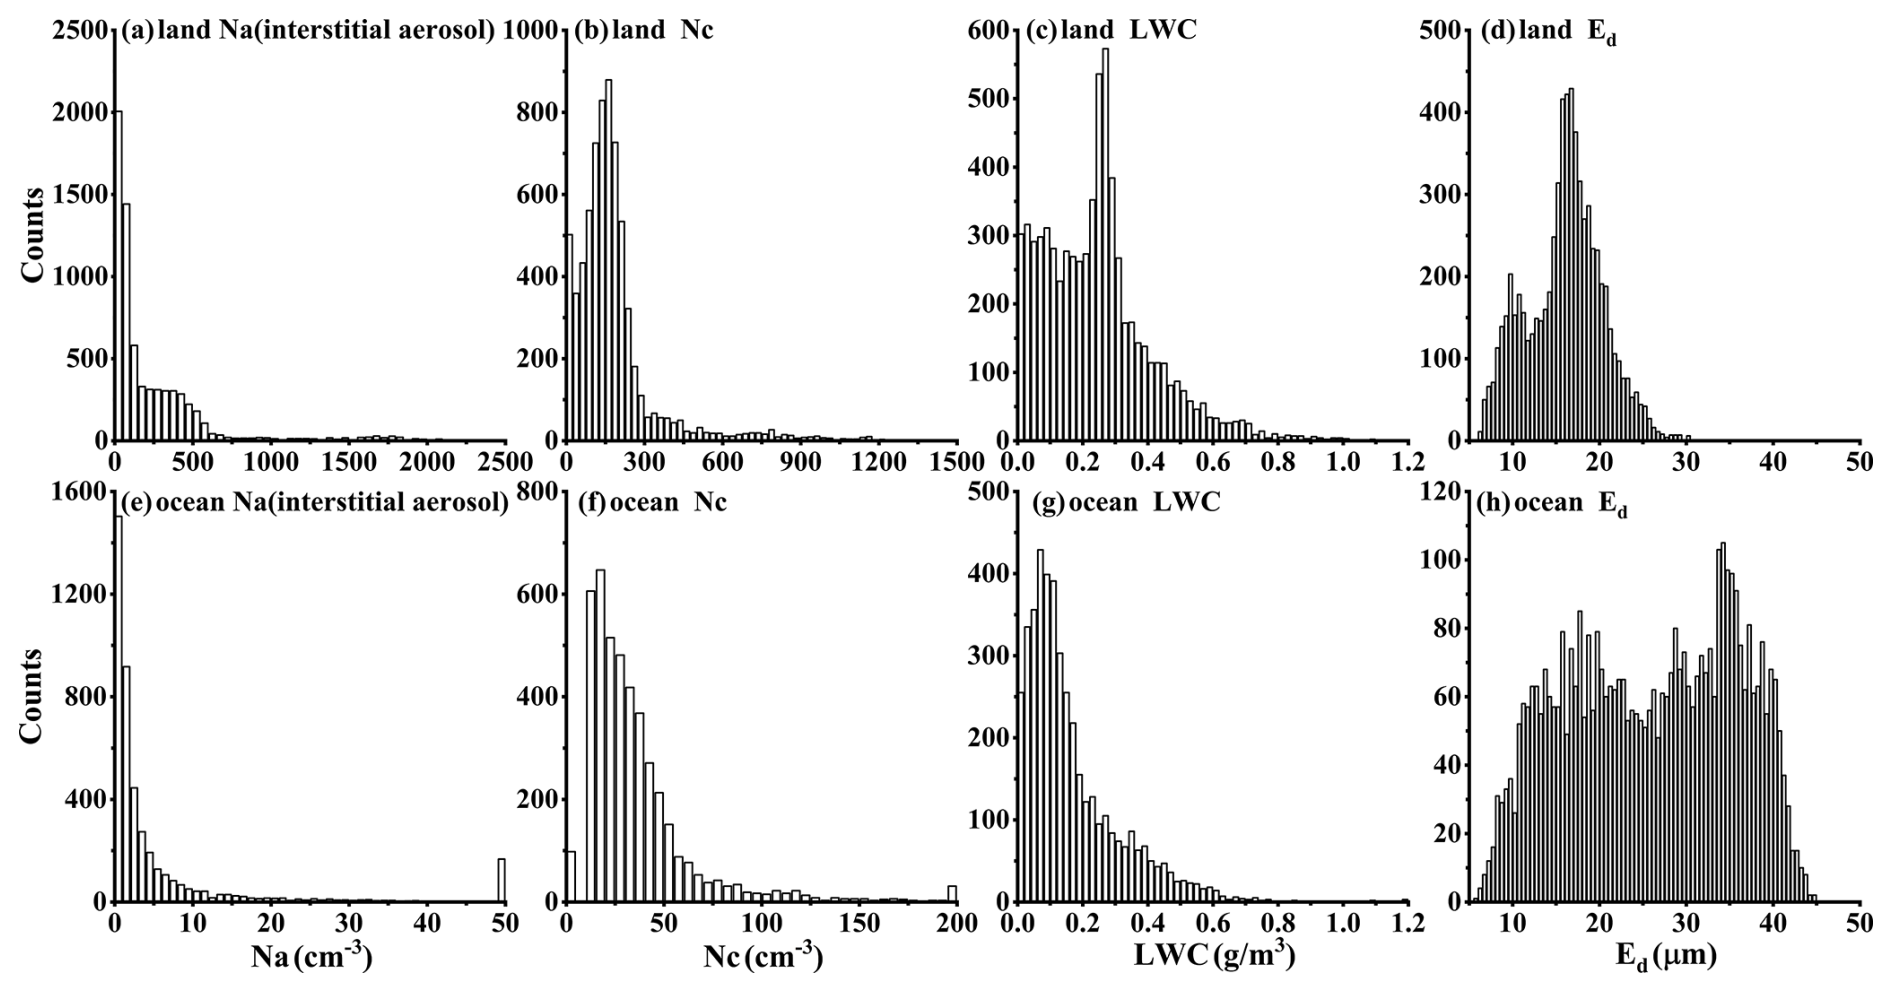
Figure 7The distributions of cloud interstitial aerosol number concentration (a, e), cloud droplet number concentration (b, f), LWC (c, g), and cloud droplet effective diameter (d, h) under different air mass sources. The y axis represents the number of samples.
Under the influence of land air mass, Na (interstitial aerosol) was less than 500 cm−3, and Nc was high. The frequency distribution of Ed was unimodal, mainly concentrated in the range of 16–18 µm (Fig. 7a). Under the influence of ocean air mass, Na (interstitial aerosol) was mainly less than 20 cm−3. Nc was primarily distributed in the range of 10 to 50 cm−3. Ed was significantly higher than that under the influence of land air mass. Ed presented a bimodal distribution with peak values of 17.75 and 34.25 µm (Fig. 7b).
In addition to the influence of the air mass source, the vertical distribution of Na is also affected by PBL. We selected two aircraft observation data on 29 October and 2 November to analyze the influence of the PBL on the cloud microphysical quantities. The observed cloud base height was lower than the heights of the PBL, and the cloud top height was > 1500 m. The clouds crossed the top of the PBL, and the cloud thickness was similar (about 2500 m).
According to the vertical profiles of the aerosol number concentration spectrum (Fig. 8a–b), there were significant differences between the two Na profiles. In the height affected by the PBL (below 1500 m), aerosol pollution occurred on 29 October (Na > 1000 cm−3), and the atmosphere was clean on 2 November (Na < 600 cm−3). In the upper atmosphere (above 1500 m), aerosol pollution (Na < 200 cm−3) occurred on 2 November compared to 29 October (Na < 100 cm−3).
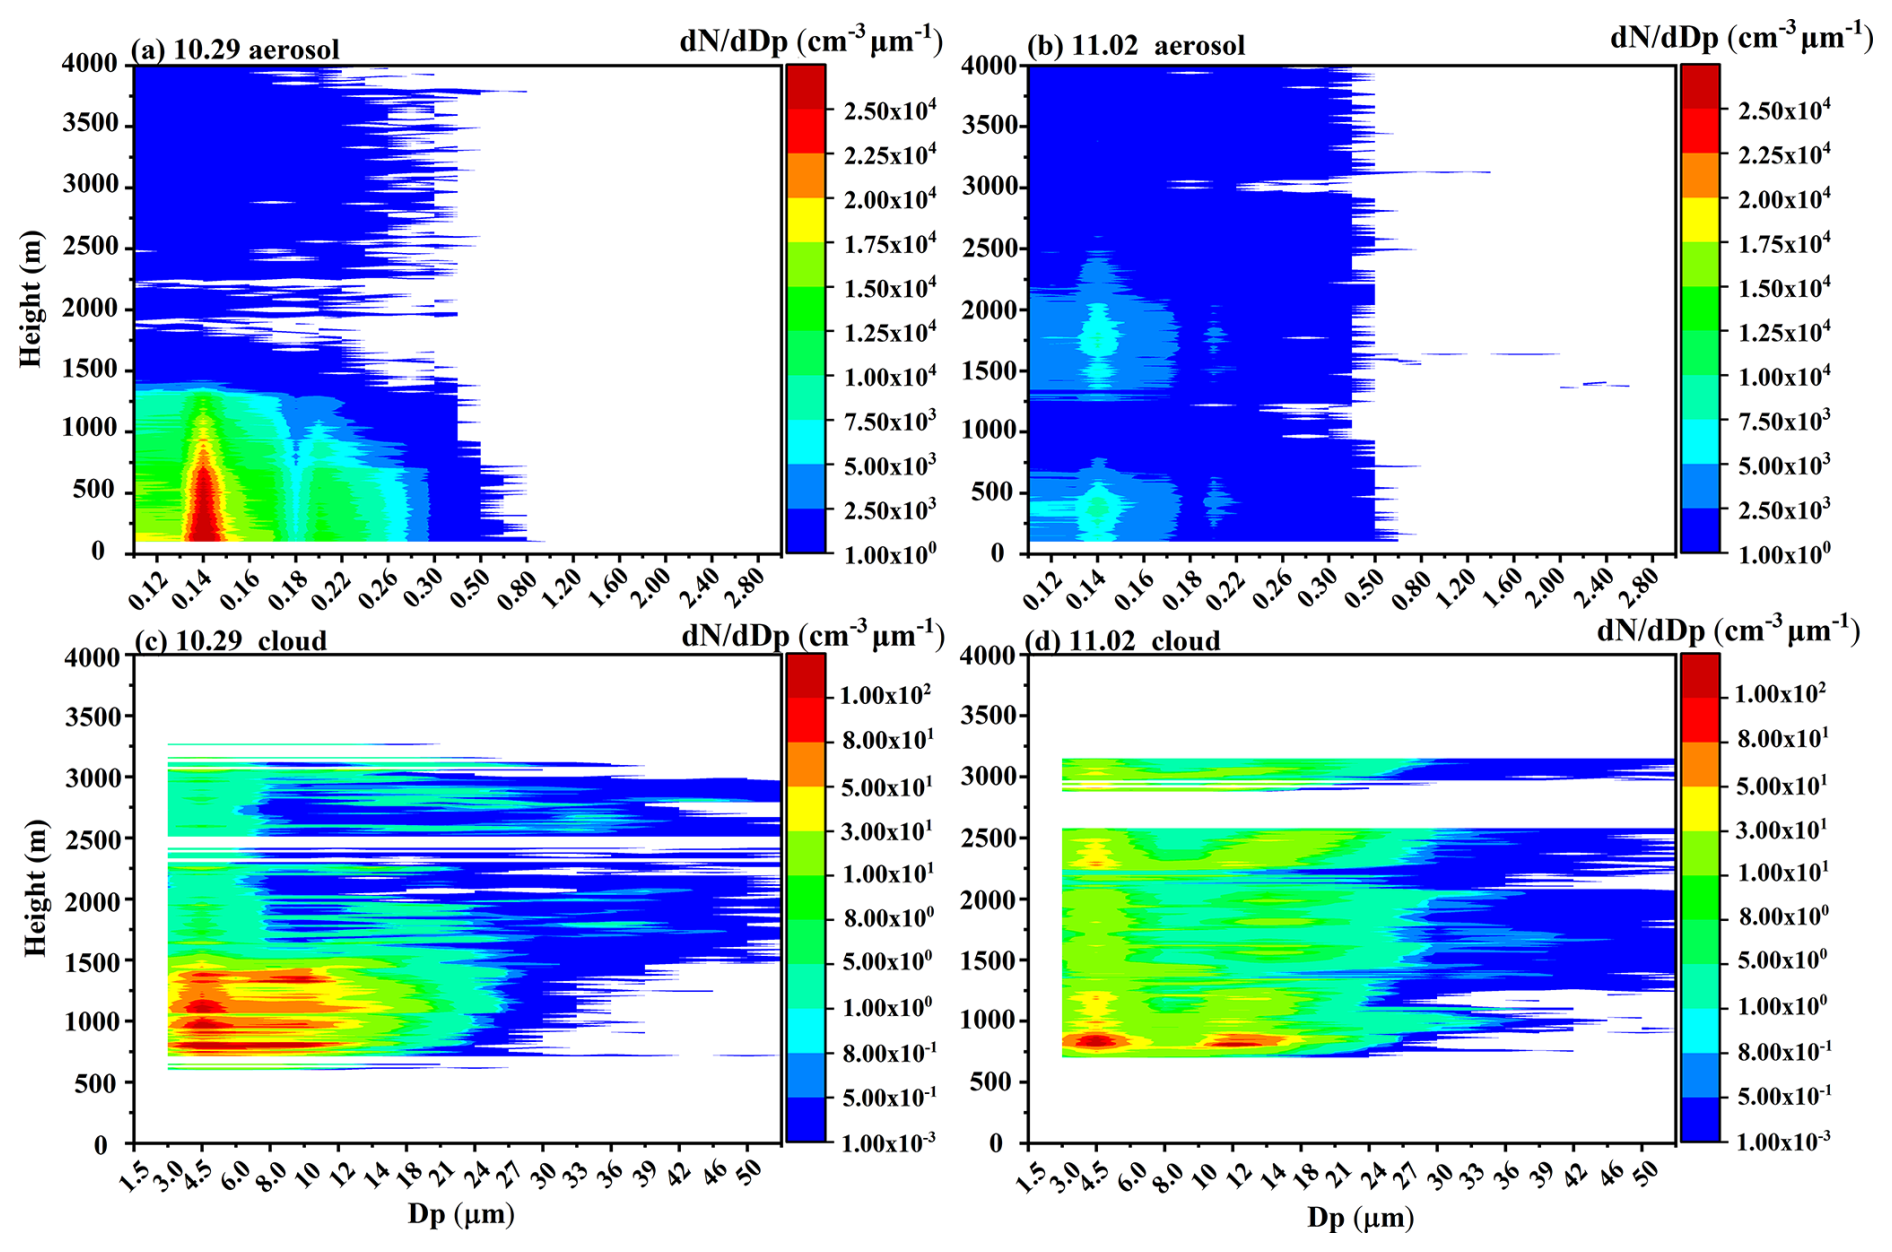
Figure 8Vertical profiles of aerosol number concentration spectra (a, b) and cloud droplet number concentration spectra (c, d) on 29 October and 2 November.
On 29 October, the aerosol pollution in the PBL was severe (Fig. 9a, Na = 1331 cm−3). The aerosol number concentration spectrum exhibited a bimodal distribution, with peak diameters of 0.14 and 0.22 µm (Fig. 8a). The atmosphere contained sufficient CCN, resulting in a large Nc (Fig. 9a, Nc = 460 cm−3). As shown in the cloud droplet number concentration spectrum (Fig. 8c), most cloud droplets were concentrated in the size range of 3–24 µm (Fig. 8c). Ed was 9.69 µm (Fig. 9e), primarily because many cloud droplets competed for water vapor, making it difficult for them to grow into larger droplets. A strong inversion layer at 1500 m (Fig. 9c) hindered the upward transport of aerosols. Consequently, Na above 1500 m was low, leading to a reduced Nc, with an average of only 35 cm−3. Figure 8c showed that cloud droplet sizes within the PBL primarily range from 8 to 21 µm. In contrast, above the PBL, cloud droplet sizes are mainly distributed below 8 µm and above 21 µm, with an average effective diameter (Ed) of 25.28 µm (Fig. 9e). These large-particle-size cloud droplets likely originated from the collision and growth of droplets within the 8.0 to 21 µm range.
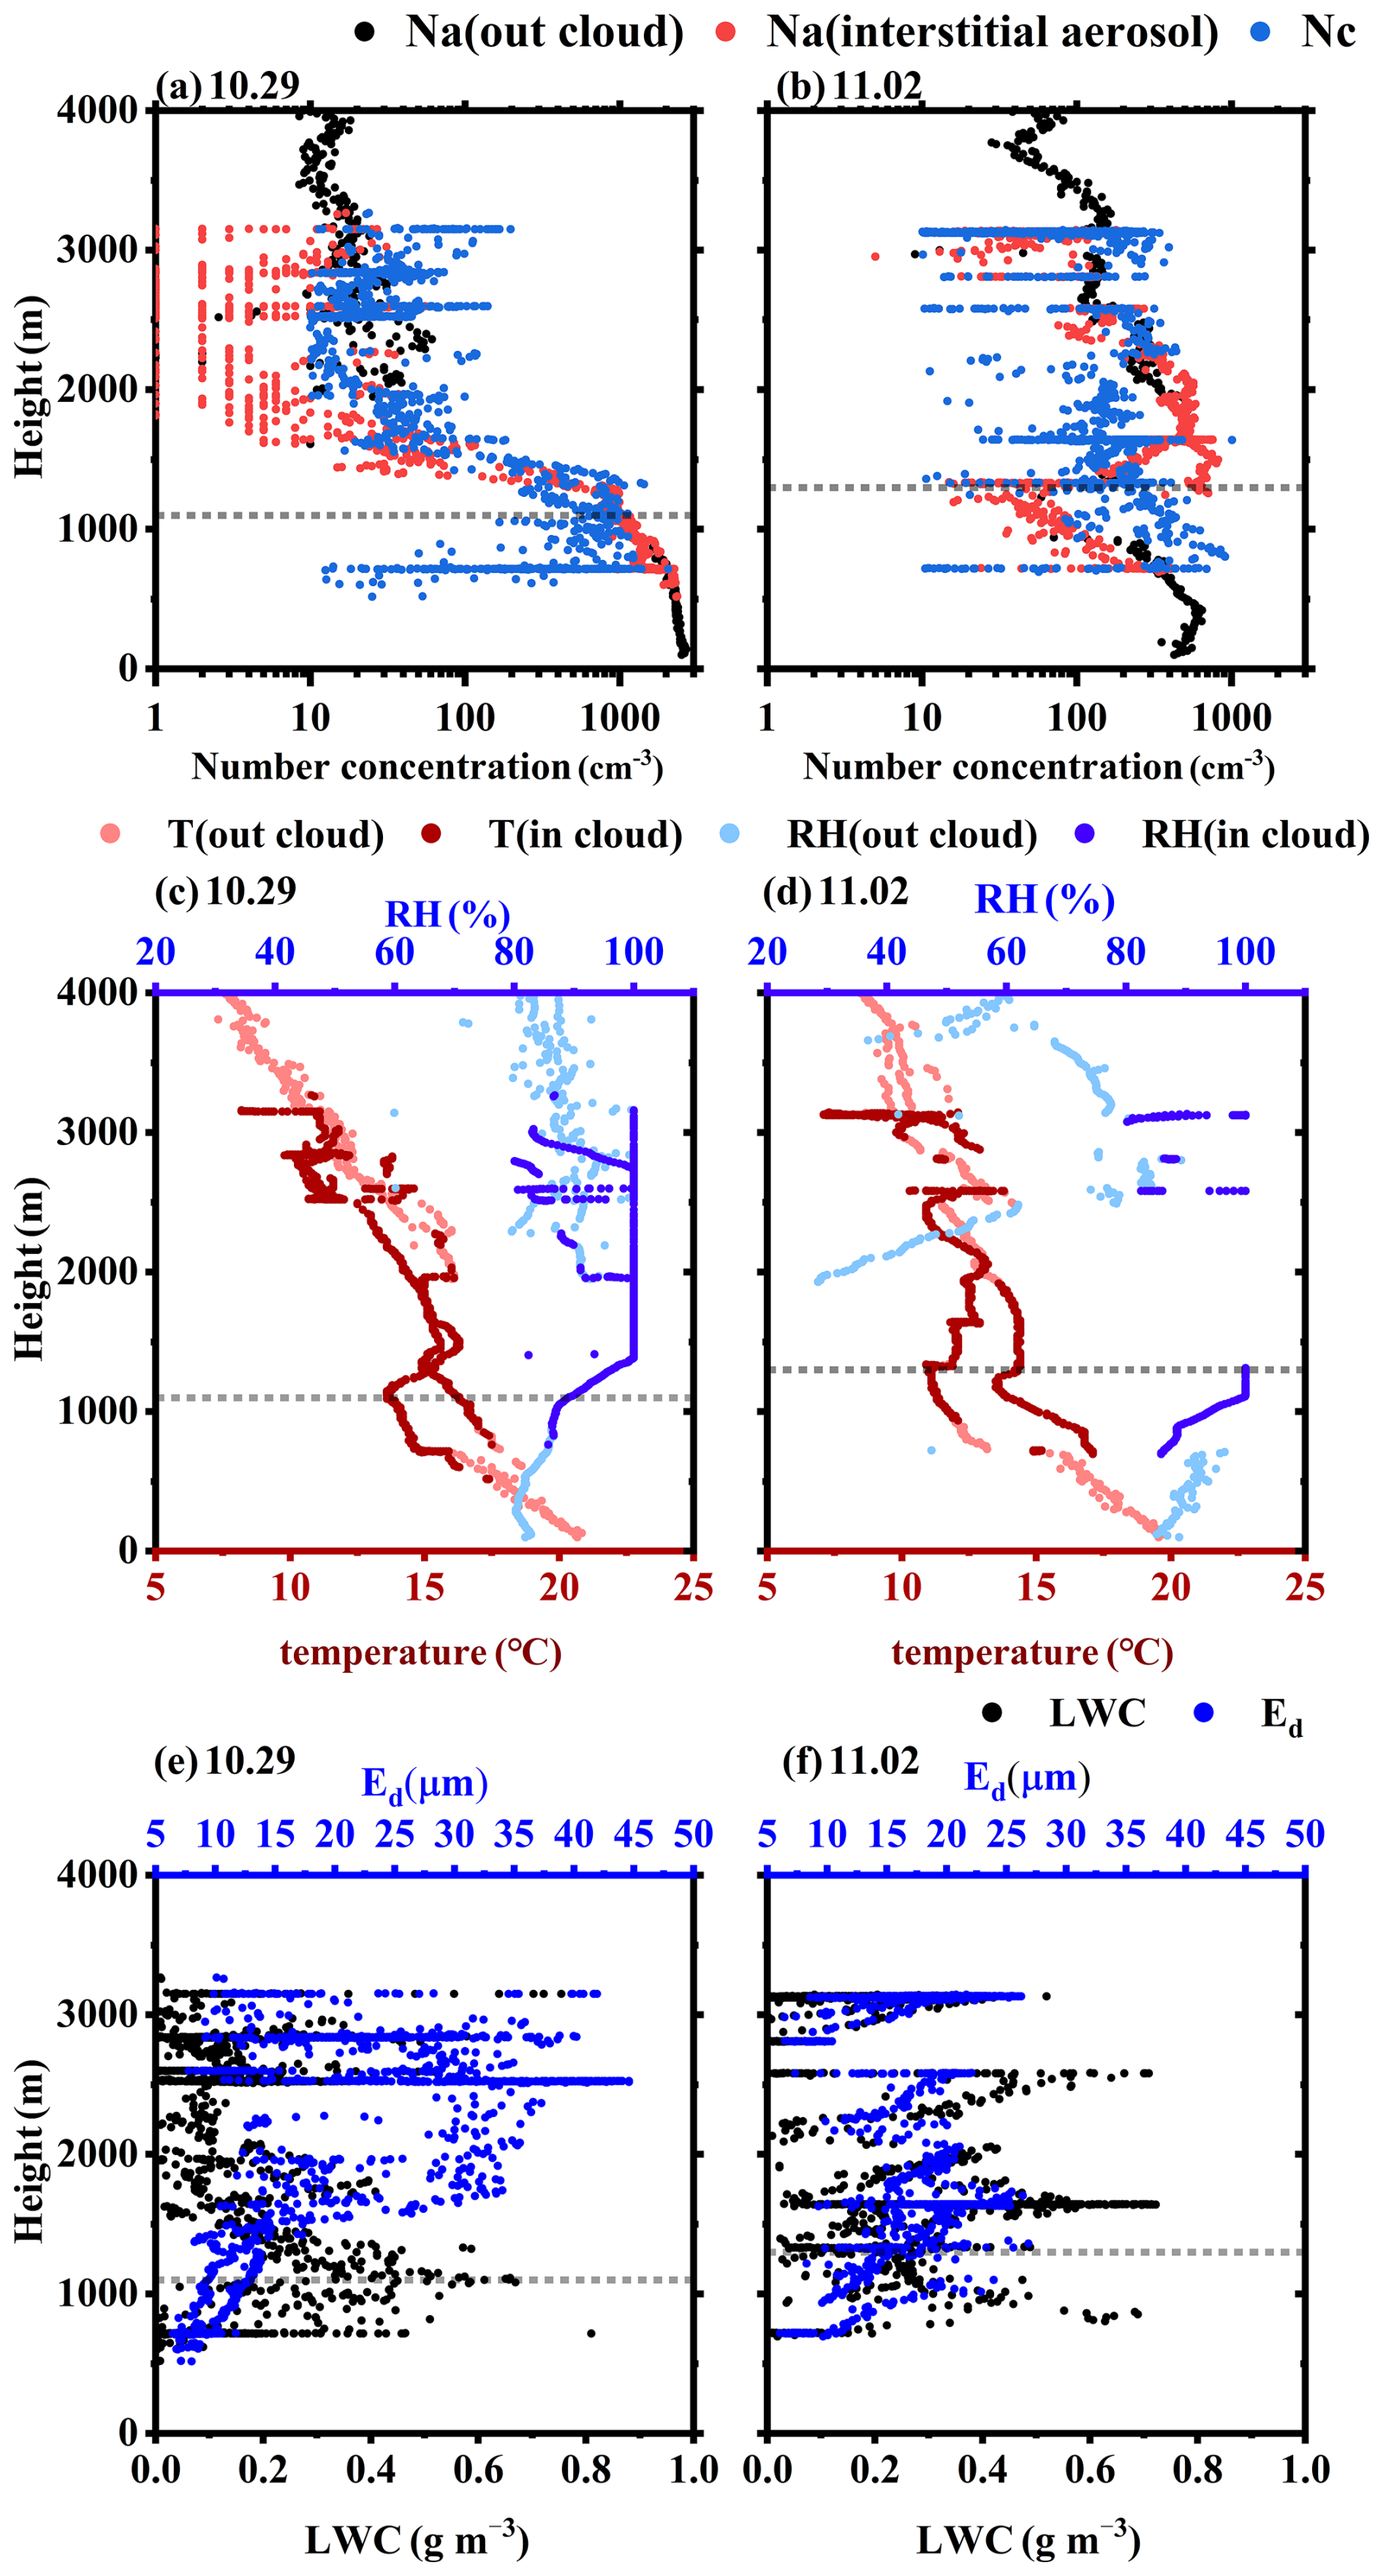
Figure 9Vertical profiles of outside aerosol concentration, cloud interstitial aerosol concentration, and cloud droplet concentration (a, b); temperature inside and outside the cloud and relative humidity inside and outside the cloud (c, d); and LWC and effective droplet diameters (e, f) on 29 October and 2 November. The dashed black line represents the height of the PBL.
On 2 November, Na in the PBL (Fig. 9b, Na = 405 cm−3) was slightly higher than Na in the upper air (Na = 220 cm−3). The Nc in the PBL (Nc = 243 cm−3) was higher than that above the PBL (Nc = 124 cm−3). The concentration spectra of cloud droplet numbers exhibited a bimodal distribution (Fig. 8d). The presence of a large number of small cloud droplets in the PBL hinders the growth of larger droplets, resulting in a lower number of large cloud droplets (Dp > 18 µm) in the PBL compared to the upper air. Ed in the PBL (Fig. 9f, Ed = 12.89 µm) was lower than in the upper air (Ed = 17.94 µm). The inversion layer (Fig. 9d, about 750 m in thickness) above the top of the PBL enhanced the evaporation activity of cloud droplets, leading to a lower Nc at this height compared to other heights and a higher Na (interstitial aerosol) than that observed at other heights.
To understand whether the relationship between aerosol and cloud in Guangxi is consistent with the Twomey effect, we classified the in-cloud data below 1000 m on 29 October and 2 November. We calculated the FIE index of LWC in different ranges (Fig. 10). The equation within each panel of Fig. 10 represents a fitted curve for the data, indicating the relationship between Na and Ed. The relationship between Na and Ed can be expressed as Ed = . The results showed that Na and Ed were always negatively correlated, regardless of low LWC conditions or high LWC conditions. Therefore, the relationship between aerosol and stratocumulus in Guangxi is consistent with the Twomey effect, and Ed decreases with the increase in Na.
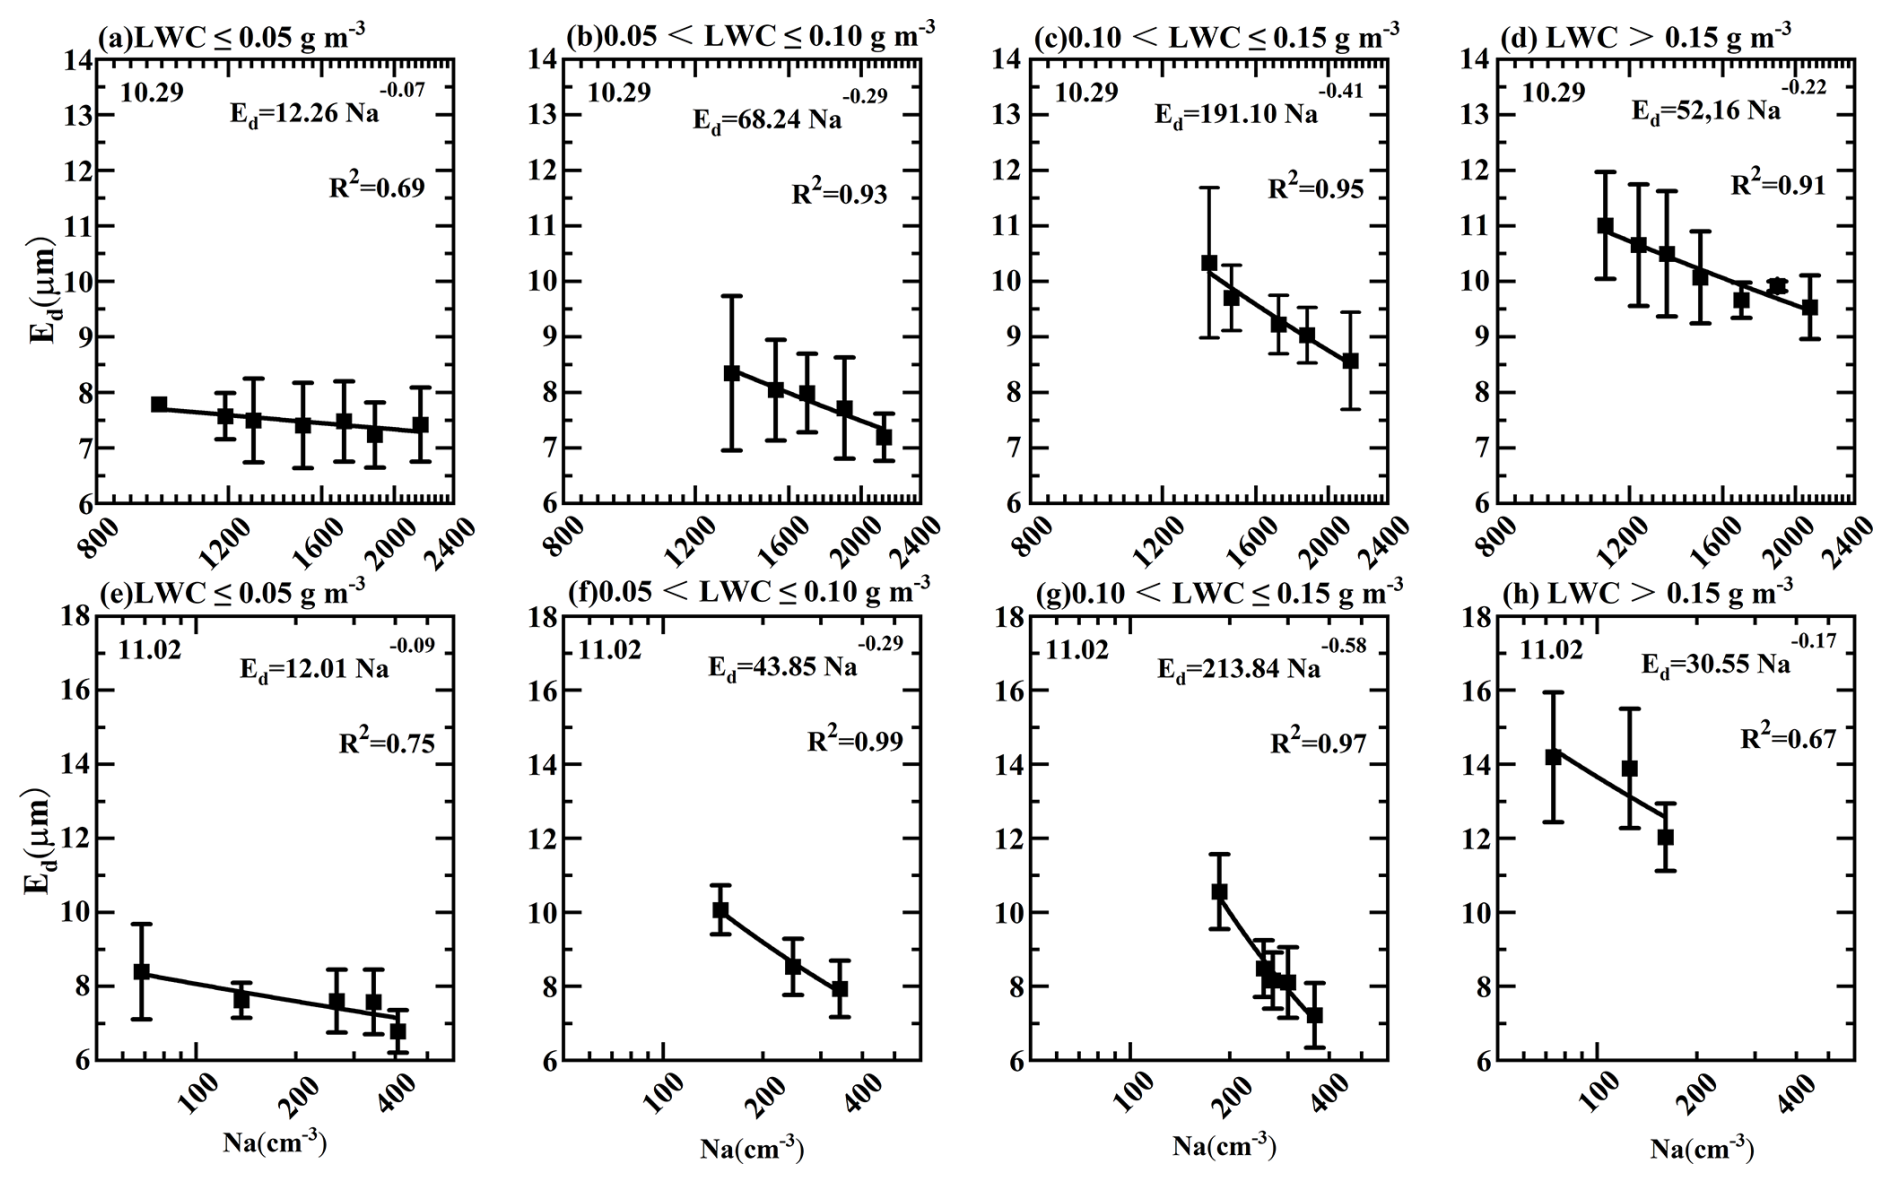
Figure 10Correlation between aerosol number concentration and effective droplet diameter in the range of 0–0.05, 0.05–0.10, 0.10–0.15, and > 0.15 g m−3 LWC. Panels (a)–(d) show data from 29 October, and panels (e)–(f) show data from 2 November. R2 is the correlation coefficient. The significance level α was set at 0.05, and the P value < 0.05 was obtained.
This study provides the vertical profiles of stratocumulus microphysical quantities, the number concentration spectrum, and meteorological parameters over Guangxi in autumn using the aircraft observation data of nine flights. The daylight variation of cloud microphysical characteristics at different altitudes is described, and the effects of air mass source on cloud microphysical quantities are discussed. The results are as follows:
- 1.
Below 1500 m in Guangxi, Na and Nc gradually decreased with the increase in altitude. Aerosols were mainly concentrated under the PBL. Nc was large, with an average of 407 cm−3. Between 1500 and 3300 m, the value of Na remained low, with Nc staying below 200 cm−3 and not changing with height. With the increase in height, Ed first increased and then remained constant and finally increased again. The Ed at the cloud top was 2.75 times that at the cloud base. The inversion layer at the top of the PBL hindered the increase in the cloud droplet particle size. Compared with other regions in China, LWC was high, with an average value of 0.22 g m−3, and LWC variation was independent of height.
- 2.
The vertical distribution of microphysical quantities of stratocumulus in autumn in this region had noticeable daylight variation, mainly influenced by the daylight variation of the vertical distribution of aerosols. From 10:00 to 13:00 BJT, aerosols were primarily concentrated at low altitudes, which led to smaller-particle-size cloud droplets in the lower cloud layer (Nc = 313 cm−3, Ed = 10.78 µm). From 14:00 to 16:00 BJT, due to the combined effects of the lifting of the top of the PBL and updrafts, the low-level aerosols were diluted, leading to a decrease in the number of cloud droplets in the lower layer (Nc = 184 cm−3). From 17:00 to 20:00 BJT, the descending motion and downdrafts of the PBL increased the number of small cloud droplets in the lower layer (Ed = 12.15 µm). From 10:00 to 13:00 BJT, Nc in the middle and upper clouds was low, while the particle size was large. From 14:00 to 20:00 BJT, the upward transport of aerosols near the surface and the formation of a high concentration aerosol layer (600–1300 m) increased the number of small-particle-size cloud droplets in the middle and upper clouds.
- 3.
The air mass source and PBL influenced the distribution characteristics of cloud microphysical quantities by influencing Na. Nc under the influence of the land air mass was 5.06 times that of the ocean air mass, while Ed under the influence was 1.62 times that of the land air mass. When there was a high number concentration of aerosols below PBL, the cloud droplet number concentration spectrum was unimodal, and the cloud droplet size was concentrated below 20 µm. Above the PBL, the cloud droplet number concentration spectrum was bimodal, and the number of large-particle-size cloud droplets (cloud droplet diameter > 30 µm) was more than that in the PBL. The relationship between aerosol and cloud in the Guangxi region was consistent with the Twomey effect. Ed and Na were negatively correlated in different LWC ranges, and the FIE ranged from −0.07 to −0.58.
In conclusion, our findings highlight the significant influence of aerosol concentrations and air mass origins on the microphysical properties of stratocumulus clouds over Guangxi. The observed daylight and vertical variations in cloud microphysics underscore the complexity of aerosol–cloud interactions in this region. Future research should cover a comprehensive time frame, including nighttime observations, to provide a complete vertical structure of these clouds, the effects of different aerosol types, and their impact on regional climate patterns.
All the aircraft data presented in this article can be accessed through https://doi.org/10.5281/zenodo.13719678 (Wang, 2024). MERRA-2 data are available at https://disc.gsfc.nasa.gov/daac-bin/FTPSubset2.pl (Bosilovich et al., 2015).
SL, HW, DZ, and MH designed this study. WZ, YD, ZZ, and PC implemented the experiment and sample analysis. SL analyzed the data and wrote the paper. HW, DZ, and TZ were responsible for funding acquisition and writing (review and editing). YK and ZW was responsible for data curation. All co-authors proofread and commented on the paper.
The contact author has declared that none of the authors has any competing interests.
Publisher's note: Copernicus Publications remains neutral with regard to jurisdictional claims made in the text, published maps, institutional affiliations, or any other geographical representation in this paper. While Copernicus Publications makes every effort to include appropriate place names, the final responsibility lies with the authors.
The authors are grateful for the assistance of colleagues for sample collection. We would like to thank the GMAO for MERRA-2 data (https://disc.gsfc.nasa.gov/datasets?keywords=MERRA-2, last access: 30 June 2024).
This research has been supported by the National Key Research and Development Program of China (grant no. 2022YFC3701204), the National Natural Science Foundation of China (grant nos. 42075084 and 42475207), the Natural Science Foundation of Jiangsu Province (grant no. BK20231300), and the Beijing Municipal Science and Technology Commission (grant no. Z221100005222016).
This paper was edited by Sergio Rodríguez and reviewed by two anonymous referees.
Albrecht, B. A.: Aerosols, cloud microphysics, and fractional cloudiness, Science, 245, 1227–1230, https://doi.org/10.1126/science.245.4923.1227, 1989.
Almeida, G. P., Brito, J., Morales, C. A., Andrade, M. F., and Artaxo, P.: Measured and modelled cloud condensation nuclei (CCN) concentration in São Paulo, Brazil: the importance of aerosol size-resolved chemical composition on CCN concentration prediction, Atmos. Chem. Phys., 14, 7559–7572, https://doi.org/10.5194/acp-14-7559-2014, 2014.
Betts, A. K.: Coupling of water vapor convergence, clouds, precipitation, and land-surface processes, J. Geophys. Res.-Atmos., 112, D10108, https://doi.org/10.1029/2006JD008191, 2007.
Bosilovich, M. G., Akella, S., Coy, L., Cullather, R., Draper, C., Gelaro, R., Kovach, R., Liu, Q., Molod, A., Norris, P., Wargan, K., Chao, W., Reichle, R., Takacs, L., Vikhliaev, Y., Bloom, S., Collow, A., Firth, S., Labow, G., Partyka, G., Pawson, S., Reale, O., Schubert, S. D., Suarez, M., and Global Modeling and Assimilation Office (GMAO): MERRA-2, Goddard Earth Sciences Data and Information Services Center (GES DISC), Greenbelt, MD, USA, https://disc.gsfc.nasa.gov/daac-bin/FTPSubset2.pl (last access: 7 January 2024), 2015.
Che, Y., Zhang, J., Fang, C., Zhou, X., Xue, W., Hu, X., Duan, J., Li, W., Gao, Y., Lu, G., Zhao, D., and Zhao, C.: Aerosol and cloud properties over a coastal area from aircraft observations in Zhejiang, China, Atmos. Environ., 267, 118771, https://doi.org/10.1016/j.atmosenv.2021.118771, 2021.
Chen, Y.-C., Wang, S.-H., Min, Q., Lu, S., Lin, P.-L., Lin, N.-H., Chung, K.-S., and Joseph, E.: Aerosol impacts on warm-cloud microphysics and drizzle in a moderately polluted environment, Atmos. Chem. Phys., 21, 4487–4502, https://doi.org/10.5194/acp-21-4487-2021, 2021.
Collaud Coen, M., Weingartner, E., Apituley, A., Ceburnis, D., Fierz-Schmidhauser, R., Flentje, H., Henzing, J. S., Jennings, S. G., Moerman, M., Petzold, A., Schmid, O., and Baltensperger, U.: Minimizing light absorption measurement artifacts of the Aethalometer: evaluation of five correction algorithms, Atmos. Meas. Tech., 3, 457–474, https://doi.org/10.5194/amt-3-457-2010, 2010.
de Boer, G., Tripoli, G. J., and Eloranta, E. W.: Preliminary comparison of CloudSAT-derived microphysical quantities with ground-based measurements for mixed-phase cloud research in the Arctic, J. Geophys. Res.-Atmos., 113, D00A06, https://doi.org/10.1029/2008JD010029, 2008.
Dusek, U., Frank, G. P., Hildebrandt, L., Curtius, J., Schneider, J., Walter, S., Chand, D., Drewnick, F., Hings, S., Jung, D., Borrmann, S., and Andreae, M. O.: Size matters more than chemistry for cloud-nucleating ability of aerosol particles, Science, 312, 1375–1378, https://doi.org/10.1126/science.1125261, 2006.
Feingold, G., Remer, L. A., Ramaprasad, J., and Kaufman, Y. J.: Analysis of smoke impact on clouds in Brazilian biomass burning regions: An extension of Twomey's approach, J. Geophys. Res.-Atmos., 106, 22907–22922, https://doi.org/10.1029/2001JD000732, 2001.
Feingold, G., Eberhard, W. L., Veron, D. E., and Previdi, M.: First measurements of the Twomey indirect effect using ground-based remote sensors, Geophys. Res. Lett., 30, 1287, https://doi.org/10.1029/2002GL016633, 2003.
Ferek, R. J., Hegg, D. A., Hobbs, P. V., Durkee, P., and Nielsen, K.: Measurements of ship-induced tracks in clouds off the Washington coast, J. Geophys. Res.-Atmos., 103, 23199–23206, https://doi.org/10.1029/98JD02121, 1998.
Ge, J., Wang, Z., Wang, C., Yang, X., Dong, Z., and Wang, M.: Diurnal variations of global clouds observed from the CATS spaceborne lidar and their links to large-scale meteorological factors, Clim. Dynam., 57, 2637–2651, https://doi.org/10.1007/s00382-021-05829-2, 2021.
Gunthe, S. S., King, S. M., Rose, D., Chen, Q., Roldin, P., Farmer, D. K., Jimenez, J. L., Artaxo, P., Andreae, M. O., Martin, S. T., and Pöschl, U.: Cloud condensation nuclei in pristine tropical rainforest air of Amazonia: size-resolved measurements and modeling of atmospheric aerosol composition and CCN activity, Atmos. Chem. Phys., 9, 7551–7575, https://doi.org/10.5194/acp-9-7551-2009, 2009.
Han, Q., Rossow, W. B., and Lacis, A. A.: Near-global survey of effective droplet radii in liquid water clouds using ISCCP data, J. Climate., 7, 465–497, https://doi.org/10.1175/1520-0442(1994)007<0465:NGSOED>2.0.CO;2, 1994.
Harikishan, G., Padmakumari, B., Maheskumar, R. S., Pandithurai, G., and Min, Q. L.: Aerosol indirect effects from ground-based retrievals over the rain shadow region in Indian subcontinent, J. Geophys. Res.-Atmos., 121, 2369–2382, https://doi.org/10.1002/2015JD024577, 2016.
Jose, S., Nair, V. S., and Babu, S. S.: Anthropogenic emissions from South Asia reverses the aerosol indirect effect over the northern Indian Ocean, Sci. Rep., 10, 18360, https://doi.org/10.1038/s41598-020-74897-x, 2020.
Kennedy, A. D., Dong, X., Xi, B., Xie, S., Zhang, Y., and Chen, J.: A comparison of MERRA and NARR reanalyses with the DOE ARM SGP data, J. Climate, 24, 4541–4557, https://doi.org/10.1175/2011JCLI3978.1, 2001.
Kim, B. G., Schwartz, S. E., Miller, M. A., and Min, Q.: Effective radius of cloud droplets by ground-based remote sensing: Relationship to aerosol, J. Geophys. Res.-Atmos., 108, 4740, https://doi.org/10.1029/2003JD003721, 2003.
Kim, S. W., Yoon, S. C., Won, J. G., and Choi, S. C.: Ground-based remote sensing measurements of aerosol and ozone in an urban area: A case study of mixing height evolution and its effect on ground-level ozone concentrations, Atmos. Environ., 41, 7069–7081, https://doi.org/10.1016/j.atmosenv.2007.04.063, 2007.
King, M. D., Platnick, S., Menzel, W. P., Ackerman, S. A., and Hubanks, P. A.: Spatial and temporal distribution of clouds observed by MODIS onboard the Terra and Aqua satellites, IEEE T. Geosci. Remote, 51, 3826–3852, https://doi.org/10.1109/TGRS.2012.2227333, 2013.
Kleinman, L. I., Daum, P. H., Lee, Y.-N., Lewis, E. R., Sedlacek III, A. J., Senum, G. I., Springston, S. R., Wang, J., Hubbe, J., Jayne, J., Min, Q., Yum, S. S., and Allen, G.: Aerosol concentration and size distribution measured below, in, and above cloud from the DOE G-1 during VOCALS-REx, Atmos. Chem. Phys., 12, 207–223, https://doi.org/10.5194/acp-12-207-2012, 2012.
Koren, I., Kaufman, Y. J., Rosenfeld, D., Remer, L. A., and Rudich, Y.: Aerosol invigoration and restructuring of Atlantic convective clouds, Geophys. Res. Lett., 32, 14828, https://doi.org/10.1029/2005GL023187, 2005.
Lance, S., Nenes, A., and Rissman, T. A.: Chemical and dynamical effects on cloud droplet number: Implications for estimates of the aerosol indirect effect, J. Geophys. Res.-Atmos., 109, D22208, https://doi.org/10.1029/2004JD004596, 2004.
Li, J., Li, P., Ren, G., Yuan, L., Li, Y., and Yang, J.: Aircraft measurements of aerosol distribution, warm cloud microphysical properties, and their relationship over the Eastern Loess Plateau in China, Tellus B, 71, 1663994, https://doi.org/10.1080/16000889.2019.1663994, 2019.
Li, Z., Li, R., and Li, B.: Analyses on Vertical Microphysical Characteristics of Autumn Stratiform Cloud in Lanzhou Region, Plateau Meteorology, 22, 583–589, https://doi.org/10.3321/j.issn:1000-0534.2003.06.008, 2003.
Liu, S., Wang, H., Zhao, D., Ke, Y., Wu, Z., Shen, L., and Zhao, T.: Aircraft observations of aerosols and BC in autumn over Guangxi Province, China: Diurnal variation, vertical distribution and source appointment, Sci. Total. Environ., 906, 167550, https://doi.org/10.1016/j.scitotenv.2023.167550, 2024.
Liu, T., Liu, Q., Chen, Y., Wang, W., Zhang, H., Li, D., and Sheng, J.: Effect of aerosols on the macro-and micro-physical properties of warm clouds in the Beijing-Tianjin-Hebei region, Sci. Total. Environ., 720, 137618, https://doi.org/10.1016/j.scitotenv.2020.137618, 2020.
Lu, C., Liu, Y., and Niu, S.: Examination of turbulent entrainment-mixing mechanisms using a combined approach, J. Geophys. Res.-Atmos., 116, D20207, https://doi.org/10.1029/2011JD015944, 2011.
Lu, M. L., Conant, W. C., Jonsson, H. H., Varutbangkul, V., Flagan, R. C., and Seinfeld, J. H.: The marine stratus/stratocumulus experiment (MASE): Aerosol-cloud relationships in marine stratocumulus, J. Geophys. Res.-Atmos., 112, D10209, https://doi.org/10.1029/2006JD007985, 2007.
Lu, Z., Liu, X., Zhang, Z., Zhao, C., Meyer, K., Rajapakshe, C., Wu, C., Yang, Z., and Penner, J. E.: Biomass smoke from southern Africa can significantly enhance the brightness of stratocumulus over the southeastern Atlantic Ocean, P. Natl. Acad. Sci. USA, 115, 2924–2929, https://doi.org/10.1073/pnas.1713703115, 2018.
McFarquhar, G. M., Bretherton, C. S., Marchand, R., Protat, A., DeMott, P. J., Alexander, S. P., Roberts, G. C., Twohy, C. H., Toohey, D., Siems, S., Huang, Y., Wood, R., Rauber, R. M., Lasher-Trapp, S., Jensen, J., Stith, J. L., Mace, J., Um, J. U., Järvinen, E., Schnaiter, M., Gettelman, A., Sanchez, K. J., McCluskey, C. S., Russell, L. M., McCoy, I. L., Atlas, R. L., Bardeen, C. G., Moore, K. A., Hill, T. C. J., Humphries, R. S., Keywood, M. D., Ristovski, Z., Cravigan, L., Schofield, R., Fairall, C., Mallet, M. D., Kreidenweis, S. M., Rainwater, B., Alessandro, J. D., Wang, Y., Wu, W., Saliba, G., Levin, E. T., Ding, S., Lang, F, Truong, S. H., Wolff, C., Haggerty, J., Harvey, M. J., Klekociuk, A. R., and McDonald, A.: Observations of clouds, aerosols, precipitation, and surface radiation over the Southern Ocean: An overview of CAPRICORN, MARCUS, MICRE, and SOCRATES, B. Am. Meteorol. Soc., 102, E894–E928, https://doi.org/10.1175/BAMS-D-20-0132.1, 2021.
Miles, N. L., Verlinde, J., and Clothiaux, E. E.: Cloud droplet size distributions in low-level stratiform clouds, J. Atmos. Sci., 57, 295–311, https://doi.org/10.1175/1520-0469(2000)057<0295:CDSDIL>2.0.CO;2, 2000.
Nakajima, T. Y., Uchiyama, A., Takamura, T., Tsujioka, N., Takemura, T., and Nakajima, T.: Comparisons of warm cloud properties obtained from satellite, ground, and aircraft measurements during APEX intensive observation period in 2000 and 2001, J. Meteorol. Soc. Jpn., Ser. II, 83, 1085–1095, https://doi.org/10.2151/jmsj.83.1085, 2005.
Painemal, D., Corral, A. F., Sorooshian, A., Brunke, M. A., Chellappan, S., Afzali Gorooh, V., Ham, S. H., O'Neill, L., Smith Jr., W. L., Tselioudis, G., Wang, H., Zeng, X., and Zuidema, P.: An overview of atmospheric features over the Western North Atlantic Ocean and North American East Coast-Part 2: Circulation, boundary layer, and clouds, J. Geophys. Res.-Atmos., 126, e2020JD033423, https://doi.org/10.1029/2020JD033423, 2021.
Painemal, D., Kato, S., and Minnis, P.: Boundary layer regulation in the southeast Atlantic cloud microphysics during the biomass burning season as seen by the A-train satellite constellation, J. Geophys. Res.-Atmos., 119, 11288–211302, https://doi.org/10.1002/2014JD022182, 2014.
Pyrina, M., Hatzianastassiou, N., Matsoukas, C., Fotiadi, A., Papadimas, C. D., Pavlakis, K. G., and Vardavas, I.: Cloud effects on the solar and thermal radiation budgets of the Mediterranean basin, Atmos. Res., 152, 14–28, https://doi.org/10.1016/j.atmosres.2013.11.009, 2015.
Ramanathan, V. L. R. D., Cess, R. D., Harrison, E. F., Minnis, P., Barkstrom, B. R., Ahmad, E., and Hartmann, D.: Cloud-radiative forcing and climate: Results from the Earth Radiation Budget Experiment, Science, 243, 57–63, https://doi.org/10.1126/science.243.4887.57, 1989.
Rosenfeld, D., Andreae, M. O., Asmi, A., Chin, M., de Leeuw, G., Donovan, D. P., Kahn, R., Kinne, S., Kivekäs, N., Kulmala, M., Lau, W., Schmidt, K. S., Suni, T, Wagner, T., Wild, M., and Quaas, J.: Global observations of aerosol-cloud-precipitation-climate interactions, Rev. Geophys., 52, 750–808, https://doi.org/10.1002/2013RG000441, 2014.
Strapp, J. W., Leaitch, W., and Liu, P.: Hydrated and dried aerosol-size-distribution measurements from the particle measuring systems FSSP-300 probe and the deiced PCASP-100X probe, J. Atmos. Ocean. Tech., 9, 548–555, https://doi.org/10.1175/1520-0426(1992)009<0548:HADASD>2.0.CO;2, 1992.
Su, T., Li, J., Li, C., Xiang, P., Lau, A. K. H., Guo, J., Yang, D., and Miao, Y.: An intercomparison of long-term planetary boundary layer heights retrieved from CALIPSO, ground-based lidar, and radiosonde measurements over Hong Kong, J. Geophys. Res.-Atmos., 122, 3929–3943, https://doi.org/10.1002/2016JD025937, 2017.
Terai, C. R., Bretherton, C. S., Wood, R., and Painter, G.: Aircraft observations of aerosol, cloud, precipitation, and boundary layer properties in pockets of open cells over the southeast Pacific, Atmos. Chem. Phys., 14, 8071–8088, https://doi.org/10.5194/acp-14-8071-2014, 2014.
Twomey, S.: The influence of pollution on the shortwave albedo of clouds, J. Atmos. Sci., 34, 1149–1152, https://doi.org/10.1175/1520-0469(1977)034<1149:TIOPOT>2.0.CO;2, 1977.
Waliser, D. E., Li, J. L., L'Ecuyer, T. S., and Chen, W. T.: The impact of precipitating ice and snow on the radiation balance in global climate models, Geophys. Res. Lett., 38, L06802, https://doi.org/10.1029/2010GL046478, 2011.
Wang, H.: Data for Aircraft observations of aerosol and microphysical quantities of stratocumulus in autumn over Guangxi Province, China: Diurnal variation, vertical distribution and aerosol-cloud relationship, Version v2, Zenodo [data set], https://doi.org/10.5281/zenodo.13719678, 2024.
Wang, Y., Zheng, X., Dong, X., Xi, B., Wu, P., Logan, T., and Yung, Y. L.: Impacts of long-range transport of aerosols on marine-boundary-layer clouds in the eastern North Atlantic, Atmos. Chem. Phys., 20, 14741–14755, https://doi.org/10.5194/acp-20-14741-2020, 2020.
Wehbe, Y., Tessendorf, S. A., Weeks, C., Bruintjes, R., Xue, L., Rasmussen, R., Lawson, P., Woods, S., and Temimi, M.: Analysis of aerosol–cloud interactions and their implications for precipitation formation using aircraft observations over the United Arab Emirates, Atmos. Chem. Phys., 21, 12543–12560, https://doi.org/10.5194/acp-21-12543-2021, 2021.
Wex, H., McFiggans, G., Henning, S., and Stratmann, F.: Influence of the external mixing state of atmospheric aerosol on derived CCN number concentrations, Geophys. Res. Lett., 37, L10805, https://doi.org/10.1029/2010GL043337, 2010.
Wood, R.: Stratocumulus clouds, Mon. Weather. Rev., 140, 2373–2423, https://doi.org/10.1175/MWR-D-11-00121.1, 2012.
Yuan, T., Li, Z., Zhang, R., and Fan, J.: Increase of cloud droplet size with aerosol optical depth: An observation and modeling study, J. Geophys. Res.-Atmos., 113, D04201, https://doi.org/10.1029/2007JD008632, 2008.
Zaveri, R. A., Wang, J., Fan, J., Zhang, Y., Shilling, J. E., Zelenyuk, A., Mei, F., Newsom, R., Pekour, M., Tomlinson, J., Comstock, J. M., Shrinastava, M., Fortner, E., Machado, L. T., Artaxo, P., and Martin, S. T.: Rapid growth of anthropogenic organic nanoparticles greatly alters cloud life cycle in the Amazon rainforest, Sci. Adv., 8, eabj0329, https://doi.org/10.1126/sciadv.abj0329, 2022.
Zelinka, M. D., Andrews, T., Forster, P. M., and Taylor, K. E.: Quantifying components of aerosol-cloud-radiation interactions in climate models, J. Geophys. Res.-Atmos., 119, 7599–7615, https://doi.org/10.1002/2014JD021710, 2014.
Zhang, Q., Ma, X., Tie, X., Huang, M., and Zhao, C.: Vertical distributions of aerosols under different weather conditions: Analysis of in-situ aircraft measurements in Beijing, China, Atmos. Environ., 43, 5526–5535, https://doi.org/10.1016/j.atmosenv.2009.05.037, 2009.
Zhang, Q., Quan, J., Tie, X., Huang, M., and Ma, X.: Impact of aerosol particles on cloud formation: Aircraft measurements in China, Atmos. Environ., 45, 665–672, https://doi.org/10.1016/j.atmosenv.2010.10.025, 2011.
Zhao, C., Klein, S. A., Xie, S., Liu, X., Boyle, J. S., and Zhang, Y.: Aerosol first indirect effects on non-precipitating low-level liquid cloud properties as simulated by CAM5 at ARM sites, Geophys. Res. Lett., 39, L08806, https://doi.org/10.1029/2012GL051213, 2012.
Zhao, C., Qiu, Y., Dong, X., Wang, Z., Peng, Y., Li, B., Wu, Z., and Wang, Y.: Negative aerosol-cloud re relationship from aircraft observations over Hebei, China, Earth Space. Sci., 5, 19–29, https://doi.org/10.1002/2017EA000346, 2018.
Zhao, C., Zhao, L., and Dong, X.: A case study of stratus cloud properties using in situ aircraft observations over Huanghua, China, Atmosphere, 10, 19, https://doi.org/10.3390/atmos10010019, 2019.
Zhao, Z. L., Mao, J. T., and Wang, L.: In situ aircraft observations of one typical stratocumulus cloud process compared with the satellite measurements, Acta Meteorol. Sin., 69, 521–527, https://doi.org/10.11676/qxxb2011.045, 2011.