the Creative Commons Attribution 4.0 License.
the Creative Commons Attribution 4.0 License.
 | 10 Apr 2025
Dimethyl sulfide chemistry over the industrial era: comparison of key oxidation mechanisms and long-term observations
Jacob I. Chalif
Linia Tashmim
William C. Porter
Kelvin H. Bates
Qianjie Chen
Erich C. Osterberg
Bess G. Koffman
Jihong Cole-Dai
Dominic A. Winski
David G. Ferris
Karl J. Kreutz
Cameron P. Wake
Dimethyl sulfide (DMS) is primarily emitted by marine phytoplankton and oxidized in the atmosphere to form methanesulfonic acid (MSA) and sulfate aerosols. Ice cores in regions affected by anthropogenic pollution show an industrial-era decline in MSA, which has previously been interpreted as indicating a decline in phytoplankton abundance. However, a simultaneous increase in DMS-derived sulfate (bioSO4) in a Greenland ice core suggests that pollution-driven oxidant changes caused the decline in MSA by influencing the relative production of MSA versus bioSO4. Here we use GEOS-Chem, a global chemical transport model, and a zero-dimensional box model over three time periods (preindustrial era, peak North Atlantic NOx pollution, and 21st century) to investigate the chemical drivers of industrial-era changes in MSA and bioSO4, and we examine whether four DMS oxidation mechanisms reproduce trends and seasonality in observations. We find that box model and GEOS-Chem simulations can only partially reproduce ice core trends in MSA and bioSO4 and that wide variation in model results reflects sensitivity to DMS oxidation mechanism and oxidant concentrations. Our simulations support the hypothesized increase in DMS oxidation by the nitrate radical over the industrial era, which increases bioSO4 production, but competing factors such as oxidation by BrO result in increased MSA production in some simulations, which is inconsistent with observations. To improve understanding of DMS oxidation, future work should investigate aqueous-phase chemistry, which produces 82 %–99 % of MSA and bioSO4 in our simulations, and constrain atmospheric oxidant concentrations, including the nitrate radical, hydroxyl radical, and reactive halogens.
- Article
(5324 KB) - Full-text XML
-
Supplement
(1995 KB) - BibTeX
- EndNote


Marine phytoplankton are primary producers and an important source of atmospheric sulfur through the emission of dimethyl sulfide (DMS; CH3SCH3). In the atmosphere, DMS oxidation forms methanesulfonic acid (MSA; CH3SO3H) and sulfate (SO) aerosols, both of which play an important role in the formation and growth of new particles and cloud condensation nuclei (e.g., Beck et al., 2021; Chen et al., 2015; Weber et al., 1997; Kaufman and Tanré, 1994) and influence aerosol radiative forcing (e.g., Fung et al., 2022; Carslaw et al., 2013; Regayre et al., 2020). Uncertainty in past, present, and future DMS emissions and oxidation chemistry contributes to uncertainty in aerosol radiative forcing estimates (e.g., Carslaw et al., 2013, 2017; Fung et al., 2022; Kaufman and Tanré, 1994; Jin et al., 2018). Ice core records of MSA concentrations, traditionally considered a proxy for DMS emissions, have been used to infer phytoplankton abundance (Kurosaki et al., 2022; Osman et al., 2019; Polashenski et al., 2018) and sea ice extent (Abram et al., 2013; Curran et al., 2003; Maselli et al., 2017; Osterberg et al., 2015). Based on industrial-era declines in MSA concentrations across many Greenland ice cores, it was inferred that DMS emissions – and consequently, marine phytoplankton abundance – had declined in the North Atlantic between the preindustrial (PI) era and the early 21st century (Osman et al., 2019). A more recent study found an increase in Greenland MSA from 2002–2014 and attributed the increase to declining sea ice extent (Kurosaki et al., 2022). More recently, sulfur isotopes of sulfate (δ34S(SO)) from a Summit, Greenland, ice core showed that DMS-derived sulfate (bioSO4) had increased in the North Atlantic region since the preindustrial era (Jongebloed et al., 2023a). The time period of minimum MSA concentrations (1969–1995 CE) aligns with peak anthropogenic NOx pollution in the regions affecting Greenland, causing Jongebloed et al. (2023a) to hypothesize that the trends in MSA and bioSO4 are driven by changes in DMS oxidation chemistry due to changes in atmospheric oxidant abundances. In support of this hypothesis, a mid-20th century through early 21st-century decline in MSA concentrations in the Denali, Alaska ice core, which is influenced by DMS emissions from the North Pacific, was found to align with an increase in East Asian oxidant precursor emissions starting in the 1950s (Chalif et al., 2024a).
Jongebloed et al. (2023a) and Chalif et al. (2024a) hypothesized that increased industrial-era NOx and VOC emissions drive increases in the nitrate radical (NO3) and that oxidation of DMS by the nitrate radical favors the production of sulfate over the production of MSA. Using a global chemistry–climate model with updated DMS oxidation chemistry, Fung et al. (2022) found a 59 % decrease in global MSA burden from the preindustrial era to the present day (PD), supporting the hypothesis of a pollution-driven decline in MSA. Chalif et al. (2024a) used a box model with gas-phase DMS oxidation chemistry from recent studies (Fung et al., 2022; Chen et al., 2018; Cala et al., 2023; Novak et al., 2021) and found a NO3-driven decline in modeled MSA concentrations of the same magnitude as the decline in MSA observed in the ice cores from Summit, Greenland, and Denali, Alaska. However, this box model approach does not include aqueous-phase chemistry, which is likely the dominant MSA formation pathway in the atmosphere (Chen et al., 2018). Additionally, the rapidly evolving representation of DMS oxidation mechanisms in atmospheric chemistry models compels a careful comparison of these various mechanisms.
Many atmospheric models have simple DMS oxidation schemes which include three gas-phase reactions with the hydroxyl radical (OH) and the nitrate radical (Chin et al., 1996). In recent years, these have been updated to include both additional gas-phase and aqueous-phase reactions involving additional MSA and sulfate precursors. Chen et al. (2018) implemented updates to DMS oxidation chemistry in the global chemical transport model GEOS-Chem, including the reaction with bromine monoxide (BrO) and the chlorine radical (Cl), formation of important intermediates such as dimethyl sulfoxide (DMSO; CH3SOCH3) and methanesulfinic acid (MSIA; CH3SO2H), and the aqueous-phase formation of MSA from these intermediates. Tashmim et al. (2024) built on the Chen et al. (2018) mechanism to include gas-phase chemistry producing hydroperoxymethyl thioformate (HPMTF; HOOCH2SCHO), which has been observed in the atmosphere (Novak et al., 2021; Siegel et al., 2023; Veres et al., 2020) and laboratory studies (Goss and Kroll, 2024; Shen et al., 2022; Ye et al., 2022) and forms sulfate in the aqueous phase (Novak et al., 2021). Along with HPMTF, Tashmim et al. (2024) included other gas-phase intermediates such as the methylthiomethylperoxy radical (MSP or MTMP; CH3SCH2OO) and the CH3SO2 radical. Chen et al. (2023) implemented a DMS oxidation mechanism in GEOS-Chem that included the temperature-dependent gas-phase production of MSA and sulfate through the CH3SO2 radical, which has been observed in recent chamber studies (Berndt et al., 2023; Goss and Kroll, 2024; Shen et al., 2022; Ye et al., 2022). Gas-phase production of MSA increases in simulations using the Chen et al. (2023) mechanism relative to the simple three gas-phase reaction mechanism, which could be important for new particle formation.
Similar DMS oxidation mechanisms with a wide range in complexity have been implemented into chemical transport models, chemistry–climate models, and box models. Hoffmann et al. (2021) and Revell et al. (2019) found that different DMS oxidation schemes yield order-of-magnitude differences in SO2, MSA, and sulfate concentrations. Similarly, Fung et al. (2022) found that updating the DMS chemistry mechanism in a chemistry–climate model causes a decreased estimated aerosol radiative forcing, demonstrating the importance of DMS chemistry to climate modeling. Cala et al. (2023) implemented gas-phase DMS oxidation similar to Tashmim et al. (2024) and Fung et al. (2022) but did not include aqueous-phase oxidation of DMS, DMSO, and MSIA or the reaction of DMS with BrO and Cl. Cala et al. (2023) also found significant variation in DMS oxidation products under different oxidation mechanisms and highlighted the need to investigate the kinetics of small sulfur radical intermediates (CH3S, CH3SO2, and CH3SO3). Finally, Bhatti et al. (2024) used a global chemistry–climate model to implement seven simple DMS oxidation mechanisms from other models, none of which included HPMTF chemistry, and found a range in global aerosol optical depth that is twice as large as the modeled change from preindustrial to present-day aerosol optical depth.
Recent chamber, modeling, and observational studies have improved understanding and highlighted remaining uncertainties in DMS oxidation, including the isomerization rate of MSP to form HPMTF (Jernigan et al., 2022; Wu et al., 2015; Ye et al., 2022); the fate of HPMTF, including gas-phase oxidation to form SO2 and in-cloud oxidation to form sulfate (Wollesen de Jonge et al., 2021; Novak et al., 2021; Vermeuel et al., 2020; Wu et al., 2015) and the possible photolysis of HPMTF (Khan et al., 2021); the formation and loss of dimethyl sulfone (Scholz et al., 2023; Shen et al., 2022); the kinetics of small sulfur radical intermediates (CH3S, CH3SO2, and CH3SO3) to form sulfate and MSA (Berndt et al., 2023; Cala et al., 2023; Chen et al., 2021, 2023; Goss and Kroll, 2024; Ye et al., 2022); the reaction of MSIA in aerosol versus dilute solutions (Liu et al., 2023); and the reaction of MSA with OH in the aqueous phase to form sulfate (Kwong et al., 2018; Mungall et al., 2018). In addition to remaining uncertainties in DMS oxidation chemistry, uncertainties in modeled oxidant abundances affect the relative abundance of DMS oxidation products, and representation of atmospheric oxidants varies drastically by model (Murray et al., 2021; Young et al., 2013).
Here we implement four DMS oxidation mechanisms from previous studies (Chen et al., 2018; Tashmim et al., 2024; Chen et al., 2023; Cala et al., 2023) into a global atmospheric chemistry model to investigate how modeled abundances of DMS oxidation products over the industrial era compare to long-term in situ observations and to ice cores from Summit, Greenland, and Denali, Alaska. We use these four mechanisms to represent a range in the complexity and characteristics of the representation of intermediates. We investigate which oxidants and reactions drive trends in MSA and bioSO4, where knowledge gaps remain in DMS oxidation chemistry, and the potential global implications of these mechanisms for DMS oxidation products.
2.1 GEOS-Chem model
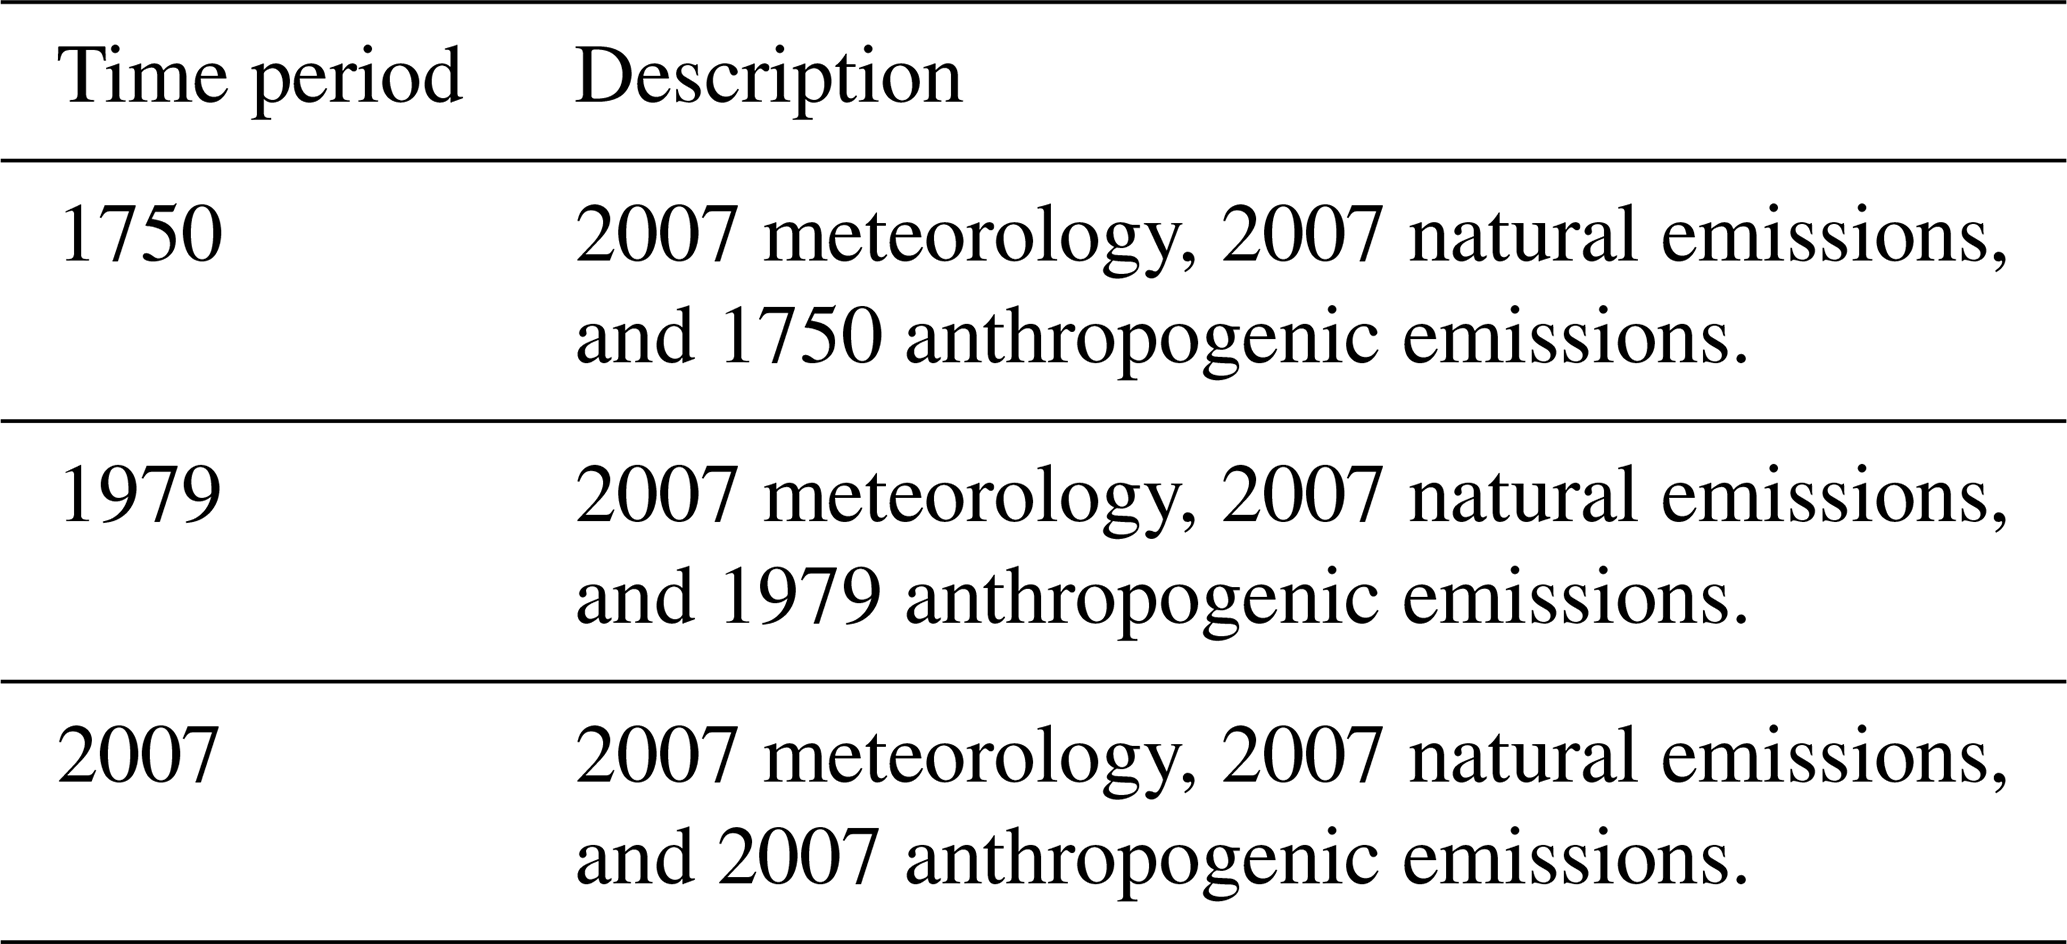
To investigate modeled industrial-era trends in MSA and DMS-derived biogenic sulfate, we use GEOS-Chem versions 12.9.3 (abbreviated as GC12; https://doi.org/10.5281/zenodo.3974569, The International GEOS-Chem User Community, 2020) and 13.2.1 (abbreviated as GC13; https://doi.org/10.5281/zenodo.5500717, The International GEOS-Chem User Community, 2021) (Bey et al., 2001). We use two model versions to test the sensitivity of our results to different oxidant concentrations (see Sect. 3.1) and different DMS oxidation mechanisms (see Table 1). GEOS-Chem is driven by assimilated meteorology from MERRA2 and has detailed HOx–NOx–VOC–O3–halogen chemistry including recently updated halogen and cloud chemistry (Bates and Jacob, 2019; Chen et al., 2017; Holmes et al., 2019; Schmidt et al., 2016; Wang et al., 2019, 2021). We run simulations at 4°×5° resolution with varying anthropogenic emissions (for years 1750, peak NOx pollution in 1979, and 2007) from the Community Emissions Data System (CEDS; McDuffie et al., 2020). DMS emissions from the ocean are described in Lana et al. (2011) and are based on a climatology of sea surface DMS concentrations with flux controlled by sea-surface-temperature- and wind-dependent gas transfer velocity (Johnson, 2010; Nightingale et al., 2000). DMS emissions in this study are 27 Tg S yr−1, which is of similar magnitude to more recent climatologies (Hulswar et al., 2022) but larger than a machine-learning-based estimate of 20 Tg S yr−1 (Wang et al., 2020). In all mechanisms, we add tracers to GEOS-Chem to track DMS-derived SO2 and bioSO4 separately from other sources of SO2 and sulfate while preserving total modeled sulfur. Dry deposition is parameterized as a resistance-in-series model (Wang et al., 1998; Wesely, 1989), and wet deposition includes both scavenging and washout of soluble species (Liu et al., 2001). In GC13, the wet deposition is updated to include spatially and temporally varying in-cloud condensed water and a higher washout rate for nitric acid (Luo et al., 2019, 2020). To test different time periods, we use the same meteorology, sea ice, and natural emissions from 2007 across all simulations but prescribe anthropogenic emissions from other years representing each time period (Table 2), following Zhai et al. (2021) and Jongebloed et al. (2023c).
We implement DMS oxidation chemistry from Chen et al. (2018), Chen et al. (2023), Cala et al. (2023), and Tashmim et al. (2024) to represent a range in DMS oxidation chemistry, such as the inclusion of HPMTF chemistry, the inclusion of DMS loss to reactive halogens, and different representations of the short-lived organosulfur intermediates such as CH3SO2. We then quantify global implications of different DMS oxidation mechanisms and oxidant concentrations for DMS oxidation products. DMS oxidation mechanisms are described in Sect. 2.2.
This study does not consider how changes in meteorology might affect long-term trends in MSA and sulfate. Changes in meteorology are potentially important in the Denali ice core, where the snow accumulation rate has increased by a factor of 1.2–2.3 since the preindustrial era (Winski et al., 2017; Chalif et al., 2024a). Chalif et al. (2024a) showed that these accumulation rate changes alone cannot explain the trend in MSA concentrations, and here we use the same meteorology across all simulations to investigate how changing atmospheric chemistry influences trends in ice core concentrations of DMS oxidation products.
Importantly, this study also does not consider how potential past and future changes in DMS emissions might affect long-term trends in MSA and sulfate. We use the same DMS emissions from Lana et al. (2011) in every simulation; however, uncertainty in or changes to DMS emissions could affect comparison of model simulations with long-term ice core and in situ observations. DMS emissions inventories in models vary by up to a factor of 2 or more (18.2–32 Tg S yr−1; Wang et al., 2020) and may not capture spatiotemporal variability in DMS emissions (Bhatti et al., 2023; Galí et al., 2018; Hulswar et al., 2022; Lana et al., 2011; Steiner et al., 2012). Furthermore, DMS emissions vary under different temperature, pH, and nutrient availability and may change under global warming (Hopkins et al., 2020, 2023; Kloster et al., 2007; Saint-Macary et al., 2021; Seland et al., 2020; Six et al., 2013; Sunda et al., 2007; Tjiputra et al., 2020; Xu et al., 2022; Zhao et al., 2024; Zindler et al., 2014). Therefore, potential changes in present, past, and future DMS emissions should also be considered when interpreting observed or modeled long-term trends of MSA and sulfate.
Finally, this study does not include emissions of methanethiol (CH3SH; MeSH), which is emitted at about 10 %–65 % of the rate of DMS emission (Wohl et al., 2024; Gros et al., 2023; Novak et al., 2022; Lawson et al., 2020), and may favor SO2 and sulfate production over MSA (Novak et al., 2022), potentially affecting our model–observation comparison of MSA, bioSO4, and MSA bioSO4.
2.2 DMS oxidation mechanisms
We perform simulations using four DMS oxidation mechanisms, which are summarized in Table 1 and Fig. 1 and discussed in detail below. Detailed schematics for the mechanisms can be found in Figs. S1–S4 in the Supplement. Table S1 in the Supplement shows Henry's law constants of aqueous-phase intermediates for the four mechanisms.
Chen et al. (2018)Chen et al. (2018)Tashmim et al. (2024)Chen et al. (2023)Cala et al. (2023)Cala et al. (2023)Table 1Description of mechanisms.
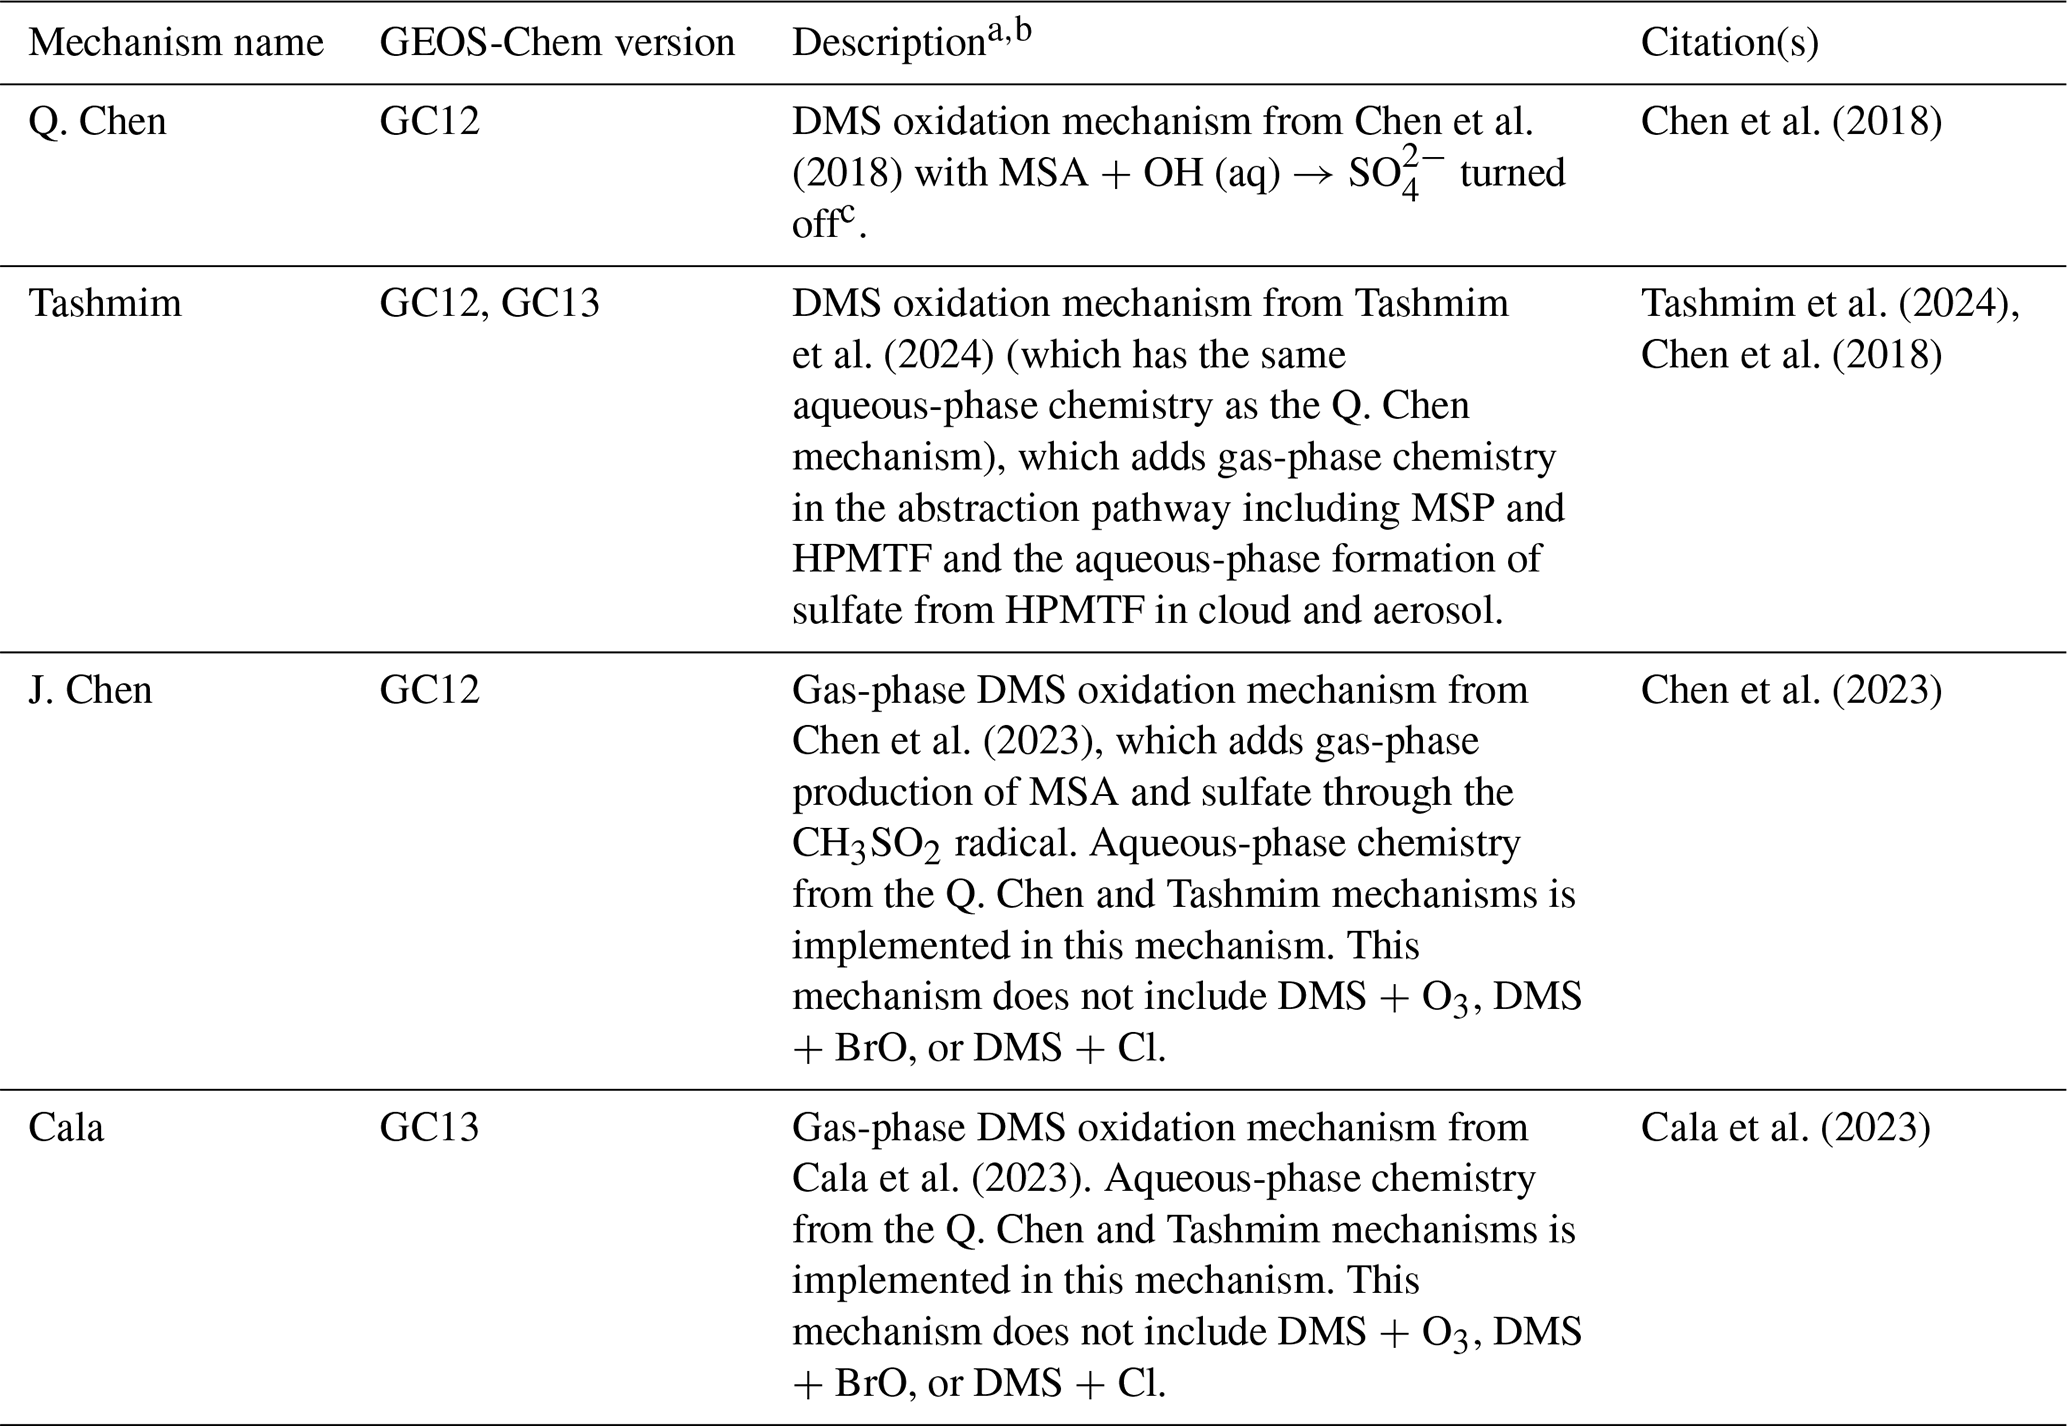
a Detailed schematics of each mechanism are shown in Figs. S1–S4. Reaction rates and full descriptions of the mechanisms can be found in the citations associated with each mechanism. b In all mechanisms, SO2 is oxidized to sulfate in the gas phase through reaction with OH and in the aqueous phase through reaction of S(IV) with H2O2, O3, HOBr, HOCl, and O2 catalyzed by transition metals iron and manganese (Alexander et al., 2009, 2012; Chen et al., 2017). c Other sensitivity tests performed include the Tashmim mechanism with MSA + OH (aq) → SO included, shown in Fig. S5.
In the Q. Chen mechanism, we use the DMS oxidation scheme from Chen et al. (2018). This mechanism includes DMS oxidation by key oxidants, including OH via addition and abstraction, the nitrate radical, bromine monoxide (BrO), ozone (O3) via gas- and aqueous-phase chemistry, and the chlorine radical (Cl). Chen et al. (2018) include aqueous-phase production of MSA via DMSO reacting with OH to produce MSIA, followed by MSIA reacting with OH and ozone to produce MSA. Chen et al. (2018) also include the aqueous-phase destruction of MSA by OH to produce sulfate. However, this reaction appears to be overly efficient when implemented in the Tashmim mechanism, causing the modeled seasonality of MSA to be opposite to the observed seasonality of MSA (Fig. S5). Fung et al. (2022) use the same aqueous-phase reaction of in-cloud OH oxidation of MSA and find that 76 % of MSA is lost through this reaction, which is likely overly efficient as well. While Hattori et al. (2024) find that MSA is oxidized to sulfate in East Antarctic snow where MSA is exposed to oxidizing conditions over many years, Mungall et al. (2018) estimate that the lifetime of MSA against in-cloud oxidation is about a year; i.e., this reaction should not be a significant loss process in the atmosphere. It is possible that the in-cloud OH oxidation of MSA to sulfate is too efficient in both Fung et al. (2022) and the Tashmim mechanism due to uncertain liquid-phase diffusion coefficients, mass accommodation coefficients, reactive uptake coefficients, aqueous-phase reaction rate coefficients, or other reaction rate uncertainties (Chen et al., 2018). Due to the large bias in the seasonality of MSA in model simulations that include this reaction in cloud water (Fig. S5) and laboratory experiments indicating that MSA + OH in cloud water should not be a significant loss process of MSA Mungall et al. (2018), we omit this MSA + OH in cloud water from all mechanisms in this study. We suggest that further study should resolve why this reaction is overly efficient when implemented into global models.
The Tashmim mechanism includes all the reactions in the aqueous-phase and addition pathways from Chen et al. (2018) (Tashmim et al., 2024). This mechanism updates the abstraction pathway to include the isomerization component, including intermediates such as MSP, CH3SO2, HPMTF, and the aqueous-phase formation of sulfate from HPMTF.
The J. Chen mechanism includes the gas-phase chemistry from Chen et al. (2023) and aqueous-phase chemistry from Chen et al. (2018) and Tashmim et al. (2024). Henry's law constants for all aqueous-phase species are from Chen et al. (2023) (see Table S1). The main difference between the J. Chen mechanism and the Tashmim mechanism is that the J. Chen mechanism adds gas-phase MSA and sulfate production through the CH3SO2 radical intermediate. Other important differences include the omission of the DMS + BrO, DMS + O3, and DMS + Cl reactions. Although Fung et al. (2022), Chen et al. (2018), and Khan et al. (2016) show that DMS + BrO may be a significant sink for DMS (8 %–29 % globally), we omit these reactions from our J. Chen mechanism for consistency with Chen et al. (2023). Other notable differences between the J. Chen and Tashmim mechanisms include intermediates such as methanesulfenic acid (MSEA) and the reactions connecting the addition and abstraction branches through the oxidation of MSEA and MSIA to form CH3SO2, which can then form both MSA and sulfate. Finally, we include the aqueous-phase chemistry from Chen et al. (2018) and Tashmim et al. (2024) in the J. Chen mechanism to include the aqueous-phase formation of MSA and sulfate from DMSO and HPMTF, respectively.
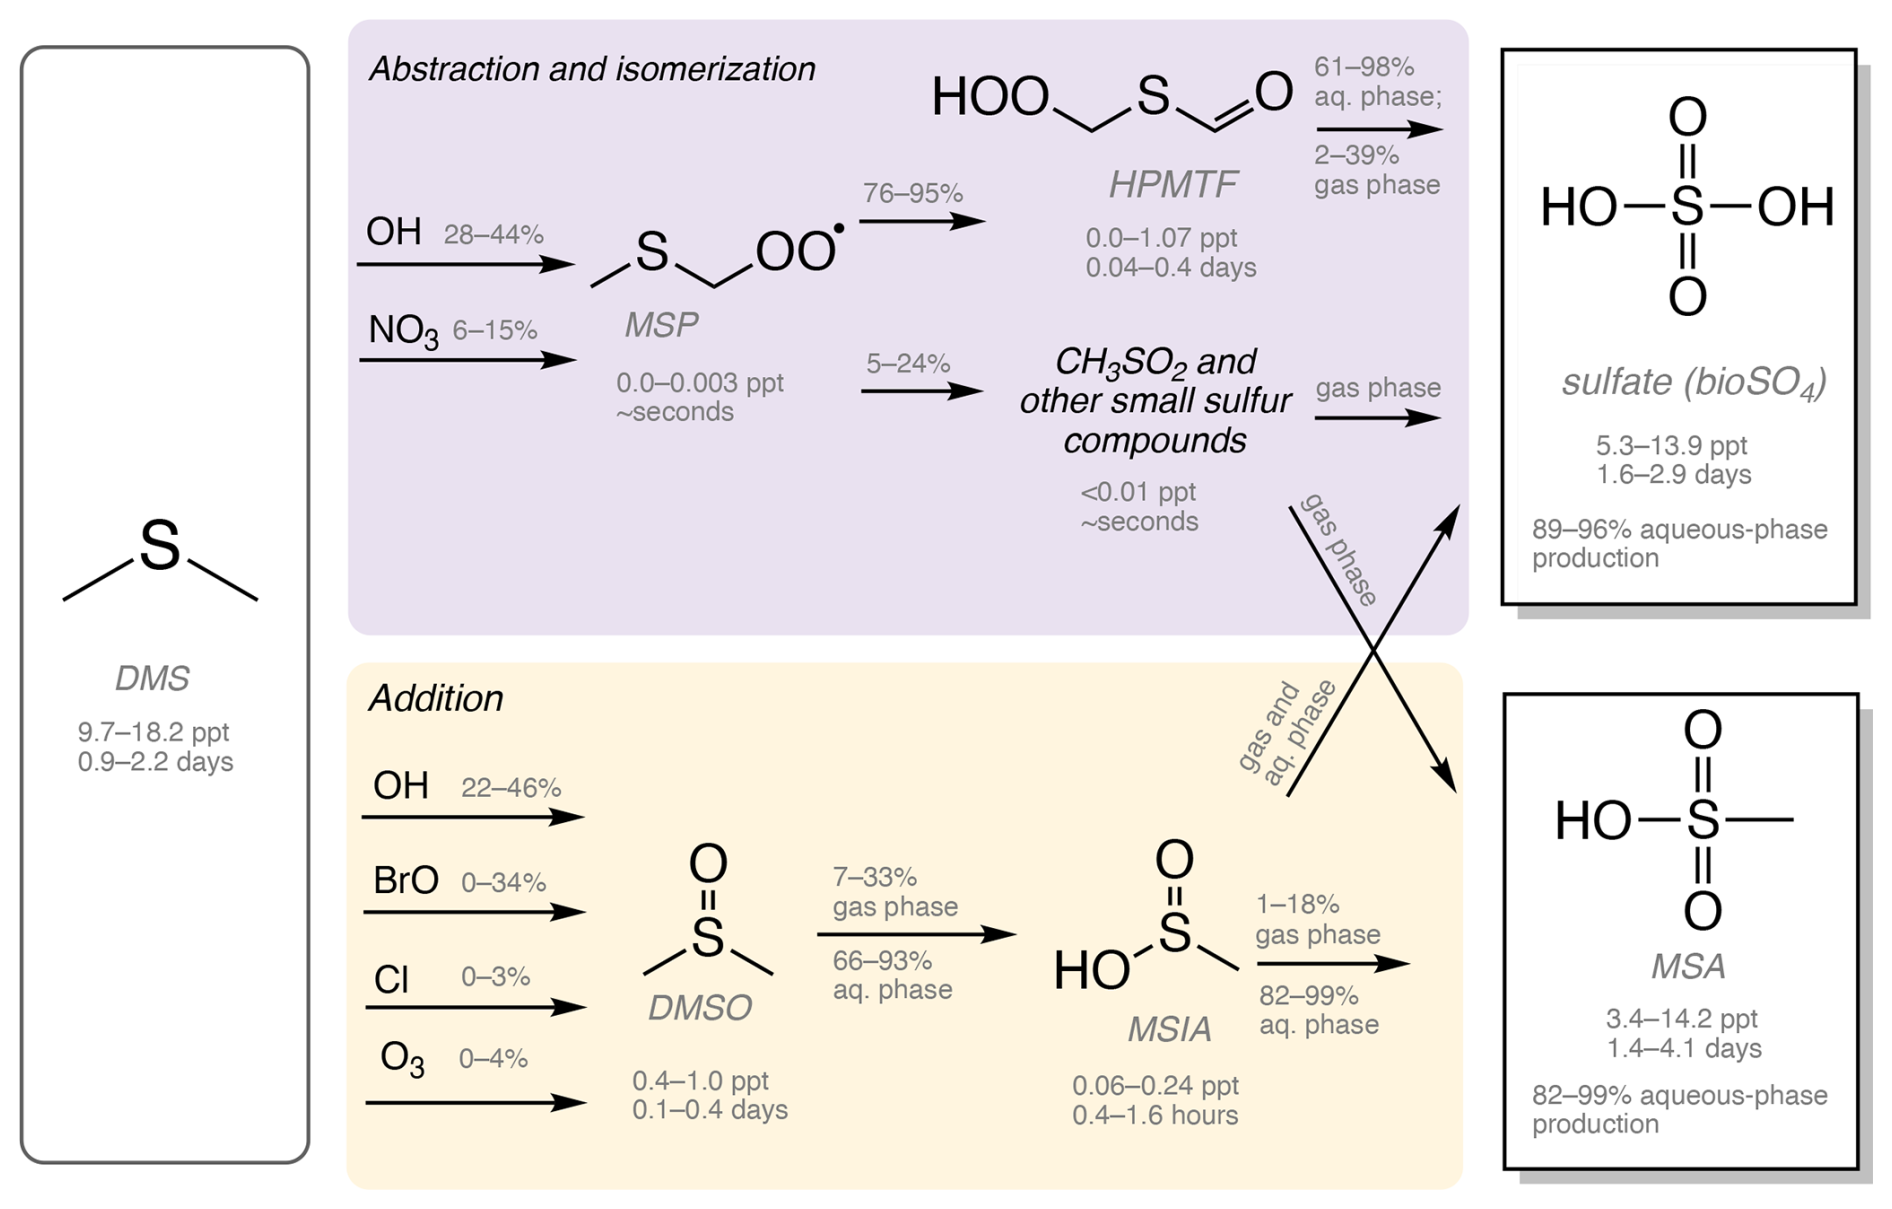
Figure 1Simplified schematic of DMS oxidation chemistry in Table 1, which includes several DMS oxidation mechanisms, including Q. Chen (Chen et al., 2018), Tashmim (Tashmim et al., 2024), J. Chen (Chen et al., 2023), and Cala (Cala et al., 2023). More detailed versions of each mechanism are shown in Figs. S2–S5. The purple box shows the abstraction and isomerization branch, which forms MSP, HPMTF, CH3SO2, other short-lived organosulfur compounds, bioSO4, MSA, and carbonyl sulfide (OCS). In the yellow box, the addition branch includes DMSO, MSIA, SO2, bioSO4, and MSA. DMSO, MSIA, and HPMTF intermediates partition into the aqueous phase. Percentages above reaction arrows show the percent of the precursor oxidized through each pathway, where the range is based on range in the global mean in simulations with various oxidation mechanisms in Table 1. Below each compound, a range in mass-weighted mean tropospheric concentrations and tropospheric lifetimes is shown as a range across all mechanisms and model versions in Table 1. All concentration, lifetime, and percent oxidation numbers are from the 2007 (present-day) simulations. SO2 produced from DMS oxidation can be dry-deposited or oxidized in the gas and aqueous phases to form sulfate (Alexander et al., 2009, 2012; Chen et al., 2017). Reaction rates and detailed descriptions of the reactions can be found in Chen et al. (2018), Tashmim et al. (2024), Chen et al. (2023), and Cala et al. (2023).
For the Cala mechanism, we implement gas-phase DMS oxidation chemistry from Cala et al. (2023) with aqueous-phase chemistry from Chen et al. (2018) and Tashmim et al. (2024). We note that oxidation of HPMTF in aerosol to form sulfate is similar in Cala et al. (2023) and Tashmim et al. (2024), but Cala et al. (2023) do not include aqueous-phase oxidation of DMSO and MSIA or cloud loss of HPMTF. Similar to the J. Chen mechanism, the Cala mechanism does not include DMS + BrO, DMS + O3, or DMS + Cl.
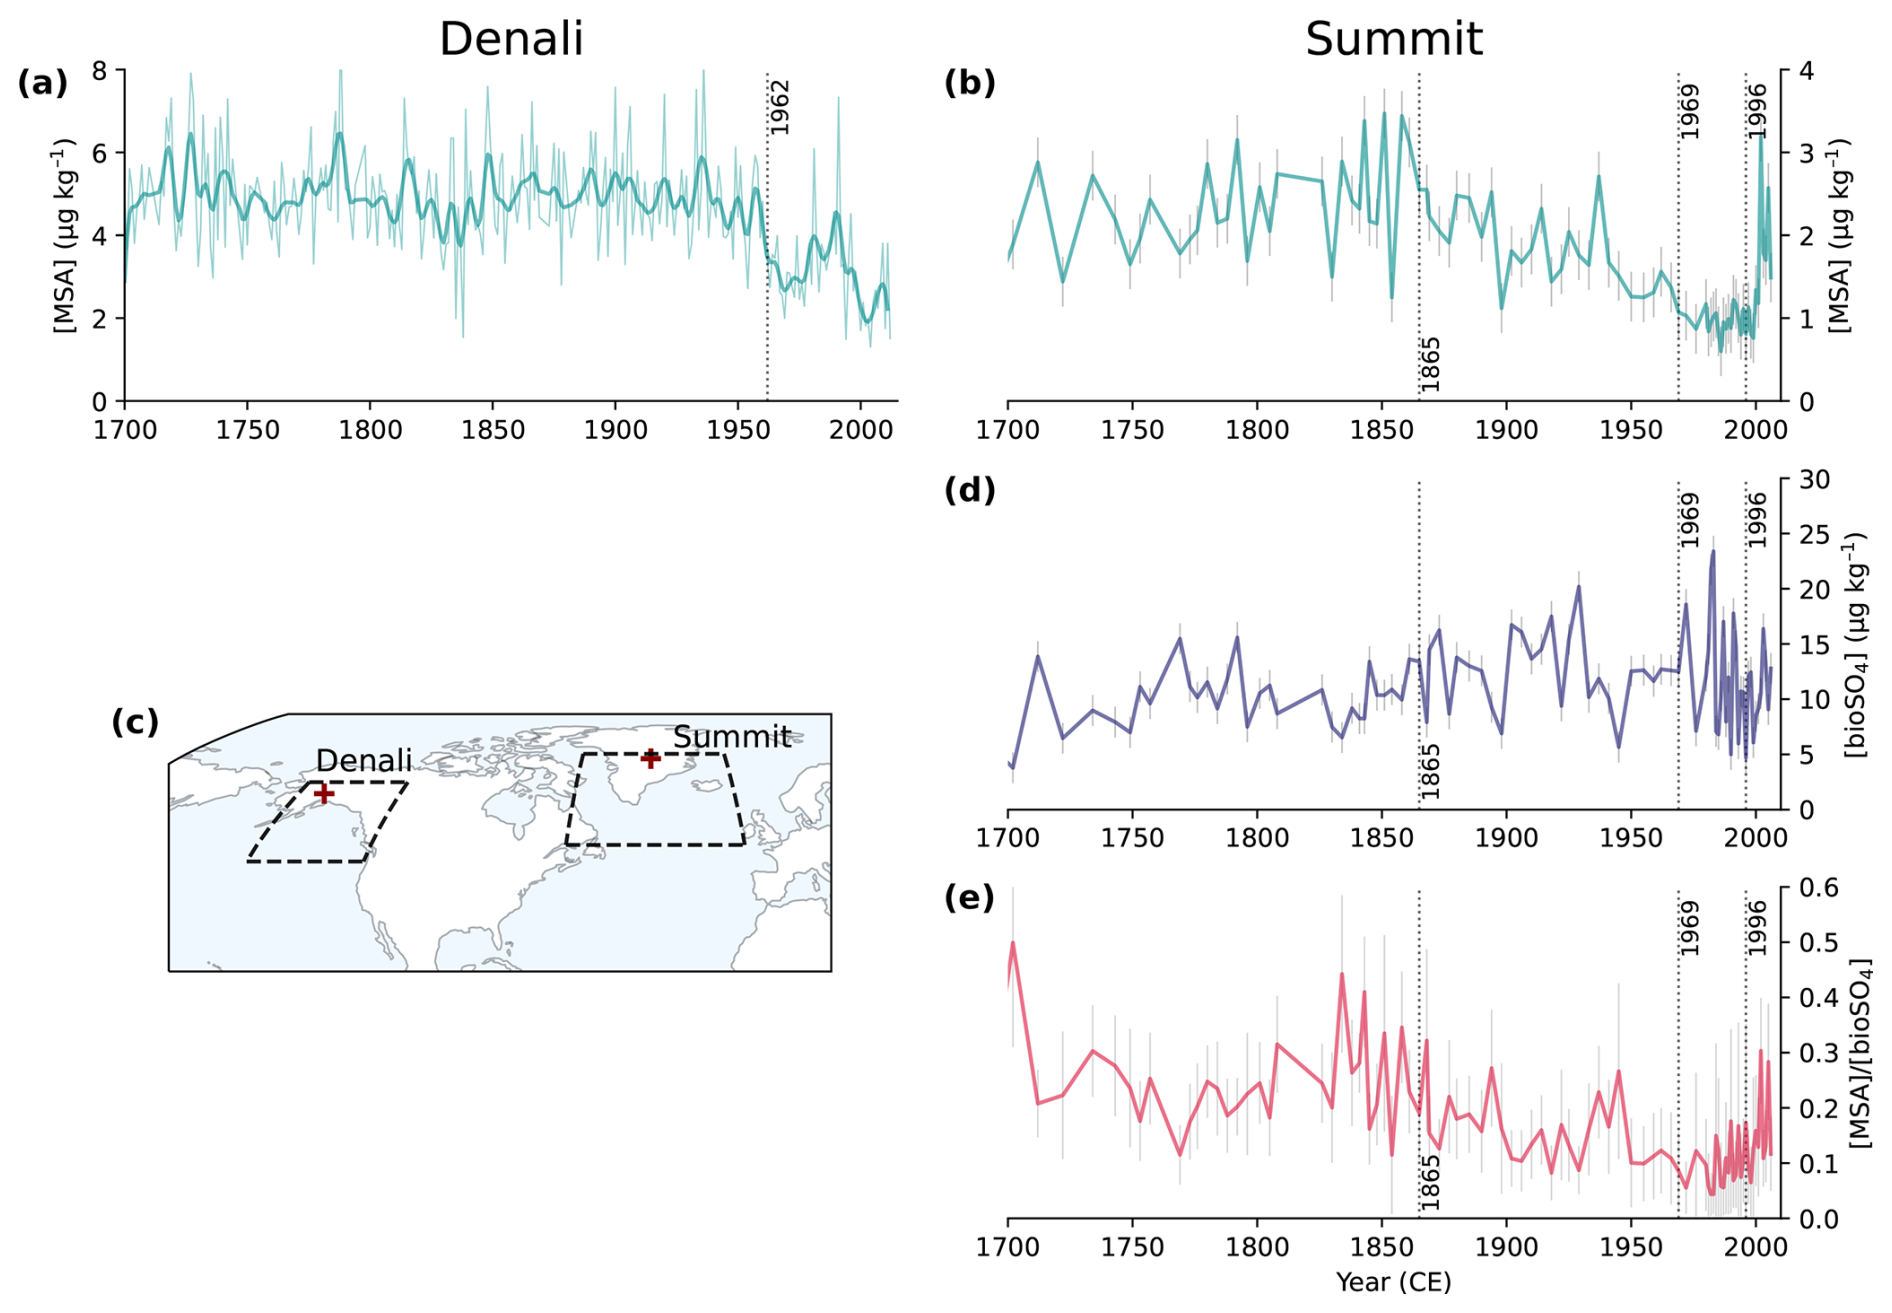
Figure 2Ice core observations from Denali, Alaska (a, c; Chalif et al., 2024a) and Summit, Greenland (b, d, e; Jongebloed et al., 2023a). (a) Denali MSA concentrations, where the thin line is annual concentrations and the thick line is annual concentrations smoothed with a Hann window function. (b) Summit MSA concentrations, which are sub-decadal from 1700 to 1980 and annual from 1980 to 2007. (c) A map showing the locations of Denali (63° N, 151° W) and Summit (73° N, 39° W) and the source regions shown as dashed lines for Denali (Chalif et al., 2024a) and Summit (Osman et al., 2019). (d) Summit bioSO4 concentrations. (e) Summit MSA bioSO4 molar ratios. Dotted lines show Bayesian change point analysis from Jongebloed et al. (2023a) and Chalif et al. (2024a). Error bars from Summit core (b, d, e) show 1σ propagation of uncertainty in isotope measurements and calculations.
2.3 Box modeling of DMS oxidation chemistry
We use the Framework for 0-Dimensional Atmospheric Modeling (F0AM; Wolfe et al., 2016) to isolate the impacts of changing oxidant concentrations on trends in MSA and bioSO4. The box model does not include emissions, transport, or deposition, therefore allowing the effects of changing oxidant concentrations to be isolated from other processes. Following Chalif et al. (2024a), we use March–October mass-weighted oxidant concentrations in the marine boundary layer (<2 km) from the 1750, 1979, and 2007 simulations (Table 1) as inputs for the box model. We model the four oxidation mechanisms described in Table 1 and oxidant concentrations from both GC12 and GC13. Box model simulations, including those in Chalif et al. (2024a), only model gas-phase chemistry. We approximate the aqueous-phase pathways by allowing MSIA oxidation to form only MSA, which is informed by GEOS-Chem simulations where 90 % of the MSIA forms MSA (Fig. 1). This approximation of aqueous-phase chemistry increases the absolute ratio of MSA bioSO4 by about a factor of 2 but does not affect modeled trends in MSA, bioSO4, or MSA bioSO4 in any mechanism.
2.4 Long-term observations: ice core and in situ measurements
We use ice core measurements of MSA from the Denali, Alaska ice core (Chalif et al., 2024a) and MSA and bioSO4 from a Summit, Greenland, ice core (Jongebloed et al., 2023a) to investigate observed trends in DMS oxidation products. Figure 2 shows ice core observations and the locations of Denali and Summit. The Denali ice core is located in the sub-Arctic North Pacific region, which is influenced by East Asian emissions and includes annually resolved MSA concentrations from 1700 to 2013 CE (Fig. 2a). The Summit ice core is from the sub-Arctic North Atlantic region, which is influenced by anthropogenic emissions from eastern North America and western Europe and includes MSA concentrations (Fig. 2b) that are consistent with a composite MSA record from ice cores across Greenland (Fig. S6; Osman et al., 2019). The Summit ice core observations also include DMS-derived biogenic sulfate (bioSO4) concentrations (Fig. 2d) and the ratio of MSA bioSO4 from 1700 to 2007 (Fig. 2e) determined via isotope apportionment of sulfate sources (Jongebloed et al., 2023a, b, c). We cannot estimate bioSO4 and MSA bioSO4 for the Denali ice core because the sulfur isotopic composition of sulfate was not measured. Uncertainty in ice core observations includes measurement uncertainty of 1 ppb for MSA concentrations and propagation of uncertainty in isotope measurements (1 ‰) and isotope calculations for bioSO4 concentrations and MSA bioSO4 (Jongebloed et al., 2023a, b, c).
To compare the model results to the ice core observations, we have considered several methods based on previous work. Zhai et al. (2021) and Jongebloed et al. (2023c) compared Greenland ice cores to the tropospheric burden of relevant species in a 5 d HYSPLIT back-trajectory region of Greenland. Osman et al. (2019) and Chalif et al. (2024a) investigated Greenland ice cores using a smaller HYSPLIT back-trajectory region. Moseid et al. (2022) and Zhang et al. (2024) compared sulfate and black carbon in ice cores to several models by examining the modeled deposition of each species in the grid cell containing the ice core. For this study, we follow Moseid et al. (2022) and Zhang et al. (2024) and compare the trends in grid cell deposition to trends in ice core concentration, but results are qualitatively similar using other methods.
In addition to ice core observations, we compare model results to long-term in situ observations of MSA, DMS, and MSA nssSO from Ayers et al. (1995), Becagli et al. (2019), Gondwe et al. (2004), Kouvarakis and Mihalopoulos (2002), Quinn et al. (2009), Schmale et al. (2022), and Sharma et al. (2019). We include details on these in situ measurements and note the limitations of these comparisons in Sect. 3.4.
3.1 Changes in oxidant concentrations across model versions and simulation years
Figure 3 shows that concentrations of DMS oxidants are substantially different across two different GEOS-Chem model versions (GC12 and GC13) and simulation years (1750, 1979, and 2007) in the Summit source region (Fig. 3a–e), Denali source region (Fig. 3f–j), and global mean (Fig. 3k–o). Figure 3 shows oxidant concentrations from the Tashmim mechanisms in GC12 and GC13, but most oxidants (e.g., O3, Cl, OH, and NO3) vary by <1 % between mechanisms within the same model version. BrO is up to 14 % lower in mechanisms that include DMS + BrO compared to mechanisms that do not include DMS + BrO, suggesting that DMS oxidation is an important sink for BrO.
We analyzed the Summit and Denali source regions (Fig. 3a and f) to examine how oxidants have changed in the upwind regions influencing each ice core site (Osman et al., 2019; Polashenski et al., 2018; Chalif et al., 2024a). Oxidants are influenced by trends in anthropogenic pollution, which differ across each of these regions over the industrial era. We show NOx emissions from the Community Emissions Data System (CEDS; McDuffie et al., 2020) in Fig. 3, which increase from the late 19th through the late 20th century and decrease from the late 20th through the early 21st century in North America and Europe (i.e., upwind of Summit; Fig. 3b–e). In East Asia (i.e., upwind of Denali; Fig. 3g–j), NOx emissions increase rapidly in the late 20th through early 21st century. We show concentrations of OH, NO3, BrO, and O3 but not the chlorine radical (Cl) because Cl is expected to be a minor oxidant of DMS; however, we note that anthropogenic emissions of chlorine are not included in either model version, and current reactive chlorine chemistry mechanisms underestimate observed reactive chlorine (Chen et al., 2022, 2024).
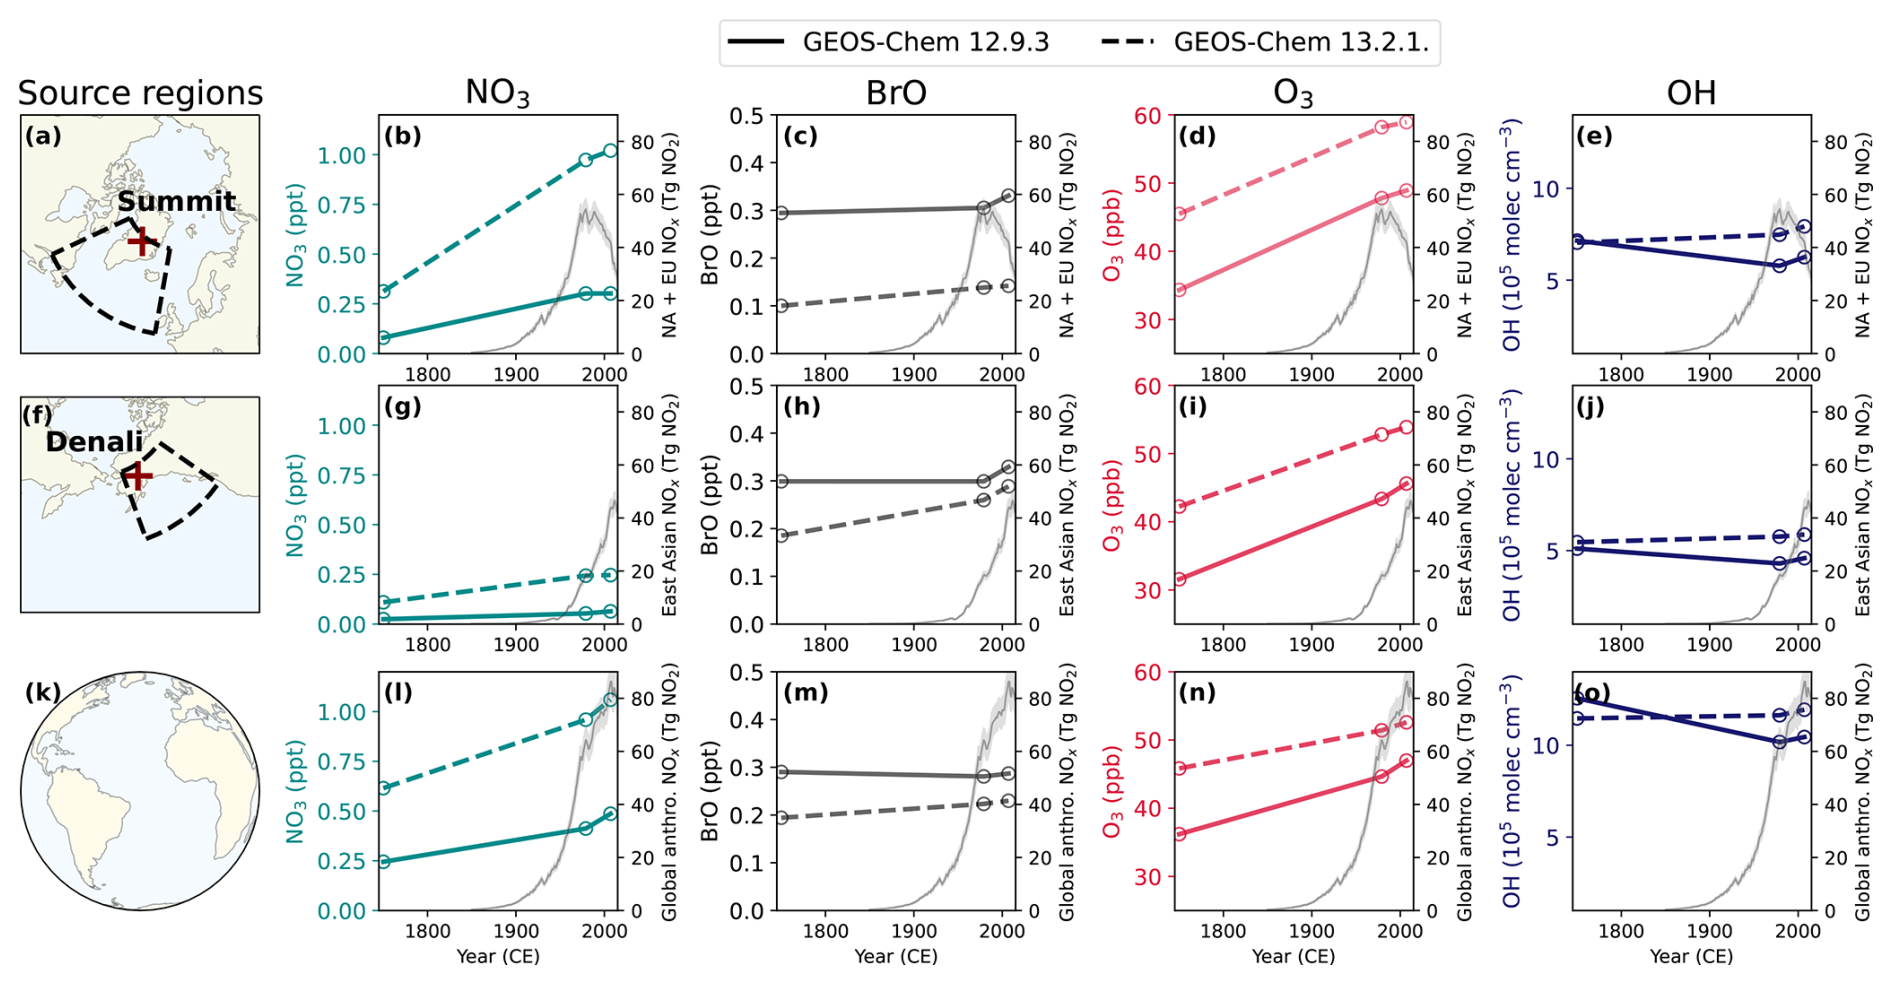
Figure 3Annual air-mass-weighted tropospheric mean oxidant concentrations in the Summit source region (top), in the Denali source region (middle), and as a global mean from the preindustrial era to the present day. In all figures showing oxidants, the dashed lines represent oxidant concentrations from version GEOS-Chem 13.2.1 (GC13), and the solid lines represent GEOS-Chem 12.9.3 (GC12). CEDS anthropogenic NOx emissions from North America and Europe (b–e), from East Asia (g–j), and globally (l–o) are shown with a gray line, with shading showing 1 standard deviation (McDuffie et al., 2020). Meteorology and natural emissions are the same in all simulations. (a) The Summit ice core site and source region. (b–e) Changes in tropospheric-air-mass-weighted NO3 (turquoise), BrO (gray), O3 (red), and OH (dark blue) in the 1750, 1979, and 2007 simulations in the Summit ice core source region. (f) The Denali ice core site and source region. (g–j) Changes in tropospheric-air-mass-weighted NO3 (turquoise), BrO (gray), O3 (red), and OH (dark blue) in the 1750, 1979, and 2007 simulations in the Denali ice core source region. (k) An icon representing the global calculations in (l)–(o). (l–o) Global tropospheric-air-mass-weighted NO3 (turquoise), BrO (gray), O3 (red), and OH (dark blue) in the 1750, 1979, and 2007 simulations.
Tropospheric nitrate radical concentrations increased between 1750 and 1979 and then increased further or plateaued between 1979 and 2007 in the Summit source region (Fig. 3b), in the Denali source region (Fig. 3g), and as a global mean (Fig. 3l). The tropospheric nitrate radical concentrations increased by similar factors in both GC12 and GC13 in the Summit source region (factor of 2.3 and 2.8), in the Denali source region (1.2 and 1.6), and as a global mean (0.7 and 1.0), consistent with changes simulated by another global model (Khan et al., 2015). Notably, the absolute concentrations are a factor of 2.2–4.5 higher in GC13 than GC12. The higher nitrate radical concentrations may be driven in part by differences in ozone concentrations in model versions (Fig. 3d, i, and n), which are consistently 6–11 ppb higher in GC13 compared to GC12 across all simulation years. GC12 simulates an annual mean tropospheric ozone burden of 341 Tg O3 and GC13 simulates an annual mean tropospheric ozone burden of 381 Tg O3. Both versions are within the range of annual mean tropospheric ozone burden in the present day in simulations in the Coupled Model Intercomparison Project 6 (CMIP6) of 356±31 Tg (Griffiths et al., 2021).
In contrast to ozone and the nitrate radical, BrO concentrations are 0.04–0.19 ppt lower in GC13 compared to GC12. Modeled concentrations of BrO in the Summit source region increased by 12 %–42 % from 1750 to 2007 (Fig. 3b), similar to a 16 % increase in Russian Arctic BrO concentrations modeled by Zhai et al. (2024).
Tropospheric mean OH is up to 1.7×10⁵ molec cm−3 higher in GC13 compared to GC12, but changes between the 1750 and 1979 mean OH vary from −19 % to +13 % (Fig. 3e, j, and o). The PI–PD increase in global-mean tropospheric OH in GC13 is consistent with simulations in the Aerosol and Chemistry Model Intercomparison Project (AerChemMIP) (Stevenson et al., 2020), while the PI–PD decrease in global-mean tropospheric OH in GC12 is consistent with several models in Atmospheric Chemistry and Climate Model Intercomparison Project (ACCMIP) simulations (Murray et al., 2021). Investigating the reasons for the differences in oxidant concentrations between model versions is beyond the scope of this study, but the substantial differences in modeled oxidant concentrations between GC12 and GC13 are useful for examining the sensitivity of DMS oxidation to oxidant concentrations.
3.2 Comparison between ice core and modeled changes in MSA, bioSO4, and MSA bioSO4
Figure 4 shows a comparison between ice core observations and model simulations. We discuss the comparison between each time period in Sect. 3.2.1 and 3.2.2 and summarize these results in Sect. 3.2.3.
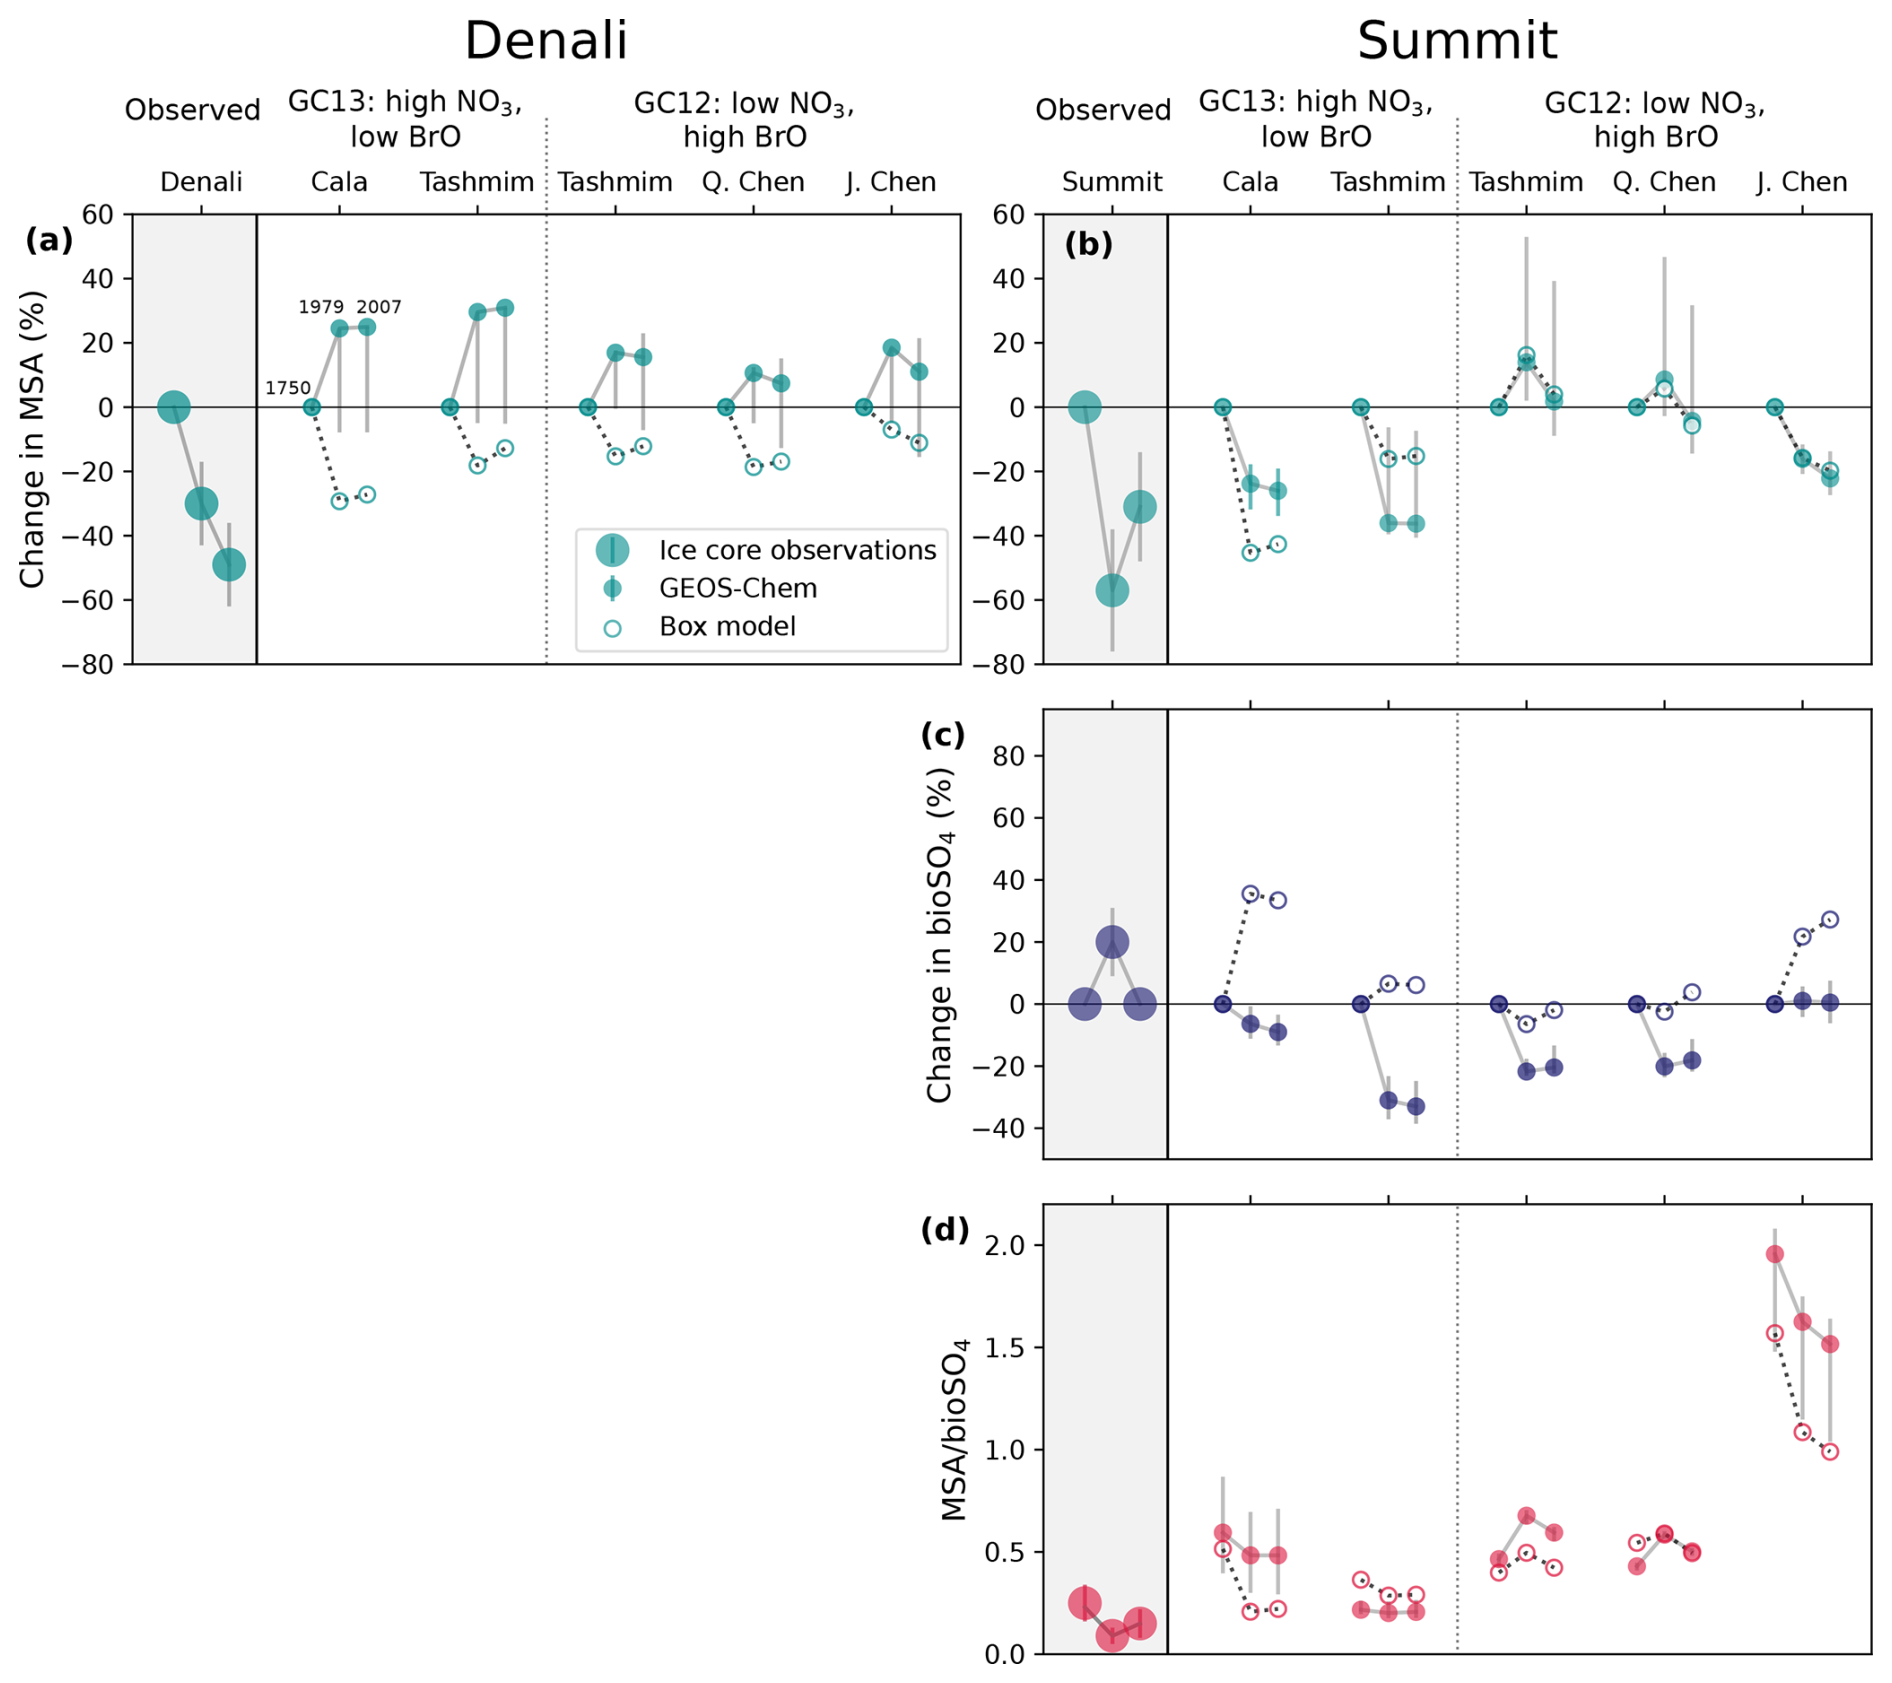
Figure 4Comparison between ice core observations and model experiments show that simulations can only partially reproduce ice core trends, and wide variation reflects sensitivity to oxidation mechanism and oxidant concentrations. Ice core MSA (top), bioSO4 (middle), and MSA bioSO4 (bottom) in the Denali (a) and Summit (b–d) ice cores compared to GEOS-Chem and box model results. Large markers are ice core observations, small solid markers are GEOS-Chem model deposition, and small outlined markers are box model concentration. MSA and bioSO4 changes are shown as a percent change from the preindustrial era for both ice core observations and model results. Markers show the percent change relative to the 1750 preindustrial baseline (left marker, always zero) in 1979 (middle marker) and 2007 (right marker) for MSA (a–b) and bioSO4 (c). In Fig. 4d, MSA bioSO4 is shown for 1750 (left markers), 1979 (middle markers) and 2007 (right markers). Denali ice core observations in (a) are shown as percent changes between the preindustrial era (1700 to 1962), the late 20th century (1962 to 1995), and top of the ice core (1996 to 2013). Summit ice core observations in (b) and (c) are shown as percent changes between the preindustrial era (1200 to 1865), Greenland minimum MSA (1969 to 1995), and top of ice core (1996 to top of ice core). Ice core error bars show the uncertainty propagated from measurement error and uncertainty in sulfur isotopic source signatures (Jongebloed et al., 2023a; Chalif et al., 2024a). GEOS-Chem model error bars show the range in MSA, bioSO4, and MSA bioSO4 deposition in the ice core grid cell and the surrounding eight grid cells. DMS emissions are the same in all GEOS-Chem simulations, and initial DMS concentrations are the same in all box model simulations.
3.2.1 Preindustrial (1750) to Greenland minimum MSA (1979) comparison
At Denali, ice core MSA concentrations decline by 32±13 % between the preindustrial era (1700–1962) and the late 20th century (1962–1995). In contrast, the modeled MSA is 7 %–31 % higher in the Denali grid cell in 1979 and 2007 compared to 1750 in all mechanisms and model versions in GEOS-Chem (Fig. 4a). All box model simulations produce a decline in MSA from 1750 to 1979. The reasons for the discrepancy between GEOS-Chem simulations, box model simulations, and Denali observations are explored in Sect. 3.3.
At Summit, ice core MSA concentrations decrease by 57±19 % between the preindustrial era (1200–1865) and Greenland minimum MSA concentrations (1969–1995). The Cala and Tashmim mechanisms using GC13 oxidants in the box model reproduce the direction of these trends but are too small in magnitude. In GEOS-Chem, the Cala and Tashmim mechanisms in GC13 and the Chen mechanism in GC12 simulate a 16 %–36 % decrease in MSA across these time periods, which is also qualitatively similar to the ice core trend but smaller in magnitude (Fig. 4b). In contrast, the Tashmim mechanism in GC12 produces trends in MSA from 1750 to 1979 that are opposite in sign to results produced by the Tashmim mechanism in GC13, indicating the sensitivity of these results to oxidants in different model versions.
Summit ice core bioSO4 increases from the preindustrial to Greenland MSA minimum (1969 to 1995) by 20±11 %. No GEOS-Chem simulations show a substantial increase in bioSO4 in the Summit grid cell, instead showing a change in bioSO4 from 1750 to 1979 ranging from −33 % to +1 % (Fig. 4b). In contrast, the box model simulations with the Cala, Tashmim, and J. Chen mechanisms show an increase in bioSO4, qualitatively aligning with the ice core trends.
In the Summit ice core, MSA bioSO4 decreases from 0.25±0.09 in the preindustrial era to 0.09±0.04 during the MSA minimum. Box model simulations using the Cala and Tashmim mechanisms with GC13 oxidants and J. Chen mechanism with GC12 oxidants produce trends that qualitatively align with Summit ice core decrease in MSA bioSO4 from 1750 to 1979. In GEOS-Chem, the Cala and J. Chen mechanisms simulate a decrease in MSA bioSO4, but MSA bioSO4 is a factor of 2–18 higher than ice core MSA bioSO4 over these time periods (Fig. 4d). The Tashmim mechanism in GC13 simulates MSA bioSO4 of 0.20–0.22, which is within the range of observed MSA bioSO4; however, unlike the Summit ice core, modeled MSA bioSO4 shows negligible changes between 1750 and 1979 in both GEOS-Chem and box model simulations. The Tashmim mechanism produces opposite trends in GC13 compared to GC12 (Fig. 4d).
3.2.2 Minimum Greenland MSA (1979) to top of ice core (2007) comparison
At Denali, MSA decreases further in the late 20th century to be 49±13 % lower at the turn of the century (1996 to 2013) relative to the preindustrial era. All but one box model simulations show an increase from 1979 to 2007, which is opposite to the observed trend. All GEOS-Chem simulations show a decrease over this time period, but 2007 MSA is still higher than 1750 MSA deposition in the model.
At Summit, none of the GEOS-Chem simulations show an increase in MSA between 1979 and 2007, in contrast to the observed 59±29 % increase in the Summit ice core. Summit bioSO4 decreases to the preindustrial mean at the turn of the century (1996 to 2007; Fig. 4c). While this trend is qualitatively captured by some box model simulations (Cala GC13 and Tashmim GC13), the magnitude is not reproduced by any box model simulation.
3.2.3 Summary of comparison between ice core observations and model simulations
In summary, box model and GEOS-Chem simulations can only partially reproduce observed trends in MSA, bioSO4, and MSA bioSO4 at Summit in some simulations (Cala in GC13, Tashmim in GC13, and J. Chen in GC12), and some GEOS-Chem and box model simulations produce the opposite of the observed trends (Tashmim in GC12, Q. Chen in GC12). GEOS-Chem simulates MSA trends at Denali that are opposite to the observed trends, but box model simulations can reproduce the decrease in MSA between 1750 and 1979 observed in the Denali ice core. Additionally, there are substantial differences across mechanisms and model versions. Only mechanisms without DMS + BrO (Cala and J. Chen) simulate both a decrease in MSA and a decrease in MSA bioSO4 in qualitative alignment with the Summit ice core. Mechanisms with DMS + BrO (Tashmim and Q. Chen) simulate negligible change or the opposite change to the trends observed in Summit MSA, bioSO4, and MSA bioSO4. No GEOS-Chem simulation reproduces the observed increase in Summit bioSO4, but box model simulations produce more positive bioSO4 trends compared to GEOS-Chem, in better alignment with the Summit ice core. All but one GEOS-Chem simulations overestimate the MSA bioSO4 ratio. The Tashmim mechanism simulates different trends in GC12 compared to GC13 in both GEOS-Chem and box model simulations, indicating the sensitivity of these results to oxidant concentrations. The differences in results across box model simulations, GEOS-Chem model versions, and DMS oxidation mechanisms are investigated in Sect. 3.3.
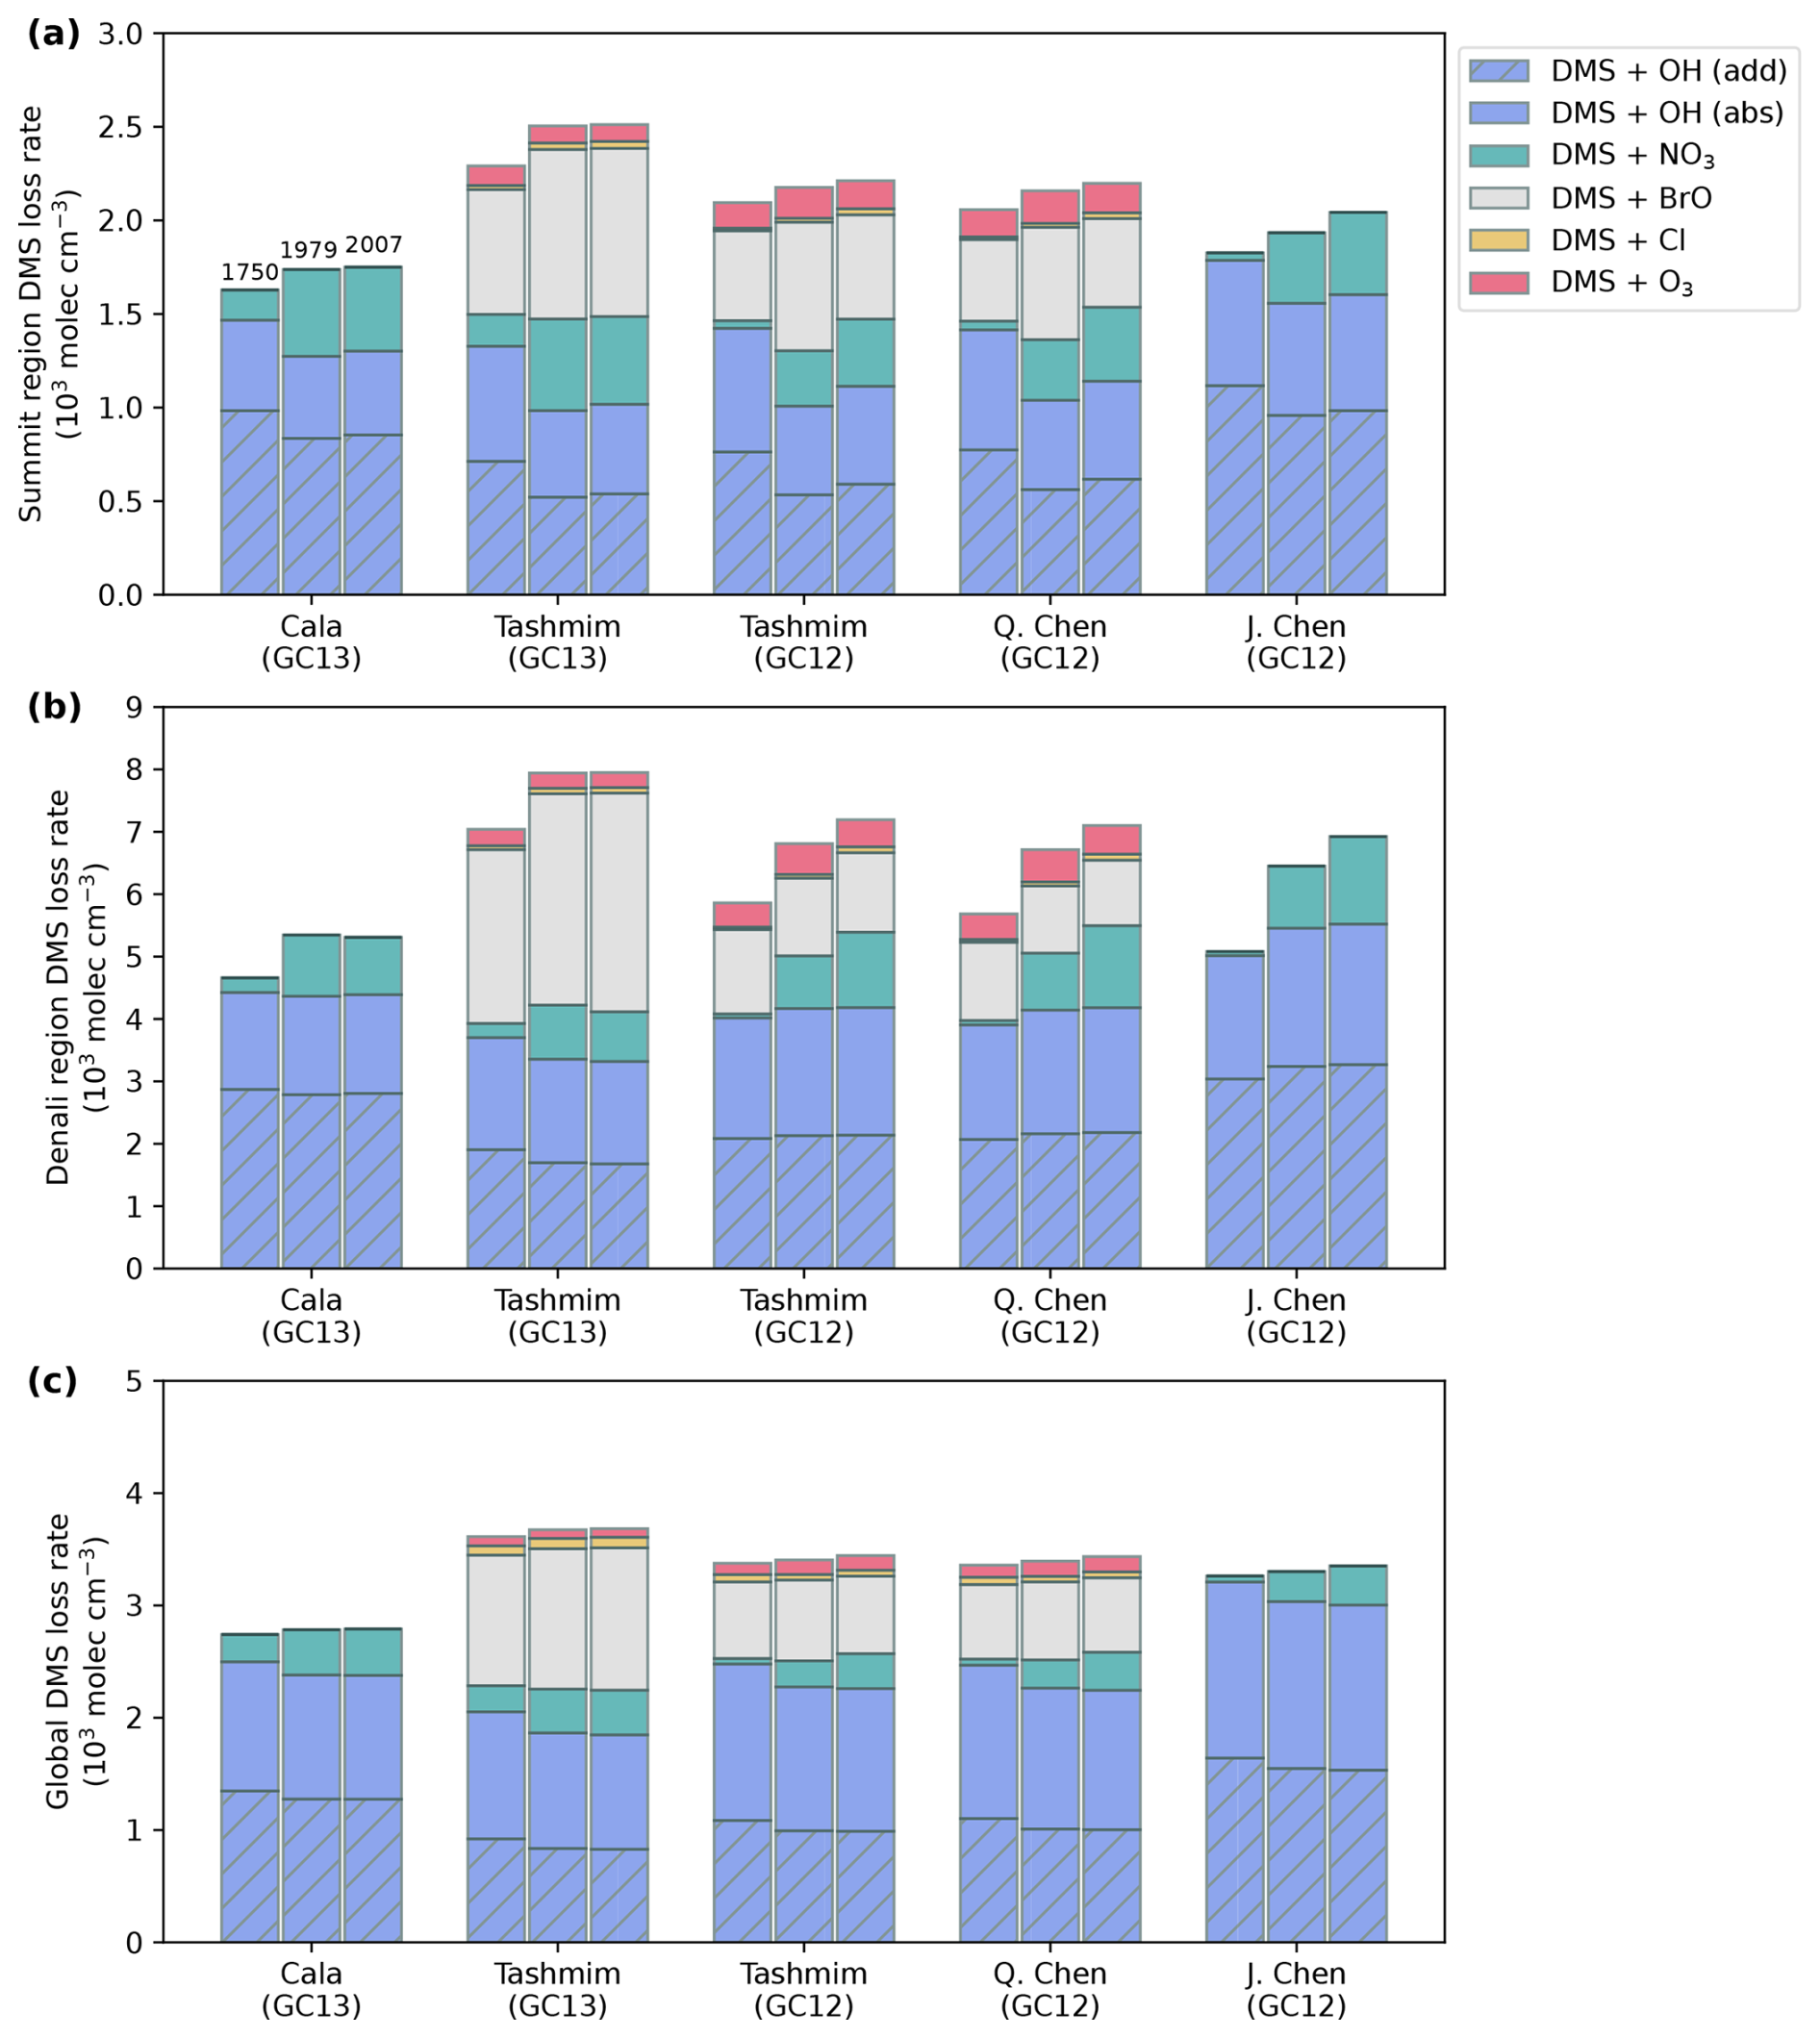
Figure 5Annual tropospheric mean reaction rate (103 molec cm−3 s−1) of DMS via OH addition (blue with hatching), OH abstraction (blue), nitrate radical (green), BrO (gray), chlorine radical (yellow), and ozone (red) (a) in the Summit source region, (b) in the Denali source region, (c) and as a global mean. The model mechanisms from Table 1 and GEOS-Chem version are shown on the x axis. For each mechanism and model version, the left column shows 1750, the middle shows 1979, and the right column shows 2007 (Table 1).
3.3 Explaining modeled changes in MSA, bioSO4, and MSA bioSO4
Figure 5 shows that the DMS oxidation rate by each oxidant changed between the preindustrial and polluted time periods in every mechanism and model version in the GEOS-Chem simulations. In the Summit source region across all simulations, oxidation of DMS via OH (addition) plus OH (abstraction) decreases from 1750 to 1979 and 2007 by 7 %–30 % (Fig. 5a) due to the combination of a decrease in OH concentration over these time periods in GC12 (Fig. 3e) and competition from other oxidants increasing in both GC12 and GC13. In the Denali source region, the change in contributions of the DMS + OH (addition) and DMS + OH (abstraction) pathways ranges from −12 % to +14 % from 1750 to 1979 and 2007 (Fig. 5b). Oxidation of DMS by the nitrate radical increases by a factor of 2.8–21 in all simulations in both the Summit and Denali source regions (Fig. 5a and b) due to an increase in nitrate radical concentrations in all simulations (Fig. 3). This increase in DMS + NO3 drives an increase in DMS oxidation through the isomerization pathway, which favors the production of bioSO4. In the Tashmim and Q. Chen mechanisms, which are the only mechanisms that include DMS + BrO and DMS + O3, an increase in BrO and O3 concentrations (Fig. 3c and d) drives a 35 %–120 % increase in DMS + BrO and a 3 %–30 % increase in DMS + O3. These changes cause an increase in DMS oxidation via the addition pathway, which favors MSA production.
The changes in DMS oxidation between 1750, 1979, and 2007 are relatively small on the global scale (Fig. 5c) due to a relatively smaller change in global-mean oxidant concentrations (Fig. 3l–o). Across all simulations, DMS + OH (addition) is 22 %–49 %, DMS + OH (abstraction) is 36 %–48 %, DMS + BrO is 0 %–34 %, DMS + NO3 is 1 %–15 %, DMS + O3 is 0 %–4 %, and DMS + Cl is 0 %–3 % (Fig. 5c). The relative contribution from the nitrate radical increased by 1 %–15 % globally from 1750 to 1979 and 2007, while the reactions between DMS and other oxidants changed by ±5 % (Fig. 5c).
Figure 6 shows that a decrease in the atmospheric lifetime of DMS and oxidation intermediates (DMSO, MSIA, SO2, etc.) due to increasing oxidant concentrations can cause a local trend in DMS oxidation products (MSA + bioSO4) in regions affected by anthropogenic pollution. While DMS emissions were the same in the 1750 and 2007 simulations, regional changes in MSA + bioSO4 deposition of up to ±50 % occur in regions where pollution affects oxidant concentrations. As anthropogenic pollution causes modeled oxidant concentrations to increase (Fig. 3), the global-mean DMS lifetime decreases in all simulations by 10 %–19 % (Fig. S7). As a result, the deposition of DMS oxidation products (MSA + bioSO4) increases in regions within or near both DMS emissions and oxidant changes, such as the North Atlantic, North Pacific, and the Southern Ocean near South America and Australia, where DMS is oxidized more quickly relative to the preindustrial era (Fig. 6b). Simultaneously, Fig. 6b shows that MSA + bioSO4 deposition decreases in regions that are distant from DMS emissions and influenced by pollution (i.e., over regions such as North America, Eurasia, and north Africa). The percentage change is especially large in regions with low deposition (e.g., Greenland). While Fig. 6 shows MSA + bioSO4 for the Cala simulations, results for other simulations are similar.
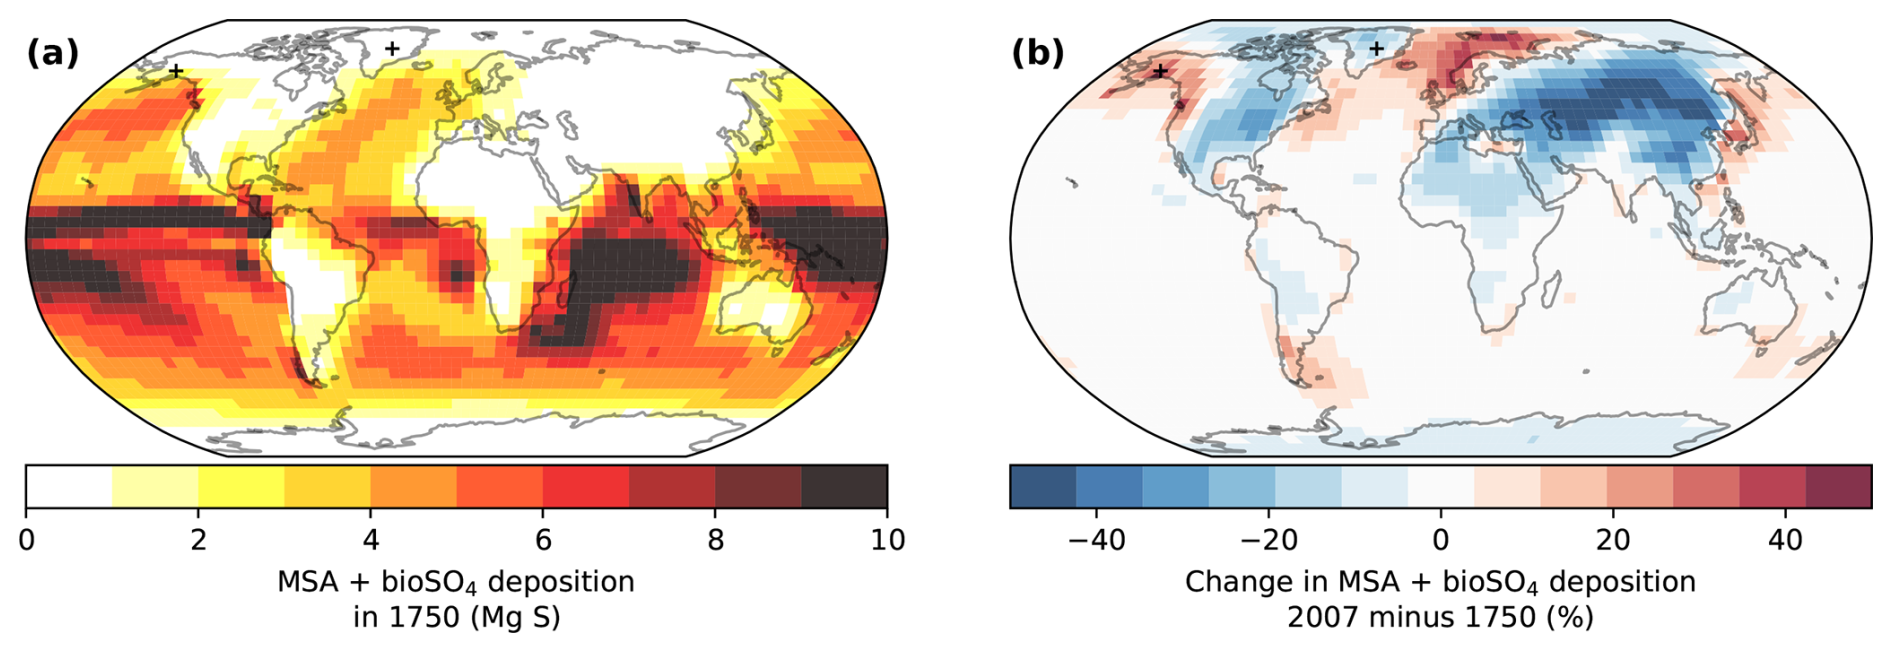
Figure 6Modeled deposition of total biogenic sulfur (MSA + bioSO4) in 1750 (a) and the percent change from 1750 to 2007 (b) in the Cala (GC13) simulations. Markers show the locations of the Denali and Summit ice cores. DMS emissions are the same in both simulations.
A trend in MSA or bioSO4 due to a decrease in DMS lifetime can offset or amplify a trend that occurs due to a change in MSA bioSO4 partitioning, which is demonstrated in Fig. 7. To estimate the effect of changing DMS lifetime on local trends in MSA deposition in Fig. 7, we multiply the fractional change in modeled MSA + bioSO4 deposition (Fig. 6b) by the preindustrial MSA deposition flux in each grid cell:
where ΔMSADMS lifetime is the change in MSA deposition due to a change in DMS lifetime between 1750 and 1979, (MSA + bioSO4)1979 is the MSA + bioSO4 deposition in 1979, (MSA + bioSO4)1750 is the MSA + bioSO4 deposition in 1750, and MSA1750 is the MSA deposition in 1750. The change in DMS lifetime also incorporates the change in lifetime of other MSA and bioSO4 precursors, e.g., DMSO, MSIA, and SO2.
To estimate the effect of changing MSA bioSO4 partitioning on MSA trends, we subtract ΔMSADMS lifetime from the change in MSA:
where ΔMSApartitioning is the change in MSA between 1750 and 2007 due to a change in MSA bioSO4 partitioning, which is caused by oxidants favoring different DMS pathways (Fig. 1), and ΔMSA is the total change in MSA deposition between 1750 and 1979.
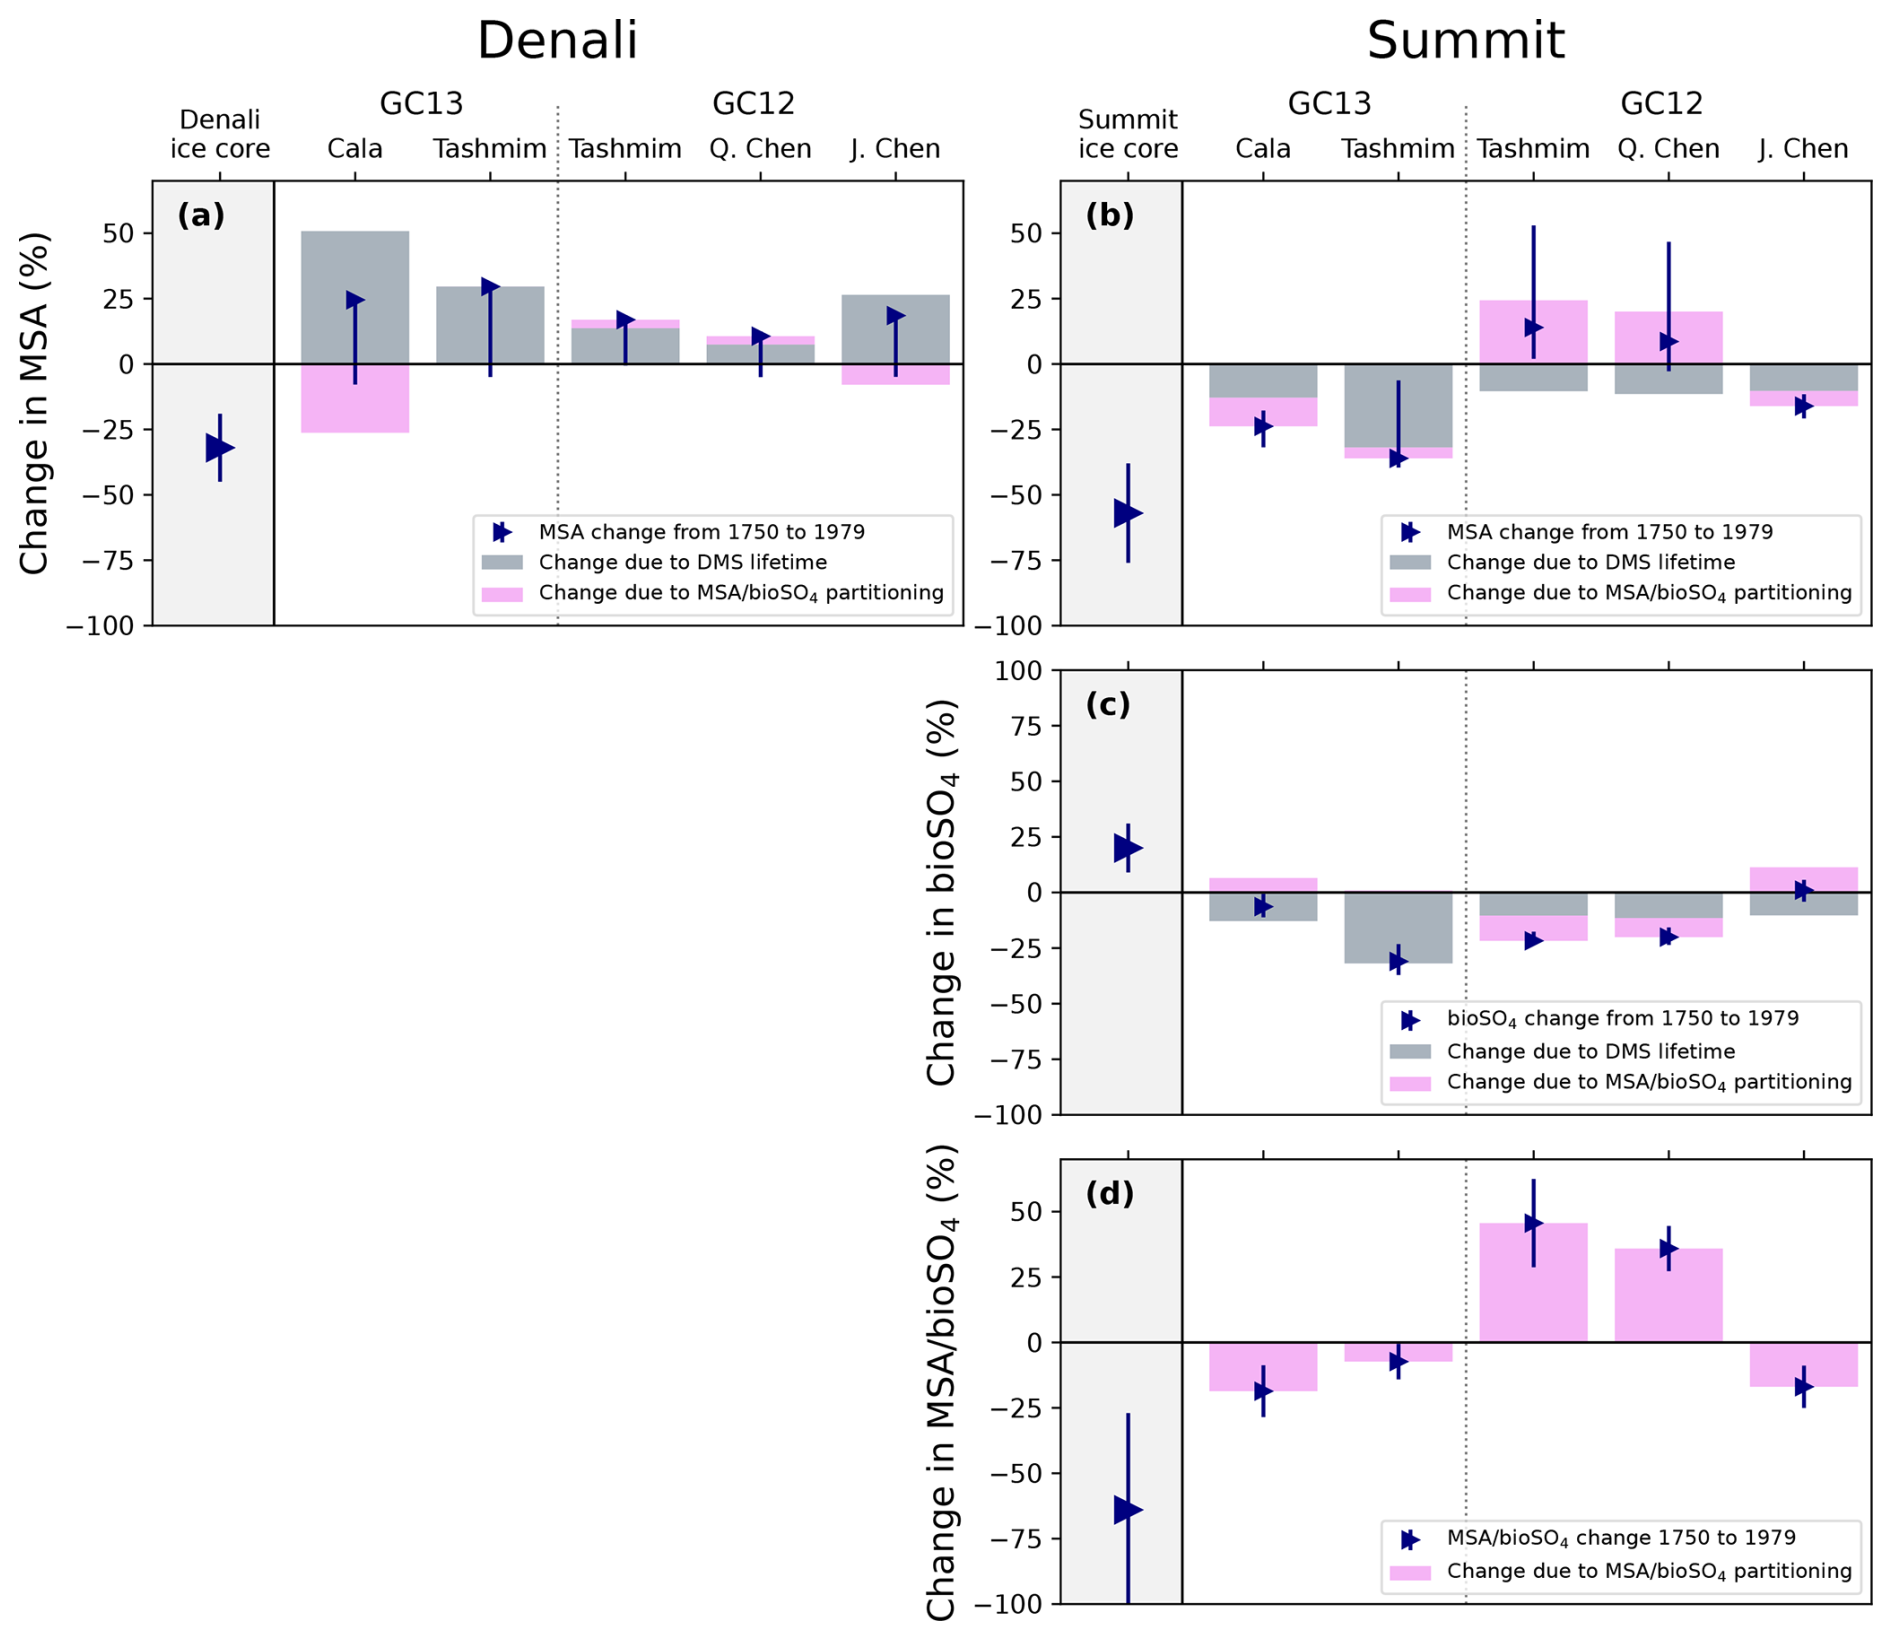
Figure 7Ice core and modeled changes in MSA (top), bioSO4 (middle) and MSA bioSO4 (bottom) deposition at Denali (a) and Summit (b–d). Gray bars show the modeled change in MSA, bioSO4, and MSA bioSO4 deposition in the ice core grid cell due to change in DMS lifetime (Eq. 1). Pink bars show the modeled change in MSA, bioSO4, and MSA bioSO4 deposition in the ice core grid cell due to change in MSA bioSO4 partitioning (Eq. 2). Blue triangles show the net change in MSA, bioSO4, and MSA bioSO4 deposition, and error bars are the range in net change in deposition in the surrounding grid cells. Ice core observations are shown as large blue triangles. This figure shows changes from 1750 to 1979, and similar changes between 1750 and 2007 are shown in Fig. S9.
Equations (1) and (2) are also applied to bioSO4 to estimate the change in bioSO4 due to a change in DMS lifetime (ΔbioSO4DMS lifetime) and change in bioSO4 due to a change in MSA bioSO4 partitioning (ΔbioSO4partitioning).
Figure 7 shows that GEOS-Chem ΔMSApartitioning and ΔbioSO4partitioning can be offset or amplified by ΔMSADMS lifetime and ΔbioSO4DMS lifetime. The changes in MSA and bioSO4 caused by a change in partitioning are qualitatively similar to the box model results. For example, in GEOS-Chem simulations using the Tashmim mechanism, ΔbioSO4partitioning is positive in GC13 and negative in GC12 (Fig. 7c), which aligns qualitatively with the box model results (Fig. 4c). Additionally, the Cala (GC13) and J. Chen (GC12) simulations produce the largest decrease in MSA at Summit in both the box model and in ΔMSApartitioning.
ΔMSADMS lifetime increases discrepancies between GEOS-Chem simulations and Denali ice core observations. While the Denali ice core shows MSA concentration decreases by 32±13 % between the preindustrial era and 1962–1995, GEOS-Chem simulates 7 %–51 % increase in MSA due to large, positive ΔMSADMS lifetime across all simulations (Fig. 7a). At Summit, the GEOS-Chem-modeled decrease in DMS lifetime between 1750 and 1979 contributes a 10 %–32 % decrease in Summit MSA deposition across all simulations. This ΔMSADMS lifetime is offset by a modeled increase in MSA bioSO4 in the Tashmim (GC12) and Q. Chen (GC12) simulations, causing a net positive trend modeled MSA, which is in contrast to the observed 57±19 % decrease. However, in the Cala (GC13), Tashmim (GC13), and J. Chen (GC12) simulations, the decrease in MSA bioSO4 partitioning drives an additional decrease in MSA of 4 %–11 %, which amplifies ΔMSADMS lifetime and qualitatively aligns with the Summit ice core MSA. A larger increase in MSA bioSO4 of 50 %–90 % would be needed to reproduce the observed 20±11 % increase in Summit ice core bioSO4. While the Summit ice core MSA bioSO4 changes by between the preindustrial era and the MSA minimum (1969–1995), no model simulation reproduces a decrease of this magnitude (Fig. 7d).
In summary, the overall qualitative similarity between box model results (Fig. 4) and GEOS-Chem ΔMSApartitioning, ΔbioSO4partitioning, and change in MSA bioSO4 (pink bars in Fig. 7) suggest that discrepancies between GEOS-Chem and the box model are primarily driven by the GEOS-Chem-modeled change in DMS lifetime. The change in DMS lifetime is sensitive to the overall change in oxidant concentrations (OH, NO3, BrO, Cl, and O3), which is difficult to constrain. The modeled change in DMS lifetime may also be sensitive to the transport and deposition efficiencies of MSA and sulfate (Fig. 6), which may not be represented well in simulations at low 4°×5° model resolution. ΔMSADMS lifetime and ΔbioSO4DMS lifetime lead to misalignment between GEOS-Chem results and Denali ice core observations and box model results, suggesting that under- or over-efficient transport and deposition could contribute to model–observation discrepancies in GEOS-Chem simulations at Denali.
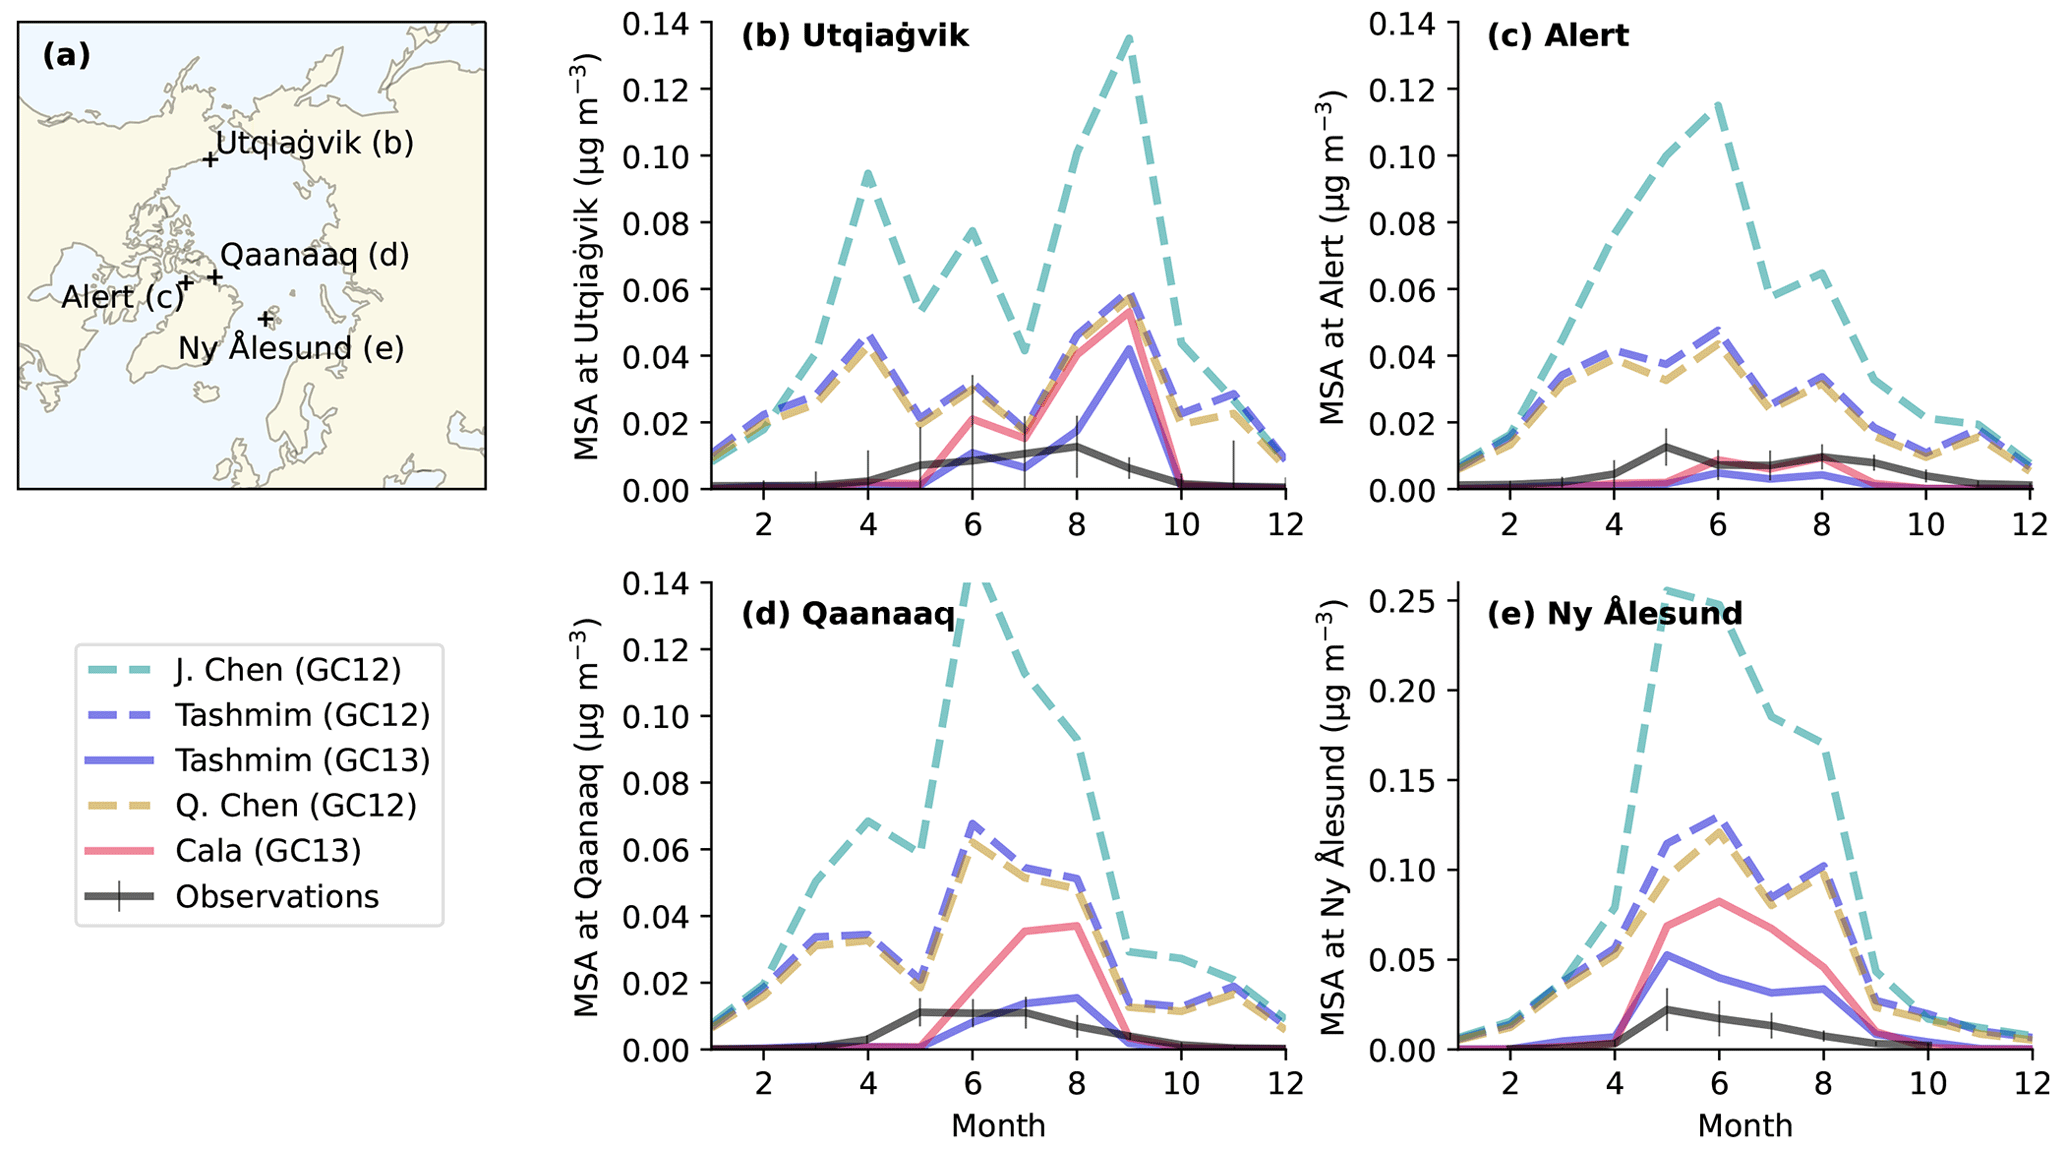
Figure 8Observed monthly mean surface MSA concentrations (black lines in b–e) at four Arctic sites (a) compared to modeled MSA concentrations in several DMS oxidation mechanisms (colored lines in b–e). The four Arctic sites include (b) Utqiaġvik (formerly Barrow), Alaska (1997–2022); (c) Alert, Canada (1980–2019); (d) Qaanaaq (formerly Thule) (2010–2020), Greenland; and (e) Ny Ålesund (Zeppelin), Svalbard (1990–2004). The error bars show the 25th to 75th percentiles, and the solid black line is the monthly surface MSA concentration following Becagli et al. (2019). The simulations include the four mechanisms in Table 1, including the J. Chen mechanism in GC12 (dashed turquoise line), the Tashmim mechanism in GC12 (dashed purple line), the Tashmim mechanism in GC13 (solid purple line), the Q. Chen mechanism in GC12 (dashed yellow line), and the Cala mechanism in GC13 (solid pink line). DMS emissions are the same in all simulations.
3.4 Implications for Antarctic ice core records of MSA
The modeled changes in MSA + bioSO4 deposition are smaller in Antarctica compared to Denali and Summit (Fig. 6b) due to the relatively small influence of anthropogenic pollution in this region. We examine modeled trends in MSA, bioSO4, and MSA bioSO4 in five grid cells containing Antarctic ice core records of MSA concentrations (Abram et al., 2010; Becagli et al., 2009; Curran et al., 2003; Osman et al., 2017; Rahaman et al., 2016; Vega et al., 2016). Antarctic ice core studies find changes in MSA ranging from negligible (e.g., West Antarctica; Osman et al., 2017) to substantial (e.g., 20 %–30 % in coastal East Antarctica; Curran et al., 2003). We find that the model simulates a change in MSA, bioSO4, and MSA bioSO4 of at any ice core location (Fig. S8). The relatively low influence of pollution on Southern Ocean region oxidants, and consequently MSA, bioSO4, and MSA bioSO4, suggests that recent trends in MSA may be driven by other factors such as sea ice concentration, primary production, and meteorology. However, MSA can undergo post-depositional loss in low-accumulation regions such as East Antarctica via oxidation to form sulfate, which can affect long-term trends in MSA (Hattori et al., 2024). Additionally, vertical migration of the methanesulfonate ion can smooth annual and sub-decadal signals, especially in low-accumulation regions (Osman et al., 2017).
3.5 Comparison between model simulations and in situ observations
Figure 8 shows that simulations in GC13 better reproduce monthly surface MSA concentrations at four Arctic sites compared to GC12. The four sites include Alert, Canada (82° N, 62° W; 1980 to 2019); Ny Ålesund (Zeppelin), Svalbard (79° N, 12° E; 1990 to 2004); Utqiaġvik (formerly Barrow), Alaska (71° N, 157° W; 1997 to 2022); and Qaanaaq (formerly Thule), Greenland (77° N, 69° W; 2010 to 2020) (Becagli et al., 2019; Quinn et al., 2009; Schmale et al., 2022; Sharma et al., 2019).
Model simulations using GC12 consistently overestimate surface MSA concentrations at Arctic sites by a factor of 2–80 during the months of highest MSA concentrations in the spring and summer (Fig. 8). With an updated wet deposition scheme resulting in reduced atmospheric concentrations of soluble species (Luo et al., 2019, 2020), GC13 simulations with the Cala and Tashmim mechanisms overestimate spring–summer MSA concentrations by a smaller factor of 0–20 at Utqiaġvik, Qanaak, and Ny Ålesund (Fig. 8e) and underestimate spring–summer MSA concentrations at Alert or in winter–fall months at other stations by up to a factor of 8. Winter MSA concentrations at Arctic stations are close to zero in observations and in GC13 simulations but overestimated by up to 0.05 µg m−3 at all stations in simulations using GC12. GEOS-Chem model simulations using the updated wet deposition scheme in GC13 (Luo et al., 2019, 2020) have been shown to better represent aircraft observations of aerosol mass concentrations (Gao et al., 2022) but result in biased model representation of surface sulfate concentrations and nitrate deposition over the continental United States (Dutta and Heald, 2023). The global annual surface mean MSA and bioSO4 concentrations in each simulation are shown in Fig. S10.
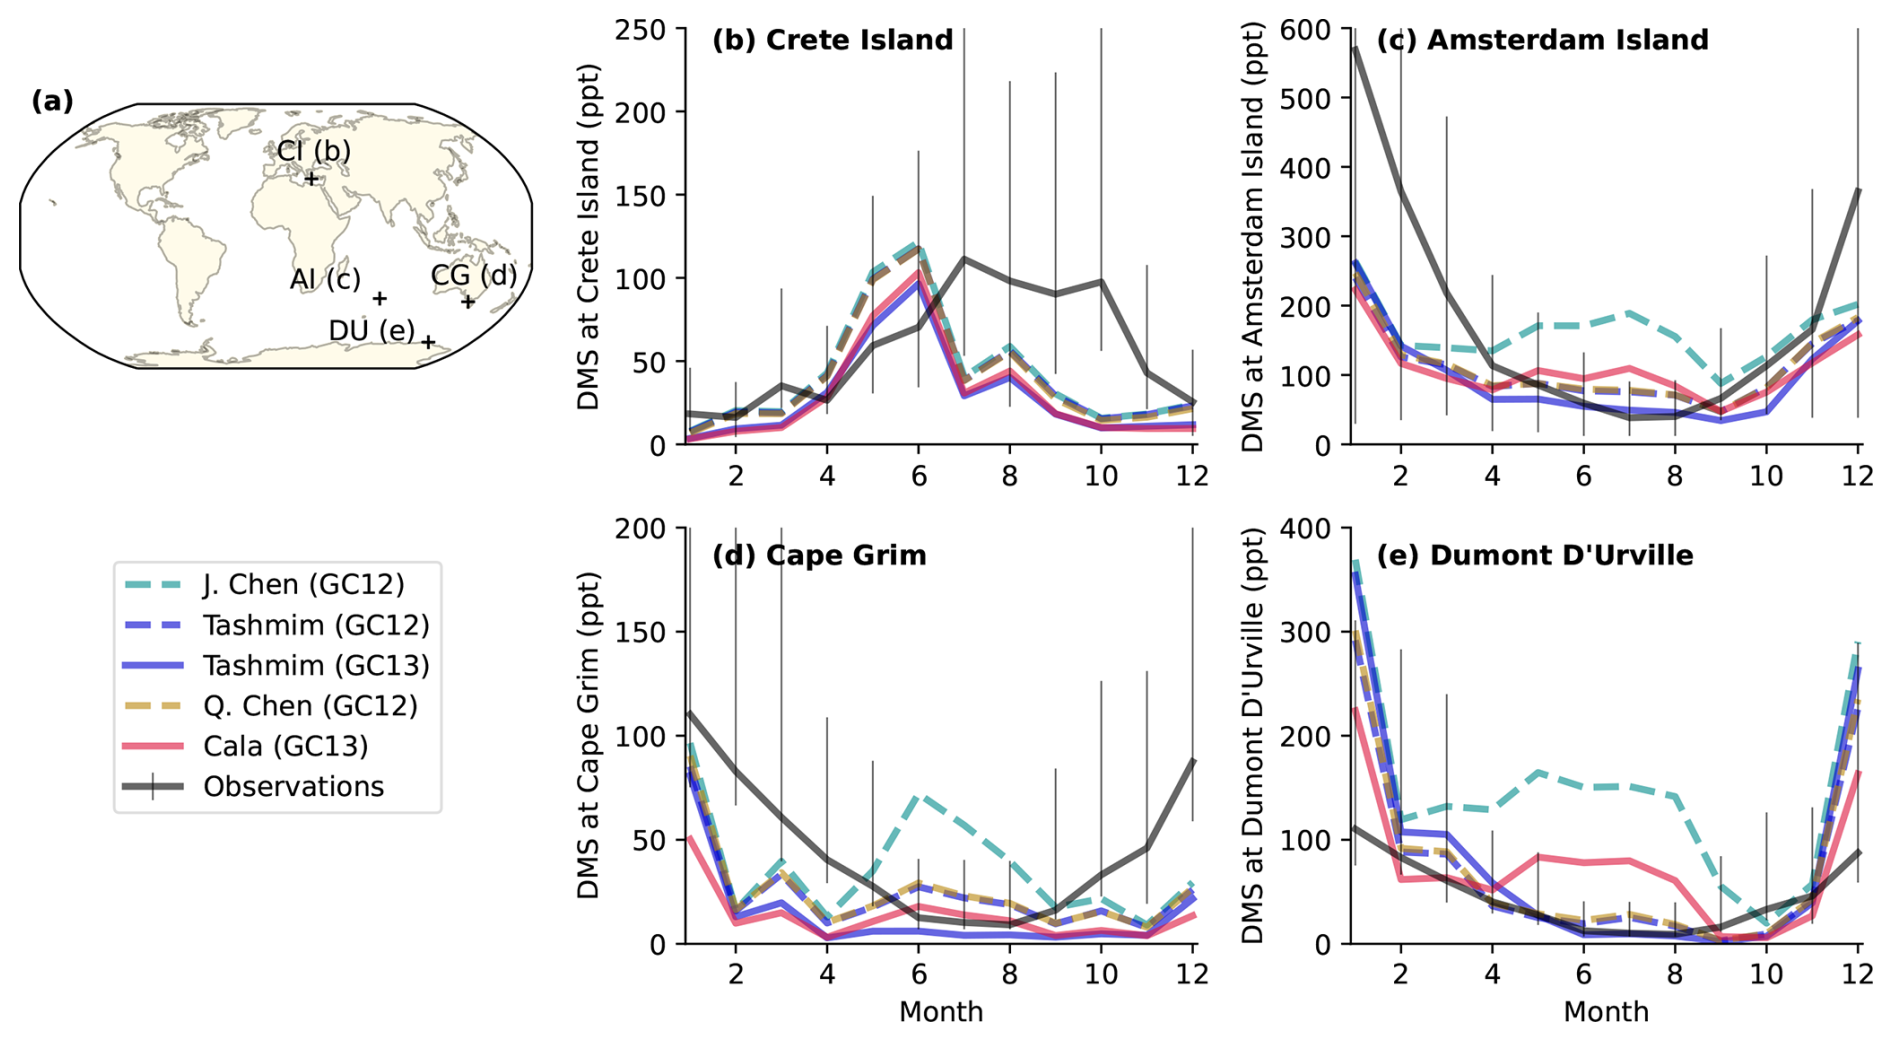
Figure 9Monthly DMS mixing ratios in model simulations (colored lines) compared to long-term observations (black lines) at four sites including (b) Crete Island (CI; 35° N, 26° E; 1997–1999), (c) Amsterdam Island (AI; 38° S, 77° E; 1987–2006), (d) Cape Grim (CG; 40° S, 144° E; 1989–1992), and (e) Dumont D'Urville (DU; 66° S, 140° E; 1998–2006). The error bars show the 25th to 75th percentiles, and the solid black line is the monthly surface concentration anomaly of MSA following Chen et al. (2018). The simulations include the four mechanisms in Table 1, including the J. Chen mechanism in GC12 (dashes turquoise line), the Tashmim mechanism in GC12 (dashed purple line), the Tashmim mechanism in GC13 (solid purple line), the Q. Chen mechanism in GC12 (dashed yellow line), and the Cala mechanism in GC13 (solid pink line). DMS emissions are the same in all simulations.
Figure 9 compares the observed and modeled DMS mixing ratio at four island or coastal sites. The four stations are Crete Island (CI; 35° N, 26° E; 1997–1999; Kouvarakis and Mihalopoulos, 2002), Amsterdam Island (AI; 38° S, 77° E; 1987–2006; Castebrunet et al., 2009), Cape Grim (CG; 40° S, 144° E; 1989–1992; Ayers et al., 1995), and Dumont D'Urville (DU; 66° S, 140° E; 1998–2006; Castebrunet et al., 2009). At Crete Island, observed DMS concentrations peak in July through October, but modeled DMS concentrations peak in May to June (Fig. 9b). The magnitude of the peak DMS mixing ratio (96–121 ppt) in June across all simulations is similar to the peak observed mixing ratio (111–104 ppt) in July. Model mechanisms that do not include DMS + BrO (Cala, J. Chen) do not reproduce the observed seasonality in DMS mixing ratio in Southern Ocean sites, similar to findings from Chen et al. (2018) (Fig. 9c–e). The observed DMS mixing ratio is at a maximum in austral summer (DJF) at Amsterdam Island (Fig. 9c), Cape Grim (Fig. 9e), and Dumont D'Urville (Fig. 9e). This austral summer peak is reproduced by mechanisms that include DMS + BrO (Tashmim, Q. Chen), but these simulations underestimate the summer DMS mixing ratio by 50 %–70 % during December at Cape Grim and Amsterdam Island and overestimate summer DMS mixing ratio by up to a factor of 3 at Dumont D'Urville. The mechanisms that do not include DMS + BrO (Cala, J. Chen) show a winter peak in DMS in the month of July at Dumont D’Urville (Fig. 9e) and variable DMS mixing ratios without a distinct seasonality at Amsterdam Island (Fig. 9c) and Cape Grim (Fig. 9d). In all three Southern Ocean sites, the winter (JJA) DMS mixing ratio is overestimated by 20 %–180 % in the J. Chen (GC12), Cala (GC13), Tashmim (GC12), and Q. Chen (GC12) simulation. The discrepancy between observed and modeled DMS concentrations and seasonality may reflect inaccurate magnitude and seasonality in DMS emissions, missing or mischaracterized DMS oxidation chemistry, or both.
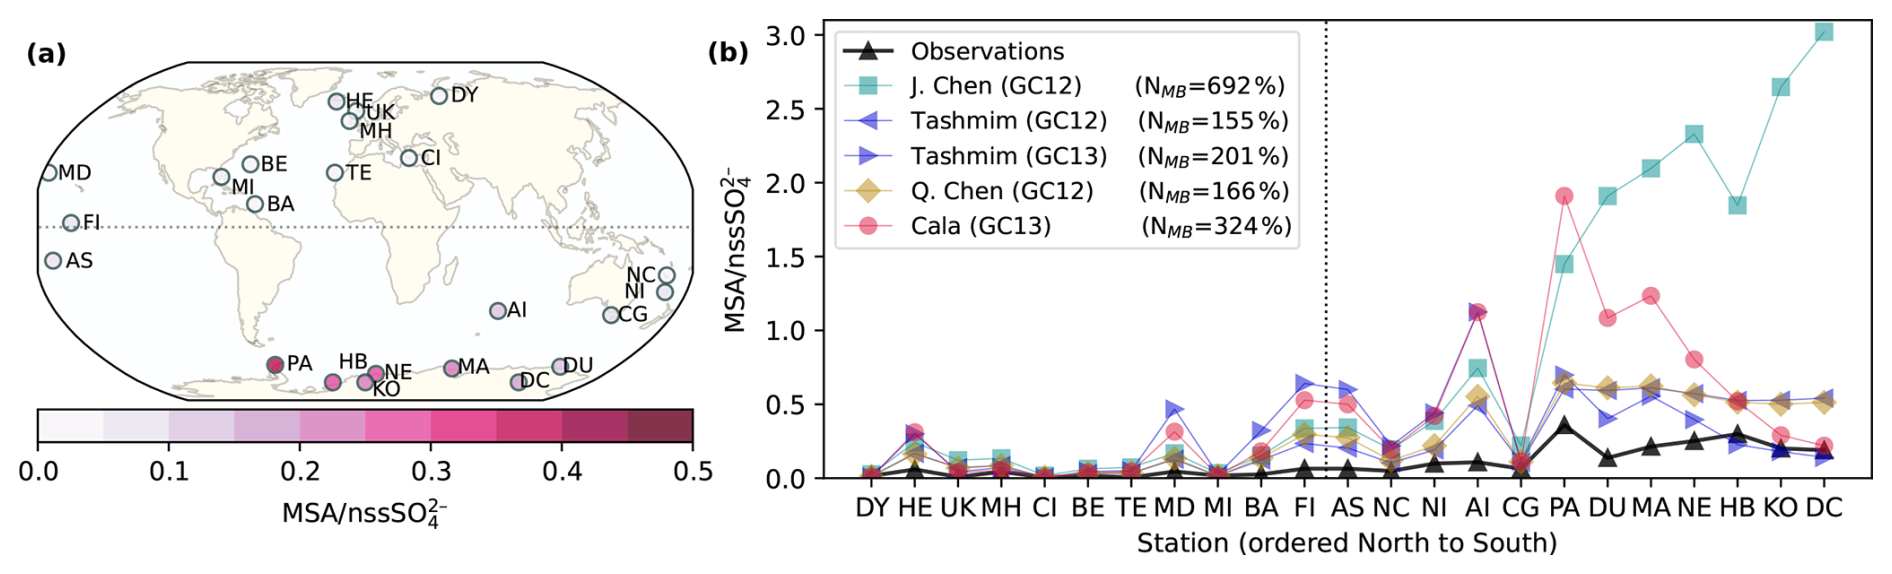
Figure 10Comparison between modeled and observed annual-mean surface MSA nssSO concentration ratio. (a) Observed annual mean surface MSA nssSO at 23 sites around the world. (b) Comparison between observed annual mean MSA nssSO and modeled MSA nssSO in the J. Chen (GC12) simulation (turquoise square), the Tashmim (GC12) simulation (left-pointing purple triangle), the Tashmim (GC13) simulation (right-pointing purple triangle), the Q. Chen (GC12) simulation (yellow diamond), and the Cala (GC13) simulation (pink circle) using the same 2007 meteorology and emissions in all simulations. Stations include Dye (DY; 66° N, 53° E), Heimaey (HE; 63° N, 20° W), United Kingdom (UK; 58° N, 20° W), Mace Head (MH; 53° N, 10° W), Crete Island (CI; 35° N, 25° E), Bermuda (BE; 32° N, 65° W), Tenerife (TE; 28° N, 17° W), Midway Island (MD; 28° N, 177° W), Miami (MI; 26° N, 80° W), Barbados (BA; 13° N, 60° W), Fanning Island (FI; 4° N, 159° W), American Samoa (AS; 14° S, 170° W), New Caledonia (NC; 21° S, 166° E), Norfolk Island (NI; 29° S, 168° E), Amsterdam Island (AI; 38° S, 77° E), Cape Grim (40° S, 144° E), Palmer (PA; 65° S, 64° W), Dumont D'Urville (DU; 66° S, 140° E), Mawson (MA; 67° S, 63° E), Neumayer (NE; 70° S, 8° W), Halley Bay (HB; 75° S, 26° W), Kohnen (KO; 75° S, 0° E), and Dome C (DC; 75° S, 123° E). The time period sampled varies by site, ranging from less than 1 year to multiple decades. The legend also shows the normalized mean bias (NMB) for each simulation. The dashed gray line shows the delineation between Northern and Southern Hemisphere sites.
Figure 10 compares modeled and observed ratios of MSA to non-sea salt sulfate (nssSO) at 23 stations around the globe and shows that all model simulations overestimate MSA nssSO relative to observations at most sites. Most of the data are obtained from Gondwe et al. (2004), except for Crete Island from Kouvarakis and Mihalopoulos (2002) and Amsterdam Island, Palmer, Kohnen, and Dome C from Casterbrunet et al. (2009). We compute the normalized mean bias (NMB) for each simulation following Chen et al. (2018): , where Mi is the modeled MSA nssSO in the surface grid cell of each station, and Oi is the observed MSA nssSO. (NMB) ranges from 155 % to 692 %, indicating a large overestimation in MSA nssSO by all simulations (Fig. 10). The overestimate is largest in the Southern Hemisphere stations on the Antarctic Coast, where there is negligible influence from anthropogenic emissions on nssSO. The observed MSA nssSO ranges from 0.005 (Crete Island) to 0.35 (Palmer). Modeled MSA nssSO ranges from 0.006–3.02 in model simulations. The maximum MSA nssSO in each modeled mechanism is 0.61 to 3.02, a factor of 1.8–8.4 higher than the observed maximum. We note that discrepancies between observed and modeled MSA nssSO could occur due to mischaracterized DMS oxidation chemistry, SO2 oxidation chemistry, DMS emissions, anthropogenic SO2 emissions, and/or natural sulfur emissions.
We investigate DMS oxidation chemistry over the industrial era by comparing model simulations with four different DMS chemical oxidation mechanisms to ice core observations of MSA and bioSO4. Jongebloed et al. (2023a) and Chalif et al. (2024a) hypothesize that a pollution-driven increase in nitrate radical in the Summit and Denali ice core source regions drove the observed industrial-era decline in ice core MSA and concurrent increase in bioSO4. We show that some box model simulations can qualitatively reproduce trends in DMS oxidation products at Summit, but GEOS-Chem simulations cannot reproduce Summit trends in either MSA or bioSO4, and only one box model simulation and no GEOS-Chem simulations can reproduce trends at Denali. Additionally, different oxidation mechanisms and model versions lead to a wide range in results. In agreement with the hypothesized NO3-driven MSA decline from Jongebloed et al. (2023a) and Chalif et al. (2024a), we find that DMS + NO3 increased over the industrial era in both the North Atlantic and North Pacific regions, favoring the production of bioSO4 in all simulations and driving a decrease in MSA, which aligns with ice core observations. In simulations that include the reaction of DMS with BrO, the industrial-era increase in BrO drives increased production of MSA and offsets the NO3-driven decrease, which results in a discrepancy between modeled and observed trends in MSA in some simulations. We compare present-day GEOS-Chem simulations with in situ observations and show that DMS + BrO is needed to capture the seasonality of atmospheric concentrations of DMS. A potential overestimate in MSA production in simulations with DMS + BrO could result from overestimated BrO concentrations, underestimated NO3 concentrations, overly efficient MSA production from the addition pathway, or other missing or misrepresented DMS oxidation chemistry.
Substantially different results using the Tashmim mechanism in two different model versions with different oxidant concentrations (GC12 and GC13 in both GEOS-Chem and box modeling) show that inaccurate oxidant concentrations may contribute to model–observation discrepancies in simulations that cannot reproduce ice core trends. The sensitivity of our results to oxidant concentrations suggests that improving our understanding of oxidant changes is critical to improving comparison between modeled and observed DMS oxidation products. Box model simulations using GC13 better align with ice core trends, suggesting that GC13 may more accurately represent trends and concentrations in oxidants over the industrial era compared to GC12. Interestingly, the trends, seasonality, and surface concentrations in MSA, bioSO4, DMS, and MSA nssSO are similar in the Tashmim and Q. Chen mechanisms when using the same model version. The Q. Chen mechanism includes DMS + OH, NO3, BrO, Cl, and O3 and intermediates such as DMSO and MSIA but does not explicitly account for the formation of HPMTF and other short-lived isomerization pathway intermediates, suggesting that a simplified mechanism for DMS chemistry may be sufficient in modeling the abundance, seasonality, and trends in DMS-derived aerosols and their effects on global radiative forcing.
The discrepancies between observed and modeled trends in MSA and bioSO4 in GEOS-Chem simulations might imply missing or misrepresented DMS oxidation chemistry. Recent studies investigating gas-phase DMS chemistry have discovered important pathways of MSA and sulfate production through intermediates such as HPMTF, MSP, and CH3SO2. We suggest that future studies should investigate aqueous-phase chemistry, which produces 82 %–99 % of MSA and bioSO4 in our simulations. In simulations that include HPMTF as an intermediate, 50 %–80 % of bioSO4 is formed through aqueous-phase oxidation of HPMTF, but the chemical reaction (or reactions) forming sulfate from HPMTF in the aqueous phase is currently unknown. Additionally, future studies analyzing the oxygen isotopes of MSA might indicate missing or misrepresented chemistry in the DMS oxidation mechanism by quantifying the importance of different oxidation pathways, similar to previous studies quantifying sulfate formation through Δ17O(SO) (Hattori et al., 2021, 2024; Sofen et al., 2011). Inclusion of methanethiol may improve model–observation comparison because methanethiol favors bioSO4 production over MSA (Novak et al., 2022). Finally, it is possible that uncertainty in reaction rates for key reactions (e.g., DMS + NO3, MSA + OH) could contribute to discrepancies between modeled and observed trends in DMS oxidation products.
In general, interpretation of ice core or in situ observations of short-lived oxidized species, such as MSA and sulfate, should consider how changes in the lifetimes of precursors and in oxidation pathways can influence long-term trends. For example, in regions influenced by pollution or other factors that affect oxidant concentrations, trends in MSA should be assumed to at least partially reflect changing oxidation chemistry. Currently, model simulations alone cannot be used to estimate the potential influence of changing atmospheric chemistry on long-term trends in MSA. Instead, measurements of sulfur isotopes that provide estimates of total biogenic sulfur (MSA + bioSO4) and the ratio of oxidation products (MSA bioSO4) can indicate whether and how much atmospheric chemistry has influenced DMS oxidation and trends in MSA and bioSO4.
DMS is a major source of aerosol and cloud condensation nuclei that influence global climate and is an increasingly large fraction of atmospheric sulfate as anthropogenic pollution emissions decrease (Jongebloed et al., 2023a). The four mechanisms of DMS oxidation tested in this study simulate different magnitudes of MSA and bioSO4 and different fractions of MSA and sulfate produced in the gas vs. aqueous phase, which has implications for new particle formation and aerosol–cloud interactions. Understanding and accurately modeling DMS oxidation is critical for understanding past and future climate, especially in light of proposed marine cloud brightening efforts to offset warming caused by greenhouse gases and potential future decreases in anthropogenic aerosol radiative forcing.
Ice core data were obtained from the referenced papers (Jongebloed et al., 2023a, b, c; Chalif et al., 2024a) and are available in the NSF Arctic Data Center at https://doi.org/10.18739/A2WW7717K (Jongebloed et al., 2023d), https://doi.org/10.18739/A2N873162 (Jongebloed et al., 2022), https://doi.org/10.18739/A26T0GX7K (Jongebloed et al., 2023), and https://doi.org/10.18739/A2Q814T9K (Chalif et al., 2024b). In situ data were obtained from the referenced papers (Ayers et al., 1995; Becagli et al., 2019; Gondwe et al., 2004; Kouvarakis and Mihalopoulos, 2002; Quinn et al., 2009; Schmale et al., 2022). GEOS-Chem versions 12.9.3 and 13.2.1 are available online (at https://doi.org/10.5281/zenodo.3974569 The International GEOS-Chem User Community, 2020, and at https://doi.org/10.5281/zenodo.5500717, The International GEOS-Chem User Community, 2021).
The supplement related to this article is available online at https://doi.org/10.5194/acp-25-4083-2025-supplement.
UAJ designed the research study, ran the simulations, performed the analysis, and wrote the manuscript. BA initiated and supervised the study. JIC contributed to study design, and JIC, ECO, and BGK contributed to analysis. BA, LT, WCP, KHB, and QC contributed to model development. UAJ, BA, and JC-D contributed to Summit ice core data collection and analysis. JIC, ECO, BGK, DAW, KJK, DGF, and CPW contributed to Denali ice core data collection and analysis. All authors contributed to interpretation and writing.
At least one of the (co-)authors is a member of the editorial board of Atmospheric Chemistry and Physics. The peer-review process was guided by an independent editor, and the authors also have no other competing interests to declare.
Publisher's note: Copernicus Publications remains neutral with regard to jurisdictional claims made in the text, published maps, institutional affiliations, or any other geographical representation in this paper. While Copernicus Publications makes every effort to include appropriate place names, the final responsibility lies with the authors.
Ursula A. Jongebloed and Becky Alexander acknowledge awards PLR 1904148, PLR 2230350, and AGS 2202287. Qianjie Chen acknowledges the Hong Kong Research Grants Council (grant nos. 15223221 and 15219722). Dominic A. Winski acknowledges awards AGS 1204035 and OPP 2002470. Karl J. Kreutz acknowledges AGS 0713974, 1203838, 1502783, 1806422, and 2002483. Erich C. Osterberg and Jacob I. Chalif acknowledge AGS 1204035, and Cameron P. Wake acknowledges AGS 1203863.
This research has been supported by the Office of Polar Programs (grant nos. 1904148, 2230350, and 2002470); the Division of Atmospheric and Geospace Sciences (grant nos. 2202287, 1204035, 0713974, 1203838, 1502783, 1806422, 2002483, and 1203863); and the University Research Committee, University of Hong Kong (grant nos. 15223221 and 15219722).
This paper was edited by Gunnar Myhre and reviewed by two anonymous referees.
Abram, N. J., Thomas, E. R., McConnell, J. R., Mulvaney, R., Bracegirdle, T. J., Sime, L. C., and Aristarain, A. J.: Ice core evidence for a 20th century decline of sea ice in the Bellingshausen Sea, Antarctica, J. of Geophys. Res.-Atmos., 115, https://doi.org/10.1029/2010JD014644, 2010. a
Abram, N. J., Wolff, E. W., and Curran, M. A.: A review of sea ice proxy information from polar ice cores, Quaternary Sci. Rev., 79, 168–183, https://doi.org/10.1016/j.quascirev.2013.01.011, 2013. a
Alexander, B., Park, R. J., Jacob, D. J., and Gong, S.: Transition metal-catalyzed oxidation of atmospheric sulfur: Global implications for the sulfur budget, J. Geophys. Res.-Atmos., 114, https://doi.org/10.1029/2008JD010486, 2009. a, b
Alexander, B., Allman, D. J., Amos, H. M., Fairlie, T. D., Dachs, J., Hegg, D. A., and Sletten, R. S.: Isotopic constraints on the formation pathways of sulfate aerosol in the marine boundary layer of the subtropical northeast Atlantic Ocean, J. Geophys. Res.-Atmos., 57, 21168–21177, https://doi.org/10.1029/2011JD016773, 2012. a, b
Ayers, G. P., Bentley, S. T., Ivey, J. P., and Forgan, B. W.: Dimethylsulfide in marine air at Cape Grim, 41°S, J. Geophys. Res.-Atmos., 100, 21013–21021, https://doi.org/10.1029/95JD02144, 1995. a, b, c
Bates, K. H. and Jacob, D. J.: A new model mechanism for atmospheric oxidation of isoprene: global effects on oxidants, nitrogen oxides, organic products, and secondary organic aerosol, Atmos. Chem. Phys., 19, 9613–9640, https://doi.org/10.5194/acp-19-9613-2019, 2019. a
Becagli, S., Castellano, E., Cerri, O., Curran, M., Frezzotti, M., Marino, F., Morganti, A., Proposito, M., Severi, M., Traversi, R., and Udisti, R.: Methanesulphonic acid (MSA) stratigraphy from a Talos Dome ice core as a tool in depicting sea ice changes and southern atmospheric circulation over the previous 140 years, Atmos. Environ., 43, 1051–1058, https://doi.org/10.1016/j.atmosenv.2008.11.015, 2009. a
Becagli, S., Amore, A., Caiazzo, L., Iorio, T. D. D., di Sarra, A., Lazzara, L., Marchese, C., Meloni, D., Mori, G., Muscari, G., Nuccio, C., Pace, G., Severi, M., and Traversi, R.: Biogenic aerosol in the Arctic from eight years of MSA data from Ny Ålesund (Svalbard Islands) and Thule (Greenland), Atmosphere, 10, 349, https://doi.org/10.3390/atmos10070349, 2019. a, b, c, d
Beck, L. J., Sarnela, N., Junninen, H., Hoppe, C. J., Garmash, O., Bianchi, F., Riva, M., Rose, C., Peräkylä, O., Wimmer, D., Kausiala, O., Jokinen, T., Ahonen, L., Mikkilä, J., Hakala, J., He, X. C., Kontkanen, J., Wolf, K. K., Cappelletti, D., Mazzola, M., Traversi, R., Petroselli, C., Viola, A. P., Vitale, V., Lange, R., Massling, A., Nøjgaard, J. K., Krejci, R., Karlsson, L., Zieger, P., Jang, S., Lee, K., Vakkari, V., Lampilahti, J., Thakur, R. C., Leino, K., Kangasluoma, J., Duplissy, E. M., Siivola, E., Marbouti, M., Tham, Y. J., Saiz-Lopez, A., Petäjä, T., Ehn, M., Worsnop, D. R., Skov, H., Kulmala, M., Kerminen, V. M., and Sipilä, M.: Differing Mechanisms of New Particle Formation at Two Arctic Sites, Geophys. Res. Lett., 48, e2020GL091334, https://doi.org/10.1029/2020GL091334, 2021. a
Berndt, T., Hoffmann, E. H., Tilgner, A., Stratmann, F., and Herrmann, H.: Direct sulfuric acid formation from the gas-phase oxidation of reduced-sulfur compounds, Nat. Commun., 14, 4849, https://doi.org/10.1038/s41467-023-40586-2, 2023. a, b
Bey, I., Jacob, D. J., Yantosca, R. M., Logan, J. A., Field, B. D., Fiore, A. M., Li, Q., Liu, H. Y., Mickley, L. J., and Schultz, M. G.: Global modeling of tropospheric chemistry with assimilated meteorology: Model description and evaluation, J. Geophys. Res., 106, 23073–23095, https://doi.org/10.1029/2001JD000807, 2001. a
Bhatti, Y. A., Revell, L. E., Schuddeboom, A. J., McDonald, A. J., Archibald, A. T., Williams, J., Venugopal, A. U., Hardacre, C., and Behrens, E.: The sensitivity of Southern Ocean atmospheric dimethyl sulfide (DMS) to modeled oceanic DMS concentrations and emissions, Atmos. Chem. Phys., 23, 15181–15196, https://doi.org/10.5194/acp-23-15181-2023, 2023. a
Bhatti, Y. A., Revell, L. E., McDonald, A. J., Archibald, A. T., Schuddeboom, A. J., Williams, J., Hardacre, C., Mulcahy, J., and Lin, D.: Aerosol and Dimethyl Sulfide Sensitivity to Sulfate Chemistry Schemes, J. Geophys. Res.-Atmos., 129, e2023JD040635, https://doi.org/10.1029/2023JD040635, 2024. a
Cala, B. A., Archer-Nicholls, S., Weber, J., Abraham, N. L., Griffiths, P. T., Jacob, L., Shin, Y. M., Revell, L. E., Woodhouse, M., and Archibald, A. T.: Development, intercomparison, and evaluation of an improved mechanism for the oxidation of dimethyl sulfide in the UKCA model, Atmos. Chem. Phys., 23, 14735–14760, https://doi.org/10.5194/acp-23-14735-2023, 2023. a, b, c, d, e, f, g, h, i, j, k, l, m
Carslaw, K. S., Lee, L. A., Reddington, C. L., Pringle, K. J., Rap, A., Forster, P. M., Mann, G. W., Spracklen, D. V., Woodhouse, M. T., Regayre, L. A., and Pierce, J. R.: Large contribution of natural aerosols to uncertainty in indirect forcing, Nature, 503, 67–71, https://doi.org/10.1038/nature12674, 2013. a, b
Carslaw, K. S., Gordon, H., Hamilton, D. S., Johnson, J. S., Regayre, L. A., Yoshioka, M., and Pringle, K. J.: Aerosols in the Pre-industrial Atmosphere, 3, 1–15, https://doi.org/10.1007/s40641-017-0061-2, 2017. a
Castebrunet, H., Martinerie, P., Genthon, C., and Cosme, E.: A three-dimensional model study of methanesulphonic acid to non sea salt sulphate ratio at mid and high-southern latitudes, Atmos. Chem. Phys., 9, 9449–9469, https://doi.org/10.5194/acp-9-9449-2009, 2009. a, b
Chalif, J. I., Jongebloed, U. A., Osterberg, E. C., Koffman, B. G., Alexander, B., Winski, D. A., Polashenski, D. J., Stamieszkin, K., Ferris, D. G., Kreutz, K. J., Wake, C. P., and Cole-Dai, J.: Pollution drives multidecadal decline in subarctic methanesulfonic acid, Nat. Geosci., 17, 1016–1021, https://doi.org/10.1038/s41561-024-01543-w, 2024a. a, b, c, d, e, f, g, h, i, j, k, l, m, n, o, p, q
Chalif, J., Osterberg, E., Winski, D., Kreutz, K., Wake, C., Koffman, B., and Ferris, D.: Ice core methanesulfonic acid from the Begguya (Mount Hunter) plateau, Denali National Park, Alaska, 2013, Arctic Data Center [data set], https://doi.org/10.18739/A2Q814T9K, 2024b. a
Chen, H., Ezell, M. J., Arquero, K. D., Varner, M. E., Dawson, M. L., Gerber, R. B., and Finlayson-Pitts, B. J.: New particle formation and growth from methanesulfonic acid, trimethylamine and water, Phys. Chem. Chem. Phys., 17, 13699–13709, https://doi.org/10.1039/C5CP00838G, 2015. a
Chen, J., Berndt, T., Møller, K. H., Lane, J. R., and Kjaergaard, H. G.: Atmospheric Fate of the CH3SOO Radical from the CH3S + O2 Equilibrium, The J. Phys. Chem. A, 125, 8933–8941, https://doi.org/10.1021/acs.jpca.1c06900, 2021. a
Chen, J., Lane, J. R., Bates, K. H., and Kjaergaard, H. G.: Atmospheric Gas-Phase Formation of Methanesulfonic Acid, Environ. Sci. Technol., 57, 21168–21177, https://doi.org/10.1021/acs.est.3c07120, 2023. a, b, c, d, e, f, g, h, i, j, k
Chen, Q., Schmidt, J. A., Shah, V., Jaeglé, L., Sherwen, T., and Alexander, B.: Sulfate production by reactive bromine: Implications for the global sulfur and reactive bromine budgets, Geophys. Res. Lett., 44, 7069–7078, https://doi.org/10.1002/2017GL073812, 2017. a, b, c
Chen, Q., Sherwen, T., Evans, M., and Alexander, B.: DMS oxidation and sulfur aerosol formation in the marine troposphere: a focus on reactive halogen and multiphase chemistry, Atmos. Chem. Phys., 18, 13617–13637, https://doi.org/10.5194/acp-18-13617-2018, 2018. a, b, c, d, e, f, g, h, i, j, k, l, m, n, o, p, q, r, s, t
Chen, Q., Xia, M., Peng, X., Yu, C., Sun, P., Li, Y., Liu, Y., Xu, Z., Xu, Z., Wu, R., Nie, W., Ding, A., Zhao, Y., and Wang, T.: Large Daytime Molecular Chlorine Missing Source at a Suburban Site in East China, J. Geophys. Res.-Atmos., 127, e2021JD035796, https://doi.org/10.1029/2021JD035796, 2022. a
Chen, Q., Wang, X., Fu, X., Li, X., Alexander, B., Peng, X., Wang, W., Xia, M., Tan, Y., Gao, J., Chen, J., Mu, Y., Liu, P., and Wang, T.: Impact of Molecular Chlorine Production from Aerosol Iron Photochemistry on Atmospheric Oxidative Capacity in North China, Environ. Sci. Technol., 58, 12585–12597, https://doi.org/10.1021/acs.est.4c02534, 2024. a
Chin, M., Jacob, D. J., Gardner, G. M., Foreman-Fowler, M. S., Spiro, P. A., and Savoie, D. L.: A global three-dimensional model of tropospheric sulfate, J. Geophys. Res.-Atmos., 101, 18667–18690, https://doi.org/10.1029/96jd01221, 1996. a
Curran, M. A. J., van Ommen, T. D., Morgan, V. I., Phillips, K. L., and Palmer, A. S.: Ice Core Evidence for Antarctic Sea Ice Decline Since the 1950s, Science, 302, 1203–1206, https://doi.org/10.1126/science.1087888, 2003. a, b, c
Dutta, I. and Heald, C. L.: Exploring Deposition Observations of Oxidized Sulfur and Nitrogen as a Constraint on Emissions in the United States, J. Geophys. Res.-Atmos., 128, e2023JD039610, https://doi.org/10.1029/2023JD039610, 2023. a
Fung, K. M., Heald, C. L., Kroll, J. H., Wang, S., Jo, D. S., Gettelman, A., Lu, Z., Liu, X., Zaveri, R. A., Apel, E. C., Blake, D. R., Jimenez, J.-L., Campuzano-Jost, P., Veres, P. R., Bates, T. S., Shilling, J. E., and Zawadowicz, M.: Exploring dimethyl sulfide (DMS) oxidation and implications for global aerosol radiative forcing, Atmos. Chem. Phys., 22, 1549–1573, https://doi.org/10.5194/acp-22-1549-2022, 2022. a, b, c, d, e, f, g, h, i
Galí, M., Levasseur, M., Devred, E., Simó, R., and Babin, M.: Sea-surface dimethylsulfide (DMS) concentration from satellite data at global and regional scales, Biogeosciences, 15, 3497–3519, https://doi.org/10.5194/bg-15-3497-2018, 2018. a
Gao, C. Y., Heald, C. L., Katich, J. M., Luo, G., and Yu, F.: Remote Aerosol Simulated During the Atmospheric Tomography (ATom) Campaign and Implications for Aerosol Lifetime, J. Geophys. Res.-Atmos., 127, e2022JD036524, https://doi.org/10.1029/2022JD036524, 2022. a
Gondwe, M., Krol, M., Klaassen, W., Gieskes, W., and de Baar, H.: Comparison of modeled versus measured MSA:nss SO ratios: A global analysis, Global Biogeochem. Cy., 18, https://doi.org/10.1029/2003GB002144, 2004. a, b
Goss, M. B. and Kroll, J. H.: Chamber studies of OH + dimethyl sulfoxide and dimethyl disulfide: insights into the dimethyl sulfide oxidation mechanism, Atmos. Chem. Phys., 24, 1299–1314, https://doi.org/10.5194/acp-24-1299-2024, 2024. a, b, c
Griffiths, P. T., Murray, L. T., Zeng, G., Shin, Y. M., Abraham, N. L., Archibald, A. T., Deushi, M., Emmons, L. K., Galbally, I. E., Hassler, B., Horowitz, L. W., Keeble, J., Liu, J., Moeini, O., Naik, V., O'Connor, F. M., Oshima, N., Tarasick, D., Tilmes, S., Turnock, S. T., Wild, O., Young, P. J., and Zanis, P.: Tropospheric ozone in CMIP6 simulations, Atmos. Chem. Phys., 21, 4187–4218, https://doi.org/10.5194/acp-21-4187-2021, 2021. a
Gros, V., Bonsang, B., Sarda-Estève, R., Nikolopoulos, A., Metfies, K., Wietz, M., and Peeken, I.: Concentrations of dissolved dimethyl sulfide (DMS), methanethiol and other trace gases in context of microbial communities from the temperate Atlantic to the Arctic Ocean, Biogeosciences, 20, 851–867, https://doi.org/10.5194/bg-20-851-2023, 2023. a
Hattori, S., Iizuka, Y., Alexander, B., Ishino, S., Fujita, K., Zhai, S., Sherwen, T., Oshima, N., Uemura, R., Yamada, A., Suzuki, N., Matoba, S., Tsuruta, A., Savarino, J., and Yoshida, N.: Isotopic evidence for acidity-driven enhancement of sulfate formation after SO2 emission control, Sci. Adv, 7, https://doi.org/10.1126/sciadv.abd4610 , 2021. a
Hattori, S., Ishino, S., Suzuki, N., Nakazawa, F., Oyabu, I., Tsutaki, S., Hirabayashi, M., Noro, K., Takenaka, N., Kawamura, K., Yoshida, N., and Motoyama, H.: Latitudinal difference in sulfate formation from methanesulfonate oxidation in Antarctic snow imprinted on 17O-excess signature, Appl. Geochem., 162, 105901, https://doi.org/10.1016/j.apgeochem.2024.105901, 2024. a, b, c
Hoffmann, E. H., Heinold, B., Kubin, A., Tegen, I., and Herrmann, H.: The Importance of the Representation of DMS Oxidation in Global Chemistry-Climate Simulations, Geophys. Res. Lett., 48, e2021GL094068, https://doi.org/10.1029/2021GL094068, 2021. a
Holmes, C. D., Bertram, T. H., Confer, K. L., Graham, K. A., Ronan, A. C., Wirks, C. K., and Shah, V.: The Role of Clouds in the Tropospheric NOx Cycle: A New Modeling Approach for Cloud Chemistry and Its Global Implications, Geophys. Res. Lett., 46, 4980–4990, https://doi.org/10.1029/2019GL081990, 2019. a
Hopkins, F. E., Suntharalingam, P., Gehlen, M., Andrews, O., Archer, S. D., Bopp, L., Buitenhuis, E., Dadou, I., Duce, R., Goris, N., Jickells, T., Johnson, M., Keng, F., Law, C. S., Lee, K., Liss, P. S., Lizotte, M., Malin, G., Murrell, J. C., Naik, H., Rees, A. P., Schwinger, J., and Williamson, P.: The impacts of ocean acidification on marine trace gases and the implications for atmospheric chemistry and climate, P. R. Soc. A, 476, 32518503, https://doi.org/10.1098/rspa.2019.0769, 2020. a
Hopkins, F. E., Archer, S. D., Bell, T. G., Suntharalingam, P., and Todd, J. D.: The biogeochemistry of marine dimethylsulfide, Nat. Rev. Earth Environ., 4, 361–376, https://doi.org/10.1038/s43017-023-00428-7, 2023. a
Hulswar, S., Simó, R., Galí, M., Bell, T. G., Lana, A., Inamdar, S., Halloran, P. R., Manville, G., and Mahajan, A. S.: Third revision of the global surface seawater dimethyl sulfide climatology (DMS-Rev3), Earth Syst. Sci. Data, 14, 2963–2987, https://doi.org/10.5194/essd-14-2963-2022, 2022. a, b
Jernigan, C. M., Fite, C. H., Vereecken, L., Berkelhammer, M. B., Rollins, A. W., Rickly, P. S., Novelli, A., Taraborrelli, D., Holmes, C. D., and Bertram, T. H.: Efficient Production of Carbonyl Sulfide in the Low-NOx Oxidation of Dimethyl Sulfide, Geophys. Res. Lett., 49, e2021GL096838, https://doi.org/10.1029/2021GL096838, 2022. a
Jin, Q., Grandey, B. S., Rothenberg, D., Avramov, A., and Wang, C.: Impacts on cloud radiative effects induced by coexisting aerosols converted from international shipping and maritime DMS emissions, Atmos. Chem. Phys., 18, 16793–16808, https://doi.org/10.5194/acp-18-16793-2018, 2018. a
Johnson, M. T.: A numerical scheme to calculate temperature and salinity dependent air-water transfer velocities for any gas, Ocean Sci., 6, 913–932, https://doi.org/10.5194/os-6-913-2010, 2010. a
Jongebloed, U., Alexander, B., Cole-Dai, J., Schauer, A., Larrick, C., Wood, R., Fischer, T., Carn, S., Salimi, S., Edouard, S., Zhai, S., and Geng, L.: Sulfur isotopes of sulfate measurements from a Greenland ice core (1200–1850) and volcanic gas measurements from various volcanoes and hot springs in Iceland, Arctic Data Center [data set], https://doi.org/10.18739/A2N873162, 2022. a
Jongebloed, U. A., Schauer, A. J., Cole-Dai, J., Larrick, C. G., Porter, W. C., Tashmim, L., Zhai, S., Salimi, S., Edouard, S. R., Geng, L., and Alexander, B.: Industrial-era decline in Arctic methanesulfonic acid is offset by increased biogenic sulfate aerosol, P. Natl. Acad. Sci. USA, 120, e2307587120, https://doi.org/10.1073/pnas.2307587120, 2023a. a, b, c, d, e, f, g, h, i, j, k, l, m
Jongebloed, U. A., Schauer, A. J., Hattori, S., Cole-Dai, J., Larrick, C. D., Salimi, S., Edouard, S. R., Geng, L., and Alexander, B.: Sulfur isotopes quantify the impact of anthropogenic activities on industrial-era Arctic sulfate in a Greenland ice core, Environ. Res. Lett., 18, 074020, https://doi.org/10.1088/1748-9326/acdc3d, 2023b. a, b, c
Jongebloed, U. A., Schauer, A. J., Cole‐Dai, J., Larrick, C. G., Wood, R., Fischer, T. P., Carn, S. A., Salimi, S., Edouard, S. R., Zhai, S., Geng, L., and Alexander, B.: Underestimated Passive Volcanic Sulfur Degassing Implies Overestimated Anthropogenic Aerosol Forcing, Geophys. Res. Lett., 50, e2022GL102061, https://doi.org/10.1029/2022GL102061, 2023c. a, b, c, d, e
Jongebloed, U., Alexander, B., and Cole-Dai, J.: Methanesulfonic acid measurements from a Greenland ice core (1850–2006), Arctic Data Center [data set], https://doi.org/10.18739/A2WW7717K, 2023d. a
Jongebloed, U., Alexander, B., Cole-Dai, J., Schauer, A., Larrick, C., Hattori, S., Salimi, S., Edouard, S., and Geng, L.: Sulfur isotopes of sulfate measurements from a Greenland ice core (1850–2006), Arctic Data Center [data set], https://doi.org/10.18739/A26T0GX7K, 2023e. a
Kaufman, Y. J. and Tanré, D.: Effect of variations in super-saturation on the formation of cloud condensation nuclei, Nature, 369, 45–48, https://doi.org/10.1038/369045a0, 1994. a, b
Khan, M. A., Cooke, M. C., Utembe, S. R., Archibald, A. T., Derwent, R. G., Xiao, P., Percival, C. J., Jenkin, M. E., Morris, W. C., and Shallcross, D. E.: Global modeling of the nitrate radical (NO3) for present and pre-industrial scenarios, Atmos. Res., 164–165, 347–357, https://doi.org/10.1016/j.atmosres.2015.06.006, 2015. a
Khan, M. A., Gillespie, S. M., Razis, B., Xiao, P., Davies-Coleman, M. T., Percival, C. J., Derwent, R. G., Dyke, J. M., Ghosh, M. V., Lee, E. P., and Shallcross, D. E.: A modelling study of the atmospheric chemistry of DMS using the global model, STOCHEM-CRI, Atmos. Environ., 127, 69–79, https://doi.org/10.1016/j.atmosenv.2015.12.028, 2016. a
Khan, M. A. H., Bannan, T. J., Holland, R., Shallcross, D. E., Archibald, A. T., Matthews, E., Back, A., Allan, J., Coe, H., Artaxo, P., and Percival, C. J.: Impacts of Hydroperoxymethyl Thioformate on the Global Marine Sulfur Budget, ACS Earth and Space Chemistry, 5, 2577–2586, https://doi.org/10.1021/acsearthspacechem.1c00218, 2021. a
Kloster, S., Six, K. D., Feichter, J., Maier-Reimer, E., Roeckner, E., Wetzel, P., Stier, P., and Esch, M.: Response of dimethylsulfide (DMS) in the ocean and atmosphere to global warming, J. Geophys. Res.-Biogeo., 112, https://doi.org/10.1029/2006JG000224, 2007. a
Kouvarakis, G. and Mihalopoulos, N.: Seasonal variation of dimethylsulfide in the gas phase and of methanesulfonate and non-sea-salt sulfate in the aerosols phase in the Eastern Mediterranean atmosphere, Atmos. Environ., 36, 929–938, https://doi.org/10.1016/S1352-2310(01)00511-8, 2002. a, b, c
Kurosaki, Y., Matoba, S., Iizuka, Y., Fujita, K., and Shimada, R.: Increased oceanic dimethyl sulfide emissions in areas of sea ice retreat inferred from a Greenland ice core, Commun. Earth Environ., 3, 327, https://doi.org/10.1038/s43247-022-00661-w, 2022. a, b
Kwong, K. C., Chim, M. M., Hoffmann, E. H., Tilgner, A., Herrmann, H., Davies, J. F., Wilson, K. R., and Chan, M. N.: Chemical Transformation of Methanesulfonic Acid and Sodium Methanesulfonate through Heterogeneous OH Oxidation, ACS Earth and Space Chemistry, 2, 895–903, https://doi.org/10.1021/acsearthspacechem.8b00072, 2018. a
Lana, A., Bell, T. G., Simó, R., Vallina, S. M., Ballabrera-Poy, J., Kettle, A. J., Dachs, J., Bopp, L., Saltzman, E. S., Stefels, J., Johnson, J. E., and Liss, P. S.: An updated climatology of surface dimethlysulfide concentrations and emission fluxes in the global ocean, Global Biogeochem. Cy., 25, https://doi.org/10.1029/2010GB003850, 2011. a, b, c
Lawson, S. J., Law, C. S., Harvey, M. J., Bell, T. G., Walker, C. F., de Bruyn, W. J., and Saltzman, E. S.: Methanethiol, dimethyl sulfide and acetone over biologically productive waters in the southwest Pacific Ocean, Atmos. Chem. Phys., 20, 3061–3078, https://doi.org/10.5194/acp-20-3061-2020, 2020. a
Liu, H., Jacob, D. J., Bey, I., and Yantosca, R. M.: Constraints from 210Pb and 7Be on wet deposition and transport in a global three-dimensional chemical tracer model driven by assimilated meteorological fields, J. Geophys. Res.-Atmos., 106, 12109–12128, https://doi.org/10.1029/2000JD900839, 2001. a
Liu, T., Ma, L., Yang, Y., and Ding, A.: Kinetics of the Reaction MSI− + O3 in Deliquesced Aerosol Particles: Implications for Sulfur Chemistry in the Marine Boundary Layer, Geophys. Res. Lett., 50, e2023GL105945, https://doi.org/10.1029/2023GL105945, 2023. a
Luo, G., Yu, F., and Schwab, J.: Revised treatment of wet scavenging processes dramatically improves GEOS-Chem 12.0.0 simulations of surface nitric acid, nitrate, and ammonium over the United States, Geosci. Model Dev., 12, 3439–3447, https://doi.org/10.5194/gmd-12-3439-2019, 2019. a, b, c
Luo, G., Yu, F., and Moch, J. M.: Further improvement of wet process treatments in GEOS-Chem v12.6.0: impact on global distributions of aerosols and aerosol precursors, Geosci. Model Dev., 13, 2879–2903, https://doi.org/10.5194/gmd-13-2879-2020, 2020. a, b, c
Maselli, O. J., Chellman, N. J., Grieman, M., Layman, L., McConnell, J. R., Pasteris, D., Rhodes, R. H., Saltzman, E., and Sigl, M.: Sea ice and pollution-modulated changes in Greenland ice core methanesulfonate and bromine, Clim. Past, 13, 39–59, https://doi.org/10.5194/cp-13-39-2017, 2017. a
McDuffie, E. E., Smith, S. J., O'Rourke, P., Tibrewal, K., Venkataraman, C., Marais, E. A., Zheng, B., Crippa, M., Brauer, M., and Martin, R. V.: A global anthropogenic emission inventory of atmospheric pollutants from sector- and fuel-specific sources (1970–2017): an application of the Community Emissions Data System (CEDS), Earth Syst. Sci. Data, 12, 3413–3442, https://doi.org/10.5194/essd-12-3413-2020, 2020. a, b, c
Moseid, K. O., Schulz, M., Eichler, A., Schwikowski, M., McConnell, J. R., Olivié, D., Criscitiello, A. S., Kreutz, K. J., and Legrand, M.: Using Ice Cores to Evaluate CMIP6 Aerosol Concentrations Over the Historical Era, J. Geophys. Res.-Atmos., 127, e2021JD036105, https://doi.org/10.1029/2021JD036105, 2022. a, b
Mungall, E. L., Wong, J. P., and Abbatt, J. P.: Heterogeneous Oxidation of Particulate Methanesulfonic Acid by the Hydroxyl Radical: Kinetics and Atmospheric Implications, ACS Earth and Space Chemistry, 2, 48–55, https://doi.org/10.1021/acsearthspacechem.7b00114, 2018. a, b, c
Murray, L. T., Fiore, A. M., Shindell, D. T., Naik, V., and Horowitz, L. W.: Large uncertainties in global hydroxyl projections tied to fate of reactive nitrogen and carbon, P. Natl. Acad. Sci. USA, 118, e2115204118, https://doi.org/10.1073/pnas.2115204118, 2021. a, b
Nightingale, P. D., Malin, G., Law, C. S., Watson, A. J., Liss, P. S., Liddicoat, M. I., Boutin, J., and Upstill-Goddard, R. C.: In situ evaluation of air-sea gas exchange parameterizations using novel conservative and volatile tracers, Global Biogeochem. Cy., 14, 373–387, https://doi.org/10.1029/1999GB900091, 2000. a
Novak, G. A., Fite, C. H., Holmes, C. D., Veres, P. R., Neuman, J. A., Faloona, I., Thornton, J. A., Wolfe, G. M., Vermeuel, M. P., Jernigan, C. M., Peischl, J., Ryerson, T. B., Thompson, C. R., Bourgeois, I., Warneke, C., Gkatzelis, G. I., Coggon, M. M., Sekimoto, K., Bui, T. P., Dean-Day, J., Diskin, G. S., Digangi, J. P., Nowak, J. B., Moore, R. H., Wiggins, E. B., Winstead, E. L., Robinson, C., Thornhill, K. L., Sanchez, K. J., Hall, S. R., Ullmann, K., Dollner, M., Weinzierl, B., Blake, D. R., and Bertram, T. H.: Rapid cloud removal of dimethyl sulfide oxidation products limits SO2 and cloud condensation nuclei production in the marine atmosphere, P. Natl. Acad. Sci. USA, 118, e2110472118, https://doi.org/10.1073/pnas.2110472118, 2021. a, b, c, d
Novak, G. A., Kilgour, D. B., Jernigan, C. M., Vermeuel, M. P., and Bertram, T. H.: Oceanic emissions of dimethyl sulfide and methanethiol and their contribution to sulfur dioxide production in the marine atmosphere, Atmos. Chem. Phys., 22, 6309–6325, https://doi.org/10.5194/acp-22-6309-2022, 2022. a, b, c
Osman, M., Das, S. B., Marchal, O., and Evans, M. J.: Methanesulfonic acid (MSA) migration in polar ice: data synthesis and theory, The Cryosphere, 11, 2439–2462, https://doi.org/10.5194/tc-11-2439-2017, 2017. a, b, c
Osman, M. B., Das, S. B., Trusel, L. D., Evans, M. J., Fischer, H., Grieman, M. M., Kipfstuhl, S., McConnell, J. R., and Saltzman, E. S.: Industrial-era decline in subarctic Atlantic productivity, Nature, 569, 551–555, https://doi.org/10.1038/s41586-019-1181-8, 2019. a, b, c, d, e, f
Osterberg, E. C., Hawley, R. L., Wong, G., Kopec, B., Ferris, D., and Howley, J.: Coastal ice-core record of recent northwest Greenland temperature and sea-ice concentration, J. Glaciol., 61, 1137–1146, https://doi.org/10.3189/2015JoG15J054, 2015. a
Polashenski, D. J., Osterberg, E. C., Koffman, B. G., Winski, D., Stamieszkin, K., Kreutz, K. J., Wake, C. P., Ferris, D. G., Introne, D., Campbell, S., and Lewis, G. M.: Denali Ice Core Methanesulfonic Acid Records North Pacific Marine Primary Production, J. Geophys. Res.-Atmos., 123, 4642–4653, https://doi.org/10.1029/2017JD028123, 2018. a, b
Quinn, P. K., Bates, T. S., Schulz, K., and Shaw, G. E.: Decadal trends in aerosol chemical composition at Barrow, Alaska: 1976–2008, Atmos. Chem. Phys., 9, 8883–8888, https://doi.org/10.5194/acp-9-8883-2009, 2009. a, b, c
Rahaman, W., Thamban, M., and Laluraj, C.: Twentieth-century sea ice variability in the Weddell Sea and its effect on moisture transport: Evidence from a coastal East Antarctic ice core record, Holocene, 26, 338–349, https://doi.org/10.1177/0959683615609749, 2016. a
Regayre, L. A., Schmale, J., Johnson, J. S., Tatzelt, C., Baccarini, A., Henning, S., Yoshioka, M., Stratmann, F., Gysel-Beer, M., Grosvenor, D. P., and Carslaw, K. S.: The value of remote marine aerosol measurements for constraining radiative forcing uncertainty, Atmos. Chem. Phys., 20, 10063–10072, https://doi.org/10.5194/acp-20-10063-2020, 2020. a
Revell, L. E., Kremser, S., Hartery, S., Harvey, M., Mulcahy, J. P., Williams, J., Morgenstern, O., McDonald, A. J., Varma, V., Bird, L., and Schuddeboom, A.: The sensitivity of Southern Ocean aerosols and cloud microphysics to sea spray and sulfate aerosol production in the HadGEM3-GA7.1 chemistry–climate model, Atmos. Chem. Phys., 19, 15447–15466, https://doi.org/10.5194/acp-19-15447-2019, 2019. a
Saint-Macary, A. D., Barr, N., Armstrong, E., Safi, K., Marriner, A., Gall, M., McComb, K., Dillingham, P. W., and Law, C. S.: The Influence of Ocean Acidification and Warming on DMSP & DMS in New Zealand Coastal Water, Atmosphere, 12, 181, https://doi.org/10.3390/atmos12020181, 2021. a
Schmale, J., Sharma, S., Decesari, S., Pernov, J., Massling, A., Hansson, H.-C., von Salzen, K., Skov, H., Andrews, E., Quinn, P. K., Upchurch, L. M., Eleftheriadis, K., Traversi, R., Gilardoni, S., Mazzola, M., Laing, J., and Hopke, P.: Pan-Arctic seasonal cycles and long-term trends of aerosol properties from 10 observatories, Atmos. Chem. Phys., 22, 3067–3096, https://doi.org/10.5194/acp-22-3067-2022, 2022. a, b, c
Schmidt, J. A., Jacob, D. J., Horowitz, H. M., Hu, L., Sherwen, T., Evans, M. J., Liang, Q., Suleiman, R. M., Oram, D. E., Breton, M. L., Percival, C. J., Wang, S., Dix, B., and Volkamer, R.: Modeling the observed tropospheric BrO background: Importance of multiphase chemistry and implications for ozone, OH, and mercury, J. Geophys. Res., 121, 11819–11835, https://doi.org/10.1002/2015JD024229, 2016. a
Scholz, W., Shen, J., Aliaga, D., Wu, C., Carbone, S., Moreno, I., Zha, Q., Huang, W., Heikkinen, L., Jaffrezo, J. L., Uzu, G., Partoll, E., Leiminger, M., Velarde, F., Laj, P., Ginot, P., Artaxo, P., Wiedensohler, A., Kulmala, M., Mohr, C., Andrade, M., Sinclair, V., Bianchi, F., and Hansel, A.: Measurement report: Long-range transport and the fate of dimethyl sulfide oxidation products in the free troposphere derived from observations at the high-altitude research station Chacaltaya (5240 m a.s.l.) in the Bolivian Andes, Atmos. Chem. Phys., 23, 895–920, https://doi.org/10.5194/acp-23-895-2023, 2023. a
Seland, Ø., Bentsen, M., Olivié, D., Toniazzo, T., Gjermundsen, A., Graff, L. S., Debernard, J. B., Gupta, A. K., He, Y.-C., Kirkevåg, A., Schwinger, J., Tjiputra, J., Aas, K. S., Bethke, I., Fan, Y., Griesfeller, J., Grini, A., Guo, C., Ilicak, M., Karset, I. H. H., Landgren, O., Liakka, J., Moseid, K. O., Nummelin, A., Spensberger, C., Tang, H., Zhang, Z., Heinze, C., Iversen, T., and Schulz, M.: Overview of the Norwegian Earth System Model (NorESM2) and key climate response of CMIP6 DECK, historical, and scenario simulations, Geosci. Model Dev., 13, 6165–6200, https://doi.org/10.5194/gmd-13-6165-2020, 2020. a
Sharma, S., Barrie, L., Magnusson, E., Brattström, G., Leaitch, W., Steffen, A., and Landsberger, S.: A Factor and Trends Analysis of Multidecadal Lower Tropospheric Observations of Arctic Aerosol Composition, Black Carbon, Ozone, and Mercury at Alert, Canada, J. Geophys. Res.-Atmos., 124, 14133–14161, https://doi.org/10.1029/2019JD030844, 2019. a, b
Shen, J., Scholz, W., He, X.-C., Zhou, P., Marie, G., Wang, M., Marten, R., Surdu, M., Rörup, B., Baalbaki, R., Amorim, A., Ataei, F., Bell, D. M., Bertozzi, B., Brasseur, Z., Caudillo, L., Chen, D., Chu, B., Dada, L., Duplissy, J., Finkenzeller, H., Granzin, M., Guida, R., Heinritzi, M., Hofbauer, V., Iyer, S., Kemppainen, D., Kong, W., Krechmer, J. E., Kürten, A., Lamkaddam, H., Lee, C. P., Lopez, B., Mahfouz, N. G. A., Manninen, H. E., Massabò, D., Mauldin, R. L., Mentler, B., Müller, T., Pfeifer, J., Philippov, M., Piedehierro, A. A., Roldin, P., Schobesberger, S., Simon, M., Stolzenburg, D., Tham, Y. J., Tomé, A., Umo, N. S., Wang, D., Wang, Y., Weber, S. K., Welti, A., de Jonge, R. W., Wu, Y., Zauner-Wieczorek, M., Zust, F., Baltensperger, U., Curtius, J., Flagan, R. C., Hansel, A., Möhler, O., Petäjä, T., Volkamer, R., Kulmala, M., Lehtipalo, K., Rissanen, M., Kirkby, J., El-Haddad, I., Bianchi, F., Sipilä, M., Donahue, N. M., and Worsnop, D. R.: High Gas-Phase Methanesulfonic Acid Production in the OH-Initiated Oxidation of Dimethyl Sulfide at Low Temperatures, Environ. Sci. Technol., https://doi.org/10.1021/acs.est.2c05154, 56, 13931–13944, 2022. a, b, c
Siegel, K., Gramlich, Y., Haslett, S. L., Freitas, G., Krejci, R., Zieger, P., and Mohr, C.: Arctic observations of hydroperoxymethyl thioformate (HPMTF) – seasonal behavior and relationship to other oxidation products of dimethyl sulfide at the Zeppelin Observatory, Svalbard, Atmos. Chem. Phys., 23, 7569–7587, https://doi.org/10.5194/acp-23-7569-2023, 2023. a
Six, K. D., Kloster, S., Ilyina, T., Archer, S. D., Zhang, K., and Maier-Reimer, E.: Global warming amplified by reduced sulphur fluxes as a result of ocean acidification, Nat. Clim. Change, 3, 975–978, https://doi.org/10.1038/nclimate1981, 2013. a
Sofen, E. D., Alexander, B., and Kunasek, S. A.: The impact of anthropogenic emissions on atmospheric sulfate production pathways, oxidants, and ice core Δ17O(SO), Atmos. Chem. Phys., 11, 3565–3578, https://doi.org/10.5194/acp-11-3565-2011, 2011. a
Steiner, N. S., Robert, M., Arychuk, M., Levasseur, M. L., Merzouk, A., Peña, M. A., Richardson, W. A., and Tortell, P. D.: Evaluating DMS measurements and model results in the Northeast subarctic Pacific from 1996-2010, Biogeochemistry, 110, 269–285, https://doi.org/10.1007/s10533-011-9669-9, 2012. a
Stevenson, D. S., Zhao, A., Naik, V., O'Connor, F. M., Tilmes, S., Zeng, G., Murray, L. T., Collins, W. J., Griffiths, P. T., Shim, S., Horowitz, L. W., Sentman, L. T., and Emmons, L.: Trends in global tropospheric hydroxyl radical and methane lifetime since 1850 from AerChemMIP, Atmos. Chem. Phys., 20, 12905–12920, https://doi.org/10.5194/acp-20-12905-2020, 2020. a
Sunda, W. G., Hardison, R., Kiene, R. P., Bucciarelli, E., and Harada, H.: The effect of nitrogen limitation on cellular DMSP and DMS release in marine phytoplankton: climate feedback implications, Aquat. Sci., 69, 341–351, https://doi.org/10.1007/s00027-007-0887-0, 2007. a
Tashmim, L., Porter, W. C., Chen, Q., Alexander, B., Fite, C. H., Holmes, C. D., Pierce, J. R., Croft, B., and Ishino, S.: Contribution of expanded marine sulfur chemistry to the seasonal variability of dimethyl sulfide oxidation products and size-resolved sulfate aerosol, Atmos. Chem. Phys., 24, 3379–3403, https://doi.org/10.5194/acp-24-3379-2024, 2024. a, b, c, d, e, f, g, h, i, j, k, l, m
The International GEOS-Chem User Community: geoschem/geos-chem: GEOS-Chem 12.9.3 (12.9.3), Zenodo [code], https://doi.org/10.5281/zenodo.3974569, 2020. a, b
The International GEOS-Chem User Community: geoschem/GCClassic: GEOS-Chem 13.2.1 (13.2.1), Zenodo [code], https://doi.org/10.5281/zenodo.5500717, 2021. a, b
Tjiputra, J. F., Schwinger, J., Bentsen, M., Morée, A. L., Gao, S., Bethke, I., Heinze, C., Goris, N., Gupta, A., He, Y.-C., Olivié, D., Seland, Ø., and Schulz, M.: Ocean biogeochemistry in the Norwegian Earth System Model version 2 (NorESM2), Geosci. Model Dev., 13, 2393–2431, https://doi.org/10.5194/gmd-13-2393-2020, 2020. a
Vega, C. P., Schlosser, E., Divine, D. V., Kohler, J., Martma, T., Eichler, A., Schwikowski, M., and Isaksson, E.: Surface mass balance and water stable isotopes derived from firn cores on three ice rises, Fimbul Ice Shelf, Antarctica, The Cryosphere, 10, 2763–2777, https://doi.org/10.5194/tc-10-2763-2016, 2016. a
Veres, P. R., Neuman, J. A., Bertram, T. H., Assaf, E., Wolfe, G. M., Williamson, C. J., Weinzierl, B., Tilmes, S., Thompson, C. R., Thames, A. B., Schroder, J. C., Saiz-Lopez, A., Rollins, A. W., Roberts, J. M., Price, D., Peischl, J., Nault, B. A., Møller, K. H., Miller, D. O., Meinardi, S., Li, Q., Lamarque, J. F., Kupc, A., Kjaergaard, H. G., Kinnison, D., Jimenez, J. L., Jernigan, C. M., Hornbrook, R. S., Hills, A., Dollner, M., Day, D. A., Cuevas, C. A., Campuzano-Jost, P., Burkholder, J., Bui, T. P., Brune, W. H., Brown, S. S., Brock, C. A., Bourgeois, I., Blake, D. R., Apel, E. C., and Ryerson, T. B.: Global airborne sampling reveals a previously unobserved dimethyl sulfide oxidation mechanism in the marine atmosphere, P. Natl. Acad. Sci. USA, 117, 4505–4510, https://doi.org/10.1073/pnas.1919344117, 2020. a
Vermeuel, M. P., Novak, G. A., Jernigan, C. M., and Bertram, T. H.: Diel Profile of Hydroperoxymethyl Thioformate: Evidence for Surface Deposition and Multiphase Chemistry, Environ. Sci. Technol., 54, 12521–12529, https://doi.org/10.1021/acs.est.0c04323, 2020. a
Wang, W.-L., Song, G., Primeau, F., Saltzman, E. S., Bell, T. G., and Moore, J. K.: Global ocean dimethyl sulfide climatology estimated from observations and an artificial neural network, Biogeosciences, 17, 5335–5354, https://doi.org/10.5194/bg-17-5335-2020, 2020. a, b
Wang, X., Jacob, D. J., Eastham, S. D., Sulprizio, M. P., Zhu, L., Chen, Q., Alexander, B., Sherwen, T., Evans, M. J., Lee, B. H., Haskins, J. D., Lopez-Hilfiker, F. D., Thornton, J. A., Huey, G. L., and Liao, H.: The role of chlorine in global tropospheric chemistry, Atmos. Chem. Phys., 19, 3981–4003, https://doi.org/10.5194/acp-19-3981-2019, 2019. a
Wang, X., Jacob, D. J., Downs, W., Zhai, S., Zhu, L., Shah, V., Holmes, C. D., Sherwen, T., Alexander, B., Evans, M. J., Eastham, S. D., Neuman, J. A., Veres, P. R., Koenig, T. K., Volkamer, R., Huey, L. G., Bannan, T. J., Percival, C. J., Lee, B. H., and Thornton, J. A.: Global tropospheric halogen (Cl, Br, I) chemistry and its impact on oxidants, Atmos. Chem. Phys., 21, 13973–13996, https://doi.org/10.5194/acp-21-13973-2021, 2021. a
Wang, Y., Jacob, D. J., and Logan, J. A.: Global simulation of tropospheric O 3-NOx-hydrocarbon chemistry 1. Model formulation, J. Geophys. Res.-Atmos., 103, 10713–10725, https://doi.org/10.1029/98JD00158, 1998. a
Weber, R. J., Marti, J. J., McMurry, P. H., Eisele, F. L., Tanner, D. J., and Jefferson, A.: Measurements of new particle formation and ultrafine particle growth rates at a clean continental site, J. Geophys. Res.-Atmos., 102, 4375–4385, https://doi.org/10.1029/96JD03656, 1997. a
Wesely, M. M.: Parameterization of surface resistances to gaseous dry deposition in regional-scale numerical models, Atmos. Environ., 23, 1293–1304, https://doi.org/10.1016/j.atmosenv.2007.10.058, 1989. a
Winski, D., Osterberg, E., Ferris, D., Kreutz, K., Wake, C., Campbell, S., Hawley, R., Roy, S., Birkel, S., Introne, D., and Handley, M.: Industrial-age doubling of snow accumulation in the Alaska Range linked to tropical ocean warming, Sci. Rep., 7, 17869, https://doi.org/10.1038/s41598-017-18022-5, 2017. a
Wohl, C., Villamayor, J., Galí, M., Mahajan, A. S., Fernández, R. P., Cuevas, C. A., Bossolasco, A., Li, Q., Kettle, A. J., Williams, T., Sarda-Esteve, R., Gros, V., Simó, R., and Saiz-Lopez, A.: Marine emissions of methanethiol increase aerosol cooling in the Southern Ocean, Sci. Adv, 10, 2465, https://doi.org/10.1126/sciadv.adq2465, 2024. a
Wolfe, G. M., Marvin, M. R., Roberts, S. J., Travis, K. R., and Liao, J.: The Framework for 0-D Atmospheric Modeling (F0AM) v3.1, Geosci. Model Dev., 9, 3309–3319, https://doi.org/10.5194/gmd-9-3309-2016, 2016. a
Wollesen de Jonge, R., Elm, J., Rosati, B., Christiansen, S., Hyttinen, N., Lüdemann, D., Bilde, M., and Roldin, P.: Secondary aerosol formation from dimethyl sulfide – improved mechanistic understanding based on smog chamber experiments and modelling, Atmos. Chem. Phys., 21, 9955–9976, https://doi.org/10.5194/acp-21-9955-2021, 2021. a
Wu, R., Wang, S., and Wang, L.: New mechanism for the atmospheric oxidation of dimethyl sulfide. The importance of intramolecular hydrogen shift in a CH3SCH2OO radical, J. Phys. Chem. A, 119, 112–117, https://doi.org/10.1021/jp511616j, 2015. a, b
Xu, F., Zhang, H., Jia, T., Yan, S., Wu, J., Liu, C., and Yang, G.: Effects of Phytoplankton on the Production and Emission of Estuarine Dimethyl Sulfide Under Different Nutrient Inputs From Changjiang River, J. Geophys. Res.-Oceans, 127, e2021JC017983, https://doi.org/10.1029/2021JC017983, 2022. a
Ye, Q., Goss, M. B., Krechmer, J. E., Majluf, F., Zaytsev, A., Li, Y., Roscioli, J. R., Canagaratna, M., Keutsch, F. N., Heald, C. L., and Kroll, J. H.: Product distribution, kinetics, and aerosol formation from the OH oxidation of dimethyl sulfide under different RO2 regimes, Atmos. Chem. Phys., 22, 16003–16015, https://doi.org/10.5194/acp-22-16003-2022, 2022. a, b, c, d
Young, P. J., Archibald, A. T., Bowman, K. W., Lamarque, J.-F., Naik, V., Stevenson, D. S., Tilmes, S., Voulgarakis, A., Wild, O., Bergmann, D., Cameron-Smith, P., Cionni, I., Collins, W. J., Dalsøren, S. B., Doherty, R. M., Eyring, V., Faluvegi, G., Horowitz, L. W., Josse, B., Lee, Y. H., MacKenzie, I. A., Nagashima, T., Plummer, D. A., Righi, M., Rumbold, S. T., Skeie, R. B., Shindell, D. T., Strode, S. A., Sudo, K., Szopa, S., and Zeng, G.: Pre-industrial to end 21st century projections of tropospheric ozone from the Atmospheric Chemistry and Climate Model Intercomparison Project (ACCMIP), Atmos. Chem. Phys., 13, 2063–2090, https://doi.org/10.5194/acp-13-2063-2013, 2013. a
Zhai, S., Wang, X., McConnell, J. R., Geng, L., Cole-Dai, J., Sigl, M., Chellman, N., Sherwen, T., Pound, R., Fujita, K., Hattori, S., Moch, J. M., Zhu, L., Evans, M., Legrand, M., Liu, P., Pasteris, D., Chan, Y. C., Murray, L. T., and Alexander, B.: Anthropogenic Impacts on Tropospheric Reactive Chlorine Since the Preindustrial, Geophys. Res. Lett., 48, e2021GL093808, https://doi.org/10.1029/2021GL093808, 2021. a, b
Zhai, S., McConnell, J. R., Chellman, N., Legrand, M., Opel, T., Meyer, H., Jaeglé, L., Confer, K., Fujita, K., Wang, X., and Alexander, B.: Anthropogenic Influence on Tropospheric Reactive Bromine Since the Pre‐industrial: Implications for Arctic Ice-Core Bromine Trends, Geophys. Res. Lett., 51, e2023GL107733, https://doi.org/10.1029/2023GL107733, 2024. a
Zhang, B., Chellman, N. J., Kaplan, J. O., Mickley, L. J., Ito, T., Wang, X., Wensman, S. M., McCrimmon, D., Steffensen, J. P., McConnell, J. R., and Liu, P.: Improved biomass burning emissions from 1750 to 2010 using ice core records and inverse modeling, Nat. Commun., 15, 3651, https://doi.org/10.1038/s41467-024-47864-7, 2024. a, b
Zhao, J., Zhang, Y., Bie, S., Bilsback, K. R., Pierce, J. R., and Chen, Y.: Changes in global DMS production driven by increased CO2 levels and its impact on radiative forcing, npj Climate and Atmospheric Science, 7, 18, https://doi.org/10.1038/s41612-024-00563-y, 2024. a
Zindler, C., Marandino, C. A., Bange, H. W., Schütte, F., and Saltzman, E. S.: Nutrient availability determines dimethyl sulfide and isoprene distribution in the eastern Atlantic Ocean, Geophys. Res. Lett., 41, 3181–3188, https://doi.org/10.1002/2014GL059547, 2014. a