the Creative Commons Attribution 4.0 License.
the Creative Commons Attribution 4.0 License.
 | 07 Apr 2025
The impact of organic nitrates on summer ozone formation in Shanghai, China
Chunmeng Li
Haichao Wang
Tianyu Zhai
Xuefei Ma
Xinping Yang
Shiyi Chen
Min Zhou
Shengrong Lou
Limin Zeng
Organic nitrates serve as important secondary oxidation products in the atmosphere, playing a crucial role in the atmospheric radical cycles and influencing the production of secondary pollutants (ozone (O3) and secondary organic aerosols). However, field measurements of organic nitrates are scarce in China, and a comprehensive localized mechanism for organic nitrates is absent, hindering effective pollution mitigation strategies. In this study, we conducted measurements of ambient gaseous organic nitrates and examined their effects on local O3 production at a polluted urban site in eastern China during summer. The average daytime concentrations of alkyl nitrates (ANs) and peroxy nitrates (PNs) throughout the campaign were 0.5 ± 0.3 and 0.9 ± 0.7 ppbv, respectively, with peaks reaching up to 1.6 and 3.6 ppbv. An observation-constrained box model, incorporating an updated mechanism for organic nitrates, was employed to assess the environmental impact of these compounds. The model results indicated that PN production inhibited the daytime O3 production by 16 % (0.8 ppbv h−1), which is relatively low compared to previous studies. Furthermore, scenario analyses revealed that production yields (α) of ANs would alter the response of O3 formation to precursors due to varying compositions of volatile organic compounds (VOCs). Our results suggest that blind pollution control may cause ineffective pollution prevention and highlight the necessity of a thorough understanding of organic nitrate chemistry for local O3 control strategy.
- Article
(5873 KB) - Full-text XML
-
Supplement
(734 KB) - BibTeX
- EndNote


Tropospheric ozone (O3), as an important oxidant, influences the atmospheric lifetimes of trace gases through its involvement in photochemical processes, thereby playing a crucial role in climate change and atmospheric chemistry. There is a broad consensus that high near-surface ozone concentrations are hazardous to human health and environmental ecosystems, particularly affecting the human respiratory and cardiovascular systems, and result in decreased yields of various crops (Ashmore, 2005; Xue and Zhang, 2023). A scientific assessment of tropospheric ozone is essential for the development of public health policies and for addressing long-term air pollution challenges (Monks et al., 2015). Primary pollutants, such as nitrogen oxides (NOx) and volatile organic compounds (VOCs), participate in the formation of HOx radical (ROx = RO2 + HO2 + OH) cycles and NOx cycles under sunlight, leading to the continuous production of ozone as a secondary oxidation product within these cycles. In addition to the reaction between OH and NO2 that produces HNO3 as part of chain termination reactions, the interaction of RO2 and NO that produces organic nitrates is of increasing concern (Romer Present et al., 2020). The atmospheric production of organic nitrates consumes both NOx and RO2. Therefore, the chemistry of organic nitrates will significantly influence the prevention and control of ozone, with NOx and VOCs serving as independent variables.
Both anthropogenic activities and natural processes contribute to the emissions of NOx and VOCs, which produce RO2 in the presence of oxidants such as OH. Subsequently, RO2 reacts with NO to yield NO2 and RO. After that, NO2 photolysis produces O3, while RO is converted into HO2 through an isomerization reaction, thereby forming the ozone production cycle. Within the cycle, a branching reaction between RO2 and NO (RONO2) leads to the formation of alkyl nitrates (ANs), while RO2 may also react with NO2 (RO2NO2) to generate peroxy nitrates (PNs). Given that PNs are prone to thermal dissociation near the surface (Roberts and Bertman, 1992), they can influence O3 production by modifying the availability of NOx and ROx. Due to the competitive production dynamics between PNs and O3, numerous field observations and model simulations have been conducted to investigate the impact of peroxyacetyl nitrate (PAN) on O3 production (Zeng et al., 2019; Zhang et al., 2020; Liu et al., 2021). For AN formation, the branching ratio (α), denoted by the reaction ratio , varies between 0.1 %–35 %, which is associated with the carbon chain structure of the molecule, the distribution of functional groups, temperature, and pressure (Reisen et al., 2005; Arey et al., 2001; Wennberg et al., 2018; Russell and Allen, 2005; Butkovskaya et al., 2012; Cassanelli et al., 2007). Some values of α, which have not been quantified in the laboratory, are estimated through structure–activity relationships (Arey et al., 2001; Reisen et al., 2005; Yeh and Ziemann, 2014b, a; Teng et al., 2015). Multiple field observations revealed a strong linear correlation between ANs and O3, with a correlation coefficient (r2) exceeding 0.5, further substantiating the competitive relationship between ANs and O3 (Flocke et al., 1998; Day et al., 2003; Aruffo et al., 2014).
Currently, research on the effects of ANs on O3 distribution is predominantly located in Europe and the United States. Following the first in situ measurement of total organic nitrates through thermal dissociation laser-induced fluorescence (TD-LIF) by Day et al. (2003), field observations of total ANs have continuously been conducted to study the role of ANs in the nitrogen cycle (Day et al., 2003; Darer et al., 2011; Browne et al., 2013; Aruffo et al., 2014; Sadanaga et al., 2016; Chen et al., 2017). In conjunction with field observations and model simulations, Farmer et al. (2011) were the first to indicate that ANs influence the sensitivity of NOx–VOCs–O3 (Farmer et al., 2011). As NOx emissions decrease due to pollution control measures, AN chemistry is expected to play an increasingly significant role in O3 simulations (Zare et al., 2018; Romer Present et al., 2020). Current mechanisms for O3 simulations generally achieve reasonable predictions in large-scale models; however, they exhibit deviations exceeding 10 ppbv in regional simulations (Young et al., 2018). Subsequent studies have demonstrated that refining the AN chemistry can further improve the simulation performance for O3 (Schwantes et al., 2020). ANs are predominantly produced through oxidation reactions facilitated by OH, O3, and NO3. The daytime ANs are mainly contributed by the OH channel, whereas, during the nighttime, the contribution of the NO3 channel is linked to significantly increased yields of ANs (Ng et al., 2017; Liebmann et al., 2018; Zare et al., 2018). Presently, the enhancement of AN chemistry mainly focuses on biogenic VOCs (BVOCs), particularly isoprene and monoterpenes. This research aims to enhance the yield of ANs derived from BVOCs, the re-release ratio of ANs to NOx, and the contribution of ANs to aerosols (Fisher et al., 2016; Romer et al., 2016; Travis et al., 2016; Zare et al., 2018). Despite the establishment of a complete mechanism scheme at present, significant uncertainties remain in AN simulation, which may introduce substantial uncertainties into the O3 simulation.
Atmospheric pollution is common across China, particularly in the Yangtze River Delta. Shanghai, as a highly urbanized metropolis in the Yangtze River Delta, is the source of the region's complex pollution due to its rapid economic growth and urbanization (Zhu et al., 2021; Wang et al., 2022). Previous studies showed a significant increase in near-surface O3 levels from 2006 to 2016 in Shanghai (Gao et al., 2017). However, research on the AN chemistry and its impact on O3 pollution remains limited in this area. In addition, most field measurements of ANs have focused on short-chain species (Wang et al., 2013; Song et al., 2018; Sun et al., 2018; Ling et al., 2016), which have been observed to exert a typical inhibition effect on daytime O3 production. A limited number of total AN measurements found that both AN production and O3 production were in the VOC-limited regime (Li et al., 2023). To further investigate the influence of organic nitrates on O3 production, this study describes the distribution of organic nitrates based on a comprehensive field campaign conducted in Shanghai, analyzes the effects of organic nitrates on O3 production through model simulations, and offers recommendations for the prevention and control of ozone pollution in the region.
2.1 Measurement site and instrumentations
A comprehensive campaign was conducted in Shanghai to further investigate the chemical behavior of organic nitrates in urban environments across China. As depicted in Fig. 1, the site is located in the Xuhui District of Shanghai (31.18° N, 121.44° E), in proximity to the Shanghai Inner Ring Viaduct, surrounded by numerous residential and office areas without significant industrial emission sources. The site is mainly influenced by morning and evening rush hours and by the transport of air masses to the urban location. The overall wind speed was low, predominantly originating from the east. All the measurement instruments were housed in a temperature-controlled room within the laboratory building at the Shanghai Academy of Environmental Sciences. A thermal dissociation cavity enhanced absorption spectroscopy (TD-CEAS) instrument was positioned on the seventh floor about 25 m above ground level, with the sampling tube extending out through the window.

Figure 1Map of the city of Shanghai and the surrounding area (© MeteoInfoMap). The red star is the location of the campaign site.
Table 1Measured species for organic nitrate analysis and instrument time resolution, accuracy, and detection limitation.

The Shanghai campaign focused on studying summer ozone pollution, with the chemical parameters presented in Table 1. Organic nitrates were measured with a TD-CEAS instrument with a sampling flow rate of 3 L min−1 and a sampling duration of 3 min for alternating measurements of NO2, PNs, and ANs. The sampling apparatus consisted of a 2 m long in. tetrafluoroethylene (TFE) tube, through which the atmosphere was filtered through a TFE particulate filter. The membrane was replaced once a day to mitigate the interference caused by wall loss. The measurement of PAN was conducted by gas chromatography electron capture detection (GC-ECD). The measurement of N2O5 was performed via CEAS, which relies on the thermal dissociation of N2O5 to yield NO3. Particulate nitrates and gaseous HNO3 were measured online by the Monitor for AeRosols and Gases in Ambient air (MARGA), where soluble substances were quantified through ion chromatography following dissolution. The measurements of HONO were finished by CEAS during the campaign. Measurements of VOCs were achieved using a combination of GC-FID and GC-MS, with GC-MS predominating due to the limited species measured by GC-FID. The photolysis rate constant (J value) was determined using a spectrum radiometer with a time resolution of 20 s. Additionally, simultaneous measurements of other trace gases such as NO, NO2, SO2, CO, O3, and PM2.5 were conducted using commercial instruments.
2.2 Model calculation
To investigate the impact of AN chemistry on O3 production, a box model was employed to simulate the photochemistry processes. The mechanism of the model was enhanced based on the Regional Atmospheric Chemical Mechanism version 2 (RACM2). This box model simulates the physicochemical processes occurring within a defined volume for each reactant. It utilizes measured parameters as the boundary condition to simulate the chemistry process while allowing convenient adjustments to the mechanism. The model generates files detailing concentration changes, budget processes, and reaction rates, thereby providing an efficient means to simulate ground-level pollutants. In this study, the box model was constrained by various parameters, including J values, O3, NO, NO2, CO, HONO, VOCs, RH, temperature, and pressure, with the time step set to 1 h. The deposition process was quantified using the deposition rate and the boundary layer height, with the dry deposition rate established at 1.2 cm s−1 and the boundary layer height constrained by data obtained from NASA.
The RACM2 facilitates classification through the distribution of functional groups and subsequently delineates reactions involving 17 stable non-organic compounds, 4 inorganic intermediates, 55 stable organic compounds, and 43 intermediate organic species within the mechanism. However, the mechanism description for ANs is notably abbreviated. The various ANs, characterized by differing functional groups, are treated as a unified entity, thereby neglecting the influence of functional groups on the underlying chemistry. Consequently, this study builds on the previous research and further evaluates the updates of the mechanism (Li et al., 2023). These mechanistic updates are developed based on the work of Zare et al. (2018) and primarily encompass the oxidation processes of BVOCs by OH and NO3 and the deposition and the aerosol uptake, which are detailed in the Supplement (Zare et al., 2018). Accordingly, three mechanistic schemes are compared based on the campaign, which will be elaborated upon in subsequent sections. A box model based on the above mechanism is used to calculate the ozone production rate (P(O3)) (Tan et al., 2017). P(O3) was quantified based on the net production rate of Ox (the sum of O3 and NO2) by subtracting the Ox depletion from the instantaneous Ox production. The simulation uncertainty of the box model is about 40 %, introduced mainly by the simplified reaction rate constants, photolysis rate constants, and near-ground deposition (Lu et al., 2013). The impact of PN photochemistry on local ozone is quantified by comparing the difference of the daytime P(O3) between the scenarios with and without PN photochemistry via a chemical box model. Here, the PN photochemistry includes the production and removal of PAN, MPAN, and PPN.
To facilitate the assessment of the impacts of ANs on local O3 pollution, we further conducted a simplified box model based on the steady-state assumption approach. Several studies have examined the combined effect of α and VOC reactivity on local O3 levels using this approach (Farmer et al., 2011; Romer et al., 2016, 2018; Romer Present et al., 2020). Briefly, the production pathway of ANs is simplified according to VOC categories, and the production rate of OH and HO2(P(HOx)) is fixed to a constant value. VOCs are categorized into two primary groups: non-oxygenated VOCs (RVOCs) and oxygenated VOCs (OVOCs). Both categories of VOCs undergo oxidation by OH, resulting in the formation of RO2, specifically RVOCRO2 and OVOCRO2. The interaction between RVOCRO2 and NO will produce α ANs, (1−α) NO2, HO2, and OVOCs. Conversely, the reaction of OVOCRO2 with NO directly generates NO2. In the Beijing–Tianjin–Hebei, Yangtze River Delta, and Chengdu–Chongqing regions of China, P(HOx) is approximately 4 ppbv h−1 (Tan et al., 2018a, b; Lu et al., 2013). P(HOx) is therefore assumed to be 4 ppbv h−1, with equal production rates of OH and HO2. The model also incorporates additional processes, including inter- and self-reactions of RO2 and reactions between NO2 and NO and deposition processes. In addition, during the daytime, NO is determined by j(NO2), O3, and NO2 according to the photo-stationary state among NO–NO2–O3. Based on the above simplified approach, production rates of ANs and O3 in this study can be derived by direct calculations.
To investigate the effects of NOx and VOCs on O3 production, the theoretical maximum of P(O3) was simulated by a box model under varying concentrations of NOx and VOCs. This approach was employed to develop an empirical kinetic modeling approach (EKMA) for ozone production. The EKMA serves as a model sensitivity method to inform strategies for pollutant abatement. In this study, the EKMA utilizes the measured mean parameters as the initial point. Each parameter was incrementally adjusted in 30 equidistant steps to create scaled arrays of VOCs and NOx, which were subsequently used to simulate the variations in P(O3) resulting from changes in precursor concentrations. Ultimately, contour plots illustrating the relationship between P(O3) arrays and the concentrations of NOx and VOCs are plotted based on the simulation results.
3.1 Overview of organic nitrates and precursors
The duration of the Shanghai campaign was 20 d, spanning 25 May to 13 June 2021. The analysis of organic nitrates is performed from 06:00 to 18:00 local time (LT), as measurements taken during the nighttime were subject to interference from N2O5 and its derivatives, a phenomenon noted in previous studies (Li et al., 2023, 2021). Simultaneous measurements of PAN and PNs were conducted throughout the campaign. There was a malfunction of the GC-ECD instrument from 12 to 13 June, during which the measurements of PAN were generally low. Relative humidity (RH) varied considerably, with over 95 % during rainfall periods on 2, 9, 10, and 13 June, while the remaining days were predominantly sunny. Temperatures were high, with minimums of 20 °C and daytime peaks reaching up to 36 °C. The wind speeds were generally high during the daytime and low at night, with a maximum of 4.2 m s−1. The easterly winds prevailed during the campaign, except for 27–28 May and 3–6 June with mostly westerly and southwesterly winds.

Figure 2The time series of the related parameters focused on organic nitrates during the campaign. The background days are represented by a green B, the clean days are represented by a blue C, and the ozone pollution days are represented by a red P.
According to Chinese air quality standards for Class II areas, which define ozone pollution days as those with an hourly average exceeding 100 ppbv, the periods from 29 to 30 May and 5 to 6 June have been identified as ozone pollution days, as shown in Fig. 2. The days without ozone pollution are categorized as clean or background days. For clean days, parameters, including KOH, SO2, and CO, show significant diurnal variations (Fig. S1 in the Supplement), and no rain occurs. The days that are neither ozone pollution days nor clean days are then classified as background days. The daytime averages of environmental parameters during the ozone pollution period, the clean period, and the background period are presented in Table 2. Excluding cloudy and rainy days, the daytime peak of J(O1D) was nearly 2.8 × 10⁵ s−1, indicating a high photochemical oxidation potential. As a secondary photochemical product, O3 exhibited a typical daily profile, peaking at 140.5 ppbv throughout the campaign. The measurements of PNs peaked at 3.6 ppbv with a daytime average of 0.5 ± 0.3 ppbv, while ANs peaked at 1.6 ppbv with a daytime average of 0.5 ± 0.3 ppbv. Ozone pollution periods were often associated with high organic nitrates. The mean daily variation in NOx was consistent with the characteristics of typical urban sites, significantly influenced by the morning and evening rush hours. During the daytime, NO exhibited a single-peak distribution, whereas NO2 displayed a bimodal distribution. In comparison to the background and clean period, the ozone pollution period was characterized by higher temperatures and lower humidity. Additionally, the photolysis rate and levels of PM2.5 were both elevated during pollution days.
Table 2Summary of daytime averages of chemical parameters over different periods during the Shanghai campaign.

The mean diurnal profiles of organic nitrates and related parameters observed during the campaign are shown in Fig. 3. During the ozone pollution period, NOx exhibited a peak concentration at 03:00 LT, especially NO, which indicates a contribution from local emissions at this site. In comparison to the clean period, daytime NOx was lower during the ozone pollution period, particularly at noon when NO dropped to as low as 1.7 ppbv. Correspondingly, ANs during the ozone pollution period were generally high, but the daily variation was not significant. Therefore, the sources of ANs were more complex during the ozone pollution period, involving both transport contribution and local production, which aligns with the significantly increased background O3. During the clean period, the daytime peak in O3 was notably reduced and occurred later in the day. The fluctuations in NOx were more closely associated with morning and evening rush hours. The daytime peak in PNs decreased from 2.6 to 1.4 ppbv. In addition, the diurnal profile of ANs displayed a more pronounced peak at noon. During the background period, there was a further decline in the daytime peaks of NOx compared to the clean period. The diurnal profile of O3 exhibited similar trends, but the duration of high O3 was significantly shortened. The levels of both PNs and ANs exhibited a decline, approaching the background concentrations.
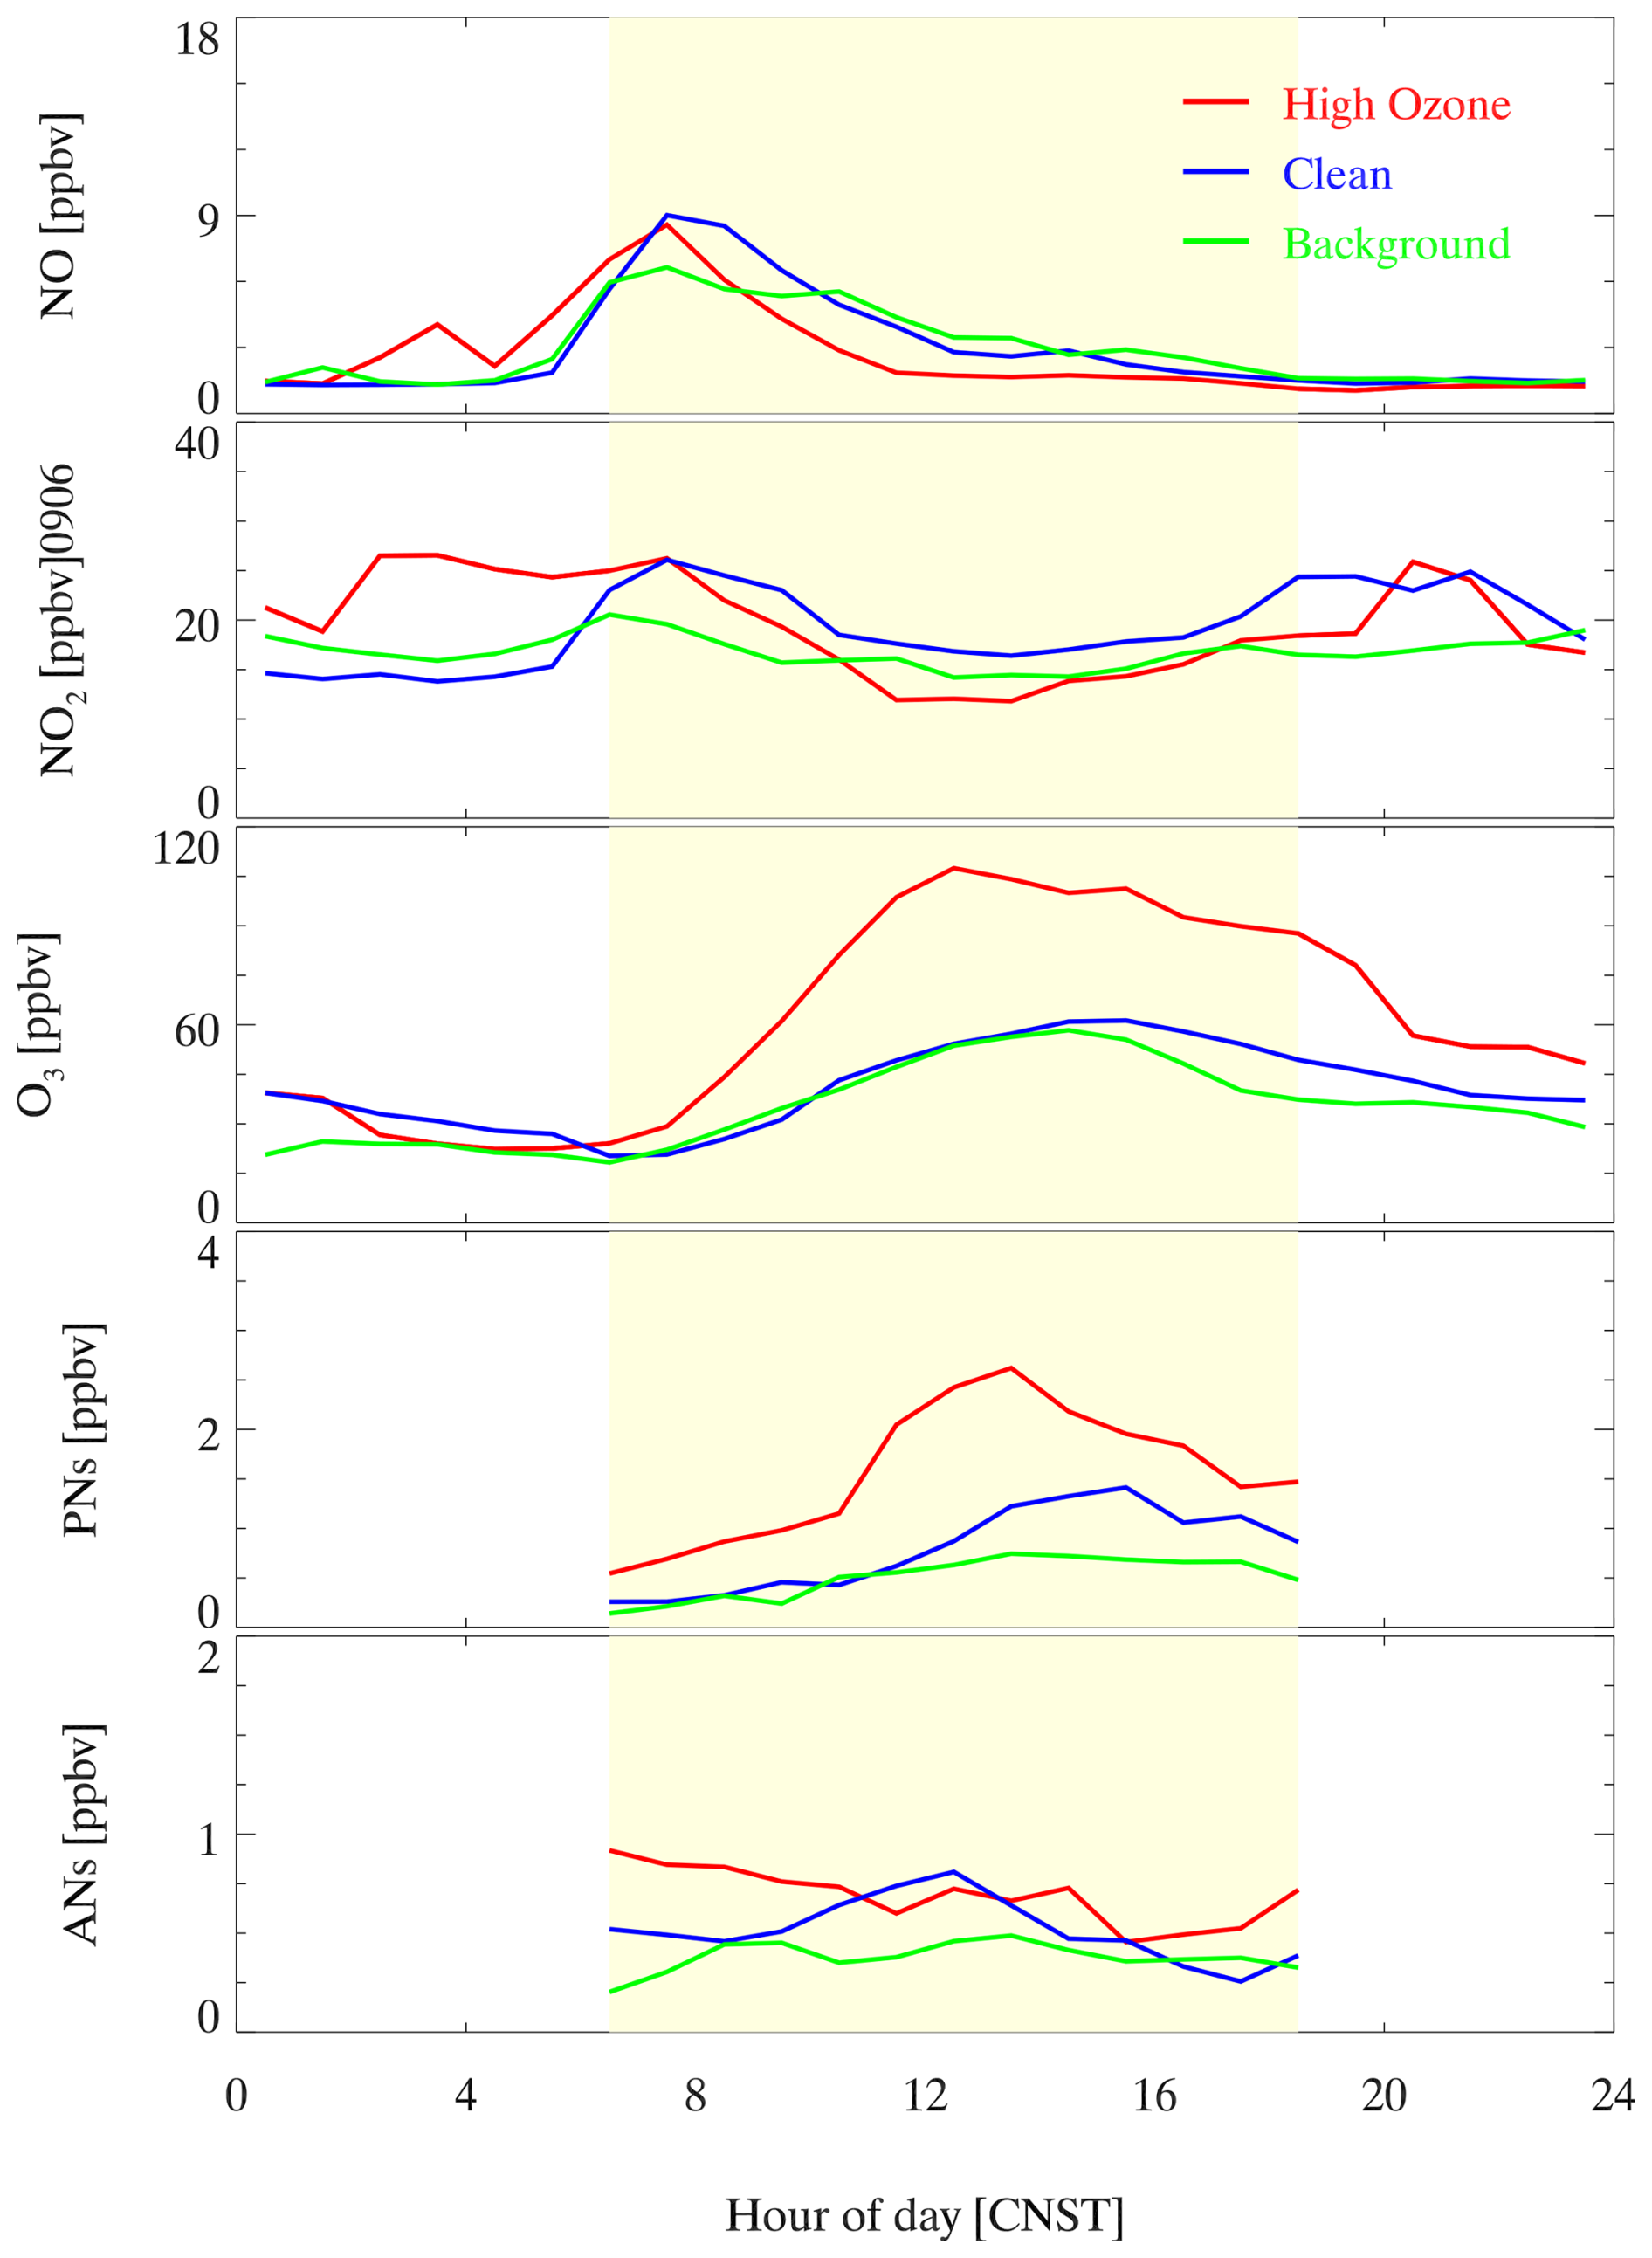
Figure 3Mean diurnal profiles of organic nitrates and related parameters during different observation periods.
Here, we compare our observations with the study previously conducted in Xinjin, which is a suburban site, located in basin topography and recently facing emerging ozone pollution, to determine the effect of organic nitrate on O3 production under different pollution conditions (Li et al., 2023). The Shanghai and Xinjin campaigns were conducted in early and late summer, respectively, exhibiting similar meteorological conditions. Photochemical conditions during both campaigns are comparable, with the daily means of J(O1D) being 0.9 × 10⁻⁵ and 0.8 × 10⁻⁵ s−1, while the daily means of J(NO2) were 3.1 × 10⁻³ and 3.0 × 10⁻³ s−1, respectively, during the Shanghai and Xinjin campaigns. The ratio of NO to NO2 was 0.19 and 0.17 at Shanghai and Xinjin, respectively. Meanwhile, the concentration of NOx observed at the Shanghai site (daily averages of 22.0 ppbv) is higher than that observed at the Xinjin site (daily averages of 12.5 ppbv). The concentrations of SO2 and CO at the Shanghai site were 0.9 and 491.4 ppbv, while SO2 and CO were 0.6 and 404.5 ppbv, respectively. Therefore, the air masses at the Shanghai site were less aged than at the Xinjin site. However, the concentration of VOCs is lower in the Shanghai campaign compared to in the Xinjin campaign, with a daily mean of 23.5 ppbv compared to 22.4 ppbv. Therefore, a comparison of the two campaigns facilitates a comprehensive analysis of the impacts of organic nitrate chemistry on local ozone pollution.
3.2 Evaluation of organic nitrates simulations
In light of the updates to the mechanisms, validation testing has been conducted. Our previous study of the Xinjin campaign evaluated three mechanism schemes: mechanism S0, which is based on RACM2, and mechanism S1 and mechanism S2, which refine the budget for BVOC-derived organic nitrates (Li et al., 2023). It was found that the performance of mechanism S2 for organic nitrates exhibited an improvement exceeding 50 %. Mechanism S2 has been updated by the Berkeley group (Fisher et al., 2016; Travis et al., 2016), which includes enhancements to the production mechanism of isoprene, the incorporation of the production mechanism for monoterpenes, and the completion of the uptake of organic nitrates by aerosols. Additionally, the Zare mechanism further refines the production mechanism of organic nitrates initiated by OH and NO3 and improves the deposition process of organic nitrates. As a result, the Shanghai campaign was simulated using RACM2 and the Berkeley and Zare mechanisms for comparison.

Figure 4Mean diurnal profiles of observed and simulated ANs and PNs under different mechanism constraints during the Shanghai campaign (a) and the error of the different cases (b), including mean square error (MSE), mean absolute error (MAE), and mean absolute percentage error (MAPE).
The simulation result of organic nitrates under the three mechanisms is shown in Fig. 4a. The simulations for PAN or PNs exhibit an overall underestimation tendency, with the simulation of PAN demonstrating an even greater underestimation. Notably, the measured PNs remained above 500 pptv during the nighttime, indicating a continuous transportation contribution at this site. Furthermore, the underestimation of PNs may be attributed to the unidentified ROx sources. It is consistent with the findings from summer campaigns in Wangdu, Beijing, where an underestimation of RO2 was noted, particularly pronounced at elevated ambient NOx (Tan et al., 2017). In terms of ANs, the simulation performances vary across different mechanisms. A significant overestimation of ANs is evident when RACM2 is utilized. Conversely, the simulation based on the Berkeley and Zare mechanisms generally results in an underestimation of ANs, while the underestimation of the Zare mechanism is more significant. Sensitivity tests conducted in the Xinjin campaign suggested that the simple representation of AN uptake caused the underestimation (Li et al., 2023), which is the same reason for underestimation in the Shanghai campaign. The uptake of ANs needs further experimental data to achieve a detailed description to support the simulations.
The diurnal profile of simulated PNs is consistent with the measurements, both reaching their daytime peak shortly after sunrise. However, it is noteworthy that the peak concentration of PN measurements is significantly higher than in the simulation. In a similar pattern to PNs, the simulated ANs began to accumulate around 06:00 LT. The measured ANs reached their peak near noon, whereas the simulated ANs peaked at 15:00 LT. To evaluate the performance of simulations, as showed in Fig. 4b, three types of error ratios were calculated: mean square error (MSE), mean absolute error (MAE), and mean absolute percentage error (MAPE). Different error metrics for the organic nitrates exhibit a similar trend. The simulation performances of the Berkeley mechanism are better than the other two mechanisms. It should be noted that the Berkeley mechanism failed to fully reproduce the diurnal pattern of observed ANs. This is mainly due to the atmospheric transport that contributes to the ANs as mentioned in Sect. 3.1. In addition, the drastic changes in NOx during rush hours will introduce errors into the AN measurements. In addition, the Zare mechanism refined the oxidation of BVOCs by OH or NO3 by introducing extra species with uncertain yields, which might bring biases to the simulations under high NOx and anthropogenic VOCs. In general, the Berkeley mechanism performs better in AN simulations than the Zare mechanism does. As a result, the subsequent analysis is based on the Berkeley mechanism.
3.3 Impact of PN chemistry on local ozone production
Organic nitrates and O3 have common precursors; therefore the atmospheric behavior of organic nitrates has an important influence on the local O3 distribution. The production of PNs consumes NO2 and ROx, thereby directly impacting O3 production. The relationship between the distribution of PNs and O3 is examined throughout the campaign. The observed PAN, PNs, and O3 between 09:00 and 14:00 LT are selected for the analysis to mitigate interference from sources that are not produced during the daytime. The correlation of PAN or PNs with O3 is shown in Fig. S2. Both PAN and PNs demonstrate a strong correlation with O3, with the ratio of PAN or PNs to O3 being 0.041 or 0.058. High ratios of PNs and O3 usually indicate severe pollution episodes (Shepson et al., 1992; Zhang et al., 2014; Sun et al., 2020; Zhang et al., 2023). The minimum ratio of PNs to O3 (0.024) was found during the clean periods, which can be regarded as the threshold for local photochemical pollution. NOx is the key pollutant for the production of O3 and PNs in order to study the relationship between the ratio of PAN or PNs to O3 and NOx. The daytime ratios of PAN to O3 derived from historical field observations are summarized with corresponding NOx concentrations in Fig. 5. The ratio derived from this study was distributed in the medium level of historical observations. The linear correlation of NOx and the ratio of PAN to O3 suggest that the NOx concentration controls the relative production of PNs and O3.

Figure 5The relationship between the historical daytime ratio of PAN to O3 and NOx concentrations. The red dot is the Shanghai campaign, and the blue dots are the historical campaigns. A: Grosjean et al. (2002); B: Lee et al. (2008); C: Zhang et al. (2014); D–E: Zhang et al. (2009); F–G: Zeng et al. (2019); H–K: Zhang et al. (2019); L–M: Sun et al. (2020); N: Li et al. (2023); O–R: Xu et al. (2024); S: this study.
Sensitivity tests were conducted based on the box model to quantify the impact of PN photochemistry on O3 budgets. The differences of each pathway rate are calculated at the peak of O3 production rate (Fig. 6). In the absence of PN chemistry, two primary source pathways – namely, the reaction between RO2 and NO and the reaction between HO2 and NO – exhibit large enhancements of 0.52 and 0.36 ppbv h−1, respectively. In comparison, O3 sinks increase slightly in the absence of PN photochemistry, with the reaction between OH and O3 showing the most significant enhancement of 0.11 ppbv h−1. Therefore, during the Shanghai campaign, PN photochemistry suppressed daytime ozone production mainly by reducing the reaction between HO2 or RO2 and NO.

Figure 6The simulated difference in ozone produce rate (ΔP(O3)) at 11:00 LT between the constraint of the PN photochemistry and without the PN photochemistry.
The PNs maintain a notable concentration until 18:00 LT, suggesting a persistent impact on local ozone production. As shown in Fig. 7a, the PN photochemistry began to inhibit ozone production as early as 06:00 LT and increased up to 0.8 ppbv h−1 (16 %) at 10:00 LT. The integrated inhibition of PN photochemistry on O3 production was 4.5 ppbv in the Shanghai campaign (Fig. 7b), which was less pronounced than in the Xinjin campaign (20 ppbv). The reduced inhibition can be attributed to the lower PN production rate (P(PNs)) observed in the Shanghai campaign (Fig. S3), where the maximum daytime P(PNs) was 0.89 ppbv h−1, much lower than that in the Xinjin campaign (3.09 ppbv h−1). In addition, the two campaigns had similar concentrations of VOCs, but the daytime average of NOx at the Shanghai site is 22.0 ppbv, which is much higher than that of the Xinjin site (10.2 ppbv). The PN formation would be reduced under high-NOx conditions due to the rapid termination reaction via OH and NO2 and thus limit the suppression effect of PN formation, which is the case in the Shanghai campaign. Like in the Xinjin campaign, PAN chemistry suppressed O3 formation at a rate of 2.84 ppbv h−1 at a suburban site in Hong Kong, SAR (Zeng et al., 2019). However, it was reported that PAN tended to suppress O3 production under low-NOx and low-ROx conditions but enhanced O3 production with sufficient NOx at a rural coastal site in Qingdao, which is consistent with the comparison of the Xinjin and Shanghai campaigns (Liu et al., 2021). The impacts of PN photochemistry on O3 vary across different days. As shown in Fig. S4, the integrated P(O3) change reaches 6.9 ppbv due to PN photochemistry during the ozone pollution period. For the background and clean periods, the changes are close to each other with a value of 3.8 and 4.2 ppbv, respectively. Therefore, the PN photochemistry contributes to more P(O3) inhibition during the ozone pollution period, which should be considered in ozone pollution prevention.
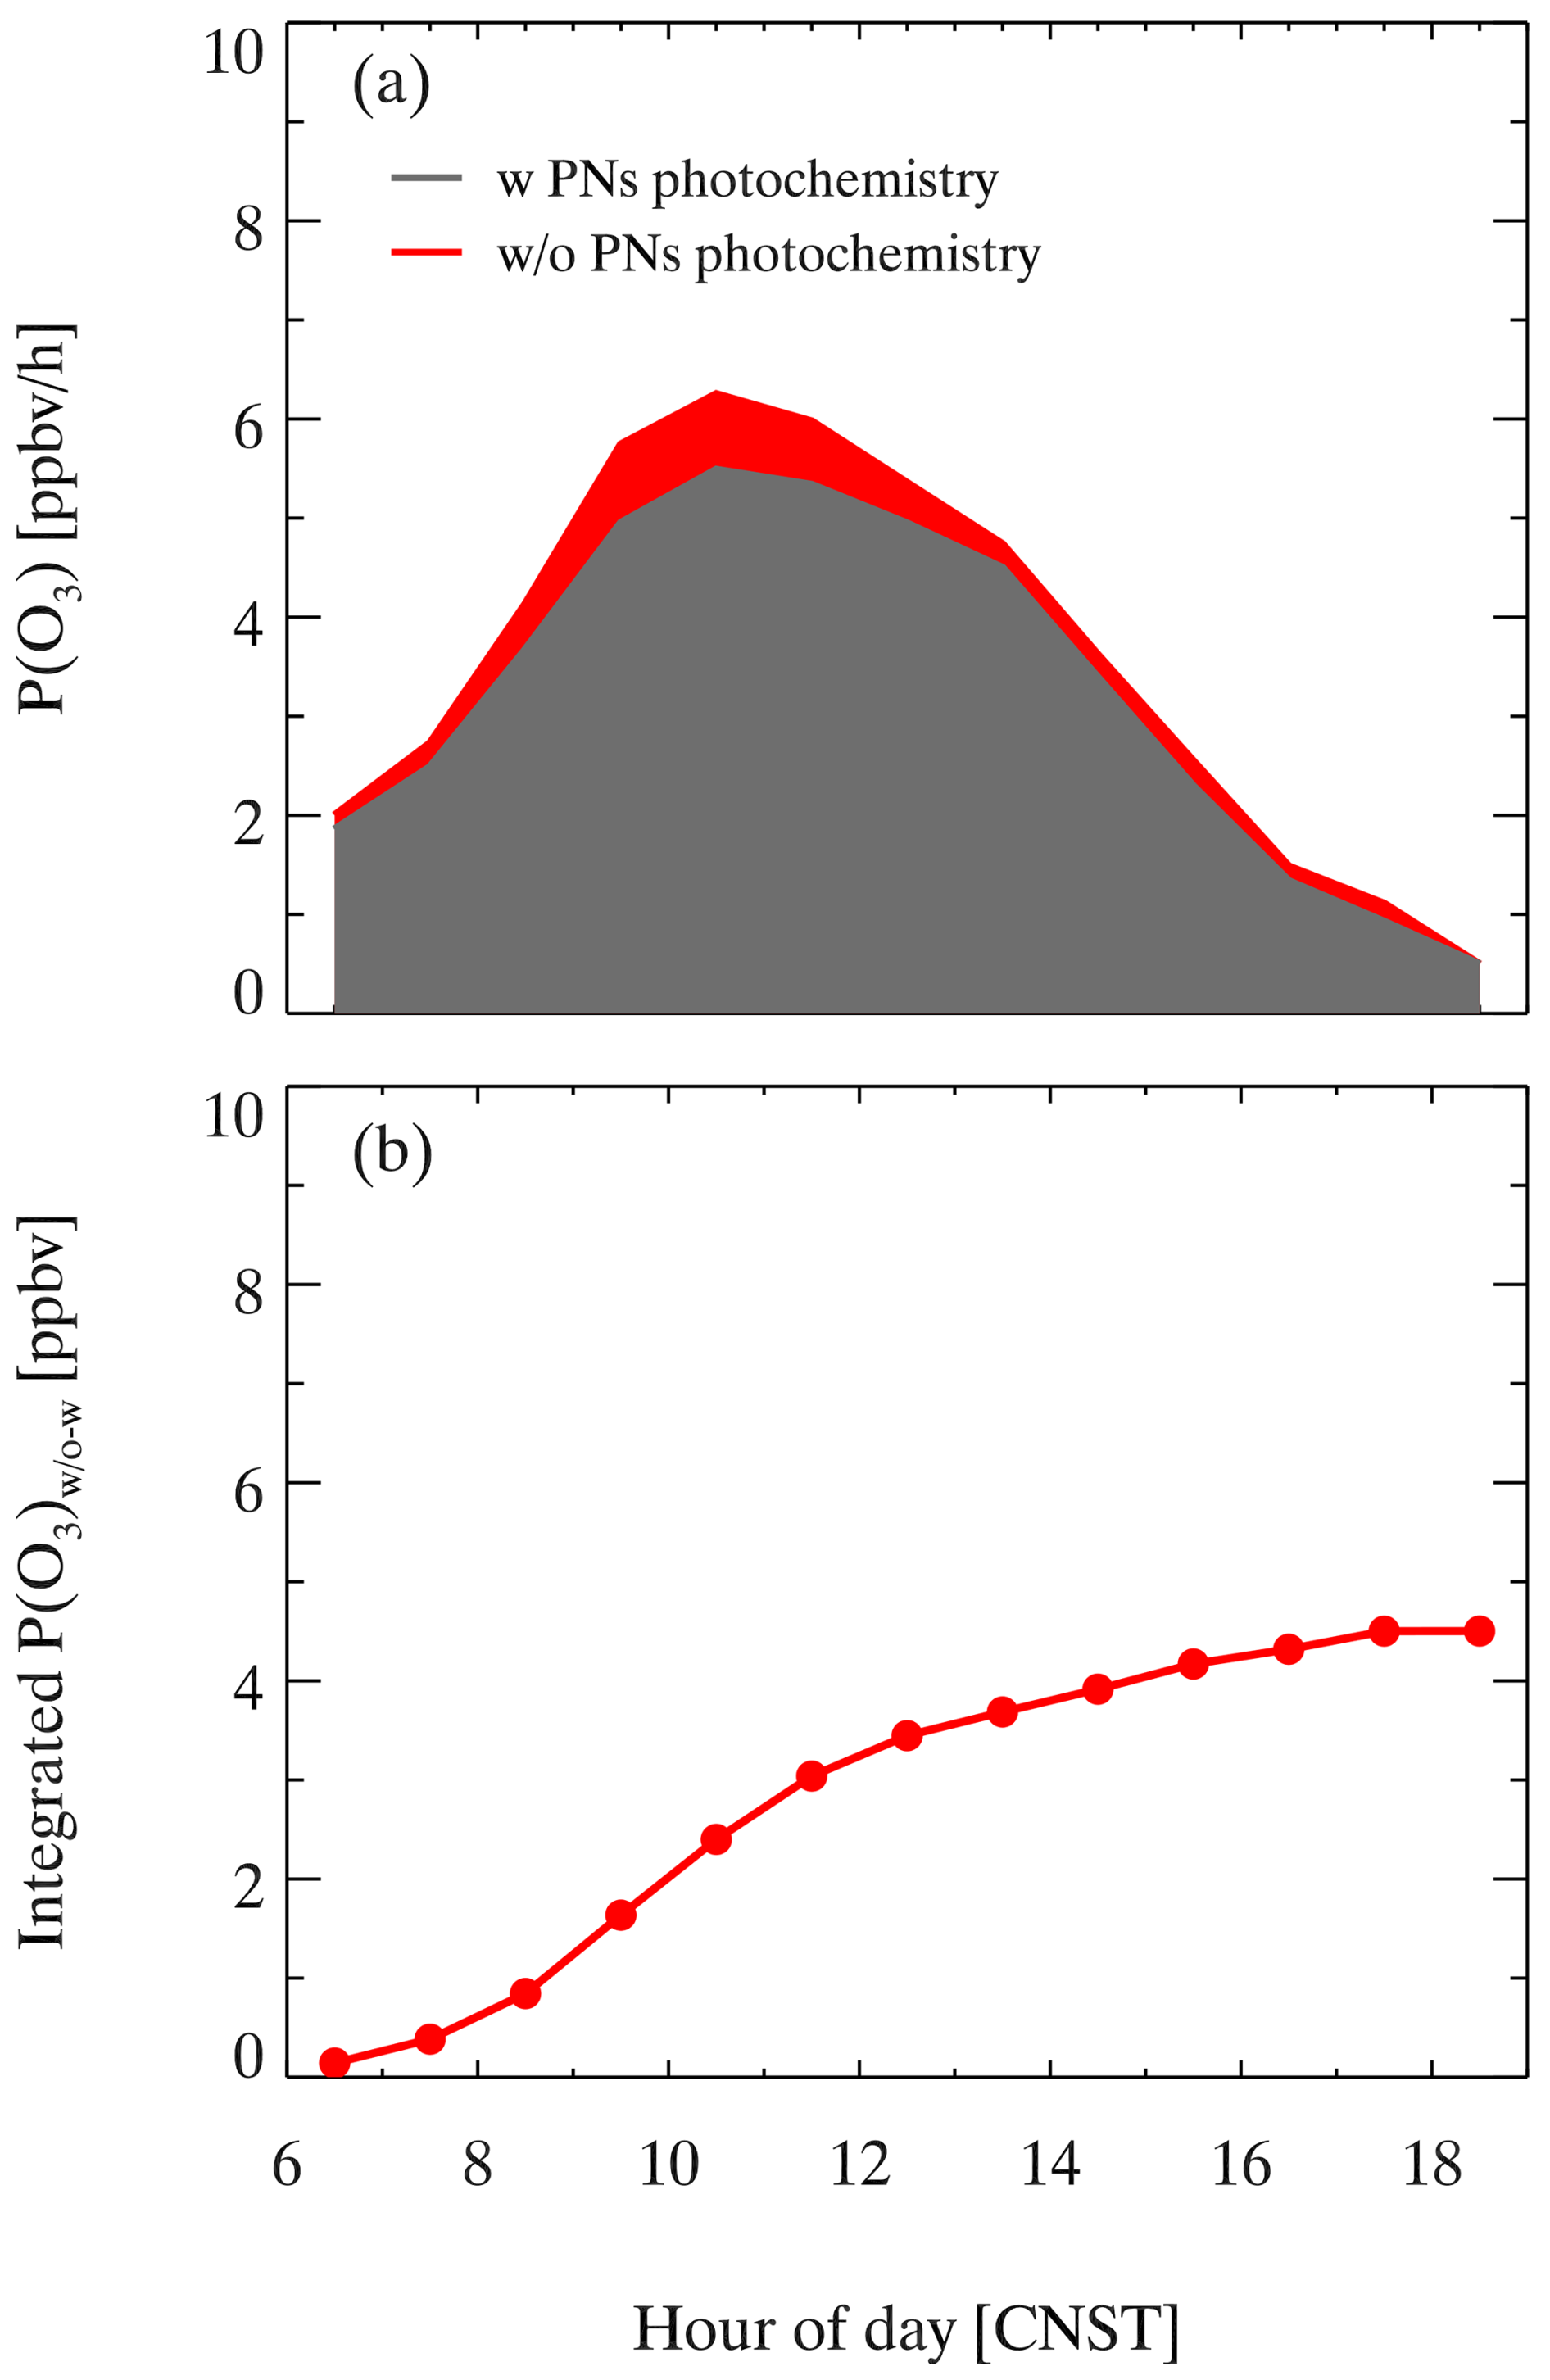
Figure 7The impact of PN photochemistry on P(O3) during the Shanghai campaign: (a) daily changes in P(O3) under the constraint of PN photochemistry and (b) integrated P(O3) change constrained by PN photochemistry.
3.4 Impact of AN chemistry on local ozone production
To elucidate the impact of the α on O3 production, the EKMA was utilized to investigate the combined response of NOx and VOCs to O3 production at different α. The O3 production was calculated by a simplified approach in method 2.2, and the α values were derived from the weighted average of α based on the measured VOCs, the corresponding OH reaction rate constant, and the α (Table S1) in the Shanghai and Xinjin campaigns. The model is initiated by the daytime averages of the environmental parameters. A comparative analysis is conducted between the Xinjin campaign and the Shanghai campaign, where effective α is determined to be 0.031 and 0.053, respectively. As illustrated in Fig. 8a and b, P(O3) exhibits a similar trend to the variations in NOx and VOCs under different α, while the value of P(O3) reduces with larger α at the same levels of precursors. For example, when the VOC level is at 8 ppbv and NOx reaches 9 ppbv, the P(O3) is 30.4 ppbv h−1 with α of 0.031, whereas it decreases to 24.6 ppbv h−1 when α is 0.053. In addition, the larger α in the Shanghai campaign increases the threshold of NOx concentration for the transition of the O3 production regime. When the concentration of VOCs is fixed, a higher effective α results in a lower NOx concentration corresponding to the peak of P(O3). Consequently, an increase in α suppresses the peak of P(O3) and simultaneously affects its sensitivity to NOx and VOC concentrations.

Figure 8Ozone production (P(O3), ppb h−1) derived from a simplified analytic model is plotted as a function of NOx and VOCs under three different organic nitrate scenarios with branching ratios of (a) 0.031 for the Xinjin campaign, (b) 0.053 for the Shanghai campaign, and (c) VOC-dependent branching ratios for the Shanghai campaign, where the branching ratio decreases linearly from 12 % to 0.5 % with VOCs from 100 to 5 ppbv as shown in panel (d).
In the real atmosphere, the effective α of ANs tends to exhibit a decline with the reduction in VOC concentration. Historical studies show the general range from 0.03 to 0.04 in rural sites and from 0.04 to 0.10 in urban environments, depending on the composition of VOCs and the α for BVOCs (Rosen et al., 2004; Perring et al., 2009, 2010; Farmer et al., 2011; Perring et al., 2013). For simplicity, we use a linear relationship between α and VOC concentration in the sensitivity analysis, as shown in Fig. 8d. An α value of 0.005 was selected for clean conditions with a VOC concentration less than 5 ppbv, while 0.12 was selected for polluted conditions with a VOC concentration larger than 100 ppbv. The lower limit of 0.005 is the average of the α for methane and ethylene. The upper limit of 0.12 is set, as the reported values of the α for isoprene and the α for aromatic hydrocarbons are generally distributed around 0.1 (Perring et al., 2013). The assumption of this linear relationship between α and VOC concentration was also applied in a previous study (Farmer et al., 2011). With a varying α, as shown in Fig. 8d, P(O3) does not follow a consistent downward trend as VOCs decrease in a VOC-limited regime or transition regime. Instead, with the decrease in VOCs, the P(O3) is likely to increase at first at a relatively high VOC distribution and then decrease similarly to the fixed-α scenario. Take the cases of the horizontal dashed line as an example: at a fixed NOx, the P(O3) increases as the VOCs decrease within the range of about 60 to 100 ppbv, whereas P(O3) subsequently decreases as VOCs fall below 60 ppbv. Therefore, with the reduction in VOC emission, an increase in α directly correlates with a reduction in the P(O3) peak. As a result, a positive correlation between α and VOC concentrations in the real atmosphere might alter the NOx–VOC–O3 relationship and diminish the effects of VOC reduction on ozone control.
Scenarios with different VOC reactivity and α are selected for sensitivity tests to further investigate the impact of AN chemistry on the O3 pollution control strategy in Shanghai. As illustrated in Fig. 9a, variations in P(O3) among three scenarios exhibit an initial increase followed by a subsequent decrease with rising NOx. For the typical VOC reactivity and α obtained from the Shanghai campaign, the turning point from NOx benefit to NOx limitation for P(O3) occurs at an NOx concentration of 1.38 ppbv, when P(O3) reaches a peak of 33.0 ppbv h−1. When VOCs are reduced by 20 % without accounting for the reductions in α, the turning point for NOx decreases to 1.26 ppbv, with the P(O3) peak decreasing to 30.1 ppbv h−1. When the reduction in α is considered alongside the decrease in VOCs (α decreases to 0.0265), the peak of P(O3) remains the same as the initial case. Consequently, neglecting the α changes is likely to overestimate the effectiveness of emission control. Our observations indicated that NOx in Shanghai was notably high, which accords with the conditions to the right of the turning point in Fig. 9a. In this case, the major chain-termination reaction of the HOx cycle is the reaction between OH and NO2 to produce HNO3, while the share of the reaction that produces ANs through the reaction between RO2 and NO becomes relatively minor. As illustrated in Fig. 9a, when NOx changes from 22.0 to 1.0 ppbv, the impact of α change will be larger, as the P(O3) difference between the two cases ranges from 0.1 to 2.6 ppbv h−1. Therefore, the variation in α has a limited impact on O3 production at high NOx, whereas it offsets the impact of VOC reduction as NOx decreases to around 1.5 ppbv, which represents a low NOx emission condition. In addition, the sensitivity analyses in a reduced VOC condition show that neglecting the α change still overestimates the impact of VOC reduction on P(O3) by around 4 times, with NOx of 1 ppbv (Fig. 9b), which is also more significant than in the Shanghai campaign. Therefore, the variation in α has a temporarily limited impact on O3 production, whereas it should be considered seriously as NOx levels continue to decrease.

Figure 9The ozone production rate (P(O3)) varies as a function of NOx under different VOC–NOx regimes during the Shanghai campaign: (a) under mean measured parameters during the whole campaign (solid line, VOC reactivity (KOH) of 4.3 s−1, AN branching ratio (α) of 0.053), a 20 % reduction in KOH with a 50 % reduction in α (dotted red line, 3.4 s−1, 0.0265), and a 20 % reduction in KOH with no change in α (dotted blue line, 3.4 s−1, 0.053). (b) Under observed parameters during the clean days (solid line, KOH of 2.0 s−1, α of 0.053), a 20 % reduction in KOH with a 50 % reduction in α (dotted red line, 1.6 s−1, 0.0265), and a 20 % reduction in KOH with no change in α (dotted blue line, 1.6 s−1, 0.053). Dashed lines show the turning points in different cases.
To further investigate the effect of AN formation on O3 production during different days, sensitivity tests on VOC reactivity and α are conducted based on typical conditions during different periods. The α values are derived as 0.055, 0.054, and 0.052 for the high-ozone, clean, and background periods, respectively. As shown in Fig. S4, the P(O3) exhibits a similar trend to the increase in NOx across different periods. The P(O3) peak during the background period (30.3 ppbv h−1) is slightly lower than during both the high-ozone days and the clean days (32.5 and 32.4 ppbv h−1). Therefore, the AN chemistry has similar effects on O3 production within different periods during the Shanghai campaign. Further comparisons of ozone production under varying precursor levels were conducted using historical observations collected in August 1994 at Mankmoos (MK), Mecklenburg-Vorpommern, Germany (Ehhalt, 1999), and during the spring of 2006 in Mexico City (MX) (Perring et al., 2010; Farmer et al., 2011). The MK site serves as a typical clean background location with a very low effective α of 0.005, corresponding to τVOC of 0.4 s−1, where methane is the predominant pollutant. Conversely, the MX site is characterized as an urban environment with an effective α of 0.036, where a total of 58 VOCs were measured, corresponding to τVOC of 3.1 s−1. The MK site shows a peak P(O3) of 2.2 ppbv h−1 at an NOx of 0.63 ppbv. In contrast, the MX site demonstrates a peak P(O3) of 7.2 ppbv h−1 at an NOx of 1.9 ppbv. Given that the Xinjin and Shanghai sites exhibit higher VOC reactivity than MX, the corresponding peak P(O3) and the NOx inflection point are significantly elevated. This increase is primarily attributed to the high P(HOx), coupled with a low α, which substantially enhances P(O3) under the intensified HOx cycling. Consequently, the ozone production potentials of urban sites in China are overall higher than in other regions, while the influence of α appears to be weak.
This study reveals the abundances of PNs and ANs and quantifies their respective impacts on O3 pollution based on the field campaign in Shanghai. They both showed higher values but less pronounced diurnal variation during the O3 pollution period than during the clean period. The mechanism validation indicates that the Berkeley mechanism generally outperforms in the simulation of organic nitrates. The ratio of PNs O3 serves as a significant indicator of photochemistry. In comparison to the previous Xinjin campaign, the inhibition effect of PN chemistry on daytime O3 production diminished, likely attributed to the lower production of PNs. For ANs, the model simulation demonstrated that the branching ratio (α) influences the NOx–VOC–O3 sensitivity. The consideration of the α value not only alters the P(O3) peak in the EKMA but also results in low effectiveness of precursor reductions, as the α would change with the reduction in VOCs. It is worth mentioning that the complex polluted regions are usually characterized by high NOx and HOx. In that case, the contribution of chain-termination reactions that produce ANs could be reduced, leading to the limited impact of AN chemistry on O3 formation. The effect of AN chemistry on O3 pollution control is therefore expected to enhance with further precursor reductions, and we suggest a pressing need for more measurements and analysis of organic nitrates to address the forthcoming challenges in air pollution mitigation.
The datasets used in this study are available from the corresponding author upon request (chenxr95@mail.sysu.edu.cn; k.lu@pku.edu.cn).
The supplement related to this article is available online at https://doi.org/10.5194/acp-25-3905-2025-supplement.
KL and XC designed the study. CL and XC analyzed the data and wrote the paper with input from KL.
The contact author has declared that none of the authors has any competing interests.
Publisher's note: Copernicus Publications remains neutral with regard to jurisdictional claims made in the text, published maps, institutional affiliations, or any other geographical representation in this paper. While Copernicus Publications makes every effort to include appropriate place names, the final responsibility lies with the authors.
This work was supported by the National Natural Science Foundation of China (grant nos. 42407139 and 22406204); the special fund of the State Environmental Protection Key Laboratory of Formation and Prevention of Urban Air Pollution Complex (grant no. SEPAir-2024080219); and the Innovative Exploration Program of National Institute of Metrology, China (grant no. AKYCX2313).
This research has been supported by the National Natural Science Foundation of China (grant nos. 42407139 and 22406204); the special fund of the State Environmental Protection Key Laboratory of Formation and Prevention of Urban Air Pollution Complex (grant no. SEPAir-2024080219); and the Innovative Exploration Program of the National Institute of Metrology, China (grant no. AKYCX2313).
This paper was edited by Kelvin Bates and reviewed by two anonymous referees.
Arey, J., Aschmann, S. M., Kwok, E. S. C., and Atkinson, R.: Alkyl Nitrate, Hydroxyalkyl Nitrate, and Hydroxycarbonyl Formation from the NOx-Air Photooxidations of C5-C8 n-Alkanes, J. Phys. Chem. A, 105, 1020–1027, https://doi.org/10.1021/jp003292z, 2001a.
Aruffo, E., Di Carlo, P., Dari-Salisburgo, C., Biancofiore, F., Giammaria, F., Busilacchio, M., Lee, J., Moller, S., Hopkins, J., Punjabi, S., Bauguitte, S., O'Sullivan, D., Percival, C., Le Breton, M., Muller, J., Jones, R., Forster, G., Reeves, C., Heard, D., Walker, H., Ingham, T., Vaughan, S., and Stone, D.: Aircraft observations of the lower troposphere above a megacity: Alkyl nitrate and ozone chemistry, Atmos. Environ., 94, 479–488, https://doi.org/10.1016/j.atmosenv.2014.05.040, 2014.
Ashmore, M. R.: Assessing the future global impacts of ozone on vegetation, Plant Cell Environ., 28, 949–964, https://doi.org/10.1111/j.1365-3040.2005.01341.x, 2005.
Browne, E. C., Min, K.-E., Wooldridge, P. J., Apel, E., Blake, D. R., Brune, W. H., Cantrell, C. A., Cubison, M. J., Diskin, G. S., Jimenez, J. L., Weinheimer, A. J., Wennberg, P. O., Wisthaler, A., and Cohen, R. C.: Observations of total RONO2 over the boreal forest: NOx sinks and HNO3 sources, Atmos. Chem. Phys., 13, 4543–4562, https://doi.org/10.5194/acp-13-4543-2013, 2013.
Butkovskaya, N., Kukui, A., and Le Bras, G.: Pressure and Temperature Dependence of Methyl Nitrate Formation in the CH3O2 + NO Reaction, J. Phys. Chem. A, 116, 5972–5980, 2012.
Cassanelli, P., Fox, D. J., and Cox, R. A.: Temperature dependence of pentyl nitrate formation from the reaction of pentyl peroxy radicals with NO, Phys. Chem. Chem. Phys., 9, 4332–4337, https://doi.org/10.1039/b700285h, 2007.
Chen, J., Wu, H., Liu, A. W., Hu, S. M., and Zhang, J.: Field Measurement of NO2 and RNO2 by Two-Channel Thermal Dissociation Cavity Ring Down Spectrometer, Chin. J. Chem. Phys., 30, 493–498, https://doi.org/10.1063/1674-0068/30/cjcp1705084, 2017.
Darer, A. I., Cole-Filipiak, N. C., O'Connor, A. E., and Elrod, M. J.: Formation and Stability of Atmospherically Relevant Isoprene-Derived Organosulfates and Organonitrates, Environ. Sci. Technol., 45, 1895–1902, https://doi.org/10.1021/es103797z, 2011.
Day, D. A., Dillon, M. B., Wooldridge, P. J., Thornton, J. A., Rosen, R. S., Wood, E. C., and Cohen, R. C.: On alkyl nitrates, O-3, and the “missing NOy”, J. Geophys. Res.-Atmos., 108, 28–44, 2003.
Ehhalt, D. H.: Photooxidation of trace gases in the troposphere, Phys. Chem. Chem. Phys., 1, 5401–5408, https://doi.org/10.1039/a905097c, 1999.
Farmer, D. K., Perring, A. E., Wooldridge, P. J., Blake, D. R., Baker, A., Meinardi, S., Huey, L. G., Tanner, D., Vargas, O., and Cohen, R. C.: Impact of organic nitrates on urban ozone production, Atmos. Chem. Phys., 11, 4085–4094, https://doi.org/10.5194/acp-11-4085-2011, 2011.
Fisher, J. A., Jacob, D. J., Travis, K. R., Kim, P. S., Marais, E. A., Chan Miller, C., Yu, K., Zhu, L., Yantosca, R. M., Sulprizio, M. P., Mao, J., Wennberg, P. O., Crounse, J. D., Teng, A. P., Nguyen, T. B., St. Clair, J. M., Cohen, R. C., Romer, P., Nault, B. A., Wooldridge, P. J., Jimenez, J. L., Campuzano-Jost, P., Day, D. A., Hu, W., Shepson, P. B., Xiong, F., Blake, D. R., Goldstein, A. H., Misztal, P. K., Hanisco, T. F., Wolfe, G. M., Ryerson, T. B., Wisthaler, A., and Mikoviny, T.: Organic nitrate chemistry and its implications for nitrogen budgets in an isoprene- and monoterpene-rich atmosphere: constraints from aircraft (SEAC4RS) and ground-based (SOAS) observations in the Southeast US, Atmos. Chem. Phys., 16, 5969–5991, https://doi.org/10.5194/acp-16-5969-2016, 2016.
Flocke, F., Volz-Thomas, A., Buers, H. J., Patz, W., Garthe, H. J., and Kley, D.: Long-term measurements of alkyl nitrates in southern Germany 1. General behavior and seasonal and diurnal variation, J. Geophys. Res.-Atmos., 103, 5729–5746, 1998.
Gao, W., Tie, X., Xu, J., Huang, R., Mao, X., Zhou, G., and Chang, L.: Long-term trend of O-3 in a mega City (Shanghai), China: Characteristics, causes, and interactions with precursors, Sci. Total Environ., 603, 425–433, https://doi.org/10.1016/j.scitotenv.2017.06.099, 2017.
Grosjean, E., Grosjean, D., Woodhouse, L. F., and Yang, Y. J.: Peroxyacetyl nitrate and peroxypropionyl nitrate in Porto Alegre, Brazil, Atmos. Environ., 36, 2405–2419, https://doi.org/10.1016/s1352-2310(01)00541-6, 2002.
Lee, G., Jang, Y., Lee, H., Han, J.-S., Kim, K.-R., and Lee, M.: Characteristic behavior of peroxyacetyl nitrate (PAN) in Seoul megacity, Korea, Chemosphere, 73, 619–628, https://doi.org/10.1016/j.chemosphere.2008.05.060, 2008.
Li, C., Wang, H., Chen, X., Zhai, T., Chen, S., Li, X., Zeng, L., and Lu, K.: Thermal dissociation cavity-enhanced absorption spectrometer for measuring NO2, RO2NO2, and RONO2 in the atmosphere, Atmos. Meas. Tech., 14, 4033–4051, https://doi.org/10.5194/amt-14-4033-2021, 2021.
Li, C., Wang, H., Chen, X., Zhai, T., Ma, X., Yang, X., Chen, S., Li, X., Zeng, L., and Lu, K.: Observation and modeling of organic nitrates on a suburban site in southwest China, Sci. Total Environ., 859, 160287, https://doi.org/10.1016/j.scitotenv.2022.160287, 2023.
Liebmann, J., Karu, E., Sobanski, N., Schuladen, J., Ehn, M., Schallhart, S., Quéléver, L., Hellen, H., Hakola, H., Hoffmann, T., Williams, J., Fischer, H., Lelieveld, J., and Crowley, J. N.: Direct measurement of NO3 radical reactivity in a boreal forest, Atmos. Chem. Phys., 18, 3799–3815, https://doi.org/10.5194/acp-18-3799-2018, 2018.
Ling, Z., Guo, H., Simpson, I. J., Saunders, S. M., Lam, S. H. M., Lyu, X., and Blake, D. R.: New insight into the spatiotemporal variability and source apportionments of C1–C4 alkyl nitrates in Hong Kong, Atmos. Chem. Phys., 16, 8141–8156, https://doi.org/10.5194/acp-16-8141-2016, 2016.
Liu, Y., Shen, H., Mu, J., Li, H., Chen, T., Yang, J., Jiang, Y., Zhu, Y., Meng, H., Dong, C., Wang, W., and Xue, L.: Formation of peroxyacetyl nitrate (PAN) and its impact on ozone production in the coastal atmosphere of Qingdao, North China, Sci. Total Environ., 778, 146265, https://doi.org/10.1016/j.scitotenv.2021.146265, 2021.
Lu, K. D., Hofzumahaus, A., Holland, F., Bohn, B., Brauers, T., Fuchs, H., Hu, M., Häseler, R., Kita, K., Kondo, Y., Li, X., Lou, S. R., Oebel, A., Shao, M., Zeng, L. M., Wahner, A., Zhu, T., Zhang, Y. H., and Rohrer, F.: Missing OH source in a suburban environment near Beijing: observed and modelled OH and HO2 concentrations in summer 2006, Atmos. Chem. Phys., 13, 1057–1080, https://doi.org/10.5194/acp-13-1057-2013, 2013.
Monks, P. S., Archibald, A. T., Colette, A., Cooper, O., Coyle, M., Derwent, R., Fowler, D., Granier, C., Law, K. S., Mills, G. E., Stevenson, D. S., Tarasova, O., Thouret, V., von Schneidemesser, E., Sommariva, R., Wild, O., and Williams, M. L.: Tropospheric ozone and its precursors from the urban to the global scale from air quality to short-lived climate forcer, Atmos. Chem. Phys., 15, 8889–8973, https://doi.org/10.5194/acp-15-8889-2015, 2015.
Ng, N. L., Brown, S. S., Archibald, A. T., Atlas, E., Cohen, R. C., Crowley, J. N., Day, D. A., Donahue, N. M., Fry, J. L., Fuchs, H., Griffin, R. J., Guzman, M. I., Herrmann, H., Hodzic, A., Iinuma, Y., Jimenez, J. L., Kiendler-Scharr, A., Lee, B. H., Luecken, D. J., Mao, J., McLaren, R., Mutzel, A., Osthoff, H. D., Ouyang, B., Picquet-Varrault, B., Platt, U., Pye, H. O. T., Rudich, Y., Schwantes, R. H., Shiraiwa, M., Stutz, J., Thornton, J. A., Tilgner, A., Williams, B. J., and Zaveri, R. A.: Nitrate radicals and biogenic volatile organic compounds: oxidation, mechanisms, and organic aerosol, Atmos. Chem. Phys., 17, 2103–2162, https://doi.org/10.5194/acp-17-2103-2017, 2017.
Perring, A. E., Wisthaler, A., Graus, M., Wooldridge, P. J., Lockwood, A. L., Mielke, L. H., Shepson, P. B., Hansel, A., and Cohen, R. C.: A product study of the isoprene + NO3 reaction, Atmos. Chem. Phys., 9, 4945–4956, https://doi.org/10.5194/acp-9-4945-2009, 2009.
Perring, A. E., Bertram, T. H., Farmer, D. K., Wooldridge, P. J., Dibb, J., Blake, N. J., Blake, D. R., Singh, H. B., Fuelberg, H., Diskin, G., Sachse, G., and Cohen, R. C.: The production and persistence of ΣRONO2 in the Mexico City plume, Atmos. Chem. Phys., 10, 7215–7229, https://doi.org/10.5194/acp-10-7215-2010, 2010.
Perring, A. E., Pusede, S. E., and Cohen, R. C.: An Observational Perspective on the Atmospheric Impacts of Alkyl and Multifunctional Nitrates on Ozone and Secondary Organic Aerosol, Chem. Rev., 113, 5848–5870, https://doi.org/10.1021/cr300520x, 2013.
Reisen, F., Aschmann, S. M., Atkinson, R., and Arey, J.: 1,4-hydroxycarbonyl products of the OH radical initiated reactions of C-5–C-8 n-alkanes in the presence of N0, Environ. Sci. Technol., 39, 4447–4453, https://doi.org/10.1021/es0483589, 2005.
Roberts, J. M. and Bertman, S. B.: The thermal-decomposition of peroxyacetic nitric anhydride (pan) and peroxymethacrylic nitric anhydride (MPAN), Int. J. Chem. Kinet., 24, 297–307, https://doi.org/10.1002/kin.550240307, 1992.
Romer, P. S., Duffey, K. C., Wooldridge, P. J., Allen, H. M., Ayres, B. R., Brown, S. S., Brune, W. H., Crounse, J. D., de Gouw, J., Draper, D. C., Feiner, P. A., Fry, J. L., Goldstein, A. H., Koss, A., Misztal, P. K., Nguyen, T. B., Olson, K., Teng, A. P., Wennberg, P. O., Wild, R. J., Zhang, L., and Cohen, R. C.: The lifetime of nitrogen oxides in an isoprene-dominated forest, Atmos. Chem. Phys., 16, 7623–7637, https://doi.org/10.5194/acp-16-7623-2016, 2016.
Romer, P. S., Duffey, K. C., Wooldridge, P. J., Edgerton, E., Baumann, K., Feiner, P. A., Miller, D. O., Brune, W. H., Koss, A. R., de Gouw, J. A., Misztal, P. K., Goldstein, A. H., and Cohen, R. C.: Effects of temperature-dependent NOx emissions on continental ozone production, Atmos. Chem. Phys., 18, 2601–2614, https://doi.org/10.5194/acp-18-2601-2018, 2018.
Romer Present, P. S., Zare, A., and Cohen, R. C.: The changing role of organic nitrates in the removal and transport of NOx, Atmos. Chem. Phys., 20, 267–279, https://doi.org/10.5194/acp-20-267-2020, 2020.
Rosen, R. S., Wood, E. C., Wooldridge, P. J., Thornton, J. A., Day, D. A., Kuster, W., Williams, E. J., Jobson, B. T., and Cohen, R. C.: Observations of total alkyl nitrates during Texas Air Quality Study 2000: Implications for O-3 and alkyl nitrate photochemistry, J. Geophys. Res.-Atmos., 109, D07307, https://doi.org/10.1029/2003jd004227, 2004.
Russell, M. and Allen, D. T.: Predicting secondary organic aerosol formation rates in southeast Texas, J. Geophys. Res.-Atmos., 110, D07S17, https://doi.org/10.1029/2004jd004722, 2005.
Sadanaga, Y., Takaji, R., Ishiyama, A., Nakajima, K., Matsuki, A., and Bandow, H.: Thermal dissociation cavity attenuated phase shift spectroscopy for continuous measurement of total peroxy and organic nitrates in the clean atmosphere, Rev. Sci. Instrum., 87, 074102, https://doi.org/10.1063/1.4958167, 2016.
Schwantes, R. H., Emmons, L. K., Orlando, J. J., Barth, M. C., Tyndall, G. S., Hall, S. R., Ullmann, K., St. Clair, J. M., Blake, D. R., Wisthaler, A., and Bui, T. P. V.: Comprehensive isoprene and terpene gas-phase chemistry improves simulated surface ozone in the southeastern US, Atmos. Chem. Phys., 20, 3739–3776, https://doi.org/10.5194/acp-20-3739-2020, 2020.
Shepson, P. B., Hastie, D. R., So, K. W., and Schiff, H. I.: Relationships between PAN, PPN and O3 at urban and rural sites in Ontario, Atmos. Environ. A-Gen., 26, 1259–1270, https://doi.org/10.1016/0960-1686(92)90387-z, 1992.
Song, J., Zhang, Y., Huang, Y., Ho, K. F., Yuan, Z., Ling, Z., Niu, X., Gao, Y., Cui, L., Louie, P. K. K., Lee, S.-C., and Lai, S.: Seasonal variations of C-1–C-4 alkyl nitrates at a coastal site in Hong Kong: Influence of photochemical formation and oceanic emissions, Chemosphere, 194, 275–284, https://doi.org/10.1016/j.chemosphere.2017.11.104, 2018.
Sun, J., Li, Z., Xue, L., Wang, T., Wang, X., Gao, J., Nie, W., Simpson, I. J., Gao, R., Blake, D. R., Chai, F., and Wang, W.: Summertime C-1–C-5 alkyl nitrates over Beijing, northern China: Spatial distribution, regional transport, and formation mechanisms, Atmos. Res., 204, 102–109, https://doi.org/10.1016/j.atmosres.2018.01.014, 2018.
Sun, M., Cui, J. n., Zhao, X., and Zhang, J.: Impacts of precursors on peroxyacetyl nitrate (PAN) and relative formation of PAN to ozone in a southwestern megacity of China, Atmos. Environ., 231, 117542, https://doi.org/10.1016/j.atmosenv.2020.117542, 2020.
Tan, Z., Fuchs, H., Lu, K., Hofzumahaus, A., Bohn, B., Broch, S., Dong, H., Gomm, S., Häseler, R., He, L., Holland, F., Li, X., Liu, Y., Lu, S., Rohrer, F., Shao, M., Wang, B., Wang, M., Wu, Y., Zeng, L., Zhang, Y., Wahner, A., and Zhang, Y.: Radical chemistry at a rural site (Wangdu) in the North China Plain: observation and model calculations of OH, HO2 and RO2 radicals, Atmos. Chem. Phys., 17, 663–690, https://doi.org/10.5194/acp-17-663-2017, 2017.
Tan, Z., Lu, K., Jiang, M., Su, R., Dong, H., Zeng, L., Xie, S., Tan, Q., and Zhang, Y.: Exploring ozone pollution in Chengdu, southwestern China: A case study from radical chemistry to O3-VOC-NOx sensitivity, Sci. Total Environ., 636, 775–786, https://doi.org/10.1016/j.scitotenv.2018.04.286, 2018a.
Tan, Z., Rohrer, F., Lu, K., Ma, X., Bohn, B., Broch, S., Dong, H., Fuchs, H., Gkatzelis, G. I., Hofzumahaus, A., Holland, F., Li, X., Liu, Y., Liu, Y., Novelli, A., Shao, M., Wang, H., Wu, Y., Zeng, L., Hu, M., Kiendler-Scharr, A., Wahner, A., and Zhang, Y.: Wintertime photochemistry in Beijing: observations of ROx radical concentrations in the North China Plain during the BEST-ONE campaign, Atmos. Chem. Phys., 18, 12391–12411, https://doi.org/10.5194/acp-18-12391-2018, 2018b.
Teng, A. P., Crounse, J. D., Lee, L., St. Clair, J. M., Cohen, R. C., and Wennberg, P. O.: Hydroxy nitrate production in the OH-initiated oxidation of alkenes, Atmos. Chem. Phys., 15, 4297–4316, https://doi.org/10.5194/acp-15-4297-2015, 2015.
Travis, K. R., Jacob, D. J., Fisher, J. A., Kim, P. S., Marais, E. A., Zhu, L., Yu, K., Miller, C. C., Yantosca, R. M., Sulprizio, M. P., Thompson, A. M., Wennberg, P. O., Crounse, J. D., St. Clair, J. M., Cohen, R. C., Laughner, J. L., Dibb, J. E., Hall, S. R., Ullmann, K., Wolfe, G. M., Pollack, I. B., Peischl, J., Neuman, J. A., and Zhou, X.: Why do models overestimate surface ozone in the Southeast United States?, Atmos. Chem. Phys., 16, 13561–13577, https://doi.org/10.5194/acp-16-13561-2016, 2016.
Wang, M., Shao, M., Chen, W., Lu, S., Wang, C., Huang, D., Yuan, B., Zeng, L., and Zhao, Y.: Measurements of C1–C4 alkyl nitrates and their relationships with carbonyl compounds and O-3 in Chinese cities, Atmos. Environ., 81, 389–398, https://doi.org/10.1016/j.atmosenv.2013.08.065, 2013.
Wang, W., Parrish, D. D., Wang, S., Bao, F., Ni, R., Li, X., Yang, S., Wang, H., Cheng, Y., and Su, H.: Long-term trend of ozone pollution in China during 2014–2020: distinct seasonal and spatial characteristics and ozone sensitivity, Atmos. Chem. Phys., 22, 8935–8949, https://doi.org/10.5194/acp-22-8935-2022, 2022.
Wennberg, P. O., Bates, K. H., Crounse, J. D., Dodson, L. G., McVay, R. C., Mertens, L. A., Nguyen, T. B., Praske, E., Schwantes, R. H., Smarte, M. D., St Clair, J. M., Teng, A. P., Zhang, X., and Seinfeld, J. H.: Gas-Phase Reactions of Isoprene and Its Major Oxidation Products, Chem. Rev. 118, 3337–3390, https://doi.org/10.1021/acs.chemrev.7b00439, 2018.
Xu, T., Nie, W., Xu, Z., Yan, C., Liu, Y., Zha, Q., Wang, R., Li, Y., Wang, L., Ge, D., Chen, L., Qi, X., Chi, X., and Ding, A.: Investigation on the budget of peroxyacetyl nitrate (PAN) in the Yangtze River Delta: Unravelling local photochemistry and regional impact, Sci. Total Environ., 917, 170373, https://doi.org/10.1016/j.scitotenv.2024.170373, 2024.
Xue, K. and Zhang, X.: The rationale behind updates to ambient ozone guidelines and standards, Frontiers in Public Health, 11, 127826, https://doi.org/10.3389/fpubh.2023.1273826, 2023.
Yeh, G. K. and Ziemann, P. J.: Identification and Yields of 1,4-Hydroxynitrates Formed from the Reactions of C8–C16 n-Alkanes with OH Radicals in the Presence of NOx, J. Phys. Chem. A, 118, 8797–8806, https://doi.org/10.1021/jp505870d, 2014a.
Yeh, G. K. and Ziemann, P. J.: Alkyl Nitrate Formation from the Reactions of C8–C14 n-Alkanes with OH Radicals in the Presence of NOx: Measured Yields with Essential Corrections for Gas-Wall Partitioning, J. Phys. Chem. A, 118, 8147–8157, https://doi.org/10.1021/jp500631v, 2014b.
Young, P. J., Naik, V., Fiore, A. M., Gaudel, A., Guo, J., Lin, M. Y., Neu, J. L., Parrish, D. D., Rieder, H. E., Schnell, J. L., Tilmes, S., Wild, O., Zhang, L., Ziemke, J., Brandt, J., Delcloo, A., Doherty, R. M., Geels, C., Hegglin, M. I., Hu, L., Im, U., Kumar, R., Luhar, A., Murray, L., Plummer, D., Rodriguez, J., Saiz-Lopez, A., Schultz, M. G., Woodhouse, M. T., and Zeng, G.: Tropospheric Ozone Assessment Report: Assessment of global-scale model performance for global and regional ozone distributions, variability, and trends, Elem. Sci. Anth., 6, 10, https://doi.org/10.1525/elementa.265, 2018.
Zare, A., Romer, P. S., Nguyen, T., Keutsch, F. N., Skog, K., and Cohen, R. C.: A comprehensive organic nitrate chemistry: insights into the lifetime of atmospheric organic nitrates, Atmos. Chem. Phys., 18, 15419–15436, https://doi.org/10.5194/acp-18-15419-2018, 2018.
Zeng, L., Fan, G.-J., Lyu, X., Guo, H., Wang, J.-L., and Yao, D.: Atmospheric fate of peroxyacetyl nitrate in suburban Hong Kong and its impact on local ozone pollution, Environ. Pollut., 252, 1910–1919, https://doi.org/10.1016/j.envpol.2019.06.004, 2019.
Zhang, B., Zhao, X., and Zhang, J.: Characteristics of peroxyacetyl nitrate pollution during a 2015 winter haze episode in Beijing, Environ. Pollut., 244, 379–387, https://doi.org/10.1016/j.envpol.2018.10.078, 2019.
Zhang, G., Xia, L., Zang, K., Xu, W., Zhang, F., Liang, L., Yao, B., Lin, W., and Mu, Y.: The abundance and inter-relationship of atmospheric peroxyacetyl nitrate (PAN), peroxypropionyl nitrate (PPN), O-3, and NOy during the wintertime in Beijing, China, Sci. Total Environ., 718, 137388, https://doi.org/10.1016/j.scitotenv.2020.137388, 2020.
Zhang, H., Xu, X., Lin, W., and Wang, Y.: Wintertime peroxyacetyl nitrate (PAN) in the megacity Beijing: Role of photochemical and meteorological processes, J. Environ. Sci., 26, 83–96, https://doi.org/10.1016/s1001-0742(13)60384-8, 2014.
Zhang, H., Tong, S., Zhang, W., Xu, Y., Zhai, M., Guo, Y., Li, X., Wang, L., Tang, G., Liu, Z., Hu, B., Liu, C., Liu, P., Sun, X., Mu, Y., and Ge, M.: A comprehensive observation on the pollution characteristics of peroxyacetyl nitrate (PAN) in Beijing, China, Sci. Total Environ., 905, 166852, https://doi.org/10.1016/j.scitotenv.2023.166852, 2023.
Zhang, J. M., Wang, T., Ding, A. J., Zhou, X. H., Xue, L. K., Poon, C. N., Wu, W. S., Gao, J., Zuo, H. C., Chen, J. M., Zhang, X. C., and Fan, S. J.: Continuous measurement of peroxyacetyl nitrate (PAN) in suburban and remote areas of western China, Atmos. Environ., 43, 228–237, https://doi.org/10.1016/j.atmosenv.2008.09.070, 2009.
Zhu, W., Zhou, M., Cheng, Z., Yan, N., Huang, C., Qiao, L., Wang, H., Liu, Y., Lou, S., and Guo, S.: Seasonal variation of aerosol compositions in Shanghai, China: Insights from particle aerosol mass spectrometer observations, Sci. Total Environ., 771, 144948, https://doi.org/10.1016/j.scitotenv.2021.144948, 2021.