the Creative Commons Attribution 4.0 License.
the Creative Commons Attribution 4.0 License.
Measurement report: Rocket-borne measurements of large ions in the mesosphere and lower thermosphere – detection of meteor smoke particles
Heinfried Aufmhoff
Hans Schlager
Markus Rapp
Carsten Baumann
Frank Arnold
Boris Strelnikov
We present mass spectroscopic in situ data from rocket flights of two improved ion mass spectrometers in the mesosphere and lower thermosphere region. The instruments were optimized to detect large ions with a mass-to-charge ratio (, mass) of up to 2000 and 20 000 respectively, for analysis of meteor smoke particles. The flights were performed in the framework of the polar mesospheric winter echo (PMWE) campaigns, initiated and coordinated by the Leibniz Institute of Atmospheric Physics (IAP), to investigate polar mesospheric winter radar echoes in Andøya (Norway) in 2018 and 2021. Both flights were successful and allowed the mass number and chemical composition of charged meteor smoke particles to be investigated. We found a complex and diverse composition of positively and negatively charged molecules and particles within our mass range in a region that is notoriously difficult to get mass spectroscopic data from. While at altitudes below 85 km we observed negatively charged particles of up to several thousands of atomic mass units, above this altitude we found possible building blocks of these large particles that form right after their ablation from the parent meteorite material. In the first flight we detected no positively charged particles above 100 and a difficult-to-interpret signal for negatively charged particles beyond our mass range of 2000. In the second flight, however, we detected positively charged particles between around 180 and 350 and a number of different negatively charged particles up to 5500. Due to the very large mass range of 20 000 used in the second flight and the subsequent lower mass resolution, unambiguous mass identification is not possible. A particular interesting pattern was found at 80.8 km of a compound that seems to double its mass around 225, 450, 900 and 1800.
Comparing our findings to proposed meteor smoke particle compounds by other authors, our observations would be consistent with magnetite, fayalite and forsterite. However, other possible compounds cannot be excluded.
- Article
(3274 KB) - Full-text XML
- BibTeX
- EndNote
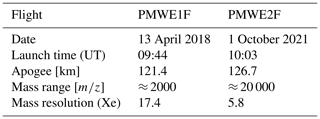
Meteor smoke particles (MSPs) range from molecule- to nanometer-sized particles that form due to ablation and re-condensing of meteoric matter upon entering the atmosphere (Rosinski and Snow, 1961). The high velocity of the impact causes the parent material to heat up such that partial or complete ablation takes place at around 90 km altitude, in the mesosphere–lower thermosphere (MLT) region. The gas-phase particles react with background atmospheric ions to form larger particles with a peak layer around 85 km (Hunten et al., 1980). Although earlier measurements indicate a composition similar to chrondrites (Zbinden et al., 1975), the actual composition of MSPs is subject to a number of studies (Antonsen et al., 2019; Hervig et al., 2017; Plane et al., 2014; Robertson et al., 2014; Obenberger et al., 2020) and is still an open subject (Plane et al., 2023), which requires challenging measurements in the MLT region. As MSPs grow in size, they act as an electron sink and influence the charge balance of the region significantly (Baumann et al., 2015) before they sediment down (Megner et al., 2008). In summer the sedimentation process is enhanced as the temperatures in the mesopause region are low enough to allow larger water ice particles to form, with the MSPs as nuclei. During the winter month, the mesopause region is too warm for the formation of water ice and thus allows pristine MSPs to be investigated at different stages of growth. The German Aerospace Center (DLR) has developed an improved ion mass spectrometer, jointly with the Max Planck Institute for Nuclear Physics (MPIK) and Ludwig-Maximilians-Universität München (LMU), which is based on an original design of MPIK with numerous deployments during rocket flights in the 1970s and 1980s (e.g., Schulte and Arnold, 1992). For the present purpose, two sounding rockets were equipped with this improved ion mass spectrometer, optimized for the detection of large ion clusters. The rockets were launched in the framework of two sounding rocket campaigns (PMWE1 and PMWE2) led by IAP Kühlungsborn in April 2018 and October 2021, with a total of four rockets. The campaigns aimed to study polar mesospheric winter echoes (PMWEs), which are very high frequency (VHF) radar echoes during the winter month at high latitudes (Latteck and Strelnikova, 2015). It was theorized that negatively charged MSPs may be involved in the creation of PMWE, and indeed, as a result of the first flight, Staszak et al. (2021) could show that MSPs enhance the radar echoes but that PMWEs are ultimately caused by turbulence. Here we present the results from those two rocket flights for both positive and negative ions and discuss our measurements with regard to the detection of charged meteor smoke particles. Both flights took place in Andøya (Norway), and an overview of the campaign and payloads is given in Strelnikov et al. (2021) and Staszak et al. (2021). In a previous paper (Stude et al., 2021) we introduced the instrument in detail, used during the first flight in 2018. In the present paper we will describe the technical improvements implemented for the rocket flight in 2021 (see Table 1). As in the previous paper we concentrated on selected mass spectra, we expand the discussion to the entire data sets of the rocket ascents of both flights in 2018 and 2021.
Our instruments were able to obtain mass spectra between altitudes of 55 to 121 and 127 km, respectively, during ascent and during descent, albeit then in the wake of the payload and thus with limited results. The instruments were calibrated to differently large mass ranges in order to analyze large ions ( > 100) and possible clusters of these, proposed by others (Schulte and Arnold, 1992; Gelinas et al., 1998; Lynch et al., 2005; Rapp et al., 2005, 2012; Strelnikov et al., 2012; Robertson et al., 2014; Havnes et al., 2015; Asmus et al., 2017; Chesworth and Hale, 1974).
In Stude et al. (2021) we showed selected ion mass spectra from 55.7, 69.2 and 106.3 km altitude for positive and negative ions from the PMWE1F flight. Our major findings were that we have detected large negative ions with a mass-to-charge ratio (, mass) of > 2000 but no large positive ions. The largest masses we detected belonged to the expected proton hydrates (charged water clusters, Johannessen et al., 1972) and the layer of iron ions.
We start this report with a description of the technical differences between the two instruments (ROMARA-1 and ROMARA-2) and their calibrations, followed by an overview of the data from both flights and a presentation of selected measurement details of interest. In the concluding section we discuss our measurements with regards to a possible detection of MSP compounds that have been proposed by Rapp et al. (2012), Plane et al. (2014) and Hervig et al. (2017).
The ROMARA (ROcket-borne MAss spectrometer for Research in the Atmosphere) instruments are cryogenically pumped, quadrupole mass spectrometers. These types of mass spectrometers filter ions according to their mass per charge (), in between four electrode rods, assembling a high-frequency, quadrupole electric field (Paul and Steinwedel, 1953). A subsequent channel electron multiplier then detects individual charged particles and produces small current pulses that are amplified and counted by the data processing unit. To produce a mass spectrum, the oscillator voltage at the quadrupole is gradually increased in mass channels, and the respective counts are stored. A more thorough description is given in Stude et al. (2021) for ROMARA-1 and the PMWE1F flight. ROMARA-2 (flight PMWE2F) required changes that affected the aerodynamic performance and led to further small modifications. In Fig. 1 both instruments are shown side by side to illustrate these differences.
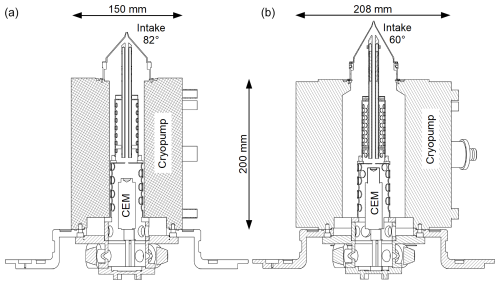
Figure 1Technical drawings of the mass spectrometer ROMARA-1 (a) and ROMARA-2 (b) in their flight configuration.
ROMARA-1 used a cryopump of 150 mm diameter to accommodate enough cryogen for the required time to wait on the launch pad for the desired atmospheric conditions. During refurbishment for ROMARA-2, we noticed a leak in the cryogenic system, and attempts of repair did not meet the tight requirements of the vacuum system's leakage rate. We therefore used an alternative pump with 208 mm diameter from our shelves. This required adjustments in instrument geometry to avoid deterioration of the aerodynamic performance around the intake cone. Therefore, we improved the intake cone to a more pointier design with an opening angle of 60° instead of 82° as with ROMARA-1 to regain comparable aerodynamic performance and assure an undisturbed sampling of the atmosphere. Following the smaller opening angle of the intake cone, the quadrupole lens was lengthened by 13.3 mm to maintain same distance to the intake orifice. We further moved the channel electron multiplier up to increase detection efficiency.
2.1 Electronics
The electronics section of ROMARA-2 was modified as well with two major improvements: the control of the quadrupole oscillator and the amplifier to detect the channel electron multiplier pulses. For ROMARA-1 we used A111F from AMPTEK® as a charge amplifier, mainly for its sufficient performance and small form factor, but we realized that under certain conditions the count rate might exceed the limits of the A111F, and thus we upgraded to the A121 from the same company. The A121 charge amplifier allows a higher count rate of up to 12 MHz and thus has a smaller minimum dead time of 80 ns (350 ns for A111F). For ROMARA the count rate is corrected for the amplifier dead time by
with Rt as the true count rate, Rm as the measured count rate and τ as the dead time. The second improvement concerned the control of the quadrupole oscillator as we wanted more flexibility for ROMARA-2. The high-voltage radio frequency (RF) oscillator amplitude VRF is controlled by a single analog voltage Vc, such that VRF=GVc, with G being on the order of 250. As VRF is linearly proportional to mass, so is Vc:
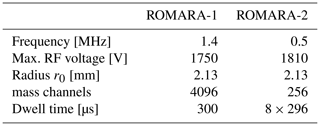
with e as the elementary charge, r0 as the radius of the imaginary circle between the rods of a quadrupole and f as the frequency of VRF. As the mass resolution is roughly constant over the mass range, mass peaks or mass steps in the mass spectrum have an increasing width with higher mass settings. For a mass channel scanning with a constant step width, this means more and more mass channels are used on a peak or step at higher masses. This was the case for ROMARA-1, where a sawtooth wave of 4096 voltage steps concluded in 4096 linear mass steps of roughly 0.5 u width. In the extreme case of 2000 a hypothetical mass step at a mass resolution of 17.4 is about 115 u wide, spending about 230 mass channels on it, while for 30 only four mass channels are used. This wastes precious measuring time on a sounding rocket flight. To achieve the same number of mass channels per step over the full mass range, a logarithmic control is required, especially for an instrument with even lower mass resolution such as ROMARA-2. For the given mass resolution of about 6 and a mass range of about 20 000, a total number of 64 logarithmic mass channels would cover the whole mass range. With the given dwell time of 300 µs, a single mass spectrum could thus be run in a fraction of the time; however the high-voltage oscillator needs a certain time to settle the higher value, and thus we decided on a conservative approach, leading to 256 mass channels for each spectrum with 8 × 296 µs dwell time, effectively cutting the acquisition time in half. Thereby we could keep the same data structure of the underlying data acquisition system and run two spectra in the given 4096 mass channels. Logarithmic mass steps thus allow the time needed for a complete mass spectrum to be minimized without loss of information if the mass resolution allows it.
2.2 Calibration of ROMARA-2
As we observed a substantial negative ion population with masses above 2000 (r≈ 0.7 nm) during the ROMARA-1 flight, we decided to increase the mass range for ROMARA-2 to about 20000 (r≈ 2 nm; Stude et al., 2021) by decreasing the oscillator frequency from 1.4 to 0.5 MHz (see Table 2). This has the drawback of a reduced sensitivity and resolution, with initial tests in the lab showing about a factor of 2 less sensitivity for krypton ions used for calibration. The mass resolution was reduced to about 6 for krypton and xenon ions, compared to 17.5 for ROMARA-1. Both instruments are operated in the RF-only mode for quadrupole mass spectrometers, providing the highest sensitivity. The RF-only mode produces spectra sometimes described as being in the integral or high pass mode. In this mode, ideally all ions pass the mass filter at the beginning of a spectrum and are gradually filtered out with the increasing oscillator voltage. The mass scan thus produces mass spectra with negative steps where the count rate drops, until all ions are filtered out, or the maximum voltage of the oscillator is reached.
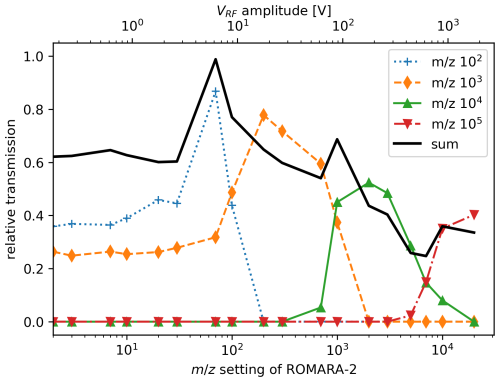
In practice, this behavior is not strictly an integral or cumulative spectrum but rather large mass windows that are moved through the spectrum, and for a reduced oscillator frequency, this behavior is unfortunately amplified. At low mass settings, large ions do not respond well to the oscillator voltage and thus are not guided well through the quadrupole filter. As the oscillator voltage increases, the ions are guided more efficiently as they respond better to the now sufficiently large fields and form a peak before they get filtered out (see Figs. 2 and 3).
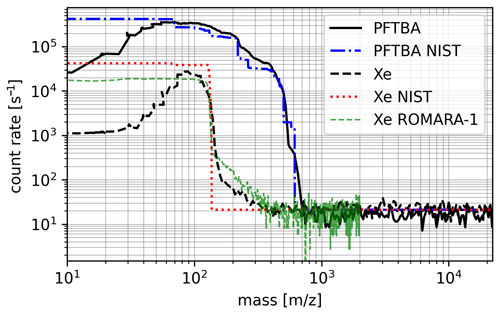
Figure 2Mass spectra of ROMARA-2, for xenon and PFTBA, the corresponding spectra from the National Institute of Standards and Technology (NIST) and a ROMARA-1 calibration for comparison.
In Fig. 2 we show the response of ROMARA-2 for xenon and PFTBA (perfluorotributylamine or FC-43) ions, together with the NIST standard and a comparison to equivalent ROMARA-1 data. It is visible how some xenon ions pass at lower masses but form the aforementioned peak around 80 before being filtered out at their respective mass per charge. The effect is similar on ROMARA-1 but to a much lesser extent. The xenon response for ROMARA-2 has a mass resolution at a 50 % full width at half maximum (FWHM) of 5.8, while for PFTBA the mass resolution is between 4 and 8, depending on measuring mode and step size. In Table 3 the fits to the major steps of ROMARA-1 and ROMARA-2 calibration are given for comparison.
For higher masses, we simulated the general behavior of how ions generate a peak in the RF-only mode of ROMARA-2 using SIMION®, and one can see how these “mass windows” move through the mass range. Ions were simulated with an angle of attack of 5° and a cone distribution inside the intake orifice. The cone angle is determined as the vector from payload speed (1000 m s−1) and thermal speed; i.e., large ions have a smaller cone angle. Each falling edge means ions are filtered out, while rising edges mean the mass filter becomes transparent for the respective ions, and it is thus possible that edges might disappear as they cancel each other out, as shown in Fig. 3.
A further finding of the ROMARA-1 flight was a saturating effect of the count rate that was not well understood, possibly connected to very large ions, resulting in a dramatic dead-time increase of the channel electron multiplier. To mitigate a possible saturation we decided to include a mode called Mode B in the sequence of mass scans with a lower sensitivity by decreasing the bias potential of the quadrupole rods. ROMARA-1 had a bias of 20.5 and 50 V at the quadrupole lens and rods, which we call Mode A and was used in ROMARA-2 for keeping a comparable mode that is used on both instruments. In Mode B the bias potentials were reduced to 5 and 12.5 V; see Table 4.
To prove the concept of Mode B and the general sensitivity of ROMARA-2 to large ions, we tested the mass spectrometer in the laboratory with an electrospray ionization (ESI) source before integration of the instrument into the cryopump and the rocket payload. The ESI source was adapted to our laboratory setup from an “LCQ classic” ion trap (Thermo Finnigan). In this setup only the quadrupole/detector assembly and the electronics of ROMARA-2 could be used. Figure 4 shows mass spectra of a tuning liquid (Agilent Part Number: G1969-85000) of Mode A and B for negative ions. The ESI-L mass spectrum data from Agilent (2023) given in their respective data sheet (Fig. 4) are limited to 3200 and thus do not fully cover our mass range. For a confirmation of the ROMARA-2 mass spectra, i.e., the large tail above 3000, a laboratory mass spectrometer with sufficient mass range would be required to interface in the same way to our setup which we did not have. The maximum major ion masses correlate quite well with the Mode B spectrum where the count rate declines at about 3000 similarly to the data sheet, although distinctive identification is not possible. Thus the results are only of qualitative nature but prove that ROMARA-2 is sensitive to ions of several thousand masses per charge and that Mode B provides some form of attenuation, even if it is not constant over the whole mass range.
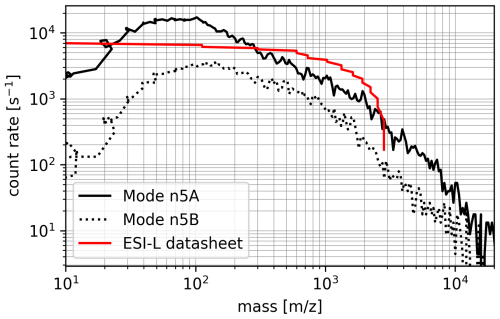
Figure 4Negative ion mass spectra of the ROMARA-2 quadrupole with an electrospray ionization source (Thermo Finnigan), using ESI-L Low Concentration Tuning Mix from Agilent.
2.2.1 Measuring modes and sequence
ROMARA-1 measured positive and negative ions in alternating order with the intake cone at payload potential and a spectrum time of 1.2 s. This seemed to have provided just enough altitude resolution for the major layers in the atmosphere during the corresponding flight. However, the unbiased intake cone was a considerable risk as, e.g., a negative payload potential prevents negative ions from entering the intake cone if their relative energy is below the payload potential.
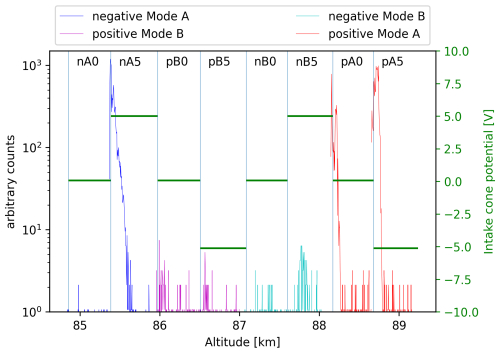
For ROMARA-2 we implemented eight different measuring modes: a positive and negative (p,n) mode, an intake cone potential of 0 (payload potential) or ±5 V (0,5), and Mode A and B (A,B). Thus, notation such as “p5B” means positive ions at −5 V intake cone potential in Mode B (Table 4). This notation will be used throughout the paper. As the payload charges up during flight, a bias voltage on the intake cone helps ions to overcome the payload potential. Although eight measuring modes seem to severely decrease the altitude resolution, we considered it necessary, as it might help to improve the understanding of ROMARA-1 data. As an illustration, we show the measuring sequence at around 87 km altitude of ROMARA-2 in Fig. 5. The different modes are lined up as follows: n0A, n5A, p0B, p5B, n0B, n5B, p0A and p5A. The example also shows the effect of the payload potential as the payload apparently charges up negatively and thus prevents negative ions from being detected during “n0A” and “n0B” mode. With a spectrum time of around 600 µs and a payload speed of 1000 m s−1 (73 km), an altitude resolution of around 600 m is achieved repeating every 4.8 km.
3.1 Rocket launches
ROMARA-1 was launched on 13 April 09:44:00 UTC into the tail of a polar mesospheric winter echo tracked on sight by the local radar (MAARSY) between 78 and 80 km altitude. While passing the natural echo, the payload of PMWE1F created an additional artificial echo as reported in Latteck et al. (2019). The same artificial echo was reported for PMWE1D for 18 April 2018. The launch of ROMARA-2 on PMWE2F took place on 1 October 2021 at 10:03:00 UTC into a relatively large and prolonged echo between 65 and 70 km; this time no artificial echoes were detected. The second payload PMWE2D was launched 3 min later. The launches and measurements of all instruments on both payloads were flawless and produced expected data. However due to a parachute failure on PMWE2D, only the PMWE2F payload could be recovered from the Norwegian Sea.
3.2 Positive ions ROMARA-1
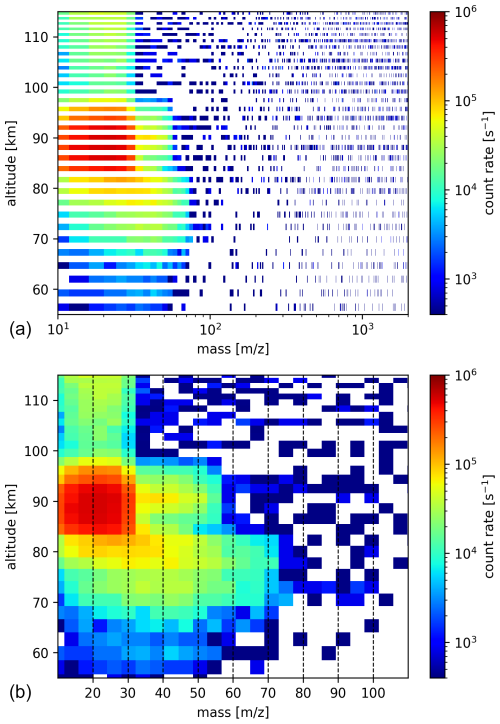
The measurements of ROMARA-1 have been partly described in Stude et al. (2021) for three selected cases at 55.7, 69.2 and 106.3 km and are here covered as a whole data set for the ascent (Fig. 6). The positive ion measurements show a somewhat expected result of light ions (< 100) with three key features: proton hydrates (charged water clusters) up to 82 km with orders of 3 and 4 water ligands [55 u/73 u] and an ionized iron layer [56 u] and NO+[30 u], or O[32 u] above that. Minor steps in the spectra between 40 and 50 can be attributed to NO+(H2O)[48 u] for the altitudes of proton hydrates and MgO(H)+ [40/41 u] at around 90 km. Some counts at our threshold limit indicate ions up to around 100, but in general no heavier positive ions could be detected. Figure 6 shows these color-coded, RF-only mass spectra between 55 and 115 km altitude during ascent of ROMARA-1. The upper panel shows the full mass range up to 2000 with omitted negative measurements, while the lower panel is restricted to 110 and the omitted negative measurement slots are filled with positive measurement data to improve visibility.
3.3 Positive ions ROMARA-2
The positive ion measurements of ROMARA-2 did show expected light ions of below 100 and, oppositely to ROMARA-1, some unexpected signals above 100, notably around 97 km, with masses up to about 400. In the upper panel of Fig. 7 we plot all positive measurements at their respective altitude at the full mass range with the negative measurements blanked out. In the lower panel we restrict the mass range to 400 and filled the omitted negative measurement slots with the closest positive data to provide a better visibility, similar to Fig. 6. Further measurements of Mode A at 0 V cone bias are marked in the plot as horizontal lines to indicate the sequence of the four different measurement modes (pA0, pA5, pB0, pB5) for each charge state.
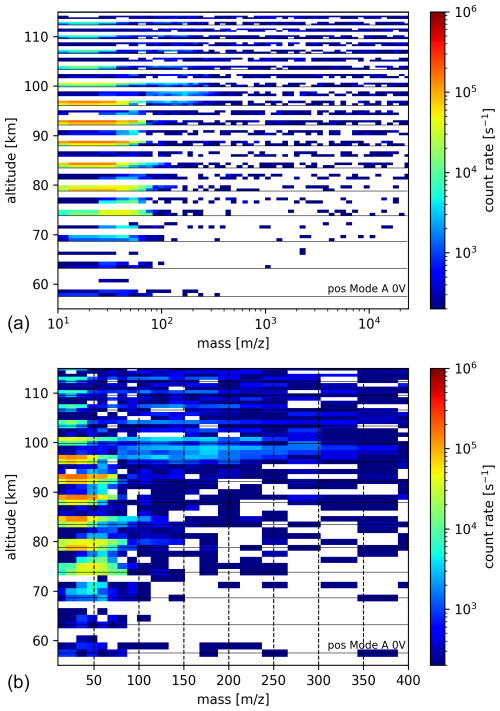
Figure 7Positive ion spectra (32ch. mean) during ascent of PMWE2F (ROMARA-2). Upper panel with full mass range and logarithmic mass scale and lower panel with linear mass scale, reduced mass range and filled negative slots for better visibility. The horizontal lines mark the pA0 measurement to indicate the measurement sequence (pA0, pA5, pB0, pB5).
The expected strong NO+/O peak was less dominant compared to ROMARA-1 but is still visible despite the much larger mass range and the resulting difficulties in calibration at very low masses. A similar pattern to that with ROMARA-1 exists in the general mass distribution. Below about 88 km the ions are heavier as proton hydrates are present. The spectrum then becomes slightly lighter for the dominating Fe+[56 u], and above about 100 km the step of NO+[30 u] or O[32 u] dominates. However for ROMARA-2 the proton hydrates seem to be much heavier up to about 150 at 80 km, indicating orders of 8 or 9 water ligands as reported by Björn and Arnold (1981). The striking feature, albeit with low count rates, are the large positive ions around 97 km just above the iron peak with masses between 180 and 350. As proton hydrates at those altitudes do not form (Reid, 1977), we assume that we have detected positively charged MSPs.
3.4 Negative ions ROMARA-1
The measurements of negative ions from ROMARA-1 (Fig. 8) show a completely different picture compared to the positive ions, as either our instrument was too sensitive in the negative channel or the atmosphere contained a large number of negative ions heavier than 2000, which obscured our measurements. First, the moment of the cap ejection is clearly visible as large negative ions immediately enter into the instrument, as shown in the first spectrum at the bottom of Fig. 8. For the next 20 km of ascent, the signal of large ions is generally rising, modulated by the payload spin, and then it starts to saturate from about 75 km, up to about 100 km. The payload spin period is 0.27 s, corresponding to a mass range of 460 (≈920 mass channels; see Table 2) in the plots. The signal then disappears and appears with the last occurrence at 114 km. Lighter ions ( < 150) are visible at around 70 and 95 km but due to our limited mass resolution can not be resolved or are masked as the negative channels are in general more noisy because of a higher dark count rate compared to the positive spectra. A similar analysis to that for the positive mass spectra could therefore not be done. For the available spectra, no distinctive steps are produced; rather there is a slope due to the limited mass resolution, which indicates that more different ion types are involved than in the positive case. Another feature is the absence of counts in the beginning of a spectrum between 75 and 90 km to varying masses, forming a kind of zero signal in the plot of Fig. 8, which is peaking at 850 and 85 km. This behavior could be caused by a paralyzed detector (Wüest et al., 2007), overwhelmed with particles of masses below the reappearance of counts, e.g., below 850 at 85 km. Thus, we do not have continuous data for negative ions below 150. Furthermore, the large negative ions exceeding our mass range seem to saturate the detector at a rather low count rate for the system and thus only give a very rough maximum at about the same altitude where the detector is paralyzed the most. The low saturating count rate could be caused by an increased dead time due to large ions as reported by Vanhaecke et al. (1998) and Gemer et al. (2020).
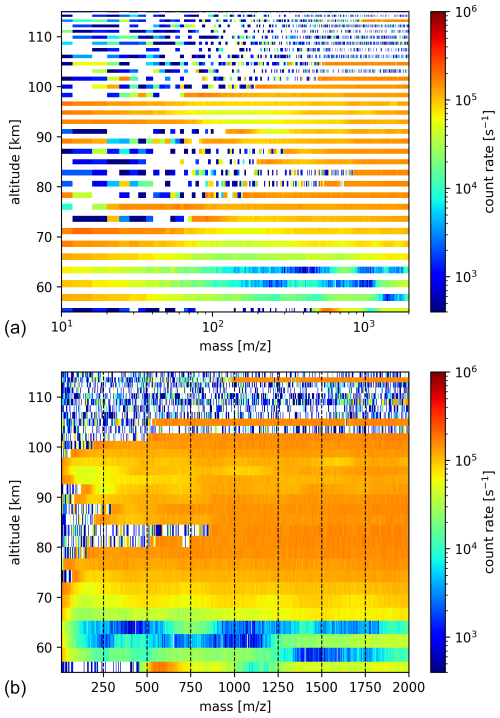
Figure 8Negative ion spectra, during ascent of PMWE1F (ROMARA-1): (a) with logarithmic mass scale and (b) with linear mass scale; the positive measurement slots are filled with negative ion data for better visibility. Both plots have the full mass range.
The exact behavior of an individual ion detector with high numbers of different incident particles can be very complex as other parameters, such as the pulse height distribution of the detector, aging, or the threshold and dead time of the amplifier or electronics, can play a role.
3.5 Negative ions ROMARA-2
The negative ion measurements of ROMARA-2 show a large variety of ion masses and most importantly confirm the existence of ions heavier than 2000, as proposed before (Fig. 9). Saturating effects as with ROMARA-1 are not existent; rather the opposite is the case, which results in very low count rates of the lower-sensitivity Mode B. The measurements can be broadly divided into those below and those above 85 km. Below 85 km the mass spectra in general include large ions and show few to no ions below 100, which is unexpected when compared to ROMARA-1. The majority of detected ions are between 200 and 1000, at about 80 km up to 5000, albeit with rather low count rates. Above 85 km the large ions disappear, and lighter ions are detected even in the lowest mass channels. Further, the unbiased mode with the intake cone at payload potential does not show counts anymore, either because of the lower masses and their lower energy or because of an increased payload potential, more effectively shielding the negative ions. Above 100 km the count rates further decline due to the aerodynamic shielding effect.
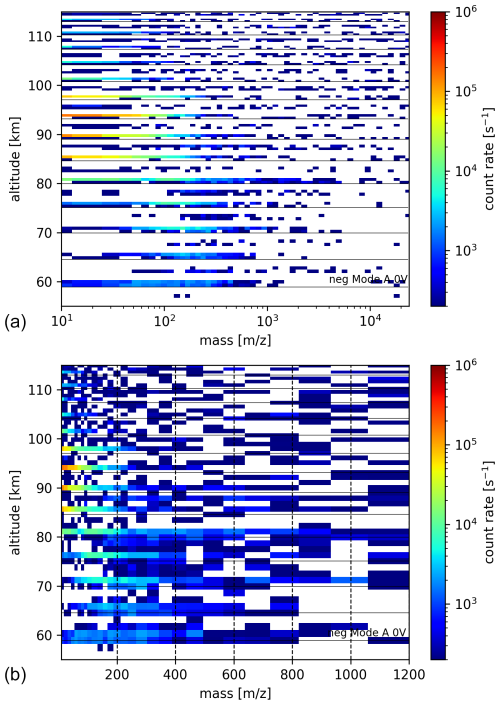
Figure 9Negative ion spectra, during ascent of PMWE2F (ROMARA-2): (a) with logarithmic mass scale and full mass range and 32ch. binning. The horizontal lines mark the nA0 measurement to indicate the measurement sequence (nA0, nA5, nB0, nB5). Positive ion measurements are omitted. Panel (b) has a linear mass scale, and the positive measurement slots are filled with negative ion data for better visibility.
3.6 Background counts
In the presented mass spectra, background counts are visible as incoherent counts, most obviously in the high mass channels where the count rates are low or close to zero. The one-count limit in the given binning of 8 or 32 channels (hereafter denoted as “8ch.” and “32ch.”) is around 400 and 100, as indicated by the lowest number of the color scale in Figs. 6, 8, 7 and 9. Background counts are usually composed of dark noise in the multiplier, penetrating radiation and UV photons. In our data, we see the noise is increasing with altitude (e.g., upper panel of Fig. 7 and Fig. C1). Dark noise should be constant and is usually in the range of some counts per minute due to radioactive decay in the glass that it is made of and is therefore irrelevant for our measurements. As the detector is deeply buried in the structure of the instrument and the payload, summing to a shielding of several millimeters of steel, copper and aluminum, only cosmic rays could penetrate to the multiplier. This form of background noise is also in the range of only a few counts per minute, and we thus assume that scattered UV photons are the most likely cause of the background counts.
The goal of the two flights was to detect and possibly identify the chemical nature of meteor smoke particles. The data of the ROMARA-1 flight did not show a significant signal for positive MSPs but suggested a large population of large negative particles of > 2000, albeit maybe being too sensitive and thus resulting in difficulties to interpret the negative spectra. ROMARA-2 showed, with high confidence, MSPs of both charge states. In order to identify possible meteor smoke compounds in our measurements, we summarized the compounds proposed by Plane et al. (2014) and Hervig et al. (2017) in Table 5 and show their atomic mass up to multiples of 3 (trimer). One can see in Table 5 that, e.g., MgO has such a small mass (40 u) that its multiples would fit almost any step in the higher mass ranges with the given mass resolution of ROMARA, and this thus makes unambiguous identification unfeasible.
Table 5Compounds as possible building blocks of MSPs by Plane et al. (2014) and Hervig et al. (2017).
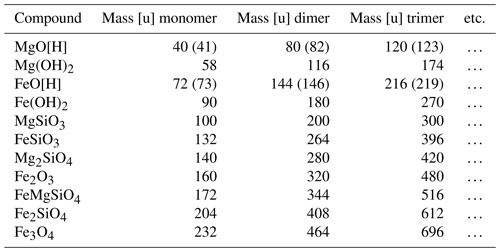
For the discussion on the possible chemical composition of MSPs, we focus on the most interesting altitudes from the individual ion spectra overview plots by averaging the mass spectra over selected altitudes. In the case of positive ions of both flights, these are altitudes above the proton hydrates' regime around 85 km, which can be seen in the respective data. The negative ion data of the ROMARA-2 flight are examined in the same altitude range, but we also analyze lower altitudes including some interesting mass spectra.
4.1 Discussion positive ions ROMARA-1
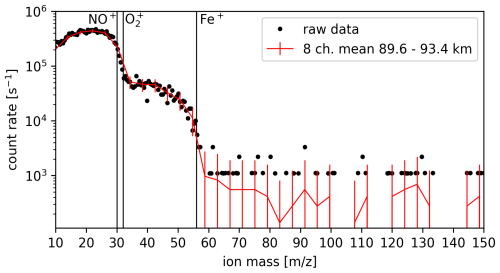
The most interesting altitudes for MSPs in the ROMARA-1 data are the altitudes between the iron peak at 89.6, 91.5 and 93.4 km (Fig. 6). The mean spectrum from these three altitudes is plotted in Fig. 10 up to 120. One can see the aforementioned NO+/ and Fe+ peak (Reid, 1977; Shuman et al., 2015; Plane et al., 2015; Kopp et al., 1984). In between these peaks, potential signatures of NO+H2O are visible. Very few counts between 70 and 100 could indicate NO+CO2[74 u], FeO[H][72 u/73 u] or Fe(OH)2[90 u] as modeled by Reid (1977) but no traces of heavier ions. The picture retrieved by the instrument for positive ions thus represents a rather expected ion population, with no large positive ions or MSPs above our sensitivity level.
4.2 Discussion positive ions ROMARA-2
Despite ROMARA-2 being able to measure down to 20–30, the data below about 150 suffer from a larger mass number uncertainty due to the large mass range setting. The results for masses below about 150 are therefore slightly shifted towards higher values as we did not aim for those masses but still wanted to see if ions are present, e.g., NO+ and Fe+.
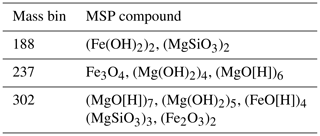
In Fig. 7 a very interesting feature between 96.3 and 100.4 km can be seen, which is likely MSPs. We plot the mean of all six positive mass spectra between 96.3–100.4 km altitude up to 1000 in Fig. 11. Besides the raw eight-channel data, we plot a binned set of 32 mass channels, which roughly correlates to the mass resolution and provides smoother data and is the basis of a differential spectrum. The differential spectrum is derived by subtracting subsequent channels , and in the case of a positive slope, the data are omitted. The bins with the highest count rates above 150 are centered around 188, 237 and 302.
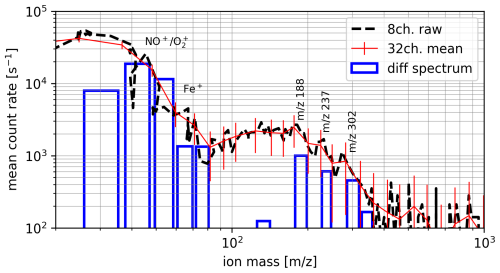
Figure 11Mean mass spectra of all positive ion measurements of PMWE2F (ROMARA-2) between 96.3–100.4 km up to 1000. Note the slightly drifted peaks for NO+ and Fe+. The differential bins above 150 are marked with their center mass per charge.
From Table 5 we looked at possible matches to the most probable bins we measured and show these matches in Table 6. For the mass bin 188 we found (Fe(OH)2)2[180 u] or (MgSiO3)2[200 u], where the iron hydroxide seems to fit best as the count rate drops clearly before 200. In general one might argue that compounds of lower indexes < 3, are probably more likely to exist, and thus, e.g., in the case of 237, Fe3O4 might be a stronger candidate than (MgO[H])6. But whether (Fe2O3)2 is more likely as (MgSiO3)3, we cannot say, except that in the same spectra plenty of iron ions are available, and thus the corresponding compounds might prevail.
4.3 Discussion negative ions ROMARA-2
As mentioned before the negative ion measurements show basically two different regions, above and below 85 km. To begin with, we compare the negative ion measurements with the positive ion layer around 97 km, by taking the average of counts between 89.7 and 97.7 km in the same way as for the positive ion case. At these altitudes only the biased mode, Mode A (n5A), produced significant count rates of similar masses to the positive ions. The mean negative ion spectrum from 89.7, 93.9 and 97.7 km altitude is plotted in Fig. 12, showing many more peaks compared to the positive ion spectra, which makes identification more difficult. For a spectrum of low mass resolution with many different steps, the spectrum turns into a slope, and individual steps overlap.
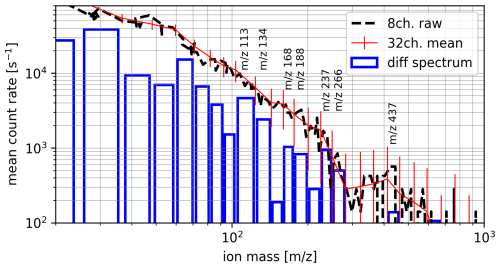
Figure 12Mean mass spectra of negative ion measurements of mode n5A at 89.7, 93.9 and 97.7 km up to 1000 from PMWE2F (ROMARA-2). The bins of interest are marked with their center mass per charge.
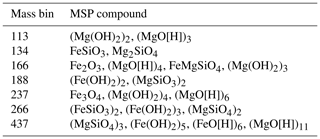
Nevertheless, possible compounds are given in Table 7. We cannot distinguish between the possible compounds of each bin, and others might rule out certain compounds. An interesting observation is the compounds Mg2SiO4 and Fe(OH)2, occurring more often as possible matches, with Mg2SiO4 showing the smallest index number (trimer). The opposite is the case for FeO[H], which is only once a possible match, although it has a high probability according to Hervig et al. (2017). Thus we find that Mg2SiO4 (forsterite) is the most likely negative MSP compound for our measurements.
In Fig. 13 we present three interesting spectra: Fig. 13a shows a pattern of multiplying masses at 80.8 km, Fig. 13b shows the heaviest detected mass at 80.2 km and Fig. 13c corresponds to the altitude of the radar echo at 65.6 km, as this echo was a launch condition. The pattern in Fig. 13a shows distinctive steps at roughly 225, 450, 900 and 1800, which could indicate a compound that is doubling its mass. This pattern is not correlated to the payload spin, as the time between these mass channels is roughly 100 ms, and the payload spins at 3.6 Hz (277 ms). Further, we do not expect proton hydrates above > 400, as proton hydrates seem to have a maximum of about 20 ligands (361 u) (Björn and Arnold, 1981). If we ignore the smaller hydroxides and oxides, we arrive at two possible compounds as plotted in Fig. 13a with vertical lines, Fe3O4 and Fe2SiO4, as monomer, dimer and tetramer, possibly even as octomer. Thus we might have detected magnetite (iron oxide) or fayalite cluster MSPs. This aligns well with the measurements and results of Hervig et al. (2017): “The most likely MSP compositions are magnetite (Fe3O4), wüstite (FeO), and iron-rich olivine (Fayalite, Fe2SiO4)”.
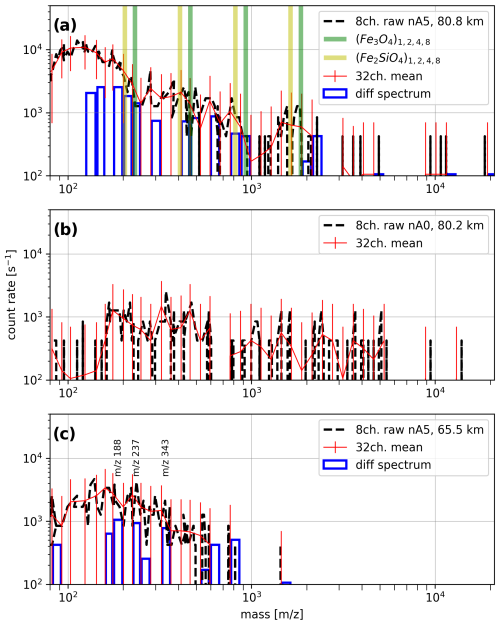
Figure 13Spectra of negative ions from ROMARA-2 for the region of present PMWE (c) and of the heaviest mass signals (a, b) (PMWE2F).
Figure 13b shows the heaviest recorded signals reaching up to 5500. As the count rate is low, we refrain from assigning possible compounds, but it seems that the signal between about 1000 and 5500 besides being noisy does not show a typical tail, thus indicating a single compound at about 5000 is producing the counts. This partly confirms the measurements of ROMARA-1 and the possibility of ions with masses above 2000, although it does not explain the general observation during the flight of ROMARA-1 with a layer of large negative ions, spanning about 65 to 100 km.
In Fig. 13c we show the spectrum at 65.5 km, where the PMWE echo was detected. In the same way as before we found significant steps at the mass bins, 188, 237 and 343, though the compounds at these lower altitudes could be different from above 85 km and, thus, for the first bin, (Fe(OH)2)2 or (MgSiO3)2l; for the second bin, Fe3O4, (Mg(OH)2)4 or (MgO[H])6; and for the third bin, (MgO[H])8, (Mg(OH)2)6, (FeO[H])5 and (Fe(OH)2)4 or (FeMgSiO4)2. The maximum mass in this case is 500 to 600. Thus the composition at this altitude does not differ significantly from other spectra, just below or above. An interesting RF-only spectrum for negative ions is given in Schulte and Arnold (1992) using a similar instrument at 77.6 km (Kiruna, 3 August 1982, nighttime) with mass steps around 160, 250 and 330 u, indicating similar ions to those observed with ROMARA-2.
The picture we received from our two flights is ambiguous. Concerning positive ions during the ROMARA-1 flight we measured a somewhat expected population of proton hydrates and NO+/O, although some signs of other metal ions are missing, e.g., Mg+ (Plane and Whalley, 2012) or Si+ (Plane et al., 2016), but no ions above about 100. The ROMARA-2 data essentially show the same picture but have an additional positive ion population between 180 and 350 included at unexpected high altitudes between 96.3–100.4 km. This unexpected layer shows a number of possible compounds, indicating a diverse chemical composition, most likely revolving around iron as the most abundant metal ion.
Concerning the negative ion measurements we did not receive a clear picture from the ROMARA-1 data as our measurement was saturated with ions of > 2000. ROMARA-2 data could confirm that particles of such mass-per-charge ratio exist, but the mass range was not well suited for masses below 150. The limited mass resolution of the ROMARA-2 measurements due to the selected large mass range further restricted our analysis. However, our observations seem to be in line with the measurements of Hervig et al. (2017), further backing up his proposed “magnetite, wüstite, and iron-rich olivine”. Rapp et al. (2012) proposed metal hydroxides, e.g., MgOH and FeOH, in favor of silicates, which we could neither confirm nor reject for the reasons mentioned above. The overall picture from our measurements of possible compounds in MSP shows a wide array of possibilities, and it seems clear that there is no single MSP compound apart from a likely iron dominated chemical composition, as proposed by others in the MLT region. Unambiguous identification would require a next-generation rocket-borne mass spectrometer with a mass resolution capable of distinguishing, e.g., (FeO)4[288 u] from (FeOH)4[292 u].
The intake cone current is measured with high resolution as an absolute value during the flight and is the net sum of all charge carriers interacting on it. As the cone of ROMARA-1 was on payload potential (0 V), only one curve is obtained, while ROMARA-2 had three different potentials (0, +5 (neg) and −5 V (pos)), as shown in Fig. A1.
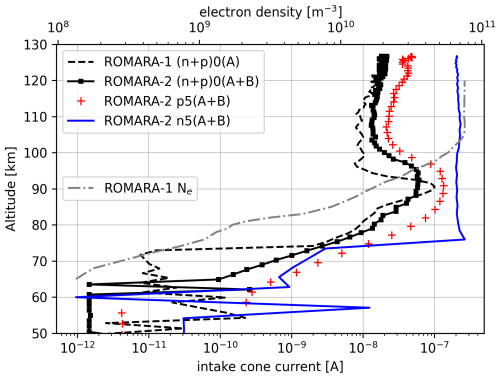
Figure A1Intake cone current mean values over the whole spectrum for ROMARA-1 and ROMARA-2. The electron density Ne from ROMARA-1 is added with data from Staszak et al. (2021).
An object in a plasma charges to a certain potential, such as a payload in the MLT region. Mass spectra allow the payload potential to be estimated if enough ions of the right mass are present; i.e., if an ion mass is present in the 5 V mode but absent in the 0 V mode, then the payload potential (Vp) must be larger than
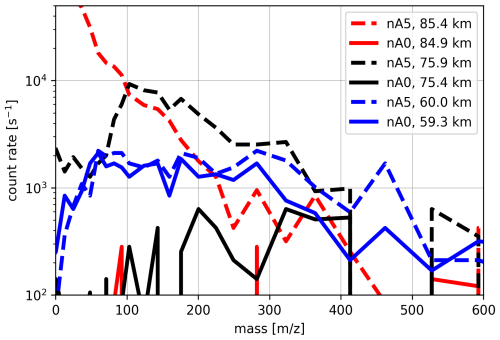
with m as the ion mass and v as the payload speed. The same must be true if in both modes an ion mass is present, and thus the payload potential must be smaller than . At 60 km in Fig. B1 the difference in count rate between 0 and 5 V at the intake is minimal; thus a payload potential for detected ions around 100 does not have an influence and gives a maximum payload potential of around −0.65 V as 100 u (lighter ions are a bit uncertain) ions would overcome the energy barrier given the payload potential. At 76 km, ions of 220 or 320 enter the instrument at comparable count rates for 0 and 5 V, indicating a payload potential of around −1.1 to −1.6 V. At 85 km ions of about 450 are present in the 5 V mode but not in the 0 V mode, thus indicating a payload potential of at least −1.8 V. Thus the payload is charging up increasingly negatively to about −2 V as usually anticipated and previously measured by, e.g., Bekkeng et al. (2013).
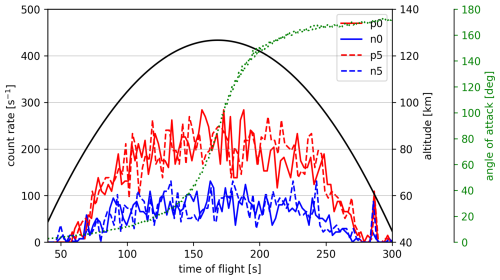
To illustrate the background counts we show in Fig. C1 the mean count rate of masses above 6000 for positive and negative channels, not separated by Mode A and B but with different intake cone potentials. The symmetry between ascent and descent is a strong indicator that these counts are not caused by particles as the instrument is in the wake during descent as indicated by the angle of attack. The similarity between the different intake cone potentials also indicates no particle involvement. Furthermore, the count rate correlates with increasing altitude and thus UV light intensity.
ROMARA-1 data are available at https://doi.org/10.5281/zenodo.11470114 (Stude et al., 2020). ROMARA-2 data are available at https://doi.org/10.5281/zenodo.11469720 (Stude et al., 2024). The data files should be self-explanatory.
JS prepared the instrument (CoPI), analyzed the data and drafted the manuscript. HA prepared the instrument. HS was responsible for supervision. MR was responsible for supervision and instrument PI. FA was responsible for supervision. BS was responsible for PMWE project PI. CB was responsible for ion compositions and payload charging. All authors actively contributed to the discussions and to the writing of the final version of the paper.
The contact author has declared that none of the authors has any competing interests.
Publisher’s note: Copernicus Publications remains neutral with regard to jurisdictional claims made in the text, published maps, institutional affiliations, or any other geographical representation in this paper. While Copernicus Publications makes every effort to include appropriate place names, the final responsibility lies with the authors.
We would like to thank the mobile rocket base (MORABA) and Andøya Space Center (ASC) for their intense and kind support as well as Robert Lindemann and Matthias Lang for their excellent technical work.
This research has been supported by the Bundesministerium für Wirtschaft und Klimaschutz (DLR grant no. 50OE1402, project PMWE).
The article processing charges for this open-access publication were covered by the German Aerospace Center (DLR).
This paper was edited by John Plane and reviewed by three anonymous referees.
Agilent: Certificate of Analysis ESI-L Low Concentration Tuning Mix 100ml Agilent Part Number: G1969-85000 Sample Lot Number: LB86189, https://www.agilent.com/cs/library/certificateofanalysis/G1969-85000cofa872022-U-LB86189.pdf, last access: 15 February 2023. a
Antonsen, T., Havnes, O., and Spicher, A.: Multi-scale measurements of mesospheric aerosols and electrons during the MAXIDUSTY campaign, Atmos. Meas. Tech., 12, 2139–2153, https://doi.org/10.5194/amt-12-2139-2019, 2019. a
Asmus, H., Staszak, T., Strelnikov, B., Lübken, F.-J., Friedrich, M., and Rapp, M.: Estimate of size distribution of charged MSPs measured in situ in winter during the WADIS-2 sounding rocket campaign, Ann. Geophys., 35, 979–998, https://doi.org/10.5194/angeo-35-979-2017, 2017. a
Baumann, C., Rapp, M., Anttila, M., Kero, A., and Verronen, P. T.: Effects of meteoric smoke particles on the D region ion chemistry, J. Geophys. Res.-Space, 120, 10823–10839, https://doi.org/10.1002/2015JA021927, 2015. a
Bekkeng, T. A., Barjatya, A., Hoppe, U.-P., Pedersen, A., Moen, J. I., Friedrich, M., and Rapp, M.: Payload charging events in the mesosphere and their impact on Langmuir type electric probes, Ann. Geophys., 31, 187–196, https://doi.org/10.5194/angeo-31-187-2013, 2013. a
Björn, L. G. and Arnold, F.: Mass spectrometric detection of precondensation nuclei at the Artic summer mesopause, Geophys. Res. Lett., 8, 1167–1170, https://doi.org/10.1029/GL008i011p01167, 1981. a, b
Chesworth, E. T. and Hale, L. C.: Ice particulates in the mesosphere, Geophys. Res. Lett., 1, 347–350, https://doi.org/10.1029/GL001i008p00347, 1974. a
Gelinas, L. J., Lynch, K. A., Kelley, M. C., Collins, S., Baker, S., Zhou, Q., and Friedman, J. S.: First observation of meteoritic charged dust in the tropical mesosphere, Geophys. Res. Lett., 25, 4047–4050, https://doi.org/10.1029/1998GL900089, 1998. a
Gemer, A., Sternovsky, Z., James, D., and Horanyi, M.: The effect of high-velocity dust particle impacts on microchannel plate (MCP) detectors, Planet. Space Sci., 183, 104628, https://doi.org/10.1016/j.pss.2018.12.011, 2020. a
Havnes, O., Antonsen, T., Hartquist, T., Fredriksen, Å., and Plane, J.: The Tromsø programme of in situ and sample return studies of mesospheric nanoparticles, J. Atmos. Sol.-Terr. Phy., 127, 129–136, https://doi.org/10.1016/j.jastp.2014.09.010, 2015. a
Hervig, M. E., Brooke, J. S. A., Feng, W., Bardeen, C. G., and Plane, J. M. C.: Constraints on Meteoric Smoke Composition and Meteoric Influx Using SOFIE Observations With Models, J. Geophys. Res.-Atmos., 122, 13495–13505, https://doi.org/10.1002/2017JD027657, 2017. a, b, c, d, e, f, g
Hunten, D. M., Turco, R. P., and Toon, O. B.: Smoke and Dust Particles of Meteoric Origin in the Mesosphere and Stratosphere, J. Atmos. Sci., 37, 1342–1357, https://doi.org/10.1175/1520-0469(1980)037<1342:SADPOM>2.0.CO;2, 1980. a
Johannessen, A., Krankowsky, D., Arnold, F., Riedler, W., Friedrich, M., Folkestad, K., Skovli, G., Thrane, E. V., and Tröim, J.: Physical Sciences: Detection of Water Cluster Ions at the High Latitude Summer Mesopause, Nature, 235, 215–217, https://doi.org/10.1038/235215a0, 1972. a
Kopp, E., Ramseyer, H., and Björn, L.: Positive ion composition and electron density in a combined auroral and NLC event, Adv. Space Res., 4, 157–161, https://doi.org/10.1016/0273-1177(84)90279-5, 1984. a
Latteck, R. and Strelnikova, I.: Extended observations of polar mesosphere winter echoes over Andøya (69°N) using MAARSY, J. Geophys. Res.-Atmos., 120, 8216–8226, https://doi.org/10.1002/2015JD023291, 2015. a
Latteck, R., Renkwitz, T., and Strelnikov, B.: D region observations by VHF and HF radars during a rocket campaign at Andøya dedicated to investigations of PMWE, Advances in Radio Science, 17, 225–237, https://doi.org/10.5194/ars-17-225-2019, 2019. a
Lynch, K. A., Gelinas, L. J., Kelley, M. C., Collins, R. L., Widholm, M., Rau, D., MacDonald, E., Liu, Y., Ulwick, J., and Mace, P.: Multiple sounding rocket observations of charged dust in the polar winter mesosphere, J. Geophys. Res.-Space, 110, A03302, https://doi.org/10.1029/2004JA010502, 2005. a
Megner, L., Siskind, D. E., Rapp, M., and Gumbel, J.: Global and temporal distribution of meteoric smoke: A two-dimensional simulation study, J. Geophys. Res.-Atmos., 113, D03202, https://doi.org/10.1029/2007JD009054, 2008. a
Obenberger, K. S., Holmes, J. M., Ard, S. G., Dowell, J., Shuman, N. S., Taylor, G. B., Varghese, S. S., and Viggiano, A. A.: Association Between Meteor Radio Afterglows and Optical Persistent Trains, J. Geophys. Res.-Space, 125, e2020JA028053, https://doi.org/10.1029/2020JA028053, 2020. a
Paul, W. and Steinwedel, H.: Notizen: Ein neues Massenspektrometer ohne Magnetfeld, Zeit. Naturforsch. Pt. A, 8, 448–450, https://doi.org/10.1515/zna-1953-0710, 1953. a
Plane, J. M., Saunders, R. W., Hedin, J., Stegman, J., Khaplanov, M., Gumbel, J., Lynch, K. A., Bracikowski, P. J., Gelinas, L. J., Friedrich, M., Blindheim, S., Gausa, M., and Williams, B. P.: A combined rocket-borne and ground-based study of the sodium layer and charged dust in the upper mesosphere, J. Atmos. Sol.-Terr. Phy., 118, 151–160, https://doi.org/10.1016/j.jastp.2013.11.008, 2014. a, b, c, d
Plane, J. M. C. and Whalley, C. L.: A New Model for Magnesium Chemistry in the Upper Atmosphere, J. Phys. Chem. A, 116, 6240–6252, https://doi.org/10.1021/jp211526h, 2012. a
Plane, J. M. C., Feng, W., and Dawkins, E. C. M.: The Mesosphere and Metals: Chemistry and Changes, Chem. Rev., 115, 4497–4541, https://doi.org/10.1021/cr500501m, 2015. a
Plane, J. M. C., Gómez-Martín, J. C., Feng, W., and Janches, D.: Silicon chemistry in the mesosphere and lower thermosphere, J. Geophys. Res.-Atmos., 121, 3718–3728, https://doi.org/10.1002/2015JD024691, 2016. a
Plane, J. M. C., Gumbel, J., Kalogerakis, K. S., Marsh, D. R., and von Savigny, C.: Opinion: Recent developments and future directions in studying the mesosphere and lower thermosphere, Atmos. Chem. Phys., 23, 13255–13282, https://doi.org/10.5194/acp-23-13255-2023, 2023. a
Rapp, M., Hedin, J., Strelnikova, I., Friedrich, M., Gumbel, J., and Lübken, F.-J.: Observations of positively charged nanoparticles in the nighttime polar mesosphere, Geophys. Res. Lett., 32, L23821, https://doi.org/10.1029/2005GL024676, 2005. a
Rapp, M., Plane, J. M. C., Strelnikov, B., Stober, G., Ernst, S., Hedin, J., Friedrich, M., and Hoppe, U.-P.: In situ observations of meteor smoke particles (MSP) during the Geminids 2010: constraints on MSP size, work function and composition, Ann. Geophys., 30, 1661–1673, https://doi.org/10.5194/angeo-30-1661-2012, 2012. a, b, c
Reid, G. C.: The production of water-cluster positive ions in the quiet daytime D region, Planet. Space Sci., 25, 275–290, https://doi.org/10.1016/0032-0633(77)90138-6, 1977. a, b, c
Robertson, S., Dickson, S., Horányi, M., Sternovsky, Z., Friedrich, M., Janches, D., Megner, L., and Williams, B.: Detection of meteoric smoke particles in the mesosphere by a rocket-borne mass spectrometer, J. Atmos. Sol.-Terr. Phy., 118, 161–179, https://doi.org/10.1016/j.jastp.2013.07.007, 2014. a, b
Rosinski, J. and Snow, R. H.: Secondary Particulate Matter from Meteor Vapors, J. Meteorol., 18, 736–745, https://doi.org/10.1175/1520-0469(1961)018<0736:SPMFMV>2.0.CO;2, 1961. a
Schulte, P. and Arnold, F.: Detection of upper atmospheric negatively charged microclusters by a rocket-borne mass spectrometer, Geophys. Res. Lett., 19, 2297–2300, https://doi.org/10.1029/92GL02631, 1992. a, b, c
Shuman, N. S., Hunton, D. E., and Viggiano, A. A.: Ambient and Modified Atmospheric Ion Chemistry: From Top to Bottom, Chem. Rev., 115, 4542–4570, https://doi.org/10.1021/cr5003479, pMID: 25659834, 2015. a
Staszak, T., Strelnikov, B., Latteck, R., Renkwitz, T., Friedrich, M., Baumgarten, G., and Lübken, F.-J.: Turbulence generated small-scale structures as PMWE formation mechanism: Results from a rocket campaign, J. Atmos. Sol.-Terr. Phy., 217, 105559, https://doi.org/10.1016/j.jastp.2021.105559, 2021. a, b, c
Strelnikov, B., Szewczyk, A., and Rapp, M.: In-situ measurements of small-scale structures in neutrals and plasma species during ECOMA-2010, in: EGU General Assembly Conference Abstracts, edited by: Abbasi, A. and Giesen, N., vol. 14, EGU General Assembly Conference Abstracts, p. 11861, https://ui.adsabs.harvard.edu/abs/2012EGUGA..1411861S (last access: 5 January 2025), 2012. a
Strelnikov, B., Staszak, T., Latteck, R., Renkwitz, T., Strelnikova, I., Lübken, F.-J., Baumgarten, G., Fiedler, J., Chau, J. L., Stude, J., Rapp, M., Friedrich, M., Gumbel, J., Hedin, J., Belova, E., Hörschgen-Eggers, M., Giono, G., Hörner, I., Löhle, S., Eberhart, M., and Fasoulas, S.: Sounding rocket project “PMWE” for investigation of polar mesosphere winter echoes, J. Atmos. Sol.-Terr. Phy., 218, 105596, https://doi.org/10.1016/j.jastp.2021.105596, 2021. a
Stude, J., Aufmhoff, H., and Rapp, M.: PMWE1F-ROMARA, Zenodo [data set], https://doi.org/10.5281/zenodo.11470114, 2020. a
Stude, J., Aufmhoff, H., Schlager, H., Rapp, M., Arnold, F., and Strelnikov, B.: A novel rocket-borne ion mass spectrometer with large mass range: instrument description and first-flight results, Atmos. Meas. Tech., 14, 983–993, https://doi.org/10.5194/amt-14-983-2021, 2021. a, b, c, d, e
Stude, J., Aufmhoff, H., and Rapp, M.: PMWE2F-ROMARA, Zenodo [data set], https://doi.org/10.5281/zenodo.11469720, 2024. a
Vanhaecke, F., de Wannemacker, G., Moens, L., Dams, R., Latkoczy, C., Prohaska, T., and Stingeder, G.: Dependence of detector dead time on analyte mass number in inductively coupled plasma mass spectrometry, J. Anal. Atom. Spectrom., 13, 567–571, https://doi.org/10.1039/A709001C, 1998. a
Wüest, M., Evans, D., and von Steiger, R.: Calibration of Particle Instruments in Space Physics, p. 132, ESA Publications Division, Keplerlaan 1, 2200 AG Noordwijk, the Netherlands, https://www.issibern.ch/PDF-Files/SR-007.pdf (last access: 1 January 2025), 2007. a
Zbinden, P., Hidalgo, M., Eberhahdt, P., and Geiss, J.: Mass spectrometer measurements of the positive ion composition in the D- and E-regions of the ionosphere, Planet. Space Sci., 23, 1621–1642, https://doi.org/10.1016/0032-0633(75)90090-2, 1975. a
- Abstract
- Introduction
- The ROMARA instruments
- Measurements
- Discussion
- Summary
- Appendix A: Intake cone current
- Appendix B: Payload charging
- Appendix C: Background counts ROMARA-2
- Data availability
- Author contributions
- Competing interests
- Disclaimer
- Acknowledgements
- Financial support
- Review statement
- References


