the Creative Commons Attribution 4.0 License.
the Creative Commons Attribution 4.0 License.
 | 01 Apr 2025
Differences in the key volatile organic compound species between their emitted and ambient concentrations in ozone formation
Xudong Zheng
Shaodong Xie
The emissions and secondary transformations of volatile organic compounds (VOCs) play a significant role in ozone (O3) formation. Previous studies have often relied on ambient VOC concentrations to identify key species. However, ambient concentrations represent the residual concentrations after the emitted VOCs have been consumed, which can introduce substantial uncertainties. To address this issue, this study proposes a novel method to identify the key VOC species in both anthropogenic and biogenic emissions. The emitted VOC concentrations are calculated during both nighttime and daytime in summer using the nitrate radical, O3, and hydroxyl radical reaction rates and ambient concentrations of 99 VOCs measured at Deyang, Chengdu, and Meishan, China. The emitted concentrations of alkenes and aromatics are higher than the ambient concentrations. The largest differences between emitted and ambient concentrations are 1.04 ppbv for cis-2-butene at Deyang, 0.81 ppbv for isoprene at Chengdu, and 1.79 ppbv for isoprene at Meishan. In contrast, due to secondary production, the emitted concentrations of oxygenated VOCs are lower than the ambient concentrations. The largest differences are −0.54 ppbv for acetone at Deyang, −0.58 ppbv for acetaldehyde at Chengdu, and −0.5 ppbv for acetone at Meishan. Based on the emitted concentrations, isoprene is one of the top three species contributing to O3 formation at all three sites, which may be overlooked in observed concentrations. Comprehensive calculation of the emitted VOC concentrations enables the key VOC species in O3 formation to be accurately identified.
- Article
(2174 KB) - Full-text XML
-
Supplement
(55725 KB) - BibTeX
- EndNote


Volatile organic compounds (VOCs), mainly including non-methane hydrocarbons (NMHCs) and oxygenated VOCs (OVOCs) (Mo et al., 2021; Gkatzelis et al., 2021; Xia et al., 2020; Huang et al., 2020), have an important role in ozone (O3) formation (Fry et al., 2018; Seinfeld and Pandis, 2016; Finlayson-Pitts and Pitts, 2000; Haagen-Smit and Fox, 1956). VOCs primarily originate from anthropogenic sources, such as biomass burning, vehicle emissions, solvent use, and industrial activities, as well as biogenic sources (Wu and Xie, 2017). The VOCs emitted from these sources are referred to as emitted VOCs. Additionally, OVOCs could be formed through the oxidation of NMHCs (Calvert et al., 2015; Birdsall and Elrod, 2011; Finlayson-Pitts and Pitts, 2000). It is crucial to accurately identify the key emitted VOC species that influence O3 formation to develop effective VOC emission reduction strategies.
The evaluation of the contribution of VOC species to O3 formation typically involves methods such as the photochemical O3 creation potentials (Derwent et al., 2007, 1998), the relative incremental reactivity method (Cardelino and Chameides, 1995), O3 formation pathway tracking based on box models (Zhan et al., 2023), and the maximum incremental reactivity (MIR) method (Carter et al., 1995; Carter, 1994). The MIR method has been widely used since 1994 (Kong et al., 2023; Carter et al., 1995; Carter, 1994). The MIR values have previously been obtained by adding VOCs in the smog chamber experiments and performing numerical simulations. These values reflect the changes in O3 concentrations resulting from adding a unit of VOCs (Carter et al., 1995; Carter, 1994). The importance of VOC species is ranked based on the product of the MIR and the ambient VOC concentrations at sampling sites, and the results are used to identify the key species contributing to O3 formation potential (OFP) in Chengdu (Wang et al., 2023; Kong et al., 2023; Xiong et al., 2021; Tan et al., 2020a, b; Deng et al., 2019; Song et al., 2018) and Deyang (Chen et al., 2021). For example, the top three VOC species at Chengdu contributing to the OFP were ethylene, propylene, and m,p-xylene (Song et al., 2018). The VOCs added in smog chamber experiments should correspond to those emitted into the atmosphere from sources. Most studies have determined these by relying on the ambient VOC concentrations measured in the atmosphere. However, there are substantial uncertainties in accurately identifying the key VOC species.
Ambient VOC concentrations consist of the residual concentrations after the emitted VOCs have been consumed during the day and night, along with the concentrations of secondary OVOC formation during the day. Most studies have calculated emitted concentrations based on the daytime consumption of NMHCs by hydroxyl radicals (OH) (He et al., 2019; Shao et al., 2009). However, the consumption of alkenes at night by O3 or nitrate radicals (NO3) and the primary emissions and secondary formation of OVOCs are not considered. First, although OH mainly reacts with NMHCs during the day, nighttime alkene consumption is majorly driven by NO3 or O3 (Zhu et al., 2020; Brown and Stutz, 2012; Finlayson-Pitts and Pitts, 1997). The ratio of nighttime NO3 and O3 consumption to daytime OH consumption is 1.28±1.28 for isoprene, styrene, 1,3-butadiene, ethylene, propylene, 1-butene, cis-2-butene, and trans-2-butene (de Gouw et al., 2017). Therefore, if nighttime alkene consumption is not considered, the emitted concentrations of alkenes are likely underestimated.
Second, ambient concentrations of OVOCs include contributions from both primary emissions and secondary formation. The OFP of secondary OVOC concentrations is already included within their precursor NMHCs because the MIR is expressed as the maximum value. Thus, without excluding the secondary OVOC formation, their OFP would likely be overestimated. The differences in the reaction rates of VOCs and secondary formation of OVOCs cause discrepancies in the species rankings of emitted and ambient VOC concentrations, which in turn affects the OFP rankings of key VOC species. Due to the instantaneous emissions, mixing, and oxidation changes in the ambient atmosphere, directly obtaining the emitted VOC concentrations during the day and night is difficult. These cause uncertainties in accurately identifying the emitted VOC species that are key to O3 formation.
To address these issues, this study calculates the emitted concentrations of alkenes at night and NMHCs and OVOCs during the day based on reaction rates and the measured ambient VOC concentrations. The differences in the OFP rankings of the VOC species are assessed based on the emitted and ambient VOC concentrations. These investigations are conducted through hourly measurements of concentrations of 99 VOCs in rural Deyang, suburban Chengdu, and forest Meishan in the Sichuan Basin, China, from August to September 2019. The main aim is to determine the emitted VOC concentrations and identify the key species affecting O3 formation by constraining the consumption of VOCs both at night and during the day and the secondary formation of OVOCs during the day.
2.1 Field measurements
Three monitoring sites are located in the Sichuan Basin, China (Fig. S1 in the Supplement): the village of Guihong (31°1′ N, 104°12′ E) in Deyang (expressed as rural Deyang); Huangjueshu community (30°24′ N, 103°51′ E) in Chengdu (suburban Chengdu); and a bamboo forest wetland park (29°48′ N, 103°49′ E) in Meishan (forest Meishan). In summer (July to September), the temperature at these sites ranges from 25–35 °C, and the relative humidity ranges from 40 % to 80 %. The Deyang–Chengdu–Meishan urban agglomeration is located between the eastern Tibetan Plateau and the western Longquan Mountains (Fig. S1b). Air masses in this agglomeration are not easily dispersed and tend to concentrate within the basin (Fig. S1c). Strong ultraviolet light, high temperatures, and low wind speeds are conducive to VOC emissions and consumption during the mid-latitude summer in the basin.
Hourly VOC samples are collected, preprocessed, and analyzed by a custom-built online gas chromatography–mass spectrometry flame ionization detector (GC-MS/FID) system (TH-PKU 300B, Tianhong, China; GCMS-QP2010SE-Plus, Shimadzu, Japan) from 8 August to 14 September 2019. After removing particulate matter, moisture, and carbon dioxide, 300 mL of air is concentrated within an electronic refrigeration unit at −150 °C for each sample. The concentrated VOCs are quickly desorbed by heating at 100 °C and transferred to the GC column. C2 to C5 hydrocarbons are separated on a nonpolar capillary column (HP-PLOT Al2O3, Agilent, Santa Clara, CA, USA) and measured with the FID. Other compounds are separated on a semi-polar column (DB-624, Agilent) and detected by MS. Standard curves are established for six concentrations from 0.1 to 8 ppbv for 57 VOCs at photochemical assessment monitoring stations (PAMSs) and 55 customized OVOCs and halocarbons using four internal standard gases (Linde, Danbury, CT, USA). Data validation is performed almost every night using the 2 ppbv standard concentration at the PAMSs and for the customized gas samples. The coefficients of determination of the calibration curves are greater than 0.99, and the method detection limits range from 0.003 to 0.070 ppbv for each VOC. A total of 99 VOCs are detected at the three sites: 29 alkanes, 11 alkenes, 16 aromatics, 28 halocarbons, 13 OVOCs, acetonitrile, and acetylene. Given the absence of secondary formation, VOCs other than OVOCs are classified as NMHCs, which include alkanes, alkenes, acetylene, acetonitrile, halocarbons, and aromatics. Similarly, no secondary formation is found for methyl tert-butyl ether (MTBE). The hourly O3 and NO2 concentrations are monitored concurrently by the Sichuan Environmental Monitoring Center at their sites at Deyang (31°8′ N, 104°26′ E), Chengdu (30°37′ N, 104°8′ E), and Meishan (30°4′ N, 103°52′ E) in a similar surrounding environment near each of the three VOC sampling sites, respectively.
2.2 Calculations of emitted VOC concentrations
Source classification is crucial for calculating emitted VOC concentrations. NMHCs (except isoprene) and MTBE are generally emitted from anthropogenic activities. Isoprene is typically emitted from biogenic sources and oxidized into methyl vinyl ketone (MVK) and methacrolein (MACR). In addition to secondary production, 10 of the 13 OVOCs (except MTBE, MVK, and MACR) are also emitted from both anthropogenic and biogenic sources (Zou et al., 2024; Lyu et al., 2024; Li et al., 2023; Wu et al., 2020). The emitted VOC concentrations are classified into three categories: anthropogenic sources in Sect. 2.2.1, biogenic sources in Sect. 2.2.2, and a combination of both in Sect. 2.2.3.
First, the major atmospheric oxidants for the consumption of emitted VOCs are NO3, O3, and OH. Due to the absence of sunlight, OH concentrations and photolysis rates are very low from 20:00 to 06:00 LT (Fig. S2). Either NO3 or O3 is the primary oxidant for the consumption of emitted alkene and styrene during the nighttime. During the local nighttime, emitted alkene and styrene concentrations are estimated through the NO3 or O3 exposure methods based on the relative loss rates of reported species between NO3 and O3 in the Los Angeles Basin (de Gouw et al., 2017). Other VOCs are excluded from the analysis due to their slow reaction rates with NO3 and O3 during the nighttime. The NO3 or O3 exposure method indicates that the concentration ratios of a stable tracer species to a reactive tracer species would increase with both NO3 or O3 concentrations and reaction time after emissions. Emitted concentrations are calculated based on NO3 or O3 reaction rates with VOCs and their exposure. Unreported alkenes are classified through comparison with reported alkenes in reaction rates of both NO3 (kNO3) and O3 (kO3) (Fig. S3). For example, the nocturnal consumption of 1-butene is over 96 % through reaction with O3 (de Gouw et al., 2017). The kO3 for 1-pentene is higher than the kO3 for 1-butene, but the kNO3 for 1-pentene is lower than the kNO3 for 1-butene. Therefore, the emitted 1-pentene concentrations are estimated using the O3 exposure method. Briefly, styrene and 1,3-butadiene are determined using the NO3 exposure method, while 8 of the 10 alkenes are determined using the O3 exposure method.
During the daytime from 07:00 to 19:00 LT (Fig. S2), NO3 is highly unstable and rapidly photolyzed. Therefore, VOC consumption by its oxidation is negligible. Alkenes and styrene can react with both OH and O3. For alkenes and styrene, the ratio of the product of the OH reaction rates (Carter, 2010) and the ambient OH concentration in the Chengdu Plain (; Yang et al., 2021) to the product of the O3 reaction rates (Carter, 2010; Atkinson and Arey, 2003) and the ambient O3 concentration (45.71 ppbv) is 19.20. This indicates that OH predominantly consumes VOCs during the daytime. The emitted concentrations of NMHCs and MTBE are quantified during the daytime using the OH exposure method in Sect. 2.2.1. The OH exposure method is similar to the NO3 and O3 exposure methods.
Second, Brown et al. (2009b) calculated emitted isoprene concentrations during the nighttime based on the steady-state NO3 production from the reaction of NO2 with O3 and its consumption by isoprene. The mean ratios of measured O3 to NO2 concentrations during the nighttime are 4.64 ppbv ppbv−1 at Deyang, 1.42 ppbv ppbv−1 at Chengdu, and 2.23 ppbv ppbv−1 at Meishan. The reported method is not suitable for this study because O3 concentrations must be much larger than the NO2 concentrations (Brown et al., 2009a). Similar to styrene and 1,3-butadiene, emitted isoprene concentrations are determined using the NO3 exposure method during the nighttime. During the day, emitted isoprene concentrations are calculated using the OH exposure method and the ambient concentrations of MVK and MACR. Emitted MVK and MACR concentrations are calculated based on their measured concentrations and isoprene consumption.
Third, emitted OVOC concentrations are determined using the photochemical age method during the daytime, due to their primary emissions, secondary production, and losses by either photolysis or photooxidation. Among meteorological factors, temperature is the primary driver of O3 production (Jacob and Winner, 2009), with the OH reaction rate showing small variations between 25–35 °C. For example, the reaction rate ratio for isoprene between these two temperatures is 0.96 (Saunders et al., 2003). Consequently, all VOC reaction rate constants are adjusted for a temperature of 300 K.
2.2.1 NMHC concentrations emitted by anthropogenic activities
For nighttime NO3 consumption, the emitted concentrations of styrene and 1,3-butadiene are estimated using the NO3 exposure method (de Gouw et al., 2017):
where [NO3] and Δt, together referred to as NO3 exposure ([NO3]Δt), are the NO3 concentrations and nocturnal reaction time, respectively. and are the reaction rate constants of benzene () and styrene () with NO3, respectively (Carter, 2010; Atkinson and Arey, 2003). [e-benzene][e-styrene] is the emission ratio between benzene and styrene. The estimated emission ratios are at Deyang, at Chengdu, and at Meishan based on the ambient concentrations with a low degree of nocturnal consumption, respectively (Fig. S4). [a-benzene][a-styrene] is the hourly ambient concentration ratio between benzene and isoprene. [a-alkenesj] and refer to the ambient concentrations and NO3 reaction rate constants (Fig. S3) of species j in styrene or 1,3-butadiene, respectively.
For nighttime O3 consumption, the emitted concentrations of eight reactive alkenes are estimated using the O3 exposure method (de Gouw et al., 2017):
where [O3] and Δt, together referred to as O3 exposure ([O3]Δt), are the O3 concentrations and nocturnal reaction time. and are the reaction rate constants of benzene () and cis-2-butene () with O3 (Carter, 2010; Atkinson and Arey, 2003). [e-benzene][e-cis-2-butene] is the emission ratio between benzene and cis-2-butene. The estimated emission ratios are at Deyang, at Chengdu, and at Meishan based on measured data with a low degree of nocturnal consumption, respectively (Fig. S5). After mixing from different sources, the emission ratios obtained at different sampling sites may vary. [a-benzene][a-cis-2-butene] is the hourly ambient concentration ratio between benzene and cis-2-butene. [a-alkenesj] and refer to the ambient concentrations and O3 reaction rate constants (Fig. S3) of the species j in alkenes, respectively. cis-2-Butene is replaced by trans-2-butene at Chengdu due to the unavailability of cis-2-butene data.
For daytime OH consumption, the emitted concentrations of each NMHC [e-NMHC], including MTBE, are estimated using the OH exposure method (Ma et al., 2022; Shao et al., 2011; de Gouw et al., 2005; Roberts et al., 1984):
where [OH] and Δt, together referred to as OH exposure ([OH]Δt), are the OH concentrations and reaction time, respectively. [e-ethylbenzene][e-m,p-xylenes] is the emission ratio between ethylbenzene and m,p-xylenes (Fig. S6). The major source of ethylbenzene and m,p-xylenes in the Chengdu Plain is solvent use (Wu and Xie, 2017). There is a strong linear correlation between ethylbenzene and m,p-xylenes (R2=0.96). kOHethylbenzene and kOHm,p-xylenes are the reaction rate constants of ethylbenzene () and m,p-xylenes () with OH, respectively (Carter, 2010). [a-NMHCj] and denote the hourly ambient concentrations and OH reaction rate constants (Fig. S7) of the species j in NMHCs, respectively.
2.2.2 Isoprene concentrations emitted by biogenic sources
For nighttime NO3 consumption, the emitted concentrations of isoprene are estimated using the NO3 exposure method (de Gouw et al., 2017):
where [NO3] and Δt, together referred to as NO3 exposure ([NO3]Δt), are the concentrations of NO3 and nocturnal reaction time, respectively. and are the reaction rate constants of MVK ( with O3) and isoprene () with NO3, respectively (Carter, 2010; Atkinson and Arey, 2003). The value is very small. Due to the unavailability of the value, is used as a substitute. [e-MVK][e-isoprene] is the emission ratio between MVK and isoprene. Although MVK and isoprene emissions are low at night, many field studies have demonstrated that they can accumulate in the early nighttime from 20:00 to 21:00 LT (Wennberg et al., 2018). Therefore, the measured MVK and isoprene concentrations in the early nighttime are the “emitted” concentrations for nighttime NO3 consumption. The estimated emission ratios are at Deyang, at Chengdu, and at Meishan from measured data with a low degree of nocturnal consumption, respectively (Fig. S8). There are no significant differences in the estimated emission ratios between early and late nighttime. Therefore, nighttime low MVK and isoprene emissions may not influence this calculation method. The emission ratios are directly linked to emission sources. After mixing from different sources, the emission ratios obtained at different sampling sites may vary. Although MVK and isoprene may originate from different sources during the nighttime, both anthropogenic and biogenic activities in the Chengdu Plain are relatively stable at nighttime based on both our unpublished results and the reported findings of a study using positive matrix factorization (Zheng et al., 2023; Kong et al., 2023; Xiong et al., 2021). Furthermore, as surrogates for traffic flows, the traffic congestion indices during the nighttime in Chengdu remain relatively stable (https://jiaotong.baidu.com/congestion/city/urbanrealtime, last access: 8 February 2025). Therefore, their emission ratios may remain consistent. [a-MVK][a-isoprene] is the hourly ambient concentration ratio between MVK and isoprene. MACR is not used as a stable biogenic tracer due to its relatively high NO3 reaction rate () compared to MVK.
For daytime OH consumption, the emitted isoprene concentrations are estimated using the OH exposure method in Eqs. (9–12) (Paulot et al., 2009; Stroud et al., 2001).
where kOHisoprene, kOHMVK, and kOHMACR are the reaction rate constants of isoprene (), MVK (), and MACR () with OH (Carter, 2010; Atkinson and Arey, 2003). [a-isoprene], [a-MVK], and [a-MACR] refer to the ambient concentrations of isoprene, MVK, and MACR, respectively.
For photolysis and photooxidation loss, the emitted concentrations of MVK and MACR ([e-OVOC]) are estimated based on isoprene consumption:
where [c-isoprene] indicates consumed concentrations of isoprene, which are equivalent to its emitted concentrations ([e-isoprene]) calculated from Eq. (12) minus the ambient concentrations ([a-isoprene]). [s-OVOCj] represents the secondary concentrations of species j in MVK or MACR produced from isoprene oxidation. The p values in Eq. (14) represent the molecular production from one molecular unit of isoprene consumption, with values of 0.32 for MVK and 0.23 for MACR, respectively (Paulot et al., 2009). Because the kOHMVK and kOHMACR values are 3.5 and 5 times lower than those of kOHisoprene (Fig. S7), respectively, the ambient OVOC concentrations ([a-OVOCj]) are assumed to be instantaneous total concentrations in Eq. (15). Therefore, [e-OVOCj] is approximately equal to [a-OVOCj] minus [s-OVOCj] plus the corresponding photochemical consumption, which is calculated using [c-isoprene] and the reaction rates. The photochemical consumption of OVOCs includes both photolysis and reaction with OH. Therefore, the total OVOCj loss rates () are estimated based on the photolysis rate () and the loss rate with OH ([OH]). The ratio of the to OH concentrations in the Sichuan Basin is similar to that reported in the Los Angeles Basin (Yang et al., 2021; de Gouw et al., 2018); therefore the and may be comparable (Tan et al., 2018; de Gouw et al., 2018). Accordingly, we assume that the ratios (0.6 for MVK and MACR) of to established in the Los Angeles Basin (Fig. S9; de Gouw et al., 2018) are applicable for estimating in the Sichuan Basin. kOHisoprene is the OH reaction rate constant of isoprene.
2.2.3 OVOC concentrations emitted by both anthropogenic and biogenic sources
To differentiate secondary production and consumption, we estimate the emitted concentrations of 10 of the 13 OVOCs ([e-OVOC]) during the daytime using the photochemical age method in Eqs. (16–17) (Wu et al., 2020; de Gouw et al., 2018; de Gouw et al., 2005). MTBE is excluded, with details provided in Sect. 2.2.1. The estimation methods for MVK and MACR are described in Sect. 2.2.2.
where the measured concentrations of species j in OVOCs ([a-OVOCj]) are equivalent to the sum of primary anthropogenic contributions, secondary anthropogenic contributions, and biogenic contributions, as represented sequentially in Eq. (16). Benzene is selected as the tracer of anthropogenic primary sources due to the dominance of combustion and industrial VOC emissions in the Sichuan Basin (Wu and Xie, 2017) and its relatively low OH reaction rate. and ERHC are the emission ratios of species j in OVOCs and hydrocarbons to benzene, respectively. We assume that the ratios (R) for to established in the Los Angeles Basin (Fig. S9; de Gouw et al., 2018) are applicable for estimating in the Sichuan Basin. OH exposure is calculated using Eq. (5). ERbiogenic is the emission ratio between OVOCs and isoprene from biogenic sources. [e-isoprene] is estimated by Eqs. (9–12). The , ERHC, kOHHC, and ERbiogenic values are determined using the nonlinear least-squares fit.
2.3 O3 formation potential
The OFP is calculated using Eqs. (18) or (19):
where MIRj, [a-VOCj], and [e-VOCj] indicate the MIR (Carter, 2010), the ambient concentration of species j in VOCs, and the emitted concentrations of species j in VOCs, respectively.
Figure 1 shows the hourly ambient total VOC (TVOC) concentrations at rural Deyang, suburban Chengdu, and forest Meishan from August to September 2019. The average TVOC concentration is 37.63±15.34 ppbv (parts per billion by volume) at Deyang, which is higher than 33.42±13.96 ppbv at Chengdu and 25.17±8.46 ppbv at Meishan (Fig. 1).
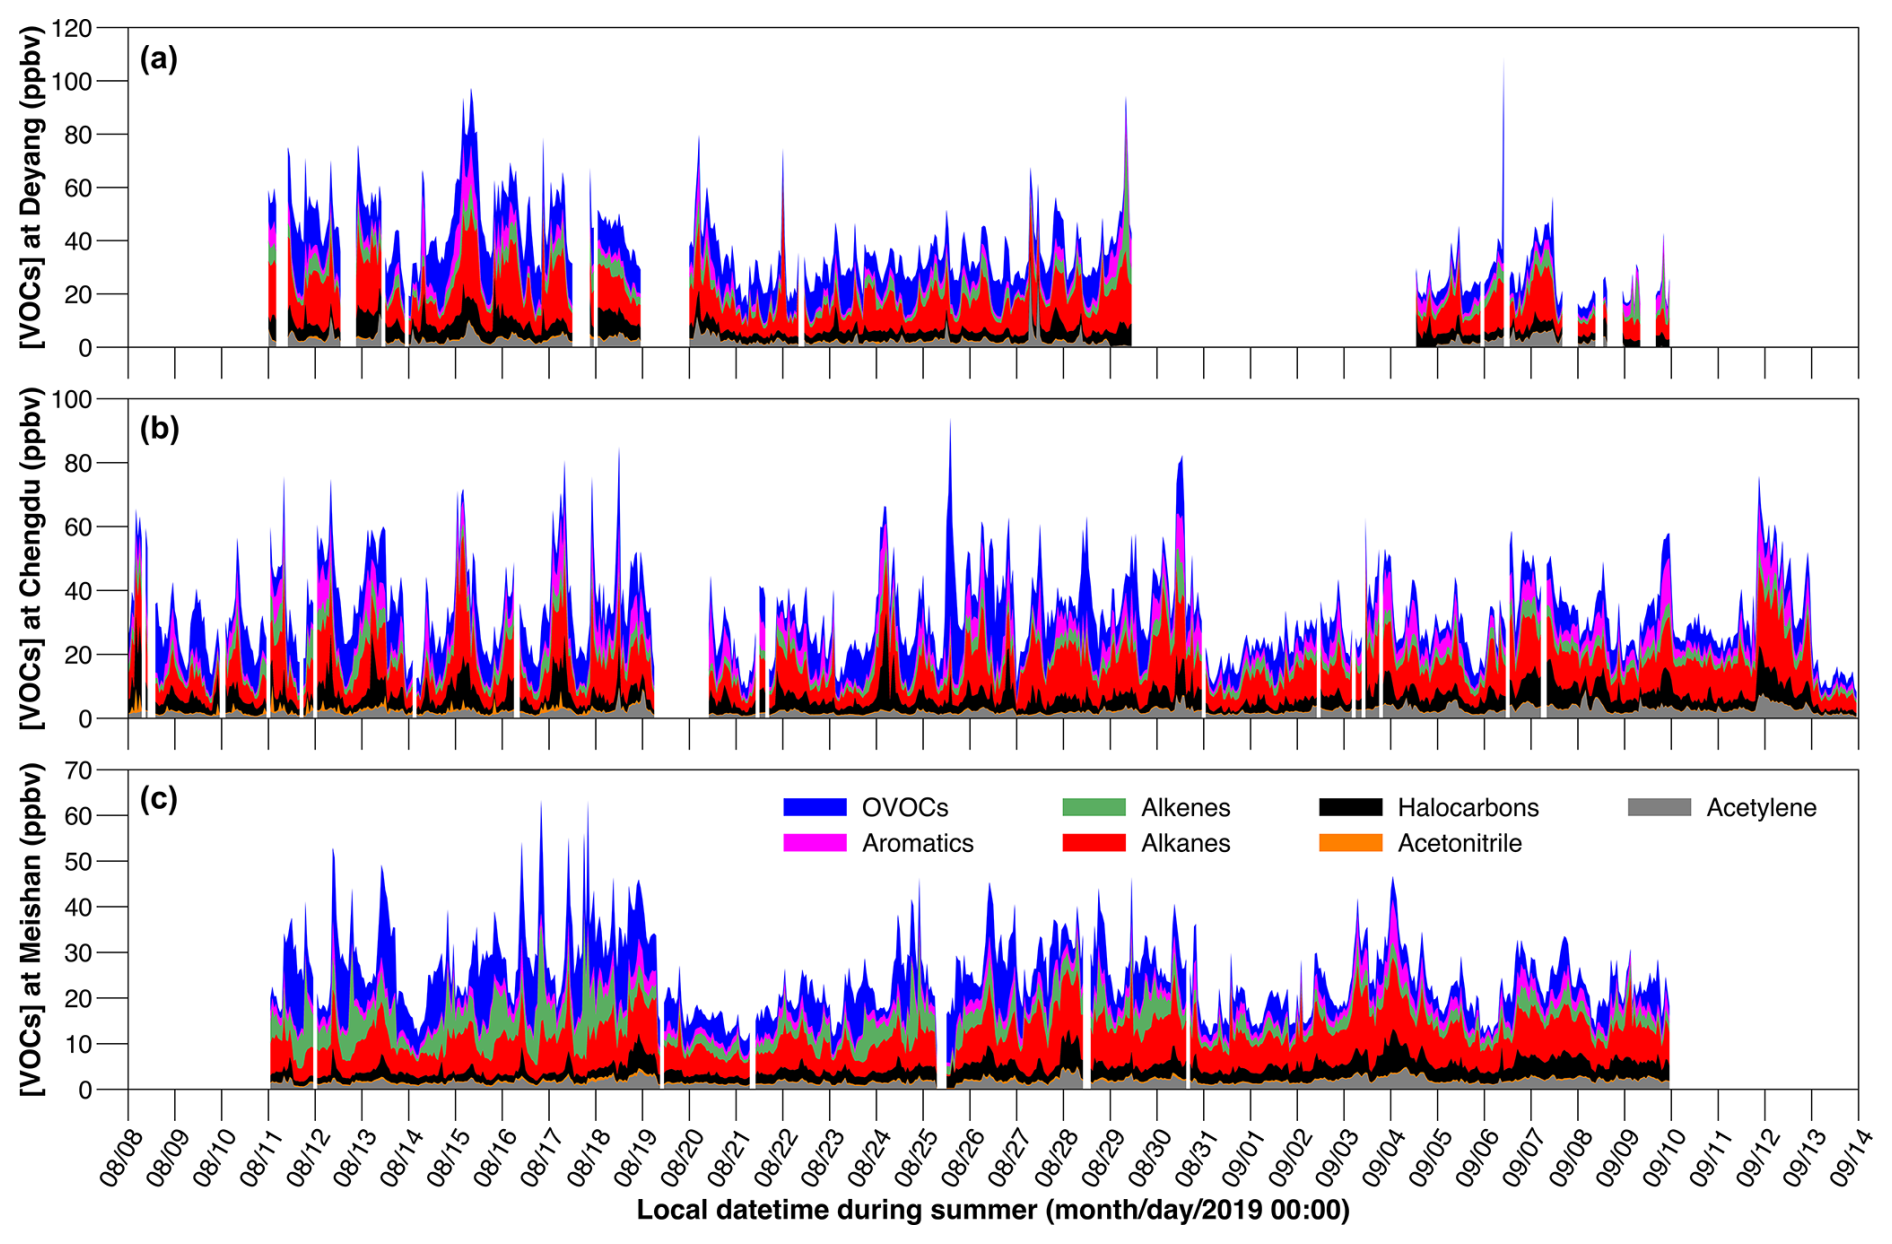
Figure 1Hourly concentrations of ambient VOCs at Deyang (a), Chengdu (b), and Meishan (c) from August to September 2019, respectively. The lack of data at rural Deyang from 30 August to 4 September 2019 is due to a power failure.
Due to the influences of sunlight, the consumption of emitted VOCs is classified into nighttime and daytime periods. During the night, emitted concentrations of alkenes and styrene are consumed through oxidation by NO3 radicals or O3 (de Gouw et al., 2017; Calvert et al., 2015; Finlayson-Pitts and Pitts, 2000). Because the reaction rates of NO3 and O3 are very low, mostly below (Carter, 2010; Atkinson and Arey, 2003; Atkinson, 2000), the nighttime consumption of aromatics except for styrene, alkanes, OVOCs, halocarbons, acetonitrile, and acetylene is not considered. During the daytime, emitted NMHC concentrations are primarily consumed by OH. Emitted OVOC concentrations are consumed by both OH and photolysis during the daytime, after excluding secondary formation.
The largest difference between the emitted and ambient average concentrations of TVOCs is found at Deyang, with a difference of 2.92 ppbv (Table 1). This is primarily attributable to the high reactivities of alkenes and aromatics (Carter, 2010). The average emitted concentrations of alkenes are 6.19 ppbv at Deyang, 5.16 ppbv at Chengdu, and 5.81 ppbv at Meishan, all exceeding the respective ambient concentrations of 3.32, 2.96 and 3.89 ppbv (Table 1). The average emitted concentrations of aromatics are 3.96 ppbv at Deyang, 5.00 ppbv at Chengdu, and 2.15 ppbv at Meishan, again exceeding the respective ambient concentrations of 2.99, 4.04, and 1.92 ppbv (Table 1). Among the chemical groups and the three sites, the largest difference is 2.87 ppbv for alkenes at Deyang (Table 1). This is attributed to the higher emitted alkene concentrations around Deyang (Table 1) and, consequently, higher consumption of alkenes. Specifically, the largest differences are 1.04 ppbv for cis-2-butene at Deyang, 0.81 ppbv for isoprene at Chengdu, and 1.79 ppbv for isoprene at Meishan, respectively (Fig. 2, Tables S1 and S2). The reaction rates of isoprene with NO3 and OH are higher than those of cis-2-butene, but the largest difference is observed for cis-2-butene at Deyang. This is possibly due to the higher emitted concentrations of cis-2-butene compared to those of isoprene (Fig. 2, Tables S1 and S2), which leads to greater consumption and thus larger differences for cis-2-butene at Deyang.
Table 1The ambient and emitted concentrations of VOC groups from August to September 2019.
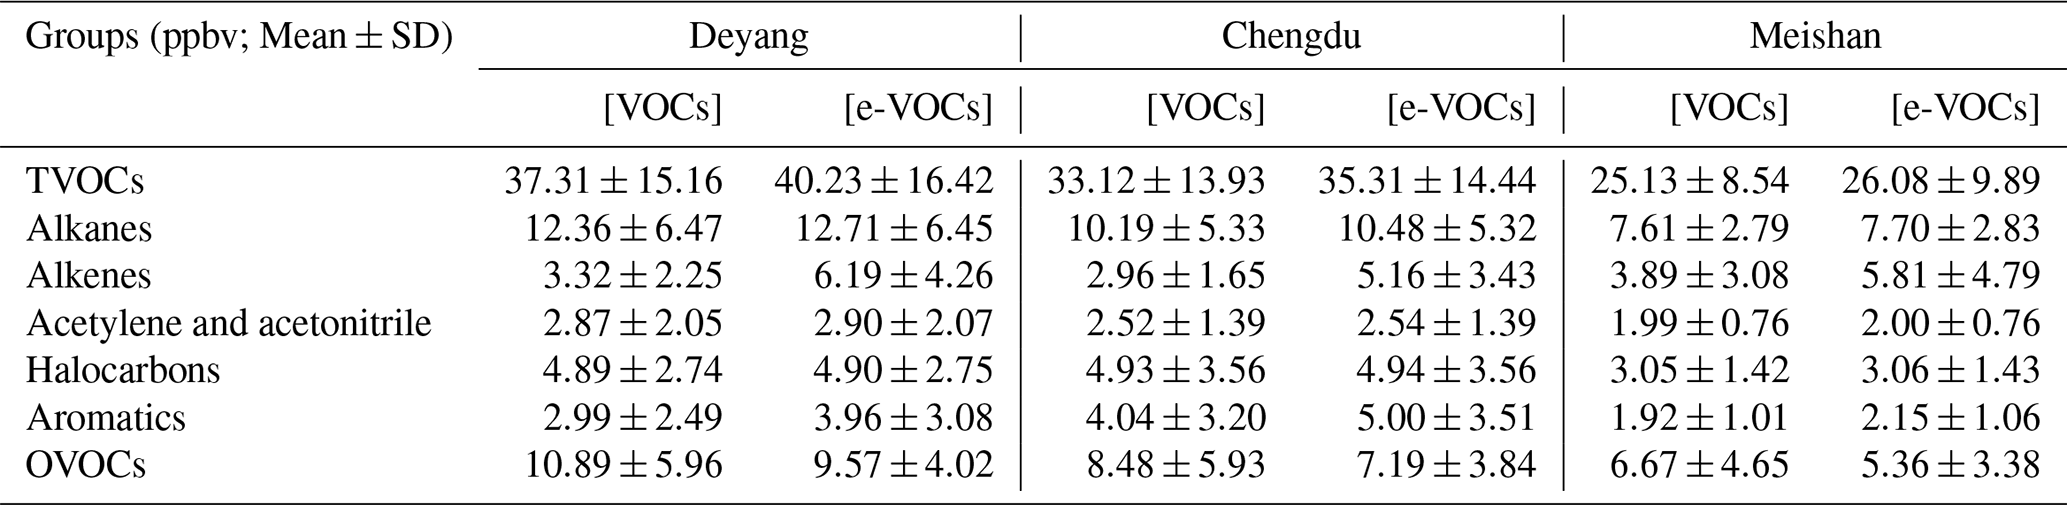
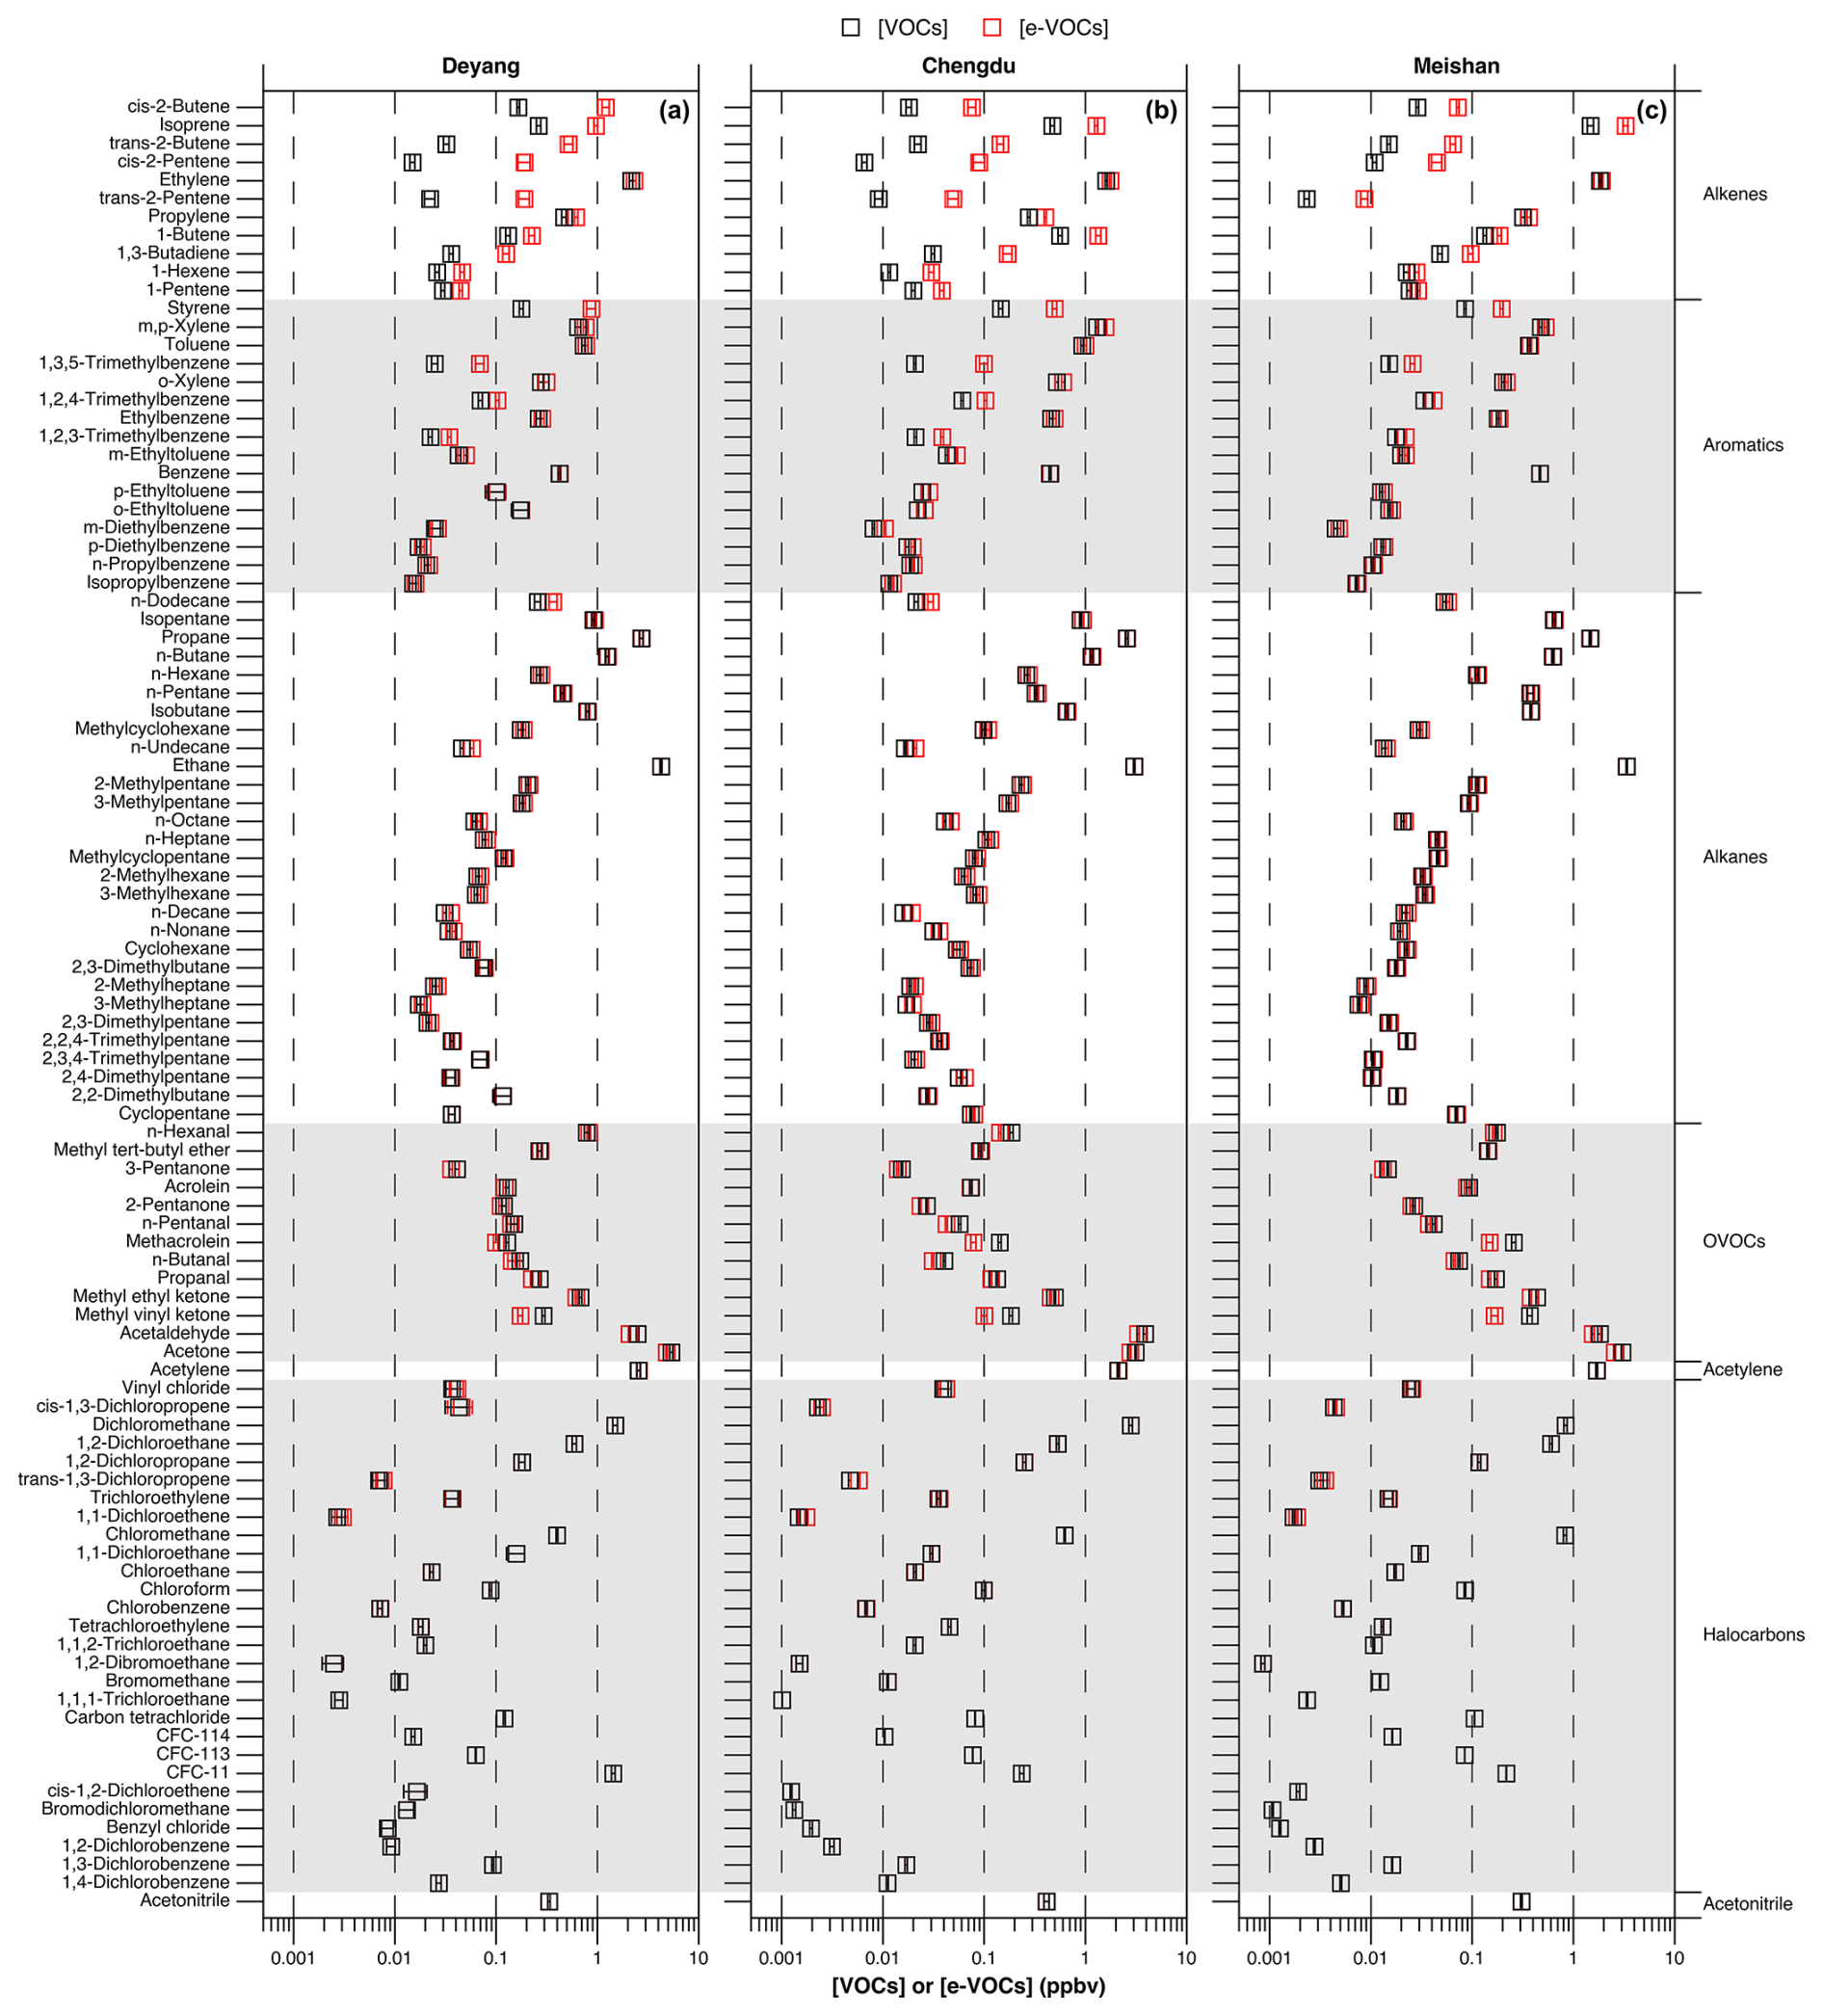
Figure 2The ambient and emitted VOC concentrations at Deyang (a), Chengdu (b), and Meishan (c) from August to September 2019, respectively. Square dots and whiskers show the means and standard errors (SEs), respectively. The details are given in Table S1.
The differences between the emitted and ambient concentrations of aromatics are 0.97 ppbv at Deyang, 0.96 ppbv at Chengdu, and 0.23 ppbv at Meishan (Table 1). Overall, the emitted concentrations of aromatics are higher at Chengdu than at Deyang, which likely leads to higher aromatics consumption. However, the larger consumption of styrene, a reactive aromatic, at Deyang results in similar consumption of aromatics: 0.97 ppbv at Deyang and 0.96 ppbv at Chengdu (Table 1). Styrene exhibited the largest difference between emitted and ambient concentrations among all aromatics, with differences of 0.70 ppbv at Deyang, 0.38 ppbv at Chengdu, and 0.11 ppbv at Meishan, respectively (Fig. 2, Tables S1 and S2). This is due to both its high OH and NO3 reaction rates. For aromatics, the second largest difference is 0.28 ppbv for m,p-xylene at Chengdu (Fig. 2, Tables S1 and S2). This is possibly due to the higher emissions of solvent use around Chengdu compared to the other two sites, which likely causes higher consumption and thus higher differences. Due to secondary formation, the average emitted OVOC concentrations are lower than the ambient concentrations by 1.32 ppbv at Deyang, 1.29 ppbv at Chengdu, and 1.31 ppbv at Meishan, respectively (Table 1). Specifically, the largest differences between emitted and ambient concentrations are observed for acetone, with differences of −0.54 ppbv at Deyang and −0.50 ppbv at Meishan, respectively (Fig. 2, Tables S1 and S2). Acetaldehyde displays the largest difference of −0.58 ppbv at Chengdu (Fig. 2, Tables S1 and S2). This might be due to the higher emissions of isoalkanes at Deyang. They could be converted into acetone (Jacob et al., 2002), which thus causes a larger negative difference. Due to the low reaction rates of OH, NO3, and O3 (Carter, 2010), the emitted and ambient concentrations of alkanes, acetylene, acetonitrile, and halocarbons are almost the same (Table 1). Overall, major differences between emitted and ambient concentrations are found for alkenes, aromatics, and OVOCs because of their high reactivities and secondary OVOC formation.
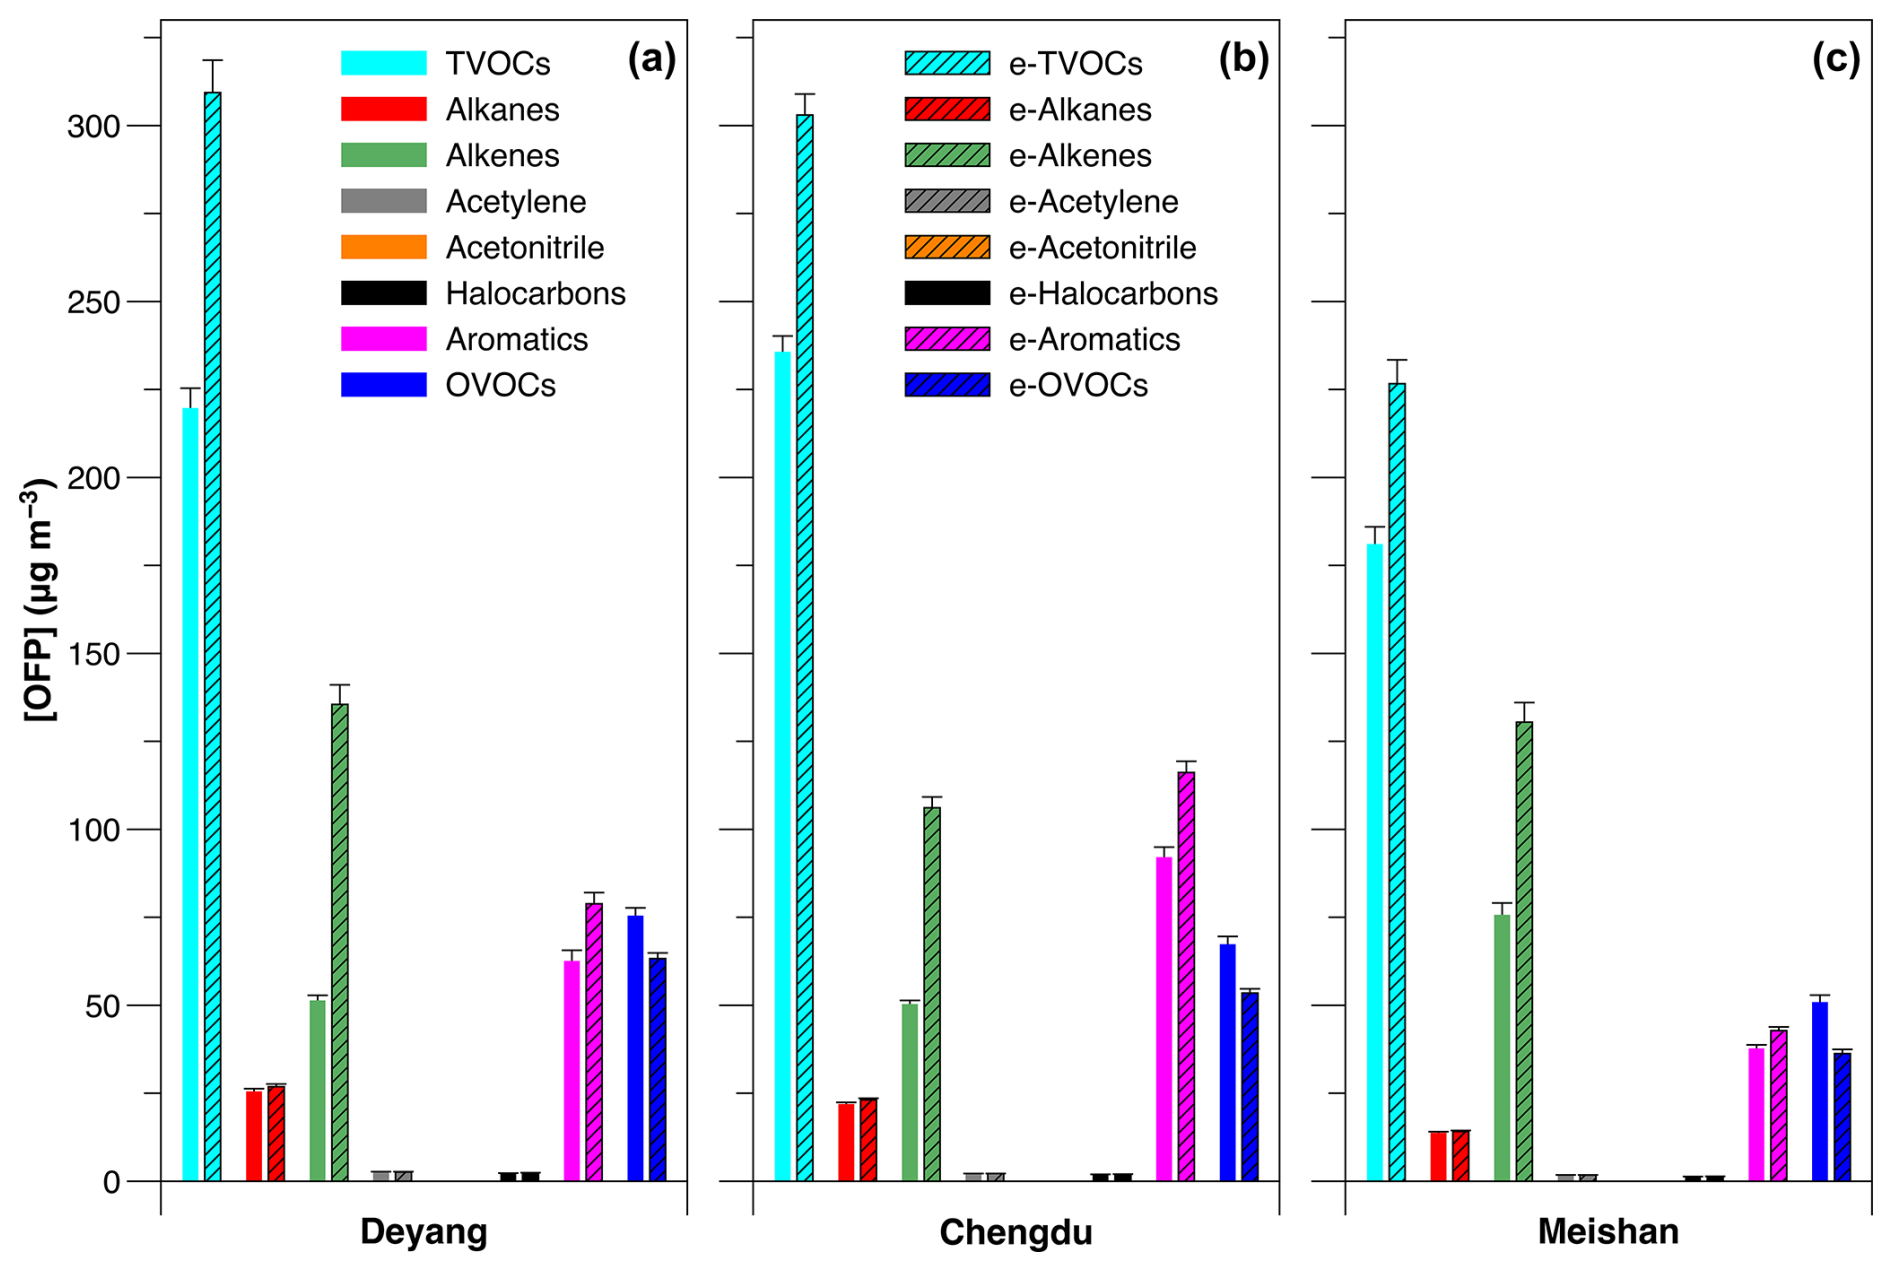
Figure 3Ozone formation potential based on ambient and emitted VOC concentrations at Deyang, Chengdu, and Meishan, from August to September 2019, respectively. Values are the means ± standard errors.
Ambient alkane concentrations are the largest among different VOC chemical groups (Fig. 1). However, due to their relatively low reaction activities, both lower OFP values and smaller OFP differences between emitted and ambient concentrations are found (Fig. 3). There are significant differences in the OFP between emitted and ambient alkene concentrations. The top three chemical groups with the largest differences are alkenes, aromatics, and OVOCs at all three sites. However, the OFP rankings of the chemical groups differ between emitted and ambient concentrations. The top three VOC chemical groups contributing to the OFP at Deyang are OVOCs, aromatics, and alkenes when based on ambient concentrations, and alkenes, aromatics, and OVOCs based on emitted concentrations. The top three VOC chemical groups at Chengdu are aromatics, OVOCs, and alkenes when based on ambient concentrations and aromatics, alkenes, and OVOCs when based on emitted concentrations. The top three VOC chemical groups at Meishan are alkenes, OVOCs, and aromatics when based on ambient concentrations and alkenes, aromatics, and OVOCs when based on emitted concentrations. The OFP of alkenes based on emitted concentrations is the highest at Deyang, reaching 135.52 µg m−3. The OFP of alkenes based on emitted concentrations is higher than that of aromatics at both Deyang and Meishan but lower at Chengdu. This might be due to the high emissions of solvents around Chengdu, leading to high emitted concentrations of aromatics (Table 1) and thus the higher OFP compared to that of alkenes.
Although the OFP is primarily associated with daytime O3 production, the nighttime OFP is also calculated to compare the potential differences in the contributions of VOCs and emitted VOCs to the OFP (Figs. S10 and S11). The temporal variation trends in the OFP values are generally consistent at the three sites based on emitted and ambient TVOC concentrations (Fig. S10a and b). The OFP based on emitted and ambient TVOC concentrations ranges from 65.60 to 1476.28 µg m−3 and from 55.86 to 827.30 µg m−3, respectively, at Deyang. Among VOC chemical groups, alkenes exhibit the greatest variations in the OFP, with ranges of 15.12 to 1081.41 µg m−3 and 7.87 to 282.78 µg m−3, respectively. The highest OFP based on the emitted TVOC concentrations was found at 16:00 LT on 11 August 2019, primarily due to the 1081.41 µg m−3 contribution from alkenes. At this time, the OFP based on the ambient TVOC concentrations is only 327.41 µg m−3. The ratio of the OFP between the emitted and ambient TVOC concentrations exceeds 4.5. This discrepancy is mainly because of the large consumption of alkenes at that time. If the consumption of alkenes is not considered, their contributions to the OFP would be greatly underestimated.
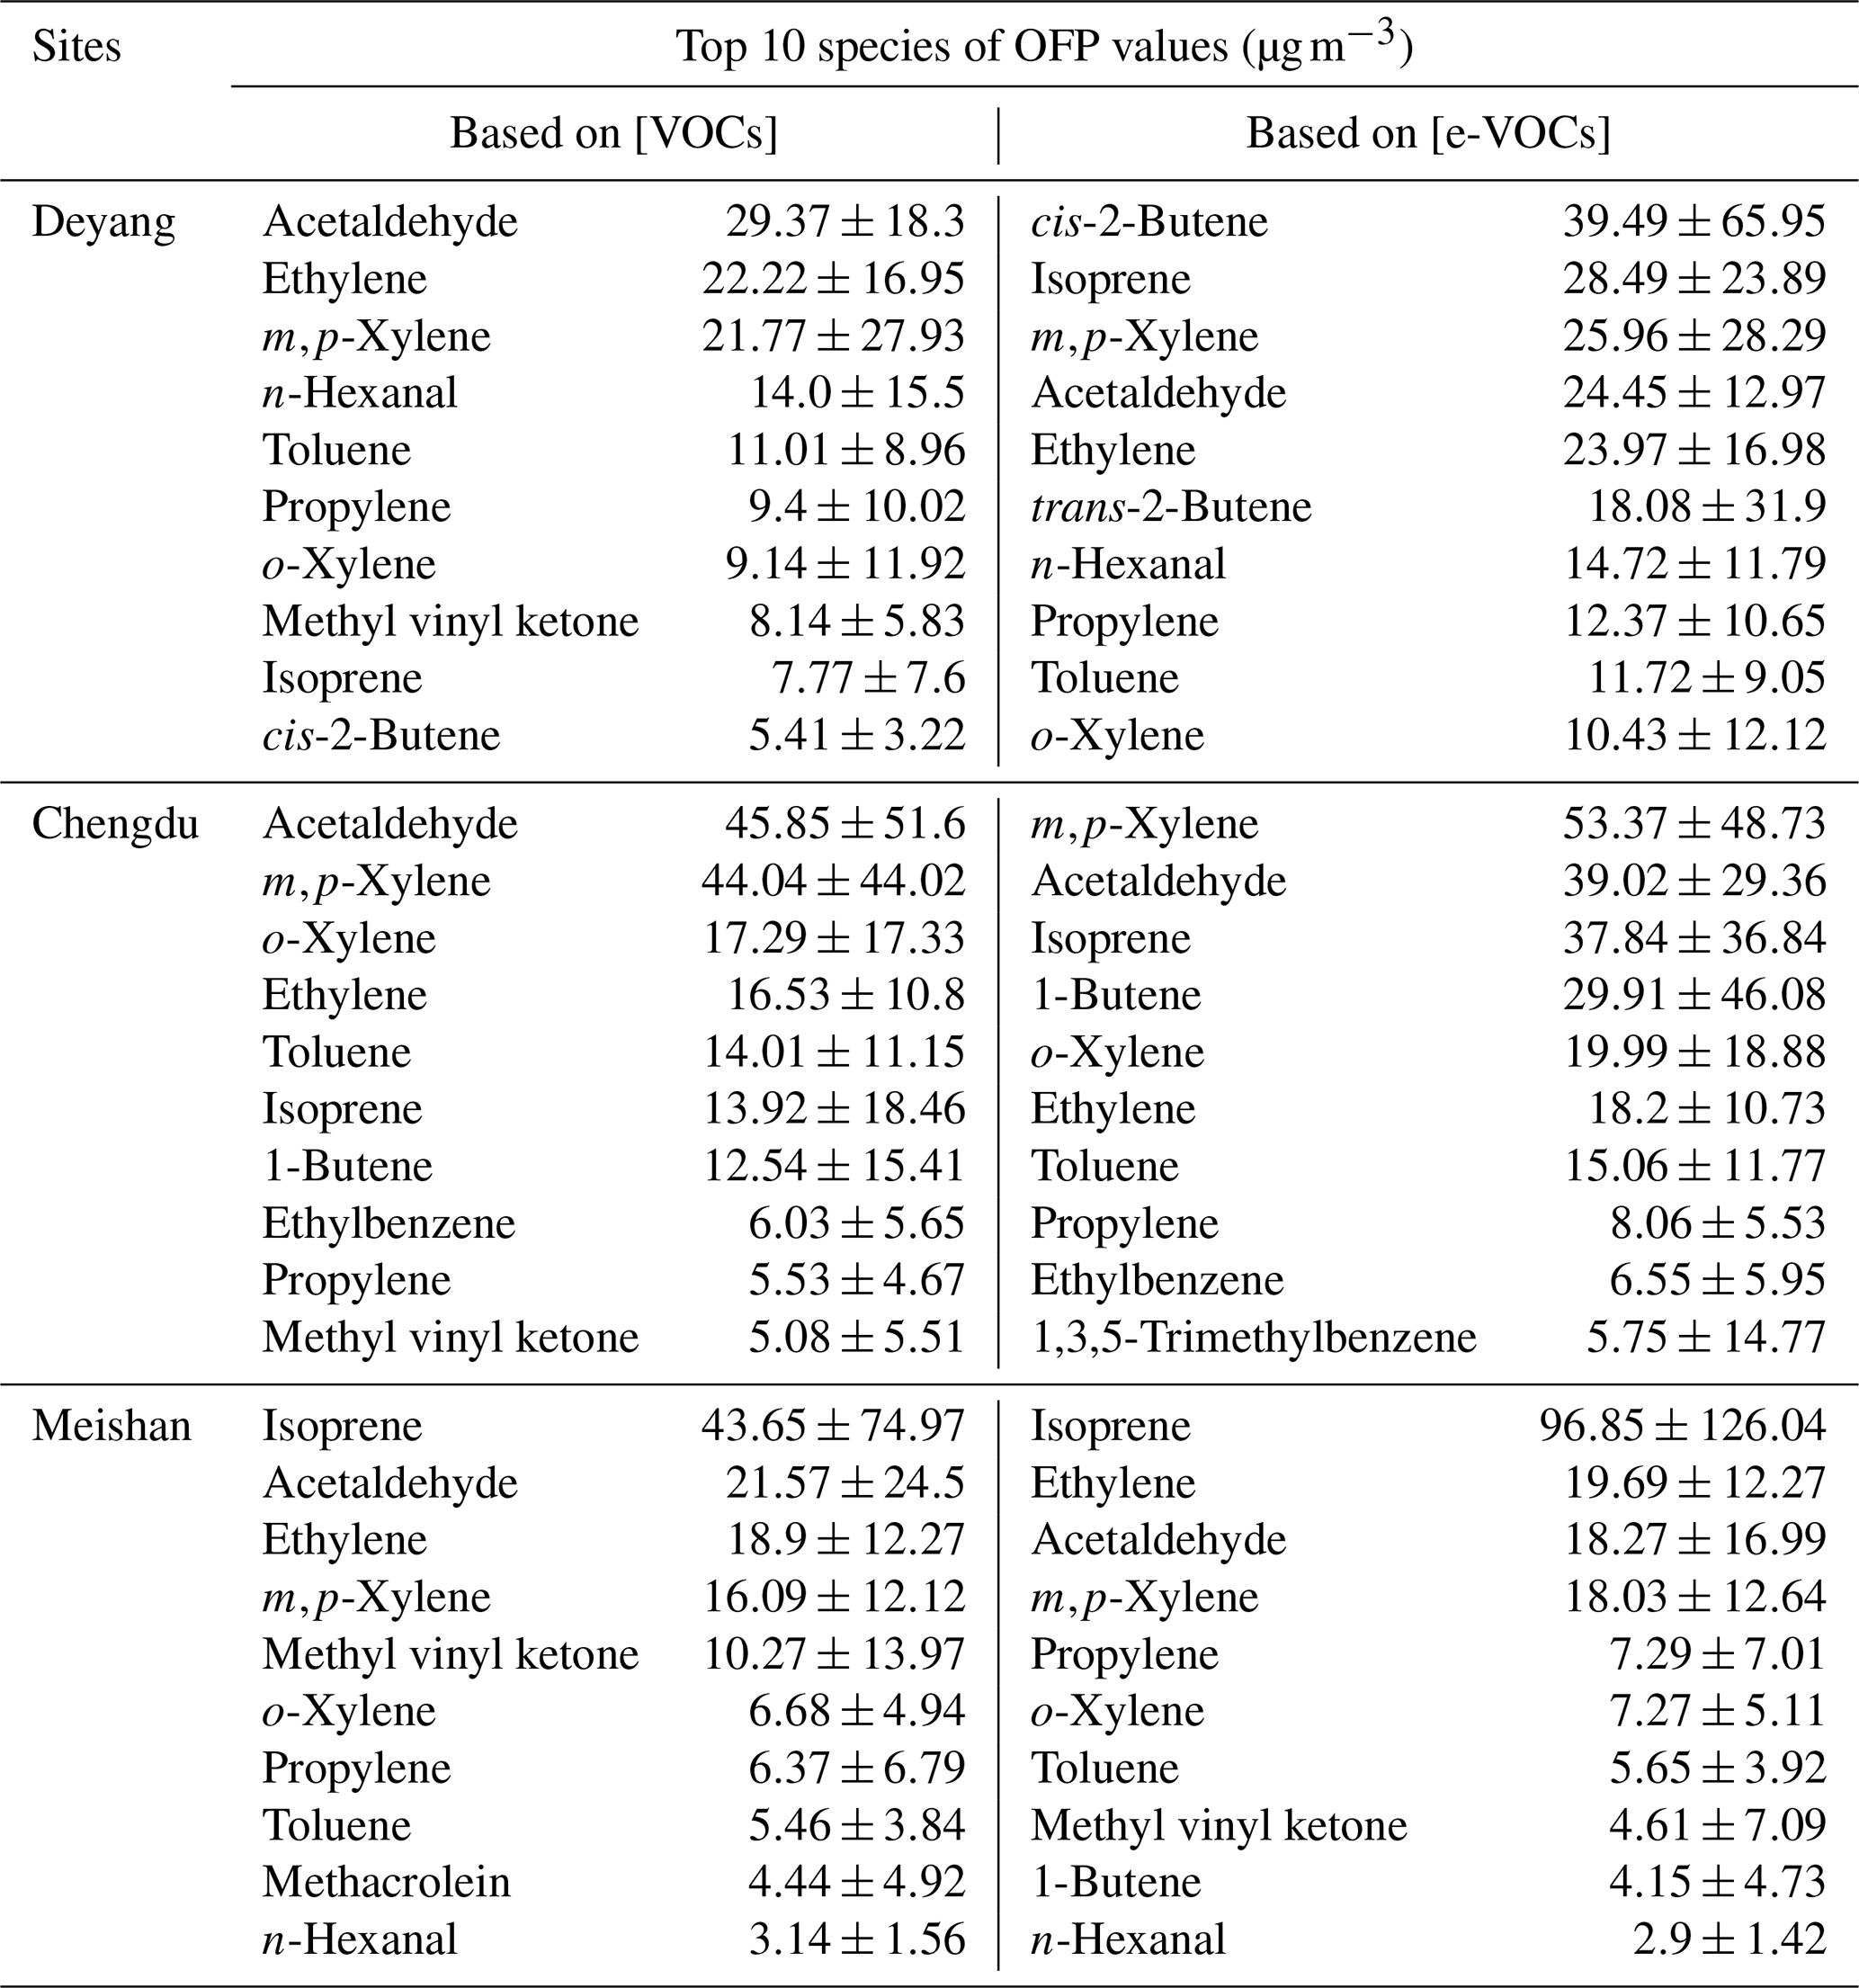
Table 2Differences of top 10 VOC species contributing to the OFP based on ambient and emitted concentrations.
The OFP based on emitted and ambient TVOC concentrations ranges from 47.47 to 1143.74 µg m−3 and from 39.21 to 819.61 µg m−3, respectively, at Chengdu (Fig. S10c and d). Alkenes exhibit the greatest variations in the OFP among VOC chemical groups, with ranges from 12.34 to 780.85 µg m−3 and from 4.94 to 336.58 µg m−3, respectively. The highest OFP based on the emitted TVOC concentrations was observed at 12:00 LT on 30 August 2019, which is primarily due to the contributions of 500.64 µg m−3 from alkenes and 494.89 µg m−3 from aromatics. At this time, the OFP based on the ambient TVOC concentrations is 819.61 µg m−3. The OFP based on the emitted and ambient TVOC concentrations are similar, indicating that photochemical consumption is relatively low at Chengdu compared to Deyang. Furthermore, the OFP of the ambient OVOC concentrations is 171.94 µg m−3, which is higher than the OFP of emitted concentrations at 88.40 µg m−3. Compared to the other two sites, emissions from solvent use are higher around Chengdu. This leads to higher emissions of aromatics, which significantly contributes to the OFP.
The OFP based on emitted and ambient TVOC concentrations ranges from 59.30 to 1351.58 µg m−3 and from 48.43 to 1077.27 µg m−3, respectively, at Meishan (Fig. S10e and f). Alkenes display the greatest variations in the OFP, ranging from 13.98 to 1133.53 µg m−3 and from 7.62 to 864.52 µg m−3, respectively. The highest OFP of the emitted TVOC concentrations was found at 18:00 LT on 17 August 2019, due to the major contribution of 1133.53 µg m−3 from alkenes. Because of low photochemical consumption and secondary OVOC formation, the difference in the OFP between emitted and ambient TVOC concentrations was relatively low, at about 25 % at this time. Compared to the other two sites, there are more biogenic isoprene emissions around Meishan, which contributes to the OFP of alkenes.
The highest hourly OFP values of emitted TVOC concentrations are 391.07 µg m−3 at 12:00 LT at Deyang, 432.12 µg m−3 at 12:00 LT at Chengdu, and 403.80 µg m−3 at 18:00 LT at Meishan, respectively (Fig. S11). After considering the nighttime alkene consumption, the emitted alkene concentrations at night are close to those during the day at Deyang. Moreover, the MIR values of alkenes are generally higher across these VOC chemical groups (Carter, 2010). These may explain why the total OFP at night is similar to that during the day at Deyang. The diurnal variations in the OFP at Chengdu are consistent with those of sunlight intensity. The OFP at Meishan is primarily driven by isoprene. The surrounding bamboo forest acts as a source of biogenic emissions. The accumulation of isoprene causes the highest concentrations, and thus the highest OFP, occurring at 18:00 LT.
As shown in Table 2, 9 species rank in the top 10 VOCs contributing to the OFP among both ambient and emitted VOCs at Deyang, Chengdu, and Meishan. Although the number of species in common is high, their rankings differ. The importance of isoprene to the OFP increases notably from ambient to emitted VOC concentrations, rising from ninth to second at Deyang, rising from sixth to third at Chengdu, and remaining first with more than a 2-fold increase at Meishan. The species with the highest OFP based on emitted VOC concentrations is cis-2-butene, with the OFP value of 39.49 µg m−3 at Deyang, whereas this species only ranks tenth based on ambient concentrations. This indicates that not considering emitted concentrations could underestimate the importance of cis-2-butene for O3 formation. At Chengdu, 5 of the top 10 OFP species based on emitted concentrations are aromatics, suggesting the need to control solvent usage. Although isoprene ranks first in its contribution to the OFP at Meishan based on both ambient and emitted VOC concentrations, its proportion increases due to relatively minor changes in the OFP contributions from other species. The top three species contributing to the OFP among emitted VOCs are cis-2-butene, isoprene, and m,p-xylene at Deyang; m,p-xylene, acetaldehyde, and isoprene at Chengdu; and isoprene, ethylene, and acetaldehyde at Meishan, respectively (Table 2). These results emphasize the importance of isoprene in O3 formation. They differ from those based on ambient VOC concentrations (Table 2) and those reported at Chengdu and Deyang from 2016 to 2019, which often include three of m,p-xylene, ethylene, toluene, and acetaldehyde (Table S3; Wang et al., 2023; Kong et al., 2023; Chen et al., 2021; Xiong et al., 2021; Tan et al., 2020a, b; Deng et al., 2019; Song et al., 2018).
Using NO3, O3, and OH reaction rates along with hourly ambient concentrations of 99 VOCs measured at Deyang, Chengdu, and Meishan in southwest China, we calculate the emitted VOC concentrations during both nighttime and daytime in summer. These emitted VOC concentrations are compared with the ambient concentrations in terms of their OFP. Because the emitted VOC concentrations are directly linked to MIR values, this novel method substantially enhances the accurate identification of the key VOC species in O3 formation. The emitted concentrations of alkenes and aromatics are significantly higher than the ambient concentrations. In contrast, because of the secondary production, the emitted OVOC concentrations are lower than the ambient ones. Based on the emitted VOC concentrations, the top three species contributing to the OFP are cis-2-butene, isoprene, and m,p-xylene at Deyang; m,p-xylene, acetaldehyde, and isoprene at Chengdu; and isoprene, ethylene, and acetaldehyde at Meishan. These results emphasize the importance of isoprene in O3 formation and differ from those based on ambient concentrations. While many current environmental policies focus on reducing emissions of non-isoprene alkenes and aromatics, our study shows that isoprene emissions are also important. Therefore, the control of isoprene emissions should be considered in the mitigation of O3 pollution. Our study provides new insights into improving the scientific understanding of the VOC emissions and their secondary transformations and serves as a reference for managing key VOC species in future control strategies.
The code and research data can be accessed by contacting the corresponding author (sdxie@pku.edu.cn).
The details of the three VOC monitoring sites, the calculation parameters used for determining the emitted VOC concentrations, and the OFP contributions from different VOC chemical groups are provided. The supplement related to this article is available online at https://doi.org/10.5194/acp-25-3807-2025-supplement.
XZ conceived the idea for the protocol and experimental design under the guidance of SX. All authors contributed to the collection of observations. XZ wrote, revised, and proofread the manuscript.
The contact author has declared that neither of the authors has any competing interests.
Publisher's note: Copernicus Publications remains neutral with regard to jurisdictional claims made in the text, published maps, institutional affiliations, or any other geographical representation in this paper. While Copernicus Publications makes every effort to include appropriate place names, the final responsibility lies with the authors.
This study is supported by the National Key Research and Development Program of China (grant no. 2023YFC3709302).
This study is supported by the National Key Research and Development Program of China (grant no. 2023YFC3709302).
This paper was edited by Benjamin A Nault and reviewed by three anonymous referees.
Atkinson, R.: Atmospheric chemistry of VOCs and NOx, Atmos. Environ., 34, 2063–2101, https://doi.org/10.1016/s1352-2310(99)00460-4, 2000.
Atkinson, R. and Arey, J.: Atmospheric degradation of volatile organic compounds, Chem. Rev., 103, 4605–4638, https://doi.org/10.1021/cr0206420, 2003.
Birdsall, A. W. and Elrod, M. J.: Comprehensive NO-dependent study of the products of the oxidation of atmospherically relevant aromatic compounds, J. Phys. Chem. A, 115, 5397–5407, https://doi.org/10.1021/jp2010327, 2011.
Brown, S. S. and Stutz, J.: Nighttime radical observations and chemistry, Chem. Soc. Rev., 41, 6405–6447, https://doi.org/10.1039/c2cs35181a, 2012.
Brown, S. S., Dubé, W. P., Fuchs, H., Ryerson, T. B., Wollny, A. G., Brock, C. A., Bahreini, R., Middlebrook, A. M., Neuman, J. A., Atlas, E., Roberts, J. M., Osthoff, H. D., Trainer, M., Fehsenfeld, F. C., and Ravishankara, A. R.: Reactive uptake coefficients for N2O5 determined from aircraft measurements during the Second Texas Air Quality Study: comparison to current model parameterizations, J. Geophys. Res.-Atmos., 114, D00F10, https://doi.org/10.1029/2008jd011679, 2009a.
Brown, S. S., de Gouw, J. A., Warneke, C., Ryerson, T. B., Dubé, W. P., Atlas, E., Weber, R. J., Peltier, R. E., Neuman, J. A., Roberts, J. M., Swanson, A., Flocke, F., McKeen, S. A., Brioude, J., Sommariva, R., Trainer, M., Fehsenfeld, F. C., and Ravishankara, A. R.: Nocturnal isoprene oxidation over the Northeast United States in summer and its impact on reactive nitrogen partitioning and secondary organic aerosol, Atmos. Chem. Phys., 9, 3027–3042, https://doi.org/10.5194/acp-9-3027-2009, 2009b.
Calvert, J. G., Orlando, J. J., Stockwell, W. R., and Wallington, T. J.: The mechanisms of reactions influencing atmospheric ozone, Oxford Univ. Press, New York, https://doi.org/10.1093/oso/9780190233020.001.0001, 2015.
Cardelino, C. A. and Chameides, W. L.: An observation-based model for analyzing ozone precursor relationships in the urban atmosphere, J. Air Waste Manage., 45, 161–180, https://doi.org/10.1080/10473289.1995.10467356, 1995.
Carter, W. P. L.: Development of ozone reactivity scales for volatile organic compounds, Air Waste, 44, 881–899, https://doi.org/10.1080/1073161x.1994.10467290, 1994.
Chen, M. L., Wang, S. N., Chen, T. S., Zhu, B., Peng, C., Zhou, J. W., Che, H. X., Huang, R. H., Yang, F. M., Liu, H. F., Tan, Q. W., Han, L., Chen, J. H., Lu, K. D., Chen, Y.: Source analysis of atmospheric oxygenated volatile organic compounds in the typical regions of Southwest China during the summer, Environ. Sci., 42, 2648–2658, https://doi.org/10.13227/j.hjkx.202010101, 2021.
Carter, W. P. L.: Development of the SAPRC-07 chemical mechanism, Atmos. Environ., 44, 5324–5335, https://doi.org/10.1016/j.atmosenv.2010.01.026, 2010.
Carter, W. P. L., Pierce, J. A., Luo, D., and Malkina, I. L.: Environmental chamber study of maximum incremental reactivities of volatile organic compounds, Atmos. Environ., 29, 2499–2511, https://doi.org/10.1016/1352-2310(95)00149s, 1995.
de Gouw, J. A., Gilman, J. B., Kim, S. W., Lerner, B. M., Isaacman-VanWertz, G., McDonald, B. C., Warneke, C., Kuster, W. C., Lefer, B. L., Griffith, S. M., Dusanter, S., Stevens, P. S., and Stutz, J.: Chemistry of volatile organic compounds in the Los Angeles Basin: nighttime removal of alkenes and determination of emission ratios, J. Geophys. Res.-Atmos., 122, 11843–11861, https://doi.org/10.1002/2017jd027459, 2017.
de Gouw, J. A., Middlebrook, A. M., Warneke, C., Goldan, P. D., Kuster, W. C., Roberts, J. M., Fehsenfeld, F. C., Worsnop, D. R., Canagaratna, M. R., Pszenny, A. A. P., Keene, W. C., Marchewka, M., Bertman, S. B., and Bates, T. S.: Budget of organic carbon in a polluted atmosphere: results from the New England air quality study in 2002, J. Geophys. Res.- Atmos., 110, D16305, https://doi.org/10.1029/2004JD005623, 2005.
de Gouw, J. A., Gilman, J. B., Kim, S. W., Alvarez, S. L., Dusanter, S., Graus, M., Griffith, S. M., Isaacman-VanWertz, G., Kuster, W. C., Lefer, B. L., Lerner, B. M., McDonald, B. C., Rappenglück, B., Roberts, J. M., Stevens, P. S., Stutz, J., Thalman, R., Veres, P. R., Volkamer, R., Warneke, C., Washenfelder, R. A., and Young, C. J.: Chemistry of volatile organic compounds in the Los Angeles Basin: formation of oxygenated compounds and determination of emission ratios, J. Geophys. Res.-Atmos., 123, 2298–2319, https://doi.org/10.1002/2017jd027976, 2018.
Deng, Y. Y., Li, J., Li, Y. Q., Wu, R. R., and Xie, S. D.: Characteristics of volatile organic compounds, NO2, and effects on ozone formation at a site with high ozone level in Chengdu, J. Environ. Sci., 75, 334–345, https://doi.org/10.1016/j.jes.2018.05.004, 2019.
Derwent, R. G., Jenkin, M. E., Passant, N. R., and Pilling, M. J.: Reactivity-based strategies for photochemical ozone control in Europe, Environ. Sci. Policy, 10, 445–453, https://doi.org/10.1016/j.envsci.2007.01.005, 2007.
Derwent, R. G., Jenkin, M. E., Saunders, S. M., and Pilling, M. J.: Photochemical ozone creation potentials for organic compounds in northwest Europe calculated with a master chemical mechanism, Atmos. Environ., 32, 2429–2441, https://doi.org/10.1016/s1352-2310(98)00053-3, 1998.
Finlayson-Pitts, B. J. and Pitts, J. N. J.: Tropospheric air pollution: ozone, airborne toxics, polycyclic aromatic hydrocarbons, and particles, Science, 276, 1045–1052, https://doi.org/10.1126/science.276.5315.1045, 1997.
Finlayson-Pitts, B. J. and Pitts, J. N. J.: Chemistry of the upper and lower atmosphere: theory, experiments, and applications, Academic Press, San Diego, https://doi.org/10.1016/B978-0-12-257060-5.X5000-X, 130–267, 2000.
Fry, J. L., Brown, S. S., Middlebrook, A. M., Edwards, P. M., Campuzano-Jost, P., Day, D. A., Jimenez, J. L., Allen, H. M., Ryerson, T. B., Pollack, I., Graus, M., Warneke, C., de Gouw, J. A., Brock, C. A., Gilman, J., Lerner, B. M., Dubé, W. P., Liao, J., and Welti, A.: Secondary organic aerosol (SOA) yields from NO3 radical + isoprene based on nighttime aircraft power plant plume transects, Atmos. Chem. Phys., 18, 11663–11682, https://doi.org/10.5194/acp-18-11663-2018, 2018.
Gkatzelis, G. I., Coggon, M. M., McDonald, B. C., Peischl, J., Gilman, J. B., Aikin, K. C., Robinson, M. A., Canonaco, F., Prevot, A. S. H., Trainer, M., and Warneke, C.: Observations confirm that volatile chemical products are a major source of petrochemical emissions in U. S. cities, Environ. Sci. Tech. Let., 55, 4332–4343, https://doi.org/10.1021/acs.est.0c05471, 2021.
Haagen-Smit, A. J. and Fox, M. M.: Ozone formation in photochemical oxidation of organic substances, Ind. Eng. Chem., 48, 1484–1487, https://doi.org/10.1021/ie51400a033, 1956.
He, Z., Wang, X., Ling, Z., Zhao, J., Guo, H., Shao, M., and Wang, Z.: Contributions of different anthropogenic volatile organic compound sources to ozone formation at a receptor site in the Pearl River Delta region and its policy implications, Atmos. Chem. Phys., 19, 8801–8816, https://doi.org/10.5194/acp-19-8801-2019, 2019.
Huang, X. F., Zhang, B., Xia, S. Y., Han, Y., Wang, C., Yu, G. H., and Feng, N.: Sources of oxygenated volatile organic compounds (OVOCs) in urban atmospheres in north and south China, Environ. Pollut., 261, 114152, https://doi.org/10.1016/j.envpol.2020.114152, 2020.
Jacob, D. J. and Winner, D. A.: Effect of climate change on air quality, Atmos. Environ., 43, 51–63, https://doi.org/10.1016/j.atmosenv.2008.09.051, 2009.
Jacob, D. J., Field, B. D., Jin, E. M., Bey, I., Li, Q., Logan, J. A., Yantosca, R. M., and Singh, H. B.: Atmospheric budget of acetone, J. Geophys. Res.-Atmos., 107, D10, https://doi.org/10.1029/2001jd000694, 2002.
Kong, L., Zhou, L., Chen, D. Y., Luo, L., Xiao, K., Chen, Y., Liu, H. F., Tan, Q. W., and Yang, F. M.: Atmospheric oxidation capacity and secondary pollutant formation potentials based on photochemical loss of VOCs in a megacity of the Sichuan Basin, China, Sci. Total Environ., 901, 166259, https://doi.org/10.1016/j.scitotenv.2023.166259, 2023.
Li, Z. J., He, L. Y., Ma, H. N., Peng, X., Tang, M. X., Du, K., and Huang, X. F.: Sources of atmospheric oxygenated volatile organic compounds in different air masses in Shenzhen, China, Environ. Pollut., 340, 122871, https://doi.org/10.1016/j.envpol.2023.122871, 2023.
Lyu, X. P., Li, H. Y., Lee, S. C., Xiong, E. Y., Guo, H., Wang, T., and de Gouw, J.: Significant biogenic source of oxygenated volatile organic compounds and the impacts on photochemistry at a regional background site in south China, Environ. Sci. Technol., 58, 20081–20090, https://doi.org/10.1021/acs.est.4c05656, 2024.
Ma, W., Feng, Z., Zhan, J., Liu, Y., Liu, P., Liu, C., Ma, Q., Yang, K., Wang, Y., He, H., Kulmala, M., Mu, Y., and Liu, J.: Influence of photochemical loss of volatile organic compounds on understanding ozone formation mechanism, Atmos. Chem. Phys., 22, 4841–4851, https://doi.org/10.5194/acp-22-4841-2022, 2022.
Mo, Z. W., Huang, S., Yuan, B., Pei, C. L., Song, Q. C., Qi, J. P., Wang, M., Wang, B. L., Wang, C., and Shao, M.: Tower-based measurements of NMHCs and OVOCs in the Pearl River Delta: vertical distribution, source analysis and chemical reactivity, Environ. Pollut., 292, 118454, https://doi.org/10.1016/j.envpol.2021.118454, 2021.
Paulot, F., Crounse, J. D., Kjaergaard, H. G., Kurten, A., St Clair, J. M., Seinfeld, J. H., and Wennberg, P. O.: Unexpected epoxide formation in the gas-phase photooxidation of isoprene, Science, 325, 730–733, https://doi.org/10.1126/science.1172910, 2009.
Roberts, J. M., Fehsenfeld, F. C., Liu, S. C., Bollinger, M. J., Hahn, C., Albritton, D. L., and Sievers, R. E.: Measurements of aromatic hydrocarbon ratios and NOx concentrations in the rural troposphere: observation of air mass photochemical aging and NOx removal, Atmos. Environ., 18, 2421–2432, https://doi.org/10.1016/0004-6981(84)90012-X, 1984.
Saunders, S. M., Jenkin, M. E., Derwent, R. G., and Pilling, M. J.: Protocol for the development of the Master Chemical Mechanism, MCM v3 (Part A): tropospheric degradation of non-aromatic volatile organic compounds, Atmos. Chem. Phys., 3, 161–180, https://doi.org/10.5194/acp-3-161-2003, 2003.
Seinfeld, J. H. and Pandis, S. N.: Atmospheric chemistry and physics: from air pollution to climate change, Wiley, New York, ISBN 978-1-118-94740-1, 2016.
Shao, M., Wang, B., Lu, S. H., Yuan, B., and Wang, M.: Effects of Beijing Olympics control measures on reducing reactive hydrocarbon species, Environ. Sci. Technol., 45, 514–519, https://doi.org/10.1021/es102357t, 2011.
Shao, M., Lu, S. H., Liu, Y., Xie, X., Chang, C. C., Huang, S., and Chen, Z. M.: Volatile organic compounds measured in summer in Beijing and their role in ground-level ozone formation, J. Geophys. Res.-Atmos., 114, D00G06, https://doi.org/10.1029/2008jd010863, 2009.
Song, M. D., Tan, Q. W., Feng, M., Qu, Y., Liu, X. G., An, J. L., and Zhang, Y. H.: Source apportionment and secondary transformation of atmospheric nonmethane hydrocarbons in Chengdu, southwest China, J. Geophys. Res.-Atmos., 123, 9741–9763, https://doi.org/10.1029/2018jd028479, 2018.
Stroud, C. A., Roberts, J. M., Goldan, P. D., Kuster, W. C., Murphy, P. C., Williams, E. J., Hereid, D., Parrish, D., Sueper, D., Trainer, M., Fehsenfeld, F. C., Apel, E. C., Riemer, D., Wert, B., Henry, B., Fried, A., Martinez-Harder, M., Harder, H., Brune, W. H., Li, G., Xie, H., and Young, V. L.: Isoprene and its oxidation products, methacrolein and methyl vinyl ketone, at an urban forested site during the 1999 southern oxidants study, J. Geophys. Res.-Atmos., 106, 8035–8046, https://doi.org/10.1029/2000jd900628, 2001.
Tan, Q. W., Zhou, L., Liu, H. F., Feng, M., Qiu, Y., Yang, F. M., Jiang, W. J., and Wei, F. S.: Observation-based summer O3 control effect evaluation: a case study in Chengdu, a megacity in Sichuan Basin, China, Atmosphere-Basel, 11, 1278, https://doi.org/10.3390/atmos11121278, 2020a.
Tan, Q. W., Liu, H. F., Xie, S. D., Zhou, L., Song, T. L., Shi, G. M., Jiang, W. J., Yang, F. M., and Wei, F. S.: Temporal and spatial distribution characteristics and source origins of volatile organic compounds in a megacity of Sichuan Basin, China, Environ. Res., 185, 109478, https://doi.org/10.1016/j.envres.2020.109478, 2020b.
Tan, Z. F., Lu, K. D., Jiang, M. Q., Su, R., Dong, H. B., Zeng, L. M., Xie, S. D., Tan, Q. W., and Zhang, Y. H.: Exploring ozone pollution in Chengdu, southwestern China: a case study from radical chemistry to O3-VOC-NOx sensitivity, Sci. Total Environ., 636, 775–786, https://doi.org/10.1016/j.scitotenv.2018.04.286, 2018.
Wang, D. C., Zhou, J. B., Han, L., Tian, W. N., Wang, C. H., Li, Y. J., and Chen, J. H.: Source apportionment of VOCs and ozone formation potential and transport in Chengdu, China, Atmos. Pollut. Res., 14, 101730, https://doi.org/10.1016/j.apr.2023.101730, 2023.
Wennberg, P. O., Bates, K. H., Crounse, J. D., Dodson, L. G., McVay, R. C., Mertens, L. A., Nguyen, T. B., Praske, E., Schwantes, R. H., Smarte, M. D., St Clair, J. M., Teng, A. P., Zhang, X., and Seinfeld, J. H.: Gas-phase reactions of isoprene and its major oxidation products, Chem. Rev., 118, 3337–3390, https://doi.org/10.1021/acs.chemrev.7b00439, 2018.
Wu, C., Wang, C., Wang, S., Wang, W., Yuan, B., Qi, J., Wang, B., Wang, H., Wang, C., Song, W., Wang, X., Hu, W., Lou, S., Ye, C., Peng, Y., Wang, Z., Huangfu, Y., Xie, Y., Zhu, M., Zheng, J., Wang, X., Jiang, B., Zhang, Z., and Shao, M.: Measurement report: Important contributions of oxygenated compounds to emissions and chemistry of volatile organic compounds in urban air, Atmos. Chem. Phys., 20, 14769–14785, https://doi.org/10.5194/acp-20-14769-2020, 2020.
Wu, R. R. and Xie, S. D.: Spatial distribution of ozone formation in China derived from emissions of speciated volatile organic compounds, Environ. Sci. Technol., 51, 2574–2583, https://doi.org/10.1021/acs.est.6b03634, 2017.
Xia, S. Y., Wang, C., Zhu, B., Chen, X., Feng, N., Yu, G. H., and Huang, X. F.: Long-term observations of oxygenated volatile organic compounds (OVOCs) in an urban atmosphere in southern China, 2014–2019, Environ. Pollut., 270, 116301, https://doi.org/10.1016/j.envpol.2020.116301, 2020.
Xiong, C., Wang, N., Zhou, L., Yang, F. M., Qiu, Y., Chen, J. H., Han, L., and Li, J. J.: Component characteristics and source apportionment of volatile organic compounds during summer and winter in downtown Chengdu, southwest China, Atmos. Environ., 258, 118485, https://doi.org/10.1016/j.atmosenv.2021.118485, 2021.
Yang, X. P., Lu, K. D., Ma, X. F., Liu, Y. H., Wang, H. C., Hu, R. Z., Li, X., Lou, S. R., Chen, S. Y., Dong, H. B., Wang, F. Y., Wang, Y. H., Zhang, G. X., Li, S. L., Yang, S. D., Yang, Y. M., Kuang, C. L., Tan, Z. F., Chen, X. R., Qiu, P. P., Zeng, L. M., Xie, P. H., and Zhang, Y. H.: Observations and modeling of OH and HO2 radicals in Chengdu, China in summer 2019, Sci. Total Environ., 772, 144829, https://doi.org/10.1016/j.scitotenv.2020.144829, 2021.
Zhan, J. L., Ma, W., Song, B. Y., Wang, Z. C., Bao, X. L., Xie, H. B., Chu, B. W., He, H., Jiang, T., and Liu, Y. C.: The contribution of industrial emissions to ozone pollution: identified using ozone formation path tracing approach, NPJ Clim. Atmos. Sci., 6, 37, https://doi.org/10.1038/s41612-023-00366-7, 2023.
Zheng, X. D., Ren, J., Hao, Y. F., and Xie, S. D.: Weekend-weekday variations, sources, and secondary transformation potential of volatile organic compounds in urban Zhengzhou, China, Atmos. Environ., 300, 119679, https://doi.org/10.1016/j.atmosenv.2023.119679, 2023.
Zhu, J., Wang, S., Wang, H., Jing, S., Lou, S., Saiz-Lopez, A., and Zhou, B.: Observationally constrained modeling of atmospheric oxidation capacity and photochemical reactivity in Shanghai, China, Atmos. Chem. Phys., 20, 1217–1232, https://doi.org/10.5194/acp-20-1217-2020, 2020.
Zou, Y., Guan, X. H., Flores, R. M., Yan, X. L., Fan, L. Y., Deng, T., Deng, X. J., and Ye, D. Q.: Revealing the influencing factors of an oxygenated volatile organic compounds (OVOCs) source apportionment model: a case study of a dense urban agglomeration in the winter, J. Geophys. Res.-Atmos., 129, e2023JD039401, https://doi.org/10.1029/2023jd039401, 2024.