the Creative Commons Attribution 4.0 License.
the Creative Commons Attribution 4.0 License.
 | 27 Mar 2025
Spatiotemporal variations of stratospheric aerosol size between 2002 and 2005 from measurements with SAGE III/M3M
Felix Wrana
Terry Deshler
Christian Löns
Larry W. Thomason
Christian von Savigny
Stratospheric aerosol size distribution parameters are derived from the multiple-wavelength aerosol extinction retrievals of the SAGE III/M3M instrument (Stratospheric Aerosol and Gas Experiment III on the Russian satellite Meteor-3M) and analyzed for their evolution between 2002 and 2005. The broad wavelength spectrum of the measurements enables us to derive all three parameters within an assumed monomodal lognormal size distribution. The 2002–2005 stratospheric aerosol layer was mostly at close to background conditions but included three moderate-magnitude tropical volcanic eruptions (Ruang, Reventador, and Manam). The SAGE III/M3M instrument measured only at middle and high latitudes, but derived particle size distribution (PSD) parameters indicate a reduction in particle size and an increase in particle number concentration after all three eruptions. In addition to this likely volcanic effect on the PSD, an influence of seasonal polar winter condensation events including meteoric smoke particles on the derived aerosol size is possible, especially due to the long-lasting low stratospheric temperatures during the northern winters of 2002/2003 and 2004/2005. During the same winters, polar stratospheric clouds (PSCs) were likely observed by the instrument. A comparison of the derived stratospheric aerosol size dataset with balloon-borne in situ measurements in Kiruna, Sweden, shows generally good agreement, but there are systematic differences below roughly 15 km altitude. Finally, the effect of the necessary assumption of a PSD shape on the aerosol size derivation with remote sensing instruments is shown and discussed.
- Article
(8953 KB) - Full-text XML
- BibTeX
- EndNote


In the lower stratosphere there is a global and permanent layer of aerosol particles (Solomon et al., 2011; Kremser et al., 2016) roughly between 15 and 30 km altitude. The stratospheric aerosol layer was first measured from high-altitude balloon soundings in 1957 (Junge et al., 1961b, a) and is called the Junge layer. The aerosols were subsequently found to be liquid droplets mostly composed of sulfuric acid and water, sometimes containing traces of other components such as meteoric and carbonaceous material (Rosen, 1971; Murphy et al., 2013; Kremser et al., 2016).
Stratospheric aerosols have effects on the chemistry of the stratosphere by providing surfaces for heterogeneous reactions, which is important in, e.g., ozone chemistry (Hofmann and Solomon, 1989; Gleason et al., 1993; Deshler, 2008). Furthermore, they affect Earth's radiation budget by scattering shortwave radiation and absorbing and emitting longwave radiation. This way stratospheric aerosols warm the stratosphere and cool the Earth's surface (Lacis et al., 1992).
In unperturbed background conditions the Junge layer is maintained through a more or less continuous flux of sulfur-containing precursor gases from the troposphere, such as sulfur dioxide (SO2) and most importantly carbonyl sulfide (OCS), which are eventually oxidized to sulfuric acid (Kremser et al., 2016), forming small droplets through co-condensation with water vapor (Curtius, 2006). However, the variability of the stratospheric aerosol layer is dominated by explosive volcanic eruptions, injecting large amounts of SO2 directly into the stratosphere. In recent years, large wildfires have also had a significant effect on the stratosphere (Ansmann et al., 2018; Ohneiser et al., 2022; Thomason et al., 2023). Through their emissions, volcanic eruptions and wildfires can strongly change the number concentration as well as the sizes of stratospheric aerosols. This is of great importance, since the chemical and the radiative effects of the aerosol particles depend on their particle size distribution (PSD). This is why we need to understand the variability of stratospheric aerosol size, especially after volcanic eruptions (Robock, 2015), and how long any perturbations can be expected to last. There are multiple methods to investigate the size of stratospheric aerosols, each with their own advantages and disadvantages. In situ measurements, e.g., balloon-borne or by aircraft, provide the most reliable characterization of both the composition and PSD of stratospheric aerosol. A high resolution is possible in terms of both altitude and particle radius. However, they can only provide sparse temporal and spatial sampling of the atmosphere.
This is where remote sensing satellite measurements come in. With satellite instruments it is possible to achieve near-global coverage, depending on orbit and measurement geometry. This is important for the investigation of trends and seasonal variability of stratospheric aerosols, for the observation of large-scale perturbations caused by volcanic eruptions and wildfires, and for the validation of, e.g., climate models. However, there are only a very limited number of satellite missions suited for high-quality observations of stratospheric aerosols. And again, each of these missions has its own strengths and weaknesses. Limb scattering instruments, such as OMPS-LP (Flynn et al., 2014; Taha et al., 2020; Rozanov et al., 2024), OSIRIS (Llewellyn et al., 2004; Bourassa et al., 2008), and SCIAMACHY (Bovensmann et al., 1999; Pohl et al., 2024), have the advantage of a high measurement frequency and almost global daily coverage. But they suffer from (1) the necessity to make assumptions about the stratospheric aerosol size distribution before being able to retrieve information about the aerosol extinction and the particle size, (2) the complicated light paths that have to be considered in radiative transfer models, and (3) resulting issues with, for example, the surface albedo and differing data quality depending on the scattering angle. Satellite solar occultation measurements, where the attenuation of the solar radiation is measured by looking through the atmosphere and into the Sun, have much less frequent opportunities to perform measurements, since those are tied to the orbit of the instrument and the setting and rising of the Sun behind the atmosphere from the point of view of the instrument. Typically, a few tens of profiles are measured per day. However, solar occultation measurements have a couple of advantages that make them especially well suited for the investigation of stratospheric aerosol size: the high signal strength of the Sun allows a small field of view, which results in a good vertical resolution being possible. The measurements are inherently self-calibrating, since a measurement of the solar spectrum unaffected by the atmosphere can be taken each orbit, minimizing the problem of long-term drift in the data over the time of the instrument's mission. Finally, the solar occultation geometry facilitates a straightforward way to retrieve the aerosol extinction, without assumptions about the aerosol PSD being necessary (McCormick, 1987).
In this work, the variability of the stratospheric aerosol size is investigated using the multiple-wavelength aerosol extinction retrievals of the Stratospheric Aerosol and Gas Experiment III on the Russian satellite Meteor-3M (SAGE III/M3M). With its measurements between 2002 and 2005 the SAGE III/M3M mission covers a valuable time frame. This is because the years after 2000 represent the only time frame to date within the satellite measurement era, i.e., since the late 1970s, that was close to background conditions and was characterized by relatively steady aerosol extinction levels (Deshler et al., 2006; Thomason et al., 2008). For the ongoing successor mission to SAGE III/M3M, SAGE III/ISS, which started in 2017, the stratosphere has been characterized by a state of perpetual perturbation due to different volcanic and wildfire events. The predecessor to SAGE III/M3M, on the other hand, SAGE II, which covered the long time frame between 1984 and 2005, did indeed cover some volcanically more quiescent periods. However, the much narrower spectral range of SAGE II restricted the possibility of unambiguous aerosol size derivation, as discussed in Wrana et al. (2023). The wider spectral range of the SAGE III/M3M measurements, on the other hand, facilitates the application of the size derivation algorithm described in Wrana et al. (2021) (see Sect. 2.2), allowing for a more robust characterization of stratospheric aerosol size during background conditions. Additionally, high latitudes that are otherwise not often covered are observed by the SAGE III/M3M measurements, especially in the Northern Hemisphere.
After introducing the main instruments and methods in Sect. 2, the evolution of the stratospheric aerosol size between 2002 and 2005 as well as some phenomena related to the high winter latitudes will be discussed in Sect. 3. Finally, after the derived dataset of this work is compared to in situ data in Sect. 4, an issue regarding the assumed PSD shape that is relevant for the presented dataset as well as for remote sensing aerosol size derivation in general will be discussed in Sect. 5.
2.1 SAGE III/M3M instrument
The solar (and lunar) occultation instrument SAGE III/M3M was launched in December 2001 and was operating and providing measurement data between February 2002 and November 2005 (Thomason and Taha, 2003). It is the successor of the SAM II, SAGE I, and SAGE II satellite instruments and was later followed by the SAGE III/ISS instrument. SAGE III/M3M gathered information on essentially the same range of different atmospheric constituents as SAGE-II (see McCormick, 1987): water vapor, O3, NO2, and stratospheric aerosol.
Mounted on the Meteor-3M weather satellite, SAGE III/M3M was in a Sun-synchronous orbit with an inclination of 99.5° (Roberts et al., 1996). Due to the platform's orbit around 15 sunrise and 15 sunset events were observed by the instrument in 24 h, and the sunrise and sunset measurements ended up happening in different hemispheres, as depicted in Fig. 1. Sunrise and sunset here refer to orbital sunrise and sunset, i.e., as seen from the instrument, rather than local sunrise and sunset. Sunrise and sunset here refer to the Sun rising or setting behind the Earth from the point of view of the satellite during its orbit. The sunrise measurements oscillate between roughly 35 and 60° S, while the sunset measurements cover the northern latitudes between approximately 40 and 80° N. The data quality of sunrise and sunset measurements is likely very similar.
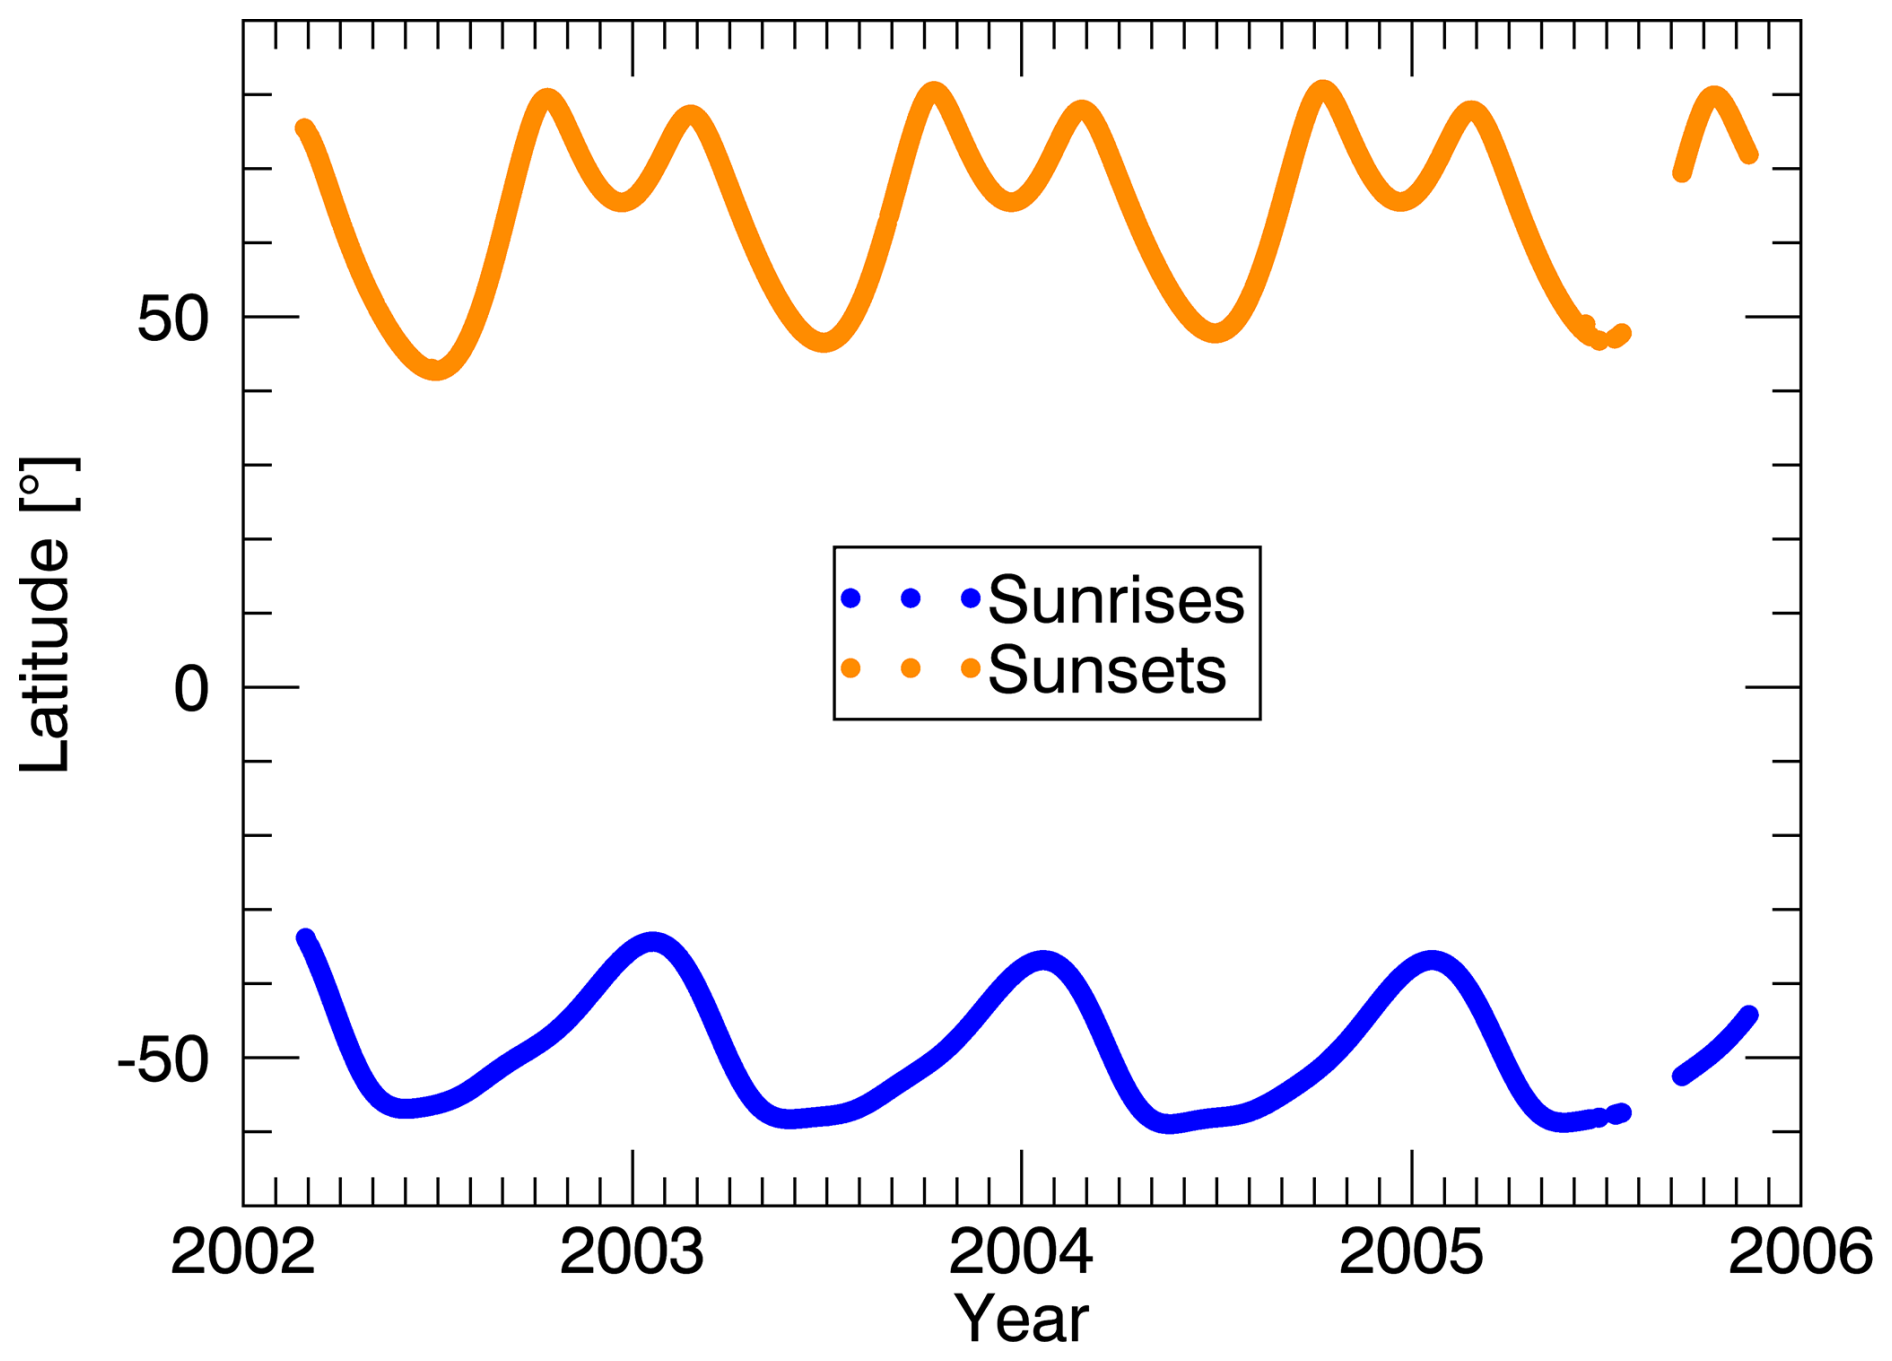
Figure 1Coverage of geographical latitude by the SAGE III/M3M solar occultation measurements over the course of its mission. Sunrise events (blue dots) were only observed in the Southern Hemisphere, while sunset events (red dots) were observed in the Northern Hemisphere.
For a solar occultation measurement a scanning mirror was used to follow the Sun's perceived ascent or descent from or towards the horizon as well as to scan across the Sun's surface and produce multiple samples at each tangent altitude. After passing the neutral density filter and the science aperture, which defines the instantaneous field of view (IFOV) of the instrument, the solar radiation reaches the grating spectrometer and the detectors. Those consist of a CCD array covering the wavelengths from 280 to 1040 nm with a spectral resolution of 1 to 2 nm and an indium gallium arsenide (InGaAs) infrared photodiode around 1550 nm with a 30 nm bandwidth (SAGE III ATDB Team, 2002; NASA/LARC/SD/ASDC, 2004). Aerosol extinction is retrieved from the calculated line-of-sight transmission profiles by removing the effects of Rayleigh scattering due to air molecules, ozone absorption, and NO2 absorption (Thomason et al., 2010). In the SAGE III/M3M dataset, the aerosol extinction coefficients are then provided between 0 and 40 km altitude in 0.5 km steps for nine different wavelength channels between 384 and 1545 nm. This is the main dataset used for the stratospheric aerosol size derivation of this work. Version 4 of the SAGE III/M3M level 2 solar occultation data is used (NASA/LARC/SD/ASDC, 2009).
Thomason et al. (2010) evaluated the aerosol extinction coefficient channels of SAGE III/M3M based on comparisons to other satellite instruments as well as internal consistency. The channels at 449, 520, 755, 869, and 1021 nm are assessed to be reliable and have accuracies and precisions of around 10 % between 15 and 25 km. The same applies to the 1545 nm channel, although a bias below 15 km cannot be excluded. The 385 nm channel is only recommended for use above 16 km altitude. The 601 nm channel has a much lower precision (∼ 20 %) due to the influence of ozone absorption, and it is generally recommended not to use the 676 nm extinction coefficients. In this work, the channels 449, 755, and 1545 nm are used for the stratospheric aerosol size parameter derivation, as will be explained in more detail in Sect. 2.2.
2.2 Aerosol size derivation method
The SAGE III/M3M multiple-wavelength aerosol extinction dataset is used in this work to derive parameters describing the size distribution of stratospheric aerosol particles. This is done by comparing the aerosol extinction data provided in the measurement dataset with a lookup table that was calculated using Mie theory (Mie, 1908). This aerosol size derivation method is similar to the original methods for deriving size parameters from SAGE-II (see Yue et al., 1986, 1995), adapted for the larger range of wavelengths covered by the SAGE III aerosol extinction channels. It was used also in Wrana et al. (2023) and is described in detail in Wrana et al. (2021).
There are a number of assumptions within the PSD parameters derived this way from SAGE III/M3M, which must be considered when interpreting the results. Firstly, it is assumed that the PSD of stratospheric aerosol can be described well by a monomodal lognormal size distribution, which is defined as follows:
In this form, there are three parameters that together describe the aerosol particle size distribution: the median radius rmed, the geometric standard deviation σg, and the total number density N0. At least after the strong Pinatubo eruption from 1991 a bimodal lognormal function yielded a better representation of the observed aerosol size distribution than a monomodal lognormal function in balloon-borne in situ measurements (Deshler, 2008). Despite this, monomodality is a common assumption when deriving stratospheric aerosol size distributions from satellite measurements because it can often be a good model of the true conditions. Additionally, Knepp et al. (2024) showed that deriving bimodal lognormal PSD parameters from SAGE data is infeasible, stating that “[...] there is not enough information within the SAGE extinction spectra to sufficiently constrain the solution space to accurately infer bimodal PSD parameters”. Still, a monomodal lognormal distribution can be inadequate in some cases. The effect this would have on the size derivation of this work is described in Sect. 5.
Furthermore, it is assumed that the individual droplets of stratospheric aerosol are spherical, which is a prerequisite for Mie theory to be applicable. Since stratospheric aerosol particles are mostly liquid droplets of sulfuric acid and water with a very small size, usually well below 2 µm (Sugita et al., 1999; Deshler et al., 2003a; Deshler, 2008; Li et al., 2023), the assumption is realistic.
The basis of the method used to derive aerosol size in this work is the lookup table that is calculated using a Mie code (EODG, 2018). It consists of aerosol extinction ratios at the wavelengths 449 755 nm and 1545 755 nm, both calculated for many combinations of different theoretically plausible values of the median radius and the geometric standard deviation σg. The value range covered this way by the lookup table is 1 to 1000 nm for the median radius and 1.05 to 2.0 for σg. The real and imaginary refractive indices necessary for the Mie calculations are taken from Palmer and Williams (1975) and adjusted for temperature using Lorentz–Lorenz corrections as described by Steele and Hamill (1981). The three wavelengths that are used by the two extinction ratios are chosen to match three of the spectral channels of the SAGE III/M3M instrument, at which aerosol extinction coefficients are provided. As already stated in the previous section, these SAGE III/M3M spectral channels (449, 755, 1545 nm) in turn were chosen because they make use of the wide spectral range of the instrument while also only including reliable aerosol extinction channels (Thomason et al., 2010). Now that the lookup table is prepared, the median radius and geometric standard deviation value can be derived from a given set of extinction ratios from the measurements via interpolation of the lookup table values. More detailed information on the size derivation approach is provided in Wrana et al. (2021).
The median radius and geometric standard deviation can be derived independently of the total number density N0 because the latter cancels out when forming the extinction ratios. The number density can be calculated after obtaining rmed and σg through the following relation:
Here, kext(λ) is the measured extinction coefficient and σext(λ) is the extinction cross section at wavelength λ simulated from the derived median radius and geometric standard deviation values. The number density values shown in this work were calculated at λ = 755 nm; differences between this and results calculated at 449 or 1545 nm are negligible, however.
Another useful quantity that can be calculated from the derived PSD parameters is the aerosol particle effective radius (reff), which is the area-weighted mean radius (Grainger, 2023). Since larger aerosol particles scatter light more strongly in the relevant size range it is more indicative of the part of the PSD that is responsible for most of the aerosol radiative effect. It can be calculated from rmed and σg or from the aerosol volume density V and surface area density A in the following way:
Lastly, the absolute mode width ω, as introduced by Malinina et al. (2018), is a very useful parameter to understand how wide the PSD is in linear radius space. It provides the variation in nanometers, with variations then easier to interpret than the geometric standard deviation σg, which only provides information about the width of the size distribution in logarithmic radius space and can therefore easily be misinterpreted. This is illustrated and explained in more detail in Wrana et al. (2023). The absolute mode width ω is calculated as follows:
Additionally, an accuracy parameter for the derived PSD parameters has been defined to be able to exclude less reliable data from the derived parameters. It relates the lookup table values to the propagated uncertainties of the extinction ratios and is described by Wrana et al. (2021). For all SAGE III/M3M aerosol size data shown here, data points with respective accuracy parameter values below 16 are excluded, as was done in Wrana et al. (2021, 2023). Over the whole dataset this filters out 35.9 % of the derived values overall, although it filters much less in the maximum of the Junge layer, e.g., only 11 % of data at the 18 km altitude level.
2.3 SAGE II instrument
SAGE II (Stratospheric Aerosol and Gas experiment II) was the predecessor to SAGE III/M3M. It was mounted on the Earth Radiation Budget Satellite (ERBS). Its mission spanned October 1984 to August 2005, i.e., having considerable overlap with the SAGE III/M3M mission. The platform was in an orbit at 610 km altitude with an inclination of 57° (McCormick, 1987; Thomason et al., 2008).
Like SAGE III/M3M, SAGE II also measured stratospheric aerosol, ozone, NO2, and water vapor through the use of the solar occultation geometry. Aerosol extinction coefficients are provided for the spectral channels at 386, 452, 525, and 1020 nm in 0.5 km steps between the Earth's surface and 40 km altitude. The aerosol extinction profiles were found to be reliable and robust during the time period covered by SAGE III/M3M with a bias lower than 20 % at 525 nm below 25 km altitude (Thomason et al., 2008). Due to the orbit parameters and the solar occultation geometry, roughly 30 profiles were measured per day. The instrument covered all latitudes between 80° N and 80° S, with a gradual daily shift in latitude of the sunrise and sunset measurements, respectively. In this work, version 7.0 of the SAGE II data in binary format (NASA/LARC/SD/ASDC, 2012) was used.
2.4 Kiruna OPC measurements
An optical particle counter (OPC) measures the number of aerosol particles with optical scattering signals above pre-set size thresholds. Such in situ observations have provided the ground truth for stratospheric aerosol satellite measurements (e.g., Deshler et al., 2003a) since the advent of the SAM-II and SAGE instruments (e.g., McCormick et al., 1979). Although PSD parameters can be derived from satellites, comparisons to in situ OPC measurements are required to validate and refine aspects of the techniques (e.g., Oberbeck et al., 1989; Hervig and Deshler, 2002). The University of Wyoming carried out balloon-borne in situ measurements using an OPC between 1990 and 2004 from Kiruna (68° N, 21° E), Sweden. Both the time frame and the location of the measurements open up the possibility of comparisons with the northern high-latitude sunset measurements of SAGE III/M3M.
The in situ measurements in Kiruna were carried out with two instruments: a size spectrometer and a total aerosol counter. The size spectrometer used was the Wyoming white-light optical particle counter (WOPC) (Hofmann and Deshler, 1989). Due to Rayleigh scattering and phototube background, only particles with radii larger than 150 nm can be measured. For the measurement, individual pulses of forward-scattered white light from single aerosol particles are measured at an angle of 40° relative to the incident light of the incandescent lamp. The scattered light is focused onto a pair of photomultiplier tubes (PMTs), which convert the photons to a voltage. Each voltage signal is compared to 12 voltage discriminators, each discriminator summing all particles producing voltages above that discriminator level. The discriminator levels are set to represent specific sizes based on the instrument counter response function and calibration using laboratory aerosol (Deshler et al., 2003a). Thus each size bin measures all particles above a certain size threshold. To reduce noise, only coincident PMT pulses from two independent but symmetrical photon paths were counted towards the integral particle concentrations. Air was pulled through the inlet with a flow rate of 10 L min−1. All Kiruna WOPC soundings analyzed here also included a separate measurement of the total aerosol number concentration of particles larger than 10 nm, often referred to as condensation nuclei (CN). This is achieved through the use of ethylene glycol vapor and a growth chamber, forcing aerosol particles larger than 10 nm to grow to optically detectable sizes via condensation of ethylene glycol. This effectively gives a measure of the total aerosol number density (Deshler and Oltmans, 1998; Norgren et al., 2024). By coupling the total aerosol number to the WOPC measurements, the measurements can be fitted with an assumed PSD to provide a means of comparison with satellite measurements that derive a smaller number of parameters. For this the WOPC data are fitted with both unimodal and bimodal lognormal PSDs (Deshler et al., 2019). For this work the unimodal or monomodal data of UWv2.0 are used (Deshler, 2023).
3.1 Temporal evolution of stratospheric aerosol size
In Figs. 2 and 3 the temporal evolution of some of the derived stratospheric aerosol particle size distribution parameters is illustrated. Figure 2 depicts the data from the Northern Hemisphere, i.e., the sunset measurements, while Fig. 3 corresponds to the Southern Hemisphere and the sunrise measurements. The data shown are daily zonal mean profiles combined over the whole SAGE III/M3M mission time span from 27 February 2002 to 12 November 2005. The topmost plot shows the mean latitude of each day to which the profiles of the color plots correspond. The derived parameters shown in the color plots are, from top to bottom, the median radius, the absolute mode width ω, the effective radius, and the number density.
The oscillation of the vertical extent of the aerosol layer over time in the color plots is in large part explained by the latitudinal oscillation of the SAGE III/M3M measurements (see Fig. 1 or topmost plots of Figs. 2 and 3). The red line in each color plot shows the tropopause height, which is provided in the SAGE III/M3M data. Some outliers have been excluded from the different parameters in the color plots due to their infrequency and the consequent widening of the displayed range of values, which would obscure the important signatures and structures within the plot. Values directly above the tropopause are often missing due to the filtering of data using the accuracy parameter described in Sect. 2.2.
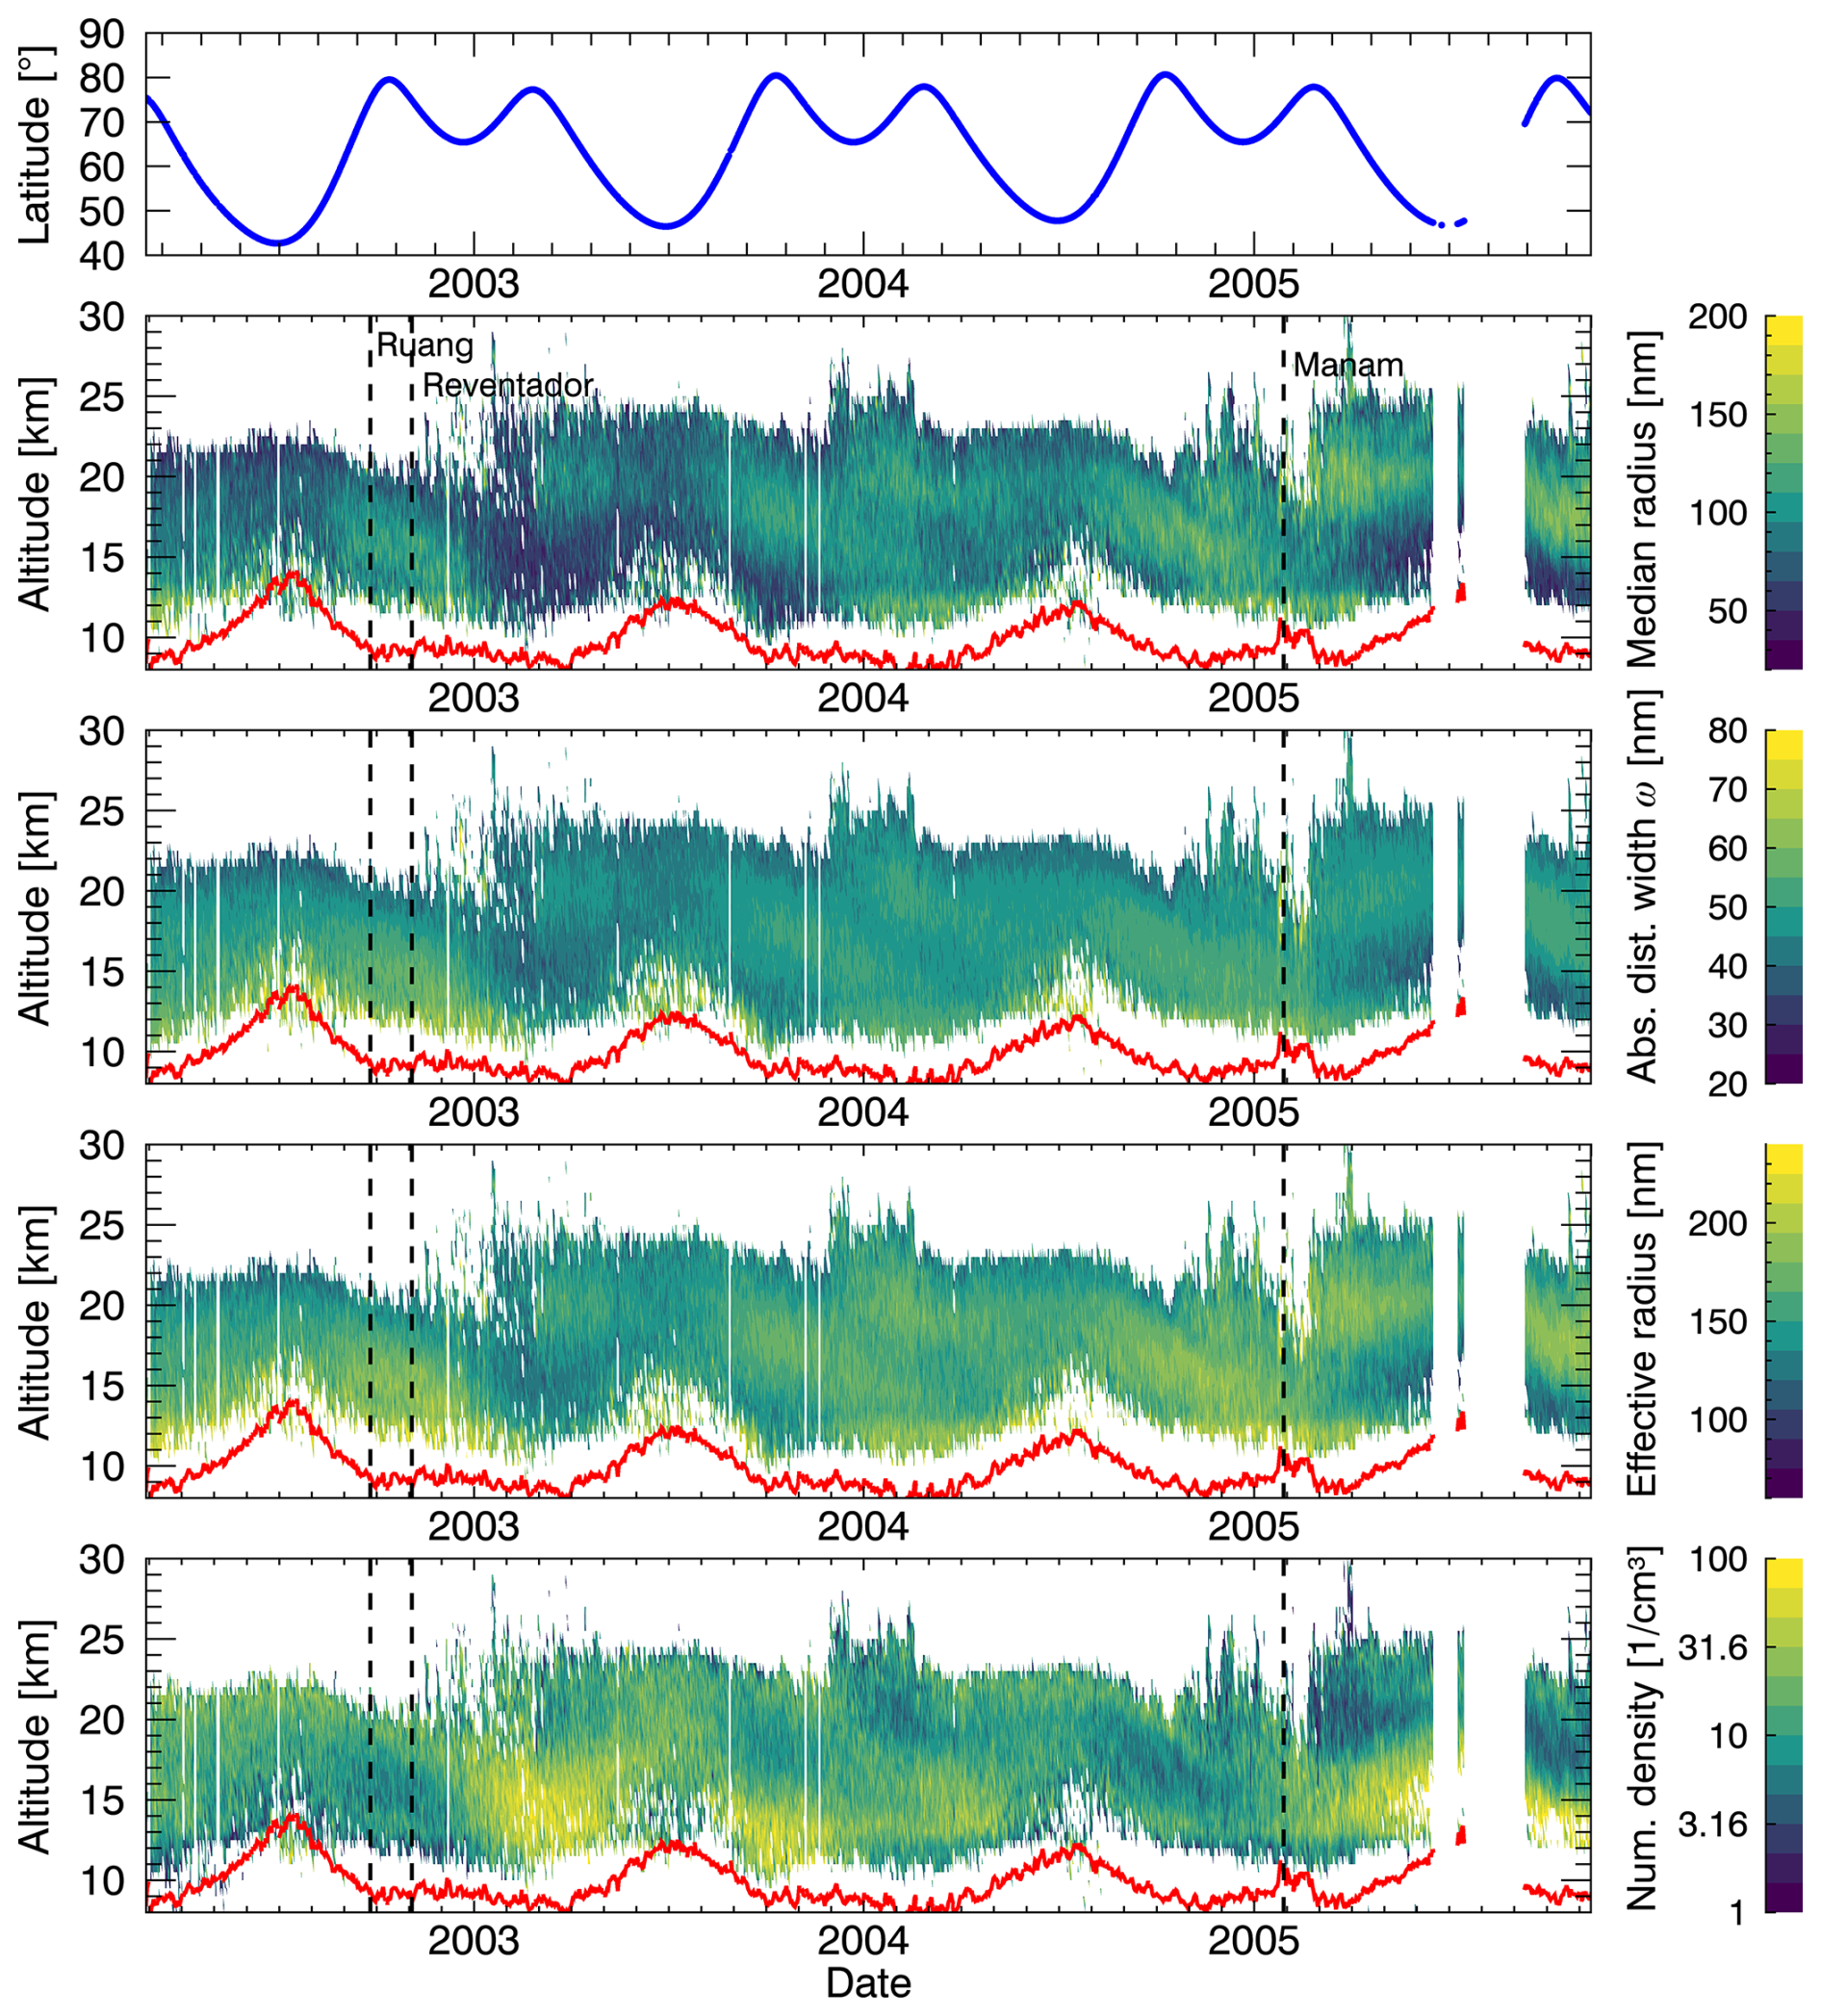
Figure 2Northern Hemisphere (i.e., from sunset occultation events): daily averages of PSD parameters, derived from the SAGE III/M3M stratospheric aerosol extinction data (NASA/LARC/SD/ASDC, 2009). From top to bottom: latitude coverage, median radius, absolute mode width ω, effective radius, number density. The red line indicates the tropopause height. Note that the number density values are given on a logarithmic scale.
Vertical dashed lines mark the times of volcanic eruptions that were strong enough to potentially have had an effect on the stratospheric aerosol layer. The first two were small (in terms of emitted SO2) but significant eruptions by two tropical volcanoes in late 2002: namely, Ruang (2.3° N) on 25 September 2002 (Global Volcanism Program, 2023) and Reventador (0.08° S) on 3 November 2002 (Hall et al., 2004). According to the Darwin Volcanic Ash Advisory Center, the plume of Ruang rose up to 17 km (Global Volcanism Program, 2023). The Reventador plume reached 17 km as well and emitted 0.06–0.08 Tg SO2 (Hall et al., 2004; Global Volcanism Program, 2023). The third dashed vertical line marks the peak of the eruptive phase of the Manam volcano (4.08° S) that lasted from October 2004 until the end of January 2005. The peak occurred on 27–28 January 2005, with the volcanic plume reaching into the stratosphere, up to 21–24 km altitude and emitting approximately 0.14 Tg of SO2 (Tupper et al., 2007; Global Volcanism Program, 2023). It should be mentioned that prior to this, between 24 October and 27 November 2004, Manam also emitted around 0.15 Tg of SO2 at altitudes between 6 and 18 km, making it unclear how much of it reached and impacted the stratosphere before the peak in January 2005 (Global Volcanism Program, 2023).
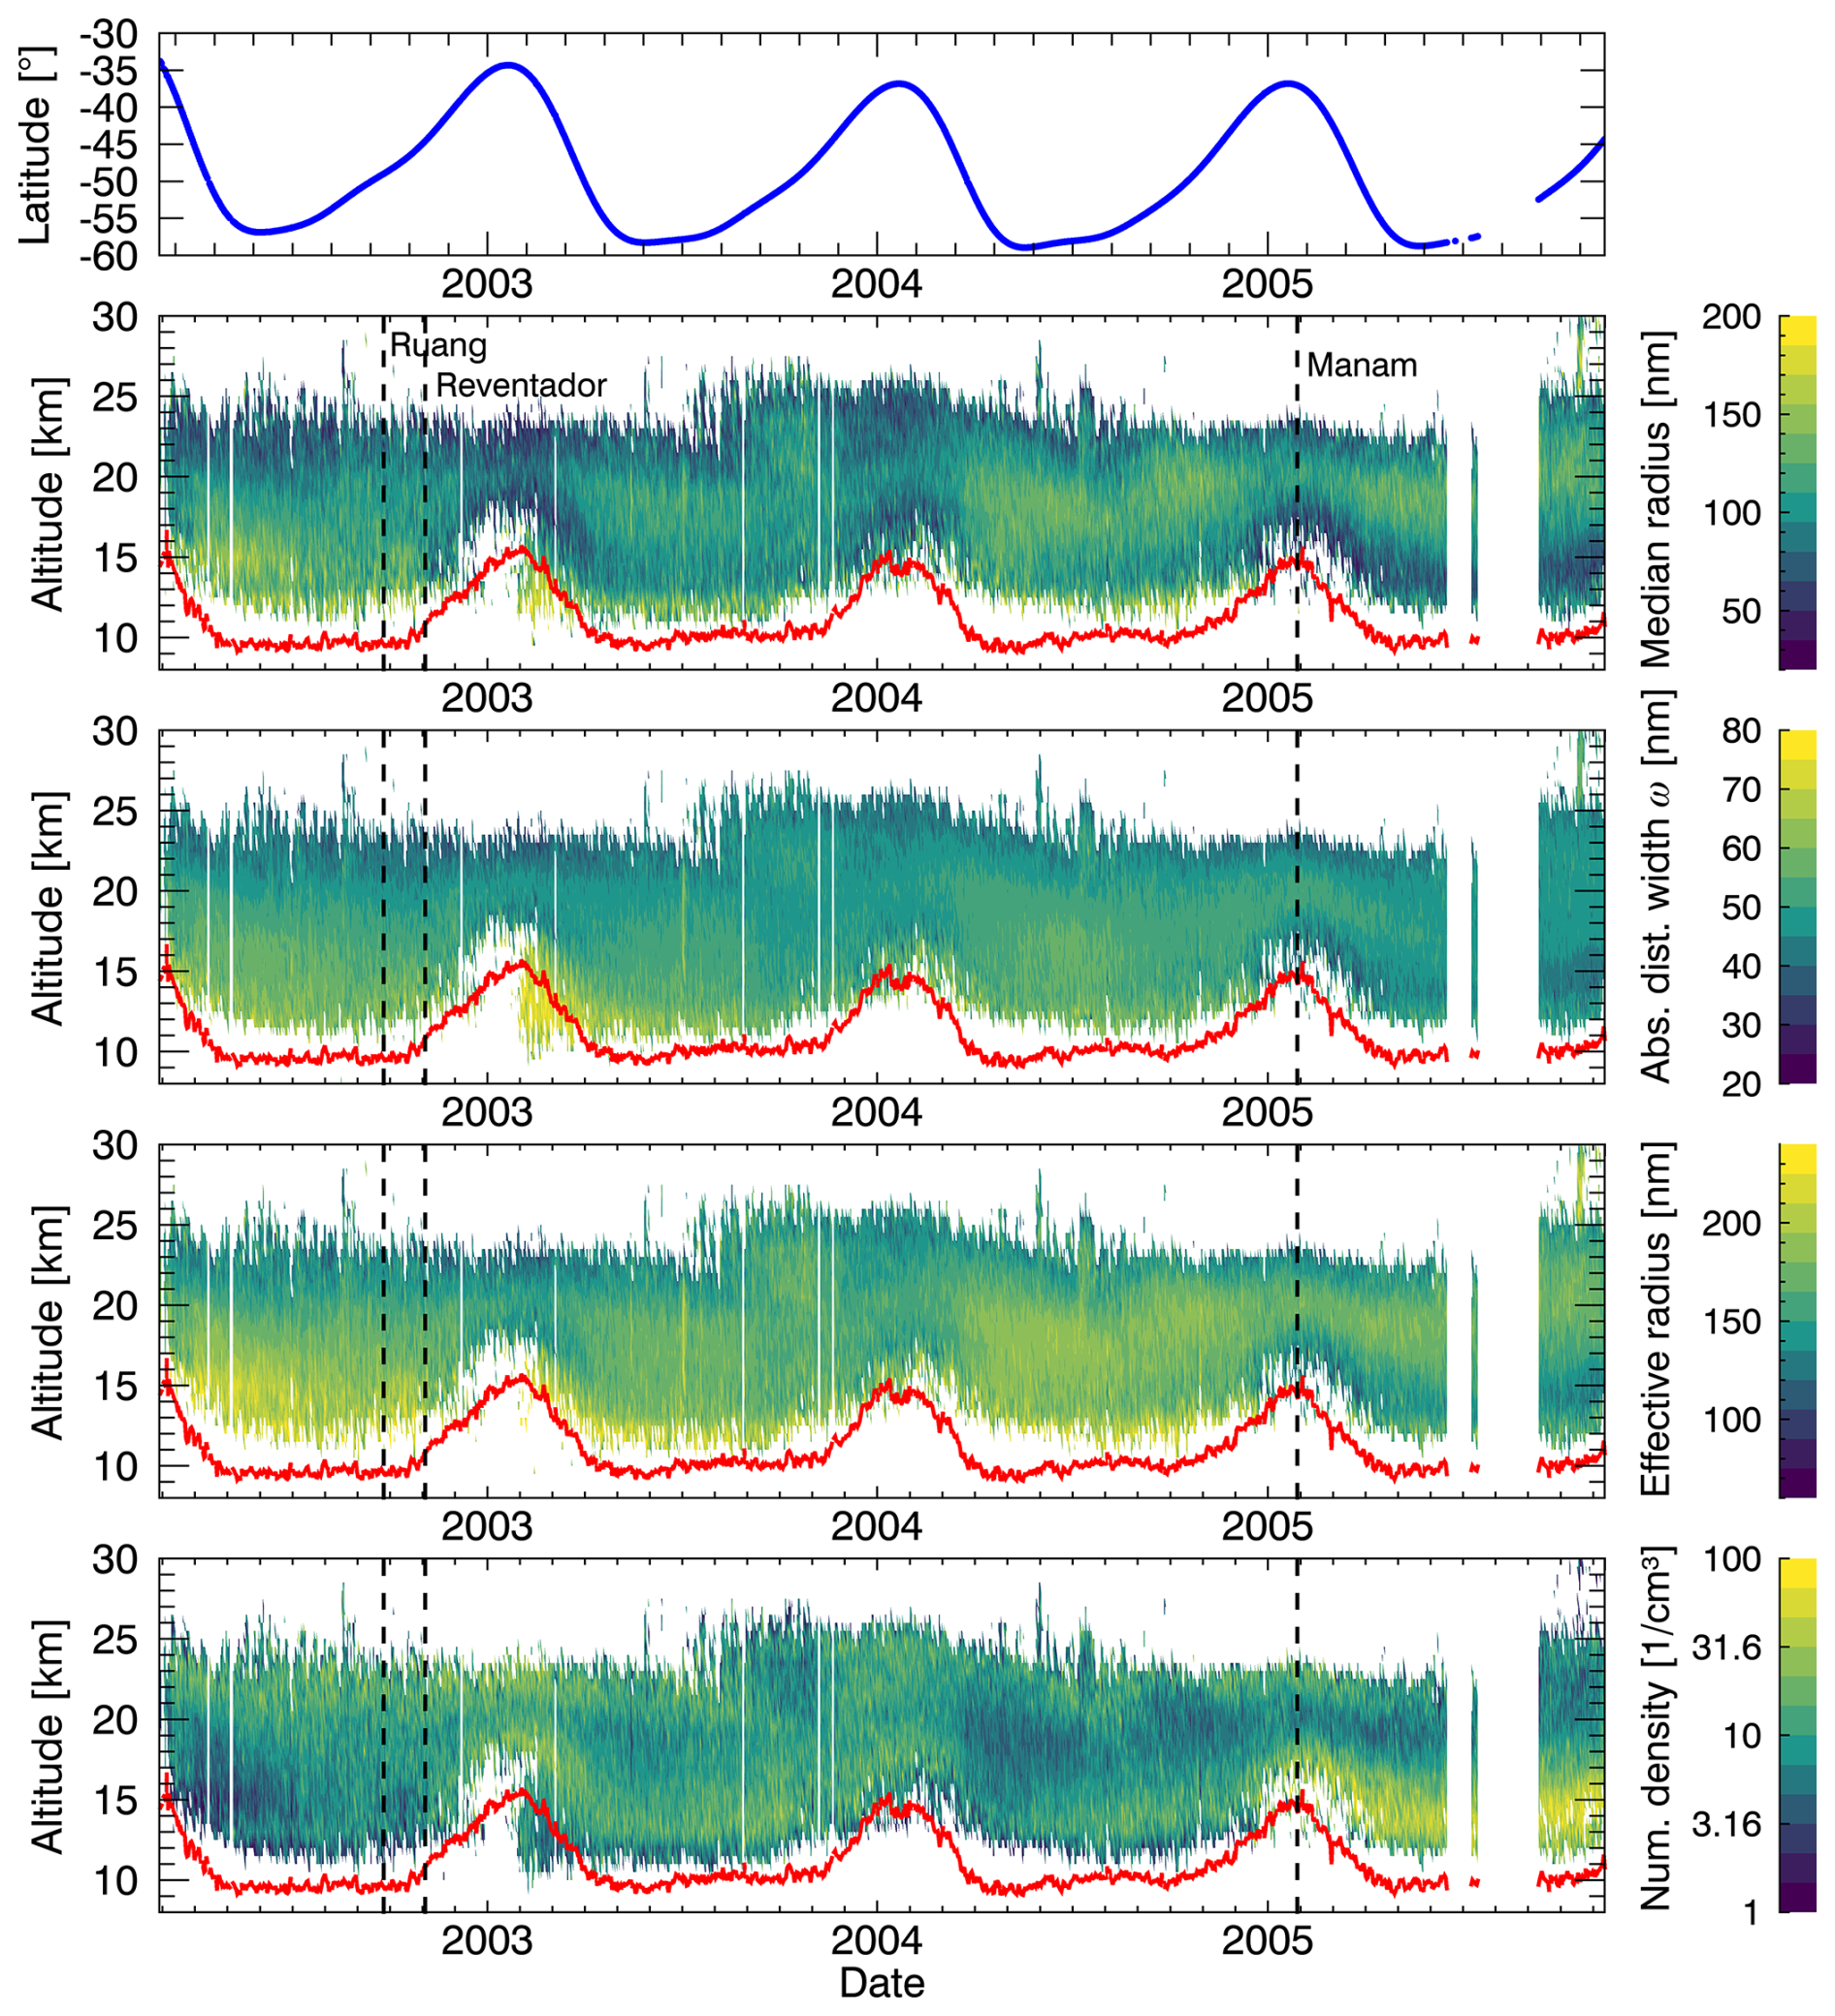
Figure 3Southern Hemisphere (i.e., from sunrise occultation events): daily averages of PSD parameters, derived from the SAGE III/M3M stratospheric aerosol extinction dataset. The red line indicates the tropopause height.
In the Northern Hemisphere (Fig. 2), the strongest signatures in the SAGE III/M3M time series for each parameter are found in the months after the three tropical volcanic eruptions. Without necessarily claiming causality, the median radius, absolute mode width ω, and effective radius show decreased values starting 2 to 3 months after the volcanic eruptions in the lower Junge layer and lasting for over half a year, as indicated by the darker colors. In contrast, the number density, which is shown with a logarithmic color scale, shows a very strong increase in the same regions. In the context of the assumed monomodal lognormal shape of the PSD this means that its peak is shifted towards smaller radii and its width is reduced; i.e., smaller particles than before dominate the optical signal measured by the instrument. The effect of the monomodal assumption is discussed further in Sect. 5. The observed overall pattern in the derived parameters is strikingly similar to the results shown in Wrana et al. (2023), where eruptions of the Ambae, Ulawun, and La Soufrière volcanoes between 2018 and 2021 were shown to also have led to a decrease in median radius, absolute mode width, and effective radius and to a strong increase in number density. This was backed up by both data derived from satellite measurements and model simulations, which generally showed good agreement. Similar to Ruang, Reventador, and Manam, these volcanic eruptions all emitted less than 1 Tg of SO2 into the stratosphere. Also, all of these eruptions were tropical. Both the emission strength and the latitudinal location of the volcano could be important causal factors for the observed reduction in average aerosol size (Wrana et al., 2023). The low temperatures in the tropical upper troposphere/lower stratosphere (UTLS) region may be especially important due to their strong positive effect on nucleation of new particles from gaseous H2SO4 (Vehkamäki et al., 2002; Korhonen et al., 2003) formed from the emitted SO2. The results of model simulations indicate that lower temperatures result in a shift in the aerosol size distribution towards lower radii (Pirjola et al., 1999).
Another notable signature found after the volcanic eruptions, particularly in the Northern Hemisphere, is an increase in average aerosol size in a roughly 5 km thick layer above the discussed layer of reduced aerosol size. This increase is seen in the median radius and effective radius, but not necessarily in the absolute mode width ω; i.e., the derived monomodal lognormal PSD remains at a similar width but its peak shifts towards larger radii. This size increase is much more pronounced in 2005 after the Manam eruption.
In the derived parameters of the Southern Hemisphere, which are shown in Fig. 3, a size reduction after the Ruang and Reventador eruptions can be seen as well. Both the increase in number density and the reduction in median radius and effective radius are much weaker than in the Northern Hemisphere. However, the signals are visible earlier here, which makes sense, since the measurements in the Southern Hemisphere were taken at lower latitudes, i.e., closer to the tropical volcanoes, than in the Northern Hemisphere. Increased aerosol size, best visible in the median radius and effective radius, and decreased number densities are found throughout the year 2004. The strongest signals in the Southern Hemisphere are the increased number density and the reduced median radius in the lowermost 4 to 5 km of the Junge layer throughout the year 2005 and starting around the eruption of Manam. It therefore appears that more of Manam's emissions were transported to the Southern Hemisphere than Ruang's and Reventador's emissions before. Factors that may have contributed to this are the larger amount of SO2 injected into the stratosphere by Manam, its location further south, and the timing of its main eruption at the start of the year rather than towards its end.
3.2 Origin of aerosol size change
The SAGE III/M3M measurements did not cover the tropics and lower latitudes, as shown in Fig. 1. Therefore we have to look at the question of whether the observed aerosol size reduction signals can plausibly be traced back to the tropical volcanic eruptions of Ruang, Reventador, and Manam or if other causes have to be considered.
In terms of the chronological sequence it seems plausible that these signatures can indeed be of volcanic origin, since the strongest size reduction signals are found a few months after the eruption dates; i.e., there was enough time for the plumes to be transported from their possible tropical origin to the observed higher latitudes. However, there may also have been non-volcanic factors influencing the evolution of aerosol size and leading to an average size reduction in 2003 and 2005. An important factor may be the seasonally occurring new particle formation events in the polar winter stratosphere (Hofmann, 1990; Wilson et al., 1990; Campbell and Deshler, 2014), also known as the springtime condensation nuclei (CN) layer that is linked to the onset of photolysis in polar spring (Mills et al., 2005).
Additional phenomena possibly also linked to the polar springtime CN layer are meteoric smoke particles (MSPs) that seasonally accumulate in the polar winter stratosphere (Megner et al., 2008). They originate from meteoroids continuously entering Earth's atmosphere and being vaporized in the upper mesosphere and lower thermosphere in a process called meteoric ablation. Through this, layers of neutral metal atoms and ions are formed. The vaporized material recondenses to form the meteoric smoke particles (Hunten et al., 1980; Plane, 2012), which by coagulation likely grow up to sizes of 40 nm (Megner et al., 2008; Bardeen et al., 2008). As part of the general atmospheric circulation the MSPs in the mesosphere are transported to the winter hemisphere and then downwards in the polar vortex (Megner et al., 2008). Through the lowering of the H2SO4 saturation vapor pressure due to the combination with meteoric material, sulfuric acid is suggested to be able to condense above the usual confines of the Junge layer (Saunders et al., 2012; Hervig et al., 2017). This way, meteoric sulfate aerosols may be formed that coagulate and grow into measurable sizes during their continued descent in the stratosphere (Schneider et al., 2021). The signal of low values in, e.g., the median radius and effective radius that seemingly descends from the upper end of the Junge layer in January 2003 (see Fig. 2) could theoretically be related to this.
These seasonal nucleation–condensation events that include the MSPs accumulating in the polar winter stratosphere could be an important factor in the observed size evolution and reduction of average aerosol size in northern hemispheric winter. If that were the case, there would be an unknown error in the derived aerosol size due to the refractive indices used in the Mie calculations of the lookup table that are based on the assumption of pure sulfate aerosol. Unfortunately, little is known about the actual properties of meteoric smoke particles, mainly because of the difficulties of performing in situ measurements at such high altitudes (Megner et al., 2008).
However, the size reduction signal is visible well before spring, especially in 2003. Also, in particular after the Manam eruption, a size reduction signal is found in the Southern Hemisphere as well, although it is weaker, i.e., in the summer hemisphere where no seasonal nucleation event would be expected. Adding to this point, the Southern Hemisphere measurements were taken at relatively low latitudes. Additionally, no comparable size reduction is found in 2004, when notable volcanic eruptions strong enough to influence the stratosphere were absent, except for a very weak possible signal in the Southern Hemisphere around January and February 2004. These points argue for the signals being at least in part of volcanic origin.
As an additional piece of information, the measurements of the SAGE II instrument, the predecessor of SAGE III/M3M, can be used to shed some light on the temporal and spatial dispersion of the volcanic plumes. Its mission started in 1984 and ended in August 2005, therefore temporally covering most of the SAGE III/M3M mission. The reason for the additional information gained on the volcanic plume dispersion by using the SAGE II instrument's data is its different orbit. Because of it a wider latitude range is covered, between up to 80° N and 80° S, depending on season. The tropics are included as well, facilitating the tracking of the volcanic plumes, albeit with a relatively poor temporal resolution due to the sampling of solar occultation measurements.
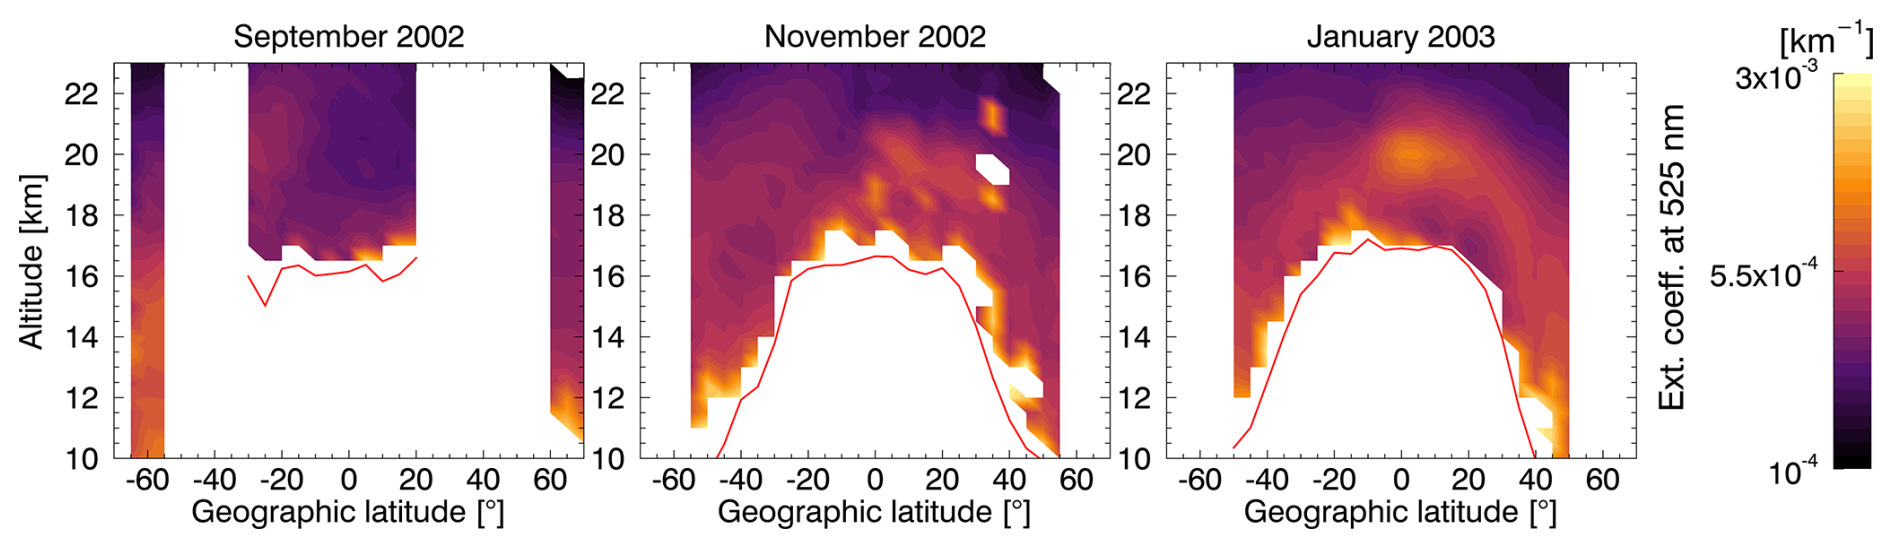
Figure 4Ruang (2.3° N) and Reventador (0.08° S) plume dispersion indicated via monthly averages of the aerosol extinction coefficient at 525 nm as provided in the SAGE II v7.0 dataset (NASA/LARC/SD/ASDC, 2012). Shown are characteristic months before (first panel) and after the volcanic eruptions. The red line indicates the tropopause height; data below it are excluded.
Monthly zonal means of the aerosol extinction coefficient at 525 nm, as provided in the SAGE II v7.0 dataset, are shown in Fig. 4 and the top row of Fig. 5. Extinction coefficients with associated relative uncertainties of 30 % or higher were excluded. The extinction data were averaged onto a latitude grid with 5° bin size and plotted logarithmically. Even though monthly averages were calculated there are still data gaps, which is mostly due to the sparse sampling of satellite solar occultation measurements. Furthermore, the SAGE II sampling causes different latitude bins to represent different days within the considered month. Both figures show characteristic months around the volcanic eruptions in question, i.e., Ruang and Reventador for Fig. 4 and Manam for Fig. 5. In both cases, the leftmost plot shows the atmospheric conditions before the respective volcanic eruptions, while the other two show the emergence and dispersion of the aerosol extinction enhancement due to the volcanic plume.
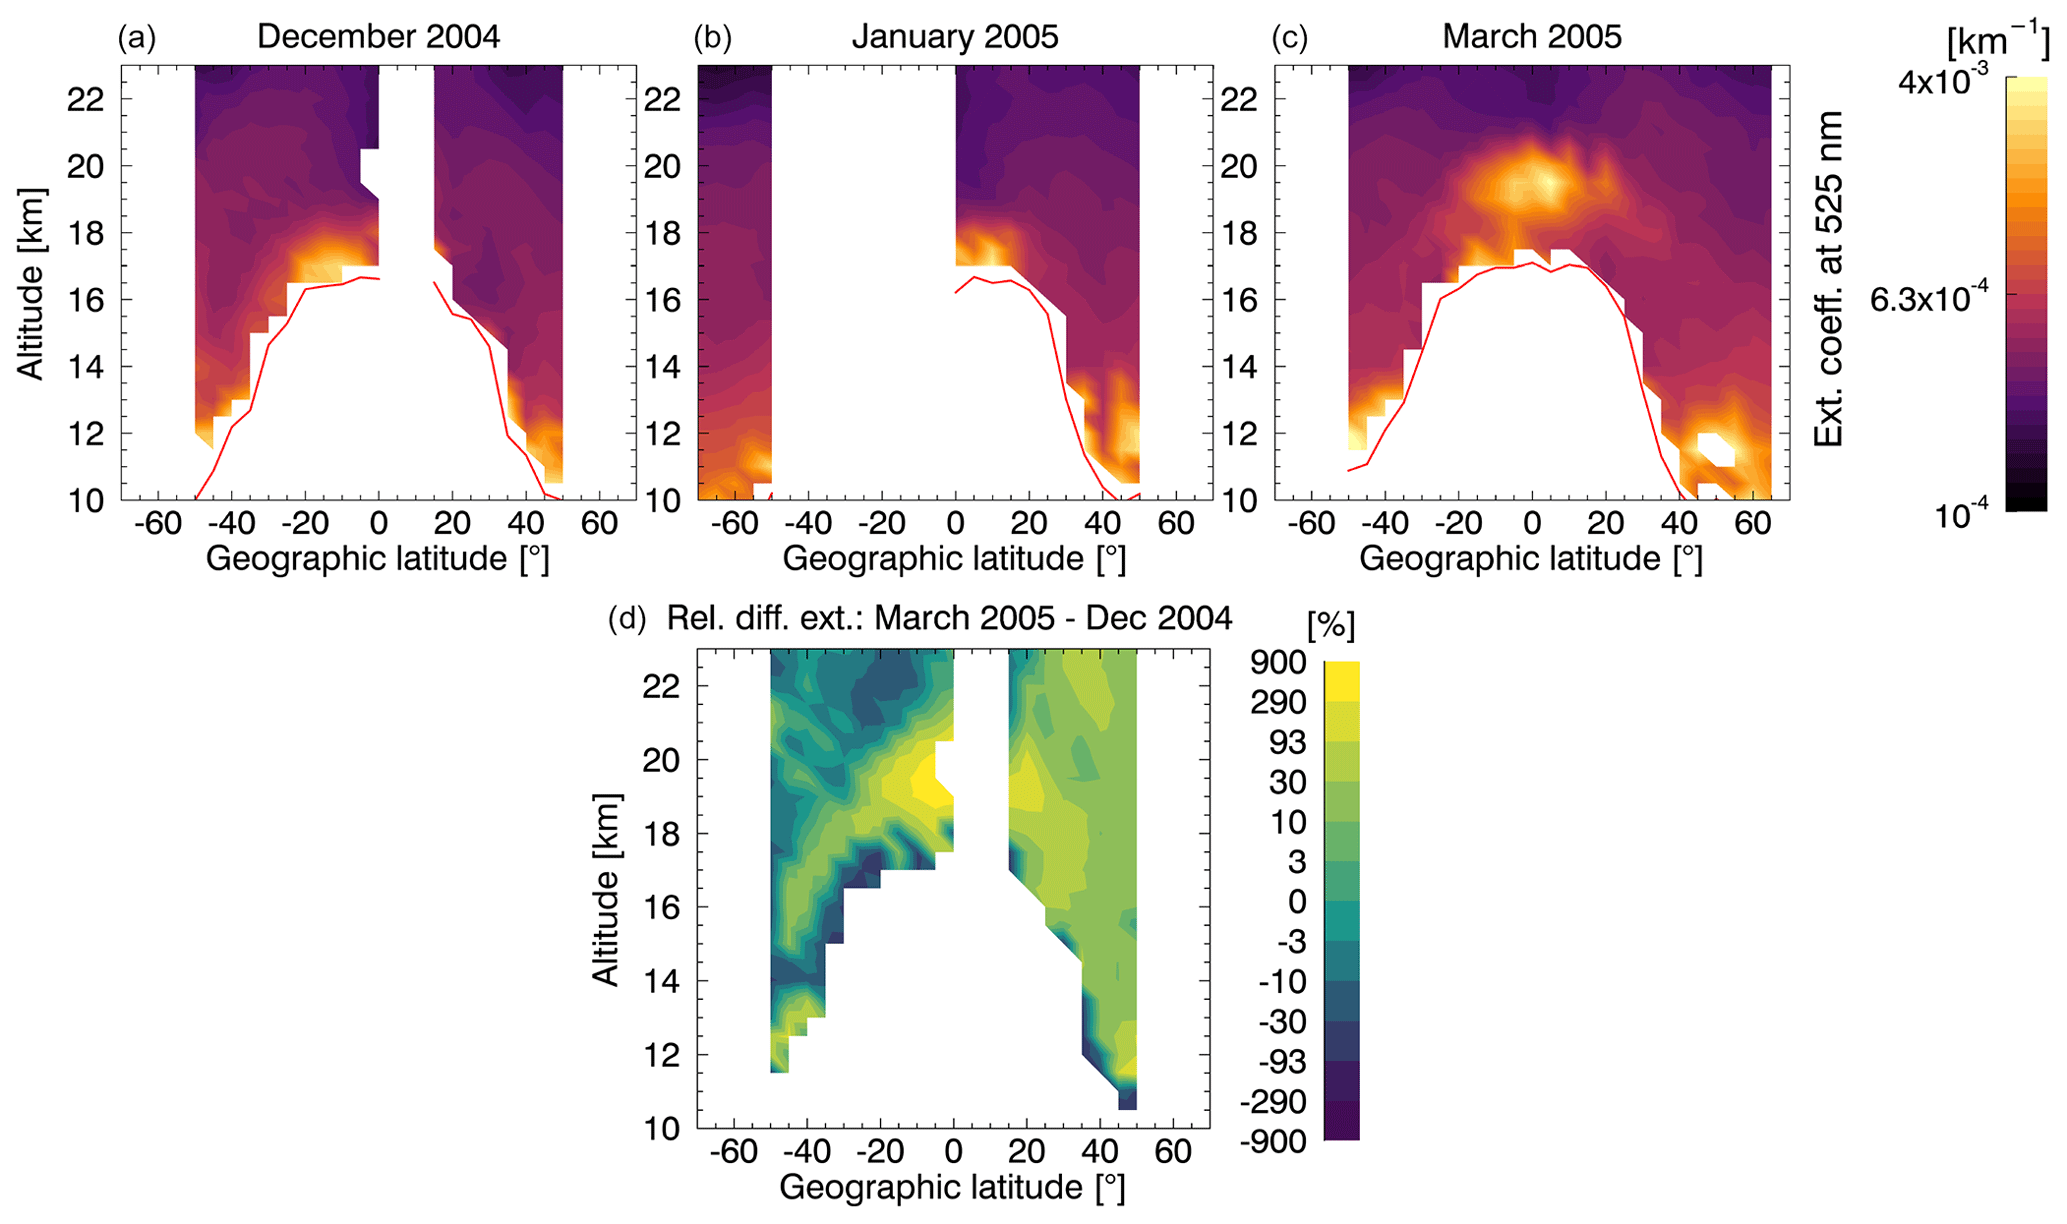
Figure 5(a, b, c) Manam (4.08° S) plume dispersion indicated via monthly averages of the aerosol extinction coefficient at 525 nm as provided in the SAGE II v7.0 dataset (NASA/LARC/SD/ASDC, 2012). Shown are characteristic months before (a) and after the volcanic eruption. The red line indicates the tropopause height; data below it are excluded. (d) Relative difference in percent between the extinction coefficients in March 2005 and December 2004 (i.e., between the top rightmost and leftmost plots).
Before the Ruang and Reventador eruptions, which happened on 25 September and 3 November, respectively, there are data gaps preventing a good look at the pre-volcanic conditions. The best overview is possible in September 2002, shown in the first panel of Fig. 4, where at least some northern high-latitude measurements are included. From this to the other panels for November 2002 and January 2003 a clear increase in the extinction coefficient can be seen in the Junge layer between the tropics, where the volcanoes are located, and the northern midlatitudes, where the SAGE III/M3M measurements happened. It can be concluded that the size reduction signal found in early 2003 in the Northern Hemisphere (see Fig. 2) is very likely connected to the volcanic eruptions of Ruang and Reventador in late 2002.
For Manam the picture is not as clear. In the top row of plots in Fig. 5, a strong and clear increase in aerosol extinction coefficient is visible in the tropics after the Manam eruption in March 2005. However, whether the volcanic plume reached higher latitudes or not is not as easily discernible. For this reason an additional plot was added to Fig. 5. It shows the change in extinction coefficient at 525 nm between December 2004 and March 2005, i.e., the difference between the first and third plot of the top row, in percent. To distinguish it from the extinction coefficient data another color scheme is used. The data are presented logarithmically. The plot suggests at least some transport of the Manam volcanic plume from the tropics towards midlatitudes. Transport to the Southern Hemisphere shows up as a distinct enhancement of the typical Junge layer, with increases between roughly 10 % and 30 %. In the Northern Hemisphere, however, an increase of a similar magnitude can be seen not in a layered shape but throughout the lower stratosphere. Especially since this time frame covers mostly the northern hemispheric winter, a strong seasonal component may be at play here, with increasing aerosol extinction coefficients due to a lowering of the temperature. There is also a cluster of high aerosol extinction coefficient values (first row of plots) in the lowermost stratosphere between roughly 40 and 60 ° N that exists even in December 2004, before the main volcanic eruption on 27–28 January 2005. This cluster of values is, however, associated with high relative uncertainties and may therefore simply be a retrieval artifact rather than a real feature. It is therefore challenging to determine from the SAGE II data to what degree the aerosol size reduction in the Northern Hemisphere after the Manam eruption (see Fig. 2) is attributable to the eruption, seasonal variation, or a combination of both.
Taking everything discussed above into account it is likely that the average aerosol size reduction signals that were observed after the Ruang and Reventador eruptions in both hemispheres and after the Manam eruption in at least the Southern Hemisphere are indeed volcanic events; they may be comparable to the ones discussed in Wrana et al. (2023). In the case that the signals are indeed of volcanic origin, the fact that the size reduction signals are stronger in the Northern Hemisphere (Fig. 2) than in the Southern Hemisphere (Fig. 3) can likely be explained by the tropical location of the volcanoes, the timing of the eruptions in northern winter, and the tendency of the Brewer–Dobson circulation to enhance transport from the tropics towards the winter hemisphere (Kremser et al., 2016).
3.3 Possible polar stratospheric cloud (PSC) observations
Polar stratospheric clouds (PSCs) can form in the lower stratosphere and play an important role in both the activation of halogen species, resulting in ozone destruction and the ozone hole, and the denitrification and dehydration of certain regions of the polar stratosphere (Tolbert and Toon, 2001; Lowe and MacKenzie, 2008). Since the stratosphere is typically very dry, the very low temperatures in the stratospheric polar winter are a precondition for them to form (Peter, 1997). There are multiple known types of PSC, whose particles have different compositions and layers and which can be liquid or frozen, based on the conditions in which they form (Lowe and MacKenzie, 2008; Tritscher et al., 2021).
Solid PSC particles, such as nitric acid trihydrate (NAT) (Voigt et al., 2000; Hanson and Mauersberger, 1988) and ice particles, as well as liquid supercooled ternary solution (STS) droplets, exist (Carslaw et al., 1994; Tabazadeh et al., 1994; Deshler et al., 2003b), the latter of which are the most commonly occurring type of particle in a PSC. Also, liquid and solid particle types can often coexist (Weisser et al., 2006). The formation of these different kinds of PSC particles depends foremost on temperature, with NAT particles having the highest equilibrium temperature. At temperatures roughly 3 K above the ice frost point (and ∼ 3 K below the NAT frost point), STS particles form. Ice particles then nucleate 3 to 4 K below the frost point (Weisser et al., 2006). Other factors, like the preexistence of other particles, may also play a role. For example, ice particles can provide surfaces for the heterogeneous nucleation of NAT particles (Koop et al., 1997), and meteoric particles may play a role in the heterogeneous nucleation of both NAT and ice particles (Bogdan et al., 2003; Hoyle et al., 2013; Engel et al., 2013).
Since the SAGE III/M3M measurements in part covered high latitudes, mostly in the Northern Hemisphere, there was a potential to encounter polar stratospheric clouds (PSCs) in the dataset. In Fig. 6, the top plot again shows the latitudinal coverage of the measurements in the Northern Hemisphere. Below this, time series of the aerosol extinction coefficient at 449 nm and the temperature are shown, both parameters being provided in the SAGE III/M3M dataset. For visibility of the relevant signals, the extinction coefficient is plotted with a reverse color scale; i.e., darker colors in this case mean higher values. To facilitate referencing of the same areas in the different plots, extinction coefficient values are only shown where aerosol size parameters could be derived and temperature values are only plotted where extinction coefficients are shown as well.
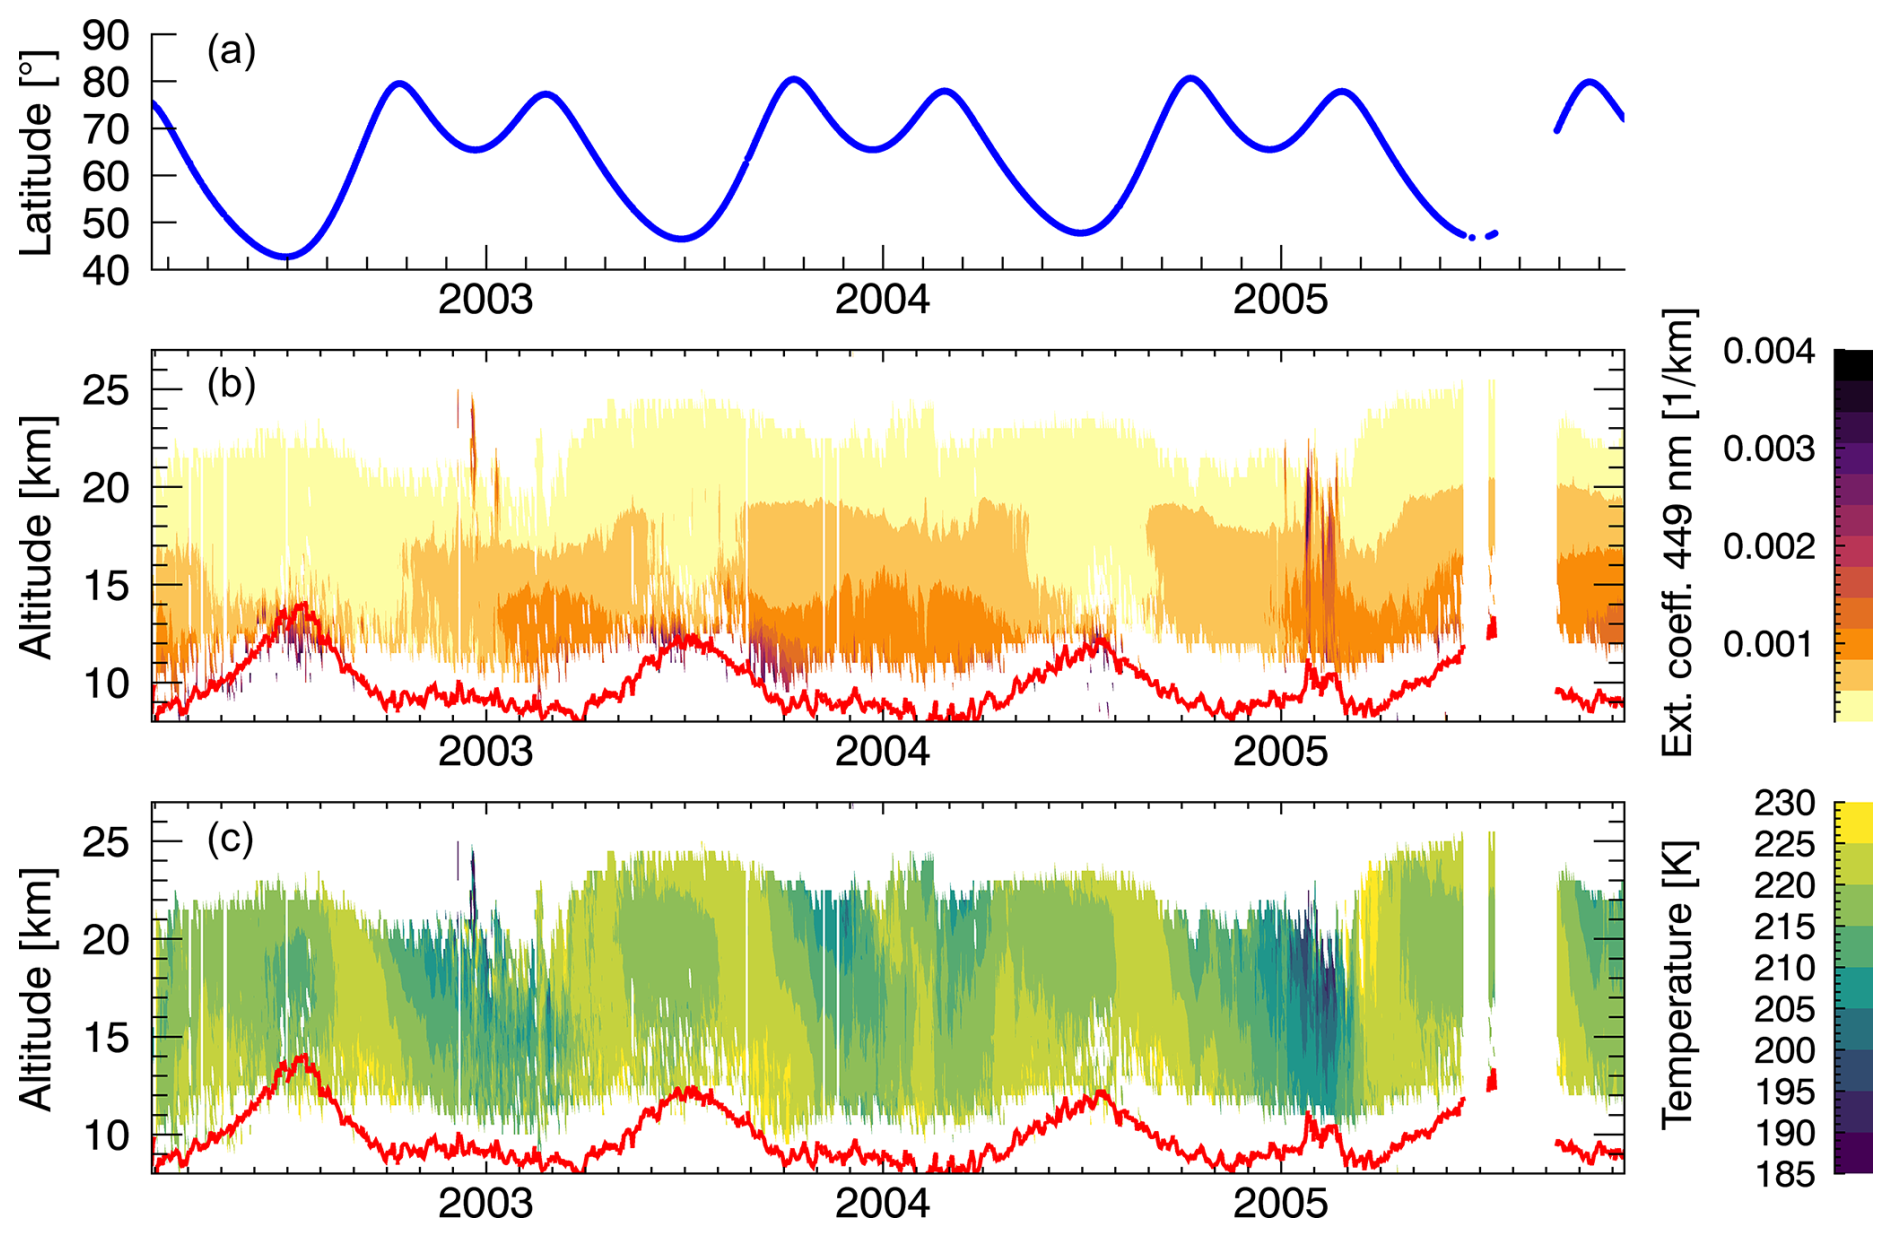
Figure 6Daily averages of parameters that are related to potential PSC observations in the SAGE III/M3M dataset in the Northern Hemisphere (i.e., from sunset occultation events). From top to bottom: latitude coverage, aerosol extinction coefficient at 449 nm, and temperature, all provided in the SAGE III/M3M dataset (NASA/LARC/SD/ASDC, 2009). The red line indicates the tropopause height.
The two main areas of interest are immediately obvious when looking at the extinction coefficient in Fig. 6: in the winters of 2002/2003 and 2004/2005 there are multiple clusters of only a few days of strongly elevated aerosol extinction at the uppermost altitudes of the Junge layer (and in part above it) including some of the highest values of the whole time series. The short duration of the signals and the position at the uppermost end of the aerosol layer basically rule out a volcanic origin. Looking at the lowermost plot, both winters included the lowest temperatures over the longest times in the SAGE III/M3M time series. More specifically, the clusters of high extinction coefficient in question also exhibit very low temperatures, well below 200 K, with the lowest temperature in these daily average profiles being 186 K. It therefore is very likely that the observed sporadic enhancements in the extinction coefficients come from PSCs that had been forming due to the cold winters in 2002/2003 and 2004/2005.
In the cases in which the aerosol size derivation method described in this work does obtain results for the measurements containing a PSC signal, median radii of up to roughly 350 nm are found. However, these results are in no way reliable. Firstly, the actual refractive indices of the PSC particles may differ strongly from the values assumed for pure sulfate aerosol. Secondly, the particles may not even be liquid and therefore not spherical, in which case Mie theory would be inaccurate. For probably the same reasons there are many measurements where the size derivation method does not work and produces no results at all, since the extinction ratios formed from the measurements fall outside of the lookup table value range.
Since the PSD parameters derived from in situ OPC measurements can be assumed to be more reliable than those derived from satellite measurements, in this section both are compared for validation of the aerosol size data of this work. The only stratospheric OPC measurements made using University of Wyoming aerosol counters in the Southern Hemisphere during the SAGE III/M3M mission were at 78° S, i.e., too far south for a comparison with SAGE III/M3M. However, there have been OPC measurements in Kiruna (68° N, 21° E), Sweden, on 8 d in total, most of them in December 2002.
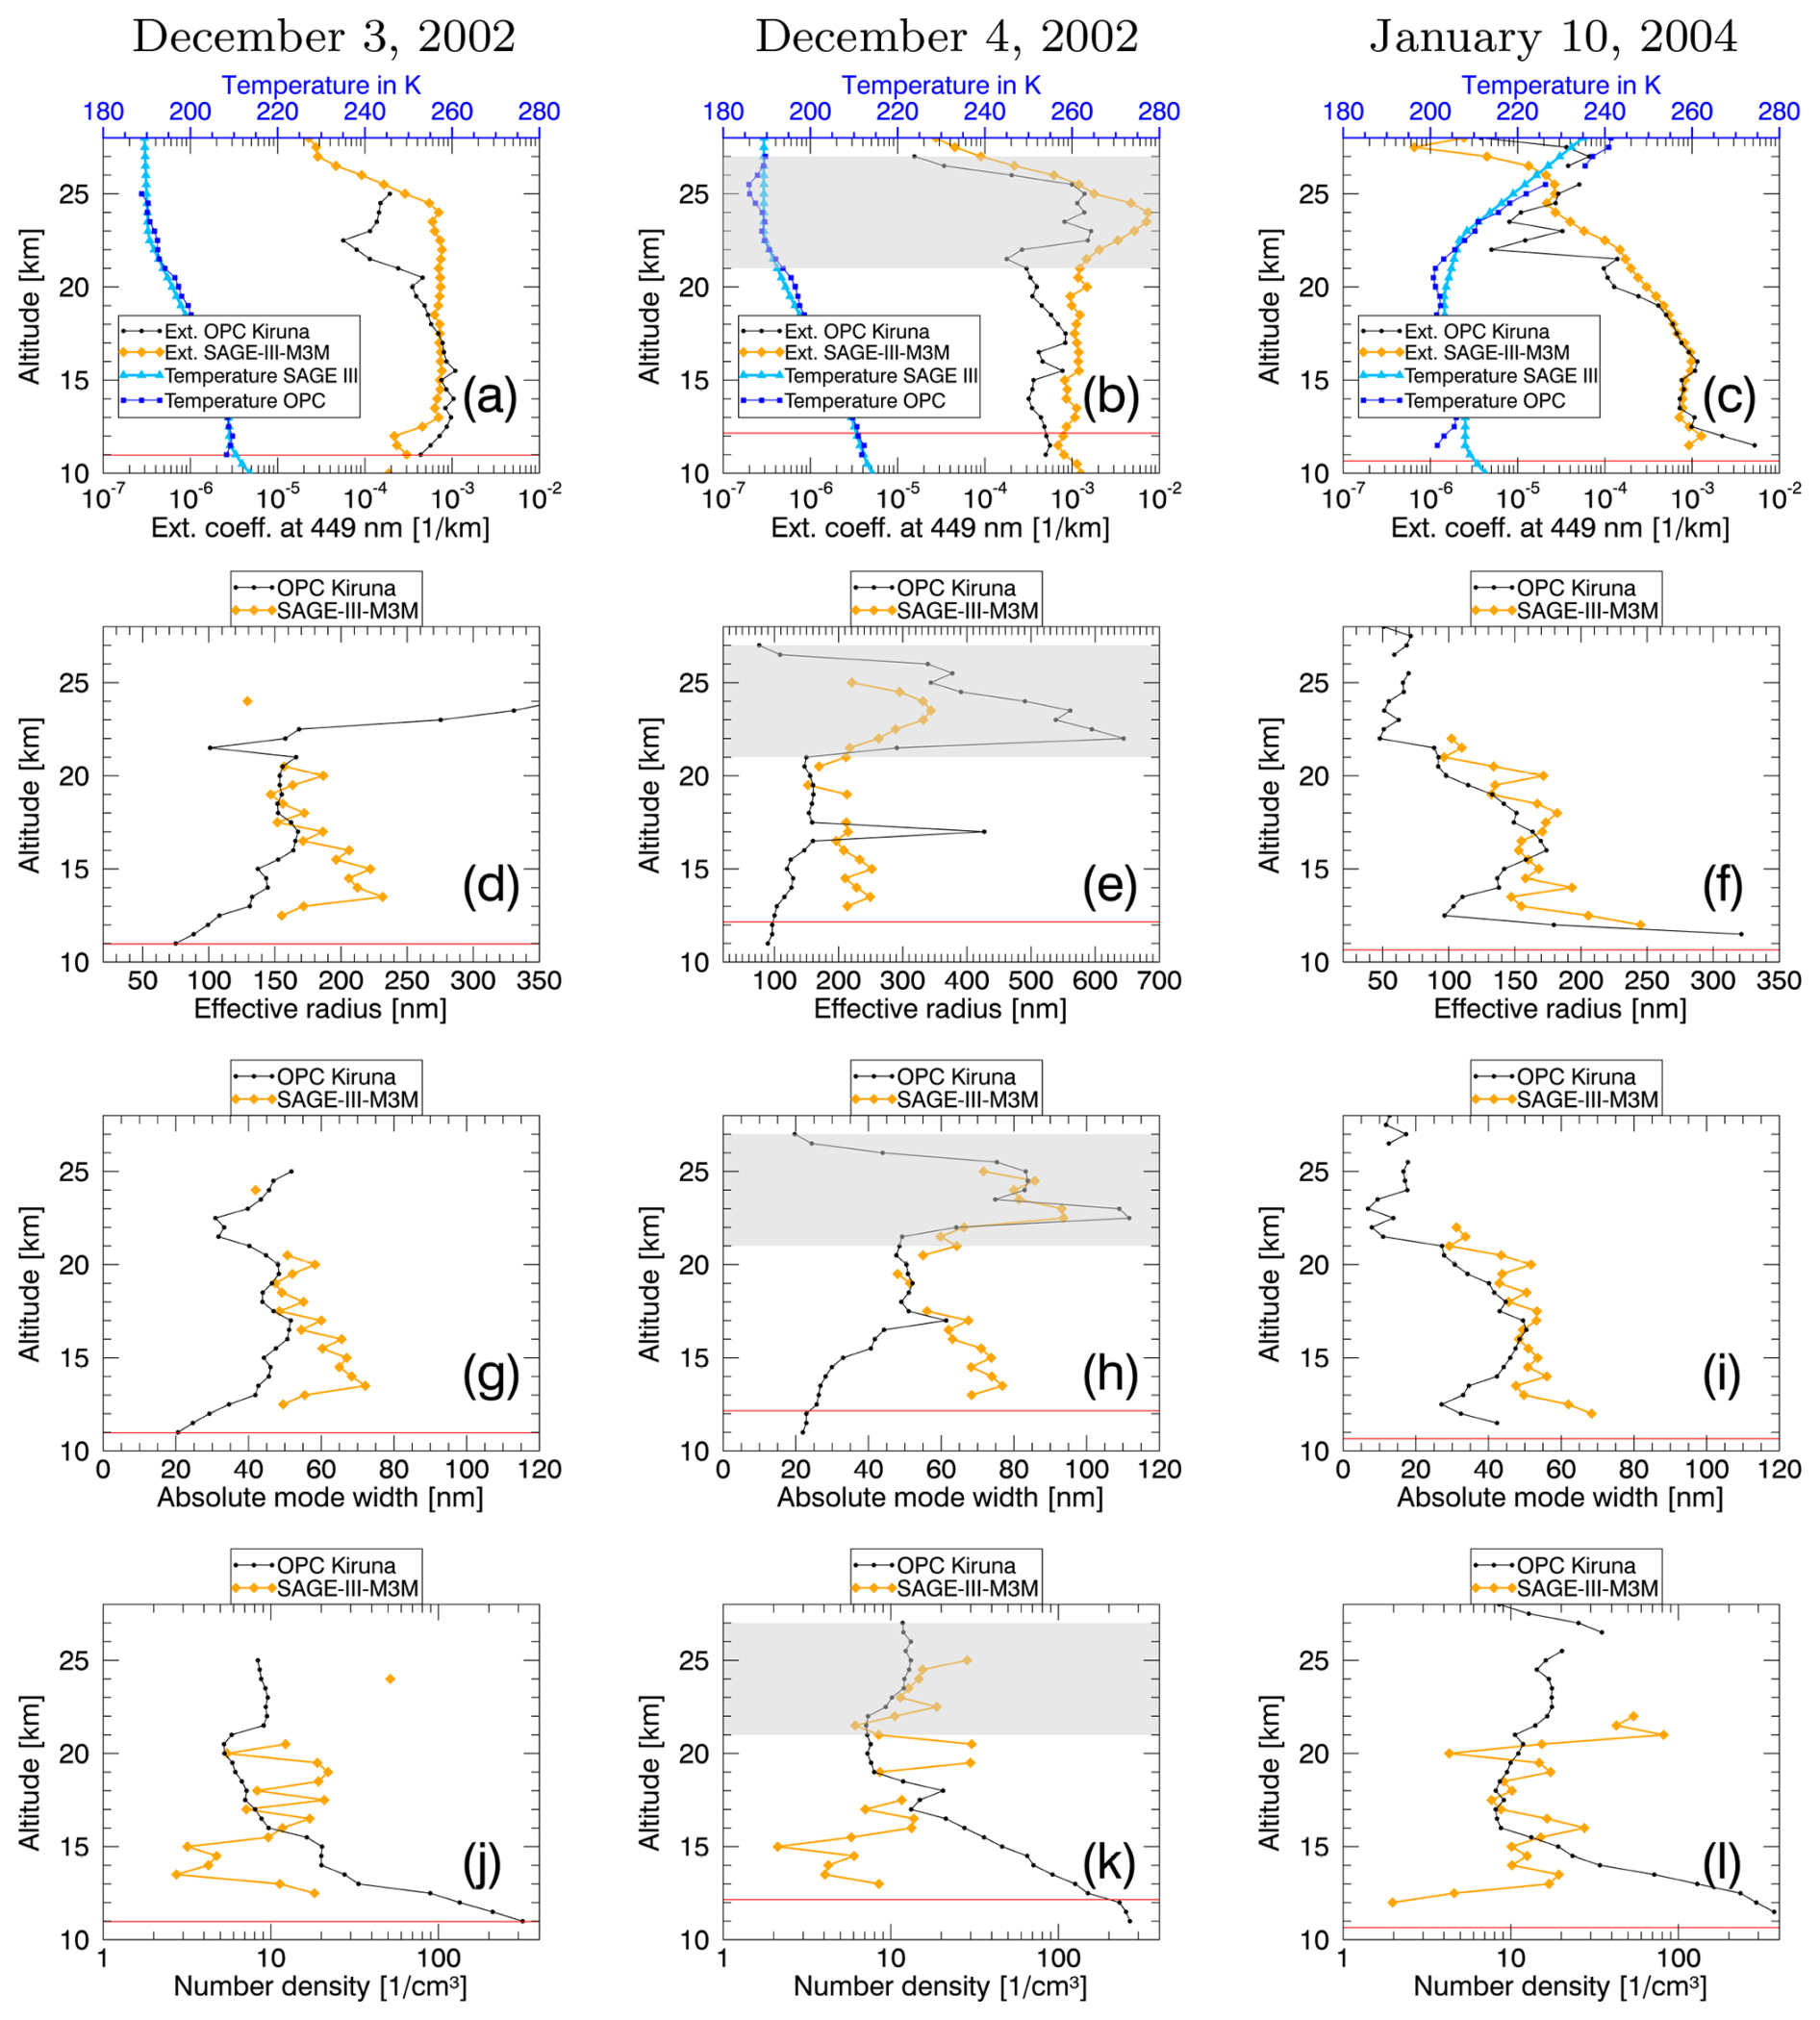
Figure 7Comparison of PSD parameters derived from SAGE III/M3M (orange) and from OPC measurements in Kiruna (Deshler, 2023) (black) for 3 different days (columns). Shown are, from top to bottom, the aerosol extinction coefficient at 449 nm, the effective radius, the absolute mode width ω, and the aerosol number density. Additionally, the first row of plots includes the average temperature as provided in the OPC dataset (dark blue) and in the SAGE III/M3M dataset (light blue). The horizontal red line indicates the average tropopause height for the SAGE III/M3M measurements. For 4 December 2002, altitude levels with temperatures below 195 K (PSC likely) are shaded gray.
In Fig. 7, a comparison of the aerosol extinction coefficient at 449 nm, the effective radius, the absolute mode width ω, and the aerosol number density from both the Kiruna OPC measurements and the derived data from collocated SAGE III/M3M sunset observations is shown. Additionally, in Fig. 7a–c the temperature as provided in the SAGE III/M3M (light blue) and OPC dataset (dark blue) is shown. Each column of plots shows data from 1 of 3 different days, i.e., 3 and 4 December 2002 and 10 January 2004. Finding good collocations is difficult, since both the OPC and SAGE III/M3M measurements are sparse. That is why the criteria for maximum spatial distance and temporal difference between the in situ and satellite measurements had to be chosen case by case in order to find a balance between sufficient sample size and actual comparability of the measured air volumes. For each date, three SAGE III/M3M events were found as good collocations and averaged to obtain the shown profiles. The maximum distance between the OPC measurement location and the collocated solar occultation events, in order of the three dates, was 1116, 760, and 915 km with a maximum time difference of 24 h. The balloon flight on 10 January 2004 actually targeted a SAGE III/M3M overflight. The satellite PSD data for this very close sunset event are included, but due to the noisy nature of individual profiles it is still averaged with two other profiles in order to have more altitude levels with reliable data. The SAGE III/M3M extinction data have a roughly 0.5 km vertical resolution and are also provided on a 0.5 km vertical grid (NASA/LARC/SD/ASDC, 2004). To achieve comparability, the OPC data, which are provided on a finer grid, are averaged to the same 0.5 km grid. The shown profiles of the SAGE III/M3M PSD parameters cover a smaller altitude range than the OPC data because the uncertainties of the extinction coefficients and therefore the uncertainties of the extinction ratios which are used for the aerosol size derivation are larger at the lower and upper end of the Junge layer. This leads to measurements more often falling outside the value range of the lookup table where no result can be obtained and to more data being filtered out as unreliable through the accuracy parameter (see Sect. 2.2). Averaging over a larger number of measurements would yield more data here but defeat the purpose of the dataset comparison. In general the comparison shows good agreement between the two PSD datasets across the different parameters, at least above roughly 15 km altitude.
Interestingly, the Kiruna WOPC measurements in December 2002 were targeted at PSCs that formed in the 2002/2003 arctic winter in a large-scale low-temperature region over the North Atlantic. Particularly on 4 December 2002, multiple passes through a PSC were achieved through controlled up and down motions of the balloon, which points towards the large horizontal scale of the cloud. During the WOPC measurements of this event the PSC was found roughly between 20 and 27 km, and both liquid STS and solid particles, possibly NAT, were identified (Larsen et al., 2004; Weisser et al., 2006).
In the middle column of Fig. 7, the altitude levels where the OPC measured temperature is lower than 195 K are shaded light gray. Here, the PSC signal can clearly be seen in both datasets in the extinction coefficient at 449 nm above 21 km altitude, although the satellite data have higher values across all altitude levels. Temperatures here are in part lower in the in situ dataset than in the satellite dataset, which points towards air volumes with different conditions likely having been observed by the satellite and the in situ measurements. Above 21 km altitude, in the PSC region, the size distribution parameters derived from SAGE III/M3M agree qualitatively with the OPC values, showing an increase in both the effective radius and absolute mode width of the size distribution. The absolute mode width ω shows remarkable agreement above 17 km; the OPC effective radii, however, show much higher values than the satellite-derived effective radii in the PSC layer. It should be noted that both datasets assume aerosol particle compositions, and therefore refractive indices, of typical pure sulfate particles, which may introduce considerable errors to the derived results.
Regarding the state of the Junge layer, below ∼21 km, both the 3 and 4 December measurements fall more or less into the category of background conditions, since the signals likely linked to Ruang and Reventador have not shown up yet at that point and the time before has been mostly volcanically quiescent.
The comparison of 10 January 2004 shows the overall best agreement between OPC and satellite PSD parameters. This result is encouraging and perhaps not fortuitous. The balloon measurement on 10 January was made specifically for a comparison with a SAGE III/M3M overpass of the balloon launching site and was coincident in time and spatially close. Also, the temperatures indicate there is little influence from PSCs, in contrast to the other two comparisons shown. The likely effects of Ruang and Reventador on stratospheric aerosol size have waned up to this point. Figure 6, though, shows a perturbation of the extinction coefficient in the lowermost stratosphere starting in summer 2003. It seems to then reach higher altitudes and to continue well into 2004, possibly influencing the 10 January comparison. The initial maximum in the northern summer of 2003 in the lowermost Junge layer could in part still be influenced by the volcanic material from the Ruang and Reventador eruptions, although another source seems likely due to the timing of this new maximum in the time series. During the northern summer 2003, there were only relatively small volcanic eruptions, such as the Anatahan (16.4° N) eruption on 10–12 May, whose ash plume rose up to 13.4 km, and the Bezymianny (56° N) eruption on 26 July 2003, where the emitted ∼ 0.003 Tg of SO2 rose up to approximately 11 km (Global Volcanism Program, 2023). Another possible source would be wildfire events. In their analysis of SAGE II data Thomason et al. (2023) identified only two significant smoke events in 2003: one event in January in Canberra, Australia, and one in August at Conibear Lake, Canada. The Canberra fire did reach and affect the stratosphere (Fromm et al., 2006) for a few months but only barely made it above the tropopause, not reaching the altitudes of the main signals in aerosol size that are found and discussed in this work. Also, the smoke event was located in Southern Hemisphere midlatitudes. The Conibear Lake smoke event was assessed to likely have had little influence on the stratosphere (Thomason et al., 2023). Lastly, the elevated aerosol extinction in January 2004 could also simply be unrelated to the unknown source of the summer 2003 signal (both seen in Fig. 6). Instead, the former may be an effect of the shift of the SAGE III/M3M measurements to higher latitudes and seasonal variability.
Since the number of available collocated measurements to analyze is so low, it is not possible to derive generalized conclusions from the dataset comparison presented in this section. Still, there may be a systematic difference between the OPC and SAGE III/M3M PSD parameters below roughly 15 km. For all 3 d, the effective radius and ω values are higher and the number densities are lower in the satellite PSD data than in the in situ data for these altitudes. Since both datasets being compared here share the same assumption on the monomodal lognormal PSD shape and similar assumptions on the refractive indices it is currently not clear what the origin of this discrepancy could be. One possible factor, however, may be the stated possibility of a positive bias in the 1545 nm channel of SAGE III/M3M below 15 km (Thomason et al., 2010). If such a positive bias existed, it would on average lead to an overestimation of the average aerosol size and an underestimation of the particle number density.
Differences in the sensitivity to different sizes of aerosol particles will also play a role in the comparison made in this section. For example, the WOPC instrument measures scattered white light (see Sect. 2.4), while for the SAGE III/M3M PSD derivation method used in this work two distinct channels in the visible and one in the near-infrared are used, which will already result in differences in sensitivity. Finally, it is difficult to say how much of the differences found in the PSD parameters of both datasets are simply a result of the sampling of air volumes that are too different due to the sparse spatial coverage of solar occultation measurements. In addition, the in situ measurements sample in a very limited spatial region, while the SAGE III/M3M profiles shown are representative of averages over multiple measurements, which themselves correspond to air volumes of hundreds of cubic kilometers (SAGE III ATDB Team, 2002). Keeping this in mind, the agreement between the two datasets is better than expected.
The assumption of a monomodal lognormal shape of the stratospheric aerosol PSD is fundamental to the SAGE III/M3M dataset and the OPC dataset that are compared in Sect. 4. Even though the assumption is a necessity for the satellite dataset due to the limited amount of independent spectral information, its effects have to be evaluated critically.
Occultation measurements are sensitive to a directed bias of the derived size distribution parameters if the assumed shape of the PSD is wrong, e.g., if the actual size distribution is close to a bimodal lognormal distribution as opposed to the monomodal lognormal distribution, which is assumed in this paper. This is relevant for all remote sensing geometries but affects, e.g., lidar and occultation measurements differently because of their different sensitivities to smaller and larger aerosol particles (von Savigny and Hoffmann, 2020).
Mie calculations and a test PSD derivation with synthetic data were conducted to illustrate how it would affect the aerosol size distribution parameters derived in this work if the actual PSD were to deviate from the assumed monomodal lognormal shape. Figure 8a shows the reference case, where the true size distribution (blue curve) is a monomodal lognormal PSD with a median radius of 150 nm and a geometric standard deviation σg of 1.6. Using a Mie code (EODG, 2018), the aerosol extinction coefficients at three wavelengths (449, 755, and 1545 nm) were then calculated for this synthetic PSD. Afterwards, the same size derivation method as described in Sect. 2.2 was used to obtain rmed, σg, and the number density N0. In Fig. 8a, this derived PSD is plotted with a thinner orange line. It is evident that the PSD parameter derivation using the lookup table works very well in such an idealized case without any measurement uncertainties when the true and the assumed shape of the PSD match, since both curves are basically identical.
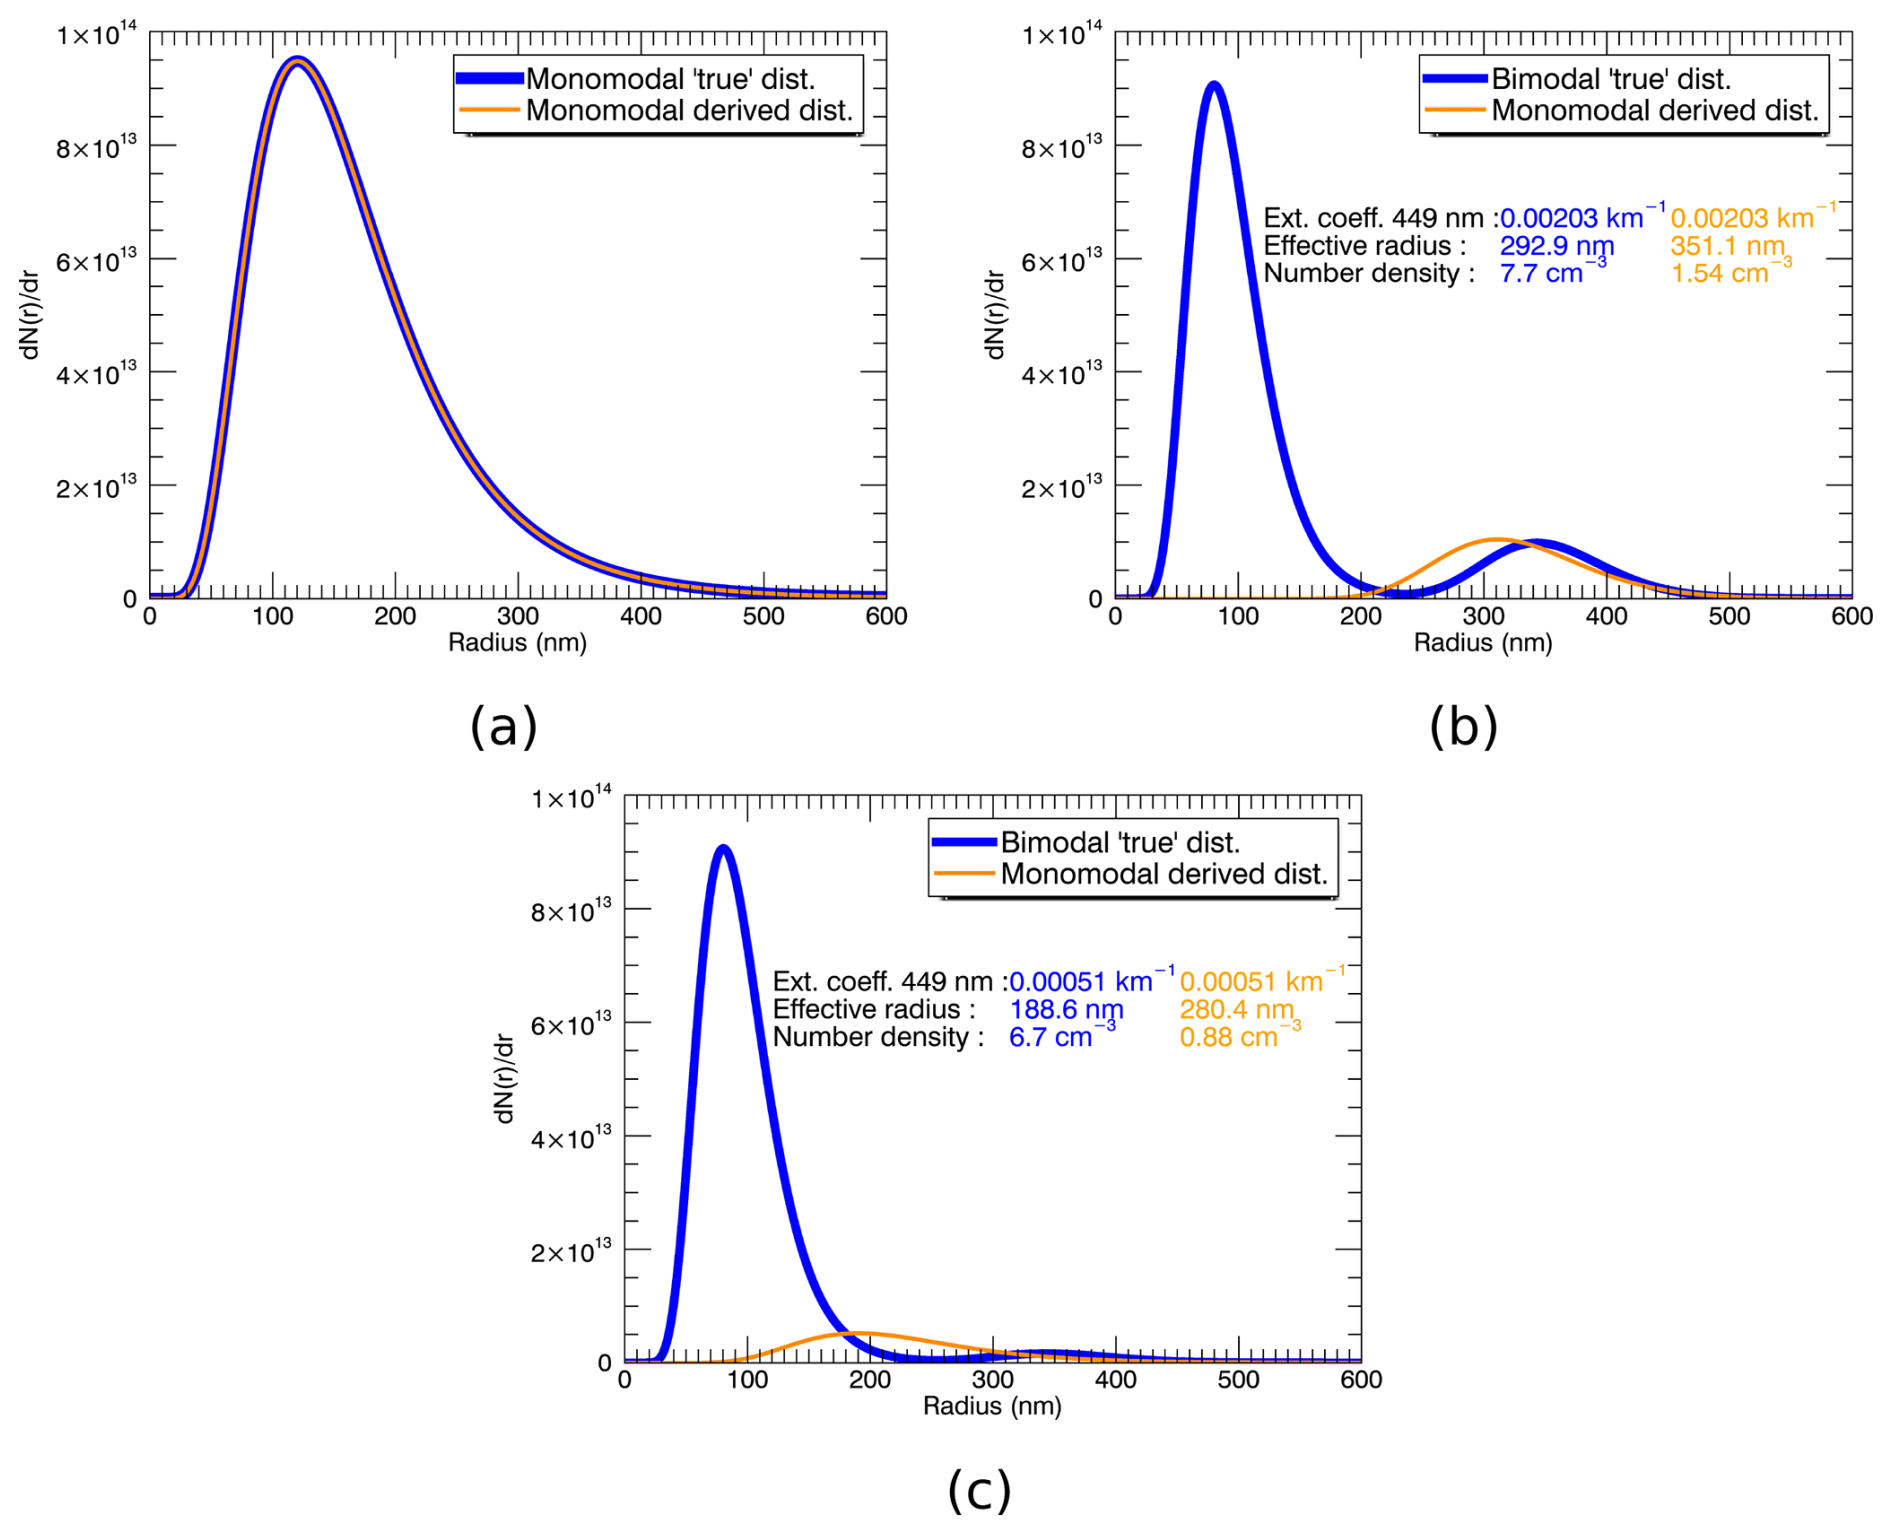
Figure 8Derived aerosol PSD (orange) from aerosol extinction ratios calculated with a Mie code from an exemplary synthetic PSD (blue), simulating the effect of a wrong monomodal assumption. (a) The synthetic “true” PSD is monomodal, like the derived PSD. (b) The true PSD is bimodal. (c) Smaller second mode than in panel (b).
For Fig. 8b, a bimodal distribution was assumed as the truth (blue curve), with rmed and σg values of 90 nm and 1.4 for the first mode and 350 nm and 1.15 for the second mode. The coarse-mode fraction (the number density of the second mode divided by the number density of the first mode) here is chosen as 0.18, i.e., larger than usual. As before, the extinction coefficients at three wavelengths are calculated and the PSD parameters are derived from those, with a monomodal assumption. The resulting size distribution is again shown as an orange curve. The extinction coefficient, effective radius, and number density of both the bimodal and monomodal distributions are given in the plot, also in blue and orange, respectively. The orange curve now stays close to the second mode instead of the much larger first mode. This is because the extinction efficiency and the extinction cross section of sulfate aerosol in this size range increase with increasing radius of the particle, which in this case leads to the second mode dominating the extinction signal produced by the aerosol population. A less extreme example and, based on the bimodal fit data of the Kiruna OPC measurements, much more common example is shown in Fig. 8c, where the second mode is even smaller relative to the first mode, with a coarse-mode fraction of roughly 0.03. What is seen here is characteristic of cases that are between Fig. 8a (monomodal) and Fig. 8b (very strong second mode), where the derived monomodal PSD will be influenced by both the first mode and second mode, and its peak will fall somewhere between the two. The larger the second mode is, the more the PSD parameter derivation will be dominated by it. With an even smaller second mode than in Fig. 8c, the derived PSD would be closer to the first mode again and the number density would be closer to the truth.
This implies that the results of the PSD derivations of this work (and in the end of all remote sensing derivations of stratospheric aerosol size) have to be interpreted as revealing information about only a certain part of the stratospheric aerosol PSD. This is the part of the size distribution that mainly contributes to the scattering signal, i.e., very roughly, the larger particles. Still, as discussed in Wrana et al. (2023) this does not call into question the qualitative observation of smaller average stratospheric aerosol size after certain volcanic eruptions, since the only plausible explanation for this observation seems to be an increase in the number of smaller aerosol particles if there is no large error in the assumptions on particle composition. As explained, however, “smaller particles” in this context means particles that are at least big enough to impact the optical signals measured through remote sensing.
In cases where the truth comes close to a monomodal lognormal size distribution, this bias is basically nonexistent. Unfortunately it is at least highly difficult, if not impossible, to derive the size distribution of stratospheric aerosol from remote sensing with sufficiently high size resolution to effectively eliminate this source of error. This is where in situ measurements and model simulations can play an important role to increase our knowledge of the circumstances under which stratospheric aerosol can be described well by a monomodal lognormal size distribution or other PSD shapes.
It is important to keep this possibly large source of errors in mind when using stratospheric aerosol size data derived from remote sensing measurements. Besides impacting other fields of research this issue has strong implications for the feasibility of hypothetical solar radiation management experiments that involve the planned enhancement of the Junge layer (Niemeier et al., 2013). For such experiments it would be critical to be able to monitor the size and, importantly, the surface area of the aerosol particles in the artificially enhanced stratospheric aerosol layer to be able to accurately predict sedimentation rates and therefore the lifetime of the aerosol particles in the stratosphere. As described in this section, the possibility to do this would be severely limited by missing knowledge of the actual shape of the stratospheric aerosol PSD and therefore of the smaller particles, which also compromises the ability to learn about the aerosol surface area.
All PSD parameters derived from remote sensing instruments will be affected by this issue, although different instruments will not be affected in exactly the same way since the use of different wavelengths and viewing geometries will affect the sensitivity to different parts of the PSD (i.e., smaller and larger particles). Measurement uncertainties at the individual wavelength channels will also impact this. A more specific analysis of an attempt to derive bimodal lognormal PSDs from the solar occultation SAGE III/ISS dataset was done by Knepp et al. (2024).
For this work, particle size distribution parameters of stratospheric aerosol were derived from the SAGE III/M3M solar occultation dataset. The evolution from 2002 to 2005 of the most useful parameters was shown and analyzed.
The aerosol size was derived using the three-wavelength extinction approach discussed by Wrana et al. (2021) that is viable due to the broad wavelength spectrum of the SAGE III instrument. Because of it no PSD parameter of the derived monomodal lognormal aerosol size distribution had to be assumed. In combination with the applicability of said method the SAGE III/M3M stratospheric aerosol dataset is special because it covers a time frame (up to 2004) that is close to background conditions, i.e., not strongly affected by volcanic eruptions and major wildfires. This makes the data useful for validation of other remote sensing stratospheric aerosol size datasets as well as for microphysical aerosol models that are coupled to climate models.
Also, due to the platform's orbit and the solar occultation geometry the dataset does not cover the tropics but instead covers middle to high latitudes in the Northern Hemisphere up to 80° N. This makes it possible to observe some high-latitude phenomena, such as polar stratospheric clouds. PSCs were observed in the northern winters of 2002/2003 and 2004/2005, when temperatures were particularly low. Starting in the same cold northern winters and lasting for almost a year, a reduction in the average size of aerosol was found in the lowermost stratosphere. It was manifested in a decrease in the median radius, absolute distribution width, and effective radius and an increase in the particle number density. These effects were stronger in the Northern Hemisphere. The tropical eruptions of the Ruang, Reventador, and Manam volcanoes are likely connected to these size reduction signals, which would put these eruptions in line with the Ambae, Ulawun, and La Soufrière eruptions that happened during the SAGE III/ISS mission and whose effect on aerosol size has been described in Wrana et al. (2023). All of these volcanic eruptions share similar characteristics, such as a relatively low amount of SO2 emitted (below 1 Tg), a tropical location, and relatively low injection heights, i.e., low temperature of the ambient air.
However, there are other factors that may have contributed to a decreased average stratospheric aerosol size: namely, the springtime condensation nuclei (CN) layer, which forms seasonally in the polar winter stratosphere and can increase the number of small particles. This may also be linked to meteoric smoke particles (MSPs), which form in the mesosphere, are transported towards the winter pole, and sink to lower altitudes in the stratosphere while interacting with the sulfate aerosol of the Junge layer and thereby growing larger. This could lead to them growing to measurable size and to an overall smaller derived size of the stratospheric aerosol PSD. For the aerosol size reduction found in 2003 and 2005 this is only relevant for the northern hemispheric measurements, since the southern hemispheric measurements happen at lower nonpolar latitudes.
In addition, balloon-borne in situ data from Kiruna, Sweden, were compared to collocated SAGE III/M3M-derived aerosol size data in order to validate the latter. Above roughly 15 km altitude, there is good to very good agreement between the two datasets in effective radius, absolute mode width, and number density. Below this altitude level, there seems to be a systematic difference, with the SAGE III/M3M dataset deriving larger particle sizes and lower number densities than the in situ data. However, the number of suitable collocations was very limited due to the sparse sampling of both datasets, therefore only allowing for a limited comparison and validation.
Finally, the effects of the assumed size distribution shape on the derived aerosol size data were discussed and illustrated. This is an issue not only for the dataset presented in this work, but also for aerosol size data derived from remote sensing instruments in general, since one way or another they all have to deal with a limited amount of information in their measurements, forcing a simplification of the PSD derivation, usually by applying some sort of analytical function to the derivation process. This stands in contrast to the high variability of real PSDs. Since in the typical size range of stratospheric aerosol larger particles tend to have a higher scattering cross section, even seemingly small deviations from the assumed size distribution shape can have a strong effect on, e.g., the peak position or the area under the derived PSD curve. In the case of the monomodal lognormal distribution assumed in this work this means, for example, that the existence of a second peak in the true PSD can lead to a strong underestimation of the number density in the derived size distribution. In light of this, the important role of in situ measurements should be stressed, since with them it is possible to derive the size distribution of stratospheric aerosol with a much higher particle size resolution than with remote sensing instruments.
The data published in this manuscript can be obtained upon request to the first author. The SAGE II (https://doi.org/10.5067/ERBS/SAGEII/SOLAR_BINARY_L2-V7.0, NASA/LARC/SD/ASDC, 2012) and SAGE III/M3M (https://doi.org/10.5067/M3M/SAGEIII/SOLAR_HDF-EOS_L2-V4.0, NASA/LARC/SD/ASDC, 2009) data were obtained from the NASA Earthdata Atmospheric Science Data Center (https://eosweb.larc.nasa.gov, last access: 12 June 2024). The in situ data are available at https://doi.org/10.15786/c.6379371.v1 (Deshler, 2023).
FW handled the different datasets, carried out the particle size retrieval, and created the figures. FW and CvS discussed and interpreted the results and proofread the manuscript. TD provided the OPC data and helped to understand the instrument. CL helped to improve the retrieved aerosol size dataset. LT helped with the understanding of the intricacies of the SAGE III/M3M dataset and the interpretation of retrieval data signals. All authors contributed to the writing of the manuscript.
The contact author has declared that none of the authors has any competing interests.
Publisher's note: Copernicus Publications remains neutral with regard to jurisdictional claims made in the text, published maps, institutional affiliations, or any other geographical representation in this paper. While Copernicus Publications makes every effort to include appropriate place names, the final responsibility lies with the authors.
We want to acknowledge support by the University of Greifswald and thank the Earth Observation Data Group at the University of Oxford for providing the IDL Mie routines used in this study.
This work was funded by the Deutsche Forschungsgemeinschaft (project VolARC of the DFG research unit VolImpact FOR 2820, grant no. 398006378). The in situ measurements presented here were supported by the US National Science Foundation under award 0095158.
This paper was edited by John Plane and reviewed by Filip Vanhellemont and one anonymous referee.
Ansmann, A., Baars, H., Chudnovsky, A., Mattis, I., Veselovskii, I., Haarig, M., Seifert, P., Engelmann, R., and Wandinger, U.: Extreme levels of Canadian wildfire smoke in the stratosphere over central Europe on 21–22 August 2017, Atmos. Chem. Phys., 18, 11831–11845, https://doi.org/10.5194/acp-18-11831-2018, 2018. a
Bardeen, C. G., Toon, O. B., Jensen, E. J., Marsh, D. R., and Harvey, V. L.: Numerical simulations of the three-dimensional distribution of meteoric dust in the mesosphere and upper stratosphere, J. Geophys. Res.-Atmos., 113, D17202, https://doi.org/10.1029/2007JD009515, 2008. a
Bogdan, A., Molina, M. J., Kulmala, M., MacKenzie, A. R., and Laaksonen, A.: Study of finely divided aqueous systems as an aid to understanding the formation mechanism of polar stratospheric clouds: Case of and systems. J. Geophys. Res., 108, 4302, https://doi.org/10.1029/2002JD002605, D10, 2003. a
Bourassa, A. E., Degenstein, D. A., and Llewellyn, E. J.: Retrieval of stratospheric aerosol size information from OSIRIS limb scattered sunlight spectra, Atmos. Chem. Phys., 8, 6375–6380, https://doi.org/10.5194/acp-8-6375-2008, 2008. a
Bovensmann, H., Burrows, J. P., Buchwitz, M., Frerick, J., Noël, S., Rozanov, V. V., Chance, K. V., and Goede, A. P. H.: SCIAMACHY: Mission Objectives and Measurement Modes, J. Atmos. Sci., 56, 127–150, https://doi.org/10.1175/1520-0469(1999)056<0127:SMOAMM>2.0.CO;2, 1999. a
Campbell, P. and Deshler, T.: Condensation nuclei measurements in the midlatitude (1982–2012) and Antarctic (1986–2010) stratosphere between 20 and 35 km, J. Geophys. Res.-Atmos., 119, 137–152, https://doi.org/10.1002/2013JD019710, 2014. a
Carslaw, K. S., Luo, B. P., Clegg, S. L., Peter, Th., Brimblecombe, P., and Crutzen, P. J.: Stratospheric aerosol growth and HNO3 gas phase depletion from coupled HNO3 and water uptake by liquid particles, Geophys. Res. Lett., 21, 2479–2482, https://doi.org/10.1029/94GL02799, 1994. a
Curtius, J.: Nucleation of atmospheric aerosol particles, C.R. Phys., 7, 1027–1045, https://doi.org/10.1016/j.crhy.2006.10.018, 2006. a
Deshler, T.: A review of global stratospheric aerosol: Measurements, importance, life cycle, and local stratospheric aerosol, Atmos. Res., 90, 223–232, 2008. a, b, c
Deshler, T.: University of Wyoming Stratospheric Aerosol Measurements, University of Wyoming, Wyoming Data repository [data set], https://doi.org/10.15786/c.6379371.v1, 2023. a, b, c
Deshler, T. and Oltmans, S.: Vertical profiles of Volcanic Aerosol and Polar Stratospheric Clouds Above Kiruna, Sweden: Winters 1993 and 1995, J. Atmos. Chem., 30, 11–23, https://doi.org/10.1023/A:1006023729315, 1998. a
Deshler, T., Hervig, M. E., Hofmann, D. J., Rosen, J. M., and Liley, J. B.: Thirty years of in situ stratospheric aerosol size distribution measurements from Laramie, Wyoming (41° N), using balloon-borne instruments, J. Geophys. Res., 108, 4517, https://doi.org/10.1029/2003JD003479, 2003a. a, b, c
Deshler, T., Larsen, N., Weisser, C., Schreiner, J., Mauersberger, K., Cairo, F., Adriani, A., Di Donfrancesco, G., Ovarlez, J., Ovarlez, H., Blum, U., Fricke, K. H., and Dörnbrack, A.: Large nitric acid particles at the top of an Arctic stratospheric cloud, J. Geophys. Res., 108, 4517, https://doi.org/10.1029/2003JD003479, 2003b. a
Deshler, T., Anderson-Sprecher, R., Jäger, H., Barnes, J., Hofmann, D. J., Clemesha, B., Simonich, D., Osborn, M., Grainger, R. G., and Godin-Beekmann, S.: Trends in the nonvolcanic component of stratospheric aerosol over the period 1971–2004, J. Geophys. Res., 111, D01201, https://doi.org/10.1029/2005JD006089, 2006. a
Deshler, T., Luo, B., Kovilakam, M., Peter, T., and Kalnajs, L. E.: Retrieval of Aerosol Size Distributions From In Situ Particle Counter Measurements: Instrument Counting Efficiency and Comparisons With Satellite Measurements, J. Geophys. Res.-Atmos., 124, 5058–5087, https://doi.org/10.1029/2018JD029558, 2019. a
Engel, I., Luo, B. P., Pitts, M. C., Poole, L. R., Hoyle, C. R., Grooß, J.-U., Dörnbrack, A., and Peter, T.: Heterogeneous formation of polar stratospheric clouds – Part 2: Nucleation of ice on synoptic scales, Atmos. Chem. Phys., 13, 10769–10785, https://doi.org/10.5194/acp-13-10769-2013, 2013. a
EODG (Earth Observation Data Group): Mie scattering routines, Department of Physics [code], Oxford University, http://eodg.atm.ox.ac.uk/MIE/index.html, 20 August 2018. a, b
Flynn, L., Long, C., Wu, X., Evans, R., Beck, C. T., Petropavlovskikh, I., McConville, G., Yu, W., Zhang, Z., Niu, J., Beach, E., Hao, Y., Pan, C., Sen, B., Novicki, M., Zhou, S., and Seftor, C.: Performance of the Ozone Mapping and Profiler Suite (OMPS) products, J. Geophys. Res.-Atmos., 119, 6181–6195, 2014. a
Fromm, M., Tupper, A., Rosenfeld, D., Servranckx, R., and McRae, R.: Violent pyro-convective storm devastates Australia’s capital and pollutes the stratosphere, Geophys. Res. Lett., 33, L05815, https://doi.org/10.1029/2005GL025161, 2006. a
Gleason, J. F., Bhartia, P. K., Herman, J. R., McPeters, R., Newman, P., Stolarski, R. S., Flynn, L., Labow, G., Larko, D., Seftor, C., Wellemeyer, C., Komhyr, W. D., Miller, A. J., and Planet, W.: Record low global ozone in 1992, Science, 260, 523–526, https://doi.org/10.1126/science.260.5107.523, 1993. a
Global Volcanism Program: Volcanoes of the World [Database], v. 5.1.5, 23 Dec 2024, compiled by: Venzke, E., Smithsonian Institution, https://doi.org/10.5479/si.GVP.VOTW5-2023.5.1, 2023. a, b, c, d, e, f
Grainger, R. G.: Some Useful Formulae for Aerosol Size Distributions and Optical Properties, http://eodg.atm.ox.ac.uk/user/grainger/research/aerosols.pdf (last access: 12 August 2024), 2023. a
Hall, M., Ramon, P., Mothes, P., Le Pennec, J.-L., Garcia, A., Samaniego, P., and Yepes, H.: Volcanic eruptions with little warning: the case of Volcan Reventador’s Surprise November 3, 2002 Eruption, Ecuador, Rev. Geol. Chile, 31, 349–358, https://doi.org/10.4067/S0716-02082004000200010, 2004. a, b
Hanson, D. and Mauersberger, K.: Laboratory studies of the nitric acid trihydrate: Implications for the south polar stratosphere, Geophys. Res. Lett., 15, 855–858, https://doi.org/10.1029/GL015i008p00855, 1988. a
Hervig, M. and Deshler, T.: Evaluation of aerosol measurements from SAGE II, HALOE, and balloonborne optical particle counters, J. Geophys. Res.-Atmos., 107, AAC 3-1–AAC 3-12, https://doi.org/10.1029/2001JD000703, 2002. a
Hervig, M. E., Bardeen, C. G., Siskind, D. E., Mills, M. J., and Stockwell, R.: Meteoric smoke and H2SO4 aerosols in the upper stratosphere and mesosphere, Geophys. Res. Lett., 44, 1150–1157, https://doi.org/10.1002/2016GL072049, 2017. a
Hofmann, D. J. and Deshler, T.: Stratospheric cloud observations during formation of the Antarctic ozone hole in 1989, J. Geophys. Res.-Atmos., 96, 2897–2912, https://doi.org/10.1029/90JD02494, 1989. a
Hofmann, D. J. and Solomon, S.: Ozone destruction through heterogeneous chemistry following the eruption of El Chichón, J. Geophys. Res.-Atmos., 94, 5029–5041, 1989. a
Hofmann, D. J.: Measurement of the condensation nuclei profile to 31 km in the Arctic in January 1989 and comparisons with Antarctic measurements, Geophys. Res. Lett., 17, 357–360, 1990. a
Hoyle, C. R., Engel, I., Luo, B. P., Pitts, M. C., Poole, L. R., Grooß, J.-U., and Peter, T.: Heterogeneous formation of polar stratospheric clouds – Part 1: Nucleation of nitric acid trihydrate (NAT), Atmos. Chem. Phys., 13, 9577–9595, https://doi.org/10.5194/acp-13-9577-2013, 2013. a
Hunten, D. M., Turco, R. P., and Toon, O. B.: Smoke and Dust Particles of Meteoric Origin in the Mesosphere and Stratosphere, J. Atmos. Sci., 37, 1342–1357, https://doi.org/10.1175/1520-0469(1980)037<1342:SADPOM>2.0.CO;2, 1980. a
Junge, C. E., Chagnon, C. W., and Manson, J. E.: A worldwide stratospheric aerosol layer, Science, 133, 1478–1479, 1961a. a
Junge, C. E., Chagnon, C. W., and Manson, J. E.: Stratospheric aerosols, J. Meteorol., 18, 81–108, https://doi.org/10.1175/1520-0469(1961)018<0081:SA>2.0.CO;2, 1961b. a
Koop, T., Luo, B., Tsias, A., and Peter, T.: Water activity as the determinant for homogeneous ice nucleation in aqueous solutions, Nature, 406, 611–614, https://doi.org/10.1038/35020537, 1997. a
Korhonen, H., Lehtinen, K. E. J., Pirjola, L., Napari, I., and Vehkamäki, H.: Simulation of atmospheric nucleation mode: Acomparison of nucleation models and sizedistribution representations, J. Geophys. Res., 108, 4471, https://doi.org/10.1029/2002JD003305, 2003. a
Knepp, T. N., Kovilakam, M., Thomason, L., and Miller, S. J.: Characterization of stratospheric particle size distribution uncertainties using SAGE II and SAGE III/ISS extinction spectra, Atmos. Meas. Tech., 17, 2025–2054, https://doi.org/10.5194/amt-17-2025-2024, 2024. a, b
Kremser, S., Thomason, L. W., von Hobe, M., Hermann, M., Deshler, T., Timmreck, C., Toohey, M., Stenke, A., Schwarz, J. P., Weigel, R., Fueglistaler, S., Prata, F. J., Vernier, J.-P., Schlager, H., Barnes, J. E., Antuña-Marrero, J.-C., Fairlie, D., Palm, M., Mahieu, E., Notholt, J., Rex, M., Bingen, C., Vanhellemont, F., Bourassa, A., Plane, J. M. C., Klocke, D., Carn, S. A., Clarisse, L., Trickl, T., Neely, R., James, A. D., Rieger, L., Wilson, J. C., and Meland, B.: Stratospheric aerosol – Observations, processes, and impact on climate, Rev. Geophys., 54, 278–335, https://doi.org/10.1002/2015RG000511, 2006. a, b, c, d
Lacis, A., Hansen, J., and Sato, M.: Climate forcing by stratospheric aerosols, Geophys. Res. Lett., 19, 1607–1610, 1992. a
Larsen, N., Knudsen, B. M., Svendsen, S. H., Deshler, T., Rosen, J. M., Kivi, R., Weisser, C., Schreiner, J., Mauerberger, K., Cairo, F., Ovarlez, J., Oelhaf, H., and Spang, R.: Formation of solid particles in synoptic-scale Arctic PSCs in early winter 2002/2003, Atmos. Chem. Phys., 4, 2001–2013, https://doi.org/10.5194/acp-4-2001-2004, 2004. a
Li, Y., Pedersen, C., Dykema, J., Vernier, J.-P., Vattioni, S., Pandit, A. K., Stenke, A., Asher, E., Thornberry, T., Todt, M. A., Bui, T. P., Dean-Day, J., and Keutsch, F. N.: In situ measurements of perturbations to stratospheric aerosol and modeled ozone and radiative impacts following the 2021 La Soufrière eruption, Atmos. Chem. Phys., 23, 15351–15364, https://doi.org/10.5194/acp-23-15351-2023, 2023. a
Llewellyn, E. J., Lloyd, N. D., Degenstein, D. A., Gattinger, R. L., Petelina, S. V., Bourassa, A. E., Wiensz, J. T., Ivanov, E. V., McDade, I. C., Solheim, B. H., McConnell, J. C., Haley, C. S., von Savigny, C., Sioris, C. E., McLinden, C. A., Griffioen, E., Kaminski, J., Evans, W., Puckrin, E., Strong, K., Wehrle, V., Hum, R. H., Kendall, D., Matsushita, J., Murtagh, D. P., Brohede, S., Stegman, J., Witt, G., Barnes, G., Payne, W. F., Piché, L., Smith, K., Warshaw, G., Deslauniers, D.-L., Marchand, P., Richardson, E. H., King, R. A., Wevers, I., McCreath, W., Kyrölä, E., Oikarinen, L., Leppelmeier, G. W., Auvinen, H., Mégie, G., Hauchecorne, A., Lefèvre, F., de La Nöe, J., Ricaud, P., Frisk, U., Sjoberg, F., von Schéele, F., and Nordh, L.: The OSIRIS instrument on the Odin spacecraft, Can. J. Phys., 82, 411–422, https://doi.org/10.1139/p04-005, 2004. a
Lowe, D. and MacKenzie, A. R.: Polar stratospheric cloud microphysics and chemistry, J. Atmos. Sol.-Terr. Phy., 70, 13–40, https://doi.org/10.1016/j.jastp.2007.09.011, 2008. a, b
Malinina, E., Rozanov, A., Rozanov, V., Liebing, P., Bovensmann, H., and Burrows, J. P.: Aerosol particle size distribution in the stratosphere retrieved from SCIAMACHY limb measurements, Atmos. Meas. Tech., 11, 2085–2100, https://doi.org/10.5194/amt-11-2085-2018, 2018. a
McCormick, M. P., Hamill, P., Pepin, T. J., Chu, W. P., Swissler, T. J., and McMaster, L. R.: Satellite Studies of the Stratospheric Aerosol, B. Am. Meteorol. Soc., 60, 1038–1046, https://doi.org/10.1175/1520-0477(1979)060<1038:SSOTSA>2.0.CO;2, 1979. a
McCormick, M. P.: Sage II: An overview, Adv. Space Res., 7, 219–226, https://doi.org/10.1016/0273-1177(87)90151-7, 1987. a, b, c
Megner, L., Siskind, D. E., Rapp, M., and Gumbel, J.: Global and temporal distribution of meteoric smoke: A two-dimensional simulation study, J. Geophys. Res., 113, D03202, https://doi.org/10.1029/2007JD009054, 2008. a, b, c, d
Mie, G.: Beiträge zur Optik trüber Medien, speziell kolloidaler Metallösungen, Ann. Phys.-Berlin, 25, 377–445, https://doi.org/10.1002/andp.19083300302, 1908. a
Mills, M. J., Toon, O. B., Vaida, V., Hintze, P. E., Kjaergaard, H. G., Schofield, D. P., and Robinson, T. W.: Photolysis of sulfuric acid vapor by visible light as a source of the polar stratospheric CN layer, J. Geophys. Res., 110, D08201, https://doi.org/10.1029/2004JD005519, 2005. a
Murphy, D. M., Froyd, K. D., Schwarz, J. P., and Wilson, J. C.: Observations of the chemical composition of stratospheric aerosol particles, Q. J. Roy. Meteor. Soc., 140, 1269–1278, https://doi.org/10.1002/qj.2213, 2013. a
NASA/LARC/SD/ASDC: SAGE III/M3M Data Products User's Guide: https://asdc.larc.nasa.gov/documents/sage3/guide/Data_Product_User_Guide.pdf, last access: 25 January 2024), 2004. a, b
NASA/LARC/SD/ASDC: SAGE III Meteor-3M L2 Solar Event Species Profiles (HDF-EOS) V004, NASA Langley Atmospheric Science Data Center DAAC [data set], https://doi.org/10.5067/M3M/SAGEIII/SOLAR_HDF-EOS_L2-V4.0, 2009. a, b, c, d
NASA/LARC/SD/ASDC: Stratospheric Aerosol and Gas Experiment (SAGE) II Version 7.0 Aerosol, O3, NO2 and H2O Profiles in binary format, NASA Langley Atmospheric Science Data Center DAAC [data set], https://doi.org/10.5067/ERBS/SAGEII/SOLAR_BINARY_L2-V7.0, 2012. a, b, c, d
Niemeier, U., Schmidt, H., Alterskjær, K., and Kristjánsson, J. E.: Solar irradiance reduction via climate engineering: Impact of different techniques on the energy balance and the hydrological cycle, J. Geophys. Res., 118, 11905–11917, https://doi.org/10.1002/2013JD020445, 2013. a
Norgren, M., Kalnajs, L. E., and Deshler, T.: Measurements of Total Aerosol Concentration in the Stratosphere: A New Balloon-Borne Instrument and a Report on the Existing Measurement Record, J. Geophys. Res.-Atmos., 129, e2024JD040992, https://doi.org/10.1029/2024JD040992, 2024. a
Oberbeck, V. R., Livingston, J. M., Russell, P. B., Pueschel, R. F., Rosen, J. N., Osborn, M. T., Kritz, M. A., Snetsinger, K. G., and Ferry, G. V.: SAGE II aerosol validation: Selected altitude measurements, including particle micromeasurements, J. Geophys. Res.-Atmos., 94, 8367–8380, https://doi.org/10.1029/JD094iD06p08367, 1989. a
Ohneiser, K., Ansmann, A., Kaifler, B., Chudnovsky, A., Barja, B., Knopf, D. A., Kaifler, N., Baars, H., Seifert, P., Villanueva, D., Jimenez, C., Radenz, M., Engelmann, R., Veselovskii, I., and Zamorano, F.: Australian wildfire smoke in the stratosphere: the decay phase in 2020/2021 and impact on ozone depletion, Atmos. Chem. Phys., 22, 7417–7442, https://doi.org/10.5194/acp-22-7417-2022, 2022. a
Palmer, K. F. and Williams, D.: Optical Constants of Sulfuric Acid; Application to the Clouds of Venus?, Appl. Optics, 14, 208–219, https://doi.org/10.1364/AO.14.000208, 1975. a
Peter, T.: Microphysics and heterogeneous chemistry of polar stratospheric clouds, Annu. Rev. Phys. Chem., 48, 785–822, https://doi.org/10.1146/annurev.physchem.48.1.785, 1997. a
Pirjola, L., Kulmala, M., Wilck, M., Bischoff, A., Stratmann, F., and Otto, E.: Formation of sulphuric acid aerosols and cloud condensation nuclei: An expression for significant nucleation and model comparison, J. Aerosol Sci., 30, 1079–1094, https://doi.org/10.1016/S0021-8502(98)00776-9, 1999. a
Plane, J. M. C.: Cosmic dust in the Earth’s atmosphere, Chem. Soc. Rev., 41, 6507–6518, https://doi.org/10.1039/c2cs35132c, 2012. a
Pohl, C., Wrana, F., Rozanov, A., Deshler, T., Malinina, E., von Savigny, C., Rieger, L. A., Bourassa, A. E., and Burrows, J. P.: Stratospheric aerosol characteristics from SCIAMACHY limb observations: two-parameter retrieval, Atmos. Meas. Tech., 17, 4153–4181, https://doi.org/10.5194/amt-17-4153-2024, 2024. a
Roberts, R. R., Milov, Y. G., Zonov, Y. V., Salikhov, R. S., and Charles, L. B.: IAN-USA SAGE III/Meteor-3M project, Acta Astronaut., 38, 479–485, https://doi.org/10.1016/0094-5765(96)00020-3, 1996. a
Robock, A.: Important research questions on volcanic eruptions and climate, Past Global Changes Magazine, 23, p. 68, https://doi.org/10.22498/pages.23.2, 2015. a
Rosen, J. M.: The boiling point of Stratospheric Aerosols, J. Appl. Meteorol., 10, 1044–1046, https://doi.org/10.1175/1520-0450(1971)010<1044:TBPOSA>2.0.CO;2, 1971. a
Rozanov, A., Pohl, C., Arosio, C., Bourassa, A., Bramstedt, K., Malinina, E., Rieger, L., and Burrows, J. P.: Retrieval of stratospheric aerosol extinction coefficients from sun-normalized Ozone Mapper and Profiler Suite Limb Profiler (OMPS-LP) measurements, Atmos. Meas. Tech., 17, 6677–6695, https://doi.org/10.5194/amt-17-6677-2024, 2024. a
SAGE III ATBD Team: SAGE III Algorithm Theoretical Basis Document: Solar and Lunar Algorithm, Earth Observing System, https://eospso.gsfc.nasa.gov/sites/default/files/atbd/atbd-sage-solar-lunar.pdf (last access: 25 January 2024), 2002. a, b
Saunders, R. W., Dhomse, S., Tian, W. S., Chipperfield, M. P., and Plane, J. M. C.: Interactions of meteoric smoke particles with sulphuric acid in the Earth's stratosphere, Atmos. Chem. Phys., 12, 4387–4398, https://doi.org/10.5194/acp-12-4387-2012, 2012. a
Schneider, J., Weigel, R., Klimach, T., Dragoneas, A., Appel, O., Hünig, A., Molleker, S., Köllner, F., Clemen, H.-C., Eppers, O., Hoppe, P., Hoor, P., Mahnke, C., Krämer, M., Rolf, C., Grooß, J.-U., Zahn, A., Obersteiner, F., Ravegnani, F., Ulanovsky, A., Schlager, H., Scheibe, M., Diskin, G. S., DiGangi, J. P., Nowak, J. B., Zöger, M., and Borrmann, S.: Aircraft-based observation of meteoric material in lower-stratospheric aerosol particles between 15 and 68° N, Atmos. Chem. Phys., 21, 989–1013, https://doi.org/10.5194/acp-21-989-2021, 2021. a
Solomon, S., Daniel, J. S., Neely III, R. R., Vernier, J.-P., Dutton, E. G., and Thomason, L. W.: The Persistently Variable “Background” Stratospheric Aerosol Layer and Global Climate Change, Science, 333, 866–870, https://doi.org/10.1126/science.1206027, 2011. a
Steele, H. M. and Hamill, P.: Effects of temperature and humidity on the growth and optical properties of sulphuric acid-water droplets in the stratosphere, J. Aerosol. Sci., 12, 517–528, https://doi.org/10.1016/0021-8502(81)90054-9, 1981. a
Sugita, T., Kondo, Y., Koike, M., Kanada, M., Toriyama, N., and Nakajima, H.: Balloon-Borne Optical Counter for in Situ Aerosol Measurements, J. Atmos. Chem., 32, 183–204, https://doi.org/10.1023/A:1006128527288, 1999. a
Tabazadeh, A., Turco, R. P., Drdla, K., Jacobson, M. Z., and Toon, O. B.: A study of type I polar stratospheric cloud formation, Geophys. Res. Lett., 21, 1619–1622, https://doi.org/10.1029/94GL01368, 1994. a
Taha, G., Loughman, R., Zhu, T., Thomason, L., Kar, J., Rieger, L., and Bourassa, A.: OMPS LP Version 2.0 multi-wavelength aerosol extinction coefficient retrieval algorithm, Atmos. Meas. Tech., 14, 1015–1036, https://doi.org/10.5194/amt-14-1015-2021, 2021. a
Thomason, L. W. and Taha, G.: SAGE-III aerosol extinction measurements: Initial results, Geophys. Res. Lett., 30, 1631, https://doi.org/10.1029/2003GL017317, 2003. a
Thomason, L. W., Burton, S. P., Luo, B.-P., and Peter, T.: SAGE II measurements of stratospheric aerosol properties at non-volcanic levels, Atmos. Chem. Phys., 8, 983–995, https://doi.org/10.5194/acp-8-983-2008, 2008. a, b, c
Thomason, L. W., Moore, J. R., Pitts, M. C., Zawodny, J. M., and Chiou, E. W.: An evaluation of the SAGE III version 4 aerosol extinction coefficient and water vapor data products, Atmos. Chem. Phys., 10, 2159–2173, https://doi.org/10.5194/acp-10-2159-2010, 2010. a, b, c, d
Thomason, L. W. and Knepp, T.: Quantifying SAGE II (1984–2005) and SAGE III/ISS (2017–2022) observations of smoke in the stratosphere, Atmos. Chem. Phys., 23, 10361–10381, https://doi.org/10.5194/acp-23-10361-2023, 2023. a, b, c
Tolbert, M. A. and Toon, O. B.: Solving the PSC Mystery, Science, 292, 61–63, https://doi.org/10.1126/science.1060083, 2001. a
Tritscher, I., Pitts, M. C., Poole, L. R., Alexander, S. P., Cairo, F., Chipperfield, M. P., Grooß, J.-U., Höpfner, M., Lambert, A., Luo, B., Molleker, S., Orr, A., Salawitch, R., Snels, M., Spang, R., Woiwode, W., and Peter, T.: Polar Stratospheric Clouds: Satellite Observations, Processes, and Role in Ozone Depletion, Rev. Geophys., 59, e2020RG000702, https://doi.org/10.1029/2020RG000702, 2021. a
Tupper, A., Itikarai, I., Richards, M., Prata, F., Carn, S., and Rosenfeld, D.: Facing the Challenges of the International Airways Volcano Watch: The 2004/05 Eruptions of Manam, Papua New Guinea, Weather Forecast., 22, 175–191, https://doi.org/10.1175/WAF974.1, 2007. a
Vehkamäki, H., Kulmala, M., Napari, I., Lehtinen, K. E. J., Timmreck, C., Noppel, M., and Laaksonen, A.: An improved parameterization for sulfuric acid–water nucleation rates for tropospheric and stratospheric conditions, J. Geophys. Res., 107, 4622, https://doi.org/10.1029/2002JD002184, 2002. a
Voigt, C., Schreiner, J., Kohlmann, A., Zink, P., Mauersberger, K., Larsen, N., Deshler, T., Kröger, C., Rosen, J., Adriani, A., Cairo, F., Di Donfrancesco, G., Viterbini, M., Ovarlez, J., Ovarlez, H., David, C., and Dörnbrack, A.: Nitric acid trihydate (NAT) in polar stratospheric clouds, Science, 290, 1756–1758, 2000. a
von Savigny, C. and Hoffmann, C. G.: Issues related to the retrieval of stratospheric-aerosol particle size information based on optical measurements, Atmos. Meas. Tech., 13, 1909–1920, https://doi.org/10.5194/amt-13-1909-2020, 2020. a
Weisser, C., Mauersberger, K., Schreiner, J., Larsen, N., Cairo, F., Adriani, A., Ovarlez, J., and Deshler, T.: Composition analysis of liquid particles in the Arctic stratosphere under synoptic conditions, Atmos. Chem. Phys., 6, 689–696, https://doi.org/10.5194/acp-6-689-2006, 2006. a, b, c
Wilson, J. C., Stolzenburg, M. R., Clark, W. E., Loewenstein, M., Ferry, G. V., and Chan, K. R.: Measurements of condensation nuclei in the airborne Arctic stratospheric expedition: Observations of particle production in the polar vortex, Geophys. Res. Lett., 17, 361–364, 1990. a
Wrana, F., von Savigny, C., Zalach, J., and Thomason, L. W.: Retrieval of stratospheric aerosol size distribution parameters using satellite solar occultation measurements at three wavelengths, Atmos. Meas. Tech., 14, 2345–2357, https://doi.org/10.5194/amt-14-2345-2021, 2021. a, b, c, d, e, f
Wrana, F., Niemeier, U., Thomason, L. W., Wallis, S., and von Savigny, C.: Stratospheric aerosol size reduction after volcanic eruptions, Atmos. Chem. Phys., 23, 9725–9743, https://doi.org/10.5194/acp-23-9725-2023, 2023. a, b, c, d, e, f, g, h, i
Yue, G. K., McCormick, M. P., and Chu, W. P.: Retrieval of Composition and Size Distribution of Stratospheric Aerosols with the SAGE II Satellite Experiment, J. Atmos. Ocean Tech., 3, 371–380, https://doi.org/10.1175/1520-0426(1986)003<0371:ROCASD>2.0.CO;2, 1986. a
Yue, G. K., Thomason, L. W., Poole, L. R., Wang, P.-H., Baumgardner, D., and Dye, J. E.: Aerosol surface areas deduced from early 1993 SAGE II data and comparisons with stratospheric photochemistry, aerosols, and dynamics expedition measurements, Geophys. Res. Lett., 22, 2933–2936, https://doi.org/10.1029/95GL02941, 1995. a