the Creative Commons Attribution 4.0 License.
the Creative Commons Attribution 4.0 License.
 | 27 Mar 2025
Measurement report: Optical and structural properties of atmospheric water-soluble organic carbon in China – insights from multi-site spectroscopic measurements
Haibiao Chen
Caiqing Yan
Liubin Huang
Yang Yue
Xinfeng Wang
Qingcai Chen
Mingjie Xie
Junwen Liu
Fengwen Wang
Shuhong Fang
Qiaoyun Yang
Hongya Niu
Mei Zheng
Yan Wu
Likun Xue
To understand the spatial variation of optical and structural properties of water-soluble brown carbon and its influencing factors in China, the light absorption, fluorescence, and Fourier transform infrared (FTIR) spectrum of water-soluble organic carbon (WSOC) in different regions of China are measured following the same analytical methods. The average light absorption coefficients and mass absorption efficiencies of WSOC at 365 nm (Abs365 and MAE365) rank from high to low as northwest China > southwest China > north China > east China > regional site, with higher values in northern China than southern China and regional sites and higher values in inland areas than coastal areas. The light absorption factors resolved by light absorption spectra-based positive matrix factorization model and the abundance of aromatic O−H and C=C functional groups determined by FTIR both indicate that aromatic compounds are significant light-absorbing substances in WSOC and have a significant impact on fluorophores. Multiple linear regression analysis shows that the fluorophores identified by fluorescence spectra combined with parallel factor analysis (PARAFAC) contribute to about 62 %–93 % of the WSOC light absorption at all sites, in which humic-like substance (HULIS) contributes the most, especially highly oxygenated HULIS (29 %–50 %) with long emission wavelengths. Combustion source emissions and atmospheric chemical processes have significant impacts on the WSOC light absorption at some sites. Moreover, relative humidity (RH) can also affect MAE365 of WSOC, with MAE365 values decreasing with the increase in RH when RH<60 % and remaining relatively unchanged when RH>60 %. Taken together, this study promotes a better understanding of the spatial heterogeneity of optical and structural properties of WSOC and their influencing factors in China.
- Article
(6086 KB) - Full-text XML
-
Supplement
(3548 KB) - BibTeX
- EndNote


Brown carbon (BrC) is an important type of carbonaceous aerosol that absorbs light over the ultraviolet and visible (UV–Vis) range and exhibits a strong wavelength dependence (Andreae and Gelencsér, 2006). BrC has substantial effects on atmospheric radiative forcing and regional climate due to its strong light absorption capacity in the UV–Vis range and has attracted widespread attention in recent years (Laskin et al., 2015; Wang et al., 2022b). It has been simulated that BrC contributes up to 72 % of the total light absorption of aerosols at 370 nm globally and that the global direct radiative effect of BrC (+0.048 W m−2) is about 30 % of black carbon (+0.17 W m−2) (Wang et al., 2018). However, the lack of field measurements limits the model's ability to extend to global simulations of BrC. The spatiotemporal variation of optical properties of BrC is one of the key factors leading to the uncertainty in the radiation assessment of organic aerosols. A comprehensive and clear understanding of optical properties of BrC in different regions is essential to accurately assess the atmospheric radiative forcing of aerosols.
Solvent-soluble organic carbon (e.g., water-soluble organic carbon, WSOC, and methanol-soluble organic carbon, MSOC) is often used to act as a substitute of BrC. In particular, light absorption of WSOC has been extensively studied due to its widespread presence and high atmospheric abundance in the atmosphere as well as mature extraction methods, although some previous studies have indicated that water-insoluble OC (WISOC) contains more light-absorbing BrC (Cao et al., 2021; Chen et al., 2024; Cheng et al., 2016; Yan et al., 2017). Absorption and fluorescence spectroscopy are two of the most widely used methods to reveal optical properties of WSOC (Wang et al., 2022b; Wu et al., 2021). Using light absorption spectroscopy analysis, light absorption characteristics and capabilities of WSOC from different sources or environments are usually characterized by the absorption coefficient or mass absorption efficiency of a specific wavelength over the range of 360–370 nm (average 365 nm) (Hecobian et al., 2010). And the direct radiative forcing of WSOC can be further estimated by simplified radiative forcing models combined with the measured absorption coefficient. The fluorescence spectra obtained by fluorescence spectroscopy measurement could be used to characterize fluorescence fingerprints of WSOC and provide source-related information of WSOC according to fluorescent indices. In addition, the parallel factor analysis (PARAFAC) could be used to analyze fluorescence spectra and help to infer the chemical and structural characteristics of WSOC chromophores (Chen et al., 2020; Wu et al., 2021).
Spectroscopy-based studies conducted in different countries or regions all over the world show that there are significant spatiotemporal differences in the light absorption characteristics of WSOC. For example, the mass absorption efficiency of WSOC is generally higher in Asia than in North America and Europe and higher in winter compared to summer (Hecobian et al., 2010; Kirillova et al., 2014; Teich et al., 2017; Wang et al., 2022a). Furthermore, light absorption of WSOC can also vary from location to location even within the same region (Cao et al., 2024b). However, the current understanding of spatial differences in light absorption and fluorescence characteristics of WSOC is mainly based on the results from different laboratories with different extraction and analysis methods. This may affect the interpretation and accuracy of comparison results due to differences in the analytical methods. For example, it has been shown that the size of the syringe filter could lead to differences in the solvent-soluble BrC light absorption measurement results (Zhang et al., 2022a). Therefore, it is more convincing and necessary to use a uniform method to compare the optical properties of WSOC in different regions.
Previous studies have suggested that there may be a link between the light absorption and fluorescence components of BrC (Chen et al., 2019; Niu et al., 2022; Tang et al., 2021) as the necessary condition for an organic compound to produce a fluorescent signal is that it absorbs light. This means that fluorescent substances must be able to absorb light, and substances that can absorb light are not necessarily fluorescent. However, studies on the relationship between light absorption and fluorescence of BrC are still very limited, and the contribution of fluorescent components identified by the commonly used three-dimensional fluorescence spectroscopy to the light absorption of BrC has not been well quantified. Additionally, Fourier transform infrared (FTIR) has been used for the structural characterization of BrC as a non-destructive spectral analysis method that can provide the functional group structure information of compounds (Dey and Sarkar, 2024). The addition of FTIR spectroscopy analysis helps to better understand the structural features that affect the optical properties of BrC. However, in previous spectroscopy-based studies, the results of different spectral methods are often discussed separately, without in-depth discussion of the relationship between different spectra, which limits the full and comprehensive prediction of the optical and structural characteristics of BrC.
In this study, PM2.5 is collected from 10 sites in different regions of China. The mass concentration, light absorption and fluorescent spectra, and functional group structures of WSOC (a substitute of water-soluble BrC) at the 10 sites are analyzed using a unified method. The objectives of this study include (1) exploring the spatial heterogeneity of optical properties of WSOC in different regions of China and its influencing factors; (2) revealing the relationship between light absorption, fluorescence, and functional group structure of WSOC; and (3) quantifying the contribution of fluorescent chromophores to the light absorption of WSOC on the basis of multi-site spectral datasets. Furthermore, this study can provide reference for the future study of the light absorption properties and structural composition of WISOC.
2.1 Ambient PM2.5 sample collection
PM2.5 samples are collected at eight urban sites and two regional sites in China during late November and January of 2019–2020 (see Fig. S1 and Table S1 in the Supplement). The eight cities are distributed in different administrative regions of China, that is, Tianjin (TJ) and Handan (HD) in north China; Qingdao (QD), Nanjing (NJ), and Shanghai (SH) in east China; Xi'an (XA) in northwest China; and Chengdu (CD) and Chongqing (CQ) in southwest China. These cities are representative of their respective regional economies and cultures, with discrepancies in energy structure and geographical and climatic characteristics. The other two sites, Mt. Tai (TS) and Heshan (HS), are taken as regional sites in this study. TS (1534 m a.s.l.) is located at the Taishan National Reference Climatological Station at the summit of Mt. Tai and in the North China Plain (NCP), which is less affected by anthropogenic emissions and has been widely used as a sampling site for research on regional atmospheric pollution and atmospheric chemistry in northern China (Chen et al., 2022; Jiang et al., 2020). The HS site is located at the Atmospheric Environmental Monitoring Super-station in Guangdong, China and downwind of the Pearl River Delta (PRD), which is mainly surrounded by farmland protection areas and forest land with no obvious industrial or urban traffic pollution sources in the vicinity and has been used as a representative regional receptor site for the PRD region (He et al., 2019; Xu et al., 2022). In this study, daytime, nighttime, or daily PM2.5 samples were collected using medium- or high-volume samplers at different sites with a sampling duration of 11–24 h for each sample. More detailed sampling information and sample sizes are summarized in Table S1. It is worth noting that in this study, the daily average of the parameters measured at each site is used for subsequent summary and comparison. Before sampling, all quartz filters used for sample collection are prebaked at 550 °C for 5.5 h to remove potential organic matter. After sampling, all samples are wrapped in prebaked aluminum foils and stored in the refrigerator under −20 °C conditions until further analysis.
2.2 Carbonaceous components mass concentration measurement
The measurement methods of carbonaceous component concentrations can be referred to our previous study (Chen et al., 2023). Briefly, organic carbon (OC) and elemental carbon (EC) are analyzed using a thermal optical transmittance (TOT) carbon analyzer (Sunset Laboratory, Inc., Tigard, OR, USA) with the National Institute for Occupational Safety and Health (NIOSH) protocol. A series of sucrose standard solutions are applied to ensure the status of the instrument and calibrate to obtain the final OC and EC concentrations. Concentrations of primary organic carbon (POC) and secondary organic carbon (SOC) are estimated according to the EC tracer method, and more details can be found in Text S1 in the Supplement. A portion of each filter (about 6 cm2) is extracted with ultrapure water (>18.2 MΩ cm, 25 °C; Direct-Q, Millipore) by ultra-sonication for 30 min, and then the extract is filtered through a 0.45 µm pore-size PTFE syringe filter (Pall, USA) to remove water-insoluble materials. WSOC concentrations are analyzed using a total organic carbon (TOC) analyzer (Elementar, Germany) and a series of concentration gradient potassium hydrogen phthalate (C8H5O4K) standard solutions are used for calibration. Each sample is analyzed in triplicate, and the average of two adjacent values is recorded to minimize the measurement error.
2.3 WSOC light absorption spectra measurement and light absorption factor determination
The light-absorbing spectra of WSOC are measured using a spectrophotometer (TIDAS®S 300 UV/VIS 1972 DH, J&M, Germany) coupled with a 1 m path-length liquid waveguide capillary cell (LWCC-3100, World Precision Instruments Inc., USA) over the wavelength range of 250–700 nm with a 1 nm scanning interval. Ultrapure water is used as the blank reference during the light absorption spectrum measurement. Light absorption parameters such as light absorption coefficients at 365 nm (Abs365), mass absorption efficiency at 365 and 405 nm (MAE365 and MAE405), and Ångström exponent over 300–500 nm (AAE300−500) are calculated. More details on the calculation methods can be found in Text S2 in the Supplement. Furthermore, the direct radiative effect of WSOC is assessed by simple forcing efficiency (SFE) calculated by the measured absorption coefficients in this study following the method described in Text S3 in the Supplement. To further analyze the light-absorbing properties of WSOC and compare the discrepancies between different sites, a method based on the positive matrix factorization (PMF; EPA PMF 5.0) model combined with light absorption spectra (PMF-LAS) is introduced to analyze the light absorption factor in the main light absorption bands of WSOC (250–500 nm, interval 5 nm). More details about the PMF-LAS method can be found in Text S4 in the Supplement.
2.4 Fluorescent spectra measurement and fluorescence factors determination
The excitation–emission matrix spectra (EEMs) of WSOC are recorded by a fluorescence spectrometer (Duetta™, Horiba Scientific, Japan) in the excitation wavelength (Ex) and emission wavelength (Em) range of 250–600 nm with a 5 nm slit width. The intervals of the Ex and Em are 5 nm and 2 nm (4 pixels), respectively. Similarly, ultrapure water is used as the blank reference during the fluorescence spectrum measurement. Fluorescence parameters such as fluorescence index (FI), biological index (BIX), and humidification index (HIX) are calculated according to the method described in our previous study (Chen et al., 2024). More details about the calculation method can be found in Text S5 in the Supplement. And fluorophores in WSOC are determined based on the excitation–emission matrix spectra coupled with PARAFAC analysis (EEM-PARAFAC) (Chen et al., 2024).
2.5 FTIR spectra analysis
To determine the functional groups in WSOC, an FTIR spectrometer (Nicolet iS50, Thermo Scientific, USA) is employed to obtain the infrared spectrum of WSOC. Briefly, a portion of the filtered extract is freeze-dried and the dried powder is placed on the diamond window of the attenuated total reflection (ATR) platform for measurement. The spectrum is recorded in the average of 128 scans with the wavenumber range of 550–4000 cm−1 at a resolution of 4 cm−1. The background spectrum is collected every 60 min. It is worth mentioning that the field blank sample is not measured due to almost no powder in the extract of the blank sample after freeze drying. The baseline correction and smooth processing of the original spectrum are performed through the OMNIC software (v 9.2), and each functional group is integrated using this software. Relative quantity of functional groups is achieved by calculating the proportion of each peak area to the total peak area.
2.6 Relationship and influencing factor analysis
The multiple linear regression (MLR) model is applied to reveal the relationship between fluorophores and WSOC light absorption and to quantify the contribution of fluorophores to light absorption. To evaluate the contribution of different fluorophores to the light absorption coefficient, ridge regression in the MLR model is used to analyze the relationship between the fluorescence intensities of fluorophores and Abs365. In the model calculation process, the Abs365 is treated as the dependent variable, the maximum fluorescence intensity (Fmax) is introduced as the independent variable, and insignificant (p<0.05) fluorescent components are excluded from the regression. The calculation is mainly carried out through SPSS software (IBM SPSS Statistics 23). Notably, a t test (two-sample testing under heteroscedasticity at the 95 % confidence level) is conducted to evaluate the significance level of data differences in this study. Besides, the extreme gradient boosting (XGBoost) model is applied to verify the results from MLR (Li et al., 2024). Additionally, the XGBoost model is used to evaluate the influence of conventional gas parameters (e.g., CO, SO2, O3, and NO2) on the light absorption of WSOC. More detailed description about the XGBoost method can be found in Text S6 in the Supplement.
3.1 Spatial similarity and heterogeneity of WSOC
3.1.1 Concentration levels of WSOC
During the observation period, the mass concentrations of carbonaceous components (i.e., OC, EC, and WSOC) increase with the increase in PM2.5 concentration (see Fig. S3 in the Supplement) and exhibit significant spatial variations across the 10 sites (p<0.05). As shown in Fig. S1 and Table S2 in the Supplement, the average concentrations of OC, EC, and WSOC observed at the 10 sites ranged from 3.31 to 19.6 µg m−3, 0.35 to 2.86 µg m−3, and 1.97 to 10.6 µg m−3, respectively, with the highest mean mass concentrations of OC, EC, and WSOC observed in CQ, XA, and HD, respectively, while the lowest values are all observed in SH. Overall, the regional average carbonaceous component concentrations show the spatial distribution trends of northwest China > southwest China > north China > east China > regional site (p<0.05). This spatial variability may be attributed to differences in the sources of carbonaceous components and meteorological conditions. For example, the enhanced fuel (e.g., fossil fuels or biomass) combustion for winter heating activities may lead to increased emissions of carbonaceous components at sites in northern China (e.g., HD, XA, TJ, and QD) (Wang et al., 2022a; Zhang et al., 2015). The unfavorable meteorological conditions such as low wind speeds may lead to the high concentration levels at sites in southwest China (e.g., CD: 1.16 ± 0.48 m s−1 and CQ: 2.27 ± 0.89 m s−1). Moreover, concentrations of carbonaceous components in inland cities (i.e., HD, NJ, XA, CD, and CQ) are much higher than those in coastal cities (i.e., TJ, QD, and SH) (p<0.01), which is consistent with those reported in previous studies that have shown that air masses from the ocean generally contain lower levels of aerosol content and carbonaceous components (Chen et al., 2023; Diesch et al., 2012; Mo et al., 2022; Zhang et al., 2022b). The 48 h backward air mass trajectory analysis shows that about one-fifth to half of the air masses that arrive at the coastal cities during the observation period pass through the ocean region, while the inland cities are predominately affected by continental air masses, which may contain a large number of anthropogenic aerosols (see Fig. S4 in the Supplement). Furthermore, it is worth noting that the regional site TS in the NCP has a relatively low mass concentration of carbonaceous components compared to urban sites, which may be due to its high altitude (∼1500 m) and low local anthropogenic activities (Jiang et al., 2020). In contrast, the mass concentrations of carbonaceous components at HS (another regional site) in the PRD region are relatively higher compared to the TS site. The backward air mass trajectory analysis indicates that more than 80 % of the air masses arriving at the HS site originated from the PRD region and are accompanied by low wind speeds (1.54 m s−1 on average during the sampling period). This suggests that there may be high anthropogenic emissions in the PRD region during the winter sampling period. Over the study period, the OCEC and WSOCOC ratios, which can characterize primary sources of carbonaceous aerosols and formation of secondary organic aerosols (SOAs), as well as atmospheric oxidation levels (Ram et al., 2012; Wang et al., 2016), vary from 2.69 to 19.5 (4.58 ± 0.93–10.1 ± 2.69 on average) and 22.7 % to 96.1 % (53.4 % ± 4.94 %–73.3 % ± 10.0 % on average) across the 10 sites, indicating non-negligible impacts from both combustion-related emissions and secondary formation on carbonaceous aerosols.
3.1.2 Light absorption of WSOC
As shown in Table 1 and Fig. S1, the average Abs365 (1.12 ± 0.53–13.1 ± 6.95 Mm−1) and MAE365 (0.56 ± 0.11–1.26 ± 0.34 m2 g−1) of WSOC at the 10 sites display significant spatial discrepancies (p<0.05), with HD (SH) having the highest (lowest) average Abs365 (13.1 ± 6.95 Mm−1 (1.12 ± 0.53 Mm−1)) and MAE365 (1.26 ± 0.34 m2 g−1 (0.56 ± 0.11 m2 g−1)), respectively. MAE365 in SH, CD, TS, and HS (0.56 ± 0.11–0.74 ± 0.24 m2 g−1 on average) are comparable to those reported in light-polluted areas such as in Guangzhou, Lulang, Waliguan, and Urumqi in China and Los Angeles in the USA (0.48–0.81 m2 g−1) (Fan et al., 2016; Liu et al., 2018; Soleimanian et al., 2020; Wu et al., 2020; Xu et al., 2020; Zhong et al., 2023). However, they are all lower than those in TJ, HD, QD, NJ, XA, and CQ (0.89 ± 0.22–1.26 ± 0.34 m2 g−1 on average), which are comparable to those reported in heavy-pollution areas such as in Beijing, Xining, Yinchuan, and Lanzhou in China and Patiala and Mohanpur in India (0.93–1.30 m2 g−1) (Cheng et al., 2016; Srinivas et al., 2016; Dey et al., 2021; Zhong et al., 2023; Ting et al., 2022). In this study, the light absorption of WSOC in different regions is significantly different (p<0.05), with the regional average Abs365 and MAE365 displaying as northwest China > southwest China > north China > east China > regional site. Moreover, the average Abs365 and MAE365 are higher in northern China (including TJ, HD, QD, and XA; 7.34 ± 5.21 Mm−1 and 1.02 ± 0.29 m2 g−1, respectively) than in southern China (including NJ, SH, CD, and CQ; 5.86 ± 3.91 Mm−1 and 0.78 ± 0.23 m2 g−1, respectively) and regional sites (e.g., TS and HS; 2.91 ± 1.38 Mm−1 and 0.72 ± 0.23 m2 g−1, respectively) (p<0.01) and higher in inland (8.24 ± 4.75 Mm−1 and 0.91 ± 0.27 m2 g−1, respectively) than in coastal areas (4.37 ± 3.52 Mm−1 and 0.88 ± 0.32 m2 g−1, respectively) (p<0.01; see Fig. S5 in the Supplement), which is consistent with the regional differences in carbonaceous component mass concentrations. This spatial variation may be related to the diversity of WSOC sources and can be affected by the atmospheric processes (including meteorological processes) and is intrinsically related to the chemical composition and structures of WSOC at different sites (Wang et al., 2023, 2024). Previous studies have indicated that the increase in primary emissions such as coal combustion and biomass burning during the winter heating period in northern China will lead to an enhancement of WSOC light absorption (Yan et al., 2017; Zhang et al., 2021). The strong correlation between Abs365 and POC (r range of 0.59–0.90) or SOC (r range of 0.43–0.97) (p<0.01) (see Fig. S6 in the Supplement) indicates that light-absorbing components in WSOC are simultaneously affected by both primary emission and secondary formation. The effects of different factors, such as chemical composition/structure, and meteorological conditions on the light absorption of WSOC are discussed in detail in the following sections.
Table 1Light absorption and fluorescence parameters of WSOC measured in this study.
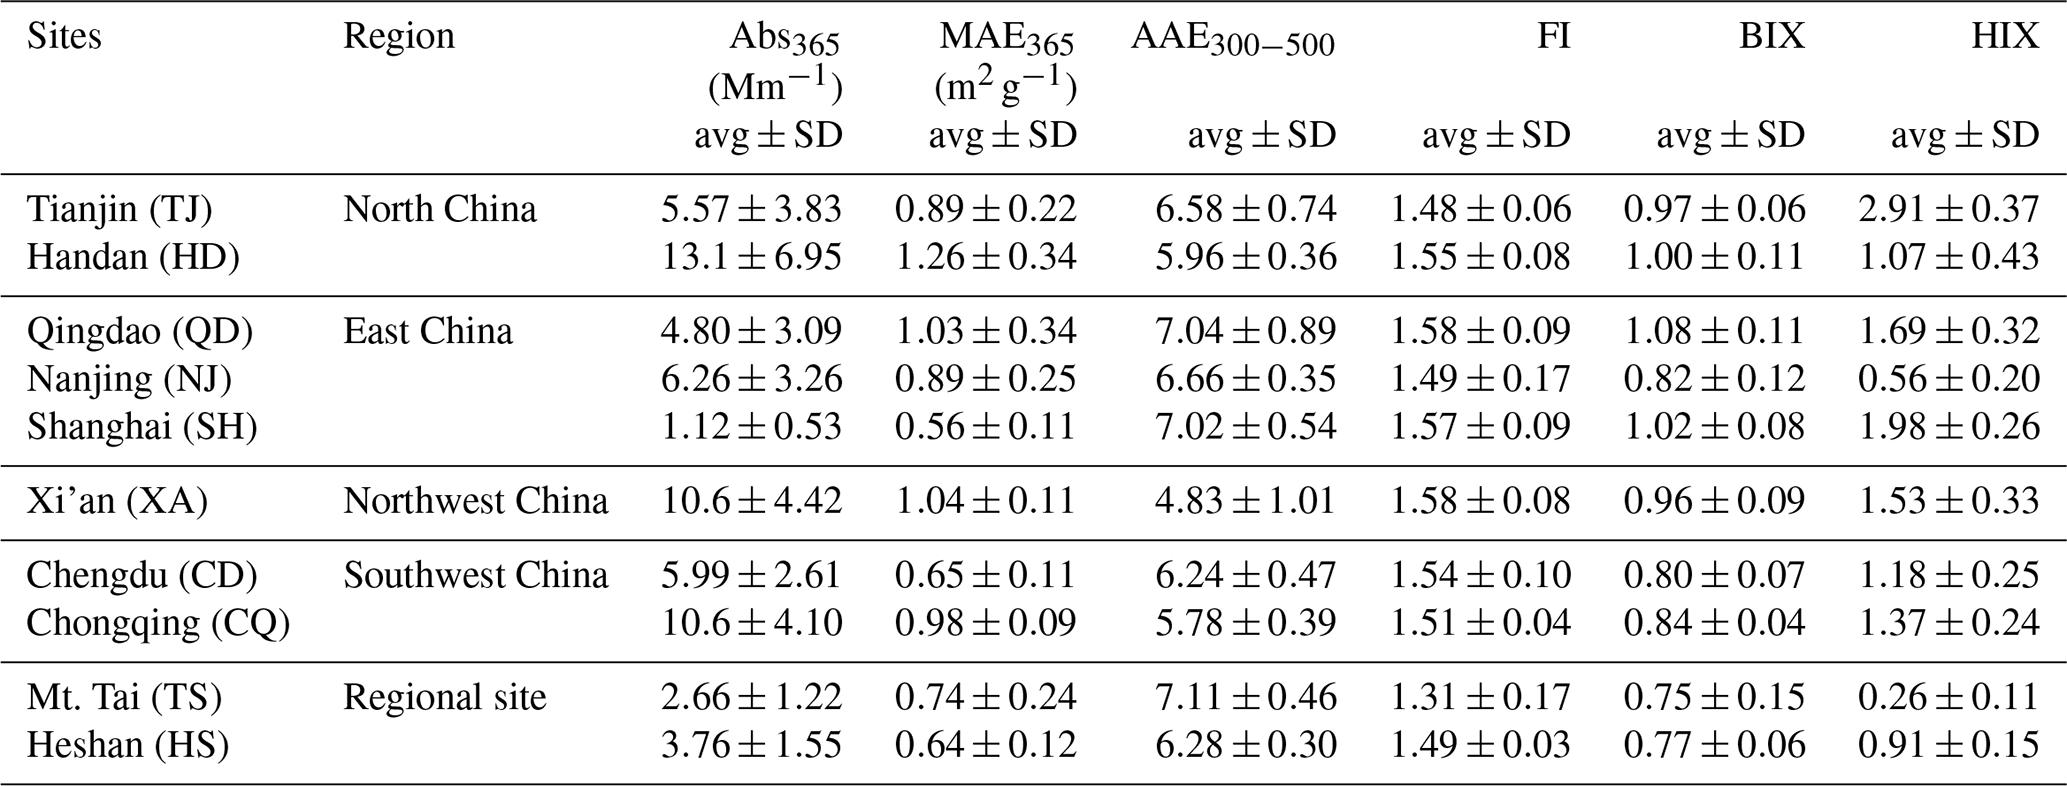
Figure 1 illustrates the log 10(MAE405) and AAE300−500 values of WSOC measured in this study and reported in previous studies. The map in log 10(MAE405) vs. AAE300−500 space has been proposed by Saleh (2020) to classify BrC types based on light-absorbing properties. Notably, most values measured at the 10 sites in this study fall in the region of weakly absorbing BrC (W-BrC), which is similar to the values of ambient samples reported in previous studies. However, there are slight differences in the distribution of values between each site. QD has the widest range of log 10(MAE405) and AAE300−500 values and is also close to the values of biomass-burning samples. Previous studies have indicated that biomass burning (especially that related to residential heating and cooking activities) around the sampling site in QD in winter is a major source contributor to atmospheric particulate matter (Li et al., 2024) and has a significant impact on the light absorption of WSOC (Zhan et al., 2022a, b). The difference in light absorption of WSOC generated from different fuel (e.g., corn straw, rice straw, and wood) combustion may be the reason for the wide range of log 10(MAE405) and AAE300−500 values in QD (Fan et al., 2016). The values in SH are much closer to those of very weakly absorbing BrC (VW-BrC) compared to other sites, which may be related to the influence of marine air mass, as the backward air mass trajectory analysis shows that more than half of the air masses arriving in SH passing through the ocean area during the sampling period (see Fig. S4). In contrast, the values in XA are mainly distributed in the moderately absorbing BrC (M-BrC) region, with a few samples falling in the W-BrC region. This indicates that WSOC in XA has a stronger light-absorbing capacity, which is consistent with its higher Abs365 and MAE365 values. The average value in XA is much closer to that of coal combustion source samples. Previous studies conducted in XA have shown that the light-absorbing capacity of WSOC in the XA region is always at a high level, especially during the winter heating period when anthropogenic emissions such as biomass burning and coal combustion activities increased (Huang et al., 2018; Lei et al., 2019; Yuan et al., 2020). The cause of the high light absorption level of WSOC in XA needs to be further investigated.
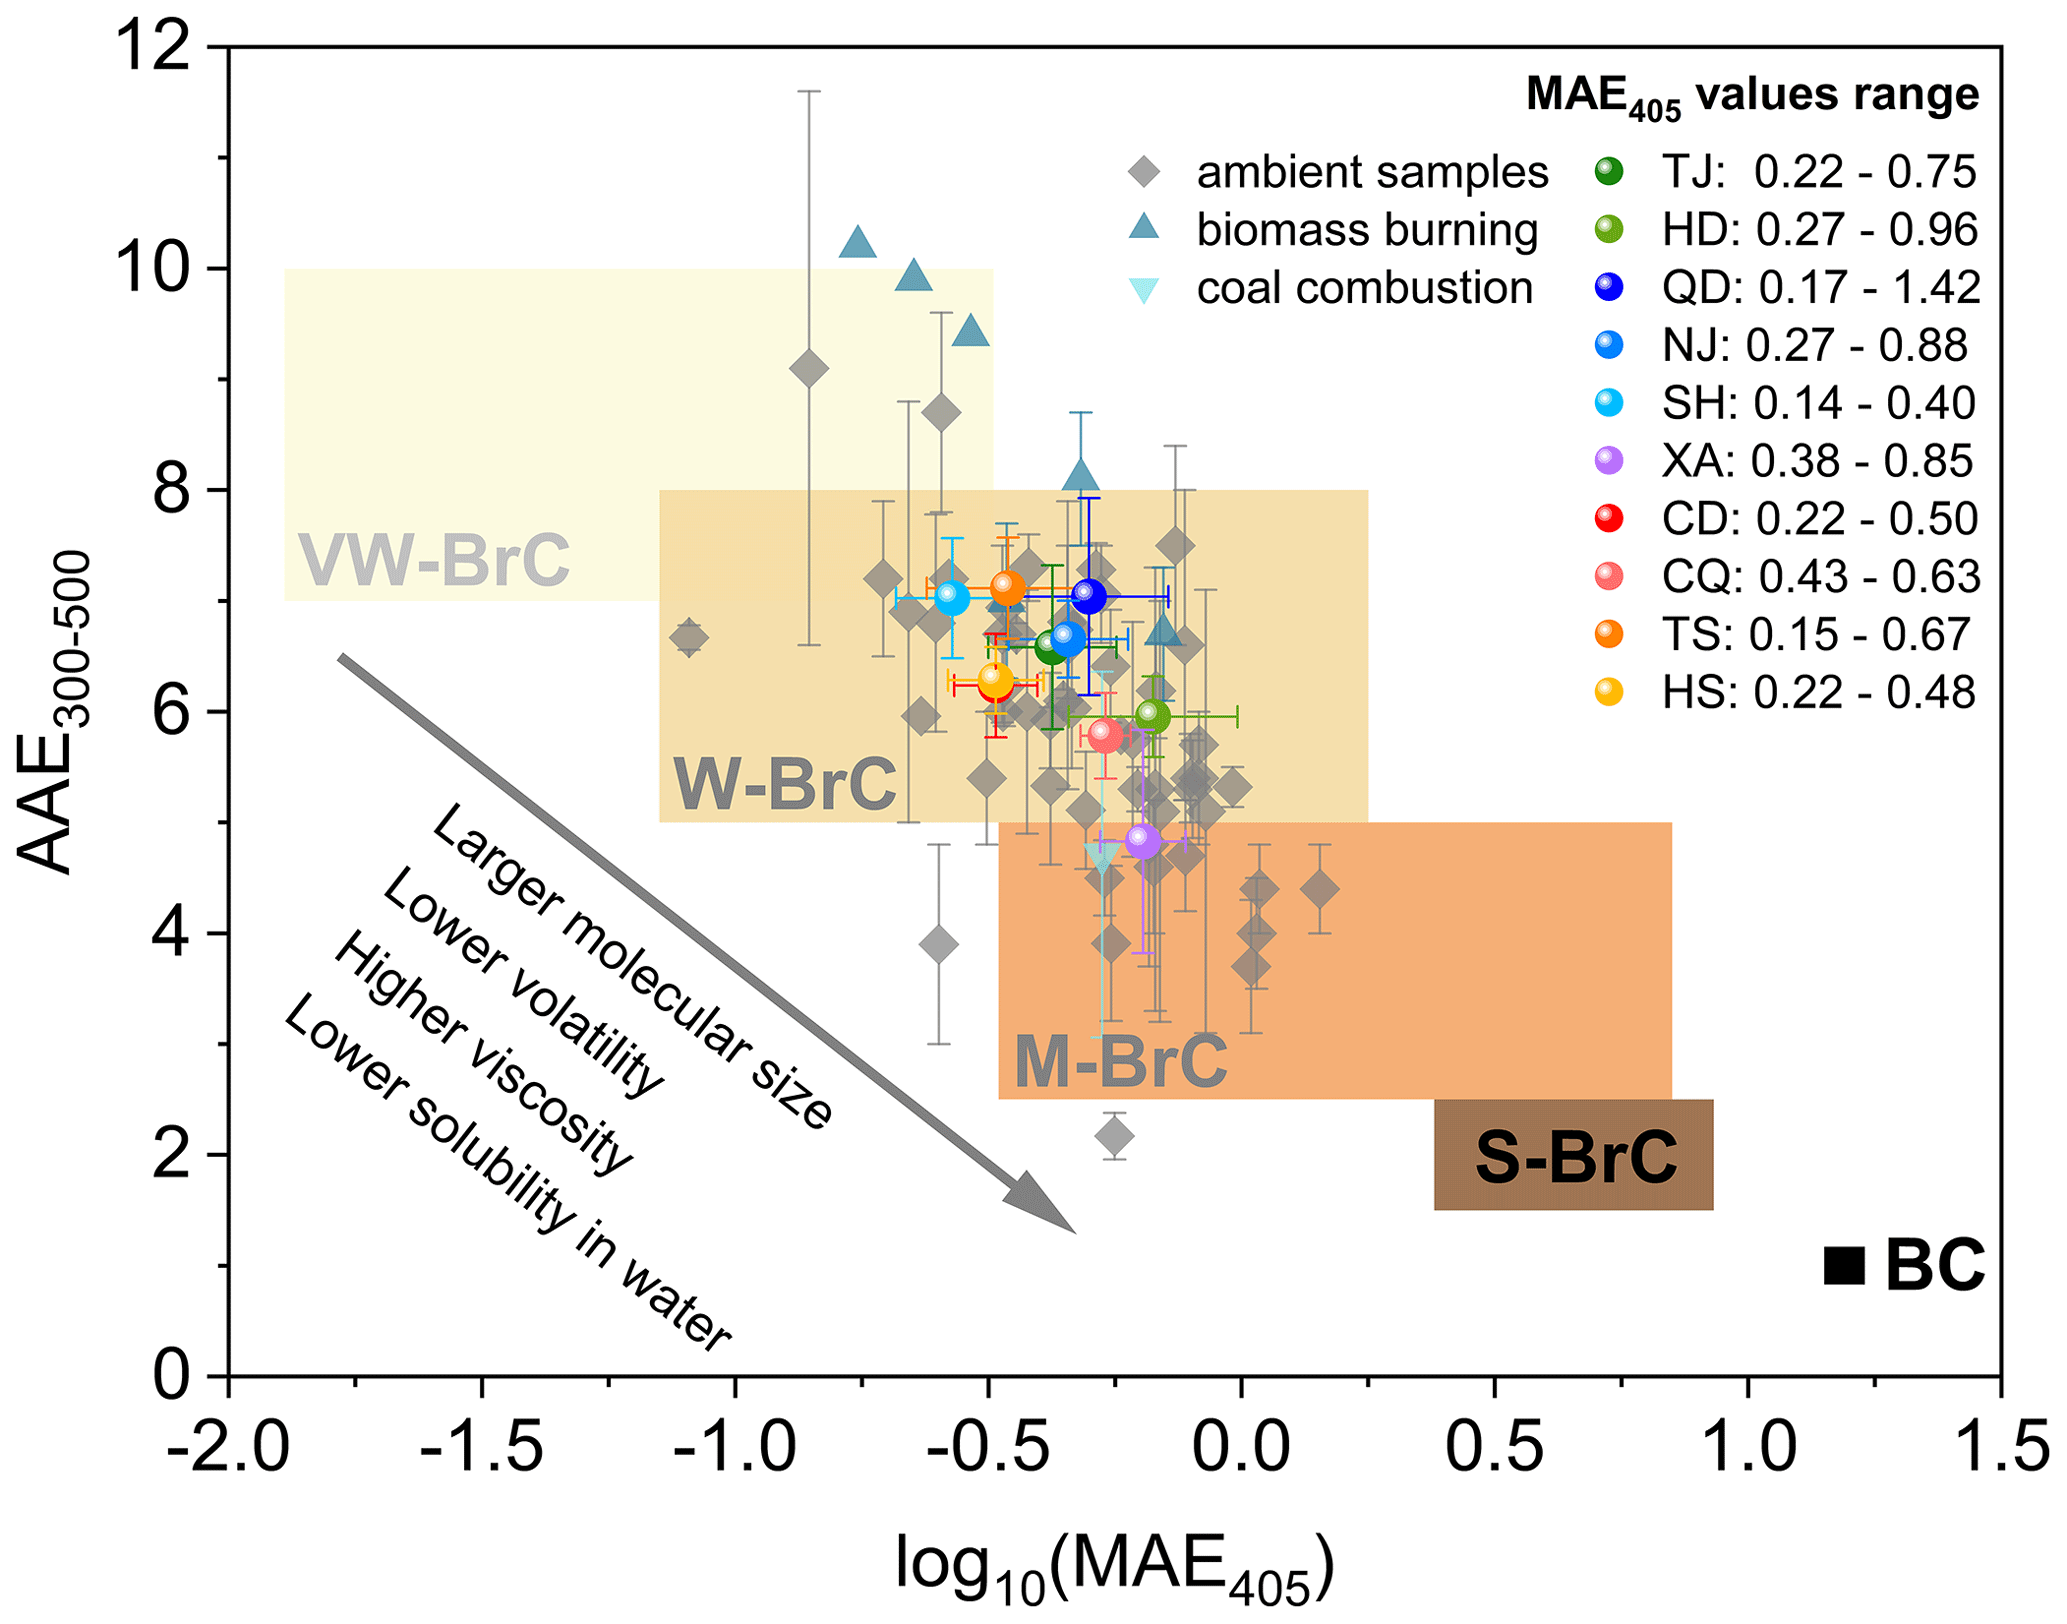
Figure 1Graphical representation of optical-based BrC classes in log 10(MAE405)-AAE space. The shaded regions represent very weakly light-absorbing BrC (VW-BrC), weakly light-absorbing BrC (W-BrC), moderately light-absorbing BrC (M-BrC), strongly light-absorbing BrC (S-BrC), and absorbing BC, respectively. Data sources are as follows: Bosch et al. (2014), Chen et al. (2018), Cheng et al. (2011, 2016), Choudhary et al. (2021), Deng et al. (2022), Dey et al. (2021), Fan et al. (2016), Fang et al. (2023), Hecobian et al. (2010), Huang et al. (2018), Kirillova et al. (2014, 2016), Li et al. (2019, 2023a, c), Liu et al. (2018, 2019), Soleimanian et al. (2020), Srinivas and Sarin (2013, 2014), Srinivas et al. (2016), Tang et al. (2021), Ting et al. (2022), Wu et al. (2020), Xie et al. (2020), Xu et al. (2020), Yan et al. (2015, 2017), Yang et al. (2020), Yuan et al. (2020), Yue et al. (2022), Zhao et al. (2022), Zhong et al. (2023), Zhu et al. (2018).
Accordingly, the SFE within the wavelength range of 300–400 nm (SFE300−400) and 300–700 nm (SFE300−700) in different regions is calculated based on the measured MAE values. The dSFEdλ spectra and integrated SFE values are shown in Fig. S7 in the Supplement. Overall, the integral SFE values exhibit significant spatial variations across the 10 sites (p<0.01), and the spatial distribution trend is similar to that of MAE365. Among these, HD (SH) has the highest (lowest) SFE300−400 (1.92 ± 0.51 W g−1 (0.88 ± 0.17 W g−1)) and SFE300−700 values (4.50 ± 1.25 W g−1 (1.82 ± 0.38 W g−1)). The similar variations in SFE and MAE values suggest that the stronger light-absorbing capacity of BrC may lead to an increase in its direct radiative forcing. This is consistent with previous studies, which suggest that a more abundant BrC with stronger light-absorbing capacity may result in a remarkable increase in the direct radiative forcing of BrC (Deng et al., 2022; Zhang et al., 2020). It should be noted that SFE300−400 accounts for more than 40 % (38.6 % ± 5.04 %–48.9 % ± 4.05 % on average) of SFE300−700 across the 10 sites in this study, which is consistent with a previous study (Deng et al., 2022), indicating that the light absorption of WSOC plays a crucial role in the aerosol direct radiative forcing in the UV–Vis range. Notably, there is a significant negative correlation (p<0.01) between the SFE value and WSOCOC at most sites (see Fig. S7c and d). The WSOCOC ratio has been used to infer the degree of SOA formation or aging of aerosols (Dasari et al., 2019; Ram et al., 2012); therefore, the reduction in the SFE value of WSOC may be related to the secondary or aged organic aerosols. Previous studies have indicated that the light absorption capacity of secondary BrC is usually lower than that of primary BrC (Fan et al., 2018; Tang et al., 2020; Zhong and Jang, 2011). Furthermore, BrC chromophores with aromatic rings and nitro and phenolic groups may undergo photolysis or photochemical oxidation under sunlight, resulting in photobleaching and a decrease in the light absorption capacity and radiation effect of WSOC (Dasari et al., 2019). However, it is noted that this is only a speculation, and further research is needed in the future in conjunction with atmospheric chemical processes and WSOC component analysis.
3.1.3 Fluorescence characteristics of WSOC
The fluorescence spectroscopy analysis shows that urban sites (except NJ) have a higher humidification index (HIX) values compared to regional sites (see Table 1 and Fig. S8 in the Supplement), suggesting that the fluorescence components in WSOC at urban sites have higher aromaticity than those at regional sites. The HIX values at urban sites are comparable to those of ambient aerosols and fresh biogenic SOA as well as aged SOA generated from the Maillard reaction reported in previous studies. However, the HIX values measured at the 10 sites are overall much lower compared to those of aged biogenic SOA (Lee et al., 2013). This suggests that the contribution of aged biogenic SOA to fluorescence components is relatively small at all sites during the wintertime in this study. Moreover, the urban sites in northern China (such as TJ, QD, XA, and HD) exhibit higher biological index (BIX) and fluorescence index (FI) values compared to the urban sites in southern China (such as CD, CQ, and NJ) and regional sites (TS and HS). This suggests that primary combustion emissions, such as biomass burning and coal combustion, have higher influences on the fluorescent components in northern China compared to southern China and regional sites (Tang et al., 2021). It agrees well with different heating modes in north and south China in winter and is also consistent with the pollution sources at the regional sites.
Different fluorophores in WSOC are identified with the EEM-PARAFAC method. Five fluorophores (C1–C5) are resolved in TJ; four fluorophores (C1–C4) are resolved in QD, SH, and HS; and three fluorophores (C1–C3) are resolved at other sites, respectively (see Fig. S9 in the Supplement). Therein, C1 at urban sites (TJ, HD, QD, NJ, SH, XA, CD, and CQ) has a primary (secondary) Ex peak at around 250 nm (300 nm), with the Em peak at around 395 nm, while the Ex peak of C1 at regional sites (TS and HS) is at around 250 and 300 nm or 315 nm, with the Em peak at around 413 nm. Such fluorophores can be classified as less oxygenated humic-like substance (LO-HULIS) species (Chen et al., 2016b). Moreover, the C4 resolved in TJ, QD, SH, and HS is also considered to be LO-HULIS as its main peak is distributed in the LO-HULIS region (Chen et al., 2020). Previous studies have reported that LO-HULIS is abundant in biomass burning aerosols, especially in winter (Jiang et al., 2022a). Additionally, industrial sources and other combustion-related sources also make important contributions to LO-HULIS (Chen et al., 2020). C2 and C5 (only found in TJ) have longer emission wavelengths (Em>420 nm) and contain multiple Ex peaks (e.g., 250, 295, 305, 340, 345, 350, 355, 360, 370, and 375 nm), and these fluorophores are regarded as highly oxygenated species (HO-HULIS) (Chen et al., 2020). The multiple Ex peaks and longer Em peaks of HO-HULIS may be associated with aromatic conjugated structures and may contain heteroatoms (Chen et al., 2016a). HO-HULIS generally has a strong correlation with anthropogenic secondary formation and combustion emission (e.g., biomass burning and coal combustion) aerosols (Jiang et al., 2022a, b; Li et al., 2023b). Differently, C3 is mainly distributed in areas with lower Ex (260–275 nm) and Em (285–336 nm) wavelengths. Recent studies have shown that these fluorophores are compatible with the fluorescent peaks of amino acids (e.g., tyrosine, tryptophan) and non-N aromatic species (non-Nas, e.g., aromatic acids, phenolic compounds and their derivatives) (Cao et al., 2023; Chen et al., 2020). However, concentrations of atmospheric amino acids are usually negligible, and the corresponding contribution to fluorophores is insignificant when compared to non-Nas (Cao et al., 2023; Chen et al., 2020). Therefore, C3 is defined as non-Nas in this study, which is more likely derived from fossil fuel combustion (Li et al., 2023b; Tang et al., 2020).
Figure 2 illustrates the average fluorescence volume (FV; RU-nm2, that is, Raman units-nm2) and relative contributions of different fluorophores at different sites. Clearly, the average FV of all fluorophores varies in the range of 2.50×10²–9.76×10³ RU-nm2, showing great spatial variability. Overall, the LO-HULIS fluorophore has the highest FV (1.49×10³ ± 4.74×10²–9.76×10³ ± 5.82×10³ RU-nm2 on average) and accounts for the largest proportion (42.2 % ± 5.59 %–60.3 % ± 2.11 % on average) of the total fluorophores at most sites (except for TS, NJ, and CD), demonstrating the widespread existence of combustion-related sources (especially biomass burning) and their important influence on the fluorophore. In contrast, HO-HULIS fluorophore accounts for the lowest proportion (12.5 % ± 1.32 %–23.8 % ± 2.43 % on average, except for TJ and TS). This suggests that the effect of secondary anthropogenic sources at different locations may be relatively small during the winter study period. The relatively high FV values of LO-HULIS and non-Nas in northern cities (1.62×10⁶ RU-nm2 in total) compared to southern cities (4.37×10⁵ RU-nm2 in total) and regional sites (1.76×10⁵ RU-nm2 in total) further indicate the impact of increased primary emissions during the heating season, especially in northern China (Cao et al., 2023; Li et al., 2023b). This is consistent with a previous study by Cao et al. (2024a), which showed that the FV of fluorophores in BrC during the winter heating season was significantly higher than that during the non-heating season.
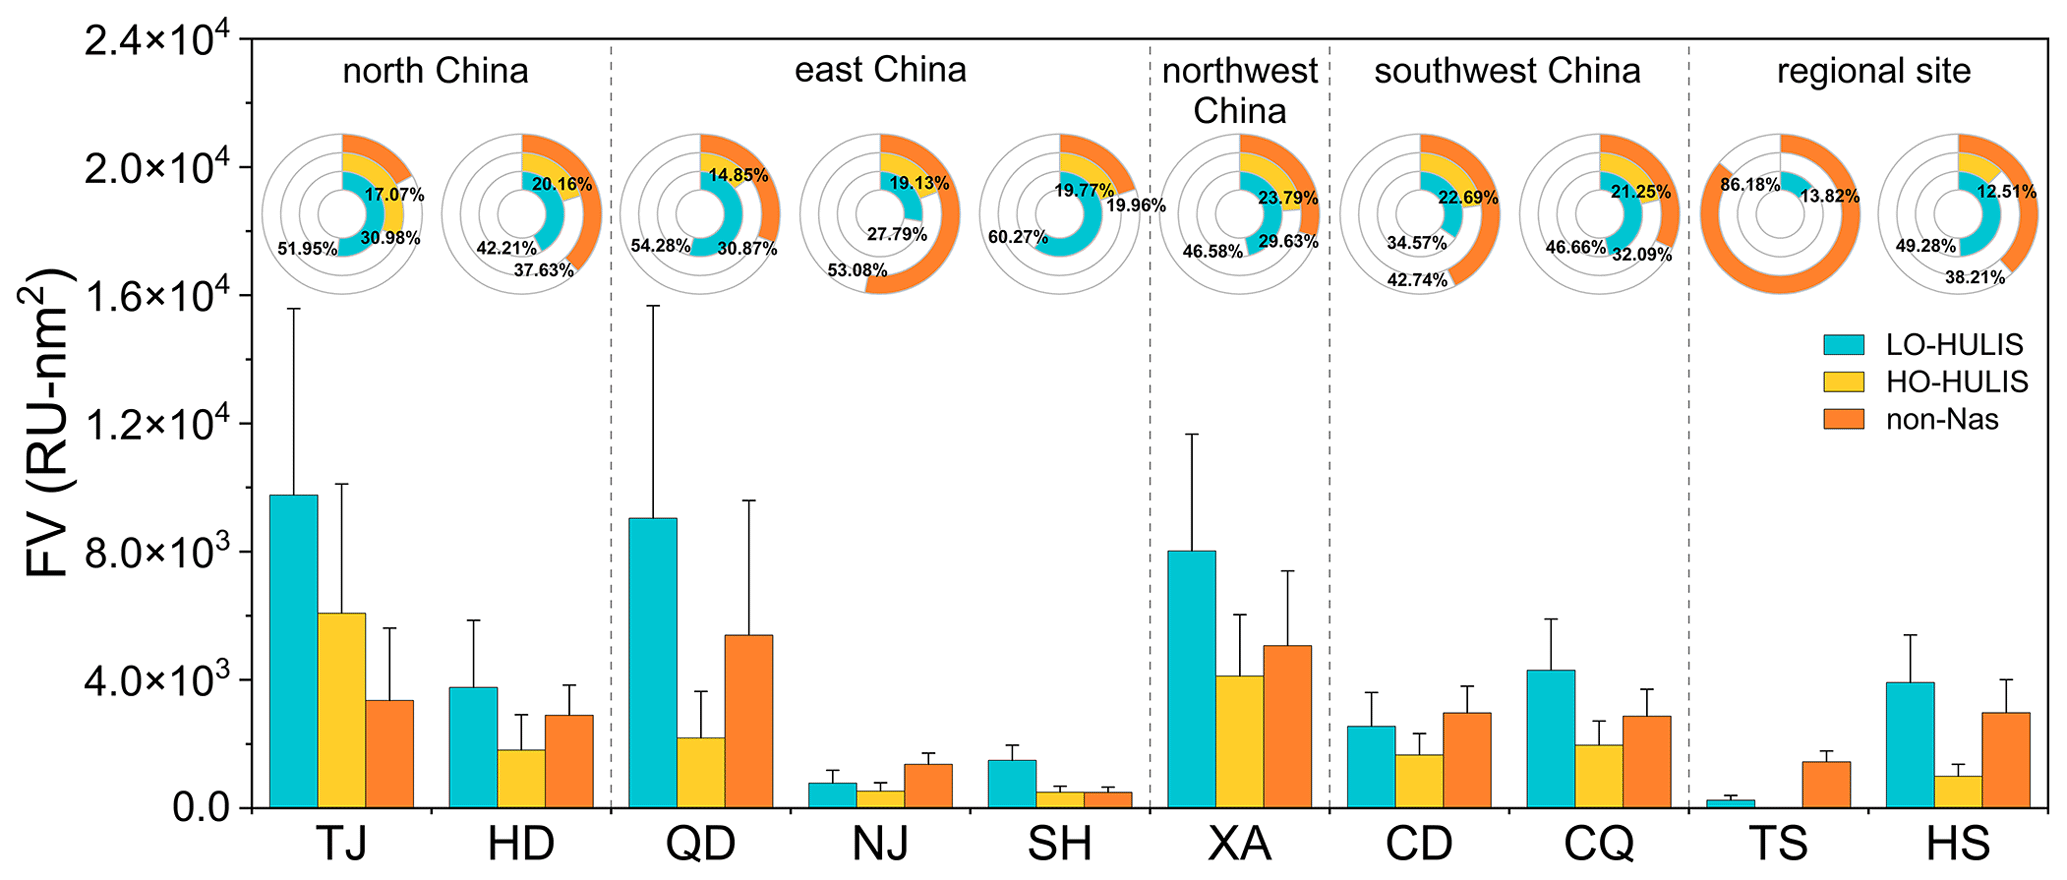
Figure 2The absolute fluorescence volumes (bar chart) and fractional contributions (pie chart) of each fluorophore at different observation sites. Note that blue denotes LO-HULIS, yellow denotes HO-HULIS, and orange denotes non-Nas.
3.1.4 Functional group structural characteristics of WSOC
The structure of WSOC is further investigated by FTIR spectroscopy. The spectra of WSOC are generally similar at different sites (see Fig. 3). The FTIR spectra at each site mainly include six or seven absorption bands at 2635–3600, 1540–1820, 1220–1510, 977–1220, 860–960, 806–844, and 590–727 cm−1. The peak in the widest band at 2635–3600 cm−1 can be attributable to the intramolecular and intermolecular O−H stretching vibrations of alcohols, phenols, and carboxylic acid (Fan et al., 2023; Huang et al., 2022; Wang et al., 2021). The peak in the band of 1540–1820 cm−1 is recognized as C=O, stretching vibrations of carboxylic acids, ketones, aldehydes, and esters (Fan et al., 2023; Wang et al., 2021; Yang et al., 2024). The sharp peak in the range of 1220–1510 cm−1 is attributed to C=C stretching vibrations of aromatic rings (Wang et al., 2021). The strongest peak occurs in the band of 977–1220 cm−1 can be assigned to C−O stretching vibrations of phenols, esters, and ethers (Fan et al., 2023; Wang et al., 2021). The peak in the range of 860–960 cm−1 is only observed at some sites (i.e., TJ, HD, QD, CD, and TS), which can be ascribed to in alkenes (Yu et al., 2018). And the sharpest peak in the band of 806–844 cm−1 corresponds to R−ONO2 stretching of organic nitrate (Huang et al., 2022), and multiple small peaks in the band at 590–727 cm−1 represent C−H bending vibrations of aromatic rings (Fan et al., 2023; Wang et al., 2021).
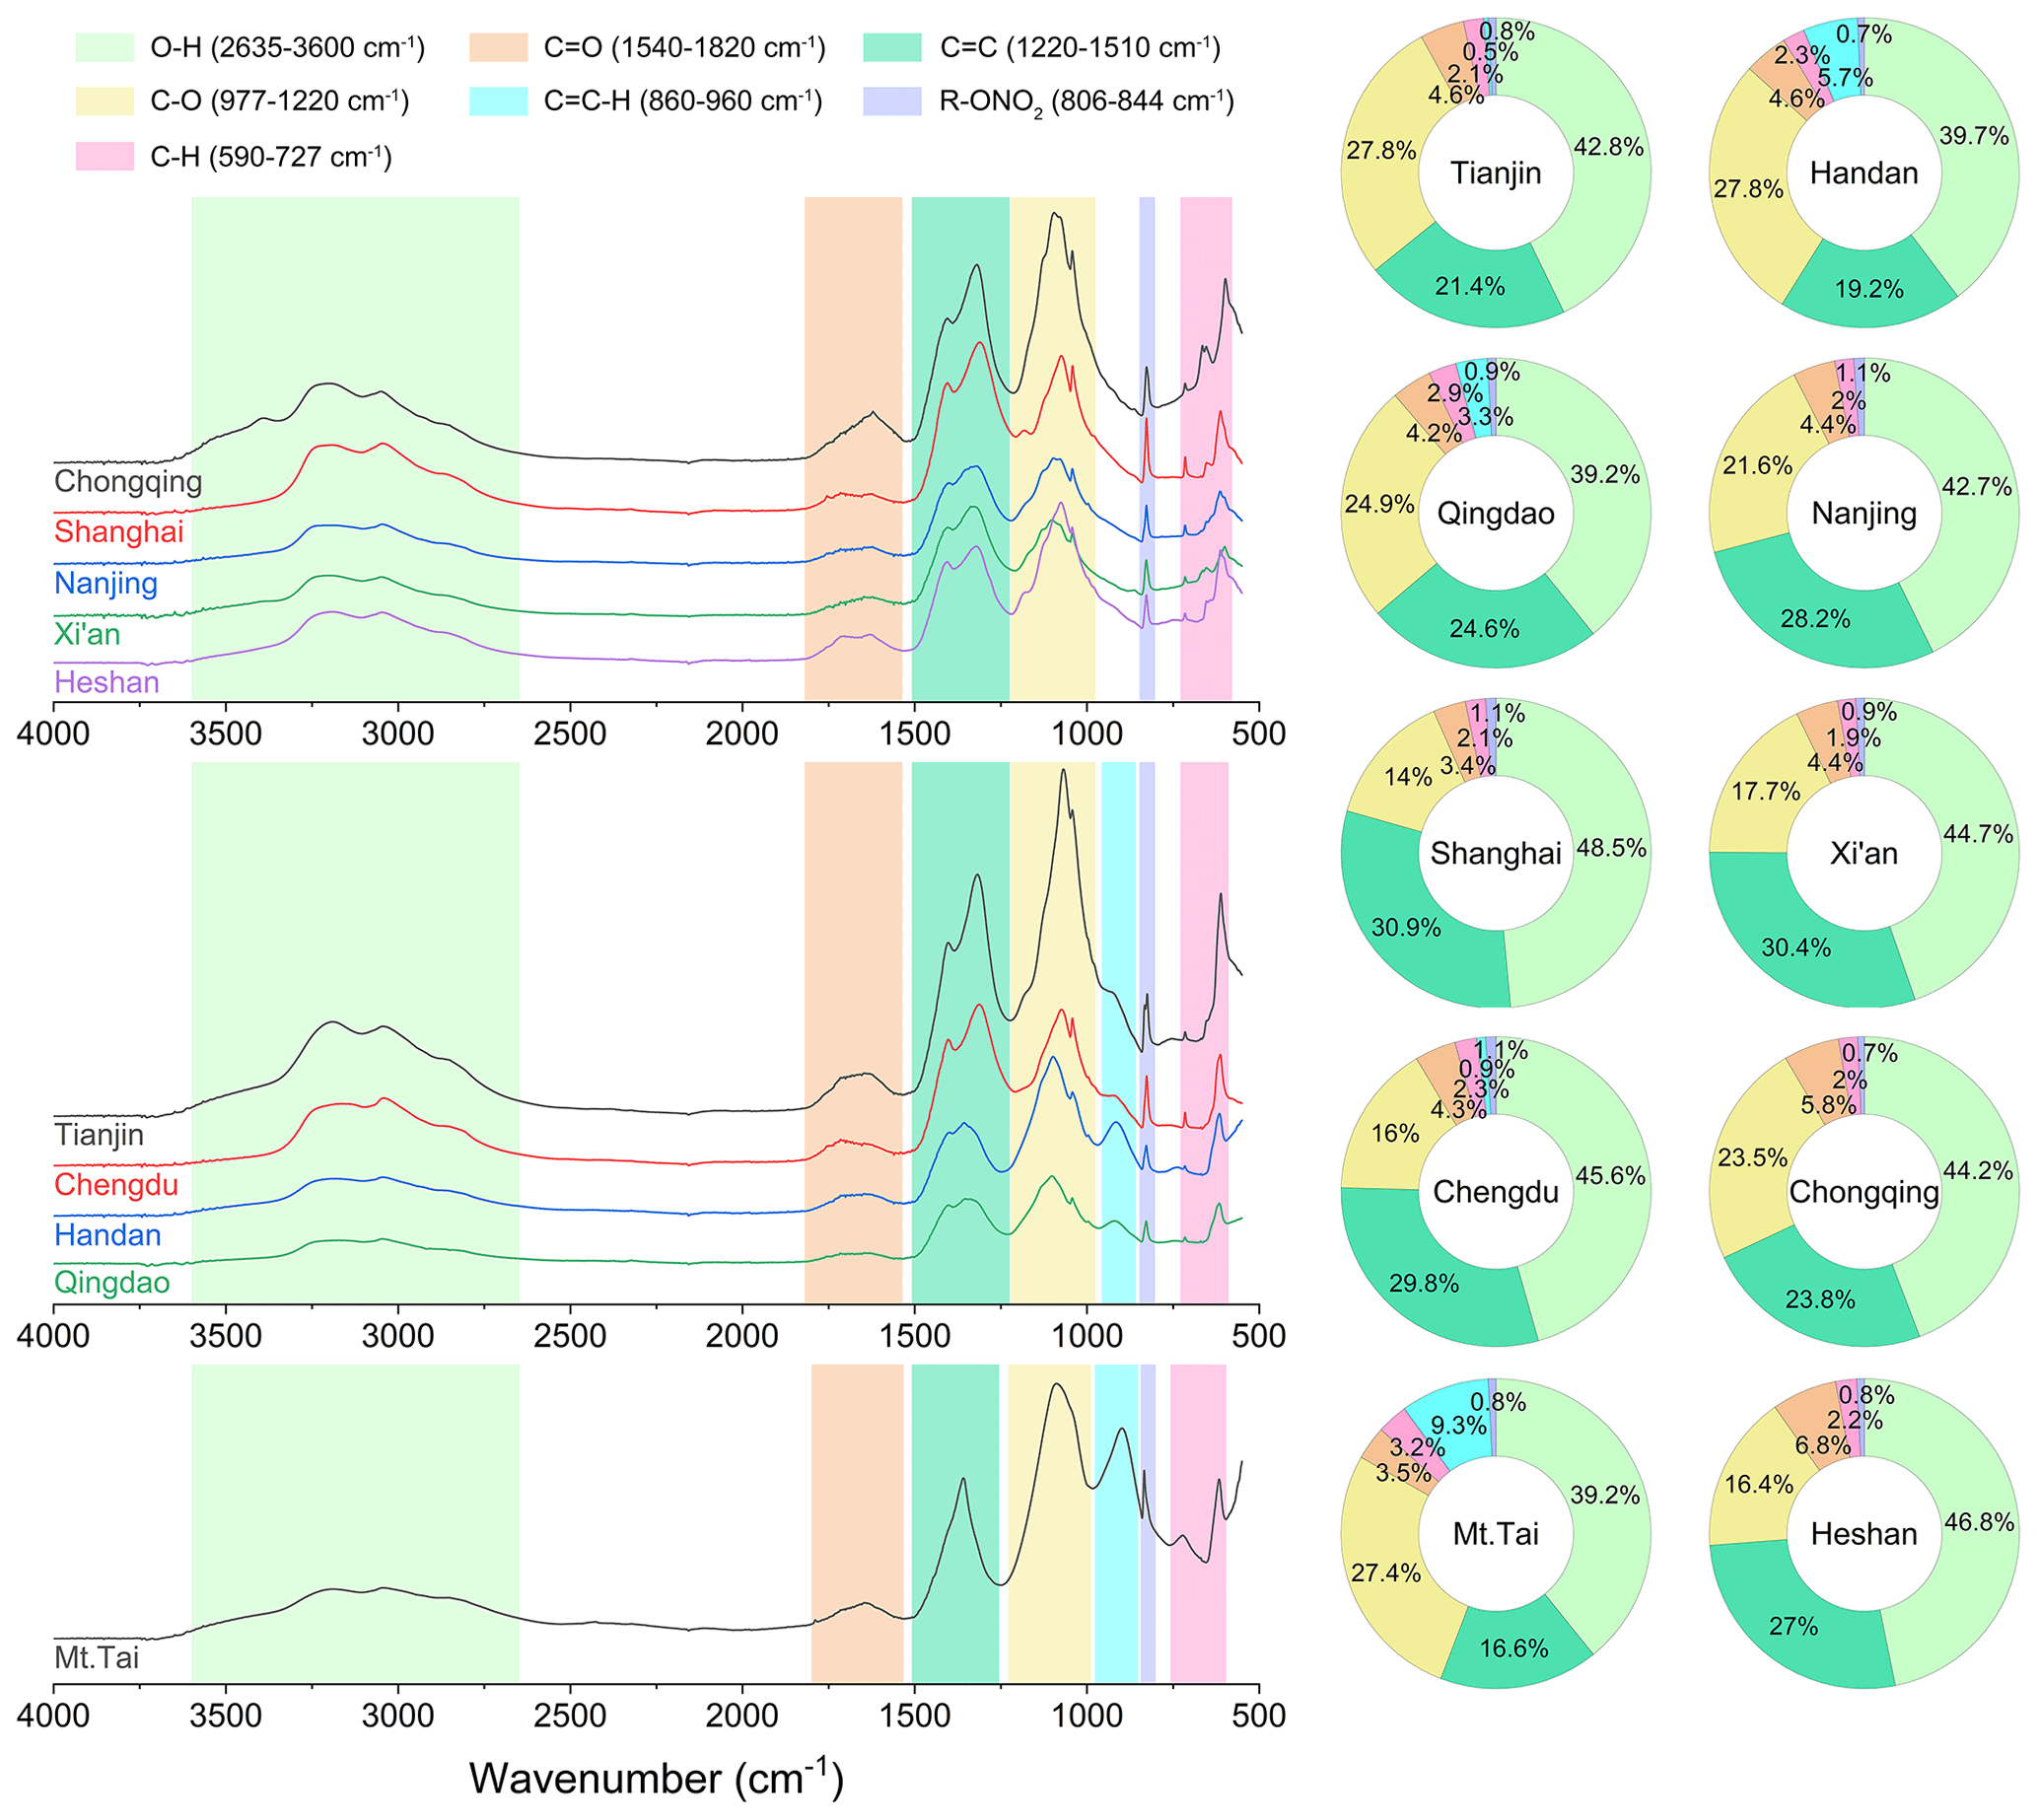
Figure 3FTIR spectra of WSOC and relative proportions of different functional groups measured (ring charts) at the 10 sites in this study.
Quantitative analysis of functional groups is conducted by integrating the peak area, and the proportion of different functional groups at each site is presented in ring charts in Fig. 3. Totally, the proportion contribution shows that O−H is the most abundant at all sites (39.2 % ± 4.57 %–48.4 % ± 3.12 % on average), followed by C=C (16.6 % ± 4.42 %–30.9 % ± 3.23 % on average) and C−O (14.0 % ± 4.48 %–27.8 % ± 4.65 % on average). The proportion of C=C is generally higher at sites in southern China than in northern China, while C−O is the opposite (p<0.05). O−H and C=C are negatively correlated with (the ratio of the light absorption of WSOC at 250 and 365 nm, see Fig. S10a and b in the Supplement). This indicates that these two functional groups may originate from aromatic compounds with a higher molecular weight and higher degree of aromaticity as lower values are related to higher aromaticity and molecular weight (Peuravuori and Pihlaja, 1997). To a certain extent, this can explain the strong light absorption capacity of WSOC in northern China in winter. In contrast, the proportion of C−O and (only detected at some sites) is positively correlated with (see Fig. S10c and d), indicating that these two functional groups are mainly related to ester or ether and aliphatic hydrocarbon compounds with smaller molecular weights. The proportion of these two functional groups is significantly higher at the regional site (TS) in northern China than at other sites (p<0.05). In contrast, C=O makes a greater contribution at the regional site (HS) in southern China.
3.2 Identification of light-absorbing substances based on light absorption spectra
In order to further explore the light absorption characteristics of WSOC and their diversity at different sites, the absorption spectra (250–700 nm) of WSOC are analyzed. Clearly, the light absorption coefficient (Absλ) of WSOC at each site exhibit strong wavelength dependence, especially over the UV–visible range (250–500 nm) where there is a significant light absorption signal. According to the UV–visible absorption spectra (see Fig. 4), the WSOC absorption spectra measured at the 10 sites can be classified into two categories. That is, the type with light absorption continues to decline from 250 to 700 nm, with a peak around 250 nm (namely, the unimodal type), and the other type with two significant absorption peaks at 265 and 300 nm (namely, the bimodal type). Interestingly, these two types of spectra happen to correspond to the sites in east China (unimodal: QD, NJ, SH, and TS) and those outside east China (bimodal: TJ, HD, XA, CD, CQ, and HS), respectively. The differences in the spectral types may be related to differences in the light-absorbing species present in WSOC. Therefore, the PMF-LAS method is further used to analyze the potential categories of the light-absorbing substances. Based on this method, the unimodal and bimodal spectra measured in east China sites and outside east China sites are separately put into the PMF model, and finally three different light absorption factors (namely, uni-Fac1, uni-Fac2, uni-Fac3 and bi-Fac1, bi-Fac2, bi-Fac3) are resolved, respectively (see Figs. 5 and S11 in the Supplement).
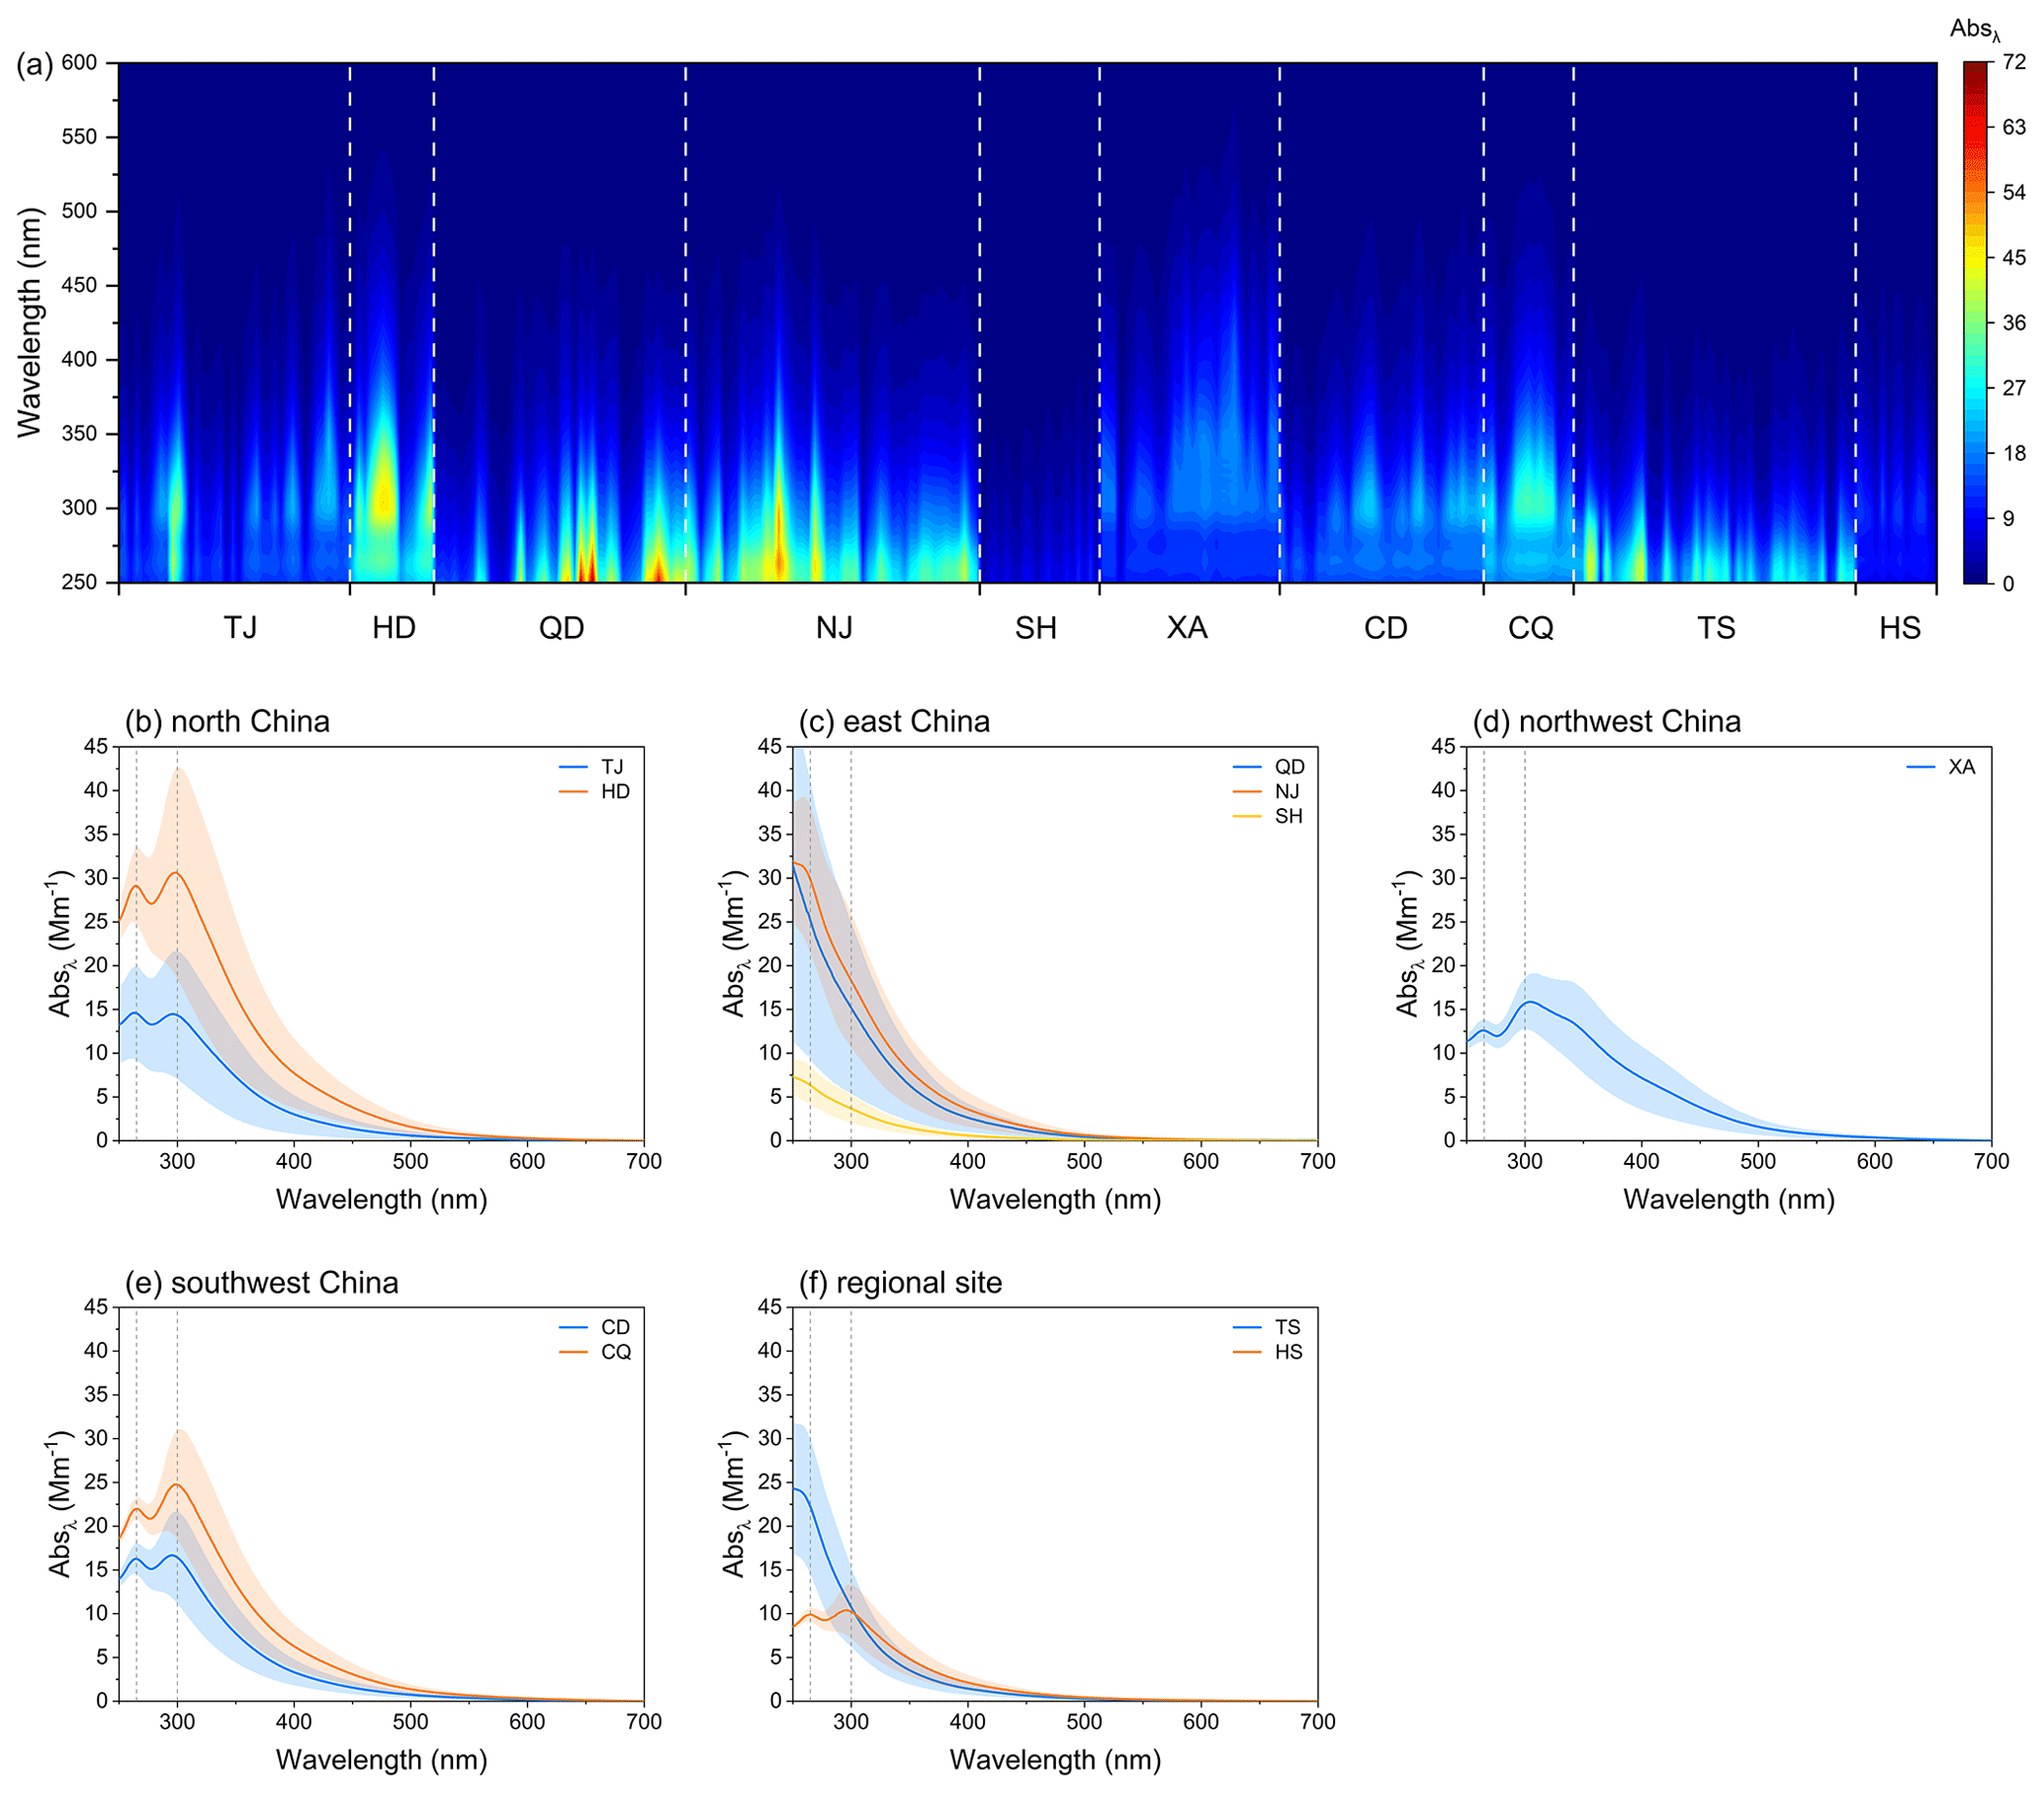
Figure 4(a) Light absorption coefficient spectrum of WSOC at each site and the average light absorption spectrum in (b) north China, (c) east China, (d) northwest China, (e) southwest China, and (f) regional sites. Note that the color bar represents the magnitude of the Absλ.
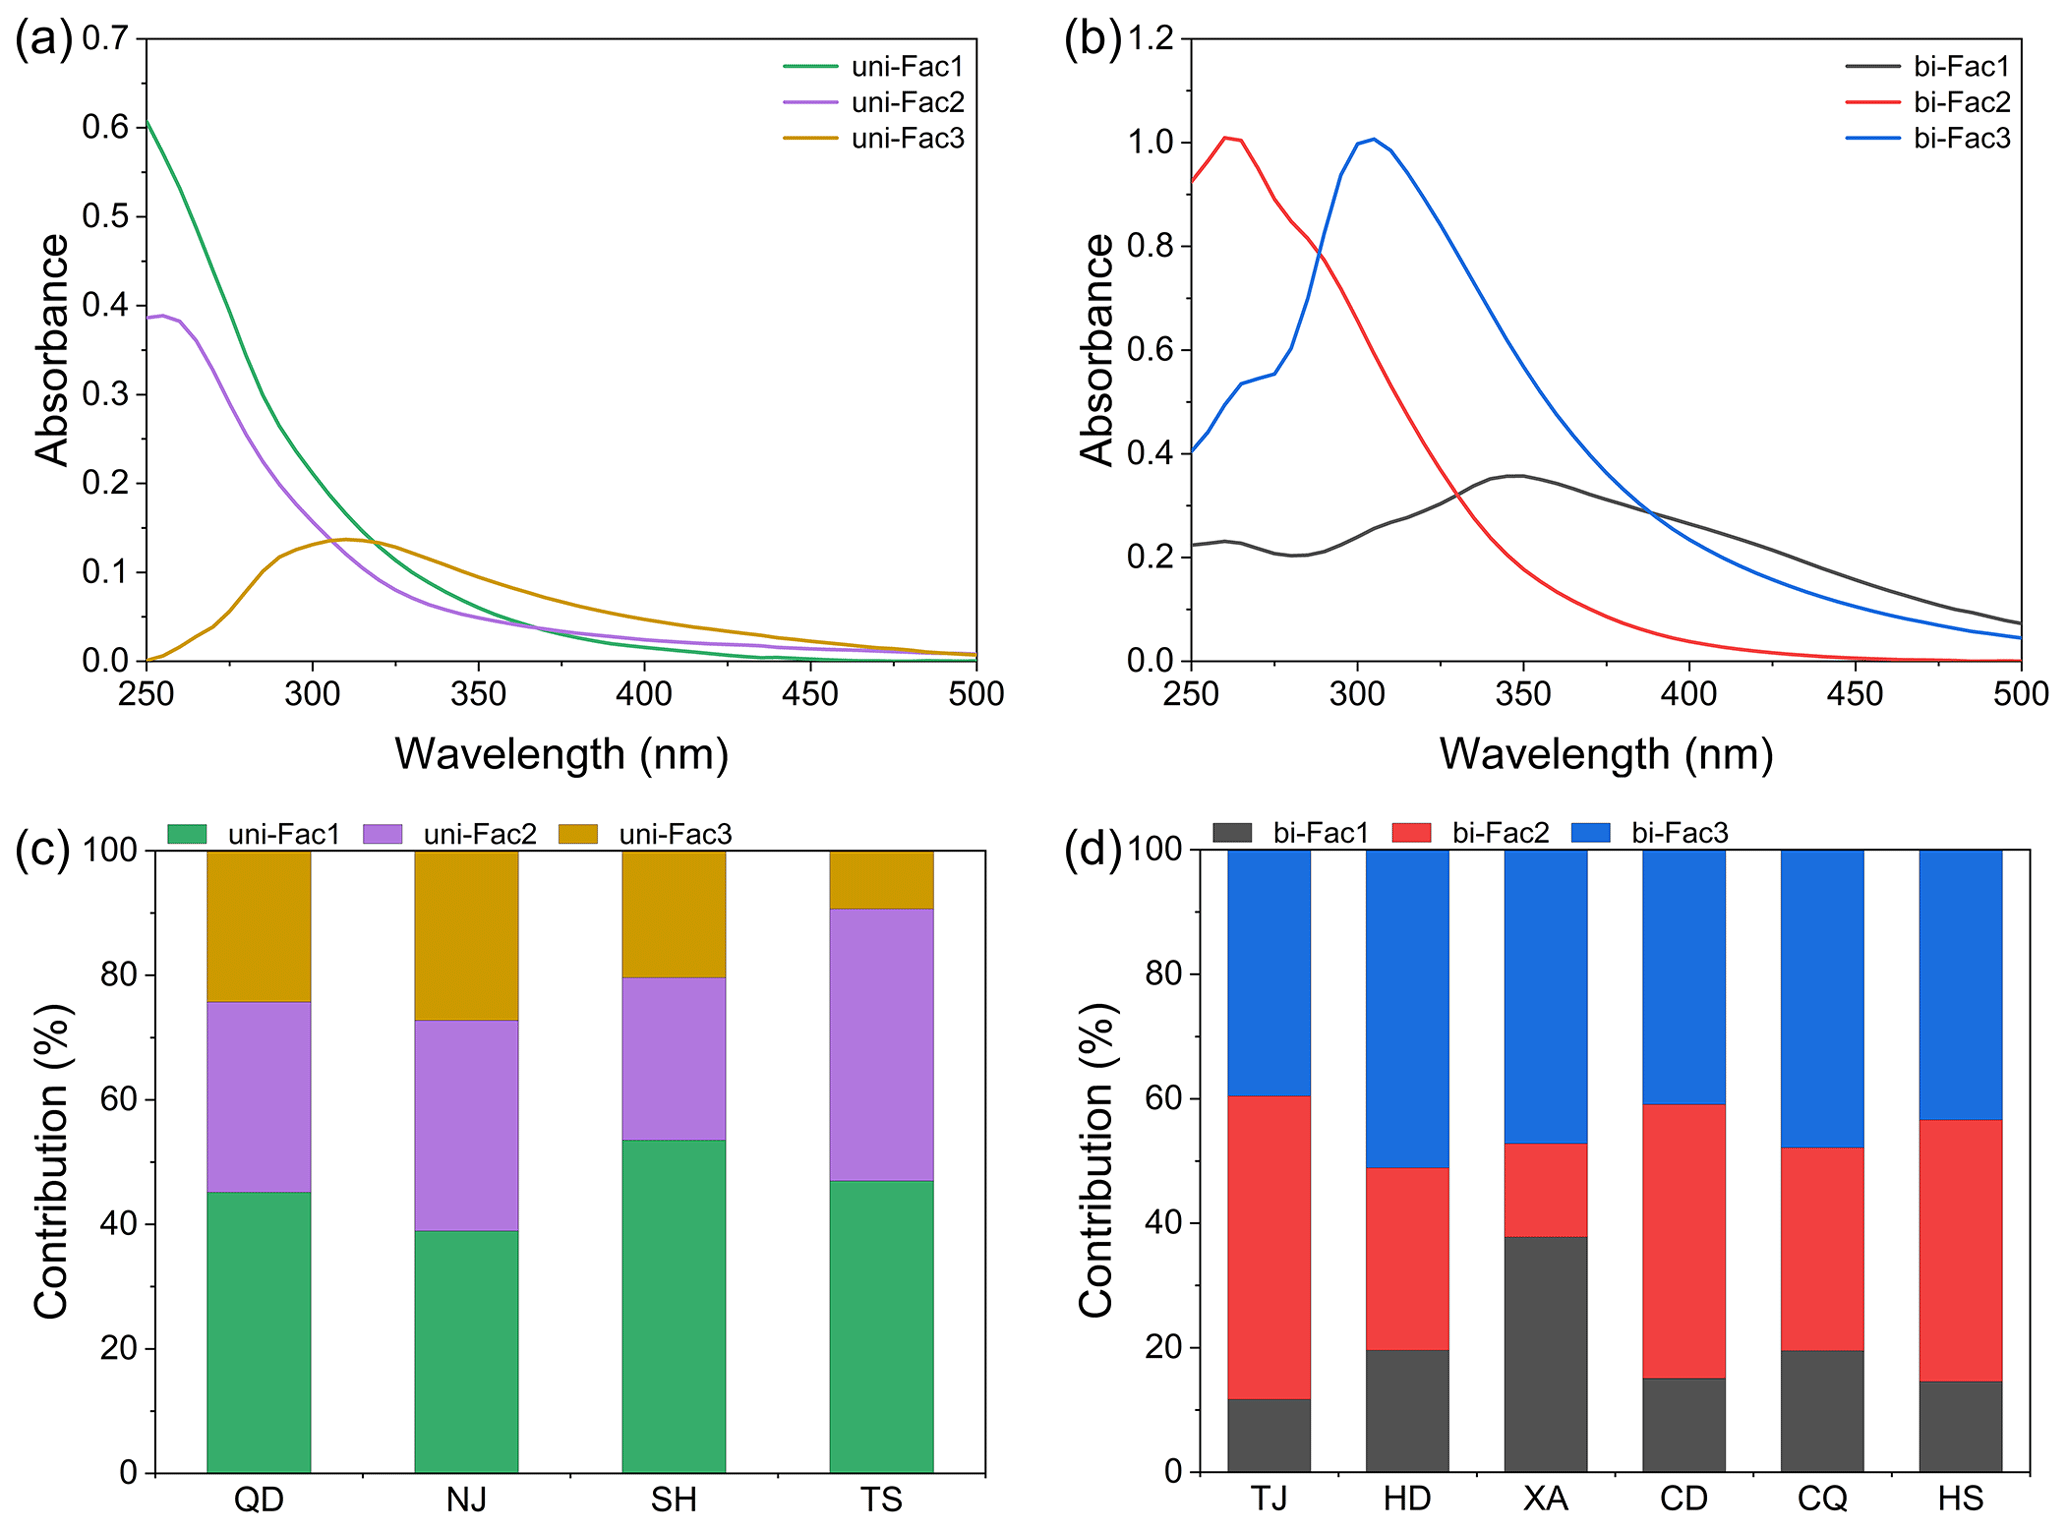
Figure 5The average light absorption spectra of the absorption factors resolved by PMF model at (a) east China sites (unimodal absorption spectral type) and (b) outside east China sites (bimodal absorption spectral type) as well as the average contribution by each factor calculated according to the integral absorbance from 250–500 nm at both types of sites (c, d).
By comparing with the light absorption spectra of light-absorbing species in previous studies, the spectra resolved in this study are found to be similar to those of most aromatic or nitrogen-containing heterocyclic compounds. For example, bi-Fac1 exhibits a clear absorption peak at 350 nm and possibly stronger absorption peaks below 250 nm, which is consistent with the spectra of nitroaromatic compounds such as 4-nitrocatechol (Huang et al., 2021; Lin et al., 2018; Yang et al., 2023). The absorbance of uni-Fac1, uni-Fac2, and bi-Fac2 decreases sharply with increasing wavelength. Here, uni-Fac2 and bi-Fac2 exhibit an absorption peak at 260 nm, while uni-Fac1 shows no distinct peaks. These factors are similar to the absorption spectra of nitroaromatic compounds and nitrogen-free aromatic compounds, respectively (Cao et al., 2023; Jiang et al., 2022a). Additionally, uni-Fac3 and bi-Fac3 have a main absorption peak at around 310 and 305 nm, which match the absorption peak of most nitrogen-free aromatic compounds such as vanillin and a few nitroaromatic compounds or nitrogen-containing heterocyclic compounds (Huang et al., 2021; Li et al., 2020b; Lin et al., 2018; Yang et al., 2023). Taken together, the above spectral analysis suggests that the important light-absorbing components in WSOC may be mainly aromatic compounds or nitrogen-containing compounds. However, it is worth noting that this judgment is based on substances with known absorption spectra, and further studies on more kinds of absorption spectra are needed in the future.
The contributions by different light absorption factors vary significantly at different wavelengths (see Fig. S12 in the Supplement). For sites located in east China, the light absorption contribution by uni-Fac1 gradually decreases with the increase in wavelength with the largest contribution at 250 nm. In contrast, the absorption contribution of uni-Fac3 increases significantly over 250–325 nm and then slowly over 325–500 nm. The absorption contribution of uni-Fac2 decreases first and then increases, with the minimum contribution appearing around 340 nm. For sites outside of east China, the contribution of bi-Fac1 is relatively stable in the 250–300 nm range but increases significantly with wavelength at wavelengths above 300 nm. In contrast, the proportional contribution of bi-Fac2 is similar to that of uni-Fac1, which monotonically decreases with increasing wavelength throughout the entire spectral range (250–500 nm). The proportional contribution of bi-Fac3 significantly increases in the range of 250–320 nm and then remains stable or slightly decreases thereafter. Overall, uni-Fac1 is the main absorption factor at sites in east China, while bi-Fac3 is the major absorption factor at sites outside east China, contributing to 38.9 % ± 10.4 %–53.5 % ± 13.5 % and 39.5 % ± 22.7 %–51.1 % ± 20.0 % (on average) of the total light absorption, respectively. This suggests that nitroaromatic or nitrogen-free aromatic compounds with strong wavelength dependence are the main light-absorbing species in WSOC at the 10 sites, highlighting the importance of aromatic structure to WSOC light absorption. However, it is worth noting that this is only preliminary knowledge based on substances with known absorption spectra. The three types of light-absorbing factors may contain different aromatic and other light-absorbing substances, which may have different relative contributions, and therefore present significantly different light absorption spectra. In the future, it is necessary to combine mass spectrometry techniques to explore the composition of light-absorbing substances in different classes at the molecular level.
The ratio calculated based on the light absorption spectra also shows that aromatic compounds are important light absorbers. As shown in Fig. 6, values in north China, northwest China, and southwest China are relatively low, especially in XA, while the value at the TS site is the highest. A very strong negative correlation between the Abs365 (r range from −0.96 to −0.32, p<0.05), MAE365 (r range of −0.83 to −0.32, p<0.05), and values are observed. This further suggests that the strong light-absorbing ability of WSOC may be associated with more aromatic structures. A strong negative correlation (p<0.05) is also found between and fluorophores (especially HULIS fluorophore) (see Fig. S13 in the Supplement), suggesting that the fluorophores also contain aromatic structures, and there may be a certain correlation between fluorophores and light-absorbing components, which is discussed in the subsequent section.
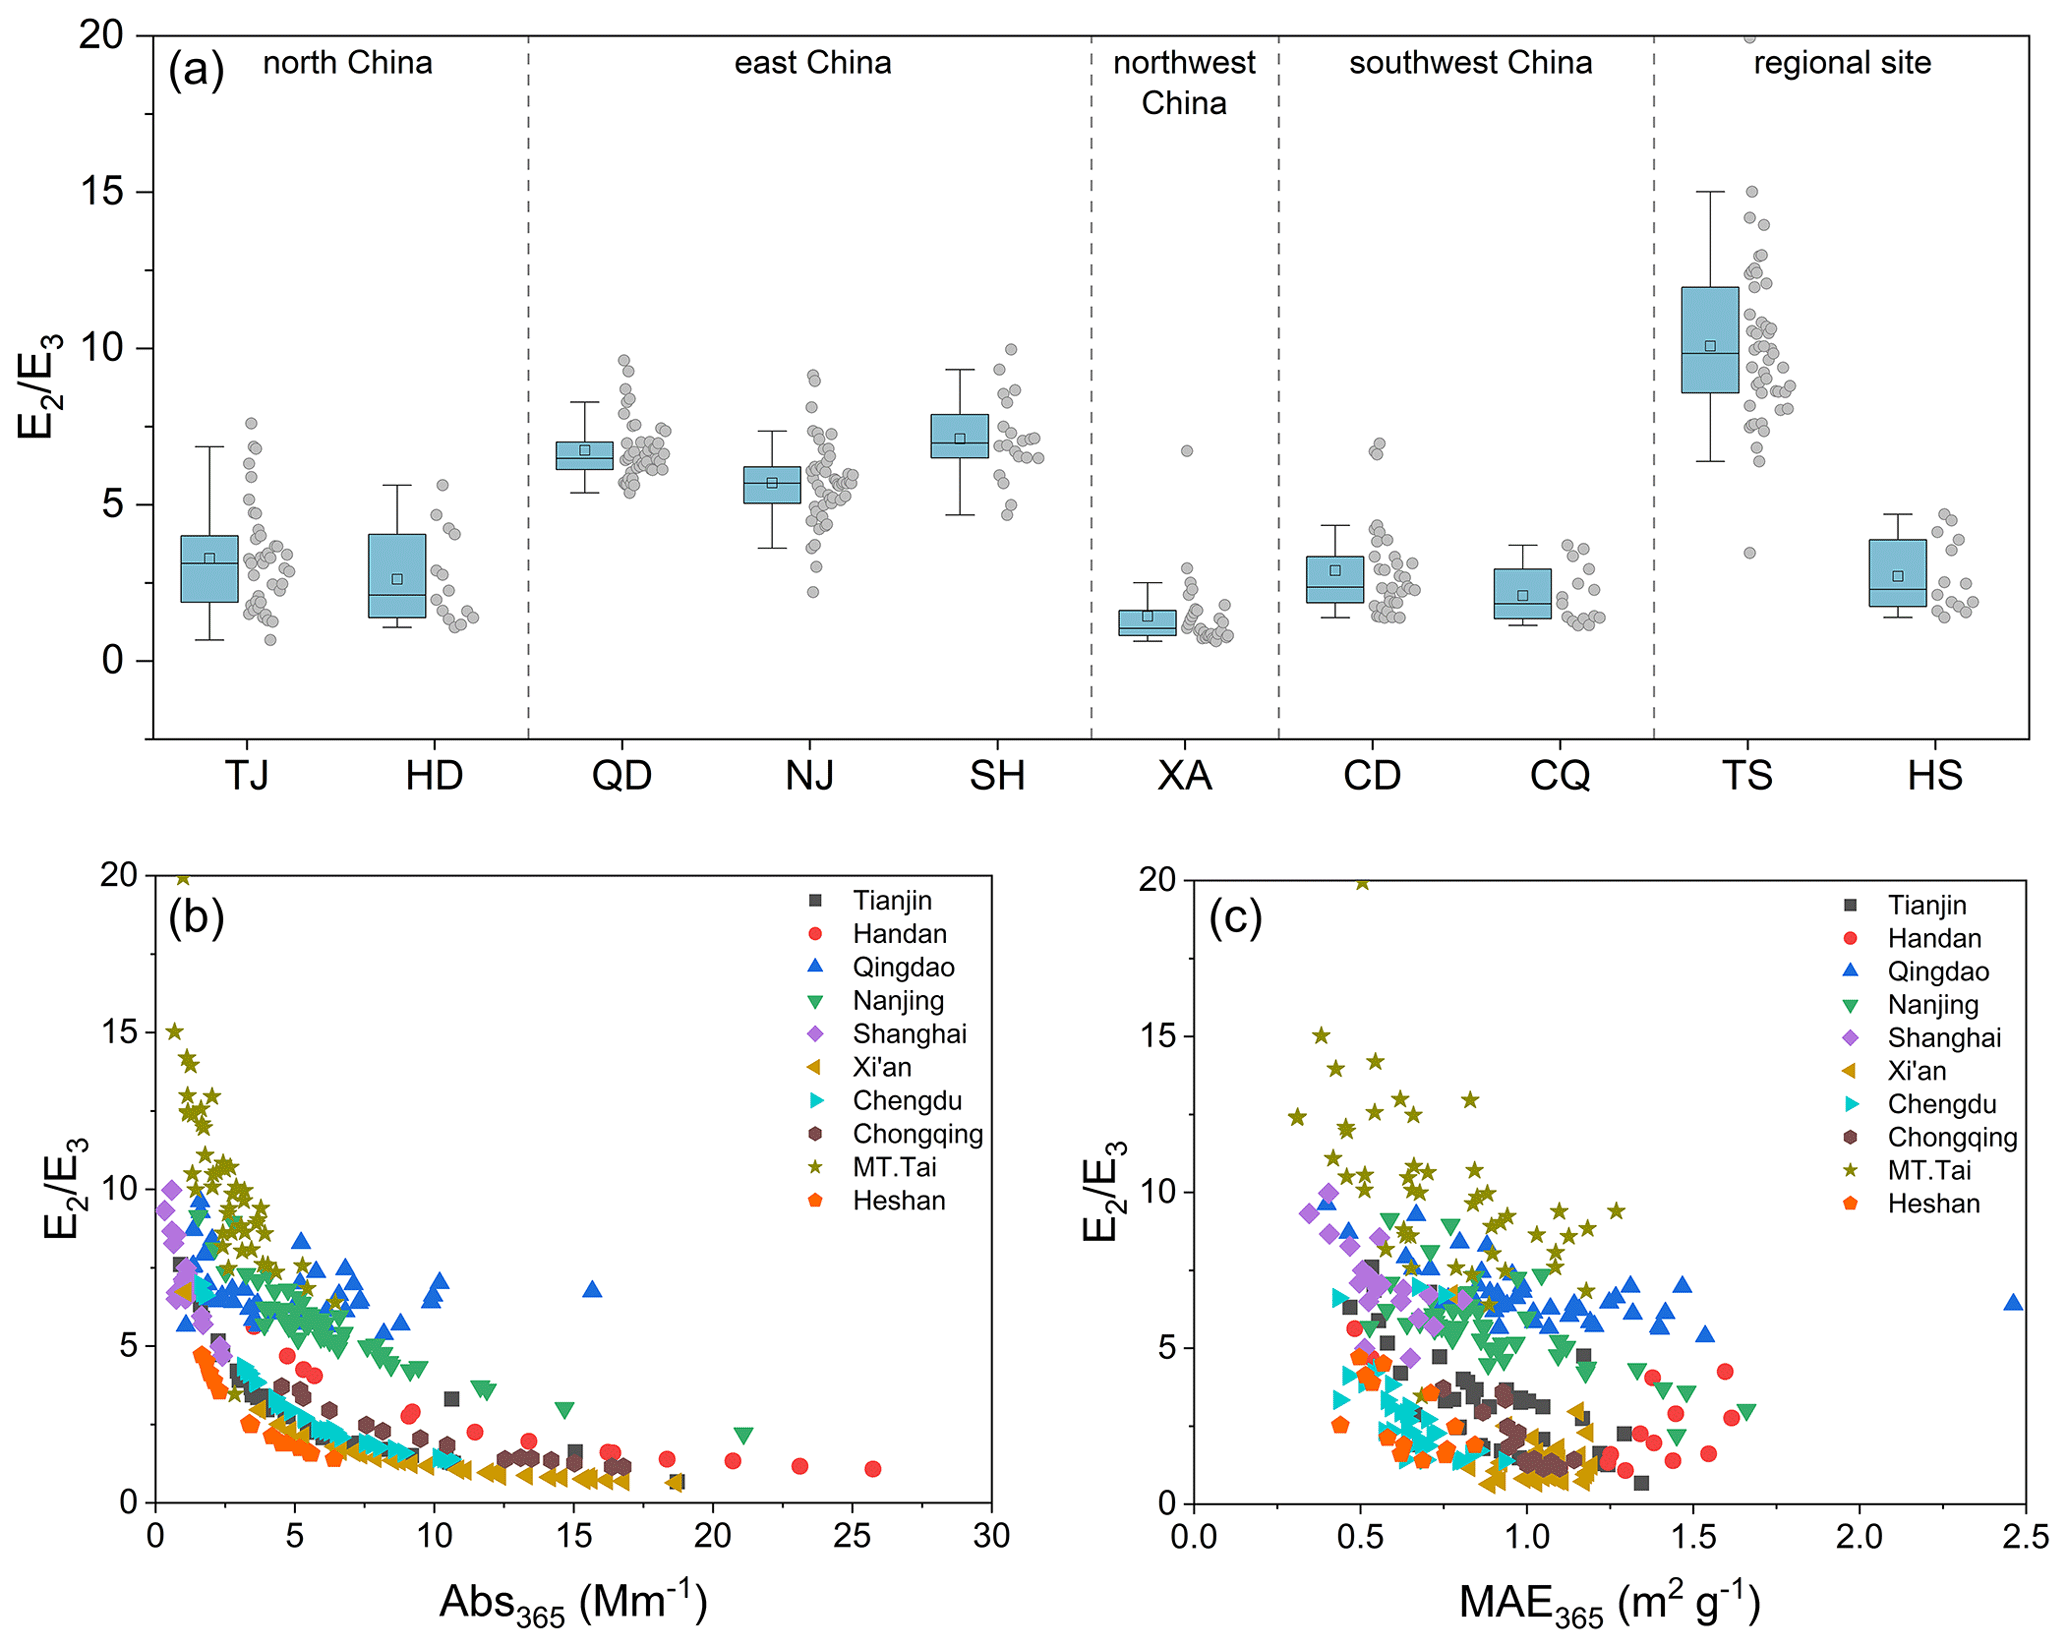
Figure 6Box plot of at the 10 sites (a) and scatterplots of relationships between Abs365 (MAE365) and (b, c).
3.3 Influencing factors of optical properties of WSOC
3.3.1 Variations of optical properties of WSOC with concentrations of PM2.5 and gaseous pollutants
To investigate the influence of air quality levels on the light absorption properties of WSOC, the sampling days are classified into five pollution levels, that is, clean (0–35 µg m−3), relatively clean (35–75 µg m−3), slightly polluted (75–115 µg m−3), moderately polluted (115–150 µg m−3), and heavily polluted (>150 µg m−3), according to the national ambient air quality daily grade-II standard threshold values and ambient air quality indices. As shown in Fig. 7a and b, Abs365 and MAE365 of WSOC both increase with the increase in pollution levels, in which Abs365 changes significantly (p<0.01), while MAE365 changes relatively gently. The enhancement of WSOC light absorption under high-pollution conditions may be related to the increase in WSOC concentration, light absorption capacity and light-absorbing species. Previous studies have reported that the mass fractions of oxidized organic aerosols increase significantly with the increase in PM2.5 mass concentration, and the oxidized organic aerosols contain a large number of light-absorbing species, such as nitroaromatic compounds (You et al., 2024). In this study, the relative abundances of O−H, C=C, and R−ONO2 functional groups, which are related to aromatic compounds, have a good positive correlation with the light absorption of WSOC and increase with PM2.5 mass concentration (see Fig. S14 in the Supplement and discussion in the next section). Additionally, the accumulation of anthropogenic emissions (especially those sources with strong light-absorbing BrC, such as biomass burning and coal combustion sources) at high pollution levels will lead to an increase in BrC chromophore types and overall light absorption capacity (Li et al., 2020a; Tang et al., 2020; Wei et al., 2020).
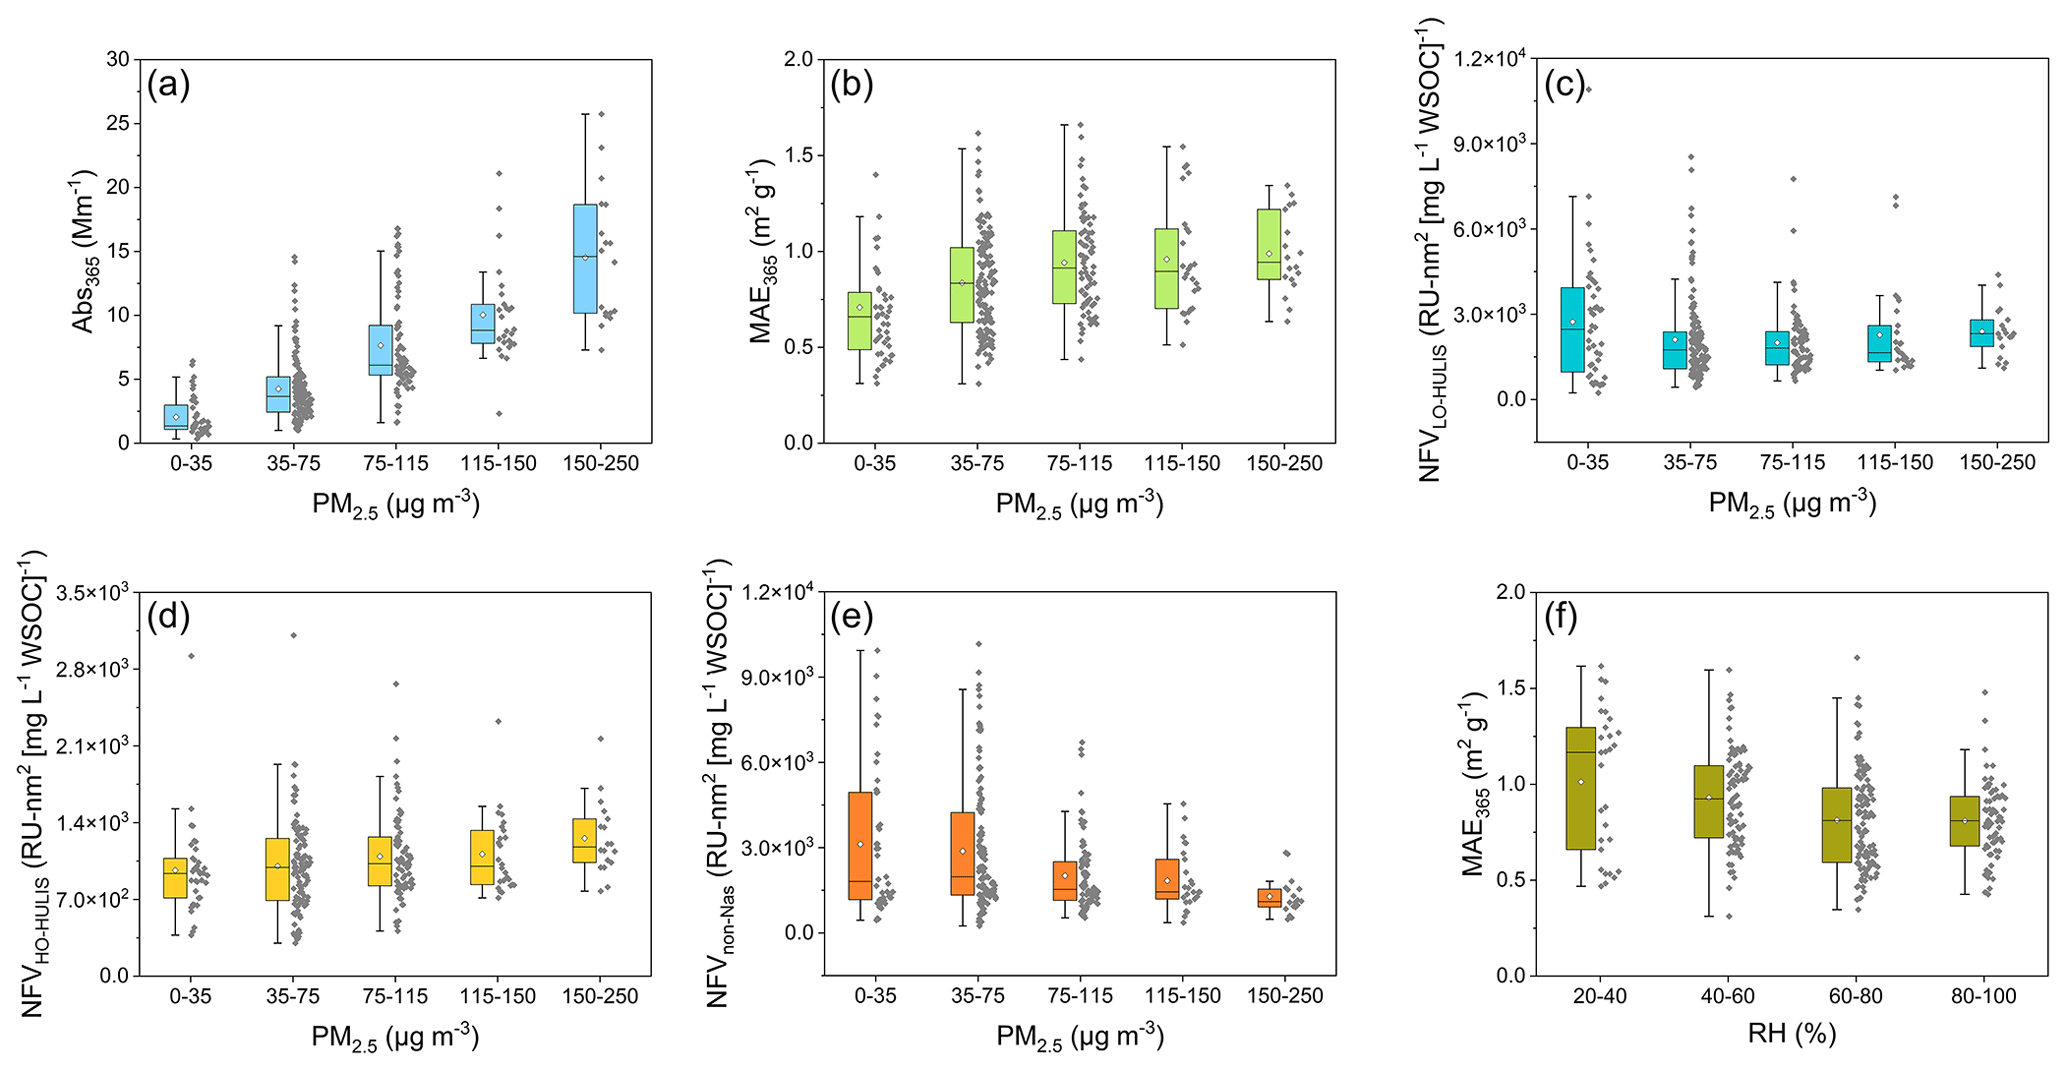
Figure 7Variations in Abs365 and MAE365 (a, b), NFV of different fluorophores (c–e) with PM2.5 mass concentrations, and MAE365 in different RH ranges (f).
The fluorescence volumes normalized by WSOC concentration (NFV) of different fluorophores exhibit different variation trends with PM2.5 mass concentrations (see Fig. 7c–e). Overall, the total NFV value of HULIS increases with PM2.5 concentrations, with the increase in HO-HULIS being more monotonous and significant (p<0.01, based on Spearman's rank correlation test), while the increase in NFV of LO-HULIS being less significant (p>0.05). In contrast, the NFV of non-Nas fluorophore decreases with the increase in PM2.5 concentrations. This suggests that HO-HULIS is the dominant fluorophore under contaminated conditions (see Fig. S14). The different degrees of increase in HO-HULIS and LO-HULIS highlight the contributions of combustion-related sources and secondary sources and the increase in aerosol oxidation under high pollution levels. This also implies an increase in chromophores with aromatic or heterocyclic structures under pollution conditions, which is consistent with the indication of functional groups.
The relationships between conventional air pollutants (CO, NO2, SO2, and O3) and Abs365 are also analyzed. As shown in Fig. S15 in the Supplement, a strong positive correlation (r range of 0.40–0.93; p<0.05) between Abs365 and CO, NO2, and SO2 is observed in TJ, QD, SH, XA, CD, CQ, and TS. As such air pollutants usually originate from fossil fuel combustion (e.g., coal combustion and vehicle emissions) or biomass burning (Adam et al., 2021), which suggests that the light absorption of WSOC in these regions could be influenced by primary combustion. Among these air pollutants, CO and SO2 have the greatest impact on Abs365 of WSOC (Fig. S15c). A good negative correlation (r range of −0.66 to −0.40; p<0.05) between Abs365 and O3 is observed at TJ, QD, SH, and XA. O3 is typically considered a type of secondary air pollutant that can be generated through various pathways, such as photochemical reactions (Adam et al., 2021). This means that the light absorption of WSOC at these sites may be also affected by atmospheric chemical processes (e.g., photobleaching) in addition to primary combustion.
3.3.2 Variations of light absorption properties of WSOC with relative humidity (RH)
Figure 7f shows that MAE365 significantly decreases with increase in RH when RH is lower than 60 %, while it exhibits no significant changes when RH>60 %. Previous studies have indicated that the mixed particles containing 4-nitrophenol and ammonium sulfate will undergo phase separation and that the separated core–shell particles may enhance light absorption through the lensing effect at low RH (Liu et al., 2023; Price et al., 2022). Moreover, compared to dry conditions, the loss of WSOC light absorption is faster at high RH. It has been reported that non-phenolic aromatic carbonyls may undergo aqueous-phase photo-oxidation to produce H2O2, which can be further decomposed to produce OH radicals at high RH, and OH radicals will bleach the BrC chromophore (Anastasio et al., 1997; Faust, 1994; Zellner et al., 1990; Zhong and Jang, 2014). Therefore, the decreasing MAE365 with increased RH may be related to phase changes and photobleaching processes as well as the changes in BrC chromophores.
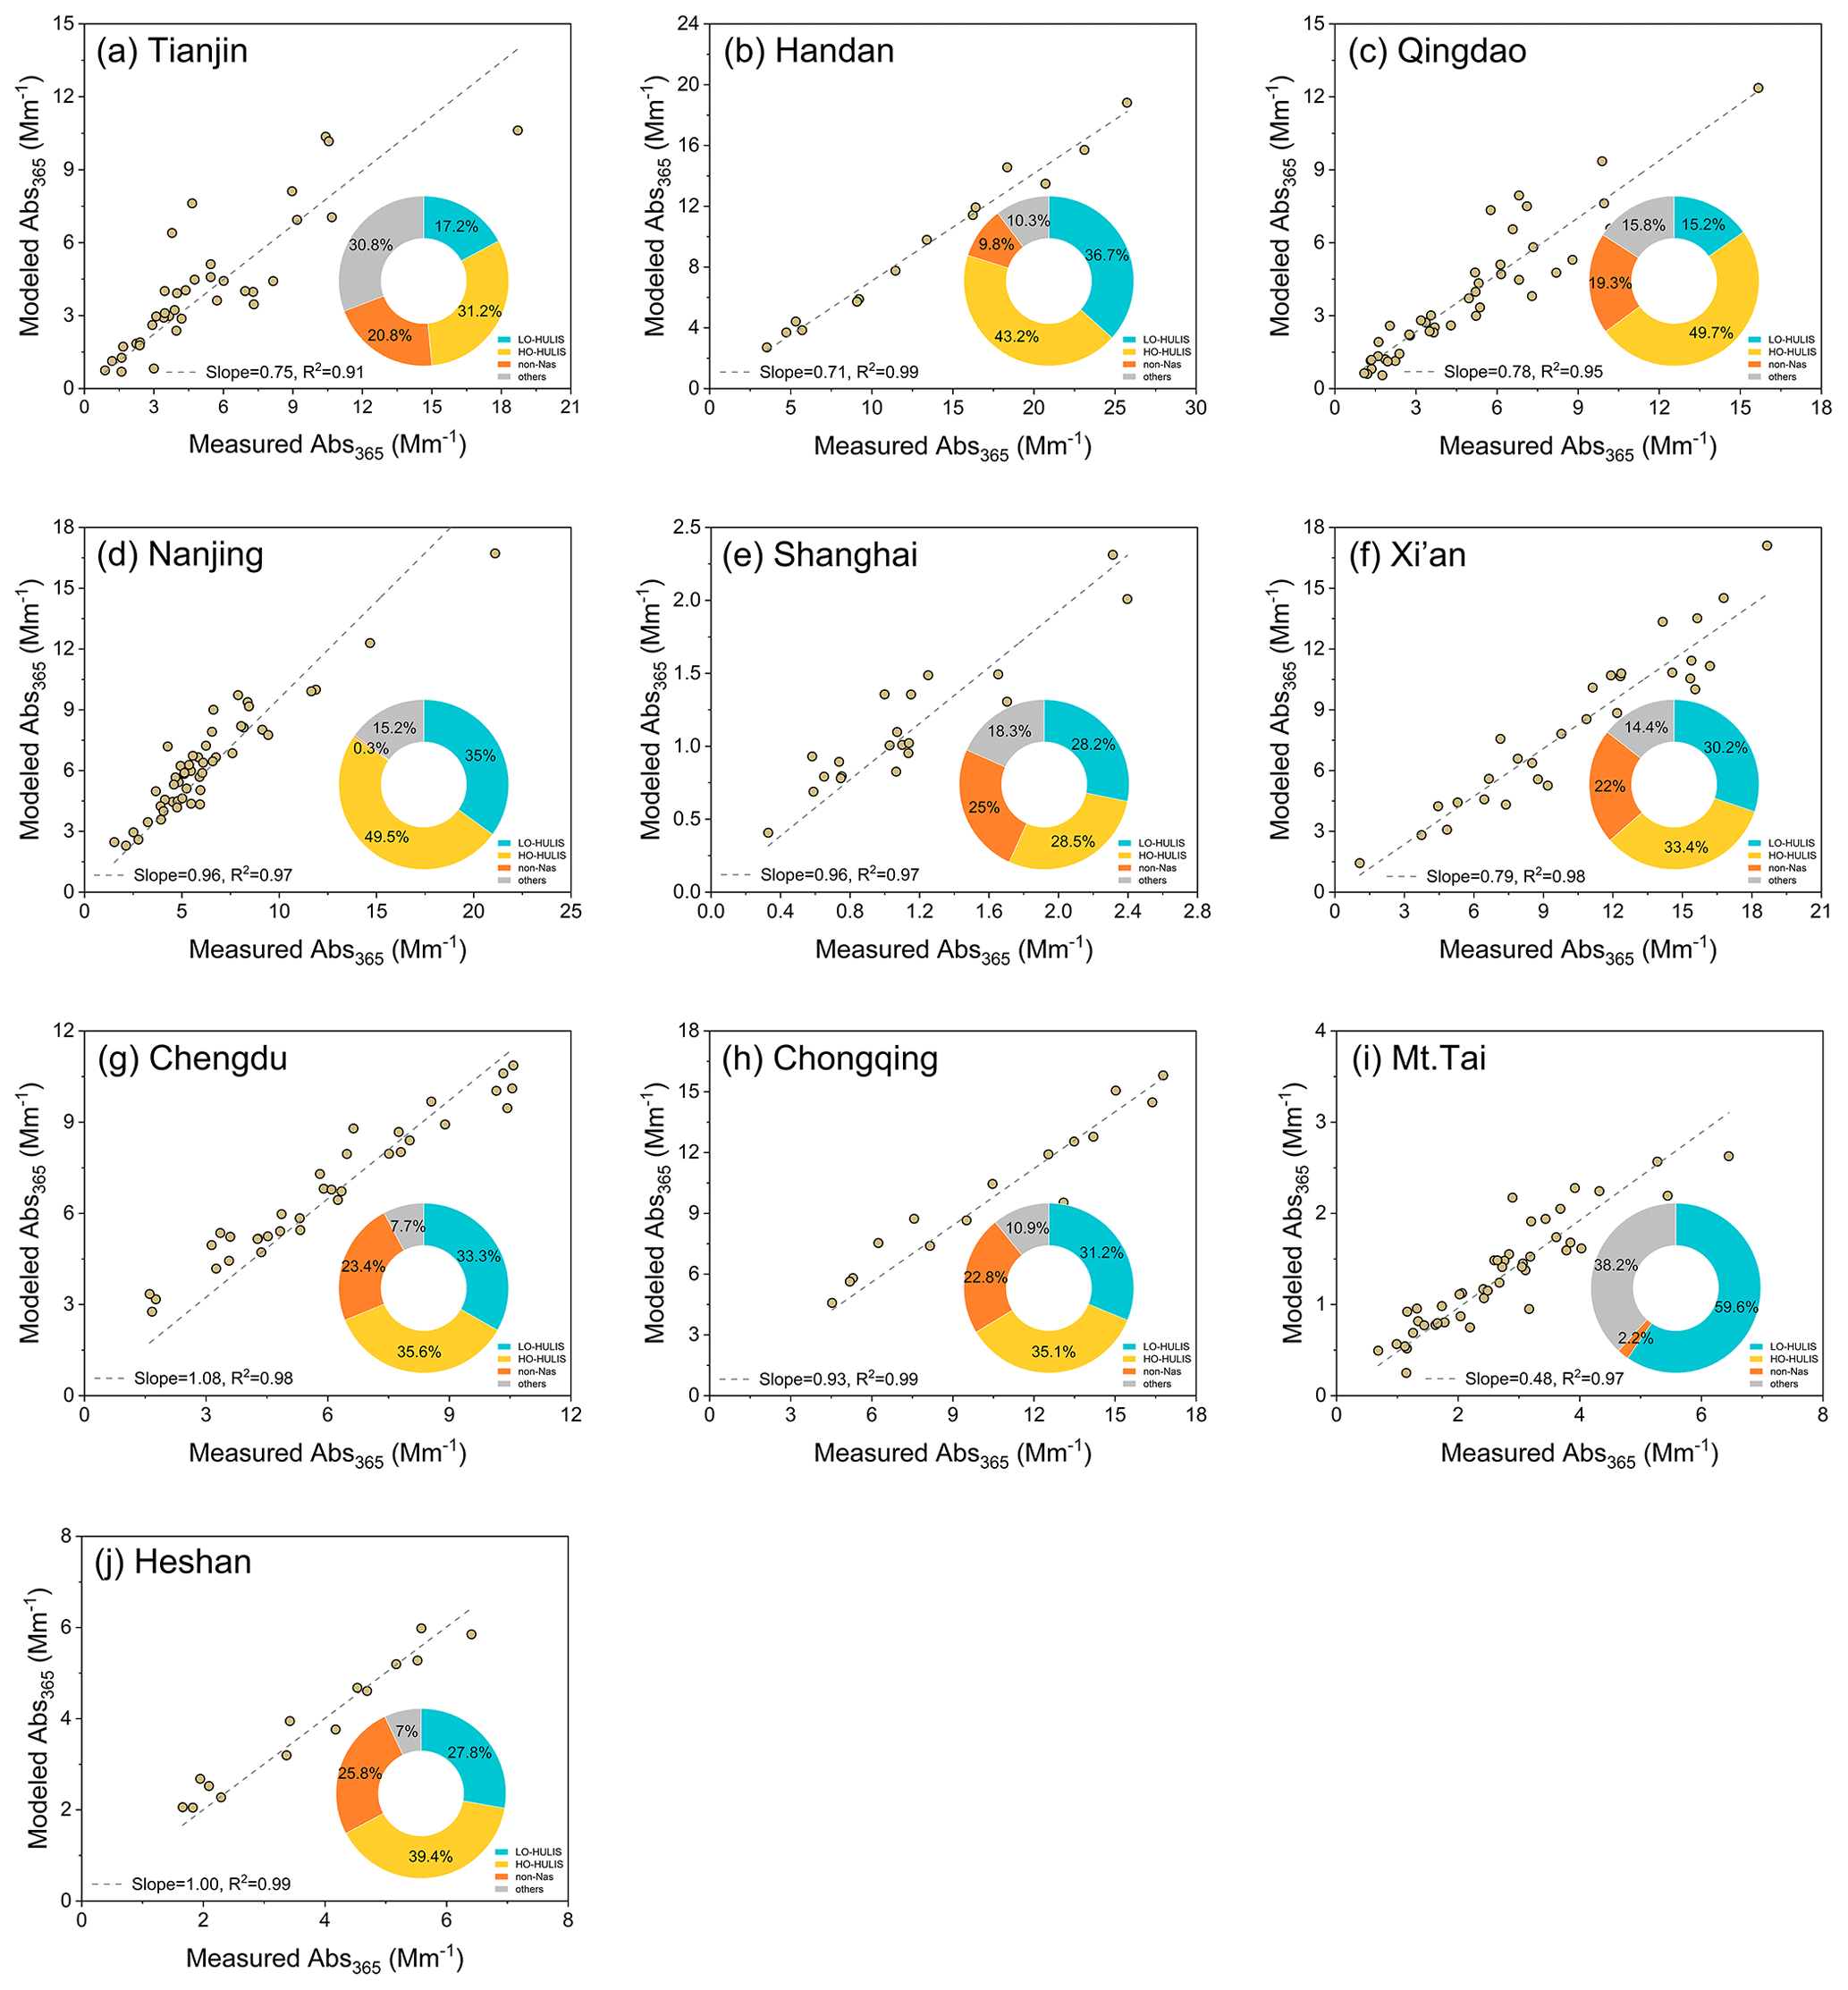
Figure 8Relationships between measured and modeled Abs365 based on multiple linear regression (MLR) analysis and fractional contributions of different fluorophores (Fmax) to total Abs365 of WSOC (circular graph) at each site.
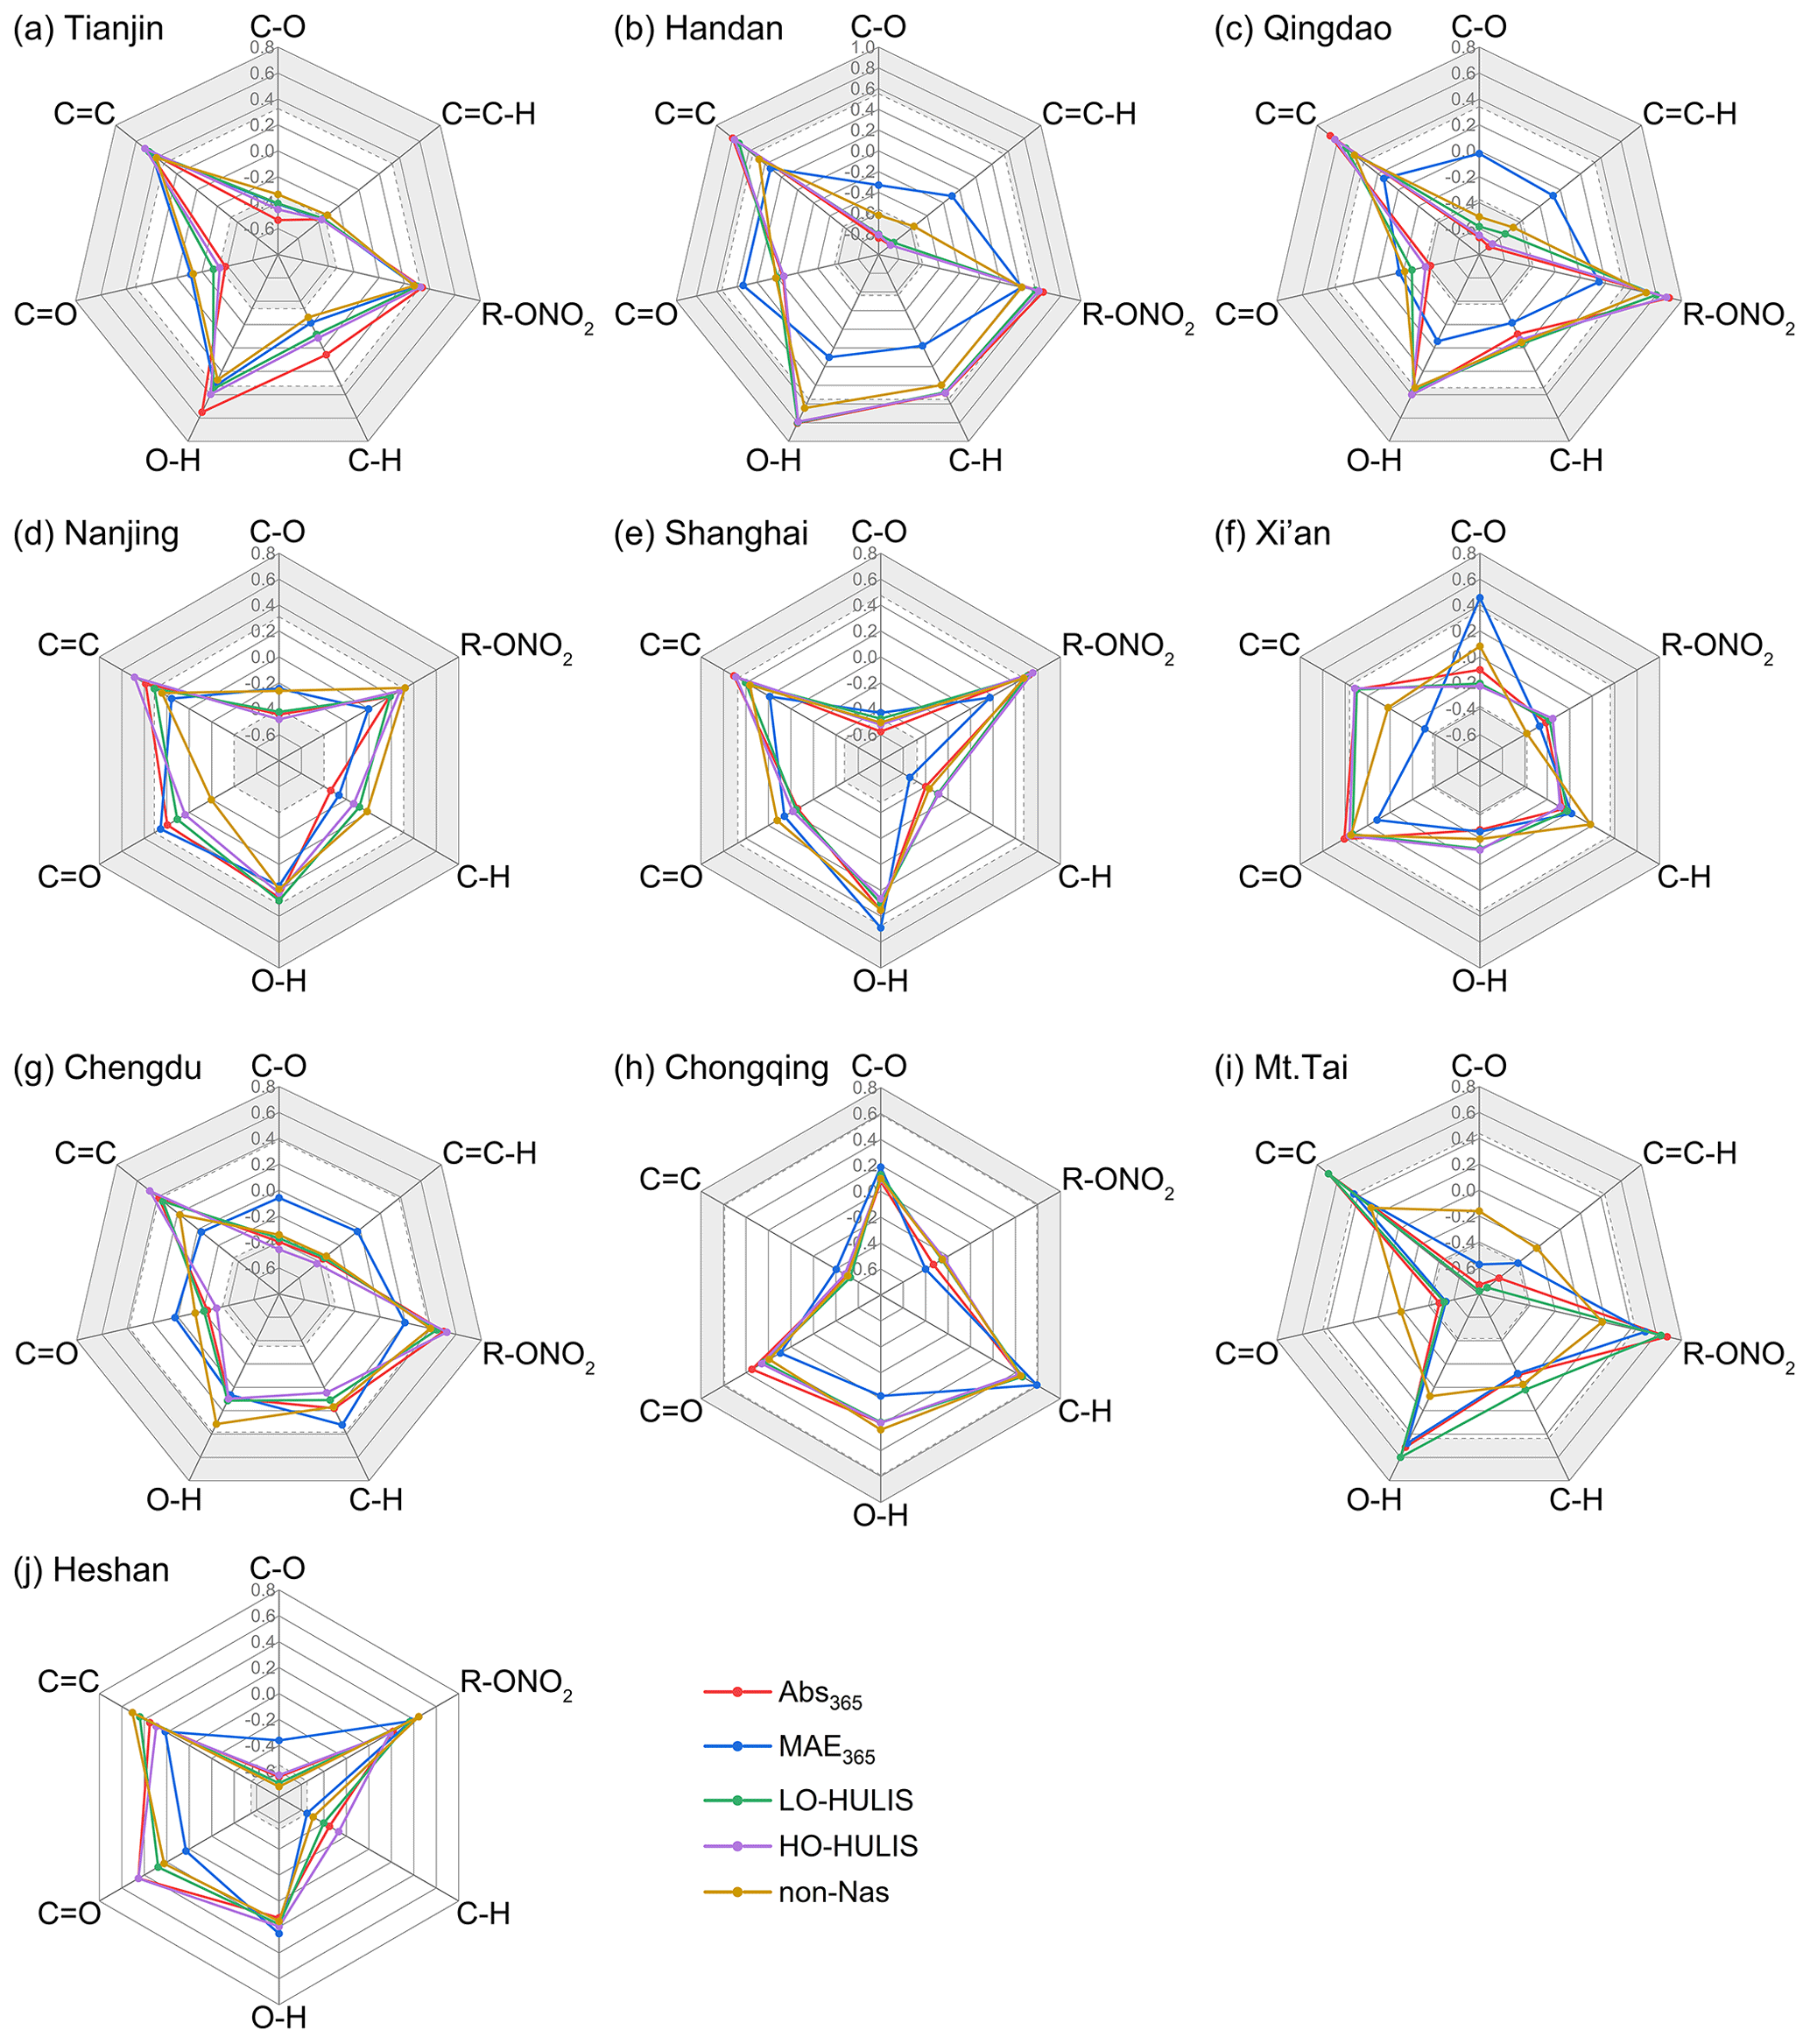
Figure 9Correlation plots among proportion of functional groups, absorbance parameters (Abs365 and MAE365), and Fmax of fluorophores (LO-HULIS, HO-HULIS, and non-Nas). Note that the shading in the radar chart denotes the significantly positive or negative correlation (p<0.05).
3.4 Relationships among fluorescent chromophore, functional groups and light absorption of WSOC
To better understand the relationships among light absorption, fluorescence, and functional group structure of WSOC, several correlation analysis methods are used in this study. Figure S13 shows that Abs365 strongly correlated with the total fluorescence volume (TFV) of fluorophores at all sites (p<0.01), indicating that the fluorescent components may contribute to WSOC light absorption to some extent. Then, the MLR model is further applied to evaluate the relationship between the Fmax of various fluorescent components and Abs365, and a good linear fitting relationship is found between measured Abs365 and modeled Abs365 (see Fig. 8). The adjusted R2 values of the MLR model range from 0.62 to 0.93, implying that the fluorophores identified at the 10 sites can explain 61.8 %–93.0 % of the measured WSOC light absorption. Furthermore, the contribution of various fluorophores to Abs365 is quantified by calculating the standardized regression coefficients (beta) in the MLR model (see the pie chart in Fig. 8). The results show that HULIS fluorophores have the greatest contribution to Abs365, with higher contributions by HO-HULIS (28.5 %–49.7 %) than LO-HULIS (15.2 %–59.6 %) and followed by non-Nas (0.31 %–25.8 %), although HO-HULIS accounts for the lowest proportion of the total fluorophores. The high contribution of HO-HULIS to Abs365 may be related to its complex source and composition, such as the presence of unsaturated and high molecular weight aromatic structures in HO-HULIS. Previous studies have shown that the light-absorbing ability of BrC is positively correlated with the unsaturation and molecular weight of chromophores (Chen and Bond, 2010; Tang et al., 2020). It should be noted that HO-HULIS is not resolved at the TS site, and the contribution of LO-HULIS to Abs365 at the TS site is much higher than that of non-Nas (59.6 %>2.2 %). To better understand the importance of fluorophores to WSOC light absorption, the fluorescence intensity of each fluorophore at all sites is summarized and input into the XGBoost-SHAP model. The absolute value of the average SHAP score is used to evaluate the importance of different fluorophores on Abs365, where the larger the value, the greater its importance. Figure S16 in the Supplement shows that HO-HULIS is of the highest importance, much higher than non-Nas and LO-HULIS. This further demonstrates the important contribution of fluorescent components to light absorption of WSOC, especially by HO-HULIS.
Figure 9 illustrates the relationships of light absorption parameters and fluorescence chromophores with functional groups. In general, fluorescence chromophores (especially the HULIS classes) and the Abs365 exhibit similar correlations with functional groups at all sites, which agrees well with the important contribution of fluorescence chromophores to the light absorption of WSOC as aforementioned. At most sites (except XA and CQ), O−H, C=C and R−ONO2 functional groups show the strongest positive correlations with Abs365 and fluorescent chromophores, implying that aromatic compounds (especially at polluted sites such as HD, NJ, QD, and CD) and organic nitrates (especially at less polluted sites such as SH, TS, and HS) have important impacts on the optical properties of WSOC. However, ester or ether and aliphatic hydrocarbon functional groups (e.g., C−O and ) have relatively smaller positive impacts on the optical properties of WSOC, even exhibiting negative correlations with light absorption parameters and fluorescence chromophores at some sites. In contrast, the relationships of functional groups with MAE365 are slightly different from those with Abs365. Overall, C=C, O−H, and R−ONO2 exhibit the strongest correlations with MAE365 at most sites (e.g., TJ, QD, SH, TS, and HS). C=O and C−O, which may be related to carboxylic acids, phenols, and esters, show positive correlations with MAE365 at some sites (e.g., HD, NJ, XA, and CQ). The positive correlation of C=O and C−H functional groups with both Abs365 and MAE365 and the strong positive correlation of the C−O group with MAE365 in XA could explain the particularity of light absorption characteristics and the ability of WSOC in XA to a certain extent.
Based on the same measurement methods and data processing processes, light absorption, fluorescence, and FTIR spectra analysis are combined to investigate the optical properties and functional group characteristics of WSOC at 10 sites in different regions of China. The spatial variations at various sites and the relationships between absorbance, fluorescence, and functional groups of WSOC are revealed. Mass concentrations of carbonaceous components (OC, EC, and WSOC) and light absorption of WSOC exhibit a significant spatial variation at the 10 sites, which generally manifested as northwest China > southwest China > north China > east China > regional site, with higher values in northern China than southern China and regional sites and higher in inland areas than coastal areas.
The aromatic and large molecular weight structure has a significant impact on the light-absorbing ability of WSOC according to the ratio, PMF-LAS resolved light absorption factors, and functional groups. PMF-LAS method determines three (uni-Fac1–uni-Fac3 and bi-Fac1–bi-Fac3) light absorption factors for unimodal light-absorbing spectra at sites in east China and bimodal light-absorbing spectra at sites outside east China, respectively. These factors are mainly determined to be aromatic compounds by comparing the spectra with existing BrC species. Furthermore, FTIR-based function groups show that aromatic O−H (39.2 %–48.5 %) and C=C (16.6 %–30.9 %) as well as aliphatic C−O (14.0 %–27.8 %) are the three most abundant functional groups in WSOC. The strong positive correlation between aromatic O−H and C=C with Abs365 and MAE365 suggests that aromatic components (especially phenolic compounds) play an important role in the light absorption of WSOC. Three types of fluorophores in WSOC are resolved by EEM-PARAFAC analysis, with LO-HULIS being the most abundant fluorophore, followed by non-Nas and HO-HULIS. The positive correlation between or aromatic functional groups (O−H and C=C) and these three fluorophores indicates that aromatic structures also have an important impact on the fluorescent components. This also indicates that there is an undeniable connection between the light absorption and fluorescence of WSOC. Quantitatively, MLR results show that the identified fluorophores (especially HULIS such as LO-HULIS and HO-HULIS) contribute significantly to the Abs365 of WSOC (with proportion contribution of 61.8 %–93.0 %), with the largest contribution by HO-HULIS (28.5 %–49.7 %).
Analysis of the relationships between WSOC light absorption and gaseous precursors and meteorological conditions show that primary combustion sources have significant impacts on WSOC light absorption at most sites (such as TJ, QD, SH, XA, CD, CQ, and TS), and atmospheric chemical process (such as photobleaching) exhibit more effects on WSOC light absorption at TJ, QD, SH, and XA sites. Moreover, the multi-site observation dataset shows that MAE365 of WSOC generally increases with pollution levels and decreases with increasing RH within the range of 20 %–60 % and keeps stable when RH>60 %. Taken together, this study promotes our knowledge of optical properties and structural characteristics of WSOC in different regions of China and deepens the understanding of the contribution of WSOC fluorescence to its light absorption. In the future, it is necessary to build a quantitative parametric relationship between light absorption, composition, and structure of WSOC, especially with the evolution of atmospheric processes. Additionally, it is important to note that this study only focuses on WSOC. Since the WISOC may have stronger light absorption capacity, further research on light absorption, composition, and structure of WISOC (especially in northern China in winter) and the correlation between them are also needed in the future.
Data presented and used throughout this study can be accessed in the following data repository: https://doi.org/10.5281/zenodo.14193028 (Chen, 2024).
The Supplement includes 6 texts (Texts S1–S6), 2 tables (Tables S1 and S2), and 16 figures (Figs. S1–S16) related to the paper. The supplement related to this article is available online at https://doi.org/10.5194/acp-25-3647-2025-supplement.
CY designed the research and supported funding the observation. XW, QC, MX, JL, FW, SF, QY, HN, MZ, YW, and LX had an active role in supporting the sampling work. HC carried out the sample pretreatment and instrumental analysis under the guidance of CY, LH, and LD. HC processed data, plotted the figures, and wrote the manuscript. YY provided assistance in data processing. CY edited the manuscript. All authors contributed to the discussions of the results and the refinement of the manuscript.
The contact author has declared that none of the authors has any competing interests.
Publisher's note: Copernicus Publications remains neutral with regard to jurisdictional claims made in the text, published maps, institutional affiliations, or any other geographical representation in this paper. While Copernicus Publications makes every effort to include appropriate place names, the final responsibility lies with the authors.
This work was supported by the Natural Science Foundation of China (grant no. 42205110), Natural Science Foundation of Jiangsu Province (grant no. BK20220275), Excellent Young Scholar (Overseas) project of Shandong Province (grant no. 2022HWYQ-049), and special fund of State Environmental Protection Key Laboratory of Formation and Prevention of Urban Air Pollution Complex (grant no. SEPAir-2022080593).
This paper was edited by Alex Lee and reviewed by Neeraj Rastogi and one anonymous referee.
Adam, M. G., Tran, P. T. M., and Balasubramanian, R.: Air quality changes in cities during the COVID-19 lockdown: A critical review, Atmos. Res., 264, 105823, https://doi.org/10.1016/j.atmosres.2021.105823, 2021.
Anastasio, C., Faust, B. C., and Rao, C. J.: Aromatic carbonyl compounds as aqueous-phase photochemical sources of hydrogen peroxide in acidic sulfate aerosols, fogs, and clouds. 1. Non-phenolic methoxybenzaldehydes and methoxyacetophenones with reductants (phenols), Environ. Sci. Technol., 31, 218–232, https://doi.org/10.1021/es960359g, 1997.
Andreae, M. O. and Gelencsér, A.: Black carbon or brown carbon? The nature of light-absorbing carbonaceous aerosols, Atmos. Chem. Phys., 6, 3131–3148, https://doi.org/10.5194/acp-6-3131-2006, 2006.
Bosch, C., Andersson, A., Kirillova, E. N., Budhavant, K., Tiwari, S., Praveen, P. S., Russell, L. M., Beres, N. D., Ramanathan, V., and Gustafsson, O.: Source-diagnostic dual-isotope composition and optical properties of water-soluble organic carbon and elemental carbon in the South Asian outflow intercepted over the Indian Ocean, J. Geophys. Res.-Atmos., 119, 11743–11759, https://doi.org/10.1002/2014jd022127, 2014.
Cao, J., Shang, J., Kuang, Y., Jiang, X., Shi, X., and Qiu, X.: Molecular composition of Beijing PM2.5 Brown carbon associated with fluorescence revealed by gas chromatography time-of-flight mass spectrometry and parallel factor analysis, Atmos. Environ., 333, 120670, https://doi.org/10.1016/j.atmosenv.2024.120670, 2024a.
Cao, T., Li, M., Zou, C., Fan, X., Song, J., Jia, W., Yu, C., Yu, Z., and Peng, P.: Chemical composition, optical properties, and oxidative potential of water- and methanol-soluble organic compounds emitted from the combustion of biomass materials and coal, Atmos. Chem. Phys., 21, 13187–13205, https://doi.org/10.5194/acp-21-13187-2021, 2021.
Cao, T., Li, M., Xu, C., Song, J., Fan, X., Li, J., Jia, W., and Peng, P.: Technical note: Chemical composition and source identification of fluorescent components in atmospheric water-soluble brown carbon by excitation–emission matrix spectroscopy with parallel factor analysis – potential limitations and applications, Atmos. Chem. Phys., 23, 2613–2625, https://doi.org/10.5194/acp-23-2613-2023, 2023.
Cao, X., Liu, J., Wu, Y., Cheng, Y., Zheng, M., and He, K.: A review on brown carbon aerosol in China: From molecular composition to climate impact, Curr. Pollut. Rep., 10, 326–343, https://doi.org/10.1007/s40726-024-00293-y, 2024b.
Chen, H.: Dataset for “Measurement Report: Optical and structural properties of atmospheric water-soluble organic carbon in China: Insights from multi-site spectroscopic measurements”, Zenodo [data set], https://doi.org/10.5281/zenodo.14193028, 2024.
Chen, H., Yan, C., Fu, Q., Wang, X., Tang, J., Jiang, B., Sun, H., Luan, T., Yang, Q., Zhao, Q., Li, J., Zhang, G., Zheng, M., Zhou, X., Chen, B., Du, L., Zhou, R., Zhou, T., and Xue, L.: Optical properties and molecular composition of wintertime atmospheric water-soluble organic carbon in different coastal cities of eastern China, Sci. Total Environ., 892, 164702, https://doi.org/10.1016/j.scitotenv.2023.164702, 2023.
Chen, H., Zhou, R., Fang, L., Sun, H., Yang, Q., Niu, H., Liu, J., Tian, Y., Cui, M., and Yan, C.: Variations in optical properties of water- and methanol-soluble organic carbon in PM2.5 in Tianjin and Handan over the wintertime of 2018–2020, Atmos. Res., 303, 107332, https://doi.org/10.1016/j.atmosres.2024.107332, 2024.
Chen, J., Wang, X., Zhang, J., Li, M., Li, H., Liu, Z., Bi, Y., Wu, D., Yin, X., Gu, R., Jiang, Y., Shan, Y., Zhao, Y., Xue, L., and Wang, W.: Particulate organic nitrates at Mount Tai in winter and spring: Variation characteristics and effects of mountain-valley breezes and elevated emission sources, Environ. Res., 212, 113182, https://doi.org/10.1016/j.envres.2022.113182, 2022.
Chen, Q., Ikemori, F., and Mochida, M.: Light absorption and excitation-emission fluorescence of urban organic aerosol components and their relationship to chemical structure, Environ. Sci. Technol., 50, 10859–10868, https://doi.org/10.1021/acs.est.6b02541, 2016a.
Chen, Q., Miyazaki, Y., Kawamura, K., Matsumoto, K., Coburn, S., Volkamer, R., Iwamoto, Y., Kagami, S., Deng, Y., Ogawa, S., Ramasamy, S., Kato, S., Ida, A., Kajii, Y., and Mochida, M.: Characterization of chromophoric water-soluble organic matter in urban, forest, and marine aerosols by HR-ToF-AMS analysis and excitation-emission matrix spectroscopy, Environ. Sci. Technol., 50, 10351–10360, https://doi.org/10.1021/acs.est.6b01643, 2016b.
Chen, Q., Wang, M., Wang, Y., Zhang, L., Li, Y., and Han, Y.: Oxidative potential of water-soluble matter associated with chromophoric substances in PM2.5 over Xi'an, China, Environ. Sci. Technol., 53, 8574–8584, https://doi.org/10.1021/acs.est.9b01976, 2019.
Chen, Q., Li, J., Hua, X., Jiang, X., Mu, Z., Wang, M., Wang, J., Shan, M., Yang, X., Fan, X., Song, J., Wang, Y., Guan, D., and Du, L.: Identification of species and sources of atmospheric chromophores by fluorescence excitation-emission matrix with parallel factor analysis, Sci. Total Environ., 718, 137322, https://doi.org/10.1016/j.scitotenv.2020.137322, 2020.
Chen, Y. and Bond, T. C.: Light absorption by organic carbon from wood combustion, Atmos. Chem. Phys., 10, 1773–1787, https://doi.org/10.5194/acp-10-1773-2010, 2010.
Cheng, Y., He, K.-B., Zheng, M., Duan, F.-K., Du, Z.-Y., Ma, Y.-L., Tan, J.-H., Yang, F.-M., Liu, J.-M., Zhang, X.-L., Weber, R. J., Bergin, M. H., and Russell, A. G.: Mass absorption efficiency of elemental carbon and water-soluble organic carbon in Beijing, China, Atmos. Chem. Phys., 11, 11497–11510, https://doi.org/10.5194/acp-11-11497-2011, 2011.
Cheng, Y., He, K. B., Du, Z. Y., Engling, G., Liu, J. M., Ma, Y. L., Zheng, M., and Weber, R. J.: The characteristics of brown carbon aerosol during winter in Beijing, Atmos. Environ., 127, 355–364, https://doi.org/10.1016/j.atmosenv.2015.12.035, 2016.
Chen, Y. F., Ge, X. L., Chen, H., Xie, X. C., Chen, Y. T., Wang, J. F., Ye, Z. L., Bao, M. Y., Zhang, Y. L., and Chen, M. D.: Seasonal light absorption properties of water-soluble brown carbon in atmospheric fine particles in Nanjing, China, Atmos. Environ., 187, 230–240, https://doi.org/10.1016/j.atmosenv.2018.06.002, 2018.
Choudhary, V., Rajput, P., and Gupta, T.: Absorption properties and forcing efficiency of light-absorbing water-soluble organic aerosols: Seasonal and spatial variability, Environ. Pollut., 272, 115932, https://doi.org/10.1016/j.envpol.2020.115932, 2021.
Dasari, S., Andersson, A., Bikkina, S., Holmstrand, H., Budhavant, K., Satheesh, S., Asmi, E., Kesti, J., Backman, J., Salam, A., Bisht, D. S., Tiwari, S., Hameed, Z., and Gustafsson, O.: Photochemical degradation affects the light absorption of water-soluble brown carbon in the South Asian outflow, Sci. Adv., 5, eaau8066, https://doi.org/10.1126/sciadv.aau8066, 2019.
Deng, J., Ma, H., Wang, X., Zhong, S., Zhang, Z., Zhu, J., Fan, Y., Hu, W., Wu, L., Li, X., Ren, L., Pavuluri, C. M., Pan, X., Sun, Y., Wang, Z., Kawamura, K., and Fu, P.: Measurement report: Optical properties and sources of water-soluble brown carbon in Tianjin, North China – insights from organic molecular compositions, Atmos. Chem. Phys., 22, 6449–6470, https://doi.org/10.5194/acp-22-6449-2022, 2022.
Dey, S. and Sarkar, S.: Compositional and optical characteristics of aqueous brown carbon and HULIS in the eastern Indo-Gangetic Plain using a coupled EEM PARAFAC, FT-IR and 1H NMR approach, Sci. Total Environ., 921, 171084, https://doi.org/10.1016/j.scitotenv.2024.171084, 2024.
Dey, S., Mukherjee, A., Polana, A. J., Rana, A., Mao, J., Jia, S., Yadav, A. K., Khillare, P. S., and Sarkar, S.: Brown carbon aerosols in the Indo-Gangetic Plain outflow: Insights from excitation emission matrix (EEM) fluorescence spectroscopy, Environ. Sci.-Proc. Imp., 23, 745–755, https://doi.org/10.1039/d1em00050k, 2021.
Diesch, J.-M., Drewnick, F., Zorn, S. R., von der Weiden-Reinmüller, S.-L., Martinez, M., and Borrmann, S.: Variability of aerosol, gaseous pollutants and meteorological characteristics associated with changes in air mass origin at the SW Atlantic coast of Iberia, Atmos. Chem. Phys., 12, 3761–3782, https://doi.org/10.5194/acp-12-3761-2012, 2012.
Fan, X., Wei, S., Zhu, M., Song, J., and Peng, P.: Comprehensive characterization of humic-like substances in smoke PM2.5 emitted from the combustion of biomass materials and fossil fuels, Atmos. Chem. Phys., 16, 13321–13340, https://doi.org/10.5194/acp-16-13321-2016, 2016.
Fan, X., Li, M., Cao, T., Cheng, C., Li, F., Xie, Y., Wei, S., Song, J., and Peng, P. A.: Optical properties and oxidative potential of water-and alkaline-soluble brown carbon in smoke particles emitted from laboratory simulated biomass burning, Atmos. Environ., 194, 48–57, https://doi.org/10.1016/j.atmosenv.2018.09.025, 2018.
Fan, X., Cheng, A., Chen, D., Cao, T., Ji, W., Song, J., and Peng, P.: Investigating the molecular weight distribution of atmospheric water-soluble brown carbon using high-performance size exclusion chromatography coupled with diode array and fluorescence detectors, Chemosphere, 338, 139517, https://doi.org/10.1016/j.chemosphere.2023.139517, 2023.
Fang, W., Andersson, A., Lee, M., Zheng, M., Du, K., Kim, S.-W., Holmstrand, H., and Gustafsson, Ö.: Combined influences of sources and atmospheric bleaching on light absorption of water-soluble brown carbon aerosols, Npj Clim. Atmos. Sci., 6, 104, https://doi.org/10.1038/s41612-023-00438-8, 2023.
Faust, B. C.: Photochemistry of clouds, fogs, and aerosols, Environ. Sci. Technol., 28, 217–222, https://doi.org/10.1021/es00054a001, 1994.
He, Z., Wang, X., Ling, Z., Zhao, J., Guo, H., Shao, M., and Wang, Z.: Contributions of different anthropogenic volatile organic compound sources to ozone formation at a receptor site in the Pearl River Delta region and its policy implications, Atmos. Chem. Phys., 19, 8801–8816, https://doi.org/10.5194/acp-19-8801-2019, 2019.
Hecobian, A., Zhang, X., Zheng, M., Frank, N., Edgerton, E. S., and Weber, R. J.: Water-Soluble Organic Aerosol material and the light-absorption characteristics of aqueous extracts measured over the Southeastern United States, Atmos. Chem. Phys., 10, 5965–5977, https://doi.org/10.5194/acp-10-5965-2010, 2010.
Huang, R. J., Yang, L., Cao, J., Chen, Y., Chen, Q., Li, Y., Duan, J., Zhu, C., Dai, W., Wang, K., Lin, C., Ni, H., Corbin, J. C., Wu, Y., Zhang, R., Tie, X., Hoffmann, T., O'Dowd, C., and Dusek, U.: Brown carbon aerosol in urban Xi'an, northwest China: The composition and light absorption properties, Environ. Sci. Technol., 52, 6825–6833, https://doi.org/10.1021/acs.est.8b02386, 2018.
Huang, R.-J., Yang, L., Shen, J., Yuan, W., Gong, Y., Ni, H., Duan, J., Yan, J., Huang, H., You, Q., and Li, Y. J.: Chromophoric fingerprinting of brown carbon from residential biomass burning, Environ. Sci. Tech. Let., 9, 102–111, https://doi.org/10.1021/acs.estlett.1c00837, 2021.
Huang, S., Luo, Y., Wang, X., Zhang, T., Lei, Y., Zeng, Y., Sun, J., Che, H., Xu, H., Cao, J., and Shen, Z.: Optical properties, chemical functional group, and oxidative activity of different polarity levels of water-soluble organic matter in PM2.5 from biomass and coal combustion in rural areas in Northwest China, Atmos. Environ., 283, 119179, https://doi.org/10.1016/j.atmosenv.2022.119179, 2022.
Jiang, F., Song, J., Bauer, J., Gao, L., Vallon, M., Gebhardt, R., Leisner, T., Norra, S., and Saathoff, H.: Chromophores and chemical composition of brown carbon characterized at an urban kerbside by excitation–emission spectroscopy and mass spectrometry, Atmos. Chem. Phys., 22, 14971–14986, https://doi.org/10.5194/acp-22-14971-2022, 2022a.
Jiang, H. X., Tang, J., Li, J., Zhao, S. Z., Mo, Y. Z., Tian, C. G., Zhang, X. Y., Jiang, B., Liao, Y. H., Chen, Y. J., and Zhang, G.: Molecular signatures and sources of fluorescent components in atmospheric organic matter in south China, Environ. Sci. Tech. Let., 9, 913–920, https://doi.org/10.1021/acs.estlett.2c00629, 2022b.
Jiang, Y., Xue, L., Gu, R., Jia, M., Zhang, Y., Wen, L., Zheng, P., Chen, T., Li, H., Shan, Y., Zhao, Y., Guo, Z., Bi, Y., Liu, H., Ding, A., Zhang, Q., and Wang, W.: Sources of nitrous acid (HONO) in the upper boundary layer and lower free troposphere of the North China Plain: insights from the Mount Tai Observatory, Atmos. Chem. Phys., 20, 12115–12131, https://doi.org/10.5194/acp-20-12115-2020, 2020.
Kirillova, E. N., Andersson, A., Tiwari, S., Srivastava, A. K., Bisht, D. S., and Gustafsson, O.: Water-soluble organic carbon aerosols during a full New Delhi winter: Isotope-based source apportionment and optical properties, J. Geophys. Res.-Atmos., 119, 3476–3485, https://doi.org/10.1002/2013jd020041, 2014.
Kirillova, E. N., Marinoni, A., Bonasoni, P., Vuillermoz, E., Facchini, M. C., Fuzzi, S., and Decesari, S.: Light absorption properties of brown carbon in the high Himalayas, J. Geophys. Res.-Atmos., 121, 9621–9639, https://doi.org/10.1002/2016jd025030, 2016.
Laskin, A., Laskin, J., and Nizkorodov, S. A.: Chemistry of atmospheric brown carbon, Chem. Rev., 115, 4335–4382, https://doi.org/10.1021/cr5006167, 2015.
Lee, H. J., Laskin, A., Laskin, J., and Nizkorodov, S. A.: Excitation-emission spectra and fluorescence quantum yields for fresh and aged biogenic secondary organic aerosols, Environ. Sci. Technol., 47, 5763–5770, https://doi.org/10.1021/es400644c, 2013.
Lei, Y., Shen, Z., Zhang, T., Lu, D., Zeng, Y., Zhang, Q., Xu, H., Bei, N., Wang, X., and Cao, J.: High time resolution observation of PM2.5 Brown carbon over Xi'an in northwestern China: Seasonal variation and source apportionment, Chemosphere, 237, 124530, https://doi.org/10.1016/j.chemosphere.2019.124530, 2019.
Li, C., He, Q., Schade, J., Passig, J., Zimmermann, R., Meidan, D., Laskin, A., and Rudich, Y.: Dynamic changes in optical and chemical properties of tar ball aerosols by atmospheric photochemical aging, Atmos. Chem. Phys., 19, 139–163, https://doi.org/10.5194/acp-19-139-2019, 2019.
Li, D., Wu, C., Zhang, S., Lei, Y., Lv, S., Du, W., Liu, S., Zhang, F., Liu, X., Liu, L., Meng, J., Wang, Y., Gao, J., and Wang, G.: Significant coal combustion contribution to water-soluble brown carbon during winter in Xingtai, China: Optical properties and sources, J. Environ. Sci., 124, 892–900, https://doi.org/10.1016/j.jes.2022.02.026, 2023a.
Li, J., Zhang, Q., Wang, G., Li, J., Wu, C., Liu, L., Wang, J., Jiang, W., Li, L., Ho, K. F., and Cao, J.: Optical properties and molecular compositions of water-soluble and water-insoluble brown carbon (BrC) aerosols in northwest China, Atmos. Chem. Phys., 20, 4889–4904, https://doi.org/10.5194/acp-20-4889-2020, 2020a.
Li, P., Yue, S., Yang, X., Liu, D., Zhang, Q., Hu, W., Hou, S., Zhao, W., Ren, H., Li, G., Gao, Y., Deng, J., Xie, Q., Sun, Y., Wang, Z., and Fu, P.: Fluorescence properties and chemical composition of fine particles in the background atmosphere of North China, Adv. Atmos. Sci., 40, 1159–1174, https://doi.org/10.1007/s00376-022-2208-x, 2023b.
Li, R., Yan, C., Meng, Q., Yue, Y., Jiang, W., Yang, L., Zhu, Y., Xue, L., Gao, S., Liu, W., Chen, T., and Meng, J.: Key toxic components and sources affecting oxidative potential of atmospheric particulate matter using interpretable machine learning: Insights from fog episodes, J. Hazard. Mater., 465, 133175, https://doi.org/10.1016/j.jhazmat.2023.133175, 2024.
Li, X., Wang, Y. J., Hu, M., Tan, T. Y., Li, M. R., Wu, Z. J., Chen, S. Y., and Tang, X. Y.: Characterizing chemical composition and light absorption of nitroaromatic compounds in the winter of Beijing, Atmos. Environ., 237, 117712, https://doi.org/10.1016/j.atmosenv.2020.117712, 2020b.
Li, X., Yu, F., Song, Y., Zhang, C., Yan, F., Hu, Z., Lei, Y., Tripathee, L., Zhang, R., Guo, J., Wang, Y., Chen, Q., Liu, L., Cao, J., and Wang, Q.: Water-soluble brown carbon in PM2.5 at two typical sites in Guanzhong Basin: Optical properties, sources, and implications, Atmos. Res., 281, 106499, https://doi.org/10.1016/j.atmosres.2022.106499, 2023c.
Lin, P., Fleming, L. T., Nizkorodov, S. A., Laskin, J., and Laskin, A.: Comprehensive molecular characterization of atmospheric brown carbon by high resolution mass spectrometry with electrospray and atmospheric pressure photoionization, Anal. Chem., 90, 12493–12502, https://doi.org/10.1021/acs.analchem.8b02177, 2018.
Liu, J., Mo, Y., Ding, P., Li, J., Shen, C., and Zhang, G.: Dual carbon isotopes (14C and 13C) and optical properties of WSOC and HULIS-C during winter in Guangzhou, China, Sci. Total Environ., 633, 1571–1578, https://doi.org/10.1016/j.scitotenv.2018.03.293, 2018.
Liu, X., Zhang, Y.-L., Peng, Y., Xu, L., Zhu, C., Cao, F., Zhai, X., Haque, M. M., Yang, C., Chang, Y., Huang, T., Xu, Z., Bao, M., Zhang, W., Fan, M., and Lee, X.: Chemical and optical properties of carbonaceous aerosols in Nanjing, eastern China: regionally transported biomass burning contribution, Atmos. Chem. Phys., 19, 11213–11233, https://doi.org/10.5194/acp-19-11213-2019, 2019.
Liu, X., Wang, H., Wang, F., Lv, S., Wu, C., Zhao, Y., Zhang, S., Liu, S., Xu, X., Lei, Y., and Wang, G.: Secondary formation of atmospheric brown carbon in China haze: Implication for an enhancing role of ammonia, Environ. Sci. Technol., 57, 11163–11172, https://doi.org/10.1021/acs.est.3c03948, 2023.
Mo, Y. Z., Zhong, G. C., Li, J., Liu, X., Jiang, H. X., Tang, J., Jiang, B., Liao, Y. H., Cheng, Z. N., and Zhang, G.: The sources, molecular compositions, and light absorption properties of water-soluble organic carbon in marine aerosols from South China Sea to the Eastern Indian Ocean, J. Geophys. Res.-Atmos., 127, e2021JD036168, https://doi.org/10.1029/2021JD036168, 2022.
Niu, X., Pu, W., Fu, P., Chen, Y., Xing, Y., Wu, D., Chen, Z., Shi, T., Zhou, Y., Wen, H., and Wang, X.: Fluorescence characteristics, absorption properties, and radiative effects of water-soluble organic carbon in seasonal snow across northeastern China, Atmos. Chem. Phys., 22, 14075–14094, https://doi.org/10.5194/acp-22-14075-2022, 2022.
Peuravuori, J. and Pihlaja, K.: Molecular size distribution and spectroscopic properties of aquatic humic substances, Anal. Chim. Acta, 337, 133–149, https://doi.org/10.1016/s0003-2670(96)00412-6, 1997.
Price, C. L., Preston, T. C., and Davies, J. F.: Hygroscopic growth, phase morphology, and optical properties of model aqueous brown carbon aerosol, Environ. Sci. Technol., 56, 3941–3951, https://doi.org/10.1021/acs.est.1c07356, 2022.
Ram, K., Sarin, M. M., and Tripathi, S. N.: Temporal trends in atmospheric PM2.5, PM10, elemental carbon, organic carbon, water-soluble organic carbon, and optical properties: Impact of biomass burning emissions in the Indo-Gangetic Plain, Environ. Sci. Technol., 46, 686–695, https://doi.org/10.1021/es202857w, 2012.
Saleh, R.: From measurements to models: Toward accurate representation of brown carbon in climate calculations, Curr. Pollut. Rep., 6, 90–104, https://doi.org/10.1007/s40726-020-00139-3, 2020.
Soleimanian, E., Mousavi, A., Taghvaee, S., Shafer, M. M., and Sioutas, C.: Impact of secondary and primary particulate matter (PM) sources on the enhanced light absorption by brown carbon (BrC) particles in central Los Angeles, Sci. Total Environ., 705, 135902, https://doi.org/10.1016/j.scitotenv.2019.135902, 2020.
Srinivas, B. and Sarin, M. M.: Light absorbing organic aerosols (brown carbon) over the tropical Indian Ocean: impact of biomass burning emissions, Environ. Res. Lett., 8, 044042, https://doi.org/10.1088/1748-9326/8/4/044042, 2013.
Srinivas, B. and Sarin, M. M.: Brown carbon in atmospheric outflow from the Indo-Gangetic Plain: Mass absorption efficiency and temporal variability, Atmos. Environ., 89, 835–843, https://doi.org/10.1016/j.atmosenv.2014.03.030, 2014.
Srinivas, B., Rastogi, N., Sarin, M. M., Singh, A., and Singh, D.: Mass absorption efficiency of light absorbing organic aerosols from source region of paddy-residue burning emissions in the Indo-Gangetic Plain, Atmos. Environ., 125, 360–370, https://doi.org/10.1016/j.atmosenv.2015.07.017, 2016.
Tang, J., Li, J., Su, T., Han, Y., Mo, Y., Jiang, H., Cui, M., Jiang, B., Chen, Y., Tang, J., Song, J., Peng, P., and Zhang, G.: Molecular compositions and optical properties of dissolved brown carbon in biomass burning, coal combustion, and vehicle emission aerosols illuminated by excitation–emission matrix spectroscopy and Fourier transform ion cyclotron resonance mass spectrometry analysis, Atmos. Chem. Phys., 20, 2513–2532, https://doi.org/10.5194/acp-20-2513-2020, 2020.
Tang, J., Wang, J., Zhong, G., Jiang, H., Mo, Y., Zhang, B., Geng, X., Chen, Y., Tang, J., Tian, C., Bualert, S., Li, J., and Zhang, G.: Measurement report: Long-emission-wavelength chromophores dominate the light absorption of brown carbon in aerosols over Bangkok: impact from biomass burning, Atmos. Chem. Phys., 21, 11337–11352, https://doi.org/10.5194/acp-21-11337-2021, 2021.
Teich, M., van Pinxteren, D., Wang, M., Kecorius, S., Wang, Z., Müller, T., Močnik, G., and Herrmann, H.: Contributions of nitrated aromatic compounds to the light absorption of water-soluble and particulate brown carbon in different atmospheric environments in Germany and China, Atmos. Chem. Phys., 17, 1653–1672, https://doi.org/10.5194/acp-17-1653-2017, 2017.
Ting, Y.-C., Ko, Y.-R., Huang, C.-H., Cheng, Y.-H., and Huang, C.-H.: Optical properties and potential sources of water-soluble and methanol-soluble organic aerosols in Taipei, Taiwan, Atmos. Environ., 290, 119364, https://doi.org/10.1016/j.atmosenv.2022.119364, 2022.
Wang, D., Shen, Z., Zhang, Q., Lei, Y., Zhang, T., Huang, S., Sun, J., Xu, H., and Cao, J.: Winter brown carbon over six of China's megacities: light absorption, molecular characterization, and improved source apportionment revealed by multilayer perceptron neural network, Atmos. Chem. Phys., 22, 14893–14904, https://doi.org/10.5194/acp-22-14893-2022, 2022a.
Wang, D., Shen, Z., Yang, X., Huang, S., Luo, Y., Bai, G., and Cao, J.: Insight into the Role of and in the Formation of Nitrogen-Containing Brown Carbon in Chinese Megacities, Environ. Sci. Technol., 58, 4281–4290, https://doi.org/10.1021/acs.est.3c10374, 2024.
Wang, L., Zhou, X., Ma, Y., Cao, Z., Wu, R., and Wang, W.: Carbonaceous aerosols over China-review of observations, emissions, and climate forcing, Environ. Sci. Pollut. R.., 23, 1671–1680, https://doi.org/10.1007/s11356-015-5398-2, 2016.
Wang, Q., Zhou, Y., Ma, N., Zhu, Y., Zhao, X., Zhu, S., Tao, J., Hong, J., Wu, W., Cheng, Y., and Su, H.: Review of brown carbon aerosols in China: Pollution level, optical properties, and emissions, J. Geophys. Res.-Atmos., 127, e2021JD035473, https://doi.org/10.1029/2021jd035473, 2022b.
Wang, X., Heald, C. L., Liu, J., Weber, R. J., Campuzano-Jost, P., Jimenez, J. L., Schwarz, J. P., and Perring, A. E.: Exploring the observational constraints on the simulation of brown carbon, Atmos. Chem. Phys., 18, 635–653, https://doi.org/10.5194/acp-18-635-2018, 2018.
Wang, X., Qin, Y., Qin, J., Long, X., Qi, T., Chen, R., Xiao, K., and Tan, J.: Spectroscopic insight into the pH-dependent interactions between atmospheric heavy metals (Cu and Zn) and water-soluble organic compounds in PM2.5, Sci. Total Environ., 767, 145261, https://doi.org/10.1016/j.scitotenv.2021.145261, 2021.
Wang, Y., Feng, Z., Yuan, Q., Shang, D., Fang, Y., Guo, S., Wu, Z., Zhang, C., Gao, Y., Yao, X., Gao, H., and Hu, M.: Environmental factors driving the formation of water-soluble organic aerosols: A comparative study under contrasting atmospheric conditions, Sci. Total Environ., 866, 161364, https://doi.org/10.1016/j.scitotenv.2022.161364, 2023.
Wei, Y., Chen, H., Sun, H., Zhang, F., Shang, X., Yao, L., Zheng, H., Li, Q., and Chen, J.: Nocturnal PM2.5 explosive growth dominates severe haze in the rural North China Plain, Atmos. Res., 242, 105020, https://doi.org/10.1016/j.atmosres.2020.105020, 2020.
Wu, G., Wan, X., Ram, K., Li, P., Liu, B., Yin, Y., Fu, P., Loewen, M., Gao, S., Kang, S., Kawamura, K., Wang, Y., and Cong, Z.: Light absorption, fluorescence properties and sources of brown carbon aerosols in the Southeast Tibetan Plateau, Environ. Pollut., 257, 113616, https://doi.org/10.1016/j.envpol.2019.113616, 2020.
Wu, G., Fu, P., Ram, K., Song, J., Chen, Q., Kawamura, K., Wan, X., Kang, S., Wang, X., Laskin, A., and Cong, Z.: Fluorescence characteristics of water-soluble organic carbon in atmospheric aerosol, Environ. Pollut., 268, 115906, https://doi.org/10.1016/j.envpol.2020.115906, 2021.
Xie, X., Chen, Y., Nie, D., Liu, Y., Liu, Y., Lei, R., Zhao, X., Li, H., and Ge, X.: Light-absorbing and fluorescent properties of atmospheric brown carbon: A case study in Nanjing, China, Chemosphere, 251, 126350, https://doi.org/10.1016/j.chemosphere.2020.126350, 2020.
Xu, B., Zhang, G., Gustafsson, Ö., Kawamura, K., Li, J., Andersson, A., Bikkina, S., Kunwar, B., Pokhrel, A., Zhong, G., Zhao, S., Li, J., Huang, C., Cheng, Z., Zhu, S., Peng, P., and Sheng, G.: Large contribution of fossil-derived components to aqueous secondary organic aerosols in China, Nat. Commun., 13, 5115, https://doi.org/10.1038/s41467-022-32863-3, 2022.
Xu, J., Hettiyadura, A. P. S., Liu, Y., Zhang, X., Kang, S., and Laskin, A.: Regional differences of chemical composition and optical properties of aerosols in the Tibetan Plateau, J. Geophys. Res.-Atmos., 125, e2019JD031226, https://doi.org/10.1029/2019jd031226, 2020.
Yan, C. Q., Zheng, M., Sullivan, A. P., Bosch, C., Desyaterik, Y., Andersson, A., Li, X. Y., Guo, X. S., Zhou, T., Gustafsson, O., and Collett, J. L.: Chemical characteristics and light-absorbing property of water-soluble organic carbon in Beijing: Biomass burning contributions, Atmos. Environ., 121, 4–12, https://doi.org/10.1016/j.atmosenv.2015.05.005, 2015.
Yan, C. Q., Zheng, M., Bosch, C., Andersson, A., Desyaterik, Y., Sullivan, A. P., Collett, J. L., Zhao, B., Wang, S. X., He, K. B., and Gustafsson, Ö.: Important fossil source contribution to brown carbon in Beijing during winter, Sci. Rep.-UK, 7, 43182, https://doi.org/10.1038/srep43182, 2017.
Yang, L., Huang, R.-J., Shen, J., Wang, T., Gong, Y., Yuan, W., Liu, Y., Huang, H., You, Q., Huang, D. D., and Huang, C.: New insights into the brown carbon chromophores and formation pathways for aqueous reactions of α-dicarbonyls with amines and ammonium, Environ. Sci. Technol., 57, 12351–12361, https://doi.org/10.1021/acs.est.3c04133, 2023.
Yang, X., Huang, S., Li, D., Xu, H., Zeng, Y., Yang, L., Wang, D., Zhang, N., Cao, J., and Shen, Z.: Water-soluble organic matter with various polarities in PM2.5 over Xi'an, China: Abundance, functional groups, and light absorption, Particuology, 84, 281–289, https://doi.org/10.1016/j.partic.2023.07.005, 2024.
Yang, Y., Qin, J., Qi, T., Zhou, X., Chen, R., Tan, J., Xiao, K., Ji, D., He, K., and Chen, X.: Fluorescence characteristics of particulate water-soluble organic compounds emitted from coal-fired boilers, Atmos. Environ., 223, 117297, https://doi.org/10.1016/j.atmosenv.2020.117297, 2020.
You, B., Zhang, Z., Du, A., Li, Y., Sun, J., Li, Z., Chen, C., Zhou, W., Xu, W., Lei, L., Fu, P., Hou, S., Li, P., and Sun, Y.: Seasonal characterization of chemical and optical properties of water-soluble organic aerosol in Beijing, Sci. Total Environ., 930, 172508, https://doi.org/10.1016/j.scitotenv.2024.172508, 2024.
Yu, X., Song, W., Yu, Q., Li, S., Zhu, M., Zhang, Y., Deng, W., Yang, W., Huang, Z., Bi, X., and Wang, X.: Fast screening compositions of PM2.5 by ATR-FTIR: Comparison with results from IC and OC/EC analyzers, J. Environ. Sci., 71, 76–88, https://doi.org/10.1016/j.jes.2017.11.021, 2018.
Yuan, W., Huang, R.-J., Yang, L., Guo, J., Chen, Z., Duan, J., Wang, T., Ni, H., Han, Y., Li, Y., Chen, Q., Chen, Y., Hoffmann, T., and O'Dowd, C.: Characterization of the light-absorbing properties, chromophore composition and sources of brown carbon aerosol in Xi'an, northwestern China, Atmos. Chem. Phys., 20, 5129–5144, https://doi.org/10.5194/acp-20-5129-2020, 2020.
Yue, S., Zhu, J., Chen, S., Xie, Q., Li, W., Li, L., Ren, H., Su, S., Li, P., Ma, H., Fan, Y., Cheng, B., Wu, L., Deng, J., Hu, W., Ren, L., Wei, L., Zhao, W., Tian, Y., Pan, X., Sun, Y., Wang, Z., Wu, F., Liu, C.-Q., Su, H., Penner, J. E., Pöschl, U., Andreae, M. O., Cheng, Y., and Fu, P.: Brown carbon from biomass burning imposes strong circum-Arctic warming, One Earth, 5, 293–304, https://doi.org/10.1016/j.oneear.2022.02.006, 2022.
Zellner, R., Exner, M., and Herrmann, H.: Absolute OH quantum yields in the laser photolysis of nitrate, nitrite and dissolved H2O2 at 308 and 351 nm in the temperature range 278–353 K, J. Atmos. Chem., 10, 411–425, https://doi.org/10.1007/bf00115783, 1990.
Zhan, Y., Li, J., Tsona, N. T., Chen, B., Yan, C., George, C., and Du, L.: Seasonal variation of water-soluble brown carbon in Qingdao, China: impacts from marine and terrestrial emissions, Environ. Res., 212, 113144, https://doi.org/10.1016/j.envres.2022.113144, 2022a.
Zhan, Y., Tsona, N. T., Li, J., Chen, Q., and Du, L.: Water-soluble matter in PM2.5 in a coastal city over China: Chemical components, optical properties, and source analysis, J. Environ. Sci., 114, 21–36, https://doi.org/10.1016/j.jes.2021.07.011, 2022b.
Zhang, C., Gao, S., Yan, F., Kang, S., He, C., and Li, C.: An overestimation of light absorption of brown carbon in ambient particles caused by using filters with large pore size, Sci. Total Environ., 833, 155286, https://doi.org/10.1016/j.scitotenv.2022.155286, 2022a.
Zhang, J., Qi, A., Wang, Q., Huang, Q., Yao, S., Li, J., Yu, H., and Yang, L.: Characteristics of water-soluble organic carbon (WSOC) in PM2.5 in inland and coastal cities, China, Atmos. Pollut. Res., 13, 101447, https://doi.org/10.1016/j.apr.2022.101447, 2022b.
Zhang, Q., Shen, Z., Zhang, L., Zeng, Y., Ning, Z., Zhang, T., Lei, Y., Wang, Q., Li, G., Sun, J., Westerdahl, D., Xu, H., and Cao, J.: Investigation of Primary and Secondary Particulate Brown Carbon in Two Chinese Cities of Xi'an and Hong Kong in Wintertime, Environ. Sci. Technol., 54, 3803–3813, https://doi.org/10.1021/acs.est.9b05332, 2020.
Zhang, T., Shen, Z., Zeng, Y., Cheng, C., Wang, D., Zhang, Q., Lei, Y., Zhang, Y., Sun, J., Xu, H., Ho, S. S. H., and Cao, J.: Light absorption properties and molecular profiles of HULIS in PM2.5 emitted from biomass burning in traditional “Heated Kang” in Northwest China, Sci. Total Environ., 776, 146014, https://doi.org/10.1016/j.scitotenv.2021.146014, 2021.
Zhang, Y.-L., Huang, R.-J., El Haddad, I., Ho, K.-F., Cao, J.-J., Han, Y., Zotter, P., Bozzetti, C., Daellenbach, K. R., Canonaco, F., Slowik, J. G., Salazar, G., Schwikowski, M., Schnelle-Kreis, J., Abbaszade, G., Zimmermann, R., Baltensperger, U., Prévôt, A. S. H., and Szidat, S.: Fossil vs. non-fossil sources of fine carbonaceous aerosols in four Chinese cities during the extreme winter haze episode of 2013, Atmos. Chem. Phys., 15, 1299–1312, https://doi.org/10.5194/acp-15-1299-2015, 2015.
Zhao, R., Zhang, Q., Xu, X., Wang, W., Zhao, W., Zhang, W., and Zhang, Y.: Light absorption properties and molecular compositions of water-soluble and methanol-soluble organic carbon emitted from wood pyrolysis and combustion, Sci. Total Environ., 809, 151136, https://doi.org/10.1016/j.scitotenv.2021.151136, 2022.
Zhong, M. and Jang, M.: Light absorption coefficient measurement of SOA using a UV-Visible spectrometer connected with an integrating sphere, Atmos. Environ., 45, 4263–4271, https://doi.org/10.1016/j.atmosenv.2011.04.082, 2011.
Zhong, M. and Jang, M.: Dynamic light absorption of biomass-burning organic carbon photochemically aged under natural sunlight, Atmos. Chem. Phys., 14, 1517–1525, https://doi.org/10.5194/acp-14-1517-2014, 2014.
Zhong, M., Xu, J., Wang, H., Gao, L., Zhu, H., Zhai, L., Zhang, X., and Zhao, W.: Characterizing water-soluble brown carbon in fine particles in four typical cities in northwestern China during wintertime: integrating optical properties with chemical processes, Atmos. Chem. Phys., 23, 12609–12630, https://doi.org/10.5194/acp-23-12609-2023, 2023.
Zhu, C., Cao, J., Huang, R., Shen, Z., Wang, Q., and Zhang, N.: Light absorption properties of brown carbon over the southeastern Tibetan Plateau, Sci. Total Environ., 625, 246–251, https://doi.org/10.1016/j.scitotenv.2017.12.183, 2018.