the Creative Commons Attribution 4.0 License.
the Creative Commons Attribution 4.0 License.
 | 27 Mar 2025
Did the 2022 Hunga eruption impact the noctilucent cloud season in 2023/24 and 2024?
Sandra Wallis
Matthew DeLand
Christian von Savigny
The 2022 Hunga Tonga – Hunga Ha'apai eruption emitted approximately 150 Tg H2O into the middle atmosphere, which is still detectable 2 years after the event. Microwave Limb Sounder (MLS) observations show that the Hunga H2O reached the upper polar mesosphere in the Southern Hemisphere (SH) in the beginning of 2024, increasing the H2O mixing ratio in January by about 1 ppmv between 70 and 80° S up to an altitude of 83 km. No clear signal was detected for the noctilucent cloud occurrence frequency inferred from Ozone Mapping and Profiling Suite – Limb Profiler (OMPS-LP) measurements. It cannot, however, be ruled out that a slight increase from mid-January to February is potentially caused by the additional water vapour from the Hunga event. Several months later, the water vapour anomaly reached the polar summer mesopause region in the Northern Hemisphere (NH) during the noctilucent cloud season in 2024. However, a subsequent anomalous warming during the second half of the season might have hindered the ice particle formation, leading to a decrease in occurrence frequency of the mesospheric clouds compared to previous years. To summarize, based on the analysis performed in the study, we show that the volcanic water vapour needs 2 years to reach the summer polar mesopause region. This resembles the Krakatoa case that is argued to have caused the first sightings of noctilucent clouds 2 years after its eruption in 1883.
- Article
(4916 KB) - Full-text XML
-
Supplement
(21857 KB) - BibTeX
- EndNote


Back in August 1883, the Krakatoa volcano was torn apart by a phreatomagmatic eruption with a volcanic explosivity index (VEI) of 6 (Oemaiya and Santoso, 2019) that released a potentially massive amount of H2O into the middle atmosphere. Estimates of the injected H2O mass, however, remain uncertain. A model study by Joshi and Jones (2009) assumed an injected mass of 500 Tg H2O, whereas Thomas et al. (1989) assumed a mass between 100 and 200 Tg H2O. The ash plume was clearly visible to nearby eyewitnesses, who reported column heights up to 40 km (Self, 1992). These reports make it plausible that the emitted and entrained H2O from the Krakatoa eruption could have reached the middle to upper stratosphere as well. This event caused optical phenomena, e.g. green twilight skies (von Savigny et al., 2024), blue suns and moons (Wullenweber et al., 2021), Bishop's rings (Kiessling, 1885) and afterglows (Symons, 1888) that were seen and reported in Europe and North America over the following weeks and months.
In June 1885, 2 years later, the first sightings of noctilucent clouds were reported (Backhouse, 1885; Leslie, 1885; Tseraskii, 1887; Schröder, 1999). These are mesospheric clouds made of ice particles with radii generally smaller than about 100 nm that are located in the mesopause summer region at approximately 83 km in altitude. They are visible as silvery translucent clouds against the dark twilight sky and are best seen from the ground at middle to high latitudes when the sun is 5–15° below the horizon. These clouds form under specific conditions, i.e. mesospheric temperatures lower than about 150 K as well as the presence of H2O and nucleation nuclei (Rapp and Thomas, 2006; von Savigny et al., 2020).
Some studies suggest that the additional water vapour and possibly nucleation nuclei from the Krakatoa eruption resulted in a boost in cloud brightness, finally making them visible to the naked eye 2 years after the eruption (Thomas et al., 1989). They argue that no convincing reports of twilight phenomena resembling noctilucent clouds exist before 1885 and that skilled observers were present (Schröder, 1999). Causality between the Krakatoa eruption and the first appearance of noctilucent clouds 2 years later is, however, still being debated in the community.
Recently, a phreatomagmatic eruption of the Hunga Tonga – Hunga Ha'apai volcano (VEI of approximately 6; Poli and Shapiro, 2022) on 15 January 2022 opened up this discussion again. Approximately 150 Tg H2O were emitted into the middle atmosphere (Millan et al., 2022), reaching altitudes up to 55 or even 57 km (Carr et al., 2022). After an initial phase of subsidence in the first 2 weeks, the tropical Hunga H2O plume remained at pressure levels between 20 and 40 hPa until it started to rise in October 2022 and reached the tropical stratopause in March 2023 (Niemeier et al., 2023). As the additional water vapour entered the mesosphere, it followed the large-scale vertical and meridional transport in the middle atmosphere. This study investigates whether the additional water vapour from the Hunga eruptions affected the mesospheric noctilucent clouds (NLCs) during the Southern Hemisphere (SH) NLC season in 2023/24 and during the Northern Hemisphere (NH) season in 2024. It therefore tries to answer the following question: could the Hunga eruption trigger a similar impact on the noctilucent clouds 2 years after the eruption occurred, analogous to the observations after the Krakatoa event?
We use Microwave Limb Sounder (MLS) H2O mixing ratio observations as well as data from the Ozone Mapping Profiling Suite – Limb Profiler (OMPS-LP) to investigate the SH NLC season in 2023/24 and the NH season in 2024. This paper is structured as follows. Section 2 introduces the MLS and OMPS-LP data sets and describes their analysis. Section 3 presents the results of this study, which are discussed in Sect. 4. This paper concludes with Sect. 5.
2.1 Microwave Limb Sounder (MLS)
We use level 2 version 5 H2O mixing ratios, temperatures, ice water content and geopotential height from the NASA Microwave Limb Sounder (MLS) to observe the transport of water vapour through the middle atmosphere and the ambient conditions in the NLC region (Waters et al., 2006). MLS is a limb-sounding instrument that measures in the microwave spectral region. It was launched on board the Aura satellite that is placed in a near-polar sun-synchronous orbit with an inclination of 98°. This allows measurements from 82° N to 82° S, with a vertical resolution of 1.3–3.6 km between 316 and 0.22 hPa and 6–11 km above 0.22 hPa for the H2O product. The accuracy is 5 %–35 %, and the precision is 5 %–16 % between 316 and 1 hPa (Livesey et al., 2022). Only mixing ratios up to 0.001 hPa are recommended for scientific use.
The data were filtered according to the data documentation (Livesey et al., 2022). Only H2O profiles that are associated with a positive precision, a status field with an even number, a quality flag greater than 0.7 and a convergence less than 2.0 are used. Profiles with mixing ratios less than 0.101 ppmv at altitudes ≤1 hPa were dismissed. The temperature data were analysed similarly, but only profiles with a quality flag greater than 0.2 at pressures ≤83 hPa and with a quality flag greater than 0.9 at pressures ≥100 hPa were used. The convergence needed to be less than 1.03, whereas profiles between 261 and 100 hPa with a 215 hPa ice water content greater than 0.005 g m−3 were omitted. Several profiles between 261 and 178 hPa were rejected due to the criteria described in Livesey et al. (2022).
Geopotential height, also provided by MLS, is utilized to interpolate the H2O mixing ratios from a pressure grid to geometric altitudes (z) using the following equation (Guinn and Mosher, 2015):
Here, H is the MLS geopotential height and r the mean Earth radius (6 371 000 m). Afterwards, daily zonal mean profiles for 10 and 5° latitude bins are determined. Water vapour anomalies are calculated by subtracting the multiannual mean for each day determined from the reference period from 2017 to 2021. Due to the strong volcanic signal, only H2O mixing ratio anomalies larger than 3 times the standard deviation of the reference period are considered significant.
2.2 Ozone Mapping and Profiling Suite – Limb Profiler (OMPS-LP)
The Ozone Mapping and Profiling Suite – Limb Profiler (OMPS-LP) instrument measures limb-scattered sunlight and was launched on board the sun-synchronous Suomi National Polar-orbiting Partnership (SNPP) satellite. Its hyperspectral measurements between 290 and 1000 nm cover an altitude range from the surface to 80–100 km, with a vertical resolution of 1.6 km (Jaross et al., 2014). NLCs can be detected in the OMPS-LP limb radiance profile because they lead to a radiance enhancement in the upper mesosphere. Individual radiance profiles at 353 nm are compared to a zonal mean radiance profile from the middle latitude (where no NLCs are expected), and the maximum value of this radiance ratio is identified. The detection method is described in DeLand and Gorkavyi (2021).
All profiles were zonally and daily binned with a latitude bin size of 5°. Only altitudes between 80 and less than 90 km are considered, and a threshold of 2.0 is applied to the maximum radiance ratio. The noctilucent cloud occurrence frequency is calculated by determining the ratio of cloud events after the filtering process and the number of all measurements times 100 %. Finally, the occurrence frequency is smoothed by a 5 d running mean.
3.1 The SH NLC season in 2023/24
The additional water vapour emitted from the Hunga eruption in January 2022 can be tracked as an anomaly using the MLS instrument (e.g. Niemeier et al., 2023). Over the period of 2 years it spread zonally, vertically and meridionally (Nedoluha et al., 2024). Figure 1a shows the latitudinal and vertical distribution of the zonally averaged and monthly mean water vapour anomaly in January 2024, corresponding to a reference period of 2017–2021, i.e. 5 years before the Hunga eruption. Areas are shaded in grey where the H2O mixing ratio anomalies do not exceed 3 times the standard deviation within the reference period and are thus considered insignificant. The water vapour anomaly in the midlatitude NH is located up to 60 km in January. In the tropics, regions up to 80 km are significant, whereas in the summer polar region (specifically between 70 and 80° S), the water vapour anomaly is significant from the lower stratosphere up to the upper mesosphere, reaching 88 km. The water vapour anomaly often exceeds about 1.5 ppmv in the SH between 80 and 30° S and between 40 and 65 km. Anomalies up to 1 ppmv reach 83 km between 70 and 80° S. The water vapour anomaly mixing ratios increase in February for the SH (Fig. 1b), where mixing ratio anomalies of 1.5 ppmv are found up to 75 km in altitude for the highest SH latitudes. Similar plots for all months from 2022 to 2024 are shown in Figs. S1–S3 in the Supplement.
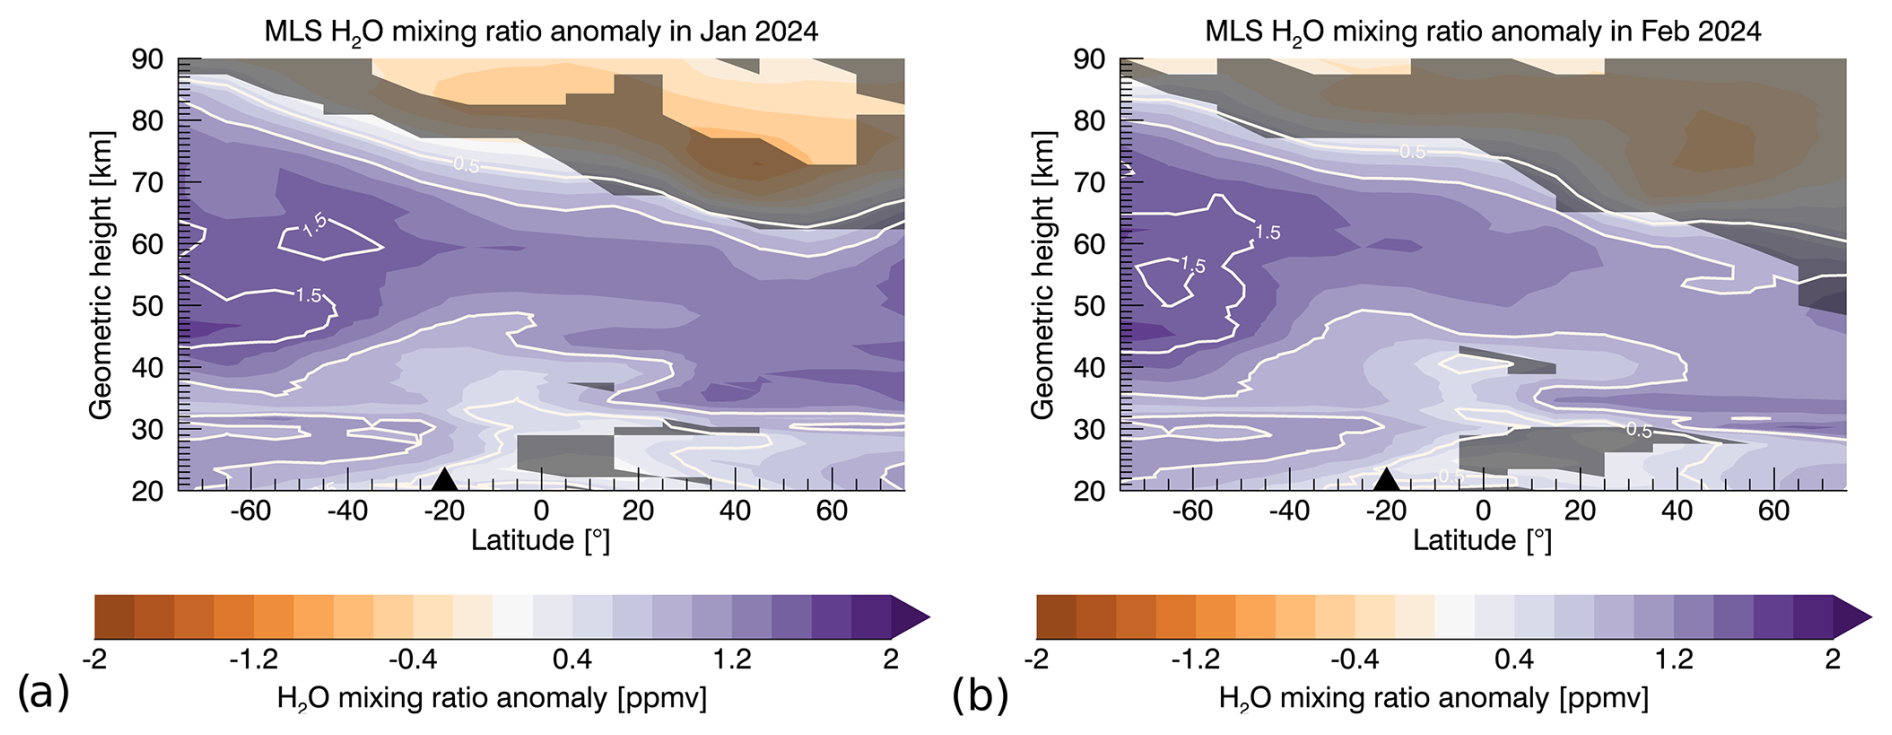
Figure 1Monthly mean water vapour mixing ratio anomaly from MLS data for (a) January and (b) February 2024. The reference period is 2017–2021, and anomalies that are less than 3 standard deviations from the reference period are considered not significant and marked with a dark-grey colour. The triangle denotes the latitude position of the Hunga volcano.
Noctilucent clouds can be described using different variables derived from observations, one of which is the occurrence frequency. This measure provides the percentage of cloud detection compared to the number of total observations. We use the maximum radiance ratio between the measured and background signal of each OMPS-LP profile to calculate the NLC occurrence frequency for each SH season since the SNPP satellite launch. Figure 2a compares the occurrence frequency for 2023/24 (red line) to the previous seasons, as well as the average of the seasons from 2016/17 to 2020/21 ± 1 and 3 standard deviation intervals. The start of the NLC season varies between different years and results in large variability. This is due to a variable date for the change from winter to summer circulation in the stratosphere (e.g. due to a late breakdown of the polar winter vortex) that impacts the gravity wave filtering in the summer hemisphere, the meridional circulation, and the temperature in the upper mesosphere and hence the conditions for noctilucent clouds (Karlsson et al., 2011). The occurrence frequency from mid-January to February 2024 is higher than 1 standard deviation of the average previous seasons (compare with the pale-blue shading) and even exceeds the 3σ interval for a short time at the end of January. Occurrence frequencies for other latitudes (85–65° S) are depicted in the Supplement (Fig. S4). We hypothesize that the additional water vapour from Hunga might have had an impact on the NLC properties. Therefore, Fig. 2b shows the H2O mixing ratio anomaly between 80 and 90 km at 70–80° S. Significant anomalies appear from mid-October to November (before the NLC season started) and from mid-December to the end of March, when they reach altitudes up to 90 km for a short time at the beginning of January and up to 87 km at its end.
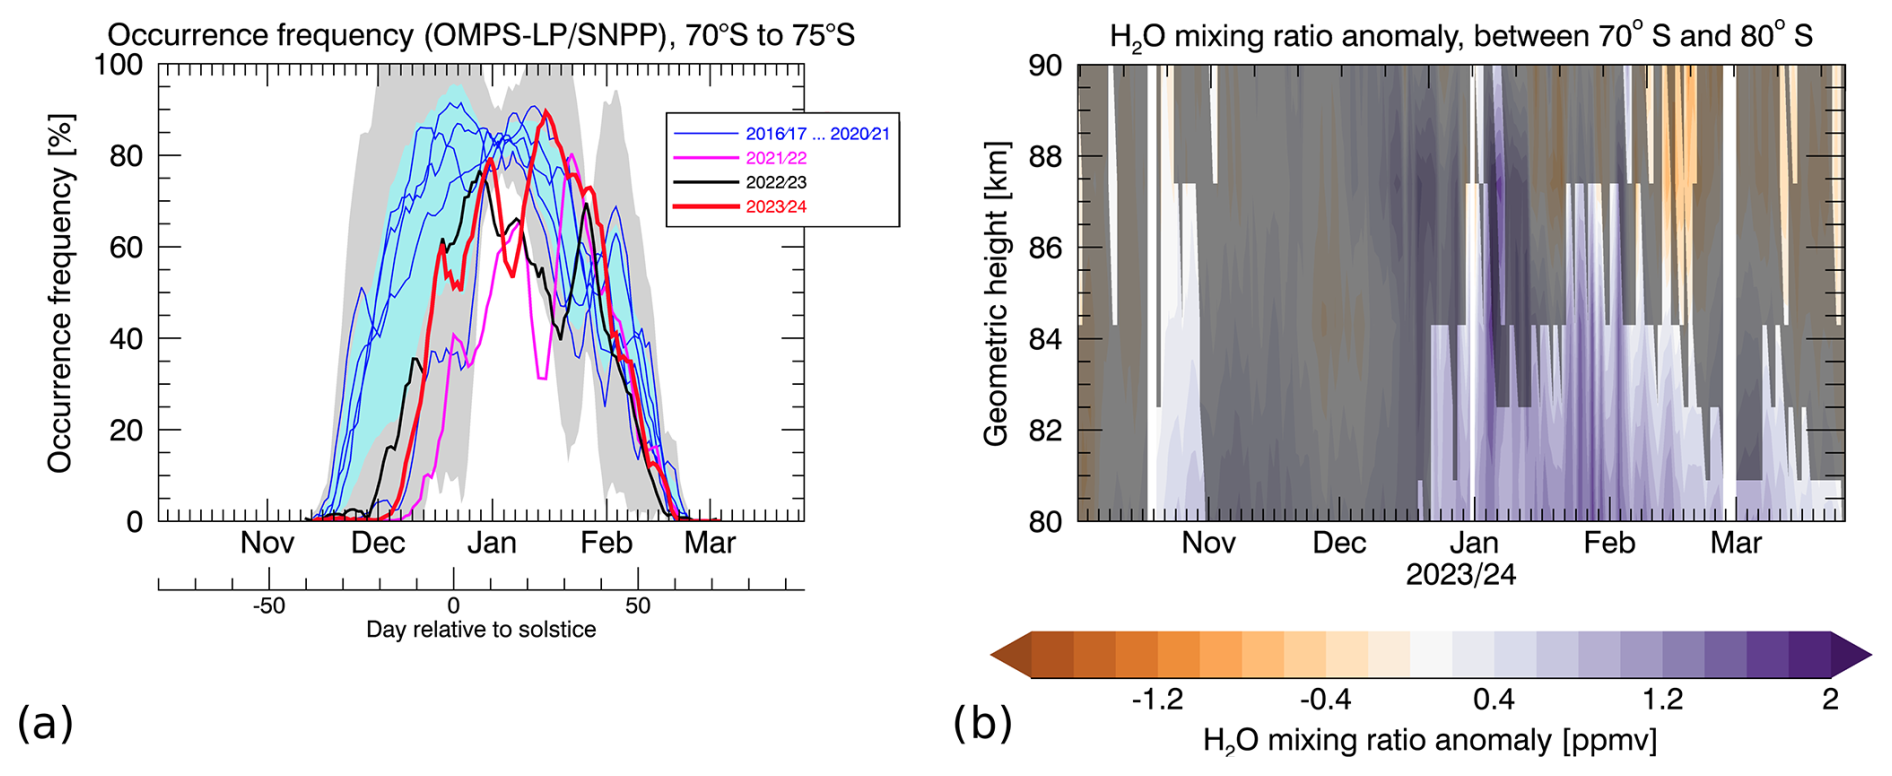
Figure 2(a) NLC occurrence frequency from OMPS-LP between 70 and 75° S. The thick lines indicates the occurrence frequency for the SH seasons in 2021/22 (magenta), 2022/23 (black) and 2023/24 (red). All seasons before are displayed as thin blue lines. The blue (grey) shaded region contains the averaged occurrence frequency for the years 2016/17 to 2020/21 ± 1 (3) standard deviation from this period. All occurrence frequencies are smoothed over 5 d, and the day of the solstice is 21 December. (b) MLS water vapour anomaly between 70 and 80° S for altitudes between 80 and 90 km during the SH NLC season. The reference period is 2017–2021, and the grey areas are considered not significant (less than 3σ).
The properties of noctilucent clouds depend on both the mesospheric temperature and the amount of water vapour. Figure 3a compares the temperature at the NLC altitude for the season in 2023/24 with previous seasons, as well as the intervals of the averaged seasons from 2016/17 to 2020/21 ± 1 and 3 standard deviations. The NLC altitude was determined from OMPS-LP measurements. It is clear that the temperature in 2023/24 is similar to the previous temperature time series. Figure 3b shows a similar comparison for the H2O mixing ratios at the NLC altitude. The H2O mixing ratio after January 2024 is larger by up to 1 ppmv compared to the previous years. Comparisons for more latitude bins between 80 and 65° are shown in the Supplement (Fig. S5).
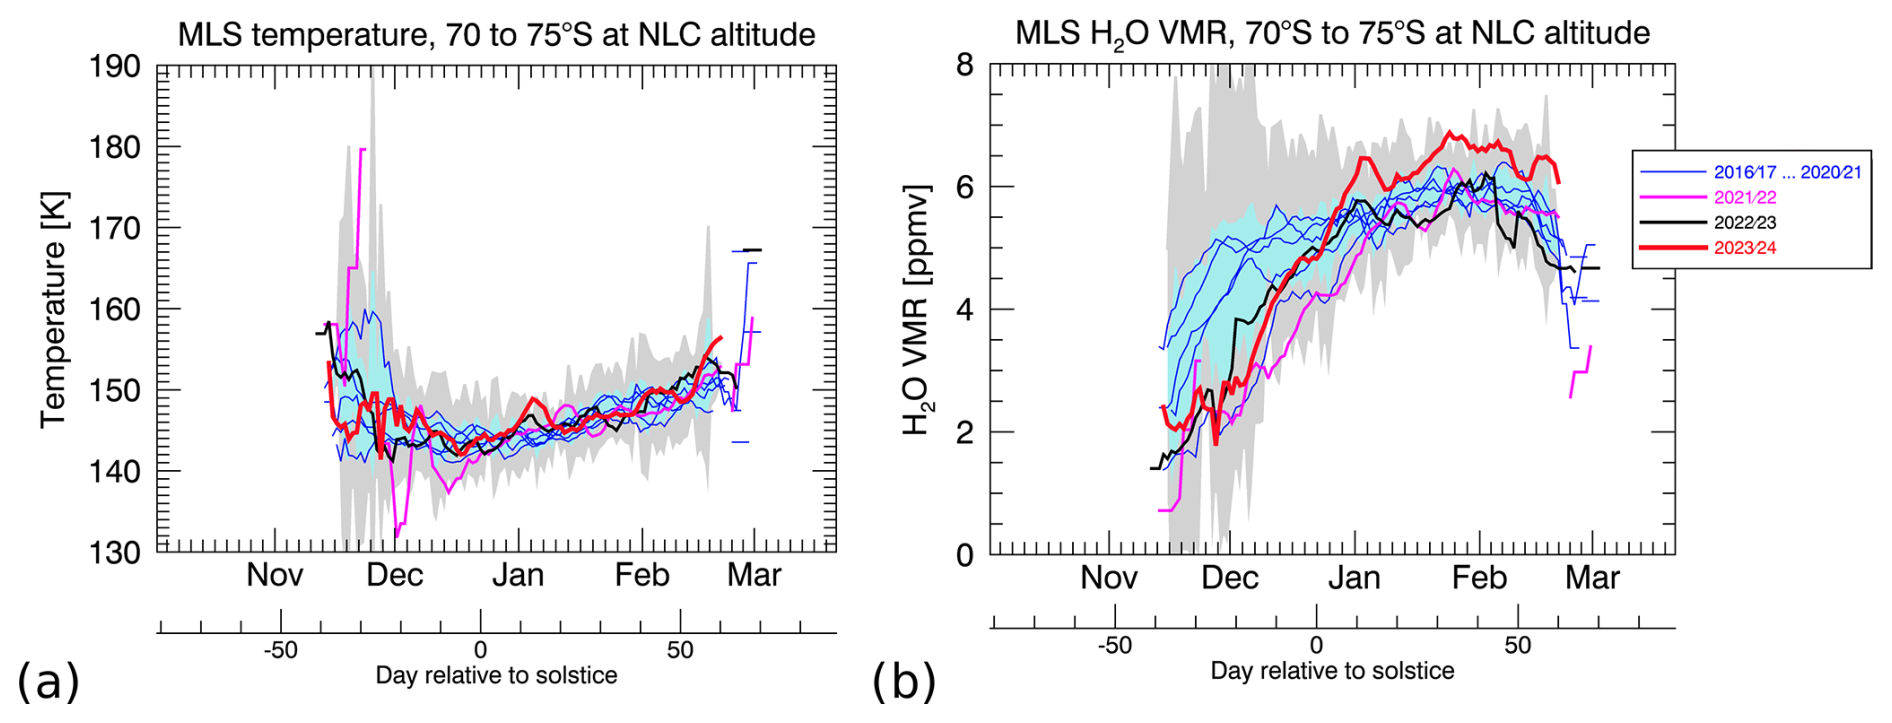
Figure 3(a) MLS temperature between 70 and 75° S at the NLC altitude determined from OMPS-LP measurements. The thick lines show the SH seasons in 2021/22 (magenta), 2022/23 (black) and 2023/24 (red). All seasons before are displayed as thin blue lines. Blue (grey) areas indicate the averaged temperature from 2016/17 to 2020/21 ± 1 (3) standard deviation. (b) The same for MLS water vapour mixing ratios. All data are smoothed over 5 d.
Figure 4 shows the maximum radiance ratio between the measured and background limb radiance from OMPS-LP measurements between 70 and 75° S, using a similar colour scheme as in Fig. 2a to indicate the NLC seasons and the average intervals. The maximum radiance ratio for 2023/24 is greater from the middle to the end of January than in all years prior, exceeding the 3σ interval of the reference period for a short time. Comparisons for other latitude bins are presented in Fig. S8.
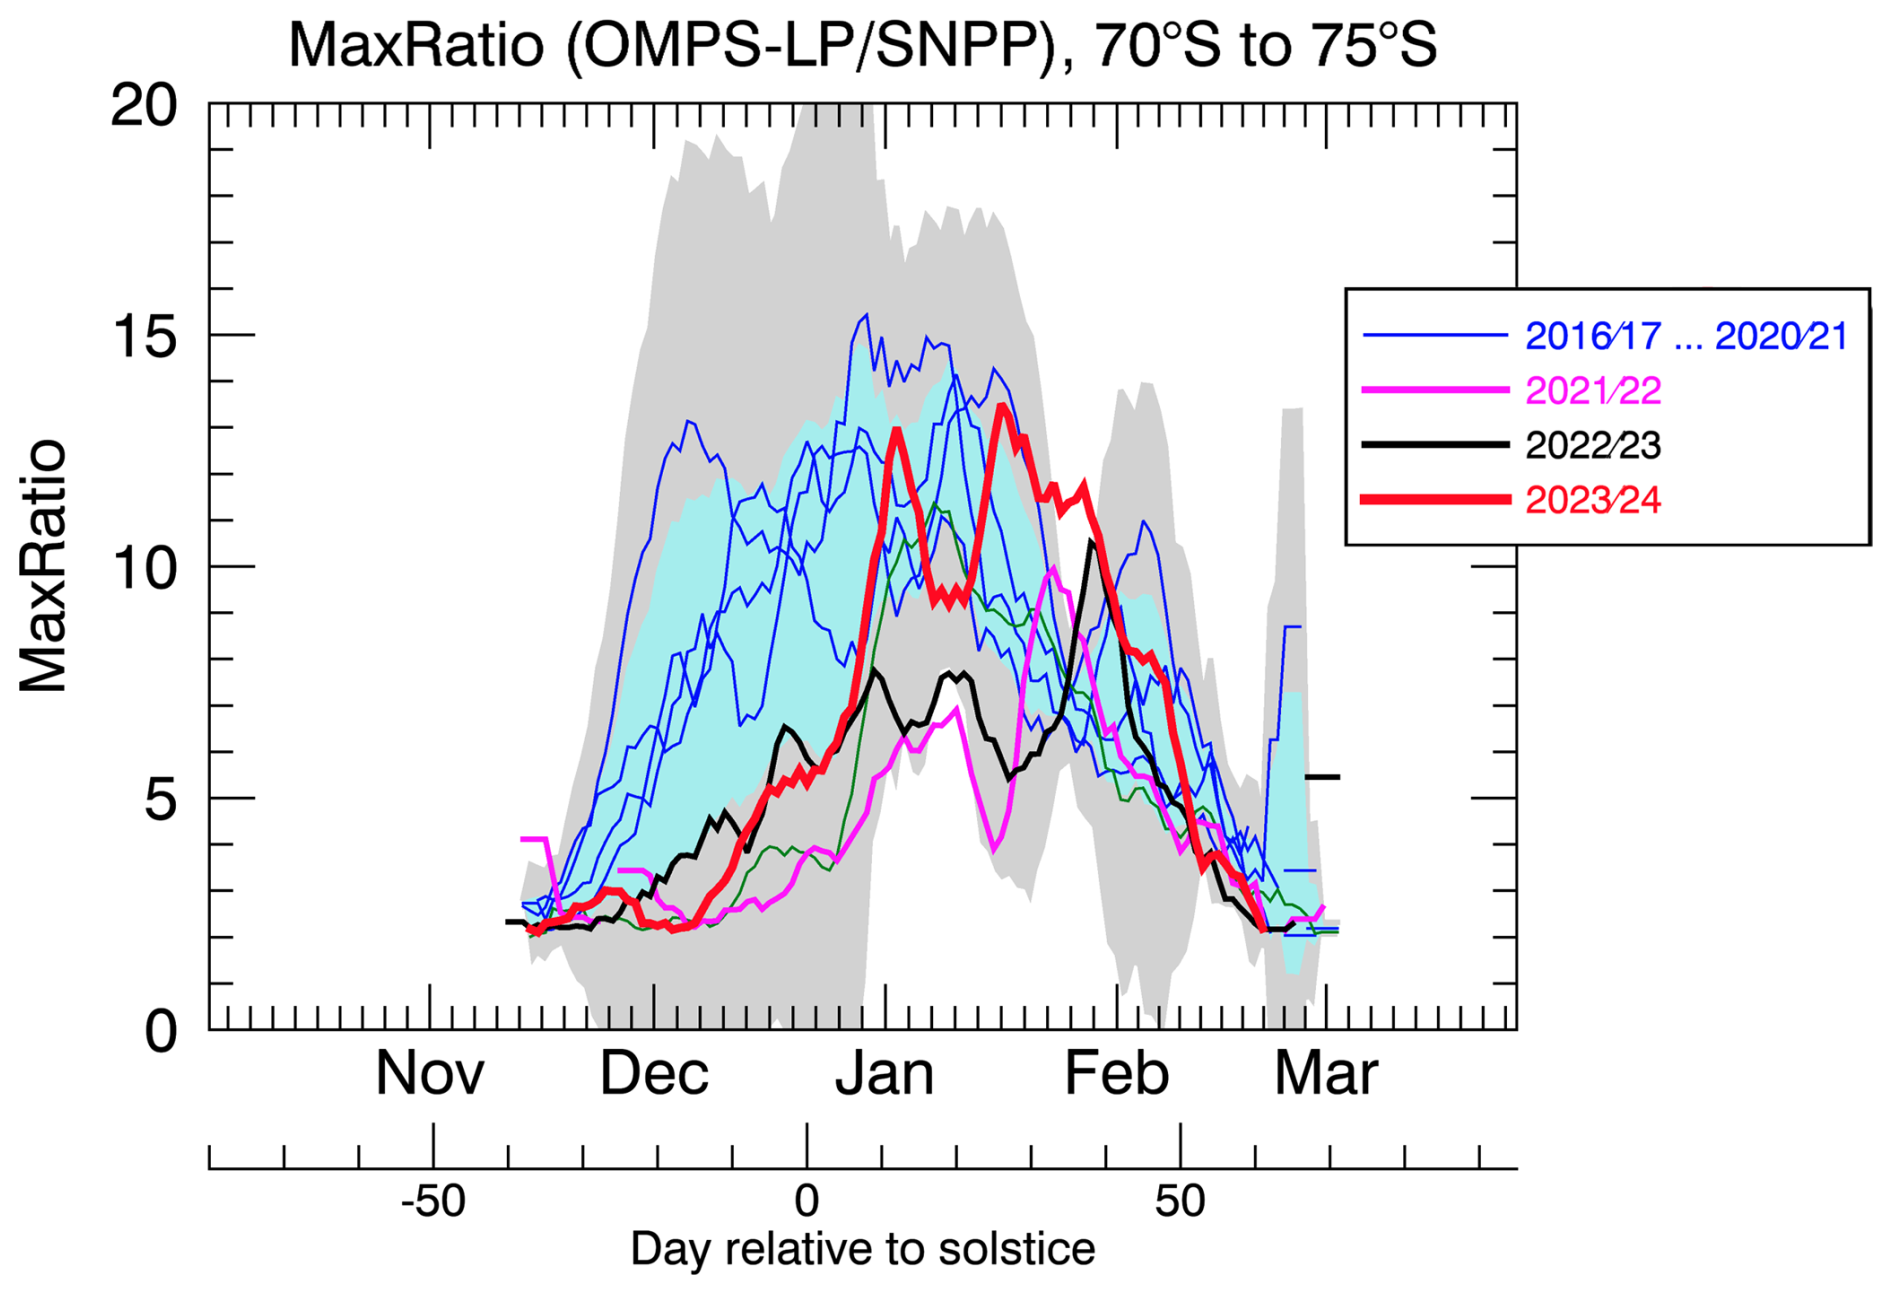
Figure 4The maximum radiance ratio between the measured and background limb radiance from OMPS-LP for each of the SH NLC seasons. The thick lines indicate zonally and daily mean maximum radiance ratios between 70 and 75° S for 2021/22 (magenta), 2022/23 (black) and 2023/24 (red). All seasons before are displayed as thin blue lines. The blue (grey) shaded region contains the averaged maximum radiance ratio for the years 2016/17 to 2020/21 ± 1 (3) standard deviation from this period. All occurrence frequencies are smoothed over 5 d, and the day of the solstice is 21 December.
The altitudes of the NLCs were determined using OMPS-LP measurements and are shown in Fig. 5 for the latitude band between 70 and 75° S. In general, the NLCs are detected at the highest altitudes at the beginning of the season before they tend to descend, reaching the minimum altitude in the beginning of February (Bailey et al., 2005). Afterwards, there is a strong variability in the NLC altitude until the end of the season. Comparisons of the different seasons for latitudes between 85 and 65° S are shown in the Supplement (Fig. S6).
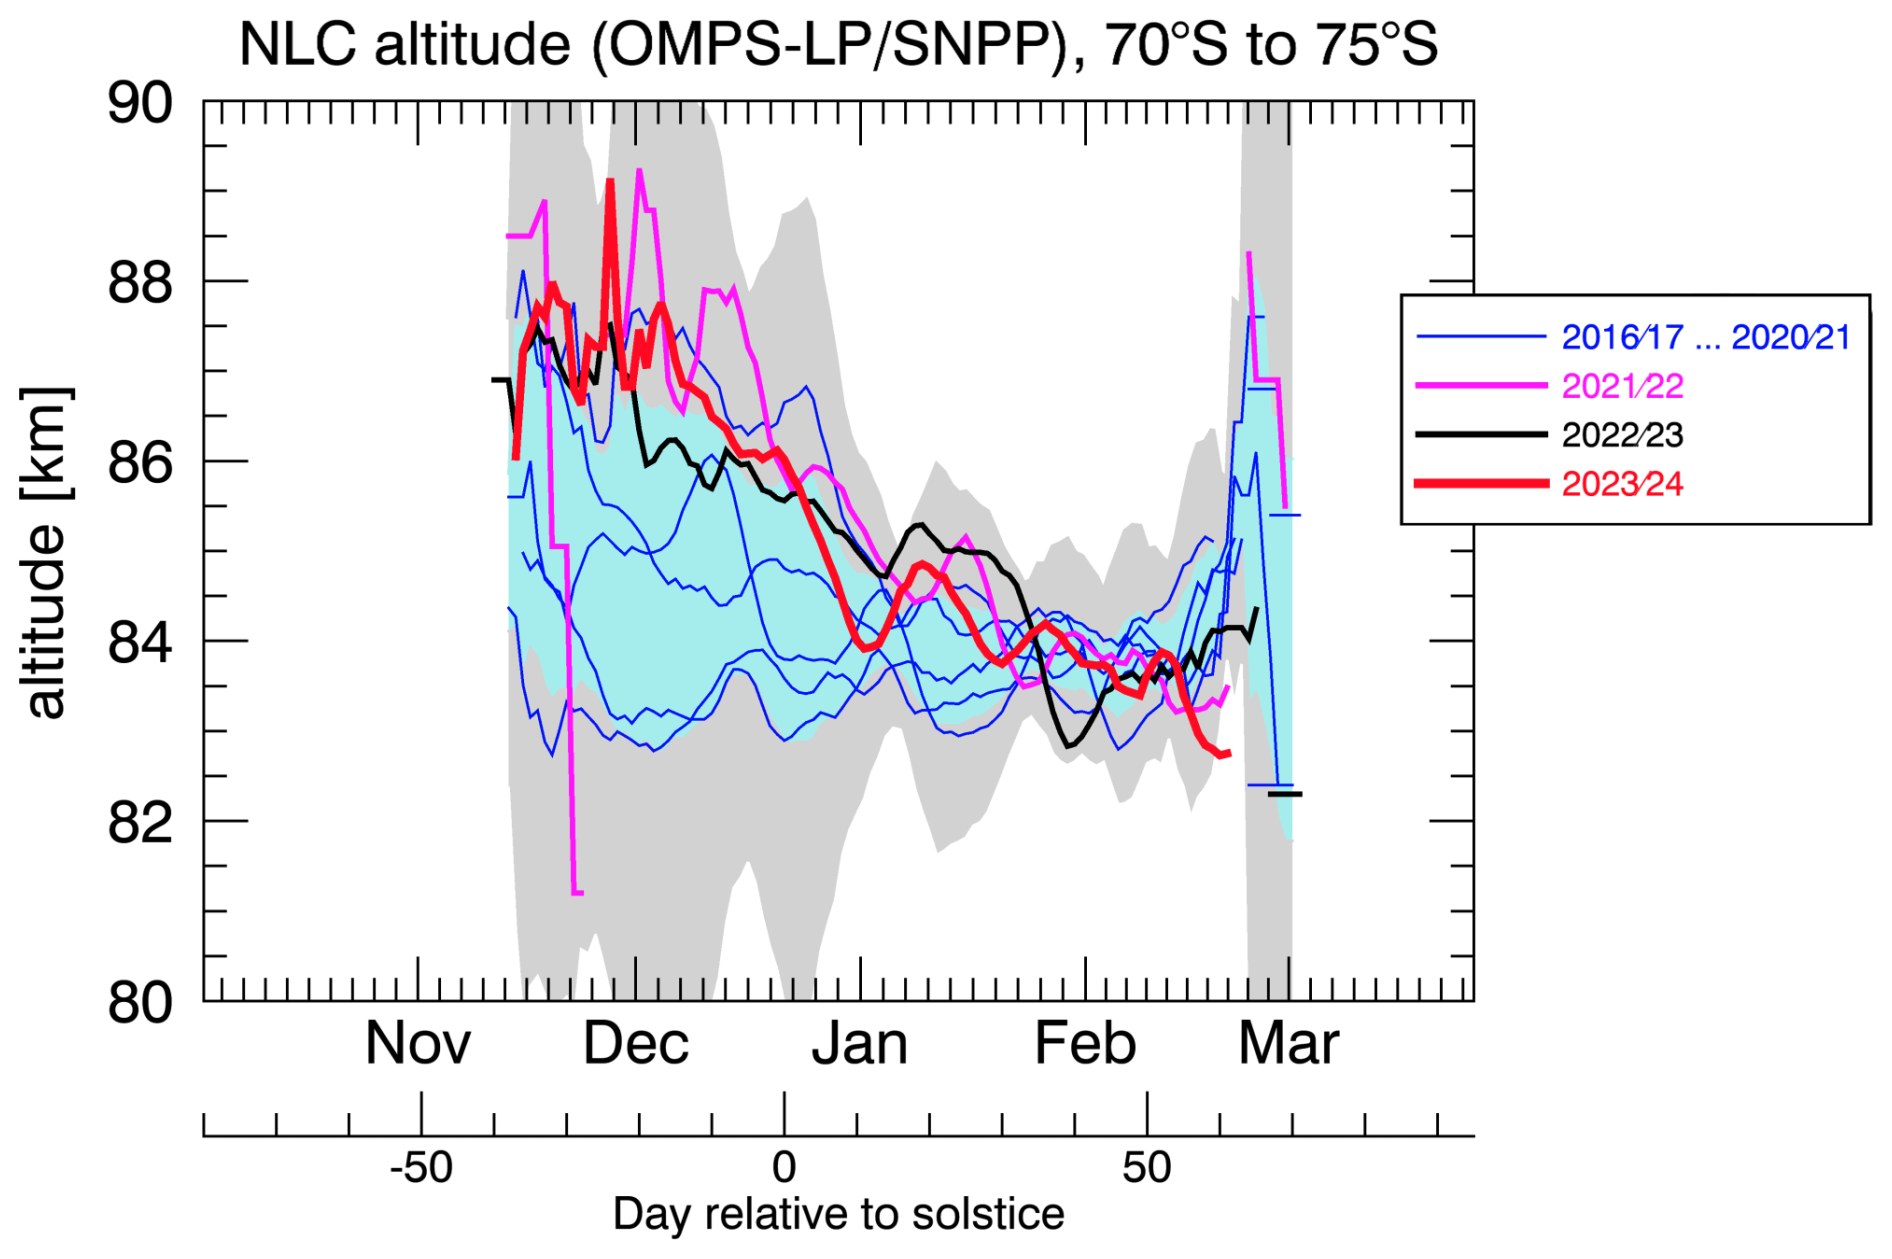
Figure 5Altitude of the NLCs determined from OMPS-LP measurements. The thick lines indicate zonally and daily mean maximum radiance ratios between 70 and 75° S for 2021/22 (magenta), 2022/23 (black) and 2023/24 (red). All seasons before are displayed as thin blue lines. Blue (grey) areas indicate the mean NLC altitude from 2016/17 to 2020/21 ± 1 (3) standard deviation. All data are smoothed over 5 d.
We also created scatter plots between MLS H2O and MLS temperature at the NLC altitudes for 65–70, 70–75 and 75–80° S (Fig. 6a and b). Data points from the seasons from 2016/17 to 2022/23 are depicted as empty circles, whereas the measurements for 2023/24 are highlighted with filled circles, using a red colour for measurements before 15 January and a green colour afterwards. All three chosen latitude bands show a clustering of filled circles for high H2O, with the highest mixing ratios reached after 15 January.
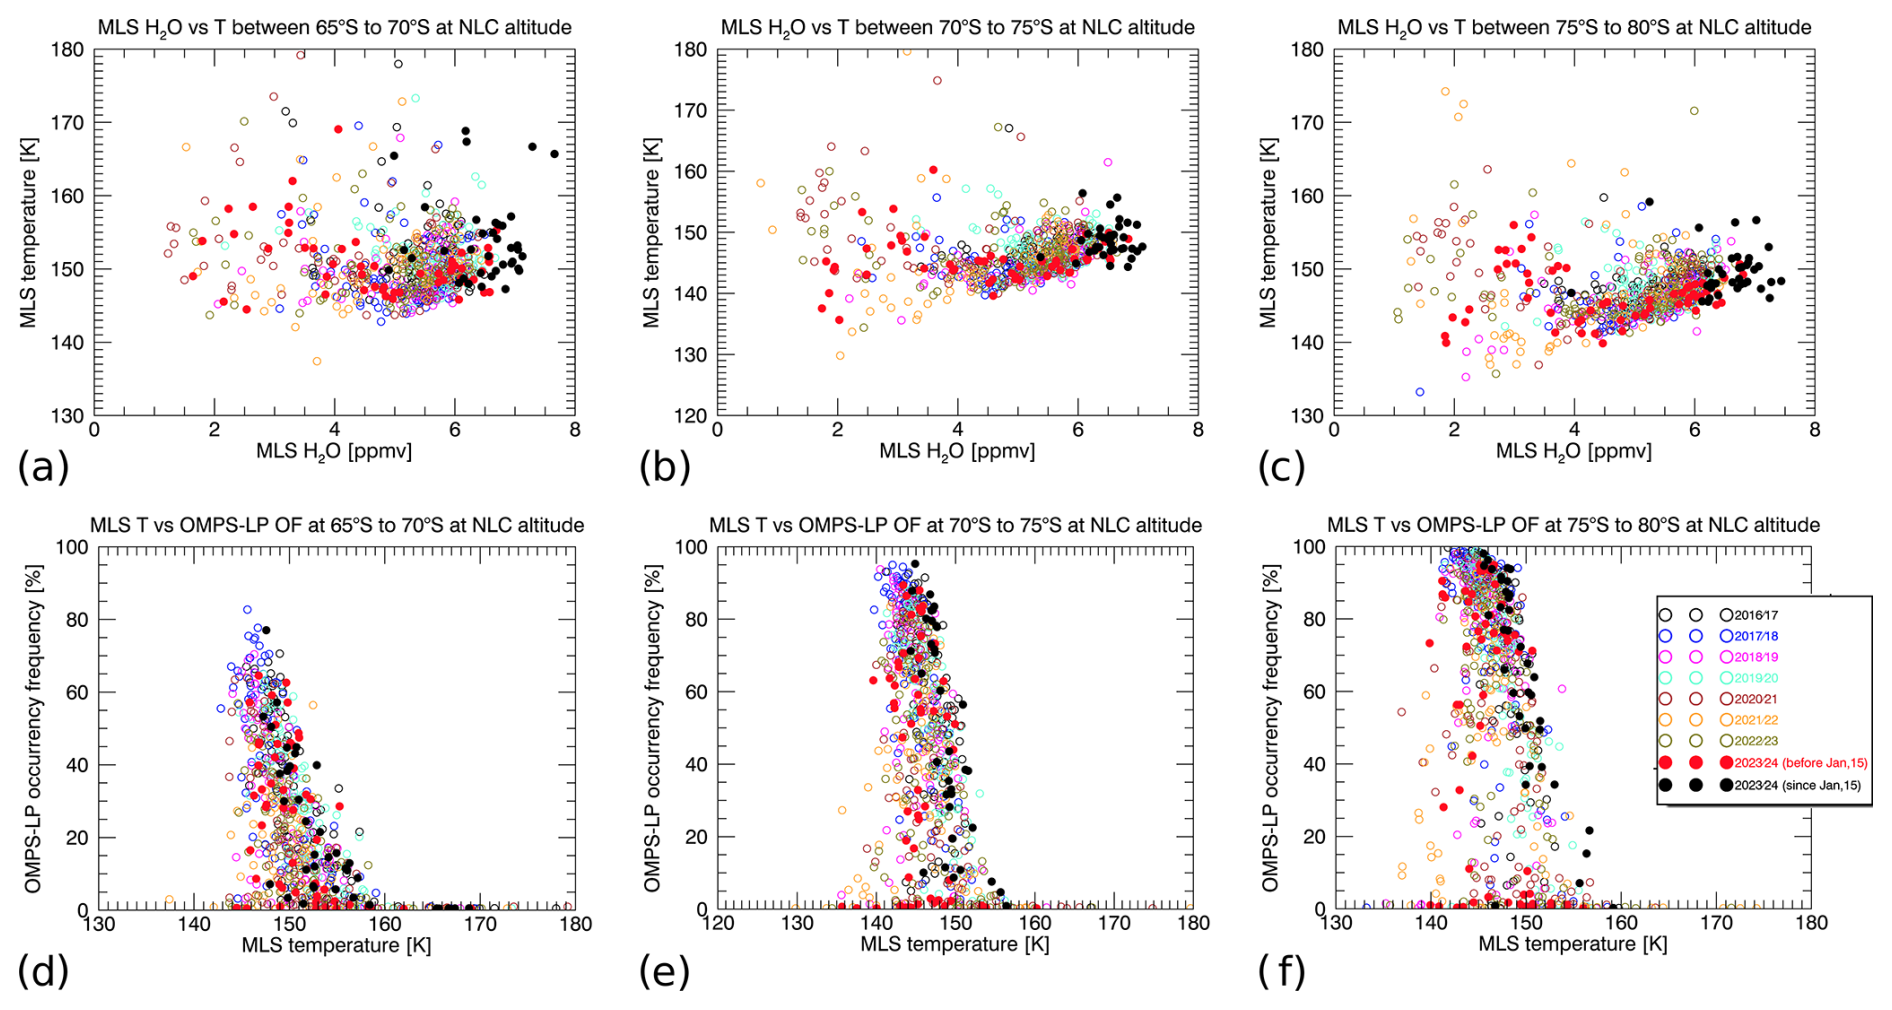
Figure 6Scatterplots for MLS temperature vs. MLS mixing ratios (a–c) and OMPS-LP occurrence frequency vs. MLS temperature (d–f), both at the NLC altitude (determined from OMPS-LP measurements). From (a) to (c): data for 65–70, 70–75 and 75–80° S. The measurements for 2023/24 are highlighted with filled circles using a red colour for measurements before 15 January and a black colour afterwards. The same for (d) to (f) but for OMPS-LP occurrence frequency vs. MLS temperature.
We further hypothesize that the additional water vapour could increase the NLC occurrence frequency at a specific mesospheric temperature compared to an unperturbed case. Figure 6d–f show the scatter plots for OMPS-LP occurrence frequency and MLS temperature at the NLC altitude, similar to Fig. 6a–c. The scatter plots at the three highest SH latitudes indicate that the occurrence frequency is on average slightly higher in 2023/24 for a specific temperature than in previous years, especially after 15 January. The correlation between the temperature at the NLC altitude and the NLC occurrence frequency is, however, weak. A similar scatter plot for latitudes 60–65° S is shown in Fig. S7, where the occurrence frequency during the core season is not as high, making the proposed effect of the increased water vapour potentially clearer. No distinct impact of the water vapour is, however, seen at these latitudes.
3.2 The NH NLC season in 2024
Similar to the SH season in 2023/24, the H2O anomaly from the eruption is also detected in the NH up to the NLC altitude in mid-2024 (see Fig. S3) and could therefore potentially affect the mesospheric clouds, making the NH NLC season in 2024 relevant to the Hunga discussion. Monitoring the H2O distribution during that season is, however, much more difficult because the MLS H2O channel has only been partially active since 29 April in order to extend the instrument's lifetime. Figure 7a shows the occurrence frequencies between 60 and 65° N for each year, again highlighting 2024 with a red line. The season in 2024 exhibits a peak in mid-July (60 %) that exceeds 1 standard deviation (σ) of the averaged reference period. Comparing this to the sparse data from the H2O channel, there is a positive H2O anomaly of nearly 1 ppmv in mid-July. The occurrence frequency rapidly decreases after the July peak and is lower than the 1σ interval for most of the remaining 2024 season. During this second half of the season, MLS detected a positive temperature anomaly of up to about 10 K compared to the mean average that could explain the decline in NLC occurrence in Fig. 7a. Unfortunately, as discussed in Sect. 2, MLS has a limited vertical resolution at these altitudes. For a better context, Fig. 7d and e show MLS H2O and temperature anomalies together with a significance estimate, as well as the NLC altitude from OMPS-LP measurements.
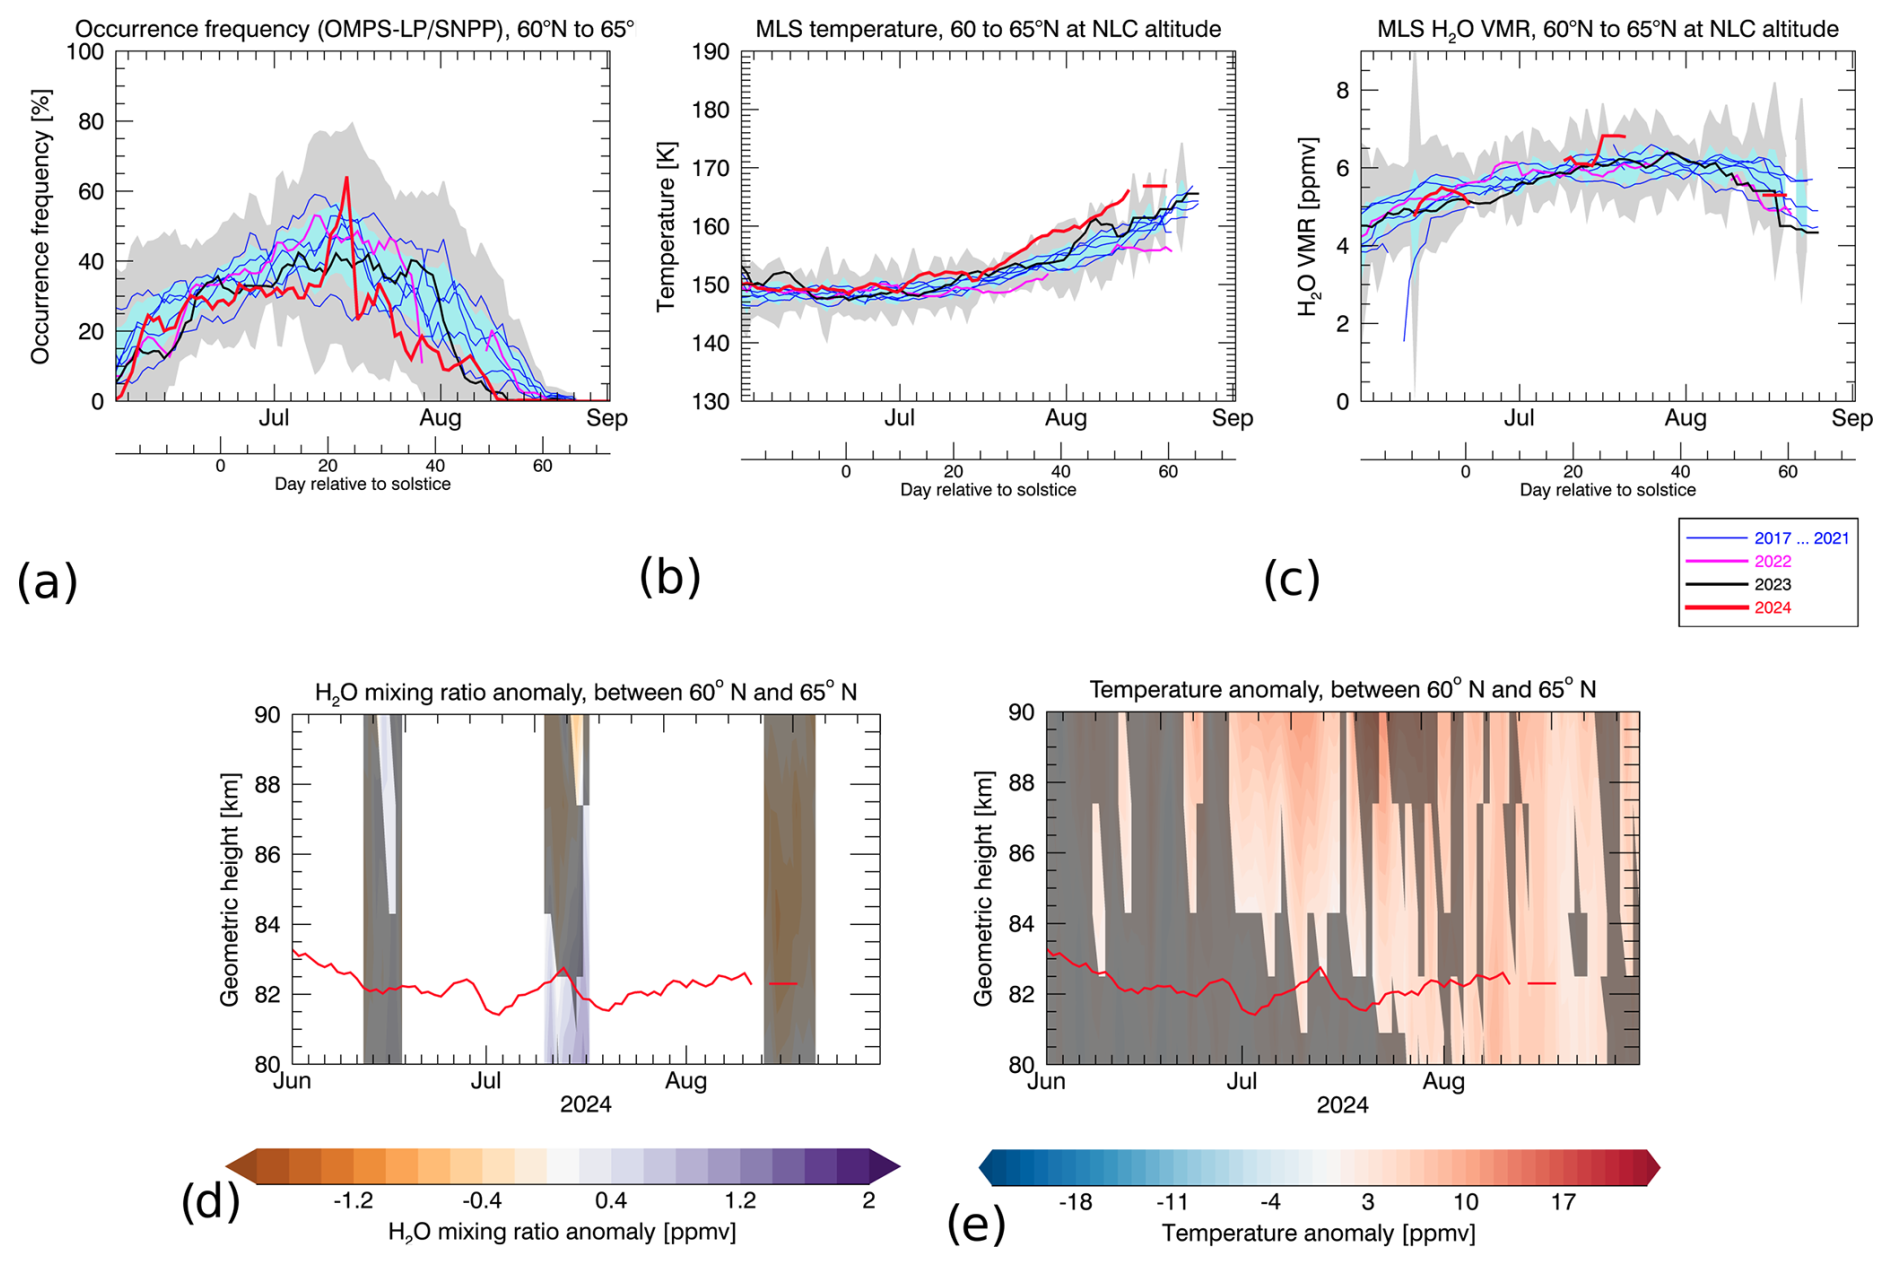
Figure 7A comparison of the OMPS-LP occurrence frequency, the MLS temperature, the MLS H2O mixing ratio, the MLS H2O mixing ratio anomaly and the MLS temperature anomaly between 60 and 65° N. The MLS H2O mixing ratio and temperature data are shown as anomalies with a reference period of 2017–2021, and areas that are not significant to 3 times the standard deviation of the reference period are shaded in grey. The daily and zonally averaged altitudes of the NLCs (from OMPS data) are plotted over the MLS data as red lines in panels (d) and (e).
Further, at higher latitudes, occurrence frequencies of the season in 2024 between 65 and 80° N are highest at the end of June and the beginning of July, when they partially exceed the 1σ interval (Fig. 8a, d, and g). Again, they decrease during the second half of the season and are lower than the 1σ interval – even declining below the 3σ area for a short time (mid-August in Fig. 8g). MLS H2O mixing ratios exceed the 1σ interval and are partially higher than 3σ during the mid-July measurement window (Fig. 8c, f, and i). An increase in MLS temperature during the second half of the season is also observed at these latitudes.
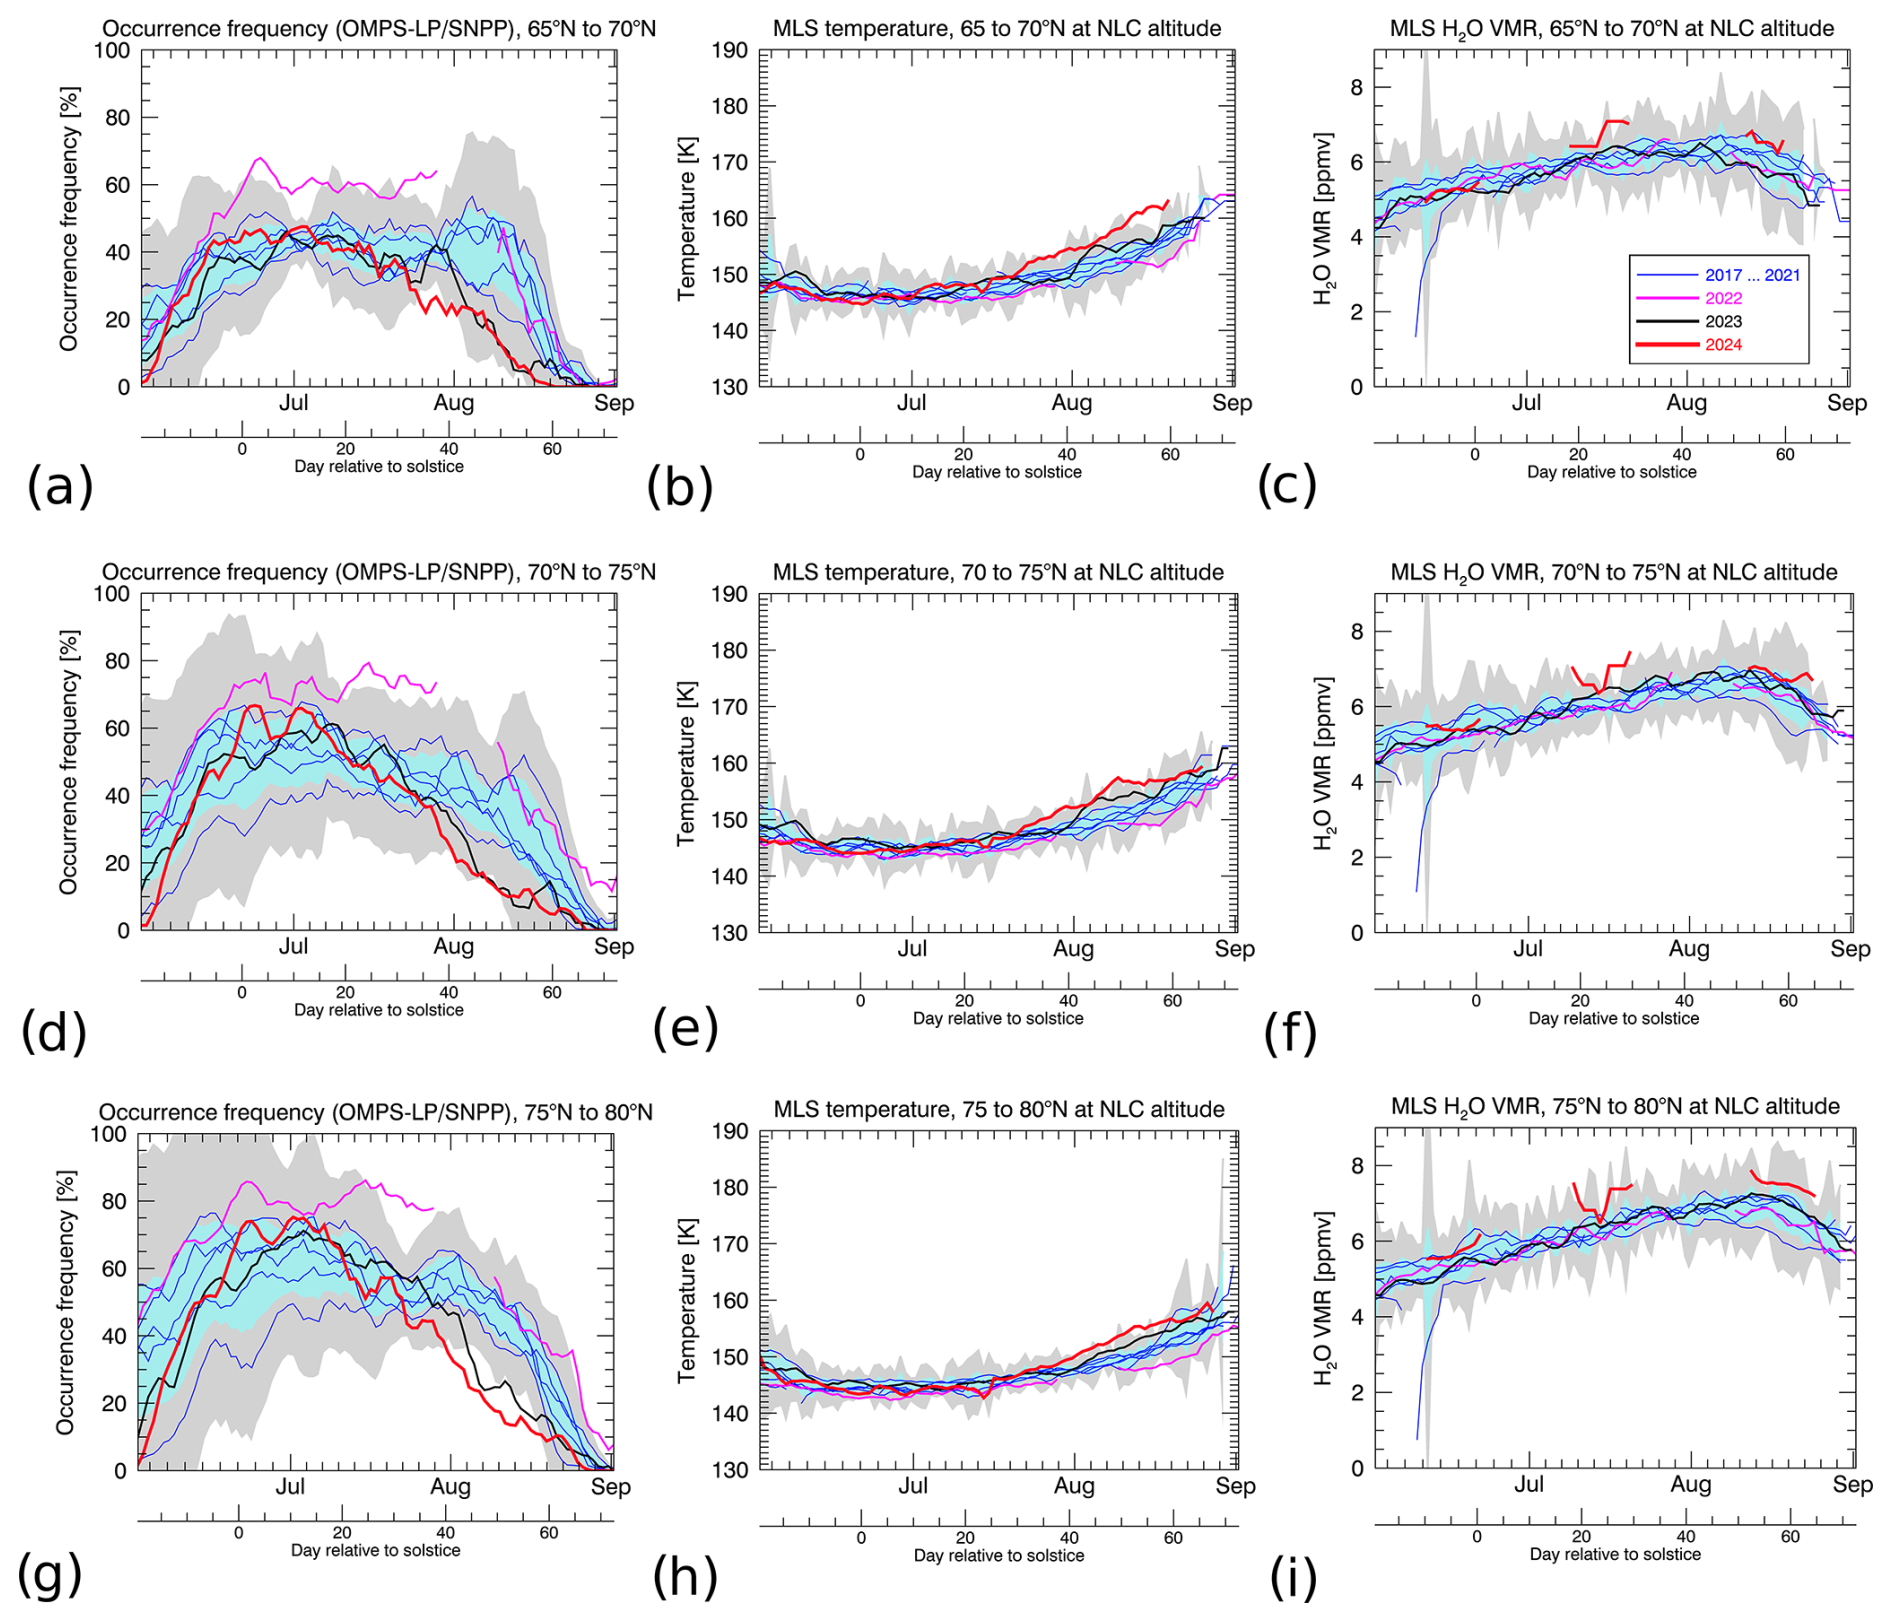
Figure 8An overview of the OMPS-LP occurrence frequency (a, d, g), the MLS temperature (b, e, h) and the MLS H2O mixing ratio (c, f, i) for 65–70° N (a, b, c), 70–75° N (d, e, f) and 75–80° N (g, h, i) during the 2024 NH NLC season. Colour schemes and significance intervals are chosen similar to Fig. 7.
One of the most striking features in Fig. 8 is the high occurrence frequency for the season in 2022 that exceeds the 3σ interval for each of the three latitude bins shown. The temperature during 2022 was low during the entire NLC season, whereas the H2O mixing ratio was unremarkable and confined within the 1σ interval.
Another approach to compare the NH NLC seasons uses the maximum radiance ratio between the measured and background limb radiance. These measurements show a peak for the 2024 data during the first days of July that exceeds 1σ (80–85° N) and 3σ (70–75° N) (Fig. S9). The NH NLC season in 2022 does not stand out any more and is well confined within the 1σ interval between 85 and 75° N.
The massive eruption of the Hunga volcano in January 2022 injected volcanic water vapour into the middle atmosphere that eventually reached the upper mesosphere. There, it increased the water vapour mixing ratios by approximately 1 ppmv at 70–75° S, beginning in January 2024 at the NLC altitude and was lifted to the mesopause region in the NH summer in 2024. Fleming et al. (2024) speculated that the additional water vapour from Hunga could impact NLCs. Similarly, a lidar station in Argentina (53.8° S) reported the most NLC detections since the beginning of their measurements in 2017 for the recent season in 2023/24 (Kaifler et al., 2024). They speculated whether additional water vapour emission from rocket engine exhaust or the Hunga eruption might be responsible.
The amount of water vapour in the mesosphere depends on water vapour transport, chemical processes (mainly photolysis and methane oxidation) and the solar cycle. The amplitude of the latter effect is about 0.1 ppmv near the mesopause at 0.001 hPa (Lee et al., 2024). Lübken et al. (2018) modelled the impact of an H2O increase of approximately 1.5 ppmv on the occurrence frequency and the brightness of NLCs. They used the Leibniz Institute Middle Atmosphere Model (LIMA) to simulate an atmospheric background with different H2O content and the Mesospheric Ice Microphysics And tranSport model (MIMAS) to simulate the mesospheric ice layer. They reported an increase in both NLC brightness and occurrence frequency due to the additional H2O in their model. Lee et al. (2024) used data from the Aeronomy of Ice in the Mesosphere (AIM)/Cloud Imaging and Particle Size (CIPS) experiment and Himawari-8/Advanced Himawari Imager (AHI) measurements to investigate the sensitivity of mesospheric clouds to temperature and water vapour content changes in the mesopause region. They supported the previous argument that water vapour could significantly enhance NLC visibility. Another model study was performed by Yu et al. (2023) using the Whole Atmosphere Community Climate Model (WACCM6) to simulate atmospheric temperature and water vapour contents that were used as input parameters for a 0 d polar mesospheric cloud (PMC) model. They found that in polar regions (that are already cold enough for NLCs during summertime), mesospheric clouds are more sensitive to water vapour than to changes in temperature. The sensitivity of NLCs to the relative humidity of the mesopause region was also confirmed by Pertsev et al. (2014). Moreover, Dalin et al. (2023) showed that a combination of low mesopause temperature and a maximum in water vapour mixing ratios was the main reason for the frequent and widespread occurrence of NLCs seen at NH midlatitudes in the summer of 2020.
The slight increase in occurrence frequency since mid-January 2024 between 70 and 75° S compared to the 2016/17 to 2020/21 average could therefore potentially stem from the additional volcanic water vapour. In this case, it would be a weak signal and would be difficult to correlate with the volcanic eruption. The additional Hunga H2O could also potentially be responsible for the peak in occurrence frequency in mid-July 2024 in the NH that coincided with an increase in the H2O mixing ratio at the NLC altitude. The subsequent decline in occurrence frequency was measured during a period of unusually high temperature that potentially hindered the formation of ice particles. Unfortunately, the MLS instrument has a coarse vertical resolution in the upper mesopause, so an exact correlation between occurrence frequency from OMPS-LP and MLS H2O and temperature data is limited. One may speculate as to whether the comparably high polar summer mesopause temperatures during the second half of the NH NLC season in 2024 might be related to the 2022 eruption of the Hunga volcano. Model simulations by Wallis et al. (2023) showed that massive volcanic eruptions may indeed cause a significant increase in polar summer mesopause temperature but mainly during the NLC season following the eruption. The temperature perturbations in the SH mesopause decrease significantly during the first 2 years after the eruption (their Fig. 6). For these reasons, it appears unlikely that the high polar summer mesopause temperatures during the NH season in 2024 are caused by the Hunga eruption.
The sensitivity of the NLC brightness to the H2O mixing ratio is well known (Thomas et al., 1989). An increase in available water vapour could result in more and larger particles. Their scattered radiance (i.e. radiant flux per unit angle and area) depends on the effective particle radius. Thus, a larger number of bigger ice particles due to additional water vapour should result in brighter NLCs. The sources of additional water vapour could also be human-made. An NLC outbreak observed in June 1963 in Tucson, for example, is speculated to have been caused by the water injection from a rocket launch (Russell III et al., 2014). Similarly, the final launch of the space shuttle was associated with unusually bright NLCs (Stevens et al., 2012), and Dalin et al. (2013) even demonstrated the direct formation of NLCs in the exhaust trails of Soyuz rockets.
Lee et al. (2024) reported that the maximum in water vapour mixing ratios at 0.01 and 0.02 hPa in the MLS H2O climatology (2005–2021) appears approximately 30–40 d after summer solstice. Comparing this to Fig. 3b indicates that the H2O amount at the NLC altitude, i.e. above the region described in Lee et al. (2024), approximately increased during this time period due to the additional volcanic water vapour.
The date of the first reported observation was 8 June 1885, as mentioned in Thomas et al. (1989), i.e. slightly less than 2 years after the Krakatoa eruption on 27 August 1883 (Leslie, 1885; Schröder, 1999). Some records estimate an injection height of 26 km (Self, 1992) up to 40 km (Francis and Self, 1983) for the Krakatoa eruption in late August 1883 and a water vapour amount of approximately 100–200 Tg (Thomas et al., 1989) up to 500 Tg (Joshi and Jones, 2009), which is comparable with the Hunga overshooting height of 57 km and the estimated 150 Tg H2O mass for the Hunga event. Using Krakatoa as a test case, it would be plausible that the Hunga water vapour would also need 2 years to reach the NLC region via the residual mean meridional circulation in the middle atmosphere.
This study showed that the H2O anomaly from the 2022 Hunga eruption reached the SH summer polar upper mesosphere between 70 and 80° S during the SH NLC season in 2023/24. There, it increased the H2O mixing ratio by approximately 1 ppmv up to 83 km in January 2024. No clear impact from the additional water vapour was detected in the occurrence frequency for the SH NLC season in 2023/24. However, a slight increase in NLC occurrence frequency from mid-January to February compared to previous seasons was observed in the OMPS-LP measurements. This could potentially indicate a weak signal of the Hunga eruption that impacted NLC properties 2 years after the eruption, analogous to the Krakatoa event in 1883. The additional water vapour from the Hunga eruption was also transported to the upper polar mesosphere region during the NH summer in 2024. The transport of the water vapour is, however, more difficult to track because the H2O channel of the MLS instrument has not been in continual operation since 29 April 2024. Even though the current solar maximum would be expected to lower the number of NLCs, there were numerous reports of bright NLC sightings during the first half of the NH NLC season in 2024 (spaceweather.com, 2024). There is, however, also no clear Hunga signal present in the occurrence frequencies. MLS data indicate an anomalously high temperature during the second half of the season in 2024 at the NLC altitude, which might have hindered the formation of ice particles. To summarize, the aftermath of the Hunga eruption offered new insights into the transport of water vapour in the middle atmosphere and the link between volcanic eruptions and noctilucent clouds. Particularly noteworthy is the roughly 2-year lag between the eruption and the time the H2O anomaly reached the polar summer mesopause region.
The NASA MLS level 2 version 5 H2O data (https://doi.org/10.5067/Aura/MLS/DATA2508, Lambert et al., 2020) are available on the EarthData GES DISC centre (https://doi.org/10.5067/Aura/MLS/DATA2508, Lambert et al., 2020). NASA level 2 version 5 temperatures (https://doi.org/10.5067/Aura/MLS/DATA2520, Schwartz et al., 2020b) and geopotential heights (Schwartz et al., 2020a) are available at the same website (https://disc.gsfc.nasa.gov/datasets/ML2T_005/summary?keywords=MLS%20temperature, last access: 6 September 2024 and https://disc.gsfc.nasa.gov/datasets/ML2GPH_005/summary?keywords=MLS%20geopotential%20height%20v5%20level%202, last access: 6 September 2024, respectively). OMPS-LP data were accessed through the https://sbuv.gsfc.nasa.gov/pmc/ompslp/ (DeLand, 2024) website.
The supplement related to this article is available online at https://doi.org/10.5194/acp-25-3635-2025-supplement.
SW and CvS designed the project. MD provided the OMPS-LP NLC detection data set. SW processed the MLS data and the OMPS-LP data. All authors discussed the results and contributed to the writing of the paper.
The contact author has declared that none of the authors has any competing interests.
Publisher's note: Copernicus Publications remains neutral with regard to jurisdictional claims made in the text, published maps, institutional affiliations, or any other geographical representation in this paper. While Copernicus Publications makes every effort to include appropriate place names, the final responsibility lies with the authors.
This study is part of the research unit FOR 2820 VolImpact (grant no. 398006378) and was funded by the German Research Foundation (DFG) within the project VolDyn.
This research has been supported by the Deutsche Forschungsgemeinschaft (grant no. 398006378).
This paper was edited by Matthias Tesche and reviewed by three anonymous referees.
Backhouse, T.: The luminous cirrus cloud of June and July, Meteorol. Mag., 20, 133–133, 1885. a
Bailey, S. M., Merkel, A. W., Thomas, G. E., and Carstens, J. N.: Observations of polar mesospheric clouds by the student nitric oxide explorer, J. Geophys. Res.-Atmos., 110, D13203, https://doi.org/10.1029/2004JD005422, 2005. a
Carr, J. L., Horvath, A., Wu, D. L., and Friberg, M. D.: Stereo plume height and motion retrievals for the record-setting Hunga Tonga-Hunga Ha'apai eruption of 15 January 2022, Geophys. Res. Lett., 49, e2022GL098131, https://doi.org/10.1029/2022GL098131, 2022. a
Dalin, P., Perminov, V., Pertsev, N., Dubietis, A., Zadorozhny, A., Smirnov, A., Mezentsev, A., Frandsen, S., Grønne, J., Hansen, O., Andersen, H., McEachran, I., McEwan, T., Rowlands, J., Meyerdierks, H., Zalcik, M., Connors, M., Schofield, I., and Veselovsky, I.: Optical studies of rocket exhaust trails and artificial noctilucent clouds produced by Soyuz rocket launches, J. Geophys. Res.-Atmos., 118, 7850–7863, https://doi.org/10.1002/jgrd.50549, 2013. a
Dalin, P., Suzuki, H., Pertsev, N., Perminov, V., Shevchuk, N., Tsimerinov, E., Zalcik, M., Brausch, J., McEwan, T., McEachran, I., Connors, M., Schofield, I., Dubietis, A., Černis, K., Zadorozhny, A., Solodovnik, A., Lifatova, D., Grønne, J., Hansen, O., Andersen, H., Melnikov, D., Manevich, A., Gusev, N., and Romejko, V.: The strong activity of noctilucent clouds at middle latitudes in 2020, Polar Sci., 35, 100920, https://doi.org/10.1016/j.polar.2022.100920, 2023. a
DeLand, M. T.: OMPS LP PMC Data, NASA [data set], https://sbuv.gsfc.nasa.gov/pmc/ompslp/ (last access: 6 September 2024), 2024. a
DeLand, M. T. and Gorkavyi, N.: PMC observations from the OMPS limb profiler, J. Atmos. Sol.-Terr. Phy., 213, 105505, https://doi.org/10.1016/j.jastp.2020.105505, 2021. a
Fleming, E. L., Newman, P. A., Liang, Q., and Oman, L. D.: Stratospheric temperature and ozone impacts of the Hunga Tonga-Hunga Ha'apai water vapor injection, J. Geophys. Res.-Atmos., 129, e2023JD039298, https://doi.org/10.1029/2023JD039298, 2024. a
Francis, P. and Self, S.: The eruption of Krakatau, Sci. Am., 249, 172–187, 1983. a
Guinn, T. and Mosher, F.: Numerical model derived altimeter correction maps for non-standard atmospheric temperature and pressure, International Journal of Aviation, Aeronautics, and Aerospace, 2, 1–22, https://doi.org/10.15394/ijaaa.2015.1060, 2015. a
Jaross, G., Bhartia, P. K., Chen, G., Kowitt, M., Haken, M., Chen, Z., Xu, P., Warner, J., and Kelly, T.: OMPS limb profiler instrument performance assessment, J. Geophys. Res.-Atmos., 119, 4399–4412, https://doi.org/10.1002/2013JD020482, 2014. a
Joshi, M. M. and Jones, G. S.: The climatic effects of the direct injection of water vapour into the stratosphere by large volcanic eruptions, Atmos. Chem. Phys., 9, 6109–6118, https://doi.org/10.5194/acp-9-6109-2009, 2009. a, b
Kaifler, N., Kaifler, B., Rapp, M., Liu, G., Janches, D., Baumgarten, G., and Hormaechea, J.-L.: Lidar measurements of noctilucent clouds at Río Grande, Tierra del Fuego, Argentina, Atmos. Chem. Phys., 24, 14029–14044, https://doi.org/10.5194/acp-24-14029-2024, 2024. a
Karlsson, B., Randall, C. E., Shepherd, T. G., Harvey, V. L., Lumpe, J., Nielsen, K., Bailey, S. M., Hervig, M., and Russell III, J. M.: On the seasonal onset of polar mesospheric clouds and the breakdown of the stratospheric polar vortex in the Southern Hemisphere, J. Geophys. Res.-Atmos., 116, D18107, https://doi.org/10.1029/2011JD015989, 2011. a
Kiessling, J.: Über die geographische Verbreitung des Bishop'schen Sonnenrings, Das Wetter, 2, 81–89, 1885. a
Lambert, A., Read, W., and Livesey, N.: MLS/Aura Level 2 Water Vapor (H2O) Mixing Ratio V005, Tech. Rep., GES DISC – Goddard Earth Sciences Data and Information Services Center [data set], https://doi.org/10.5067/Aura/MLS/DATA2508, 2020. a, b
Lee, J. N., Wu, D. L., Thurairajah, B., Hozumi, Y., and Tsuda, T.: The sensitivity of polar mesospheric clouds to mesospheric temperature and water vapor, Remote Sens.-Basel, 16, 1563, https://doi.org/10.3390/rs16091563, 2024. a, b, c, d
Leslie, R. C.: Sky glows, Nature, 32, 245, https://doi.org/10.1038/032245a0, 1885. a, b
Livesey, N., Read, W., Wagner, P., Froidevaux, L., Santee, M., Schwartz, M., Lambert, A., Millán, L., Pumphrey, H., Manney, G., Fuller, R., Jarnot, R., Knosp, B., and Lay, R.: Earth observing system (EOS) aura microwave limb sounder (MLS) version 5.0x level 2 and 3 data quality and description document, JPL D-105336 Rev. B, 5.0–1.1a, https://mls.jpl.nasa.gov/data/v5-0_data_quality_document.pdf (last access: February 2022), 2022. a, b, c
Lübken, F.-J., Berger, U., and Baumgarten, G.: On the anthropogenic impact on long-term evolution of noctilucent clouds, Geophys. Res. Lett., 45, 6681–6689, https://doi.org/10.1029/2018GL077719, 2018. a
Millan, L., Santee, M. L., Lambert, A., Livesey, N. J., Werner, F., Schwartz, M. J., Pumphrey, H. C., Manney, G. L., Wang, Y., Su, H., Wu, L., Read, W. G., and Froidevaux, L.: The Hunga Tonga-Hunga Ha'apai hydration of the stratosphere, Geophys. Res. Lett., 49, e2022GL099381, https://doi.org/10.1029/2022GL099381, 2022. a
Nedoluha, G. E., Gomez, R. M., Boyd, I., Neal, H., Allen, D. R., and Lambert, A.: The spread of the Hunga Tonga H2O plume in the middle atmosphere over the first two years since eruption, J. Geophys. Res.-Atmos., 129, e2024JD040907, https://doi.org/10.1029/2024JD040907, 2024. a
Niemeier, U., Wallis, S., Timmreck, C., van Pham, T., and von Savigny, C.: How the Hunga Tonga – Hunga Ha'apai water vapor cloud impacts its transport through the stratosphere: dynamical and radiative effects, Geophys. Res. Lett., 50, e2023GL106482, https://doi.org/10.1029/2023GL106482, 2023. a, b
Oemaiya, D. V. and Santoso, D.: 3D model of Krakatau volcano subsurface structure based on gravity data, J. Phys. Conf. Ser., 1242, 012049, https://doi.org/10.1088/1742-6596/1242/1/012049, 2019. a
Pertsev, N., Dalin, P., Perminov, V., Romejko, V., Dubietis, A., Balčiunas, R., Černis, K., and Zalcik, M.: Noctilucent clouds observed from the ground: sensitivity to mesospheric parameters and long-term time series, Earth Planets Space, 66, 1880–5981, https://doi.org/10.1186/1880-5981-66-98, 2014. a
Poli, P. and Shapiro, N. M.: Rapid characterization of large volcanic eruptions: measuring the impulse of the Hunga Tonga Ha'apai explosion from teleseismic waves, Geophys. Res. Lett., 49, e2022GL098123, https://doi.org/10.1029/2022GL098123, 2022. a
Rapp, M. and Thomas, G. E.: Modeling the microphysics of mesospheric ice particles: assessment of current capabilities and basic sensitivities, J. Atmos. Sol.-Terr. Phy., 68, 715–744, https://doi.org/10.1016/j.jastp.2005.10.015, 2006. a
Russell III, J. M., Rong, P., Hervig, M. E., Siskind, D. E., Stevens, M. H., Bailey, S. M., and Gumbel, J.: Analysis of northern midlatitude noctilucent cloud occurrences using satellite data and modeling, J. Geophys. Res.-Atmos., 119, 3238–3250, https://doi.org/10.1002/2013JD021017, 2014. a
Schröder, W.: Were noctilucent clouds caused by the Krakatoa eruption? A case study of the research problems before 1885, B. Am. Meteorol. Soc., 80, 2081–2086, https://doi.org/10.1175/1520-0477(1999)080<2081:WNCCBT>2.0.CO;2, 1999. a, b, c
Schwartz, M., Livesey, N., and Read, W.: MLS/Aura Level 2 Geopotential Height V005, GES DISC – Goddard Earth Sciences Data and Information Services Center [data set], https://doi.org/10.5067/Aura/MLS/DATA2507, 2020a. a
Schwartz, M., Livesey, N., and Read, W.: MLS/Aura Level 2 Temperature V005, GES DISC – Goddard Earth Sciences Data and Information Services Center [data set], https://doi.org/10.5067/Aura/MLS/DATA2520, 2020b. a
Self, S.: Krakatau revisited: the course of events and interpretation of the 1883 eruption, GeoJournal, 28, 109–121, https://doi.org/10.1007/BF00177223, 1992. a, b
spaceweather.com: Noctilucent clouds blanKET Europe, https://spaceweather.com/archive.php?view=1&day=29&month=06&year=2024, (last access: 4 July 2024), 2024. a
Stevens, M. H., Lossow, S., Fiedler, J., Baumgarten, G., Lübken, F.-J., Hallgren, K., Hartogh, P., Randall, C. E., Lumpe, J., Bailey, S. M., Niciejewski, R., Meier, R. R., Plane, J. M. C., Kochenash, A. J., Murtagh, D. P., and Englert, C. R.: Bright polar mesospheric clouds formed by main engine exhaust from the space shuttle's final launch, J. Geophys. Res.-Atmos., 117, D19206, https://doi.org/10.1029/2012JD017638, 2012. a
Symons, G. J.: The eruption of Krakatoa, and subsequent phenomena: report of the Krakatoa Committee of the Royal Society, Trübner, https://cir.nii.ac.jp/crid/1130000798102308736 (last access: June 2024), 1888. a
Thomas, G. E., Olivero, J. J., Jensen, E. J., Schroeder, W., and Toon, O. B.: Relation between increasing methane and the presence of ice clouds at the mesopause, Nature, 338, 490–492, https://doi.org/10.1038/338490a0, 1989. a, b, c, d, e
Tseraskii, V. K.: Astronomichesky fotometr i ego prilozhenia (Astronomical photometer and its applications), Doctoral dissertation, mathematical Proceedings, XIII, Section 21, 626–631, 1887. a
von Savigny, C., Baumgarten, G., and Lübken, F.-J.: Noctilucent Clouds: General Properties and Remote Sensing, Springer International Publishing, Cham, 469–503, https://doi.org/10.1007/978-3-030-33566-3_8, 2020. a
von Savigny, C., Lange, A., Hoffmann, C. G., and Rozanov, A.: Explaining the green volcanic sunsets after the 1883 eruption of Krakatoa, Atmos. Chem. Phys., 24, 2415–2422, https://doi.org/10.5194/acp-24-2415-2024, 2024. a
Wallis, S., Schmidt, H., and von Savigny, C.: Impact of a strong volcanic eruption on the summer middle atmosphere in UA-ICON simulations, Atmos. Chem. Phys., 23, 7001–7014, https://doi.org/10.5194/acp-23-7001-2023, 2023. a
Waters, J., Froidevaux, L., Harwood, R., Jarnot, R., Pickett, H., Read, W., Siegel, P., Cofield, R., Filipiak, M., Flower, D., Holden, J., Lau, G., Livesey, N., Manney, G., Pumphrey, H., Santee, M., Wu, D., Cuddy, D., Lay, R., Loo, M., Perun, V., Schwartz, M., Stek, P., Thurstans, R., Boyles, M., Chandra, K., Chavez, M., Chen, G.-S., Chudasama, B., Dodge, R., Fuller, R., Girard, M., Jiang, J., Jiang, Y., Knosp, B., LaBelle, R., Lam, J., Lee, K., Miller, D., Oswald, J., Patel, N., Pukala, D., Quintero, O., Scaff, D., Van Snyder, W., Tope, M., Wagner, P., and Walch, M.: The Earth observing system microwave limb sounder (EOS MLS) on the aura Satellite, IEEE T. Geosci. Remote, 44, 1075–1092, https://doi.org/10.1109/TGRS.2006.873771, 2006. a
Wullenweber, N., Lange, A., Rozanov, A., and von Savigny, C.: On the phenomenon of the blue sun, Clim. Past, 17, 969–983, https://doi.org/10.5194/cp-17-969-2021, 2021. a
Yu, W., Yue, J., Garcia, R., Mlynczak, M., and Russell III, J.: WACCM6 projections of polar mesospheric cloud abundance over the 21st century, J. Geophys. Res.-Atmos., 128, e2023JD038985, https://doi.org/10.1029/2023JD038985, 2023. a