the Creative Commons Attribution 4.0 License.
the Creative Commons Attribution 4.0 License.
 | 25 Mar 2025
Characterization of aerosol optical depth (AOD) anomalies in September and October 2022 over Skukuza in South Africa
Marion Ranaivombola
Nelson Bègue
Lucas Vaz Peres
Farahnaz Fazel-Rastgar
Venkataraman Sivakumar
Gisèle Krysztofiak
Gwenaël Berthet
Fabrice Jegou
Stuart Piketh
Hassan Bencherif
Most major field campaigns, such as the Southern Africa Fire Atmosphere Research Initiative (SAFARI-92 and SAFARI-2000) and AErosol, RadiatiOn and CLOuds in southern Africa (AEROCLO-sA), have focused on the west coast of southern Africa, leaving the east coast underexplored. To address this, the Biomass Burning Aerosol Campaign (BiBAC) was initiated by the IRP ARSAIO (International Research Project – Atmospheric Research in Southern Africa and Indian Ocean) during the 2022 biomass burning season to study aerosol optical properties over southern Africa and the southwestern Indian Ocean (SWIO). This study analyzes aerosol properties during the intensive observation period (IOP) of BiBAC at Skukuza in Kruger National Park during two events: 18–23 September (Event 1) and 9–17 October (Event 2). Sun-photometer data, consistent with CALIOP (Cloud-Aerosol Lidar with Orthogonal Polarization), revealed a predominance of biomass burning aerosols. Transport analyses show southeastward movement of carbon monoxide (CO) and aerosols, reaching up to 6 km during Event 1 and 10 km during Event 2. Synoptic conditions, including frontal systems and baroclinic waves, drove regional and intercontinental pollutant transport, impacting the Mozambique Channel and surrounding areas. A “river of smoke” observed in Event 1 suggests novel synoptic conditions compared to previous studies. This study is the first to highlight two distinct transport mechanisms of aerosol plumes and CO from southern Africa and South America toward the SWIO basin, underscoring the significance of east-coast observations in understanding regional and global atmospheric dynamics.
- Article
(14100 KB) - Full-text XML
- BibTeX
- EndNote


Atmospheric aerosols influence the global climate system by scattering and absorbing incoming solar radiation and altering cloud microphysics, thereby impacting the atmospheric radiation budget and radiative forcing (Albrecht, 1989; Twomey, 1977; Feingold and Siebert, 2009). Assessing climate change relies on the understanding of the processes controlling the burden and distribution of aerosols. This task is particularly challenging in the Southern Hemisphere due to the lower number of aerosol observations compared to the Northern Hemisphere, largely because of the greater ocean coverage relative to land. This is more crucial in the Southern Hemisphere, due to the low number of observations in comparison with the Northern Hemisphere. The Southern American and southern African regions are recognized to be significant primary sources of carbonaceous aerosols in the Southern Hemisphere through the biomass burning activity which occurs seasonally from June to November (Randerson et al., 2012; van der Werf et al., 2017). This intense biomass burning activity has the potential to release a large number of pollutants, such as carbon monoxide and aerosols. These pollutants are harmful to both the environment and human health (Duflot et al., 2010, 2022; Holanda et al., 2020; Torres et al., 2007). Based on sun-photometer observations at the Réunion site, Duflot et al. (2022) showed that the aerosol optical depth (AOD) variability is mainly modulated by the biomass burning activity over southern Africa and South America.
The low number of observations of aerosols and gas in southern Africa during the biomass burning season led to the achievement of several measurement campaigns in the 1990s, such as the Southern Tropical Atlantic Region Experiment in 1992 (STARE-92; Andreae et al., 1996), combining two scientific experiments: the Transport and Atmospheric Chemistry near the Equator-Atlantic (TRACE-A; Fishman et al., 1996) and the Southern Africa Fire Atmosphere Research Initiative (SAFARI-92; Lindesay et al., 1996). The TRACE-A experiment aimed to investigate the transport and chemistry of trace gases over southern Africa and the equatorial Atlantic Ocean. During the same period, SAFARI-92 was undertaken and focused on studying the impacts of savanna fires and biomass burning on the atmosphere, air quality, and climate. These experiments showed that biomass burning plumes are transported from both South America and southern Africa over the Atlantic Ocean. During the biomass burning season, a photochemical reaction occurs between the associated emissions and solar radiation, which increases the concentration of ozone and leads to its accumulation in the Southern Hemisphere, from eastern Brazil to Australia (Fishman et al., 1996; Pickering et al., 1996; Thompson et al., 1996; Lindesay et al., 1996). SAFARI-2000 expanded upon the SAFARI-92 research, encompassing a broader range of topics, including aerosols, clouds, and land–atmosphere interactions in southern Africa (Swap et al., 2003). During SAFARI-2000, Schmid et al. (2003) observed a thick and widespread layer of aerosols that covered southern Africa, forming a smoke plume that extended from southeastern southern Africa to the Indian Ocean. The SAFARI campaigns gave way to other campaigns in southern Africa, such as AErosol, Radia-tiOn and CLOuds in southern Africa (AEROCLO-sA; Formenti et al., 2019), Namib Fog Life Cycle Analysis (NaFoLiCA; Andersen and Cermak, 2018), and Observations of Aerosols above Clouds and Their Interactions (ORACLES; Redemann et al., 2021; Doherty et al., 2022; Chang et al., 2021). These campaigns provided a large-scale picture of aerosols and their interactions with clouds and fog and specifically of biomass burning plumes at or near emissions (AEROCLO-sA and NaFoLiCA) and short- to mid-range transport (AEROCLO-sA and ORACLES). Recently, the data collected during AEROCLO-sA have made it possible to investigate the interaction between the tropical temperate troughs and cut-off lows that form over the west coast (Flamant et al., 2022). These phenomena potentially contribute to the transport of biomass burning aerosols, also known as “rivers of smoke”, from fire-prone regions in the tropical band to temperate mid-latitudes. The occurrence of rivers of smoke is generally due to a direct eastward transport of biomass burning plume from the continent toward the southwestern Indian Ocean (SWIO) basin. This eastward transport is one of the five trajectories that govern the air flows over southern Africa (Garstang et al., 1996). These trajectories lead to the transport of pollutants toward the SWIO basin (Clain et al., 2009; Duflot et al., 2010) and the southeast of Australia (Pak et al., 2003). Recently, Gaetani et al. (2021) performed a classification of the synoptic variability over 14 years (2003–2017) that controls the spatial distribution of biomass burning aerosols in southern Africa and the South Atlantic Ocean. They reported that the synoptic variability involves six weather regimes. Four of them correspond to disturbances traveling at mid-latitudes, and the two remaining ones account for pressure anomalies in the South Atlantic. These mid-latitude anomaly patterns may play a role in the formation of rivers of smoke and are consistent with Garstang et al. (1996).
An overview (2008–2021) of the spatiotemporal variability of aerosols in southern Africa and Réunion Island was recently investigated by Ranaivombola et al. (2023), using a combination of sun-photometer and satellite observations. They highlighted that vertical profiles of elevated smoke reach 3–4 km when biomass burning is at its maximum. Using the HYSPLIT back-trajectory model, they also demonstrated that intercontinental transport from South America and the Atlantic Ocean to southern Africa may rise during the biomass burning season. The quantification of the influence of biomass burning aerosols on the climate system using numerical models is highly dependent on how accurate the parameterization of aerosols is represented. However, for the tropical biomass burning regions, aerosol vertical distributions and their driving dynamical processes are poorly documented.
In the last 2 decades of the aforementioned field, campaigns have been conducted on the west coast (Formenti et al., 2019; Redemann et al., 2021; Doherty et al., 2022; Chang et al., 2021). Given the lack of observations on aerosols along the east coast of southern Africa, efforts were made to perform regular aerosol and chemical measurements during the 2022 biomass burning season. The partners of the IRP ARSAIO (International Research Project – Atmospheric Research in Southern Africa and Indian Ocean) initiated the Biomass Burning Aerosol Campaign (BiBAC). BiBAC is a multi-instrumental campaign for quantifying optical properties of aerosols over southern Africa and the Indian Ocean, as well as the associated transport at a regional and large scale. BiBAC aims to determine the optical properties of biomass burning aerosols transported from southern Africa over the southwestern Indian Ocean basin. It also analyzes the chemical and optical properties of biomass burning emissions collected at Skukuza and at several sites in southern Africa (Fig. 1), as well as the variability in chemical and optical properties based on the flaming and smoldering phases. The long-range transport of aerosol plumes off the east coast of southern Africa is identified using satellite observations. The vertical structure of the identified plumes is determined, and spatiotemporal variation is analyzed.
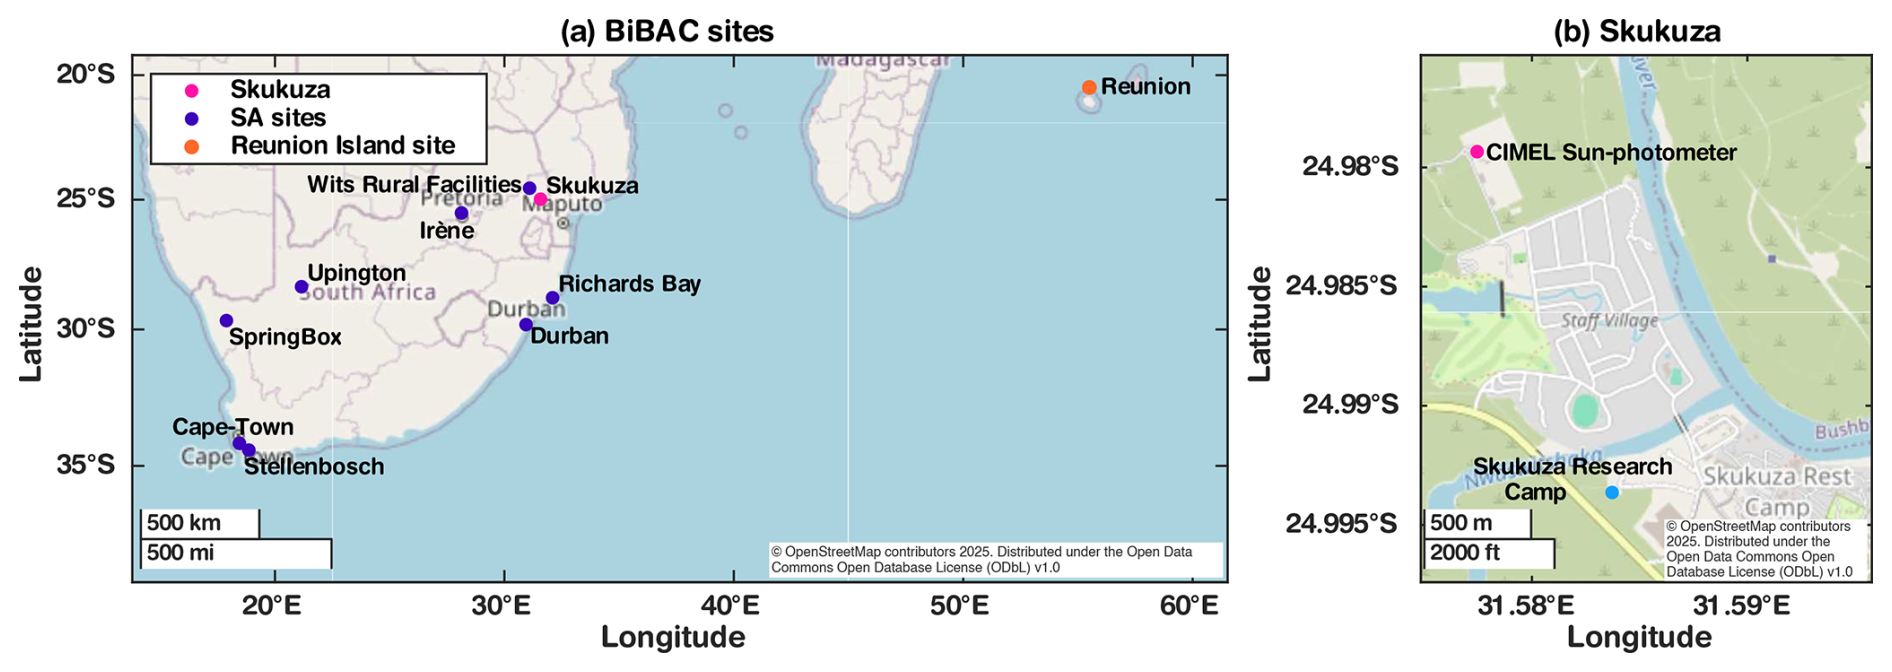
Figure 1Geographical location of sites involved in BiBAC (a) and the sun-photometer site and the research camp of Skukuza (b). Each site is represented by a dot (BiBAC sites in purple, Réunion Island in orange, Skukuza in pink, and N'Rwaswitshaka Research Camp in cyan).
The intensive observation period (IOP) took place in Kruger National Park (KNP), at the Skukuza camp, from August to November 2022. Given KNP is highly exposed to the biomass burning plume, it is considered a core base site for investigating the characteristics and impacts of biomass burning emissions over southern Africa (Garstang et al., 1996; Swap and Tyson, 1999). Furthermore, this site has been hosting a Cimel sun photometer for several decades. During the IOP period, an instrument set including a mobile lidar, ground-based and in situ optical particle counters (including LOAC, the Light Optical Aerosol Counter), and a mobile monitoring station for measurement of surface aerosol and trace gas chemical properties and concentrations were deployed in the KNP.
This study reports on the analysis of the spatiotemporal and vertical evolution of aerosol optical properties during the BiBAC campaign. In addition, it aims to provide a general description of the dynamic context that has impacted the air mass distributions observed during the campaign. In this work, the temporal, horizontal, and vertical distributions of aerosols are determined from ground-based observations collected over southern Africa as part of the BiBAC campaign and combined with satellite observations and reanalysis data. The paper is organized as follows: Sect. 2 describes the observations used in this study. An overview of sun-photometer observations during the IOP, as well as the extraction of aerosol loading events, is presented in Sect. 3. The transport of CO and aerosol plumes from satellite observations is highlighted in Sect. 4, as well as their vertical distribution. This section presents the synoptic conditions that drive the transport of CO and aerosol plumes. The conclusions of the study are given in Sect. 5.
2.1 Site location
The main study site of the BiBAC campaign is the N'Rwaswitshaka Research Camp, in Kruger National Park (24.98° S, 31.60° E), close to the main tourist rest camp, Skukuza. This site is located in the Mpumalanga province, in the eastern part of South Africa, and shares its borders with Mozambique and the provinces of Limpopo, Gauteng, and KwaZulu-Natal (see Fig. 1). The sun photometer (pink dot, Fig. 1) was located approximately 1.7 km from the N'Rwaswitshaka Research Camp, where ground-based instruments were installed (see cyan dot in Fig. 1b). Ground-based remote-sensing instruments were deployed from September to November 2022, collocated to the sun photometer.
2.2 Instrumentation and methods
2.2.1 Ground-based observations: AERONET sun photometer
The AERONET (AErosol RObotic NETwork) sun photometer (model CE318) is a passive-remote-sensing instrument that measures the optical and microphysical properties of vertically integrated aerosols in the atmosphere by analyzing the attenuation of solar radiation. Measurements are taken under cloud-free and daytime conditions, at wavelengths of 340, 380, 440, 500, 670, 870, 940, and 1020 nm and at 15 min intervals. We used Level 2 data (Version 3) to analyze direct sun measurements of aerosol optical depth (AOD) at 440 and 500 nm and Ångström exponent (AE) between 440 and 870 nm. The single-scattering albedo (SSA at 440 nm), extinction AE (EAE between 440 and 870 nm), and fine-mode fraction (FMF at 550 nm) were derived from the aerosol size distribution data obtained using the sun photometer. To prevent substantial inversion errors caused by the restricted aerosol information content, the SSA almucantar retrievals were only available when the AOD at 440 nm was greater than 0.4 (Dubovik and King, 2000; Smirnov et al., 2000). Under the cloud-free conditions, the uncertainty of AOD measurements is estimated to be 0.01 in the visible and near-IR, increasing to 0.02 in the ultraviolet (340 and 380 nm) (Eck et al., 2003; Dubovik et al., 2006). However, with the release of the AERONET Version 3 database, improvements in retrieval algorithms have further reduced uncertainties in aerosol properties (Giles et al., 2019; Sinyuk et al., 2020). The uncertainty in SSA values was expected to be on the order of 0.03–0.05, depending on aerosol type and loading (Eck et al., 2003; Alam et al., 2011; Yu et al., 2016).
Several aerosol classification methods using sun-photometer measurements have been applied across different environments in the world (Lee et al., 2010; Giles et al., 2012), such as South Africa (Kumar et al., 2014, 2017, 2020; Adesina et al., 2017; Ranaivombola et al., 2023), India (Kaskaoutis et al., 2009; Patel et al., 2017), Buenos Aires (Cúneo et al., 2022), and Australia (Yang et al., 2021). In our study, we classified aerosols using a combination of AOD, AE, EAE, SSA, and FMF, applying threshold values based on previously published studies (Fig. 2). These thresholds are well established in the literature, to distinguish between different aerosol types, including biomass burning and urban industrial (BB/UR), clean marine (CM), desert dust (DD), and mixed aerosols (MX), as used in studies by Kaskaoutis et al. (2009), Patel et al. (2017), and Giles et al. (2012).
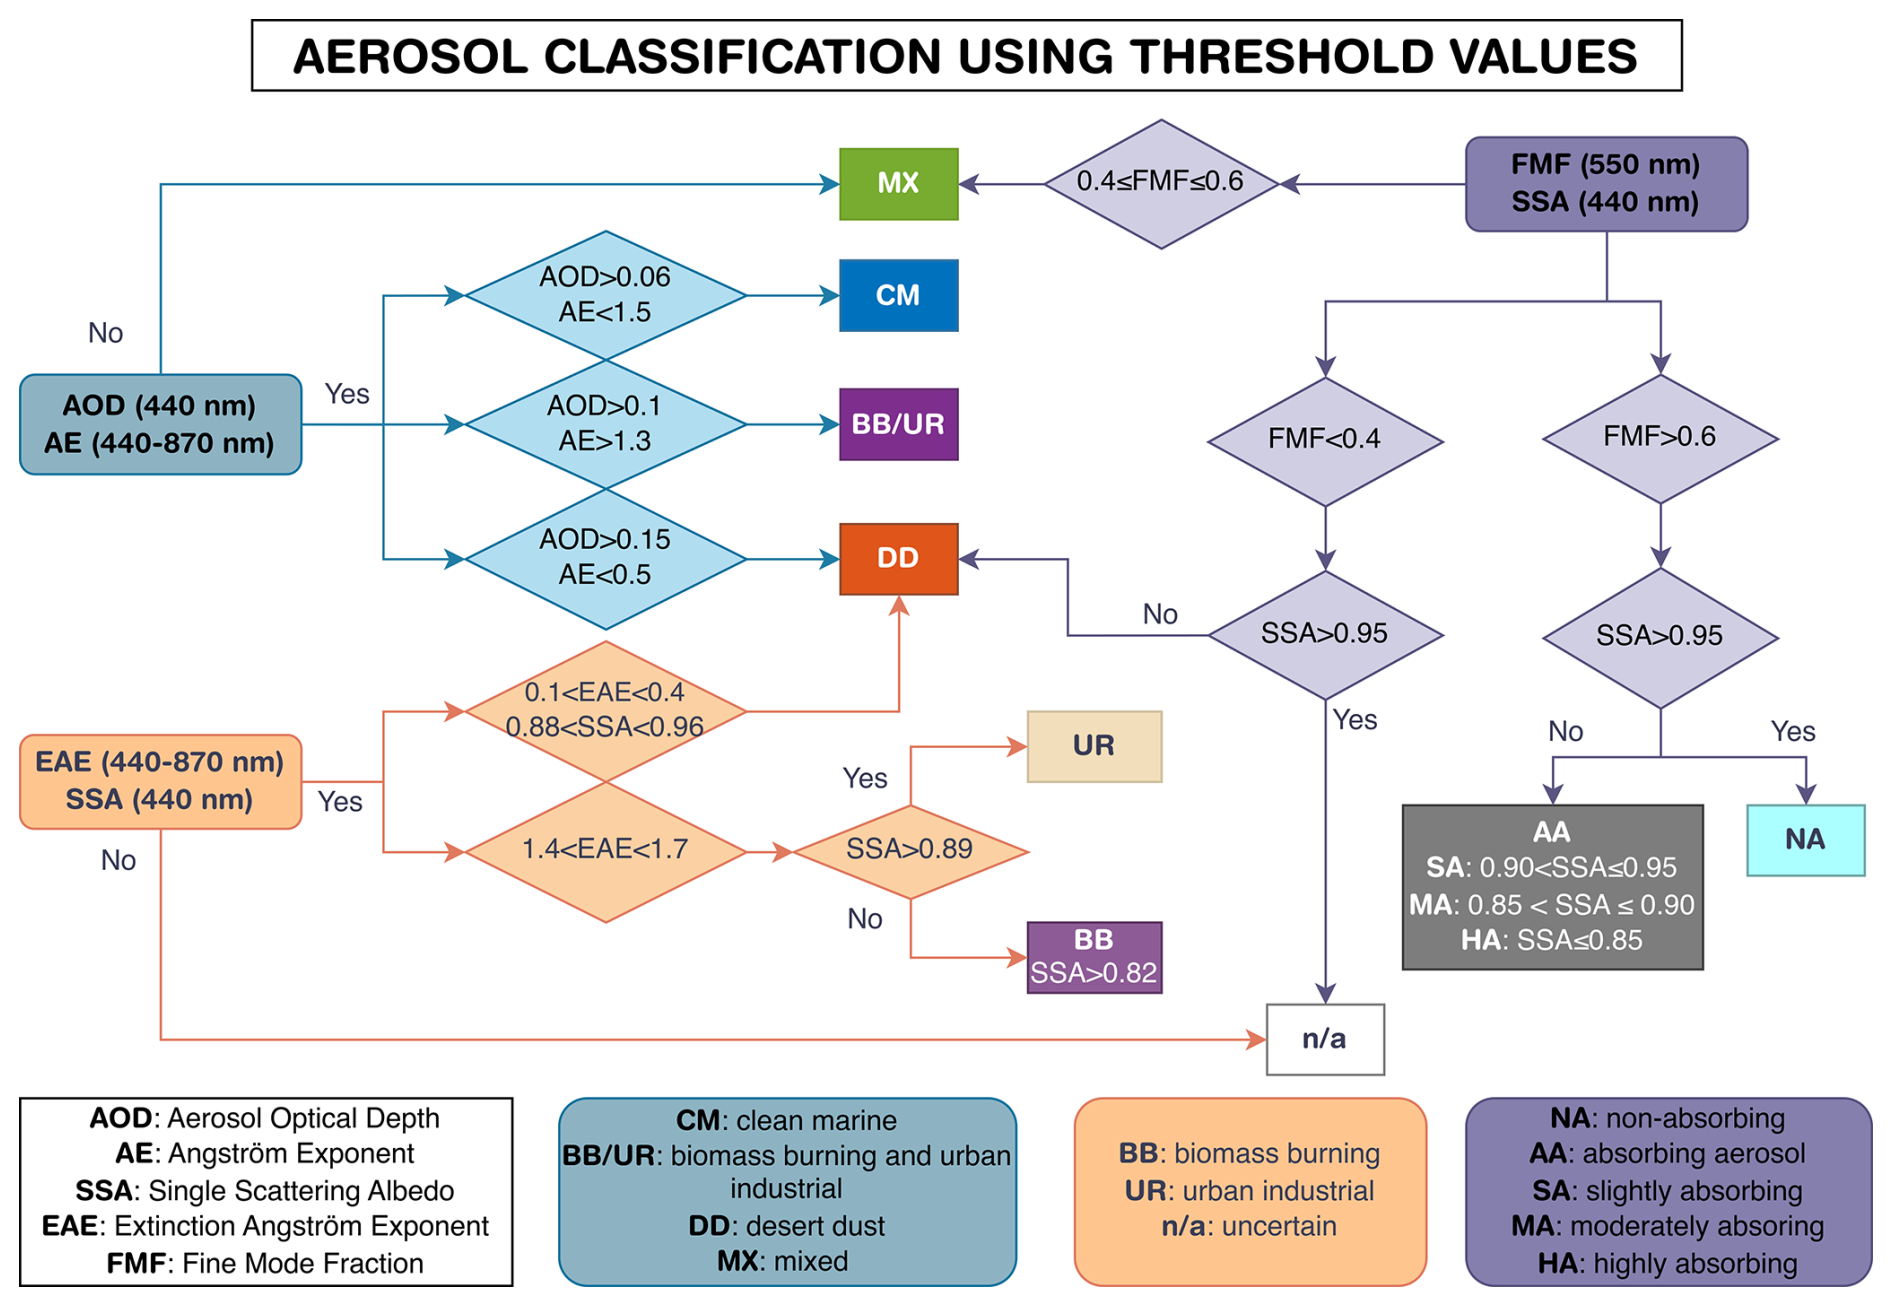
Figure 2A flow chart illustrating the threshold values of aerosol optical parameters (AOD, AE, FMF, EAE, and SSA) used to classify aerosol types.
For the AOD–AE classification method, threshold values were chosen based on their ability to distinguish aerosol types with high AOD values (typically indicative of biomass burning and urban industrial (BB/UR) aerosols) and lower values for clean marine (CM) and desert dust (DD) aerosols (Kaskaoutis et al., 2009; Patel et al., 2017; Giles et al., 2012). This method has been widely applied in South Africa (Kumar et al., 2017, 2020; Ranaivombola et al., 2023), with threshold values for AOD and AE set according to these previous studies. We also used the SSA–EAE method to distinguish between absorbing (SSA < 0.95) and non-absorbing aerosols. SSA is sensitive to the aerosol absorption properties, and the use of SSA combined with EAE helps differentiate between dust (DD), biomass burning (BB), and urban/industrial (UI) aerosols, as shown by Sinyuk et al. (2003) and Lee et al. (2010). This method has been used and reported in numerous studies and in different environments and locations, like South Africa, India, Bangladesh, and Pakistan (Giles et al., 2012; Bibi et al., 2016; Adesina et al., 2017; Kumar et al., 2020; Zaman et al., 2022). In our study, we standardized the classification into BB/UR for consistency with previous works, such as Ranaivombola et al. (2023). This method is a complement to the AOD–AE method in order to distinguish biomass burning and urban/industrial aerosol types.
The combination of SSA with FMF allows us to further classify aerosols by their size and absorption properties (absorbing and non-absorbing (NA) aerosol types). FMF helps in determining whether aerosols are predominantly fine-mode (from combustion processes) or coarse-mode (e.g., dust). We divided absorbing aerosols (AAs) into highly absorbing (HA), moderately absorbing (MA), and slightly absorbing (SA) based on SSA ranges, following Lee et al. (2010), Giles et al. (2012), and Adesina et al. (2017). This method was used in several studies by Lee et al. (2010), Giles et al. (2012), Adesina et al. (2017), Boiyo et al. (2019), Kumar et al. (2020), and Zaman et al. (2022). Figure 2 provides a visual representation of the aerosol classification framework used in this study. It shows how AOD, AE, SSA, EAE, and FMF are combined to classify aerosol types. To sum up, the commonly used method (AOD–AE) allows us to determine four main types: dust (DD), clean marine and biomass burning and urban industrial (BB/UR), and mixed (MX). The two other methods allow us to (1) distinguish biomass burning and urban industrial (BB/UR) and (2) capture the variation in absorption strength by distinguishing between non-absorbing aerosols (NA) and absorbing aerosols (AA). These classifications are complementary and useful for determining the observed aerosol types during the IOP, as well as for each event.
These classifications are both complementary and essential for identifying the types of aerosols observed during each event in the IOP. Additionally, calculating the frequencies of occurrence for each aerosol type over the campaign period (September to November) and across Events 1 and 2 provides further insight into their distribution over time. We calculated the aerosol frequencies based on Eq. (2) in Ranaivombola et al. (2023). For a given aerosol type, the relative frequency of occurrence for each season, as a percentage, is defined by the following equation:
where Ns (type) is the number of occurrences for a given aerosol type and period, and Ns is the total number of occurrences for the given season (for all types). The calculation of occurrence frequencies is based on all-point data to have the largest amount of data. We selected the timestamps that were common to each pair of parameters with a 120 s interval.
Sun-photometer data for Skukuza range from 1998 to 2022, although the Skukuza sun photometer was out of operation from 2012 to March 2016 owing to calibration and maintenance issues (Adesina and Piketh, 2016). As a result, the data span the years 1998 to 2011 and 2016 to 2020. This represents 4605 d of AOD and AE measurements, out of which 246 were in 2022.
2.3 Satellite observations
2.3.1 MODIS-Aqua aerosol observations
The Moderate Resolution Imaging Spectroradiometer (MODIS) is carried on board NASA's Aqua (EOS PM-1) and Terra (EOS AM-1) satellites, which have heliosynchronous orbits and have been operational since 2002 and 2000, respectively. MODIS records data in 36 different spectral bands with wavelengths ranging from 0.4 to 14.4 µm and spatial resolutions ranging from 250 m to 1 km, depending on the channel. MODIS products give several parameters derived from the radiance measurement. These quantities are the distribution of cloud cover, the amount of water vapor in an atmospheric column, the temperature distribution, and the characteristics of aerosols.
The study uses the Level 3 MODIS Atmosphere Daily Gridded Product carried on the Aqua satellite: “Combined Dark Target and Deep Blue AOD at 550 nm, for land and ocean” (MYD8_D3_v6.1), which is obtained from the NASA Giovanni platform (https://giovanni.gsfc.nasa.gov/giovanni/, last access: 11 July 2023). This product provides global daily gridded data of aerosol properties, including aerosol optical depth (AOD). The dataset MYD8_D3_v6.1 is derived from MODIS Level 2 AOD data, with a native resolution of 10 km at nadir. The daily Level 3 gridded product with a spatial resolution of 1° × 1° uses the MODIS bands centered at 0.47 and 0.55 µm to estimate AOD. The MODIS AOD retrievals are regularly validated against AERONET data. Over land, the MODIS AOD product has an expected error of ±(0.05+0.15 × AOD), and over ocean, the error is typically ±(0.03+0.05 × AOD). As an example, Levy et al. (2013) have evaluated MODIS performance, showing good agreement with AERONET, though discrepancies may occur in areas with complex surface types or high aerosol loading. Over southern Africa, the recent work of Ranaivombola et al. (2023) compares MODIS data and AERONET sun-photometer data and shows good agreement between the two sensors, with a correlation coefficient from 0.5 to 0.78, depending on the study sites.
Regarding fire data, the products “Thermal Anomalies/Fire locations 1 km FIRMS V0061 (MCD14ML)” from the Aqua and Terra platform were downloaded from the FIRMS platform (https://firms.modaps.eosdis.nasa.gov/, last access: 7 November 2023). A confidence class is attributed to each pixel fire (“low”, “nominal”, or “high”). For this study we only used the “high” confidence class, where the confidence values are situated between 80 % and 100 % (Giglio, 2015).
2.3.2 CALIPSO aerosol profiles
The Cloud Aerosol Lidar Infrared Pathfinder Satellite Observations (CALIPSO) was launched in April 2006, in a joint mission between NASA and the French Agency CNES, to investigate the effects of aerosols and clouds on the Earth’s radiation budget and climate. It is a polar-orbiting satellite of the A-Train Constellation, flying at a height of 705 km with a 16 d cycle. The Cloud-Aerosol Lidar with Orthogonal Polarization (CALIOP) is one of the three instruments of CALIPSO and is an elastic backscatter lidar, which operates at two wavelengths: 532 and 1064 nm. It uses two 532 nm receiver channels and a channel measuring the total 1064 nm return signal (Hunt et al., 2009). The dataset used in this study is the Level 2 Aerosol Profiles (V4-51), for a period covering the IOP and downloaded from the EarthData website (https://search.earthdata.nasa.gov/, last access: 23 October 2023). The V4-51 is an upgrade of V4-21, improving the accuracy of the smoke layer above clouds and clearing clouds in the planetary boundary layer that are misclassified as aerosols (Getzewich et al., 2023). Data were selected on a box with a latitude range from 10 to 40° S and longitude from 10 to 40° E (Fig. 6e). We used aerosol extinction profiles at 532 nm, as well as the layer classification information (i.e., aerosol and “clean air”, meaning air without aerosols). Aerosol types given by the CALIOP algorithm are clean marine, dust, polluted continental/smoke, clean continental, polluted dust, elevated smoke, and dusty marine. The quality-filtering procedure of data is described in Tackett et al. (2018). We have adapted them for Level 2, since Tackett et al. (2018) used these criteria for Level 3 data by including (1) cloud aerosol discrimination score , (2) extinction quality control flag = 0 or 1, (3) extinction uncertainty > 99.99 km−1 and (4) extinction for “clear air” = 0 km−1. Average profiles of total aerosol extinction at 532 nm were obtained by the same averaging method described in Sect. 4.3 by Tackett et al. (2018). To obtain the profiles for each type, one applies a mask for each type using the layer classification information.
2.3.3 MetOp-B IASI CO measurements
The Infrared Atmospheric Sounding Interferometer (IASI) on board the Meteorological Operational (MetOp) satellite uses a Fourier transform spectrometer to measure the infrared radiation at wavelengths ranging from 6.62 to 15.5 µm during daytime and nighttime (Clerbaux et al., 2009; Coheur et al., 2009; Clarisse et al., 2011). It was designed for global observations of chemical species (such as ozone, sulfur dioxide, and carbon monoxide) with a vertical range covering the troposphere and the lower stratosphere. In the present study we used the daily IASI/MetOp-B carbon monoxide (CO) dataset, which is processed using the Fast Optimal Retrievals on Layers for IASI (FORLI) software (Hurtmans et al., 2012) and downloaded from the AERIS platform (https://iasi.aeris-data.fr/co, last access: 8 December 2023).
2.4 CAMS global reanalysis (EAC4)
The Copernicus Atmosphere Monitoring Service (CAMS) provides a global reanalysis (EAC4) dataset of atmospheric composition that covers 2003 to 2022 (Inness et al., 2019). This dataset was built on the knowledge gathered during the previous Monitoring Atmospheric Composition and Climate (MACC) reanalysis and the CAMS interim reanalysis. The CAMS reanalysis uses the ECMWF's Integrated Forecasting System (IFS) model to retrieve the total column of carbon monoxide (CO), tropospheric column of nitrogen dioxide (NO2), aerosol optical depth (AOD), and total column and partial column and profiles of ozone (O3) from satellites measurements (e.g. IASI, MOPITT, and TROPOMI for the CO and MODIS and VIIRS for the AOD). The reanalysis has a high horizontal resolution of 0.75° × 0.75° and provides more chemical species at a high temporal resolution (3-hourly analysis fields) than the previous CAMS interim reanalysis.
This dataset has already been used by Flamant et al. (2022) to describe the synoptic conditions over southern Africa in 2017. As reported by Langerock et al. (2024), the reanalysis data underestimate the AOD for some parts of southern Africa and Southern America. They showed that the modified normalized mean bias (MNMB) ranges from 0 % to −25 % in southern Africa. Langerock et al. (2024) compared IASI and reanalysis CO data and showed a negative bias over biomass burning regions in South America and southern Africa up to 30 %. In the present study, we used CAMS reanalysis at 12:00 UTC to describe the synoptic condition that favored transport during the events. We used AOD at 550 nm; the mixing ratio of CO (molecules cm−2); and the wind speed at 850, 500, 400, and 300 hPa. Additionally, to account for synoptic conditions during each event, geopotential height fields (meters) at 500 hPa and mean sea level pressure were used. The geopotential height is obtained by dividing the geopotential by the Earth’s gravitational acceleration, 9.80665 m s−2, which is a fixed value in the IFS model. Reanalysis data were downloaded from the Atmospheric Data Store (ADS) website (https://ads.atmosphere.copernicus.eu/, last access: 19 December 2023).
Figure 3a displays AOD at 500 nm (green line) and AE at 440–870 nm (purple line) recorded at Skukuza during the IOP. Daily average AOD and AE values in September and October 2022 are compared with a multiyear monthly average of the entire dataset (September and October 1998–2011 to 2016–2021). Monthly average values of AOD and AE lie in the 0.2–0.3 and 1.2–1.5 ranges, respectively, and reveal a decrease with time, suggesting a slowing down in biomass burning activity between early September and late October. These values are similar to those reported by Ranaivombola et al. (2023) during the austral spring (September to November). The daily AOD and AE values show the same trend as the multiyear monthly average values, except during the third week of September (from 18 to 23) and during the second week of October (from 9 to 17), where AOD and AE values increased and reached maximums of 0.7 and 1.9, respectively. Unfortunately, the photometers did not work on 20 and 21 September due to the rainy conditions.
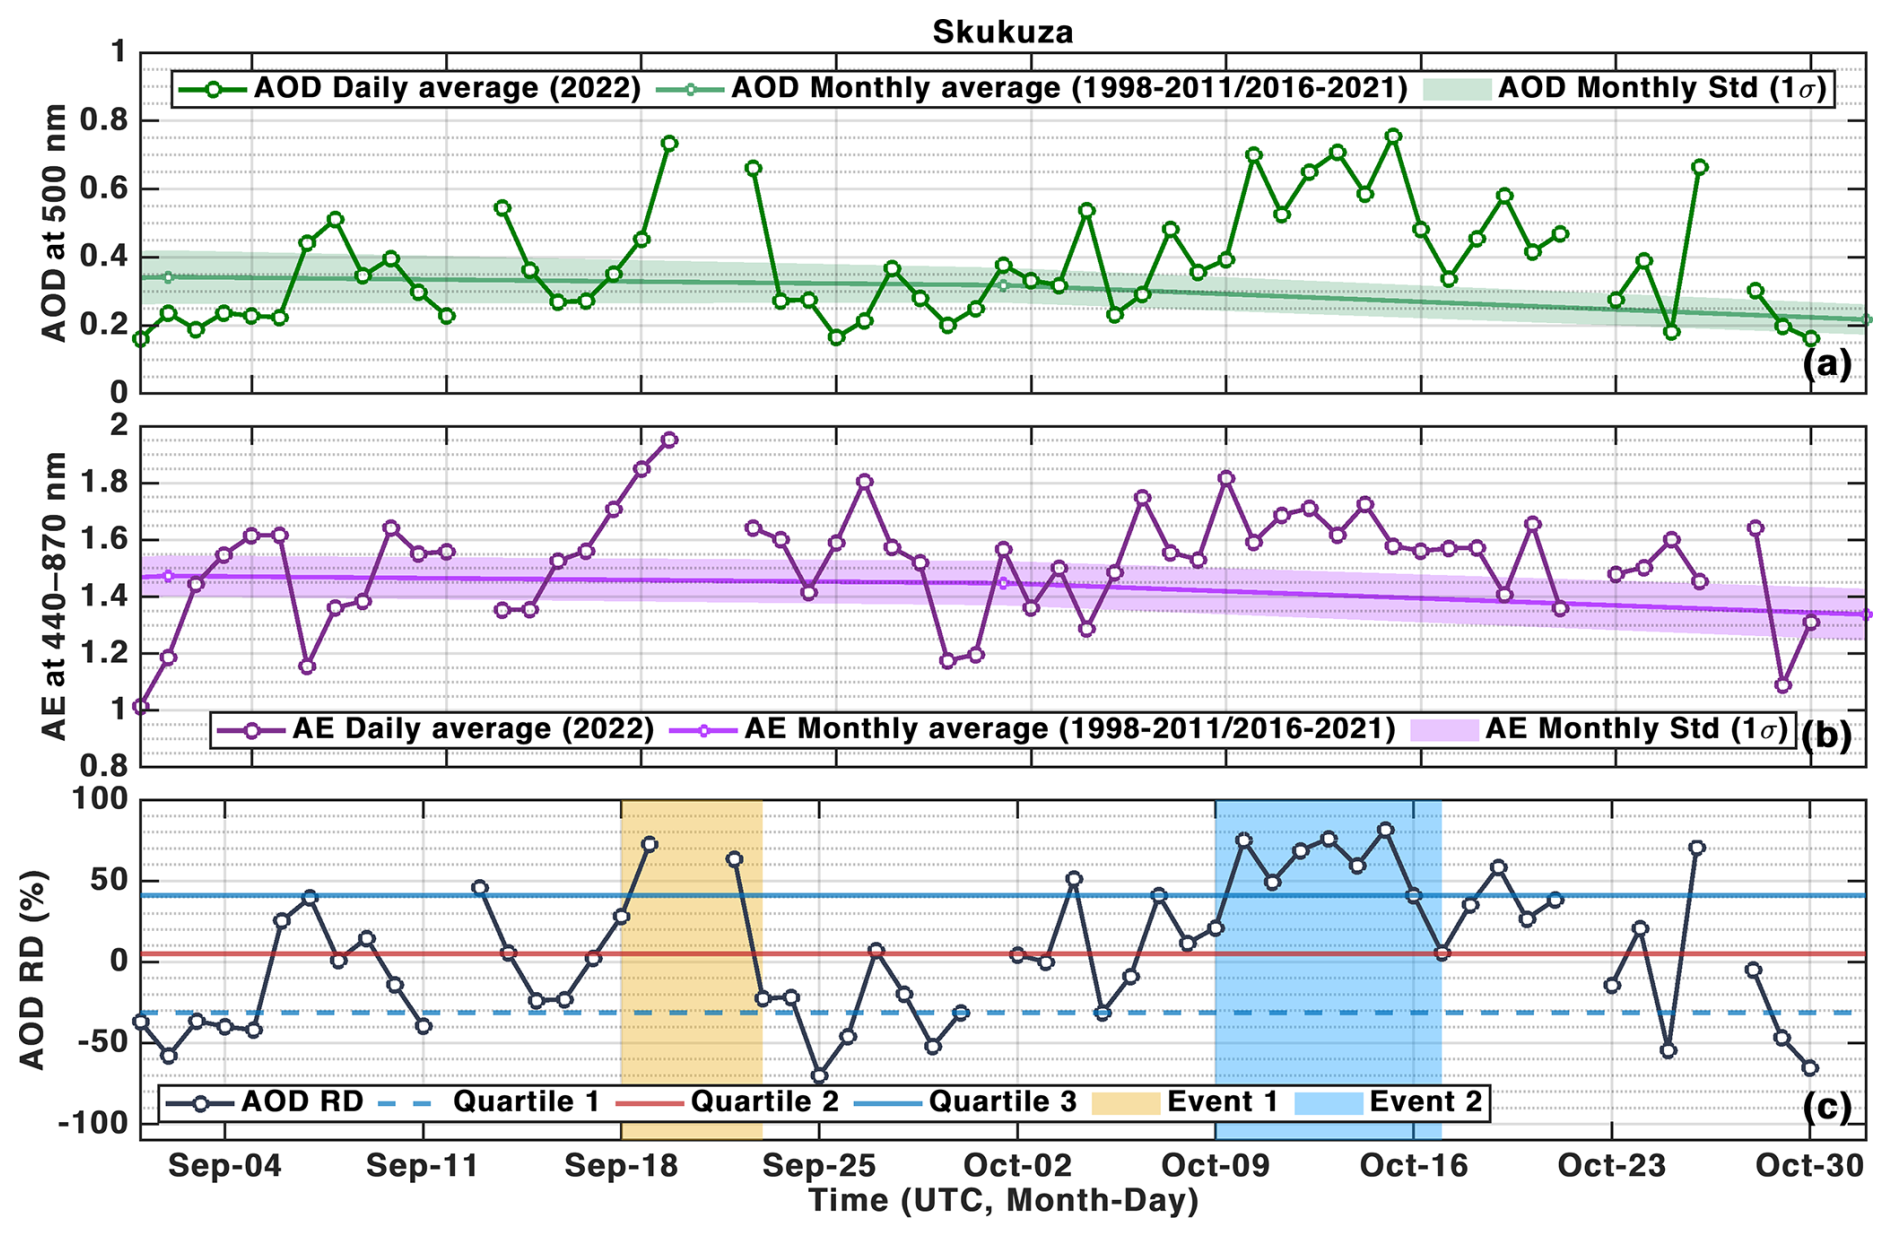
Figure 3Time series of AOD at 500 nm (green lines) and AE at 440–870 nm (purple line) over Skukuza (panels a and b, respectively). Colored lines represent daily 2022 observations, while lighter colored lines depict the multiyear monthly average values for the entire dataset. Shaded areas represent the ±1 standard deviation. Panel (b) shows the relative difference of AOD between the 2022 and multiyear monthly values (black solid line). The quartiles (Q1, Q2, and Q3) are represented, respectively, by the dashed blue line, the solid red line, and the solid blue line. The yellow and blue shaded regions highlight the two selected events (Event 1, 18 to 23 September, and Event 2, 9 to 17 October 2022).
To characterize the anomalies in aerosol loading over the study site, the quartiles Q1, Q2, and Q3 of the relative difference of the AOD (AODRD) were computed and correspond to the following equation:
where AODmm represents the monthly multiyear average AOD values of the whole dataset (1998 to 2021) before 2022 (Fig. 3b). At least two values of AODRD exceeding the Q3 line within a given period are considered high aerosol load events at ±1 d. Two aerosol events were thus identified during the IOP: Event 1, from 18 to 23 September, and Event 2, from 9 to 17 October, highlighted with yellow and blue shaded areas, respectively, in Fig. 3b.
In the following part, the two events are characterized in terms of different aerosol classification types. Figure 4 shows the aerosol type occurrence frequencies at Skukuza during the IOP (September and October) and during Events 1 and 2 and the austral spring 2022 period (called SON hereafter, for the September–October–November period). As mentioned above, the aerosol classification is carried out using three methods, on a bar plot between each parameter of AOD–AE (Fig. 4a), EAE–SSA (Fig. 4b), and FMF–SSA (Fig. 4c).
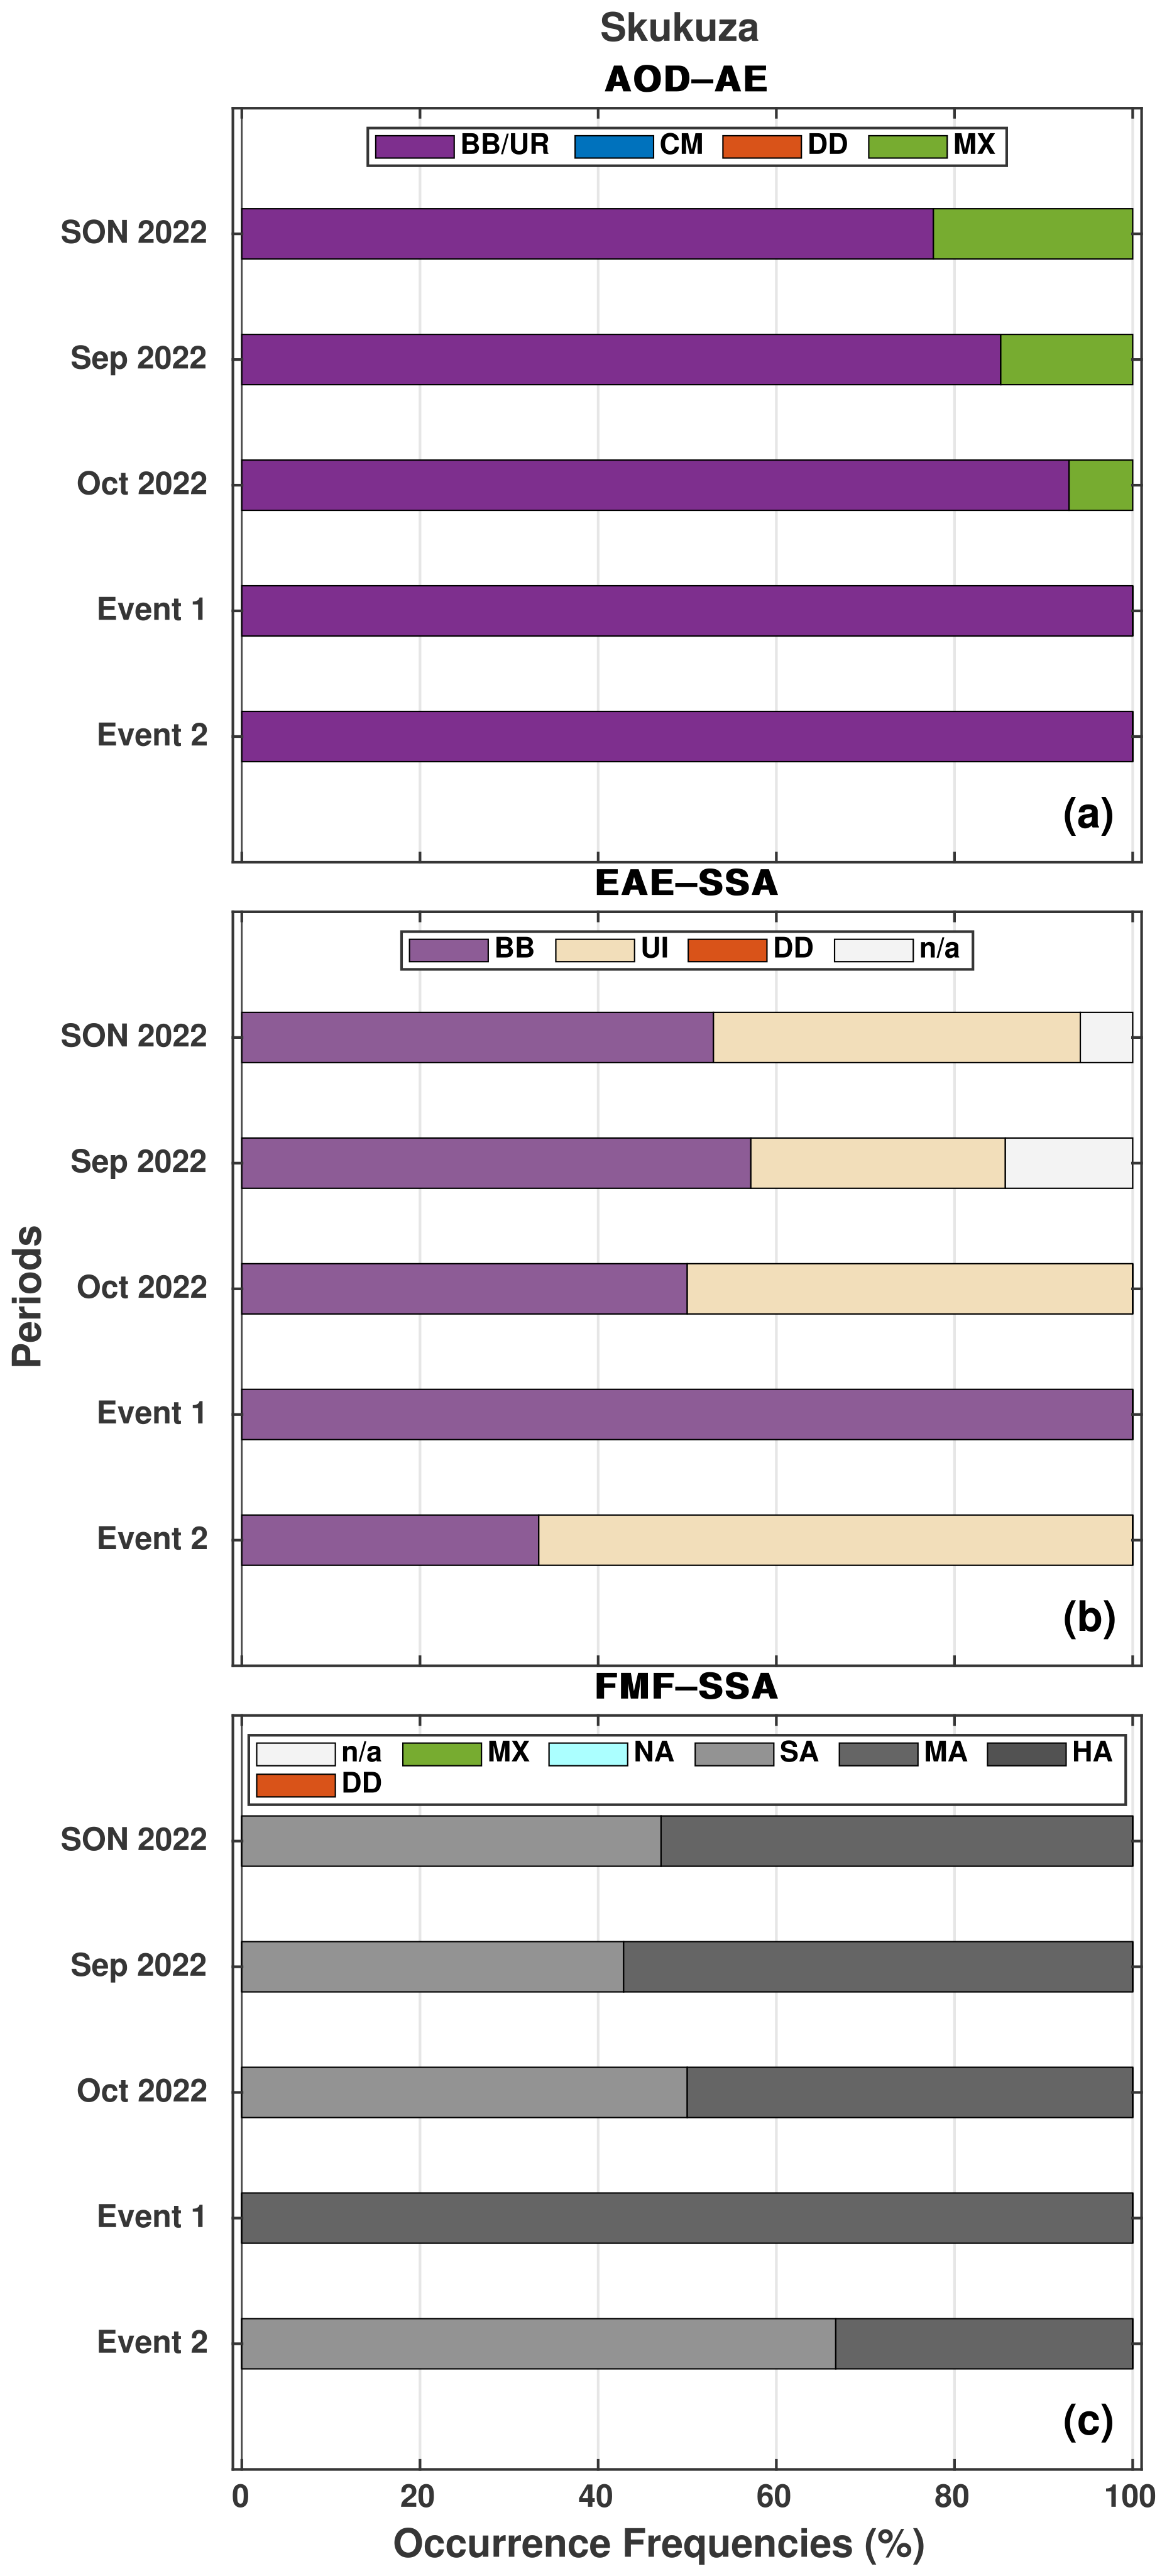
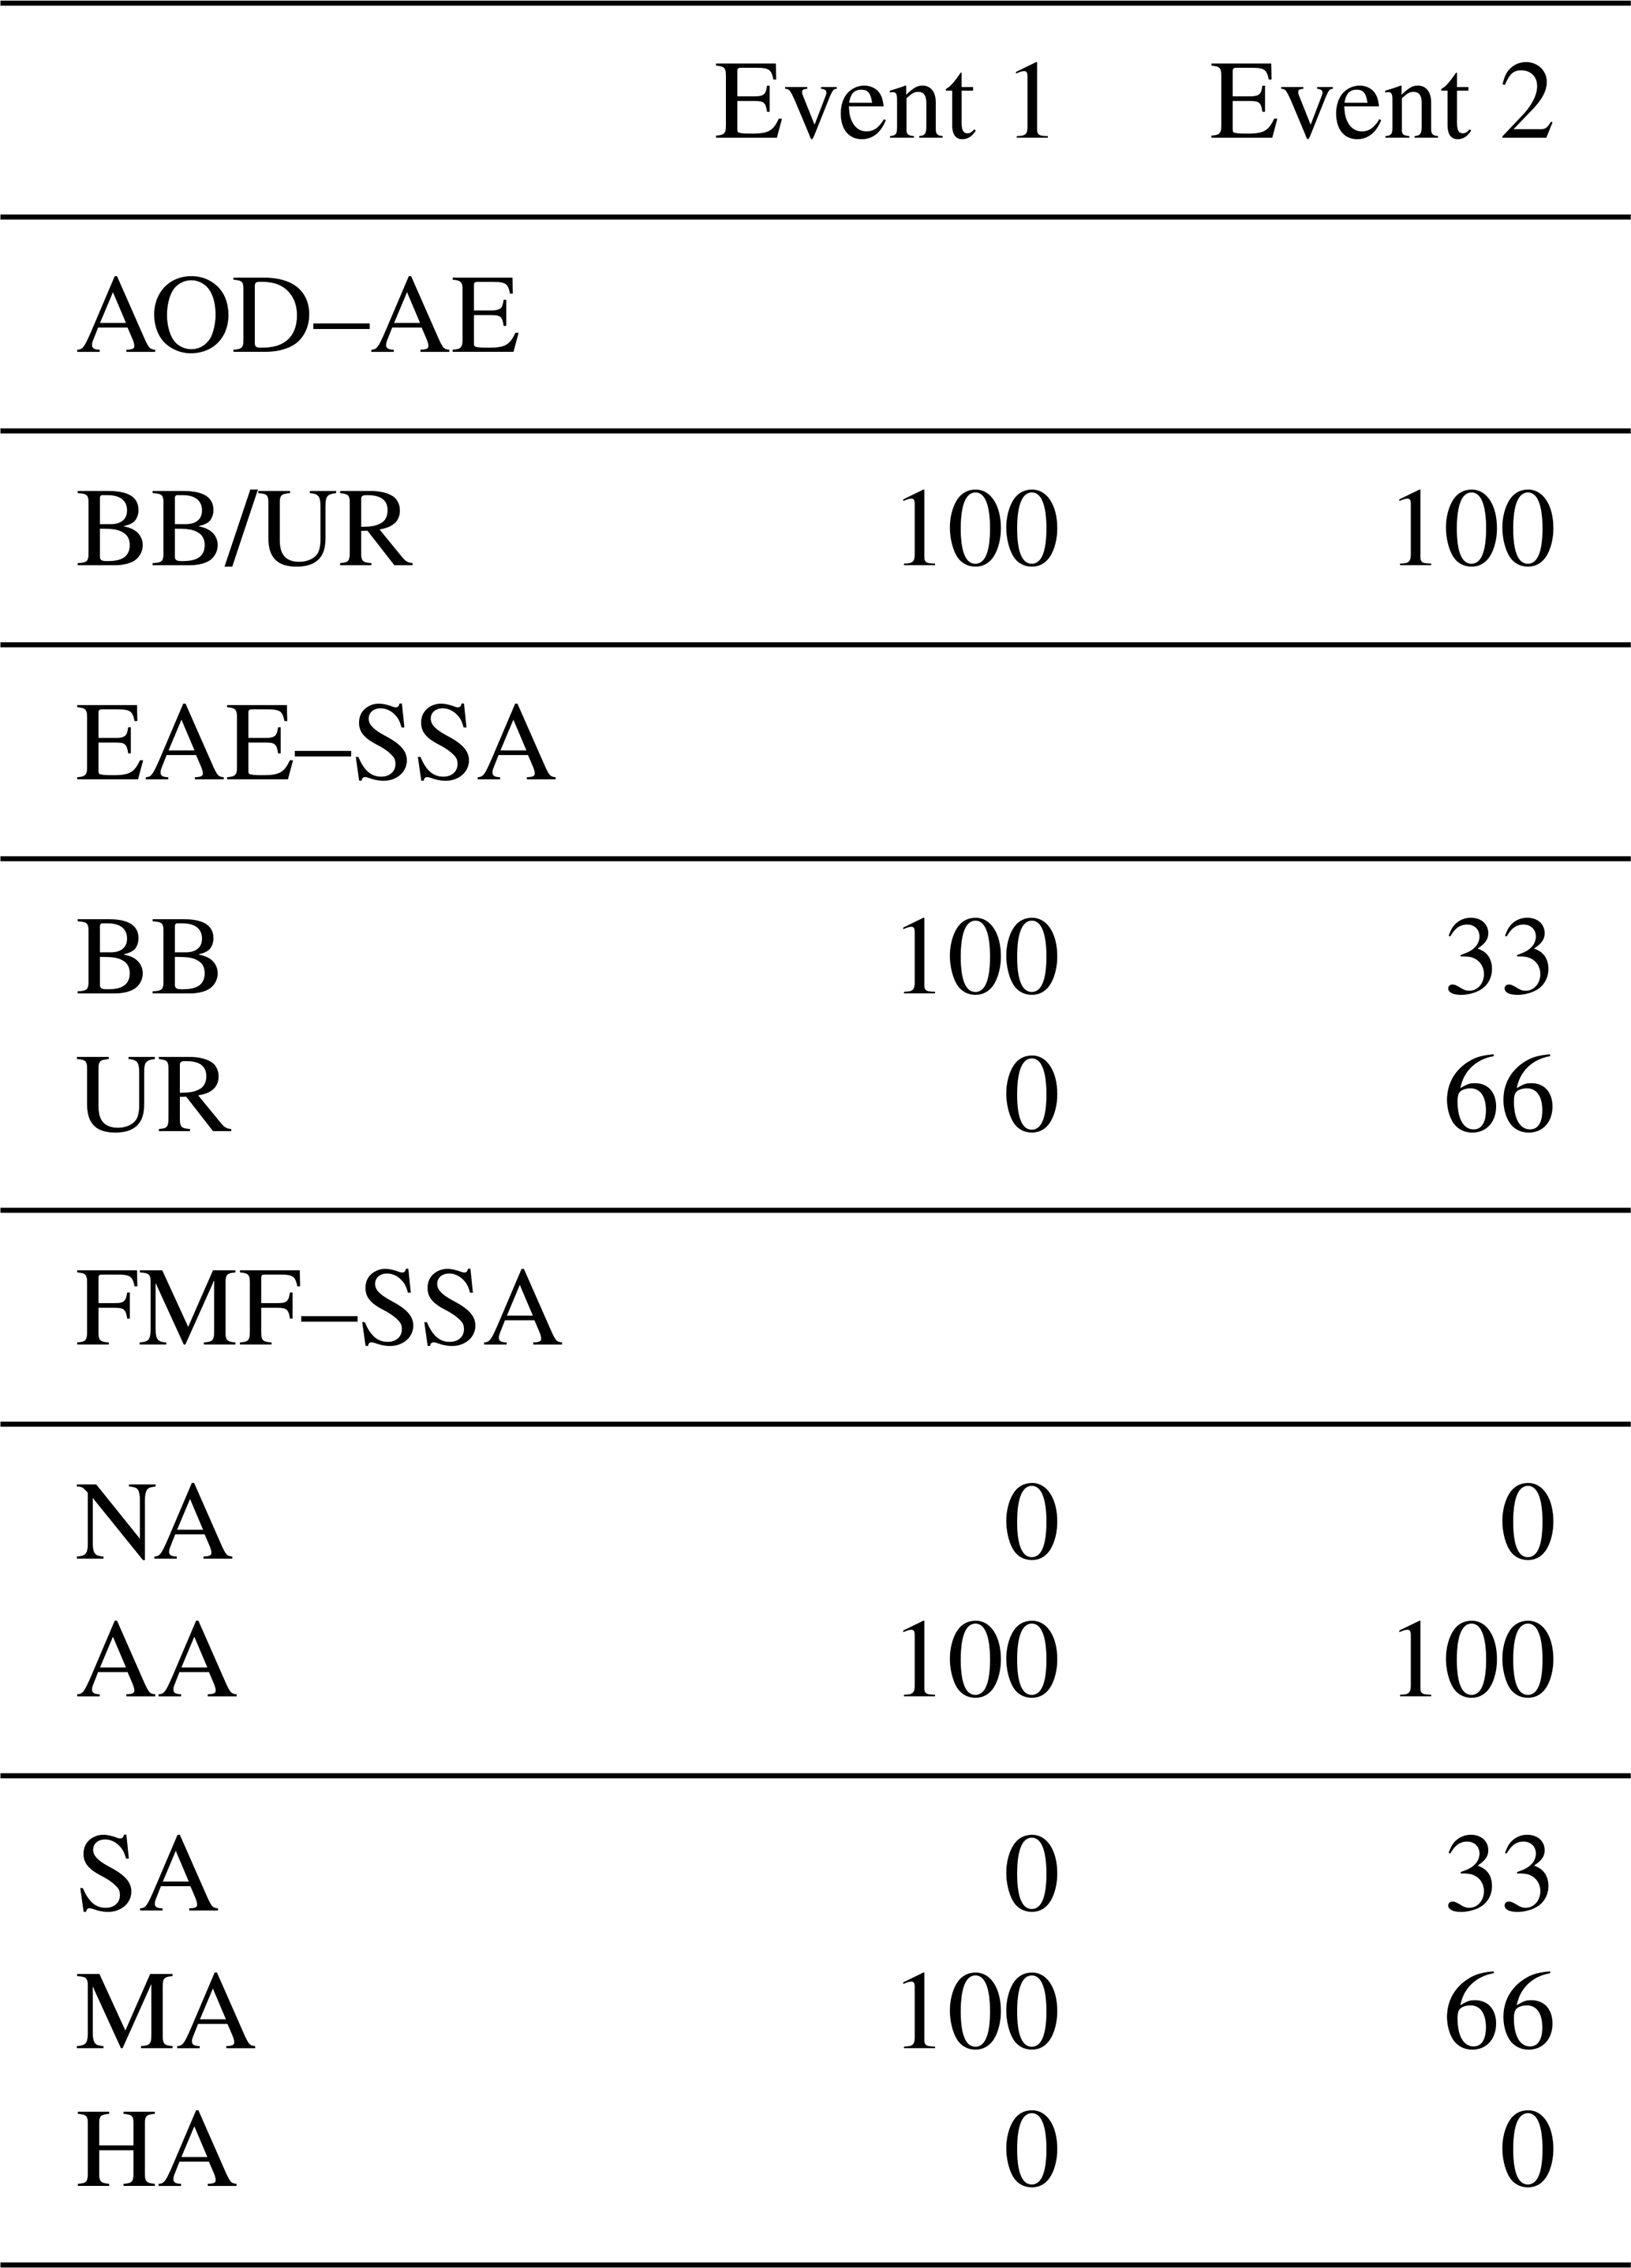
Figure 4Aerosol classification from sun-photometer observations at Skukuza during austral spring 2022 period (SON 2022), the IOP (September and October) and Event 1 and 2. Relative occurrence frequencies of each aerosol type, in percentage, are based on AOD–AE (a), EAE–SSA (b) and FMF–SSA (c) methods. Each color is associated with an aerosol type. AOD–AE method: clean marine (CM, in blue), biomass burning and urban industrial (BB/UR, in purple), desert dust (DD, in orange), and mixed type (MX, in green). EAE–SSA method: biomass burning (BB, in light purple), urban industrial (UR, in beige), desert dust (DD, in orange), and uncertain (n/a, in white). FMF–SSA method: uncertain (n/a, in white), mixed type (MX, in green), non-absorbing (NA, in light blue), slightly absorbing (SA, in light gray), moderately absorbing (MA, in middle gray), highly absorbing (HA, in dark gray), and desert dust (DD, in orange).
Based on the AOD–AE method, Skukuza exhibits higher frequencies for the biomass burning and urban industrial (BB/UR) type (85 %) than for the mixed (MX) type (14 %) during SON (Fig. 4a). The other types are absent for both months. These values agree with those obtained by Ranaivombola et al. (2023) during austral spring. Complementing this first classification, the EAE–SSA method allows us to complete the distinction between biomass burning (BB) and urban/industrial (UR) aerosols. BB aerosols predominate against the UR type at Skukuza during the SON period (61 % against 30 %, Fig. 4b). An undetermined category (labeled n/a) corresponding to aerosol which does not fit in any category represents 8 %. The FMF–SSA method allows us to have more information on the absorbing and non-absorbing aerosols. The absorbing aerosols category, regrouping absorbing aerosols including slightly, moderately, and highly absorbing (SA, MA, and HA), prevails during the SON period, with frequencies of 98.3 % (Fig. 4c). In this category, aerosol is moderately and slightly absorbing, where MA and SA types account for 63.6 % and 33 %, respectively. The results found at Skukuza with this latter method are consistent with those reported by Lee et al. (2010). The same maximum frequencies are observed in the September and October period. The BB/UR and MX types appear to be predominating, with values of up to 80 % and 2 %–12 %, respectively (Fig. 4a). BB types predominate at Skukuza in comparison with UR (58–60 against 30 %, Fig. 4b). The AA type represents the highest frequencies, with values of 98 %, where MA prevails with frequencies from 57 % to 63 % (Fig. 4c).
Looking at Events 1 and 2, BB/UR predominates at 100 % for both events (Fig. 4a). Based on the EAE–SSA method, the BB type prevails at Skukuza for both events with frequencies from 59 % to 85 % (Fig. 4b). With the FMF–SSA method, the AA type (MA and SA) is predominant for both events, with frequencies from 99.5 % to 100 % (Fig. 4c).
To summarize the aerosol classification over Skukuza with the three methods, the BB/UR aerosol type prevails over other types during the IOP and during the two events as well (see Table 1). Using the SSA with other inversion parameters, we have determined that the BB aerosol type prevails, and aerosols are moderately absorbing.
Table 1Summary of relative occurrence frequencies of predominant aerosol type from sun-photometer observations at Skukuza during the IOP, during Event 1 and 2. Relative occurrence frequencies are in percentage and based on AOD–AE, EAE–SSA, and FMF–SSA methods.
With the sun photometer, we determined two anomalies of AOD with aerosol types that are mainly BB aerosols linked to biomass burning over southern Africa. In the following section, the transport and the vertical distribution of the biomass burning plume are investigated for both events.
To characterize air mass transport, MODIS satellite observations of aerosol optical depth (AOD) over southern Africa were used. Additionally, CO measurements from IASI were employed to monitor biomass burning plumes. The CO is generated during the incomplete combustion of carbon compounds. It is one of the main pollutants emitted into the atmosphere by biomass burning activity. Given its lifetime (from weeks to months), it is often used as a tracer of biomass burning plume transport (Bencherif et al., 2020).
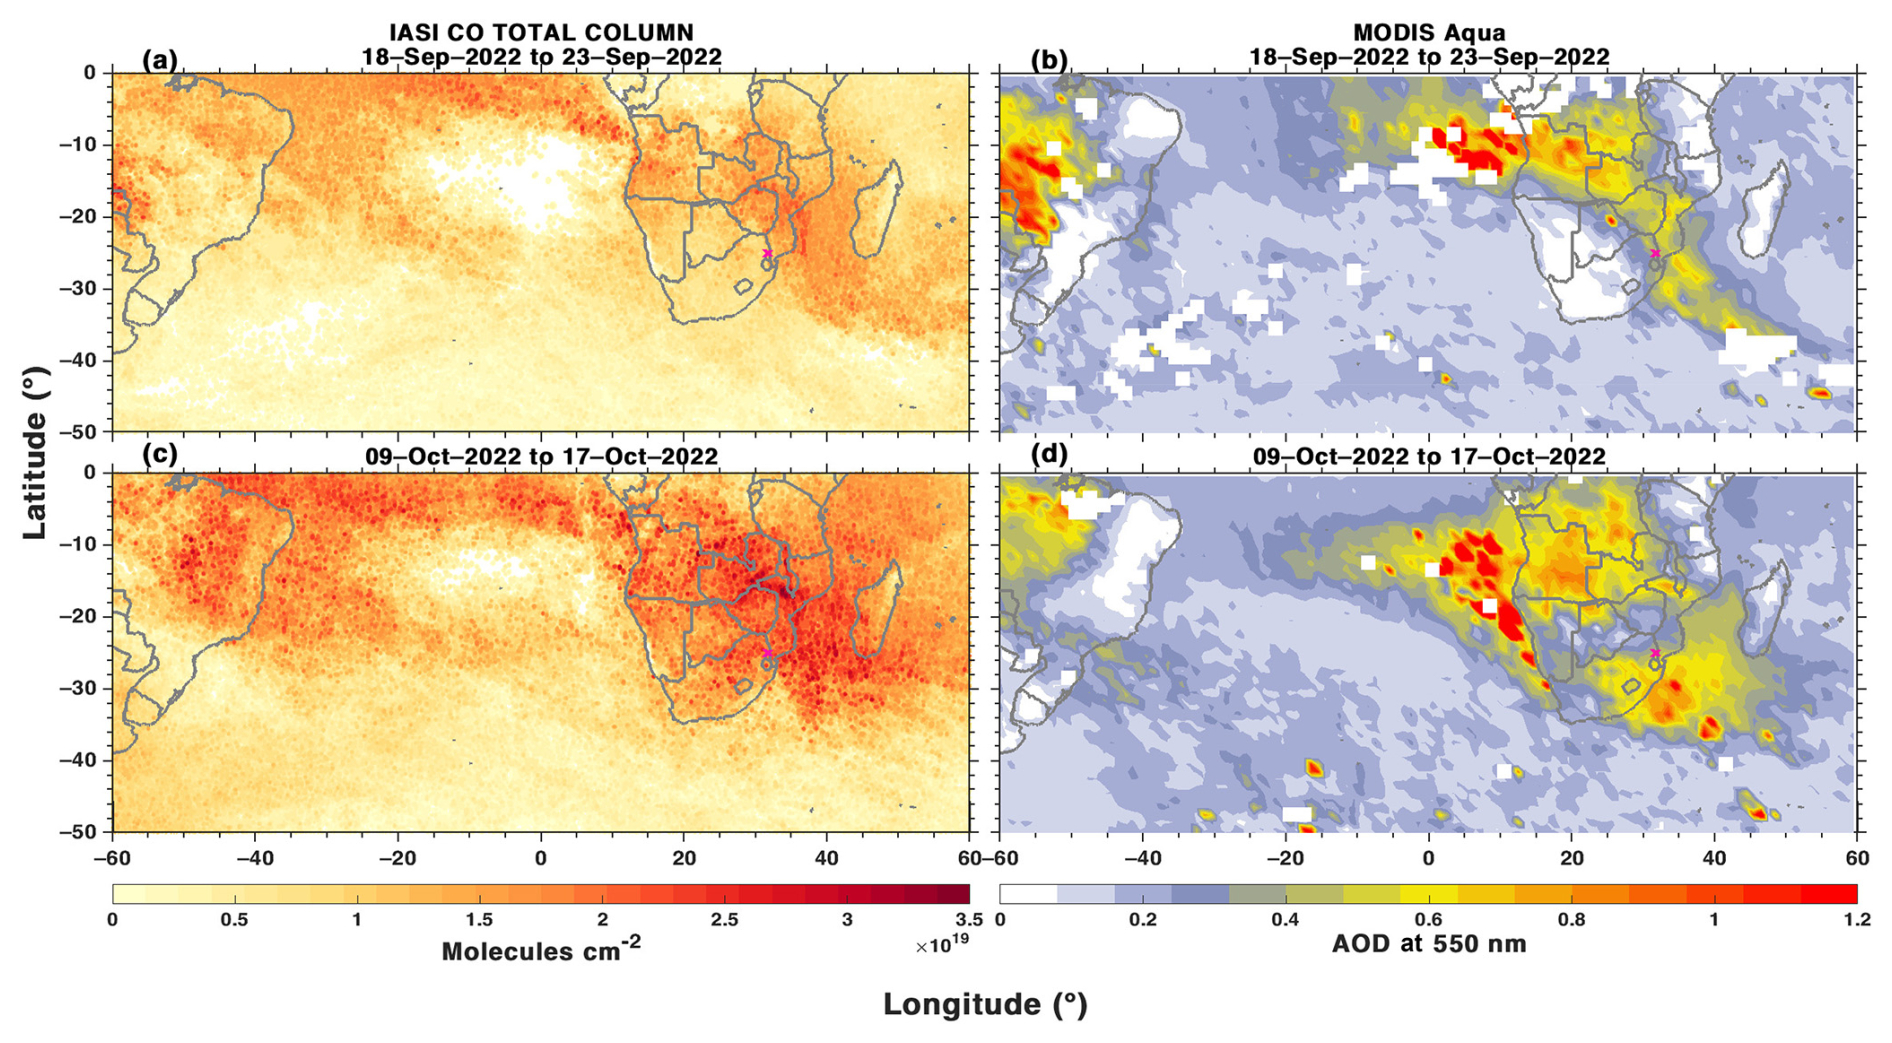
Figure 5Average map of total column of CO (a, c) from IASI and AOD at 550 nm from MODIS-Aqua (b, d) over southern Africa and the eastern part of South America. Panels (a) and (b) correspond to an average over Event 1, while panels (c) and (d) correspond to that over Event 2. Note that the blank area in panels (b) and (d) could correspond to cloud contamination.
Figure 5 displays averaged maps of the total column of CO and AOD at 550 nm during the two events (panels a and b for Event 1, panels c and d for Event 2), based on satellite observations from IASI and MODIS-Aqua. The CO maps show high values over southern Africa, mainly over the latitude band −5 to −25°, as well as the center of Brazil (Fig. 5a and c). The CO plume spreads across the southern Africa west coast, reaching the Atlantic Ocean and the eastern part of southern Africa. The center of Brazil also has a CO plume that extends to the Atlantic Ocean. From the CO maps, it is evident that the mixing of plumes from southern Africa and South America takes place in CO values over the Atlantic Ocean. The CO plume propagates thereafter towards the SWIO basin over the eastern part of southern Africa. AOD maps show similar structure between aerosol and CO plumes (Fig. 5b and d). The aerosol plumes spread over the Atlantic Ocean, over the SWIO basin, and from the center of Brazil to the Atlantic Ocean. The similarities between the structures of the CO and AOD plumes suggest that the AOD values are the result of biomass burning. Although the main structures are the same, there are differences between the areas of CO and AOD maxima. High CO concentrations are observed in the latitude band from 0 to −10° over the Atlantic, which is not the case for AOD. The maximum of AOD over the western coast of southern Africa seems to correspond to CO minima and/or missing CO data. The shape of the plume toward the SWIO basin differs noticeably between Event 1 and Event 2. During Event 1, the plume crossed Mozambique and reached the SWIO basin, while during Event 2, the plume crossed a larger portion of the eastern coast of southern Africa, spanning Mozambique and South Africa. The variation in CO and AOD values over the Western Cape province (South Africa) between the events is noteworthy. During Event 1, CO concentrations and AOD were found to be low, 0.5 to 1 molecules cm−2 and 0.2, respectively, reaching 2.5 molecules cm−2 and 0.4 to 0.5. More globally, during Event 2 these values were found to be higher. The shape of the CO and AOD plumes obtained during Event 1 looks similar to the so-called “river of smoke” phenomena reported in previous works during SAFARI-2000 on 2 September 2000 (Swap et al., 2003; Stein et al., 2003) and the AEROCLO-sA campaign from 2 to 6 September 2017 (Chazette et al., 2019; Flamant et al., 2022).
In order to analyze the vertical distribution, Fig. 6 shows the daytime and nighttime profiles of the elevated smoke aerosol extinction coefficient, measured by CALIOP over the Mozambique Channel (panel e), for each of the events. These profiles are compared to the multiyear average profile for September and October, calculated for the period 2006–2021, respectively. These average profiles are obtained using CALIOP Level 3 products. The September and October averages show a maximum of the extinction coefficient around 2.5 km. During Event 1, the profiles extend from the surface to 6–7 km. The nighttime profiles show a maximum of the extinction coefficient at between 3 and 4.5 km in altitude, whereas for the daytime profiles, the maxima are between 2 and 3 km. For Event 2, aerosol nighttime profiles range from 1 to 10 km, with maxima between 4 and 6 km. The daytime profiles are within the standard deviation of the mean profile. The only notable exception is on 9 October (13:00 UTC), where a maximum is observed around 5 km. The same trend can be observed as for Event 1, where nighttime profiles show higher altitude maxima than daytime profiles. Thus, in general, the aerosol layers from biomass fires with CALIOP range from 1–6 km during Event 1 and from 1–10 km during Event 2.
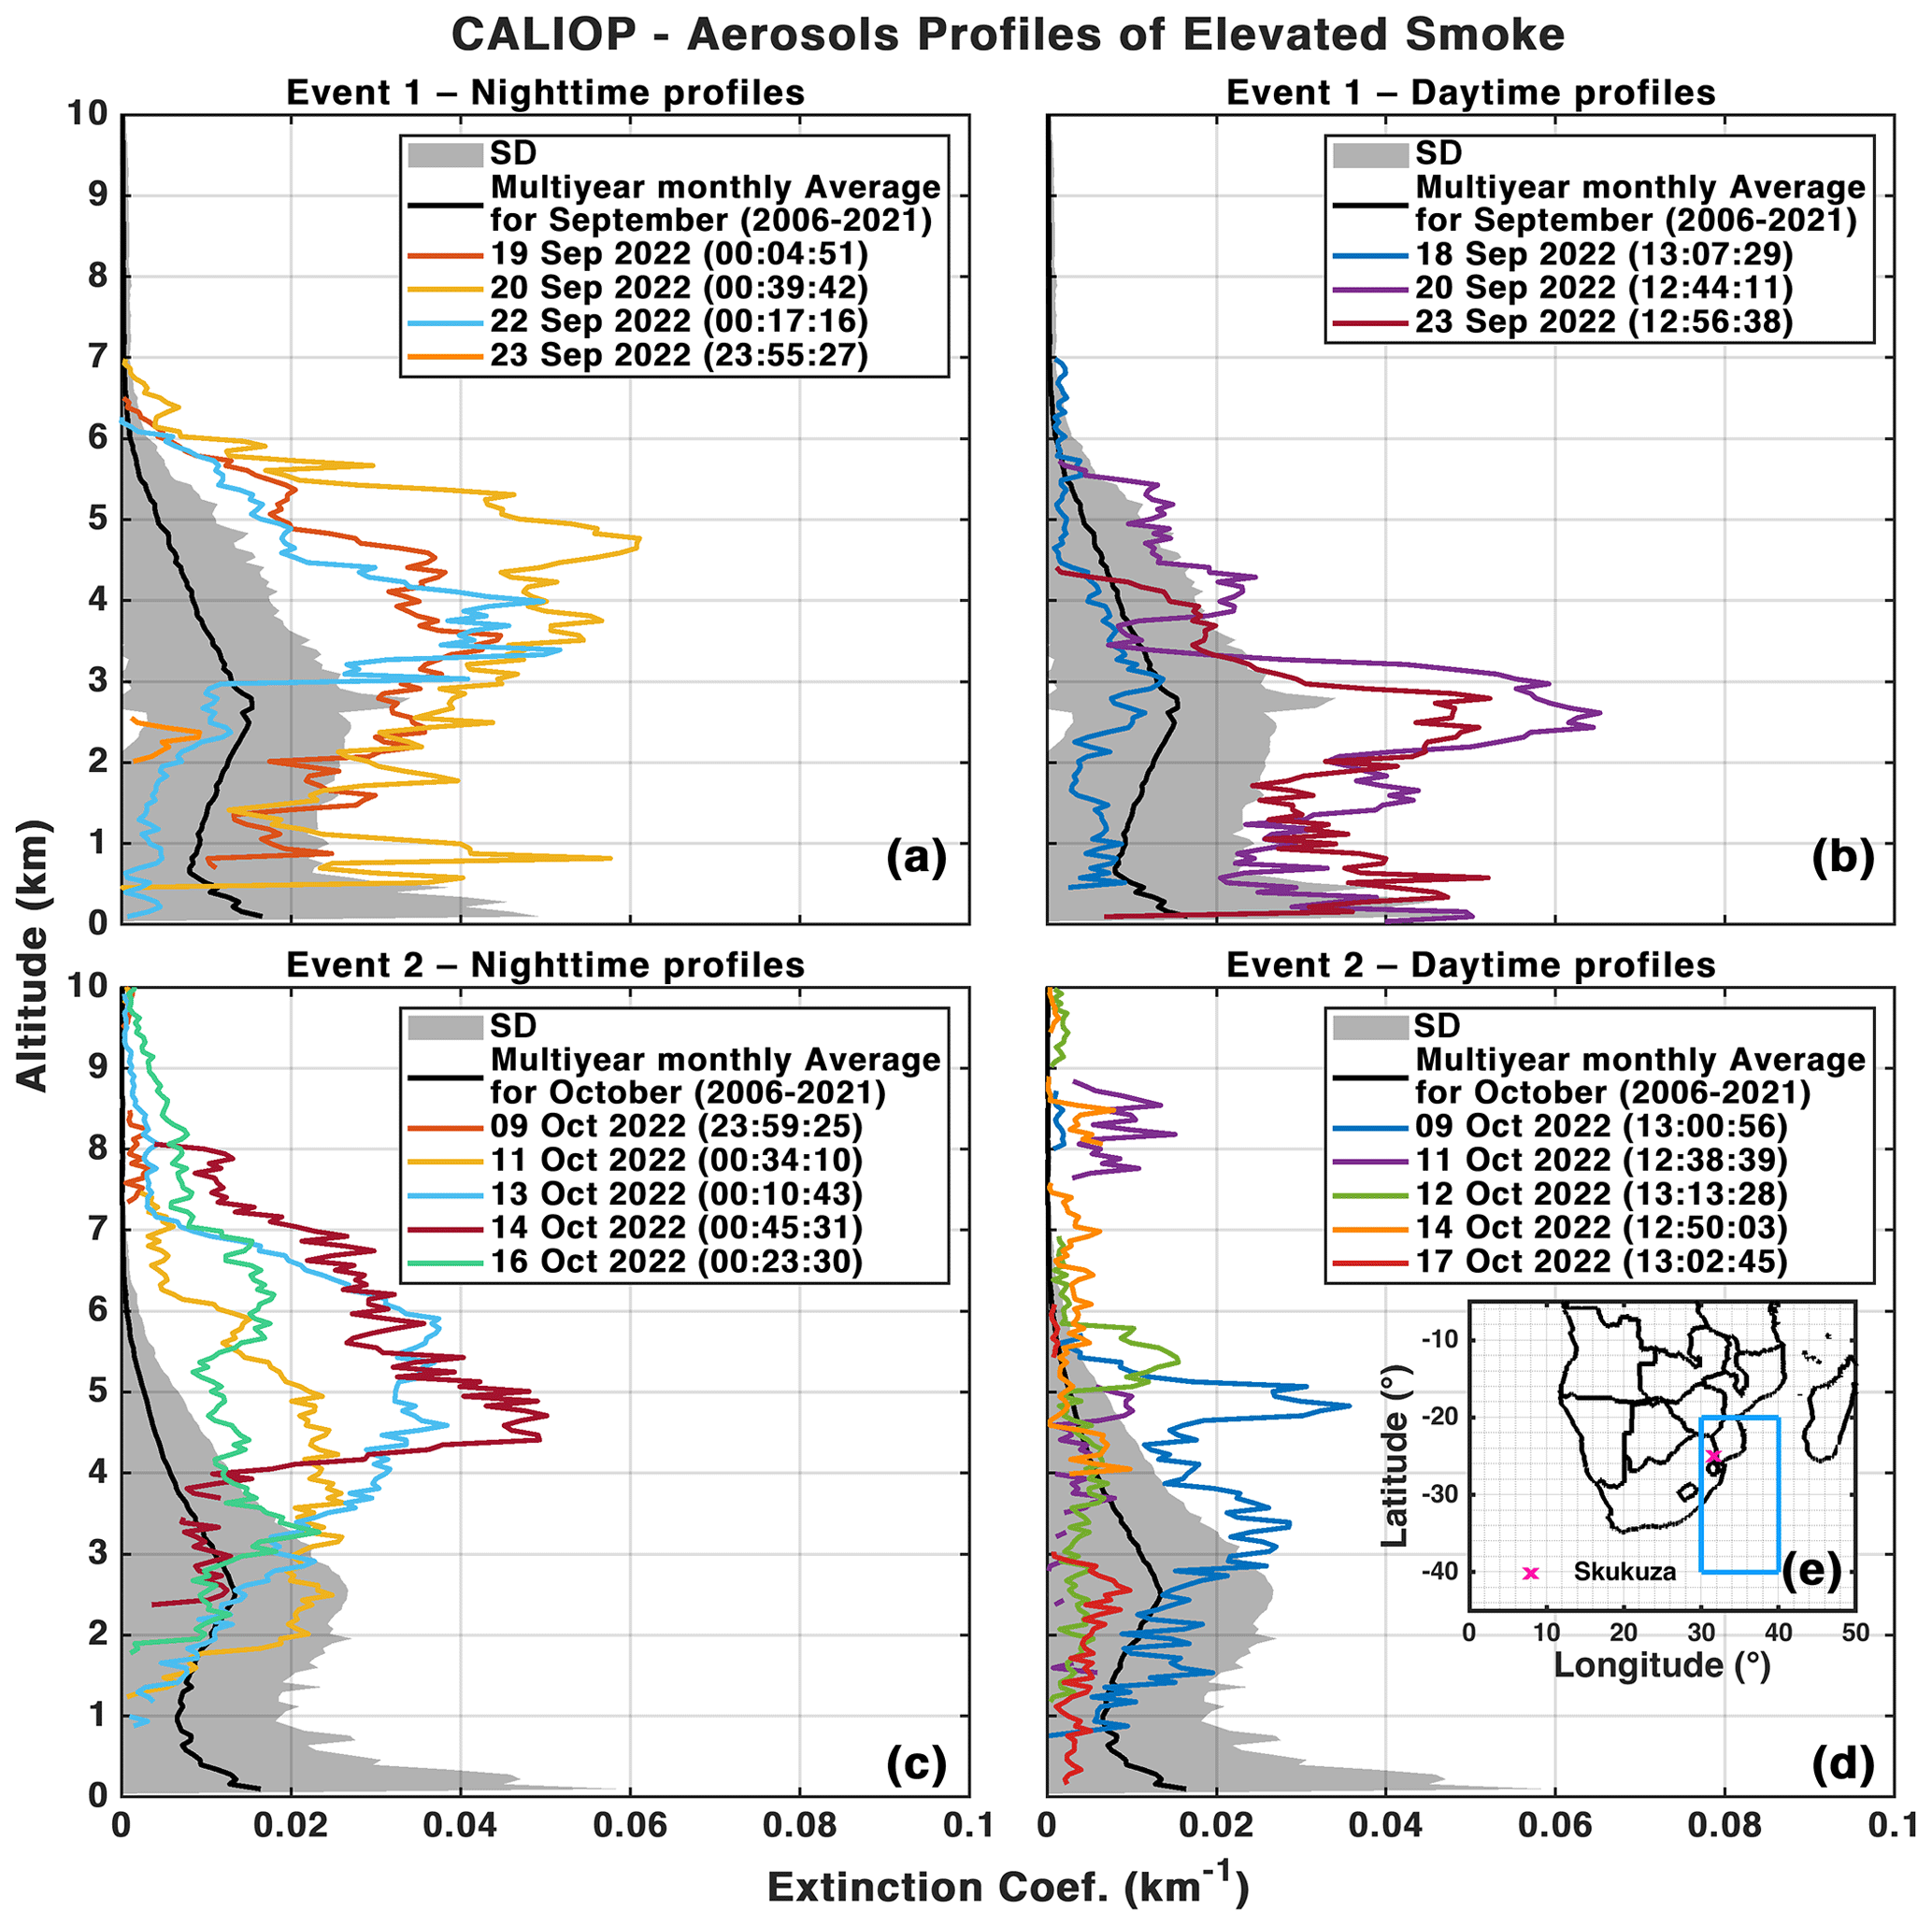
Figure 6Extinction coefficient profiles of elevated smoke aerosols measured by CALIOP during the IOP over the Mozambique Channel (e), for Event 1 (a, b) and Event 2 (c, d), respectively, during the day and night. The profiles (in color) are compared to the monthly profile averaged over the entire dataset (2006–2021, in black and ±1σ in gray).
Both aerosol and CO peak events observed in the Mozambique Channel region during the IOP combine ingredients as locally produced aerosols, regional transport from the African continent, and intercontinental transport from South America, which will be described in the following sections.
4.1 Regional and intercontinental transport – Event 1: 18 to 23 September 2022
Maps and profiles of aerosols during Event 1 (Figs. 5 and 6) suggest the occurrence of biomass burning activity from 18 to 20 September in the African and South American continents. Figure 7 depicts the fire radiative power (FRP) values from MODIS-Aqua from 18 to 22 September. The Africa biomass burning activity was in the latitude band −10 to −25° (Angola, Zambia, Zimbabwe, and Mozambique) and is associated with moderate values of FRP from 20 to 50 MW. Some locations show high FRP from 60 to 100 MW, such as the southeastern part of Angola or the central part of Mozambique on 20 September. The South America biomass burning activity is concentrated in two cells, one centered in the northeast region of Brazil and another that extends from the extreme west of Brazil, passing through Bolivia, Paraguay, and northern Argentina.
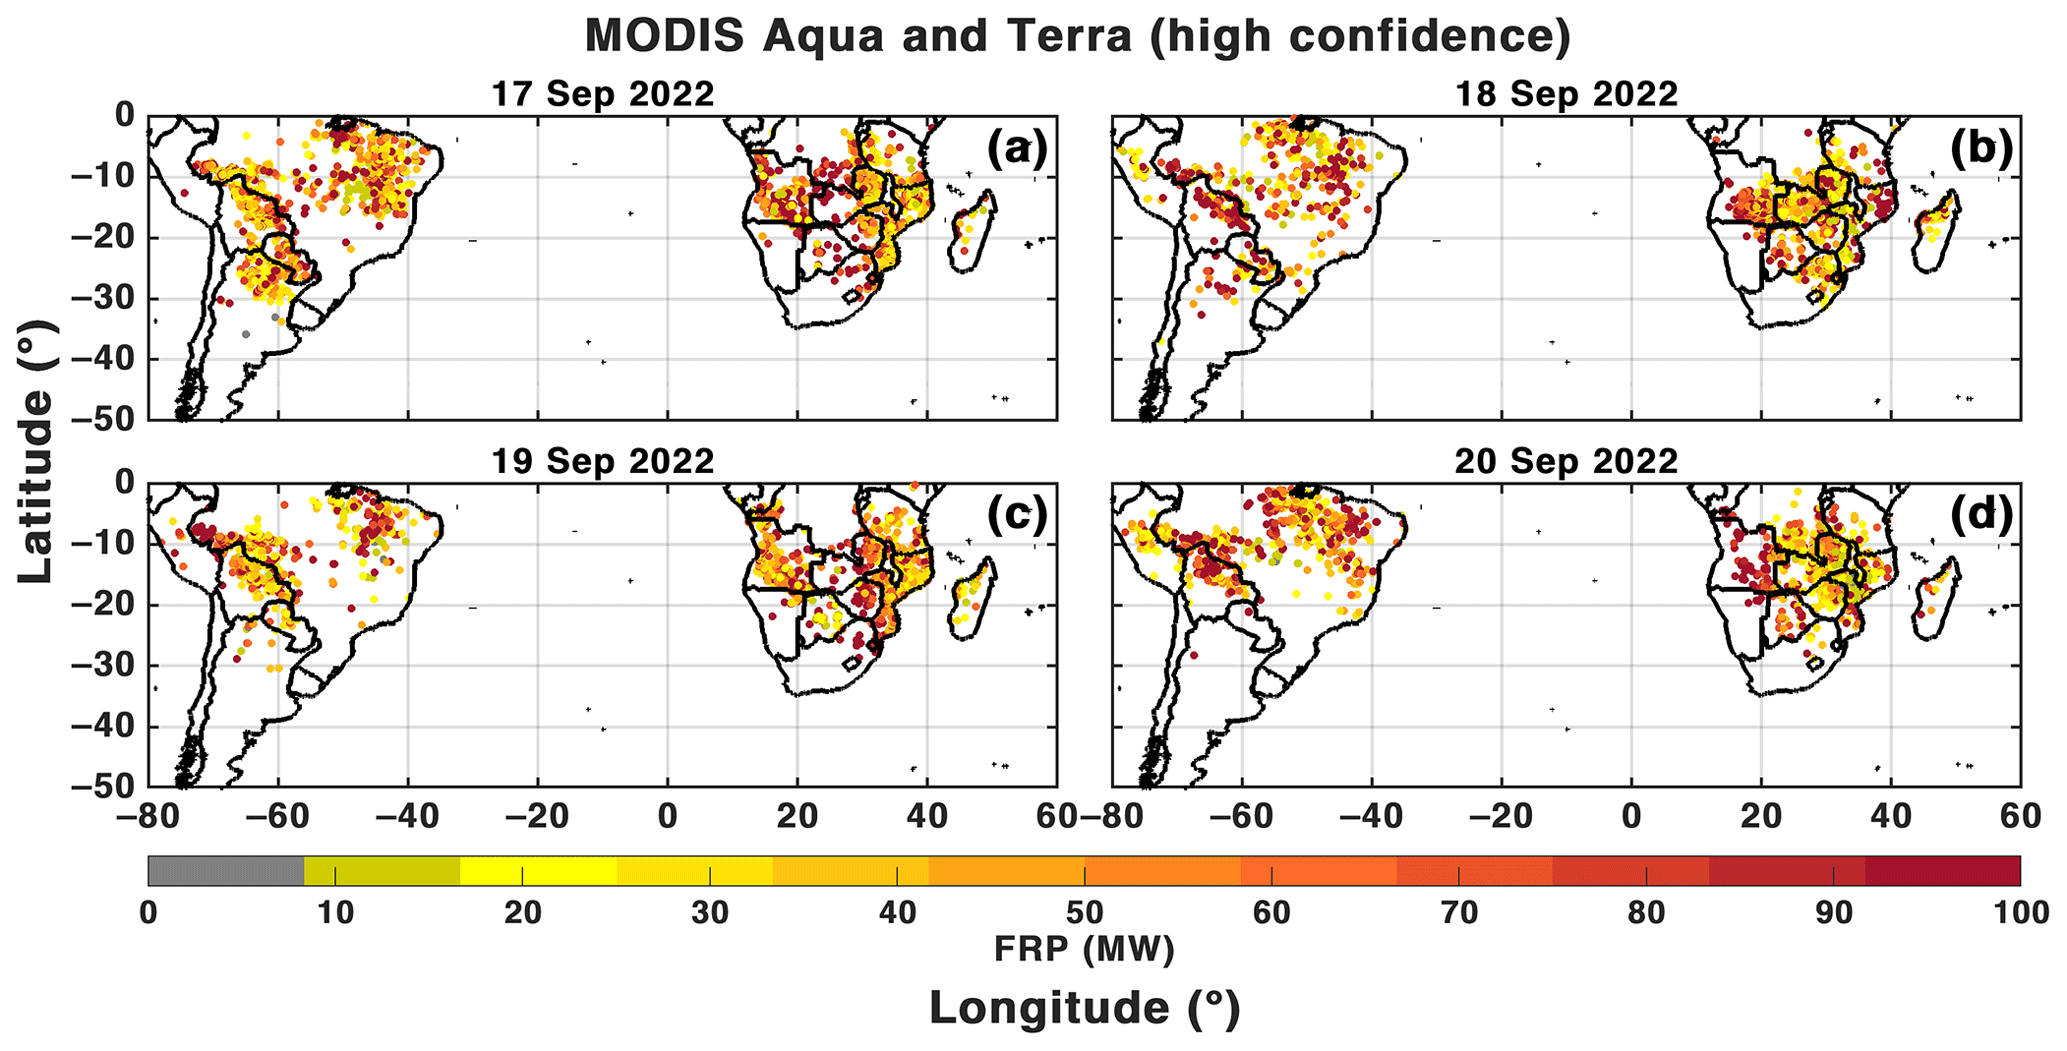
Figure 7Fire radiative power (FRP in MW) over southern Africa and South America from 17 to 20 September.
The aerosol peak event is associated with short- and long-range transport over the north and center of Argentina (Mulena et al., 2024) and the southern part of the African continent. This transport is directly related to dynamic processes in the atmosphere that involve the propagation of baroclinic waves (Ndarana et al., 2020). Baroclinic waves may exhibit either cold or warm fronts, which form in regions of flow deformation between two areas of high pressure and two areas of low pressure, such as saddle points (Hoskins and Heckley, 1981).
To analyze the synoptic conditions that favor the transport of aerosol and CO, Fig. 8 overlays the total cloud cover together with mean sea level pressures (panels a–d) and AOD at 550 nm overlays winds at 850 hPa (panels e–h) from the CAMS reanalysis during Event 1. Additionally, a 3-hourly animation of CAMS AOD is available as a video supplement (https://doi.org/10.5446/67052, Ranaivombola, 2024a). On 17 September (Fig. 8a), a broad saddle point (i.e., neutral point between two high-pressure and two low-pressure systems) is observed, extending from central Africa to the Atlantic and Pacific oceans, where low-pressure supports a cold front over southern South Africa. Simultaneously, an extratropical cyclone is embedded in the western edge of the elongated South Atlantic Subtropical High (Sun et al., 2017), forming a broad cloud band associated with a frontal system. This system extends from southeastern Brazil (20° S, 40° W) in its cold branch to the southwest coast of South Africa in its warm branch, where it connects with the South African cold front. Wind fields at 850 hPa highlight the transport of aerosols over southern Africa. This level was chosen based on the mean altitude of biomass burning aerosols from CALIOP observations (Fig. 6). Figure 8b shows wind convergence at 850 hPa toward two cyclonic circulation centers, where temperature, moisture, and the aerosol plume are transported via the low-level jet stream (Jones et al., 2023). This atmospheric dynamic favors the formation of the “river of smoke”, which passes over Zambia and northern Angola, carrying moderate (0.6–0.8) to high AOD values (0.8–1.2) to southern Namibia and South Africa and between southeastern Brazil and the adjacent Atlantic. Between 18 and 19 September, the Atlantic low-pressure system (in red) intensified southeastward and “broke” the high-pressure cell (Fig. 8b, c). By 19 September, the high-pressure system resumed a circular shape (Fig. 8c) and, between 19 and 20 September, elongated over the African continent, allowing the cold front to move toward the Mozambique Channel (Fig. 8d). The aerosol plume followed the low-pressure system toward the polar regions (Fig. 8f–g), moving between northeastern South Africa and central Mozambique, as indicated by wind speeds and AOD values (Fig. 8h). The strengthening prefrontal winds intensified aerosol concentrations as air masses passed through source regions. After the passage of the front precipitation “washed” the atmosphere, aerosol levels were reduced (Arshinova et al., 1996). Weather reports at Skukuza (not shown) confirmed rainfall on 20 and 21 September, with 6.6 and 8.61 mm, respectively, corresponding to reduced AOD values (Fig. 3). However, the observed AOD peak cannot be solely attributed to regional transport from central Africa. The connection between the warm branch of the South American frontal system and the cold branch of the South African system on 17 September (Fig. 8a) suggests South American aerosol influence in the Mozambique Channel. Warm air advection over cooler air in a frontal system follows baroclinic wave propagation, transporting mass and energy through geopotential disturbances such as ridges and troughs (Ndarana et al., 2023).
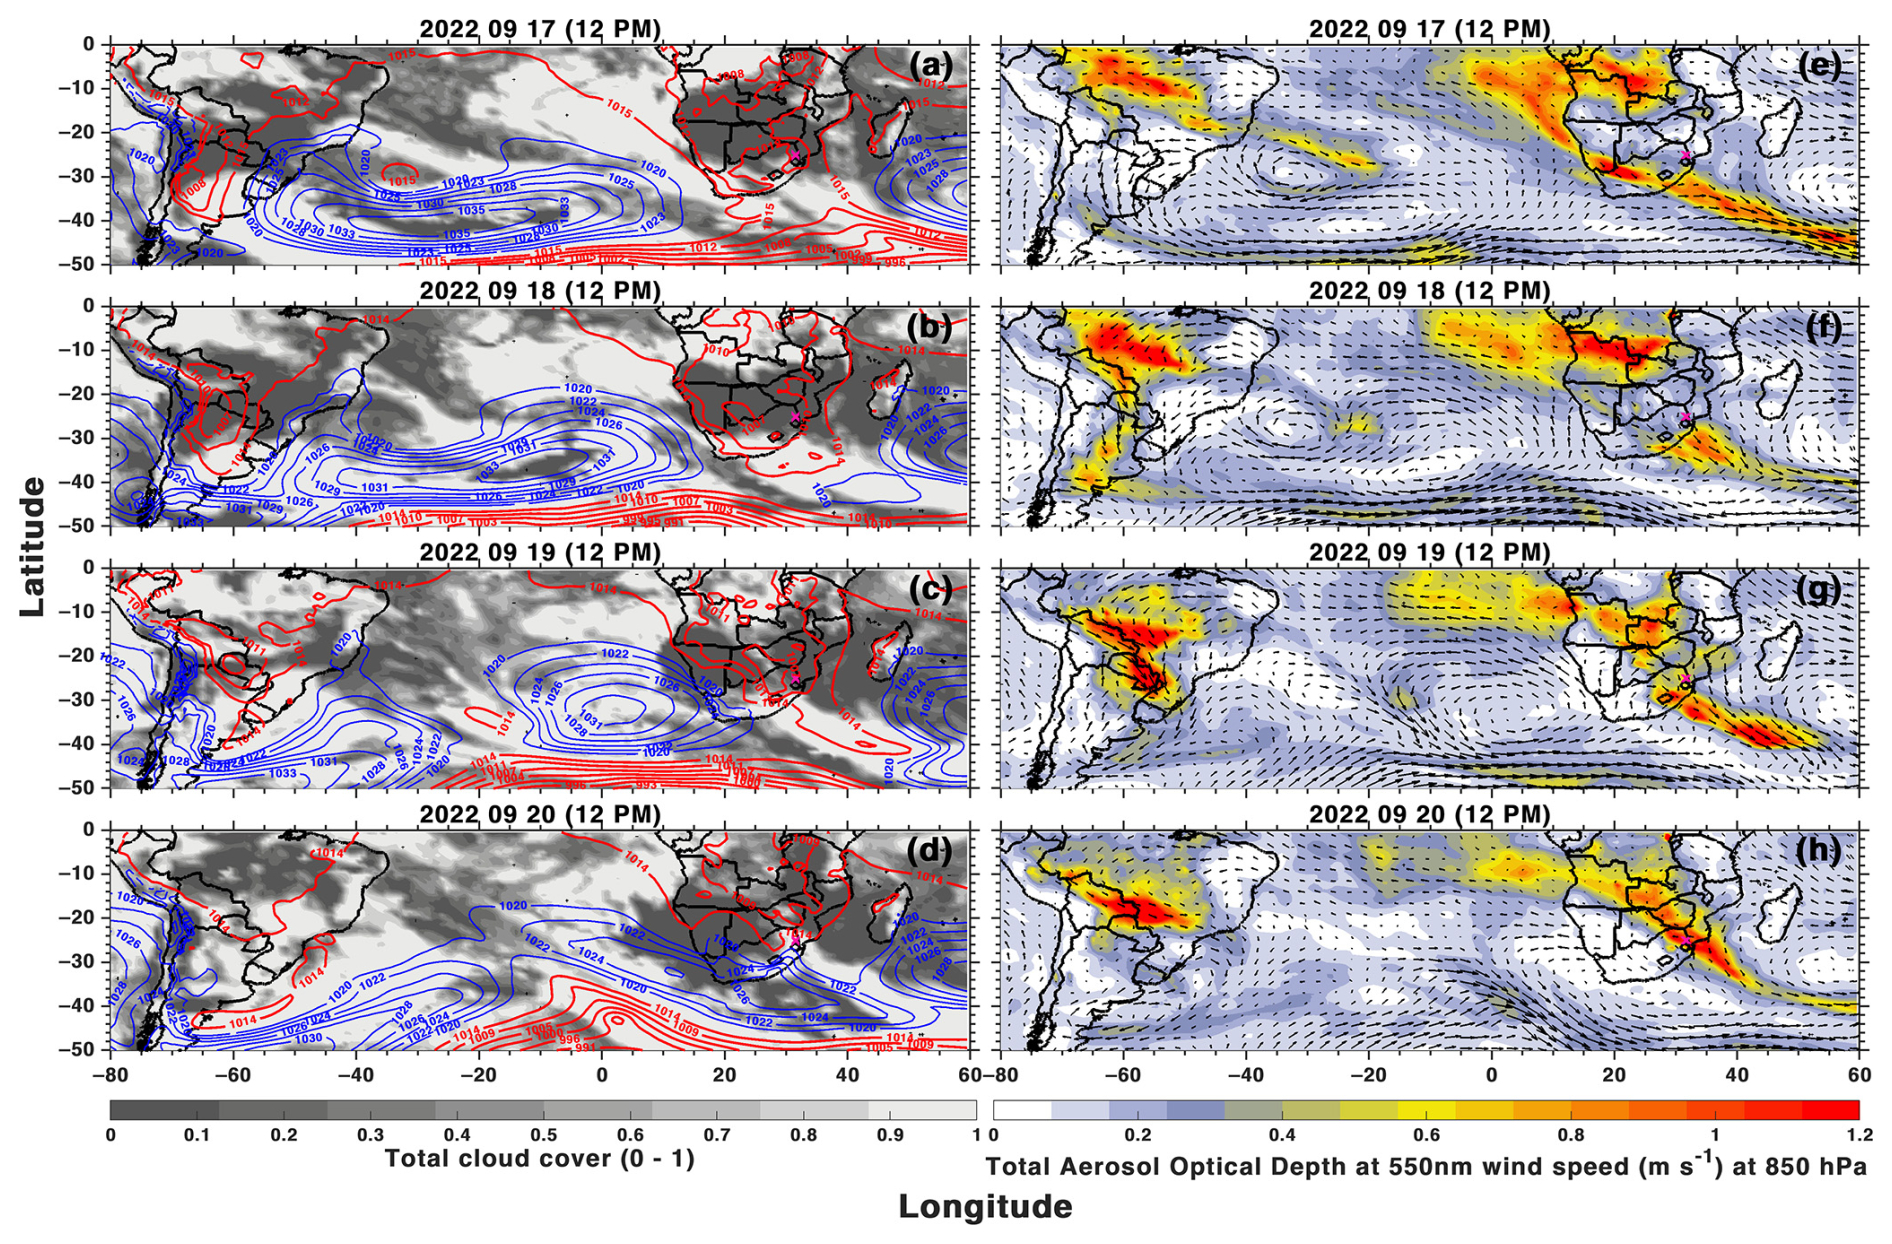
Figure 8Synoptic conditions from 17 to 20 September 2022. Black and white color shading represents the total cloud cover, and the grey–yellow–red color shading represents the AOD at 550 nm, from CAMS reanalysis. Blue and red isolines represent the mean sea level pressure above and below 1018 hPa, respectively. Black arrows over AOD are wind speed (m s−1) at 850 hPa.
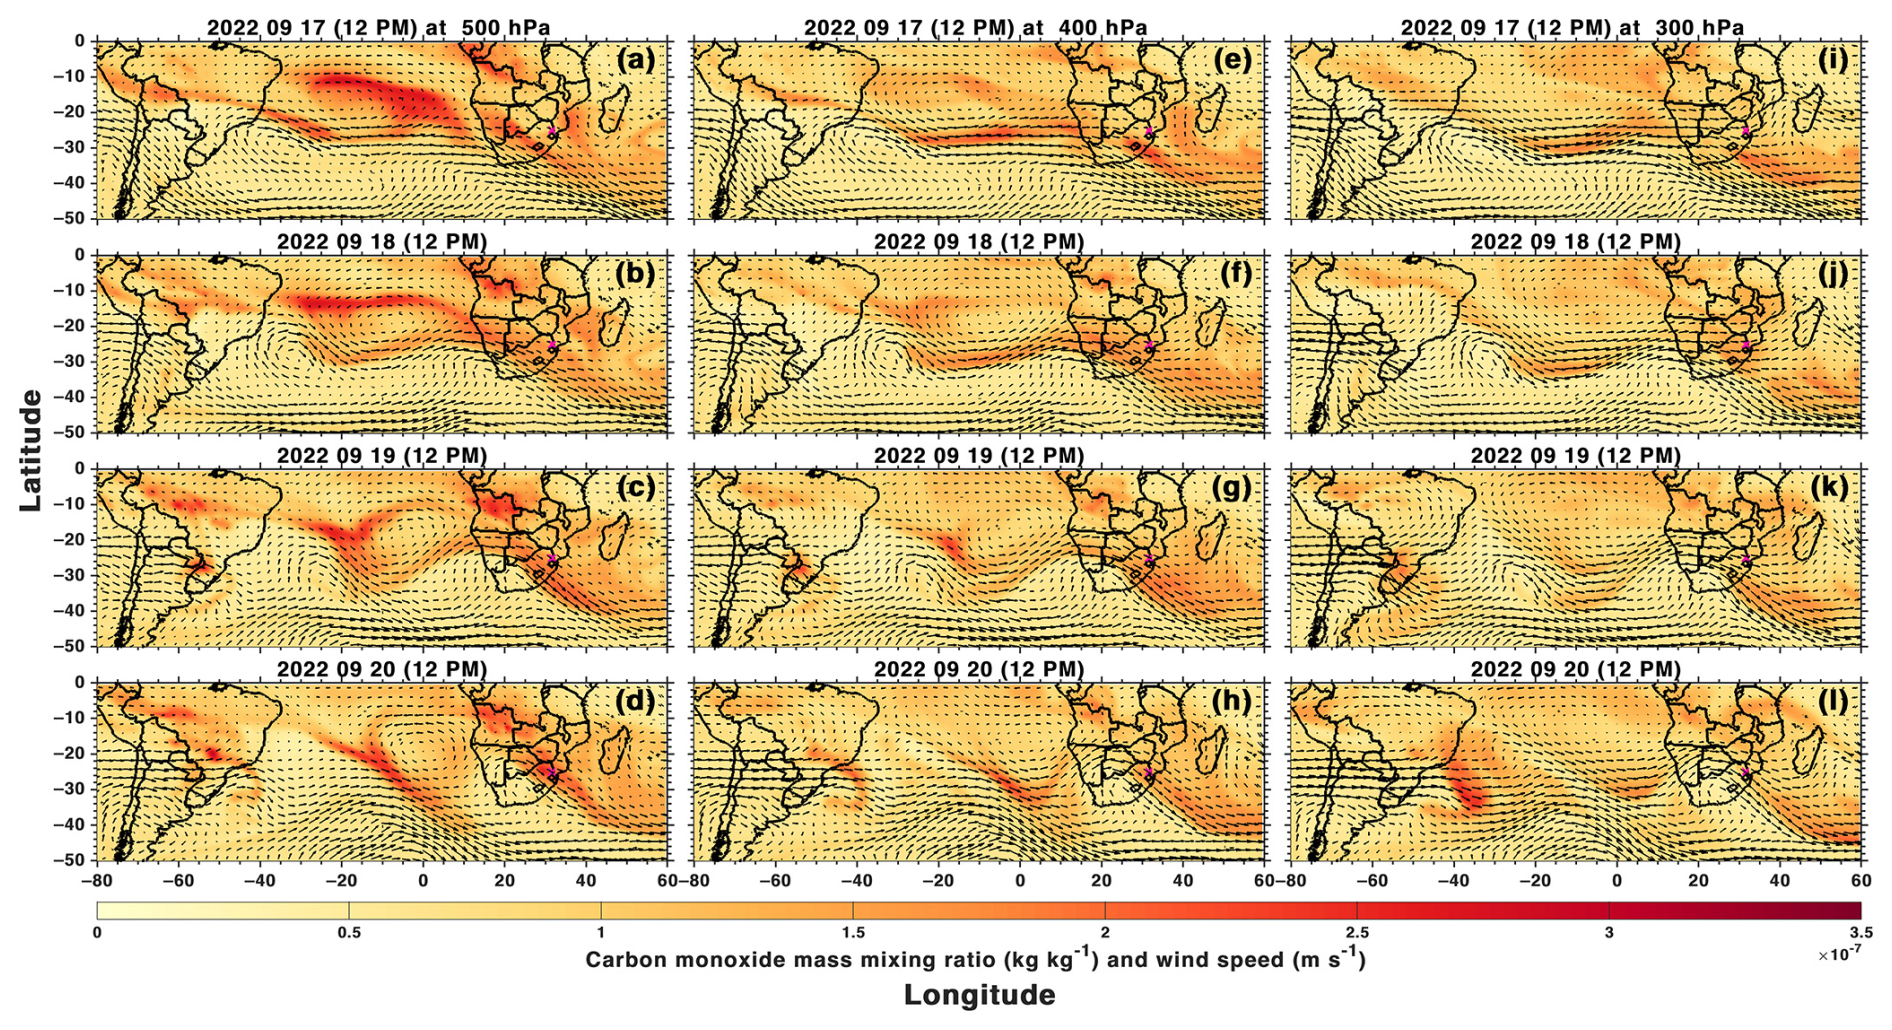
Figure 9Daily maps of CO mixing ratio from CAMS reanalysis (color shading) and wind fields (arrows) for 500, 400, and 300 hPa pressure levels and between 17 and 20 September.
Intercontinental transport is further analyzed through wind fields and CO mixing ratios at medium and high levels of the troposphere (500, 400, and 300 hPa) in Fig. 9. On 17 September, an upper-level cyclonic vortex (Keable et al., 2002) extends vertically from the 500 to the 300 hPa level (Fig. 9a–c), providing dynamic support to the frontal system observed near the South American coast (30° S, 35° W). The winds from this trough, surrounding the South American vortex, also interact with the trough supporting the South African frontal system (40° S, 15° E). This interaction facilitates the intercontinental transport of the South American CO plume towards the Atlantic coast of Africa. For southern Africa, a similar transport pattern is observed for the CO plumes, which move from Angola to Namibia and western South Africa. From 18 September onward, the cyclonic vortex intensifies, and the baroclinic wave transports it eastward, causing the South American CO plume to mix with the African plume at all three levels (Fig. 9b, f, j). A continuous flow of CO is observed over Angola, Botswana, and southern Africa. By 19 and 20 September, this plume gradually shifted toward eastern southern Africa and the Indian Ocean, coinciding with the “river of smoke” (Fig. 9c, g, and k and d, h, and l). The 500 hPa level exhibits higher CO concentrations than the other levels, indicating that intercontinental transport occurs between the 300 and 500 hPa levels, and it is most pronounced at 500 hPa, following the baroclinic wave propagation (Ndarana et al., 2023).
Previous instances of the “river of smoke” were reported during the SAFARI-2000 field campaign (Swap et al., 2003; Stein et al., 2003) and the AEROCLO-sA project in 2017 (Flamant et al., 2022). In both cases, the synoptic conditions responsible for the formation of the smoke river involved the propagation of a westerly wave and the development of a cut-off low. In our study, however, only the westerly wave was present, without a cut-off low. A common factor among all three smoke river events is that they occurred during the negative phase of ENSO (El Niño–Southern Oscillation), specifically the La Niña phase. As noted by Shikwambana et al. (2022), ENSO phases do not directly influence biomass burning or emissions but impact the rainy season and agricultural practices. For example, the moderate La Niña phase that began in the austral summer of 1998 featured sea surface temperatures between −1 and −1.5 °C (Roy et al., 2001). Rainfall from Cyclone Eline contributed to vegetation growth, increasing the amount of fuel available for fires during the subsequent dry season (Swap et al., 2003). In contrast, the La Niña phases in 2017 and 2022 were weaker, with sea surface temperatures ranging from −0.5 to −1 °C (NOAA website) and no cyclone comparable to Eline occurring. Further analysis of precipitation patterns in the region will help determine whether similar meteorological conditions preceded the formation of these smoke rivers.
4.2 Regional and intercontinental transport – Event 2: 9 to 17 October 2022
As observed during Event 1, the high AOD values recorded during Event 2 similarly indicate biomass burning activity across both Africa and South America from 7 to 10 October. Figure 10 shows the FRP values for MODIS-Aqua for Event 2. As in Event 1, the biomass burning activity appears confined to the latitude band between −10 and −25°, with moderate to high FRP values. During Event 2, fires tend to extend eastward in southern Africa, impacting mainly Zambia and Mozambique. Over South America, the biomass burning activity is again concentrated in two areas (northeast region and west Brazil, Bolivia, Paraguay, and northern Argentina), highlighting the importance of locally produced aerosols, as well as regional transport from other African regions or intercontinental transport from South America during the Event 2.
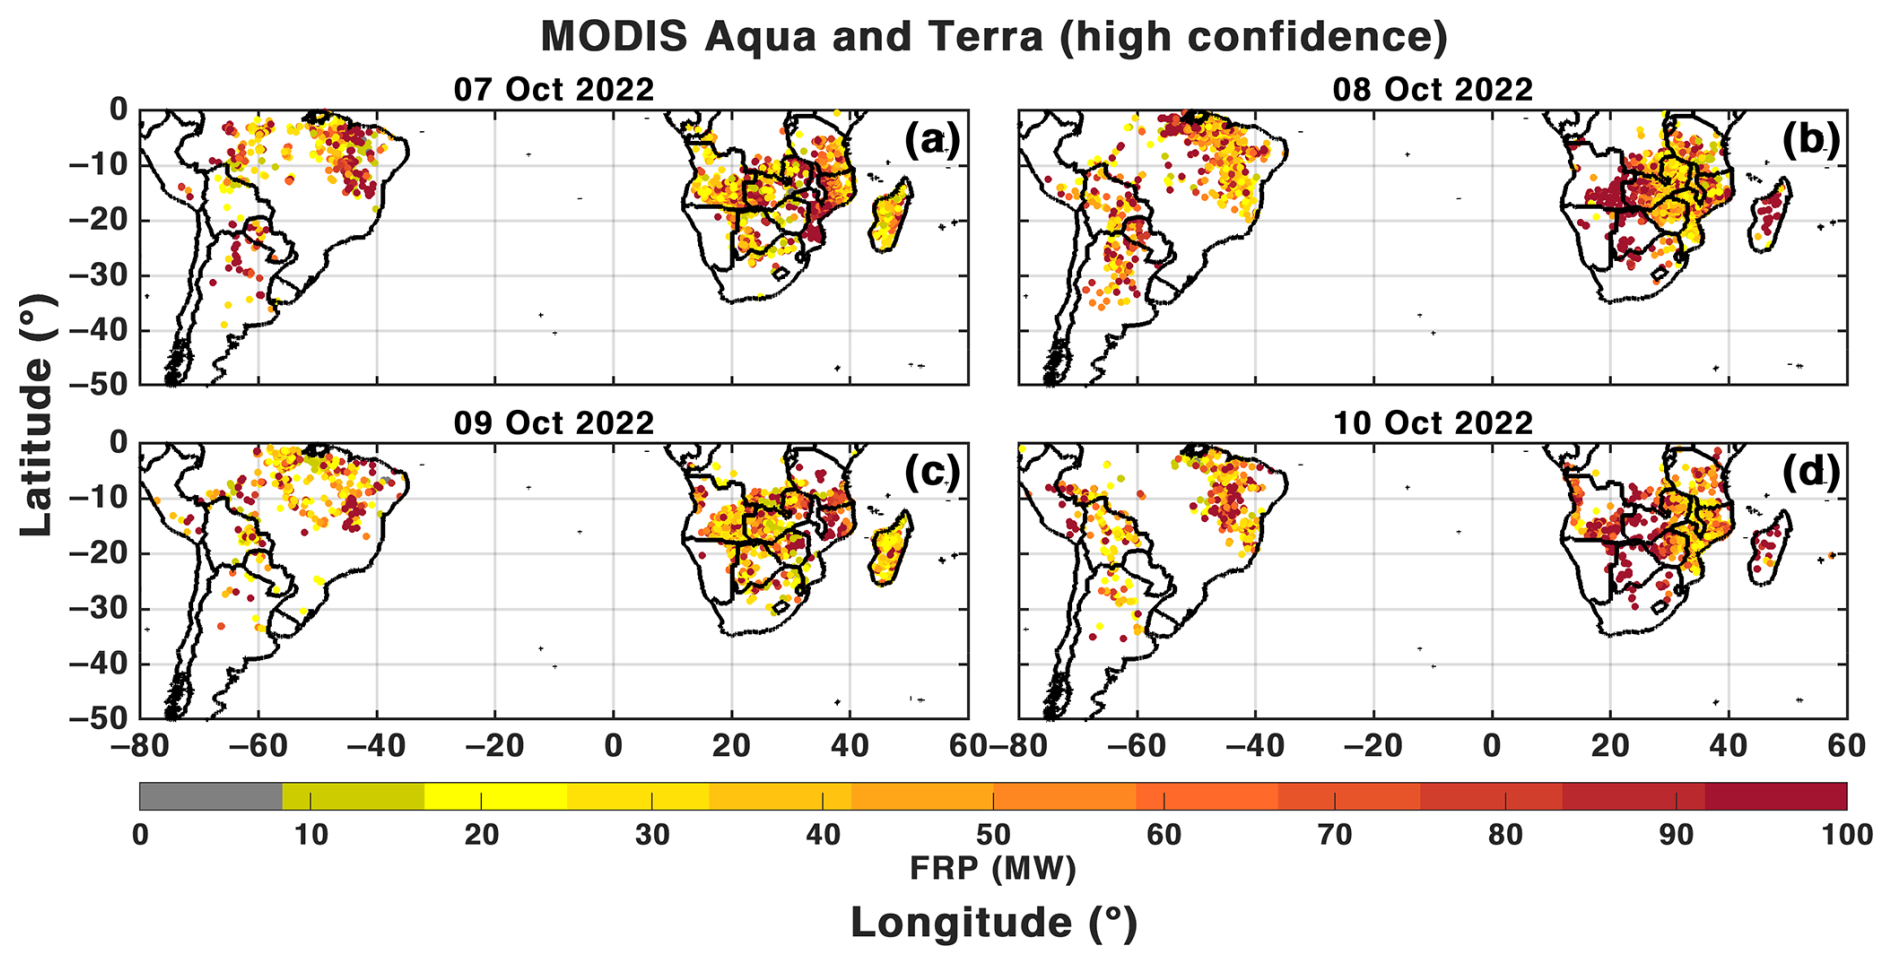
Figure 10Fire radiative power (FRP in MW) over southern Africa and South America from 7 to 10 October.
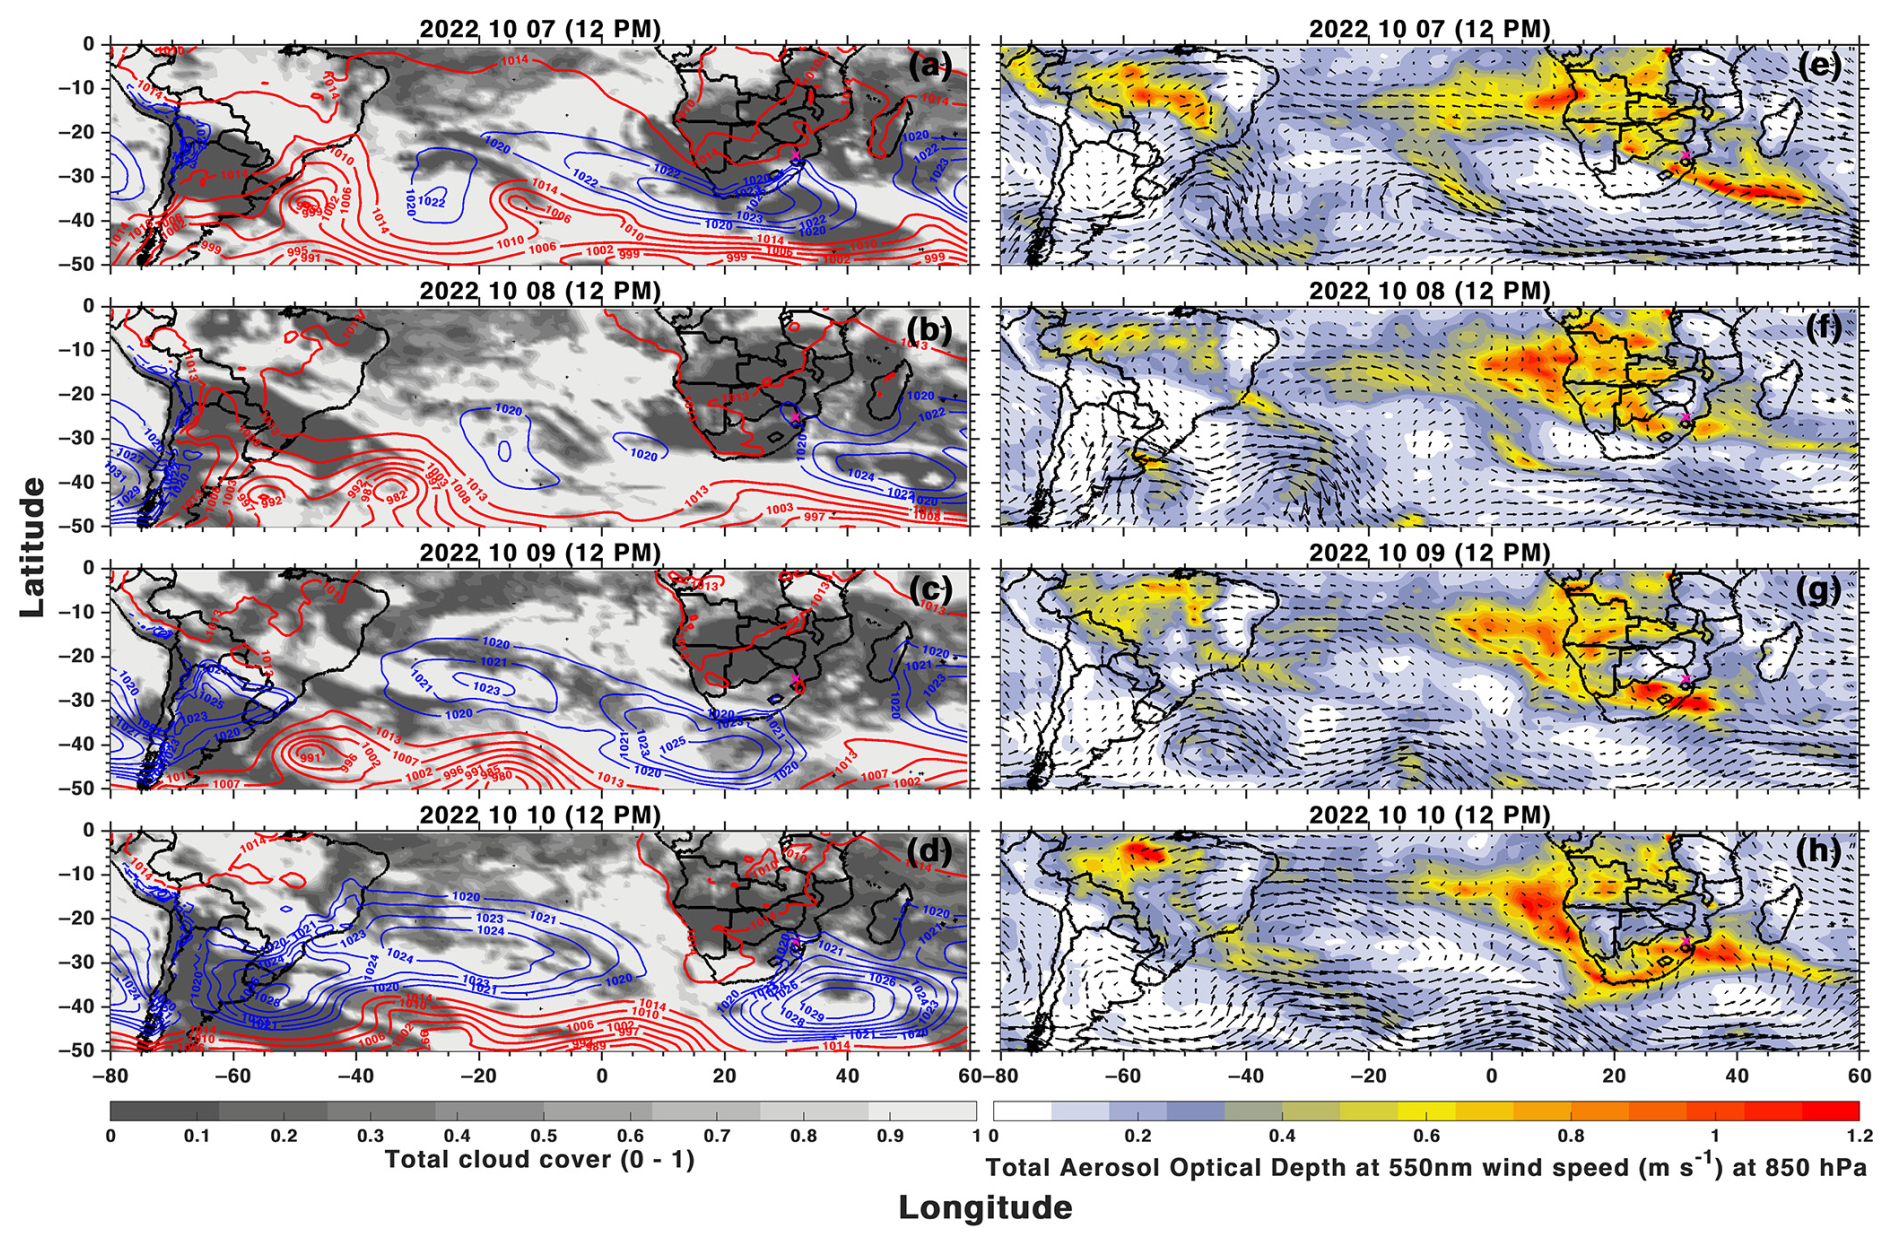
Figure 11Same as Fig. 8 but from 7 to 10 October 2022.
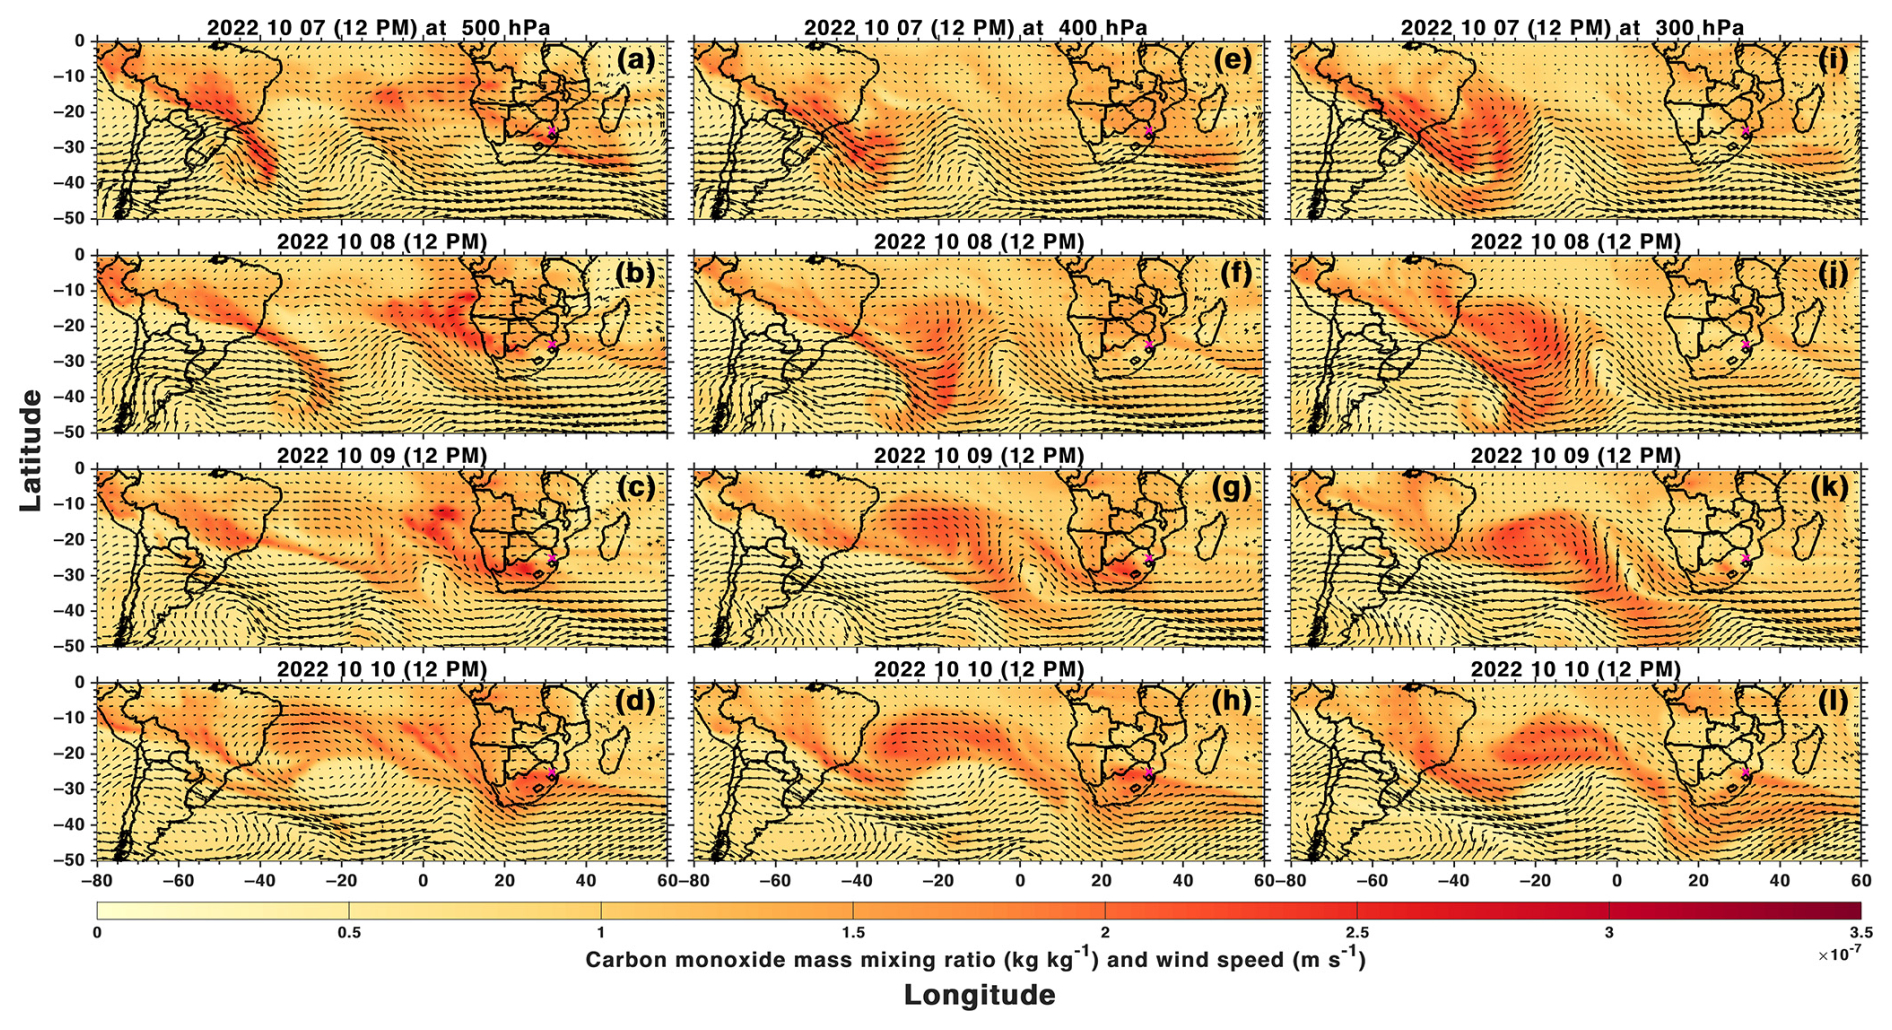
Figure 12Same as Fig. 9 but from 7 to 10 October 2022.
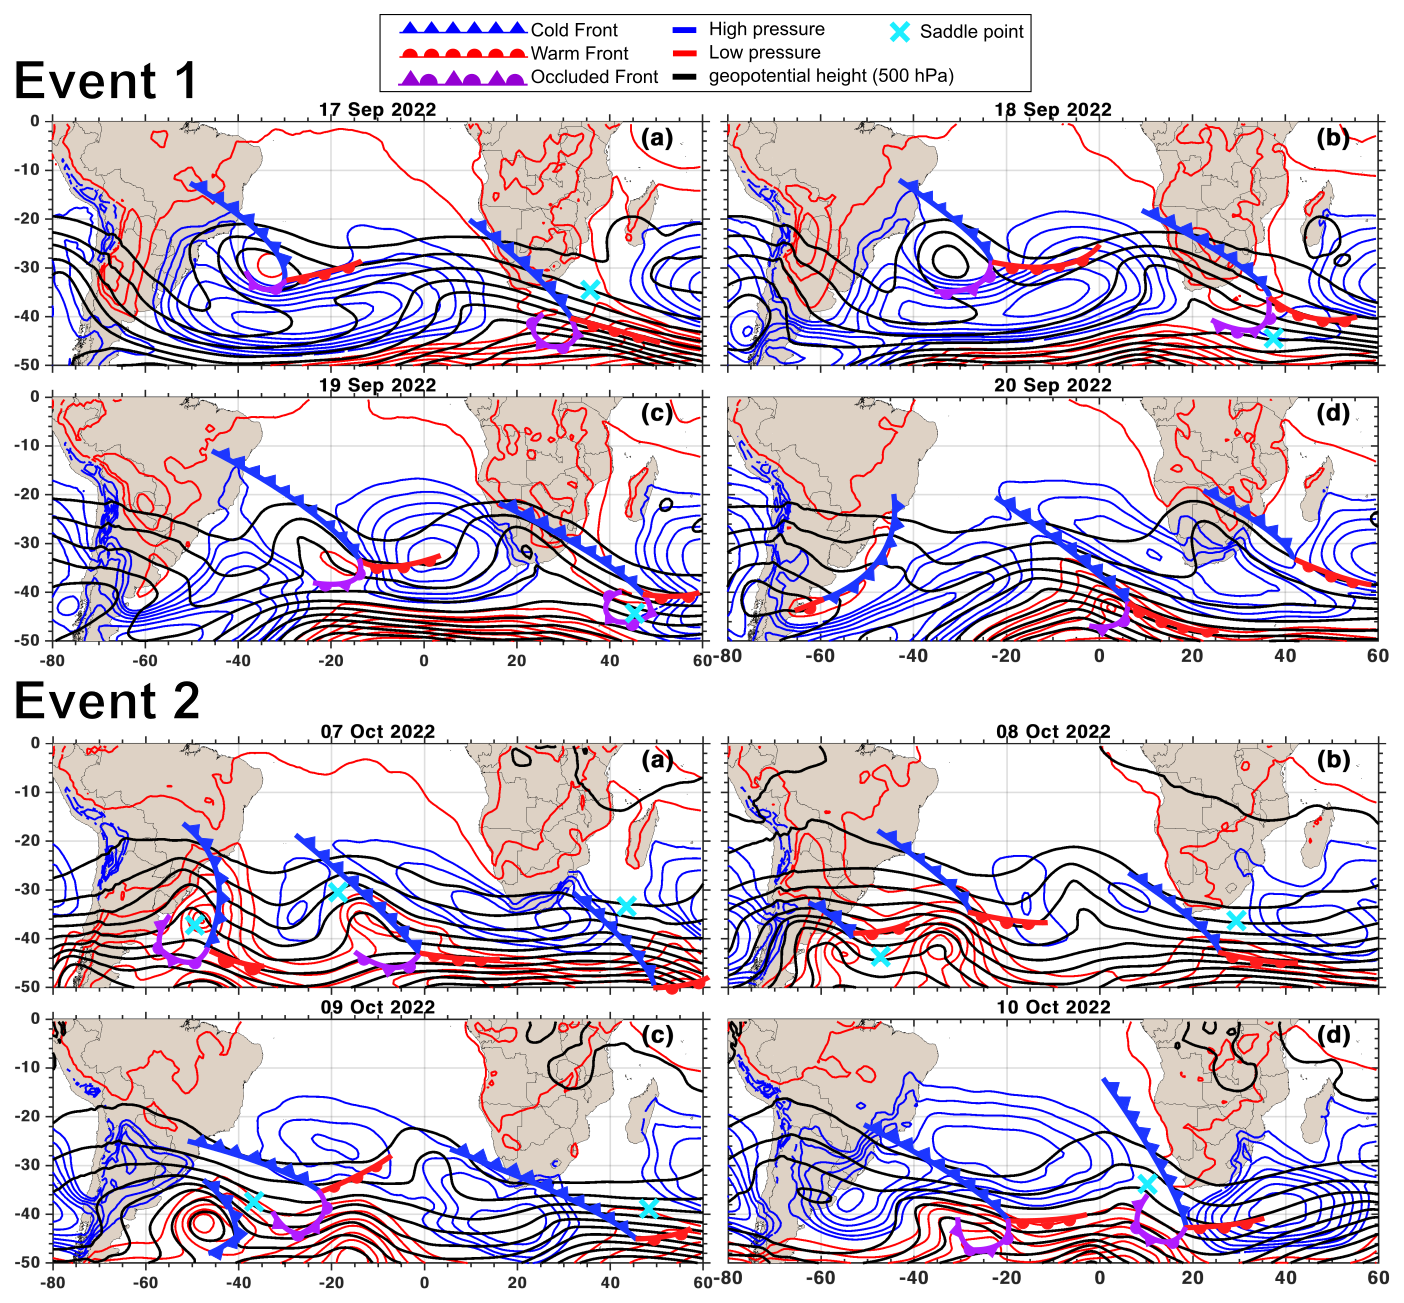
Figure 13Meteorological features favoring the transport of aerosols and CO plume during Event 1 (top panels) and Event 2 (bottom panels). Frontal systems are shown as follows: cold front in blue, warm front in red, and occluded front in purple. Mean sea level pressure: low and high shown by red and blue lines, respectively. The geopotential at 500 hPa is represented by black lines and the location of saddle points by cyan crosses.
Figure 11 presents the total cloud cover and mean sea level pressure (panels a–d), alongside AOD at 550 nm and winds at 850 hPa (panels e–h). A 3-hourly CAMS AOD animation is available as a video supplement and is accessible on https://doi.org/10.5446/67052 (Ranaivombola, 2024a). Unlike Event 1, where the baroclinic disturbance exhibited a two-trough pattern supporting two frontal systems, Event 2 is characterized by a three-frontal-system pattern. From 7 October onwards, an increase in AOD values is observed, peaking on 16 October before decreasing (Fig. 3). Vertical profiles indicate elevated smoke aerosols between 2–3 km and predominantly between 4–8 km, indicating long-range transport. The synoptic conditions associated with Event 2 begin to form on 7 October (Fig. 11a, e), with the emergence of three saddle points (Hoskins and Heckley, 1981) and their corresponding low-pressure centers, which support the development of frontal systems. From the low-pressure center at 50° S and 55° E, a frontal system extends to the east of South Africa, driving low-level jet outflows at 850 hPa that form an aerosol plume over the Mozambique Channel, moving towards the Indian Ocean. Simultaneously, a high-pressure cell elongates over the southern tip of Africa, transporting aerosol plumes from Angola towards the Atlantic Ocean. A second low-pressure center, located at 40° S and 10° W, generates a frontal system and associated cloud band over the central South Atlantic. At 850 hPa, flow convergence contributes to transporting mixed aerosol plumes from South America and west Africa into the Atlantic. A large low-pressure system off the southern coast of Brazil supports another frontal system, which extends from central Brazil to the adjacent Atlantic, facilitating aerosol transport into the Atlantic Ocean. By 8 October (Fig. 11b, f), the frontal systems have shifted eastward. The frontal system over South Africa dissipates into the Indian Ocean, while the post-frontal high-pressure system causes aerosol plumes to recirculate over southern Africa. The frontal system in the central Atlantic advances towards South Africa, while the South American system extends further into the Atlantic, continuing to transport aerosol plumes. Near 40° S, 5° E, the warm branch of the South American system connects with the cold branch of the South African system. On 9 October (Fig. 11c, g), the baroclinic disturbance progresses eastward, extending the two connected frontal systems from southeast Brazil towards a low-pressure center in the Atlantic at 45° S, 15° W. This connection spans across southern Africa to a low-pressure center in the Indian Ocean at 50° S, 60° E, which drives an AOD plume over eastern South Africa and southern Mozambique. A new frontal system forms, extending from Paraguay and southern Brazil to a low-pressure center at 40° S, 45° W. By 10 October (Fig. 11d, h), the post-frontal high-pressure system advances eastward over South Africa, recirculating the aerosol plume over the region. Simultaneously, the two connected frontal systems continue advancing across the Atlantic, approaching the southwestern African coast. This sequence of frontal systems from South America to Africa sustains high AOD levels until 17 October (not shown).
The dynamics of the middle and upper troposphere are examined using wind fields and CO mixing ratios at the 500, 400, and 300 hPa levels (Fig. 12), in relation to the high aerosol extinction coefficients measured by CALIOP between 4 and 8 km (Fig. 6). On 7 October, the three frontal systems observed in Fig. 12 are dynamically supported by three troughs at 500 hPa, located at 40° S, 40° E; 40° S, 10° W; and 40° S, 50° W, respectively. These troughs facilitate the ejection of CO plumes to the east of each trough Fig. 12a. This pattern is replicated at both 400 hPa (Fig. 12e) and 300 hPa (Fig. 12i), with the 300 hPa level showing higher CO concentrations than the other two levels. By 8 October, the westerly baroclinic wave at 500 hPa Fig. 12b progresses eastward. The trough associated with the South African frontal system weakens as it moves into the Indian Ocean, while the trough over the central Atlantic shifts towards the east coast of Africa. Here, local CO plumes merge with filaments of the South American CO plume. This pattern remains consistent at 400 hPa Fig. 12f and 300 hPa Fig. 12j, where the trough near the South American coast exhibits a particularly intense CO plume, which even connects with the trough near Africa’s west coast. On 9 October, the westerly baroclinic wave continues to support the ejection of the South American CO plume, forming an extended transport channel that combines with the African CO plume. This combined plume is positioned over South Africa and the adjacent ocean. By 10 October, this long CO transport channel intensifies as the frontal systems over the South Atlantic merge, forming a continuous corridor of South American-origin smoke. In the middle and upper troposphere, this corridor connects with the African CO plume and is directed over the Mozambique Channel, causing the peak concentrations captured by ground and satellite instruments.
The persistence of high aerosol values observed until 17 October is attributed to the sustained activity of the westerly baroclinic wave, which continues to generate new troughs and associated frontal systems. These systems perpetuate the transport of the South American CO plume, facilitating its connection with the African plume and directing the combined plumes toward the Mozambique Channel.
This study investigates the spatiotemporal evolution of aerosol optical properties during the BiBAC intensive observation period, focusing on two events: 18–23 September (Event 1) and 9–17 October (Event 2). These periods were statistically determined using sun-photometer data collected at the Skukuza site, by comparing daily measurements with the entire dataset. Aerosol classification based on sun-photometer observations aligns with the CALIOP algorithm, both indicating a predominance of biomass burning aerosols. The techniques described in our study show the dominance of moderately absorbing aerosols during both events. Satellite observations of CO and AOD revealed a southeastward transport across southern Africa, extending toward the SWIO basin. CALIOP vertical profiles indicated that aerosol layers, mainly composed of elevated smoke, typically span the surface to 6 km. However, part of Event 2 shows aerosol layers reaching up to 10 km. These altitude ranges and aerosol types are consistent with findings from Ranaivombola et al. (2023), as well as earlier studies along the western coast of southern Africa, such as the 2017 case study reported by Chazette et al. (2019) and Flamant et al. (2022).
In both events, the synoptic conditions played a crucial role in facilitating the transport of CO and aerosol plumes across the South Atlantic and towards southern Africa. Figure 12 illustrates the synoptic conditions during both events. These include meteorological characteristics such as frontal systems, mean sea level pressure, the geopotential at 500 hPa, and the location of saddle points. Event 1 was characterized by the presence of two troughs that supported the formation of two frontal systems (Fig. 13 top). These systems worked in tandem, contributing to transport aerosols and CO plumes from South America towards southern Africa (Figs. 8 and 9), especially through the mid-tropospheric layers, where the transport was driven by a westerly baroclinic wave. Event 2, in contrast, involved a more complex synoptic setup with three frontal systems supported by three distinct troughs, with a post-frontal high-pressure system that allows the recirculation of plumes over southern Africa (Figs. 11 and 13 bottom). This dynamic system enhanced the transport of South American CO plumes, which merged with African-origin plumes over the Mozambique Channel (Fig. 12). The sustained activity of the baroclinic wave generated new troughs, keeping the aerosol levels high for an extended period. In both events, the progression of baroclinic waves and the development of frontal systems were essential in driving the regional and intercontinental transport of aerosols and CO plumes. These synoptic features over several days led to the formation of the “river of smoke” during Event 1, influencing the atmospheric composition over the Mozambique Channel and the surrounding regions.
In our opinion, this study is the first to highlight two transport mechanisms of aerosol plumes and CO between source regions (South America and southern Africa) towards the SWIO basin. The CO maps (Figs. 9 and 12) reveal that, on an intercontinental scale, southern Africa is a major receptor region for aerosols from South American biomass fires. This underscores the importance of conducting transport studies that incorporate multiple aerosol sources. In further investigations, the FLEXPART model, coupled with emissions database, will be used to assess and quantify the contributions of African and South American sources to observed aerosol and CO concentrations. This analysis will provide deeper insights into regional and intercontinental transport in the Southern Hemisphere.
Sun-photometer observations Version 3 Level 2 are available on https://aeronet.gsfc.nasa.gov/ (NASA AERONET, 2023). Aerosol MODIS observations “Combined Dark Target and Deep Blue AOD at 550 nm, for land and ocean” (MYD08_D3_v6.1) from the Aqua platform are available from https://doi.org/10.5067/MODIS/MOD08_D3.061 (Platnick et al., 2017). Fire MODIS observations “Thermal Anomalies/Fire locations 1km FIRMS V0061” (MCD14ML) from the Aqua platform were downloaded from NASA (https://doi.org/10.5067/MODIS/MYD14A1.061, Giglio and Justice, 2021a; https://doi.org/10.5067/MODIS/MOD14A1.061, Giglio and Justice, 2021b). CALIOP Level 2 Aerosol Profiles (V4-51) were downloaded from the EarthData website (https://doi.org/10.5067/CALIOP/CALIPSO/CAL_LID_L2_05km APro-Standard-V4-51, NASA Langley Research Center Atmospheric Science Data Center, 2023). The IASI/MetOp-B carbon monoxide (CO) dataset was downloaded from the AERIS platform (https://doi.org/10.25326/16, Clerbaux and Coheur, 2019). CAMS global reanalysis (EC4) data were downloaded from the Atmospheric Data Store (ADS) website (https://ads.atmosphere.copernicus.eu/, Inness et al., 2019).
Animations 1 and 2 are available at https://doi.org/10.5446/67052 (Ranaivombola, 2024a) and at https://doi.org/10.5446/67051 (Ranaivombola, 2024b), respectively.
Conceptualization and methodology, MR, NB, and HB; software, MR and NB; data curation, MR; writing (original draft preparation), MR; writing (review and editing), all co-authors; visualization, MR; funding acquisition, HB and NB. All authors have read and agreed to the published version of the paper.
The contact author has declared that none of the authors has any competing interests
Publisher’s note: Copernicus Publications remains neutral with regard to jurisdictional claims made in the text, published maps, institutional affiliations, or any other geographical representation in this paper. While Copernicus Publications makes every effort to include appropriate place names, the final responsibility lies with the authors.
We thank the PIs and their staff for establishing and maintaining the Skukuza site used in this investigation. We thank the PHOTONS National Observation Service of the ACTRIS-France infrastructure for the AERONET data and products. We also acknowledge the MODIS and CALIPSO missions scientists and associated NASA personnel for the production of the data used in this research effort. We acknowledge the use of MODIS data from NASA's Fire Information for Resource Management System (FIRMS) (https://earthdata.nasa.gov/firms, last access: 7 November 2023), part of NASA's Earth Observing System Data and Information System (EOSDIS). The authors thank ECMWF-IFS for providing access to CAMS reanalysis. The authors thank Trecia Strydom and Gregor Fieg from SANParks in Kruger National Park for their collaboration. We thank Anna Asperti-Côme for language corrections in an earlier draft of the manuscript.
This research was jointly funded by the Université de La Réunion (grant no. LACy/UMR 8105), the CNRS (Centre National de la Recherche Scientifique), and the NRF (National Research Foundation) in the framework of the IRP ARSAIO and by the South Africa–France PROTEA program (project no. 42470VA). This study is integrated and supported by (1) the LEFE BRAAI project (Biomass buRning Aerosols over south Africa and Indian ocean) and (2) the MOUSSACA project (Méthodes et Outils nUmériqueS appliquéS Aux Composés Atmosphériques) through the federation Observatoire des Milieux Naturels et des Changements Globaux (OMNCG) of the OSU-R (Observatoire des Sciences de l’Univers – La Réunion) at the Université de la Réunion. Marion Ranaivombola received a doctoral scholarship from the Regional Council of Réunion (Conseil Général de La Réunion).
This paper was edited by N'Datchoh Evelyne Touré and reviewed by two anonymous referees.
Adesina, A. J., Piketh, S., Kanike, R. K., and Venkataraman, S.: Characteristics of columnar aerosol optical and microphysical properties retrieved from the sun photometer and its impact on radiative forcing over Skukuza (South Africa) during 1999–2010, Environ. Sci. Pollut. Res., 24, 16160–16171, https://doi.org/10.1007/s11356-017-9211-2, 2017. a, b, c, d
Adesina, J. and Piketh, S.: SEASONAL VARIATION OF MAJOR AEROSOL TYPES OVER SKUKUZA AS INFERRED FROM SUNPHOTOMETER MEASUREMENTS, ISBN 978-0-620-70646-9, 2016. a
Alam, K., Qureshi, S., and Blaschke, T.: Monitoring spatio-temporal aerosol patterns over Pakistan based on MODIS, TOMS and MISR satellite data and a HYSPLIT model, Atmos. Environ., 45, 4641–4651, https://doi.org/10.1016/j.atmosenv.2011.05.055, 2011. a
Albrecht, B. A.: Aerosols, Cloud Microphysics, and Fractional Cloudiness, Science, 245, 1227–1230, https://doi.org/10.1126/science.245.4923.1227, 1989. a
Andersen, H. and Cermak, J.: First fully diurnal fog and low cloud satellite detection reveals life cycle in the Namib, Atmos. Meas. Tech., 11, 5461–5470, https://doi.org/10.5194/amt-11-5461-2018, 2018. a
Andreae, M. O., Fishman, J., and Lindesay, J.: The Southern Tropical Atlantic Region Experiment (STARE): Transport and Atmospheric Chemistry near the Equator-Atlantic (TRACE A) and Southern African Fire-Atmosphere Research Initiative (SAFARI): An introduction, J. Geophys. Res.-Atmos., 101, 23519–23520, https://doi.org/10.1029/96JD01786, 1996. a
Arshinova, V. G., Belan, B. D., Rasskazchikova, T. M., and Skliadneva, T. K.: – Variation of aerosol distribution in the near-ground layer of the atmosphere in the presence of atmospheric fronts, in: Nucleation and Atmospheric Aerosols 1996, edited by: Kulmala, M. and Wagner, P. E., Pergamon, Amsterdam, 626–628, ISBN 978-0-08-042030-1, https://doi.org/10.1016/B978-008042030-1/50153-0, 1996. a
Bencherif, H., Bègue, N., Kirsch Pinheiro, D., du Preez, D. J., Cadet, J.-M., da Silva Lopes, F. J., Shikwambana, L., Landulfo, E., Vescovini, T., Labuschagne, C., Silva, J. J., Anabor, V., Coheur, P.-F., Mbatha, N., Hadji-Lazaro, J., Sivakumar, V., and Clerbaux, C.: Investigating the Long-Range Transport of Aerosol Plumes Following the Amazon Fires (August 2019): A Multi-Instrumental Approach from Ground-Based and Satellite Observations, Remote Sensing, 12, 3846, https://doi.org/10.3390/rs12223846, 2020. a
Bibi, H., Alam, K., and Bibi, S.: In-depth discrimination of aerosol types using multiple clustering techniques over four locations in Indo-Gangetic plains, Atmos. Res., 181, 106–114, https://doi.org/10.1016/j.atmosres.2016.06.017, 2016. a
Boiyo, R., Kumar, K. R., Zhao, T., and Guo, J.: A 10-Year Record of Aerosol Optical Properties and Radiative Forcing Over Three Environmentally Distinct AERONET Sites in Kenya, East Africa, J. Geophys. Res.-Atmos., 124, 1596–1617, https://doi.org/10.1029/2018JD029461, 2019. a
Chang, I., Gao, L., Burton, S. P., Chen, H., Diamond, M. S., Ferrare, R. A., Flynn, C. J., Kacenelenbogen, M., LeBlanc, S. E., Meyer, K. G., Pistone, K., Schmidt, S., Segal-Rozenhaimer, M., Shinozuka, Y., Wood, R., Zuidema, P., Redemann, J., and Christopher, S. A.: Spatiotemporal Heterogeneity of Aerosol and Cloud Properties Over the Southeast Atlantic: An Observational Analysis, Geophys. Res. Lett., 48, e2020GL091469, https://doi.org/10.1029/2020GL091469, 2021. a, b
Chazette, P., Flamant, C., Totems, J., Gaetani, M., Smith, G., Baron, A., Landsheere, X., Desboeufs, K., Doussin, J.-F., and Formenti, P.: Evidence of the complexity of aerosol transport in the lower troposphere on the Namibian coast during AEROCLO-sA, Atmos. Chem. Phys., 19, 14979–15005, https://doi.org/10.5194/acp-19-14979-2019, 2019. a, b
Clain, G., Baray, J. L., Delmas, R., Diab, R., Leclair de Bellevue, J., Keckhut, P., Posny, F., Metzger, J. M., and Cammas, J. P.: Tropospheric ozone climatology at two Southern Hemisphere tropical/subtropical sites, (Reunion Island and Irene, South Africa) from ozonesondes, LIDAR, and in situ aircraft measurements, Atmos. Chem. Phys., 9, 1723–1734, https://doi.org/10.5194/acp-9-1723-2009, 2009. a
Clarisse, L., R'Honi, Y., Coheur, P.-F., Hurtmans, D., and Clerbaux, C.: Thermal infrared nadir observations of 24 atmospheric gases, Geophys. Res. Lett., 38, L10802, https://doi.org/10.1029/2011GL047271, 2011. a
Clerbaux, C. and Coheur, P.-F.: Daily IASI/Metop-A ULB-LATMOS Carbon Monoxide (CO) L2 Product (Total Column), Aeris [data set], https://doi.org/10.25326/16, 2019. a
Clerbaux, C., Boynard, A., Clarisse, L., George, M., Hadji-Lazaro, J., Herbin, H., Hurtmans, D., Pommier, M., Razavi, A., Turquety, S., Wespes, C., and Coheur, P.-F.: Monitoring of atmospheric composition using the thermal infrared IASI/MetOp sounder, Atmos. Chem. Phys., 9, 6041–6054, https://doi.org/10.5194/acp-9-6041-2009, 2009. a
Coheur, P.-F., Clarisse, L., Turquety, S., Hurtmans, D., and Clerbaux, C.: IASI measurements of reactive trace species in biomass burning plumes, Atmos. Chem. Phys., 9, 5655–5667, https://doi.org/10.5194/acp-9-5655-2009, 2009. a
Cúneo, L., Ulke, A. G., and Cerne, B.: Advances in the characterization of aerosol optical properties using long-term data from AERONET in Buenos Aires, Atmos. Pollut. Res., 13, 101360, https://doi.org/10.1016/j.apr.2022.101360, 2022. a
Doherty, S. J., Saide, P. E., Zuidema, P., Shinozuka, Y., Ferrada, G. A., Gordon, H., Mallet, M., Meyer, K., Painemal, D., Howell, S. G., Freitag, S., Dobracki, A., Podolske, J. R., Burton, S. P., Ferrare, R. A., Howes, C., Nabat, P., Carmichael, G. R., da Silva, A., Pistone, K., Chang, I., Gao, L., Wood, R., and Redemann, J.: Modeled and observed properties related to the direct aerosol radiative effect of biomass burning aerosol over the southeastern Atlantic, Atmos. Chem. Phys., 22, 1–46, https://doi.org/10.5194/acp-22-1-2022, 2022. a, b
Dubovik, O. and King, M. D.: A flexible inversion algorithm for retrieval of aerosol optical properties from Sun and sky radiance measurements, J. Geophys. Res.-Atmos., 105, 20673–20696, https://doi.org/10.1029/2000JD900282, 2000. a
Dubovik, O., Sinyuk, A., Lapyonok, T., Holben, B. N., Mishchenko, M., Yang, P., Eck, T. F., Volten, H., Muñoz, O., Veihelmann, B., van der Zande, W. J., Leon, J.-F., Sorokin, M., and Slutsker, I.: Application of spheroid models to account for aerosol particle nonsphericity in remote sensing of desert dust, J. Geophys. Res.-Atmos., 111, D11208, https://doi.org/10.1029/2005JD006619, 2006. a
Duflot, V., Dils, B., Baray, J. L., De Mazière, M., Attié, J. L., Vanhaelewyn, G., Senten, C., Vigouroux, C., Clain, G., and Delmas, R.: Analysis of the origin of the distribution of CO in the subtropical southern Indian Ocean in 2007, J. Geophys. Res.-Atmos., 115, D22106, https://doi.org/10.1029/2010JD013994, 2010. a, b
Duflot, V., Bègue, N., Pouliquen, M.-L., Goloub, P., and Metzger, J.-M.: Aerosols on the Tropical Island of La Réunion (21° S, 55° E): Assessment of Climatology, Origin of Variability and Trend, Remote Sensing, 14, 4945, https://doi.org/10.3390/rs14194945, 2022. a, b
Eck, T. F., Holben, B. N., Reid, J. S., O'Neill, N. T., Schafer, J. S., Dubovik, O., Smirnov, A., Yamasoe, M. A., and Artaxo, P.: High aerosol optical depth biomass burning events: A comparison of optical properties for different source regions, Geophys. Res. Lett., 30, 2035, https://doi.org/10.1029/2003GL017861, 2003. a, b
Feingold, G. and Siebert, H.: Cloud–Aerosol Interactions from the Micro to the Cloud Scale, in: Clouds in the Perturbed Climate System: Their Relationship to Energy Balance, Atmospheric Dynamics, and Precipitation, edited by: Heintzenberg, J. and Charlson, R. J., The MIT Press, 319–338, ISBN 978-0-262-01287-4, https://doi.org/10.7551/mitpress/9780262012874.003.0014, 2009. a
Fishman, J., Hoell Jr., J. M., Bendura, R. D., McNeal, R. J., and Kirchhoff, V. W. J. H.: NASA GTE TRACE A experiment (September–October 1992): Overview, J. Geophys. Res.-Atmos., 101, 23865–23879, https://doi.org/10.1029/96JD00123, 1996. a, b
Flamant, C., Gaetani, M., Chaboureau, J.-P., Chazette, P., Cuesta, J., Piketh, S. J., and Formenti, P.: Smoke in the river: an Aerosols, Radiation and Clouds in southern Africa (AEROCLO-sA) case study, Atmos. Chem. Phys., 22, 5701–5724, https://doi.org/10.5194/acp-22-5701-2022, 2022. a, b, c, d, e
Formenti, P., D’Anna, B., Flamant, C., Mallet, M., Piketh, S. J., Schepanski, K., Waquet, F., Auriol, F., Brogniez, G., Burnet, F., Chaboureau, J.-P., Chauvigné, A., Chazette, P., Denjean, C., Desboeufs, K., Doussin, J.-F., Elguindi, N., Feuerstein, S., Gaetani, M., Giorio, C., Klopper, D., Mallet, M. D., Nabat, P., Monod, A., Solmon, F., Namwoonde, A., Chikwililwa, C., Mushi, R., Welton, E. J., and Holben, B.: The Aerosols, Radiation and Clouds in Southern Africa Field Campaign in Namibia: Overview, Illustrative Observations, and Way Forward, B. Am. Meteorol. Soc., 100, 1277–1298, https://doi.org/10.1175/BAMS-D-17-0278.1, 2019. a, b
Gaetani, M., Pohl, B., Alvarez Castro, M. C., Flamant, C., and Formenti, P.: A weather regime characterisation of winter biomass aerosol transport from southern Africa, Atmos. Chem. Phys., 21, 16575–16591, https://doi.org/10.5194/acp-21-16575-2021, 2021. a
Garstang, M., Tyson, P. D., Swap, R., Edwards, M., Kållberg, P., and Lindesay, J. A.: Horizontal and vertical transport of air over southern Africa, J. Geophys. Res.-Atmos., 101, 23721–23736, https://doi.org/10.1029/95JD00844, 1996. a, b, c
Getzewich, B. J., et al.: Summary of the CALIPSO V4.5 Lidar Level 1 and Level 2 Dataset, in preparation, https://www-calipso.larc.nasa.gov/resources/calipso_users_guide/qs/cal_lid_l2_all_v4-51_qs.php (last access: 12 July 2024), 2023. a
Giglio, L.: MODIS Collection 6 Active Fire Product User's Guide Revision A, https://www.semanticscholar.org/paper/MODIS-Collection-6-Active-Fire-Product-User's-Guide-Giglio/4aacae34ad3bcd557591067399ebc38580eb8286 (last access: 23 October 2023), 2015. a
Giles, D. M., Holben, B. N., Eck, T. F., Sinyuk, A., Smirnov, A., Slutsker, I., Dickerson, R. R., Thompson, A. M., and Schafer, J. S.: An analysis of AERONET aerosol absorption properties and classifications representative of aerosol source regions, J. Geophys. Res.-Atmos., 117, D17203, https://doi.org/10.1029/2012JD018127, 2012. a, b, c, d, e, f
Giles, D. M., Sinyuk, A., Sorokin, M. G., Schafer, J. S., Smirnov, A., Slutsker, I., Eck, T. F., Holben, B. N., Lewis, J. R., Campbell, J. R., Welton, E. J., Korkin, S. V., and Lyapustin, A. I.: Advancements in the Aerosol Robotic Network (AERONET) Version 3 database – automated near-real-time quality control algorithm with improved cloud screening for Sun photometer aerosol optical depth (AOD) measurements, Atmos. Meas. Tech., 12, 169–209, https://doi.org/10.5194/amt-12-169-2019, 2019. a
Holanda, B. A., Pöhlker, M. L., Walter, D., Saturno, J., Sörgel, M., Ditas, J., Ditas, F., Schulz, C., Franco, M. A., Wang, Q., Donth, T., Artaxo, P., Barbosa, H. M. J., Borrmann, S., Braga, R., Brito, J., Cheng, Y., Dollner, M., Kaiser, J. W., Klimach, T., Knote, C., Krüger, O. O., Fütterer, D., Lavrič, J. V., Ma, N., Machado, L. A. T., Ming, J., Morais, F. G., Paulsen, H., Sauer, D., Schlager, H., Schneider, J., Su, H., Weinzierl, B., Walser, A., Wendisch, M., Ziereis, H., Zöger, M., Pöschl, U., Andreae, M. O., and Pöhlker, C.: Influx of African biomass burning aerosol during the Amazonian dry season through layered transatlantic transport of black carbon-rich smoke, Atmos. Chem. Phys., 20, 4757–4785, https://doi.org/10.5194/acp-20-4757-2020, 2020. a
Hoskins, B. J. and Heckley, W. A. J.: Cold and warm fronts in baroclinic waves, Q. J. Roy. Meteor. Soc., 107, 79–90, https://doi.org/10.1002/qj.49710745105, 1981. a, b
Hunt, W. H., Winker, D. M., Vaughan, M. A., Powell, K. A., Lucker, P. L., and Weimer, C.: CALIPSO Lidar Description and Performance Assessment, J. Atmos. Ocean. Tech., 26, 1214–1228, https://doi.org/10.1175/2009JTECHA1223.1, 2009. a
Hurtmans, D., Coheur, P. F., Wespes, C., Clarisse, L., Scharf, O., Clerbaux, C., Hadji-Lazaro, J., George, M., and Turquety, S.: FORLI radiative transfer and retrieval code for IASI, J. Quant. Spectrosc. Ra., 113, 1391–1408, https://doi.org/10.1016/j.jqsrt.2012.02.036, 2012. a
Inness, A., Ades, M., Agustí-Panareda, A., Barré, J., Benedictow, A., Blechschmidt, A.-M., Dominguez, J. J., Engelen, R., Eskes, H., Flemming, J., Huijnen, V., Jones, L., Kipling, Z., Massart, S., Parrington, M., Peuch, V.-H., Razinger, M., Remy, S., Schulz, M., and Suttie, M.: The CAMS reanalysis of atmospheric composition, Atmos. Chem. Phys., 19, 3515–3556, https://doi.org/10.5194/acp-19-3515-2019, 2019 (data available at: https://ads.atmosphere.copernicus.eu/, last access: 19 December 2023). a, b
Jones, C., Mu, Y., Carvalho, L. M. V., and Ding, Q.: The South America Low-Level Jet: form, variability and large-scale forcings, npj Climate and Atmospheric Science, 6, 1–11, https://doi.org/10.1038/s41612-023-00501-4, 2023. a
Kaskaoutis, D. G., Badarinath, K. V. S., Kumar Kharol, S., Rani Sharma, A., and Kambezidis, H. D.: Variations in the aerosol optical properties and types over the tropical urban site of Hyderabad, India, J. Geophys. Res.-Atmos., 114, D22204, https://doi.org/10.1029/2009JD012423, 2009. a, b, c
Keable, M., Simmonds, I., and Keay, K.: Distribution and temporal variability of 500 hPa cyclone characteristics in the Southern Hemisphere, Int. J. Climatol., 22, 131–150, https://doi.org/10.1002/joc.728, 2002. a
Kumar, K., Devi, L., Khan, R., Kang, N., Yu, X., Boiyo, R., Sivakumar, V., and Griffith, D.: Multi-year analysis of aerosol optical properties and implications to radiative forcing over urban Pretoria, South Africa, Theor. Appl. Climatol., 141, 1–15, https://doi.org/10.1007/s00704-020-03183-7, 2020. a, b, c, d
Kumar, K. R., Sivakumar, V., Reddy, R. R., Gopal, K. R., and Adesina, A. J.: Identification and Classification of Different Aerosol Types over a Subtropical Rural Site in Mpumalanga, South Africa: Seasonal Variations as Retrieved from the AERONET Sunphotometer, Aerosol Air Qual. Res., 14, 108–123, https://doi.org/10.4209/aaqr.2013.03.0079, 2014. a
Kumar, K. R., Kang, N., Sivakumar, V., and Griffith, D.: Temporal characteristics of columnar aerosol optical properties and radiative forcing (2011–2015) measured at AERONET’s Pretoria_CSIR_DPSS site in South Africa, Atmos. Environ., 165, 274–289, https://doi.org/10.1016/j.atmosenv.2017.06.048, 2017. a, b
Langerock, B., Arola, A., Benedictow, A., Bennouna, Y., Blake, L., Bouarar, I., Cuevas, E., Errera, Q., Eskes, H., Griesfeller, J., Ilic, L., Kapsomenakis, J., Mortier, A., Pison, I., Pitkänen, M., Richter, A., Schoenhardt, A., Schulz, M., Thouret, V., Tsikerdekis, A., Warneke, T., and Zerefos, C.: Validation report of the CAMS global reanalysis of aerosols and reactive trace gases, years 2003–2023, Copernicus Atmosphere Monitoring Service, https://doi.org/10.24380/G8H7-KD21, 2024. a, b
Lee, J., Kim, J., Song, C. H., Kim, S. B., Chun, Y., Sohn, B. J., and Holben, B. N.: Characteristics of aerosol types from AERONET sunphotometer measurements, Atmos. Environ., 44, 3110–3117, https://doi.org/10.1016/j.atmosenv.2010.05.035, 2010. a, b, c, d, e
Levy, R. C., Mattoo, S., Munchak, L. A., Remer, L. A., Sayer, A. M., Patadia, F., and Hsu, N. C.: The Collection 6 MODIS aerosol products over land and ocean, Atmos. Meas. Tech., 6, 2989–3034, https://doi.org/10.5194/amt-6-2989-2013, 2013. a
Lindesay, J. A., Andreae, M. O., Goldammer, J. G., Harris, G., Annegarn, H. J., Garstang, M., Scholes, R. J., and van Wilgen, B. W.: International geosphere-biosphere programme/international global atmospheric chemistry SAFARI-92 field experiment: Background and overview, J. Geophys. Res.-Atmos., 101, 23521–23530, https://doi.org/10.1029/96JD01512, 1996. a, b
Mulena, G. C., Asmi, E. M., Ruiz, J. J., Pallotta, J. V., and Jin, Y.: Biomass Burning Aerosol Observations and Transport over Northern and Central Argentina: A Case Study, Remote Sensing, 16, 1780, https://doi.org/10.3390/rs16101780, 2024. a
NASA AERONET: AERONET – Aerosol Robotic Network, https://aeronet.gsfc.nasa.gov/ (last access: 24 April 2023), 2023. a
Giglio, L. and Justice, C.: MODIS/Aqua Thermal Anomalies/Fire Daily L3 Global 1km SIN Grid V061, NASA EOSDIS Land Processes Distributed Active Archive Center [data set], https://doi.org/10.5067/MODIS/MYD14A1.061, 2021a. a
Giglio, L. and Justice, C.: MODIS/Terra Thermal Anomalies/Fire Daily L3 Global 1km SIN Grid V061, NASA EOSDIS Land Processes Distributed Active Archive Center [data set], https://doi.org/10.5067/MODIS/MOD14A1.061, 2021b. a
NASA Langley Research Center Atmospheric Science Data Center: CALIPSO Lidar Level 2 Aerosol Profile, V4-51, NASA Langley Research Center Atmospheric Science Data Center [data set], https://doi.org/10.5067/CALIOP/CALIPSO/CAL_LID_L2_05km APro-Standard-V4-51, 2023. a
Ndarana, T., Rammopo, T. S., Chikoore, H., Barnes, M. A., and Bopape, M.-J.: A quasi-geostrophic diagnosis of the zonal flow associated with cut-off lows over South Africa and surrounding oceans, Clim. Dynam., 55, 2631–2644, https://doi.org/10.1007/s00382-020-05401-4, 2020. a
Ndarana, T., Lekoloane, L. E., Rammopo, T. S., Reason, C. J. C., Bopape, M.-J. M., Chikoore, H., and Engelbrecht, F. A.: Downstream development during ridging South Atlantic Ocean anticyclones, Clim. Dynam., 61, 2865–2883, https://doi.org/10.1007/s00382-023-06717-7, 2023. a, b
Pak, B. C., Langenfelds, R. L., Young, S. A., Francey, R. J., Meyer, C. P., Kivlighon, L. M., Cooper, L. N., Dunse, B. L., Allison, C. E., Steele, L. P., Galbally, I. E., and Weeks, I. A.: Measurements of biomass burning influences in the troposphere over southeast Australia during the SAFARI 2000 dry season campaign, J. Geophys. Res.-Atmos., 108, 8480, https://doi.org/10.1029/2002JD002343, 2003. a
Patel, P. N., Dumka, U. C., Kaskaoutis, D. G., Babu, K. N., and Mathur, A. K.: Optical and radiative properties of aerosols over Desalpar, a remote site in western India: Source identification, modification processes and aerosol type discrimination, Sci. Total Environ., 575, 612–627, https://doi.org/10.1016/j.scitotenv.2016.09.023, 2017. a, b, c
Pickering, K. E., Thompson, A. M., Wang, Y., Tao, W.-K., McNamara, D. P., Kirchhoff, V. W. J. H., Heikes, B. G., Sachse, G. W., Bradshaw, J. D., Gregory, G. L., and Blake, D. R.: Convective transport of biomass burning emissions over Brazil during TRACE A, J. Geophys. Res.-Atmos., 101, 23993–24012, https://doi.org/10.1029/96JD00346, 1996. a
Platnick, S., King, M., and Hubanks, P.: MYD08 D3 MODIS/Aqua Aerosol Cloud Water Vapor Ozone Daily L3 Global 1Deg CMG, NASA Level-1 and Atmosphere Archive & Distribution System (LAADS) Distributed Active Archive Center (DAAC) [data set], https://doi.org/10.5067/MODIS/MOD08_D3.061, 2017. a
Ranaivombola, M.: Aerosol Optical Depth at 550 from CAMS Reanalysis (September 18 to 23, 2022), TIB AV-Portal [video], https://doi.org/10.5446/67052, 2024a. a, b, c
Ranaivombola, M.: Aerosol Optical Depth at 550 from CAMS Reanalysis (October 9 to 17, 2022), TIB AV-Portal [video], https://doi.org/10.5446/67051, 2024b. a
Ranaivombola, M., Bègue, N., Bencherif, H., Millet, T., Sivakumar, V., Duflot, V., Baron, A., Mbatha, N., Piketh, S., Formenti, P., and Goloub, P.: Aerosol Optical Properties and Types over Southern Africa and Reunion Island Determined from Ground-Based and Satellite Observations over a 13-Year Period (2008–2021), Remote Sensing, 15, 1581, https://doi.org/10.3390/rs15061581, 2023. a, b, c, d, e, f, g, h, i
Randerson, J. T., Chen, Y., van der Werf, G. R., Rogers, B. M., and Morton, D. C.: Global burned area and biomass burning emissions from small fires, J. Geophys. Res.-Biogeo., 117, G04012, https://doi.org/10.1029/2012JG002128, 2012. a
Redemann, J., Wood, R., Zuidema, P., Doherty, S. J., Luna, B., LeBlanc, S. E., Diamond, M. S., Shinozuka, Y., Chang, I. Y., Ueyama, R., Pfister, L., Ryoo, J.-M., Dobracki, A. N., da Silva, A. M., Longo, K. M., Kacenelenbogen, M. S., Flynn, C. J., Pistone, K., Knox, N. M., Piketh, S. J., Haywood, J. M., Formenti, P., Mallet, M., Stier, P., Ackerman, A. S., Bauer, S. E., Fridlind, A. M., Carmichael, G. R., Saide, P. E., Ferrada, G. A., Howell, S. G., Freitag, S., Cairns, B., Holben, B. N., Knobelspiesse, K. D., Tanelli, S., L'Ecuyer, T. S., Dzambo, A. M., Sy, O. O., McFarquhar, G. M., Poellot, M. R., Gupta, S., O'Brien, J. R., Nenes, A., Kacarab, M., Wong, J. P. S., Small-Griswold, J. D., Thornhill, K. L., Noone, D., Podolske, J. R., Schmidt, K. S., Pilewskie, P., Chen, H., Cochrane, S. P., Sedlacek, A. J., Lang, T. J., Stith, E., Segal-Rozenhaimer, M., Ferrare, R. A., Burton, S. P., Hostetler, C. A., Diner, D. J., Seidel, F. C., Platnick, S. E., Myers, J. S., Meyer, K. G., Spangenberg, D. A., Maring, H., and Gao, L.: An overview of the ORACLES (ObseRvations of Aerosols above CLouds and their intEractionS) project: aerosol–cloud–radiation interactions in the southeast Atlantic basin, Atmos. Chem. Phys., 21, 1507–1563, https://doi.org/10.5194/acp-21-1507-2021, 2021. a, b
Roy, C., Weeks, S., Rouault, M., Nelson, G., Barlow, R., and Van, d. L. C.: Extreme oceanographic events recorded in the Southern Benguela during the 1999–2000 summer season: research article, S. Afr. J. Sci., 97, 465–471, 2001. a
Schmid, B., Redemann, J., Russell, P. B., Hobbs, P. V., Hlavka, D. L., McGill, M. J., Holben, B. N., Welton, E. J., Campbell, J. R., Torres, O., Kahn, R. A., Diner, D. J., Helmlinger, M. C., Chu, D. A., Robles-Gonzalez, C., and de Leeuw, G.: Coordinated airborne, spaceborne, and ground-based measurements of massive thick aerosol layers during the dry season in southern Africa, J. Geophys. Res.-Atmos., 108, 8496, https://doi.org/10.1029/2002JD002297, 2003. a
Shikwambana, L., Kganyago, M., and Xulu, S.: Analysis of wildfires and associated emissions during the recent strong ENSO phases in Southern Africa using multi-source remotely-derived products, Geocarto Int., 37, 16654–16670, https://doi.org/10.1080/10106049.2022.2113449, 2022. a
Sinyuk, A., Torres, O., and Dubovik, O.: Combined use of satellite and surface observations to infer the imaginary part of refractive index of Saharan dust, Geophys. Res. Lett., 30, 1081, https://doi.org/10.1029/2002GL016189, 2003. a
Sinyuk, A., Holben, B. N., Eck, T. F., Giles, D. M., Slutsker, I., Korkin, S., Schafer, J. S., Smirnov, A., Sorokin, M., and Lyapustin, A.: The AERONET Version 3 aerosol retrieval algorithm, associated uncertainties and comparisons to Version 2, Atmos. Meas. Tech., 13, 3375–3411, https://doi.org/10.5194/amt-13-3375-2020, 2020. a
Smirnov, A., Holben, B. N., Eck, T. F., Dubovik, O., and Slutsker, I.: Cloud-Screening and Quality Control Algorithms for the AERONET Database, Remote Sens. Environ., 73, 337–349, https://doi.org/10.1016/S0034-4257(00)00109-7, 2000. a
Stein, D. C., Swap, R. J., Greco, S., Piketh, S. J., Macko, S. A., Doddridge, B. G., Elias, T., and Bruintjes, R. T.: Haze layer characterization and associated meteorological controls along the eastern coastal region of southern Africa, J. Geophys. Res.-Atmos., 108, 8506, https://doi.org/10.1029/2002JD003237, 2003. a, b
Sun, X., Cook, K. H., and Vizy, E. K.: The South Atlantic Subtropical High: Climatology and Interannual Variability, J. Climate, 30, 3279–3296, https://doi.org/10.1175/JCLI-D-16-0705.1, 2017. a
Swap, R. and Tyson, P.: Stable discontinuities as determinants of the vertical distribution of aerosols and trace gases in the atmosphere, S. Afr. J. Sci., 95, 63–71, 1999. a
Swap, R. J., Annegarn, H. J., Suttles, J. T., King, M. D., Platnick, S., Privette, J. L., and Scholes, R. J.: Africa burning: A thematic analysis of the Southern African Regional Science Initiative (SAFARI 2000), J. Geophys. Res.-Atmos., 108, 8465, https://doi.org/10.1029/2003JD003747, 2003. a, b, c, d
Tackett, J. L., Winker, D. M., Getzewich, B. J., Vaughan, M. A., Young, S. A., and Kar, J.: CALIPSO lidar level 3 aerosol profile product: version 3 algorithm design, Atmos. Meas. Tech., 11, 4129–4152, https://doi.org/10.5194/amt-11-4129-2018, 2018. a, b, c
Thompson, A. M., Pickering, K. E., McNamara, D. P., Schoeberl, M. R., Hudson, R. D., Kim, J. H., Browell, E. V., Kirchhoff, V. W. J. H., and Nganga, D.: Where did tropospheric ozone over southern Africa and the tropical Atlantic come from in October 1992? Insights from TOMS, GTE TRACE A, and SAFARI 1992, J. Geophys. Res.-Atmos., 101, 24251–24278, https://doi.org/10.1029/96JD01463, 1996. a
Torres, O., Tanskanen, A., Veihelmann, B., Ahn, C., Braak, R., Bhartia, P. K., Veefkind, P., and Levelt, P.: Aerosols and surface UV products from Ozone Monitoring Instrument observations: An overview, J. Geophys. Res.-Atmos., 112, D24S47, https://doi.org/10.1029/2007JD008809, 2007. a
Twomey, S.: The Influence of Pollution on the Shortwave Albedo of Clouds, J. Atmos. Sci., 34, 1149–1152, https://doi.org/10.1175/1520-0469(1977)034<1149:TIOPOT>2.0.CO;2, 1977. a
van der Werf, G. R., Randerson, J. T., Giglio, L., van Leeuwen, T. T., Chen, Y., Rogers, B. M., Mu, M., van Marle, M. J. E., Morton, D. C., Collatz, G. J., Yokelson, R. J., and Kasibhatla, P. S.: Global fire emissions estimates during 1997–2016, Earth Syst. Sci. Data, 9, 697–720, https://doi.org/10.5194/essd-9-697-2017, 2017. a
Yang, X., Zhao, C., Yang, Y., and Fan, H.: Long-term multi-source data analysis about the characteristics of aerosol optical properties and types over Australia, Atmos. Chem. Phys., 21, 3803–3825, https://doi.org/10.5194/acp-21-3803-2021, 2021. a
Yu, X., Kumar, K. R., Lü, R., and Ma, J.: Changes in column aerosol optical properties during extreme haze-fog episodes in January 2013 over urban Beijing, Environ. Pollut., 210, 217–226, https://doi.org/10.1016/j.envpol.2015.12.021, 2016. a
Zaman, S. U., Pavel, M. R. S., Rani, R. I., Jeba, F., Islam, M. S., Khan, M. F., Edwards, R., and Salam, A.: Aerosol climatology characterization over Bangladesh using ground-based and remotely sensed satellite measurements, Elementa: Science of the Anthropocene, 10, 000063, https://doi.org/10.1525/elementa.2021.000063, 2022. a, b
- Abstract
- Introduction
- Site location, instrumentation, and methods
- Evolution of aerosol properties during BiBAC
- Transport of CO and aerosol plume
- Summary and conclusion
- Data availability
- Video supplement
- Author contributions
- Competing interests
- Disclaimer
- Acknowledgements
- Financial support
- Review statement
- References