the Creative Commons Attribution 4.0 License.
the Creative Commons Attribution 4.0 License.
 | 24 Mar 2025
Study of optical scattering properties and direct radiative effects of high-altitude cirrus clouds in Barcelona, Spain, with 4 years of lidar measurements
Cristina Gil-Díaz
Michäel Sicard
Odran Sourdeval
Athulya Saiprakash
Constantino Muñoz-Porcar
Adolfo Comerón
Alejandro Rodríguez-Gómez
Daniel Camilo Fortunato dos Santos Oliveira
Cloud–radiation interaction still drives large uncertainties in climate models, and its estimation is key to make more accurate predictions. In this context, high-altitude cirrus clouds play a fundamental role because (1) they have a high occurrence frequency globally and (2) they are the only cloud that can readily cool or warm the atmosphere during daytime, depending on their properties. This study presents a comprehensive analysis of optical scattering properties and direct radiative effect of cirrus clouds based on 4 years of continuous ground-based lidar measurements with the Barcelona (Spain) Micro Pulse Lidar. First, we introduce a novel approach of a self-consistent scattering model for cirrus clouds to determine their optical scattering properties at different wavelengths using only the extinction coefficient and cloud temperature. Second, we calculate the direct radiative effects of cirrus clouds with the discrete ordinates method, and we validate our results with SolRad-Net pyranometers and NOAA-20 measurements. Third, we present a case study analysing the direct radiative effect of a cirrus cloud along its back-trajectory using data from the Chemical LAgrangian Model of the Stratosphere with microphysics scheme for Ice clouds formation (CLaMS-Ice). The results show that the cirrus clouds with an average ice water content of 4.97 ± 5.53 mg m−3, in the nighttime, have a positive direct radiative effect at the top of the atmosphere (TOA; +40.4 W m−2) almost twice than at the bottom of the atmosphere (BOA; +22.1 W m−2); in the daytime, they have generally a negative direct radiative effect at BOA (−11.5 W m−2, 82 % of the cases) and always a positive effect at TOA (+14.2 W m−2). In these simulations, the influence of the lower layer aerosols is negligible in the cirrus direct radiative effects, with a bias (denoted BIAS) of −1.2 %. For the case study, the net direct radiative effects produced by the cirrus cloud, are from 0 to +40 W m−2 at TOA and from −51 to +20 W m−2 at BOA. This study reveals that the complexity of the cirrus cloud direct radiative effect calculation lies in the fact that it is highly sensitive to the cirrus scene properties.
- Article
(1114 KB) - Full-text XML
- BibTeX
- EndNote


Cloud–radiation interaction still drives large uncertainties in weather and climate models (IPCC, 2023). Its estimation is very important in order to understand the main physical processes driving climate change, to predict long-term global warming and to make more accurate weather predictions. Loeb et al. (2009) estimated globally an annual cloud shortwave radiative effect of approximately −50 W m−2 and longwave effect of approximately +30 W m−2 at the top of the atmosphere. The resulting net global mean cloud radiative effect of approximately −20 W m−2 implies a net cooling effect of clouds on the current climate. Owing to the large magnitudes of the cloud radiative effects, clouds cause a significant climate feedback that depends on cloud properties and their spatial distribution (IPCC, 2023). In this context, high-altitude cirrus clouds play a fundamental role in the global radiation budget (Liou, 1986; Lolli et al., 2017b), having been designated as poorly understood by IPCC (2023) because of a lack of knowledge of their dynamic, microphysical and optical scattering properties. Indeed, the critical role of cirrus clouds in the climate comes from the fact that (1) they have a high occurrence frequency globally (Holz et al., 2008) and (2) they are the only cloud that can readily cool or warm the top of the atmosphere and bottom of the atmosphere, during daytime, depending on their properties (Campbell et al., 2016). In fact, Campbell et al. (2016) demonstrated through a 1-year-long lidar dataset that positive or negative daytime cirrus cloud forcing could occur depending on the cloud optical depth (COD) and the solar zenith angle (SZA).
Cirrus clouds are mainly composed of ice crystals and can form through different atmospheric mechanisms that determine their initial properties and further evolution. In European field campaigns it has been observed that during a low- or high-pressure system, cirrus clouds are typically formed by a slow updraft, while in conjunction with jet streams or gravity waves, cirrus clouds originate as a consequence of a fast updraft. Also, liquid origin cirrus clouds mostly related to warm conveyor belts are found (Kramer et al., 2016). The most common parameters that are measured in cirrus clouds are temperature, relative humidity (for ice), vertical velocity, ice water content, ice crystal number, ice nucleation particles and ice crystal size distribution. Unfortunately, the measurements of ice crystal number and size as well as relative humidity have faced instrumental problems during recent decades (Korolev et al., 2011; Kramer et al., 2016). Moreover, it is a difficult task to draw conclusions about the microphysical processes of cirrus clouds from these observations. Nevertheless, worldwide studies on cloud and aerosol optical and microphysical properties have increased significantly over the last years through passive ground-based measurements made, for example, by the European Aerosol Research LIdar NETwork (EARLINET; Pappalardo et al., 2014), now included in the Aerosols, Clouds and Trace gases Research Infrastructure (ACTRIS; Saponaro et al., 2019) and Micro Pulse Lidar NETwork (MPLNET; Welton et al., 2001), and satellite measurements, for example, by Cloud-Aerosol Lidar and Infrared Pathfinder Satellite Observations (CALIPSO; Winker et al., 2007); AEOLUS (Ingmann and Straume, 2016); MODerate-resolution Imaging System (MODIS; Levy et al., 2013); and the Earth Cloud, Aerosol and Radiation Explorer (EarthCARE; Eisinger et al., 2017). Additionally, in situ airborne measurement campaigns have been carried out such as the First ISCCP Project Regional Experiment (FIRE) from 1989 to 1995 (Ackerman et al., 1990; Heymsfield et al., 1990; Heymsfield and Miloshevich, 1995); the International Cirrus Experiment (ICE) campaign in 1989 (Raschke et al., 1987); the EUropean Cloud Radiation EXperiment (EUCREX) in 1993 and 1994 (Sauvage et al., 1999); the Field Radiation Experiment on Natural Cirrus and High-level clouds (FRENCH) in 2001 (Brogniez et al., 2004); the Tropical Composition, Cloud and Climate Coupling (TC4) campaign in 2007 (King et al., 2010; Toon et al., 2010); and the CIRRUS-HL campaign in 2021, which is the follow-up to the CIRRUS-ML campaign in 2017 (Voigt et al., 2017; De La Torre Castro et al., 2023).
Up to the present, there have been three possibilities for characterizing cirrus clouds. One option is the use of in situ airborne measurements. A second option is to work with a microphysical cirrus cloud model like the Chemical LAgrangian Model of the Stratosphere with microphysics scheme for Ice clouds formation (CLaMS-Ice) (Spichtinger and Gierens, 2009) or Model for aerosol and ice dynamics (MAID) (Bunz et al., 2008; Rolf et al., 2012) that simulates the cirrus cloud development based on the cirrus bulk model using back-trajectories. The main advantage of this choice is that there is no need to have in situ airborne lidar measurements. A third option is to employ lidar measurements for the characterization of cirrus clouds. For that purpose, it is necessary to use a method such as the two-way transmittance method to characterize cirrus clouds optically (Gil-Díaz et al., 2024) together with a scattering model to obtain optical scattering retrievals. For example, Baran and Labonnote (2007), Baran et al. (2009), Baran et al. (2011a), Baran et al. (2011b), Baran et al. (2014), and Vidot et al. (2015) relate the cirrus ice water content (IWC) and cloud temperature with the extinction coefficient, single-scattering albedo (SSA) and asymmetry factor (g). Alternatively, Heymsfield et al. (2014) and Dolinar et al. (2022) propose calculating the cirrus ice water content from the extinction coefficient at a visible wavelength and the effective geometric diameter of the ice crystals, which in turn is a function of temperature. Once the cirrus ice content and the effective geometric diameter of ice crystals are obtained, the scattering and absorption coefficients and the asymmetry factor can be calculated with the (Fu et al., 1998, 1999; Lolli et al., 2017a) parametrizations.
The objective of this paper is to analyse the optical scattering properties and direct radiative effects of cirrus clouds based on 4 years of continuous ground-based lidar measurements obtained from the NASA Micro Pulse Lidar NETwork (MPLNET; https://mplnet.gsfc.nasa.gov/, last access: 8 July 2024) in Barcelona. Specifically, the optical scattering properties of cirrus clouds have been calculated with a new approach of the self-consistent scattering model for cirrus clouds (Baran and Labonnote, 2007; Baran et al., 2014; Vidot et al., 2015), using only lidar measurements, and radiosounding data and their direct radiative effects have been calculated with the ARTDECO package. The instrumentation used is presented in Sect. 2. A new approach of the self-consistent scattering model for cirrus clouds, the radiative transfer model DISORT and the CLaMS-Ice model are presented in Sect. 3.1, 3.2 and 3.3, respectively. The results obtained in this paper are shown in Sect. 4, and conclusions are presented in Sect. 5.
The radiative characterization of cirrus clouds relies on the results obtained from Gil-Díaz et al. (2024) and the instrumentation detailed below.
2.1 NASA Micro Pulse Lidar NETwork
A more detailed description of this instrumentation can be found in Gil-Díaz et al. (2024). In this study, we use the Aerosol (AER) product, which provides 1 min temporal resolution and at 75 m vertical resolution variables like aerosol extinction, backscatter and the column lidar ratio (Welton et al., 2000, 2002, 2018; Lolli et al., 2019). This product is used to characterize the aerosol layer which is closest to the surface. The MPLNET AER product integrates solar and lunar photometer measurements, allowing the lidar signal to be inverted to obtain aerosol properties over a 24 h period.
2.2 Meteorological Service of Catalonia
The Meteorological Service of Catalonia (Meteocat) releases radiosondes twice a day (at 00:00 and 12:00 UTC) at a location less than 1 km from the MPL site. The radiosondes provide data of pressure, altitude, temperature, relative humidity, wind speed and wind direction. However, only altitude, pressure and temperature profiles are used in this study.
2.3 Solar Radiation Network
The Solar Radiation Network (SolRad-Net, https://solrad-net.gsfc.nasa.gov/, last access: 8 July 2024) is a network of ground-based sensors that provide high-frequency solar flux measurements to the scientific community in near-real time. This programme operates in conjunction with AERONET, since its instrumentation is collocated at the AERONET sites. Each SolRad-Net station is initially equipped with two flux sensors: a Kipp & Zonen CM-21 pyranometer (0.305–2.8 µm) to measure the full solar spectrum and a Skye Instrument SKE-510 PAR (photosynthetically active radiation) Energy sensor (0.4–0.7 µm).
For this study, data from the Kipp & Zonen instrument Level 1.0 (unscreened and without final calibration) are used for the period from 2018 to 2022. The Kipp & Zonen CM-21 units are ISO 9060 Secondary Standard thermopile pyranometers, equipped with a receiving element enclosed by two concentric Schott K5 glass domes. Further details on the instrument can be found online (https://www.kippzonen.com/Product/14/CMP21-Pyranometer, last access: 1 February 2024).
2.4 Clouds and the Earth’s Radiant Energy System project
The Clouds and the Earth's Radiant Energy System project (CERES; https://ceres.larc.nasa.gov/, last access: 8 July 2024) provides measurements of Earth's radiation budget using data from CERES instruments on board the Terra, Aqua and Suomi National Polar-orbiting Partnership (S-NPP) and NOAA-20 satellites (Loeb et al., 2016). The primary objectives of the CERES project are (1) to create a long-term, integrated global climate data record that can detect decadal changes in the Earth’s radiation budget; (2) to enhance the understanding of the temporal and spatial variability in Earth's radiation budget and the role of clouds and other atmospheric properties; and (3) to support climate model evaluation and improvement through model–observation comparisons.
In this study, we use the CERES instantaneous Single Scanner Footprint (SSF) product at Level 2 to analyse observations of the upward fluxes at the top of the atmosphere, the surface emissivity in the longwave spectral range (5–100 µm), the surface albedo in the shortwave spectral range (0.2–5 µm), the surface temperature and the clear-sky percentage for the period from 2018 to 2022. Surface albedo is calculated as one minus the surface emissivity. The CERES data used come from the NOAA-20 satellite (overpassing Barcelona between 11:00 and 13:00 UTC and between 00:00 and 02:00 UTC). This dataset is provided with a surface spatial resolution of ∼20 km at nadir (Su et al., 2015).
2.5 NASA AErosol RObotic NETwork
The NASA AErosol RObotic NETwork (AERONET, https://aeronet.gsfc.nasa.gov/, last access: 8 July 2024) is a global network of ground-based sun and lunar photometers established by NASA and LOA-PHOTONS (CNRS). For over 2 decades, AERONET has provided a long-term, continuous, publicly accessible database of aerosol optical and microphysical properties for aerosol characterization, satellite retrieval validation, and synergism with other databases. The network enforces strict standardization of instruments, calibration, processing and distribution.
For this study, Version 3.0, Level 1.5 (cloud-screened and quality-controlled) inversion products are used for the period from 2018 to 2022. To characterize aerosols in the lowest tropospheric layer in the shortwave spectrum (SW; 0.2–4 µm), variables like aerosol optical depth (AOD), single-scattering albedo (SSA) and asymmetry factor (g) are analysed. For wavelengths outside AERONET's working range in the SW spectrum, the Ångström exponent is used (Wagner and Silva, 2008). For example, the Ångström exponent is calculated using AOD values at 440 and 675 nm to estimate AOD at 550 nm. In the longwave spectrum (LW, 2–40 µm), aerosol optical properties are extracted from the Laboratory for Information Technologies and Mathematical Simulation (LITMS) database (Rublev et al., 1994).
2.6 The Cloud-Aerosol Lidar and Infrared Pathfinder Satellite Observation
Further details on this instrument are provided in Gil-Díaz et al. (2024). To validate the ice water content from the Lagrangian microphysical cirrus model CLaMS-Ice (see Sect. 3.3), we use the CALIPSO “5 km Cloud Layer (05kmCLay)” product, at Level 2 (L2) and Version 4.20 (V4.20), available from June 2006. This product offers a horizontal averaging resolution of 5 km, with up to 10 layers reported per profile. This product contains geometrical, thermal and optical properties for each detected cloud layer such as layer top/base altitude and temperature, integrated attenuated backscattering coefficients at 532 and 1064 nm, integrated particle depolarization ratio, and ice water path. The ice water content is estimated by dividing the ice water path by the geometrical thickness of the cloud layer.
The optical scattering properties of cirrus scenes are determined through the use of a self-consistent scattering model for cirrus clouds (Baran and Labonnote, 2007; Baran et al., 2014; Vidot et al., 2015), and their direct radiative effects are calculated with the ARTDECO package, which implements a variety of optical properties into state-of-the-art radiative transfer models (see below).
3.1 The self-consistent scattering model for cirrus clouds
The self-consistent scattering model for cirrus clouds consists of an ensemble of six ice crystal types. The simplest form is a hexagonal ice column with an unity aspect ratio, while more complex ice crystals are formed by randomly attaching additional hexagonal elements, until a chain-like structure is created. As ice crystals grow in size, their complexity increases, and they generally become more spatially extended, with the hexagonal components elongating over time (Heymsfield and Miloshevich, 2003). The ensemble consists of six distinct members, starting with the hexagonal ice column and followed by a six-branched bullet rosette. Subsequent crystals are formed by attaching hexagonal monomers together as a function of their maximum dimension, resulting in aggregates containing 3–10 hexagonal elements. This ensemble is designed to represent the various ice crystal types observed in cirrus clouds during different measurement campaigns (Heymsfield and Miloshevich, 2003; Lawson et al., 2003; Connolly et al., 2005). For instance, bullet rosettes are included because they are frequently observed in mid-latitude and Arctic regions (Lawson et al., 2006; Schmitt et al., 2006), with their geometry described in Macke et al. (1996). Each ensemble member is constructed to avoid intersecting planes, and the crystals are arranged so that multiple internal reflections between them are negligible, which was verified experimentally using ray-tracing techniques. The first member represents the smaller ice crystals in the particle size distribution (PSD), whilst the hexagonal ice aggregates represent the process of ice crystal aggregation, corresponding to the larger crystals in the PSD. The six members are evenly distributed across the PSD. The assumed PSD follows the moment estimation parametrization of Field et al. (2003, 2007). The self-consistent scattering model for the cirrus cloud database consists of more than 20 000 PSDs of tropical and mid-latitude cirrus at temperatures between −60 and 0 °C. For each PSD, this database provides the simulated optical scattering properties (scattering, absorption coefficient and asymmetry factor) as a function of the decimal logarithm of ice water content (LIWC) and the cloud temperature (T) by nonlinear least-squares fitting (Vidot et al., 2015). This parametrization excludes ice crystals smaller than 100 µm due to shattering issues on closed-path instruments (Korolev et al., 2011), assuming an exponential PSD fit instead. For crystals larger than 100 µm, measured PSDs were filtered to reduce the likelihood of including shattered crystal artefacts.
In this study, we present a new methodology for calculating the optical scattering properties of cirrus clouds across different wavelengths, as shown in Fig. 1. First, we calculate the ice water content of the cirrus cloud by Eq. (1), which is independent of wavelength, by introducing the extinction coefficient for a cloud temperature in each vertical layer of the model into Eq. (3) by (Vidot et al., 2015). To align these calculations with the model vertical resolution of 1 km at cirrus cloud levels, we previously degrade the vertical resolution of the cloud extinction and temperature profiles through vertical averaging.
The working wavelength of the lidar system is defined as λo, and in this study it is 0.532 µm. The extinction coefficient, (z,t), is retrieved using the two-way transmittance method (Gil-Díaz et al., 2024). T(z,t) denotes the cloud temperature, while As to Fs are the parametrization coefficients as defined in Vidot et al. (2015). This formulation provides a unique physical solution and simplifies the IWC calculation based on extinction coefficient and cloud temperature, assuming no absorption, which is entirely reasonable because the working wavelength lies within the visible spectral range (Sun and Shine, 1994). Once the IWC is obtained, this variable is introduced into Eqs. (2)–(4) of Vidot et al. (2015) to calculate the absorption, scattering and asymmetry factor coefficients for each wavelength. From these variables, the extinction coefficient and the single-scattering albedo are also subsequently derived.
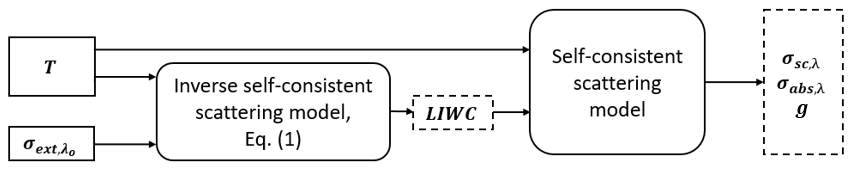
Figure 1Scheme of the new model approach of the self-consistent scattering model for cirrus clouds.
The main advantage of this model is that it is not necessary to calculate the ice particle shapes and their size distributions in order to calculate their optical scattering properties. These variables can be obtained easily with only elastic lidar systems and radiosondes or meteorological models. An example of the application of this method is shown in Fig. 2 for a cirrus cloud of 8 December 2018 at 12:00 UTC, measured in Barcelona.
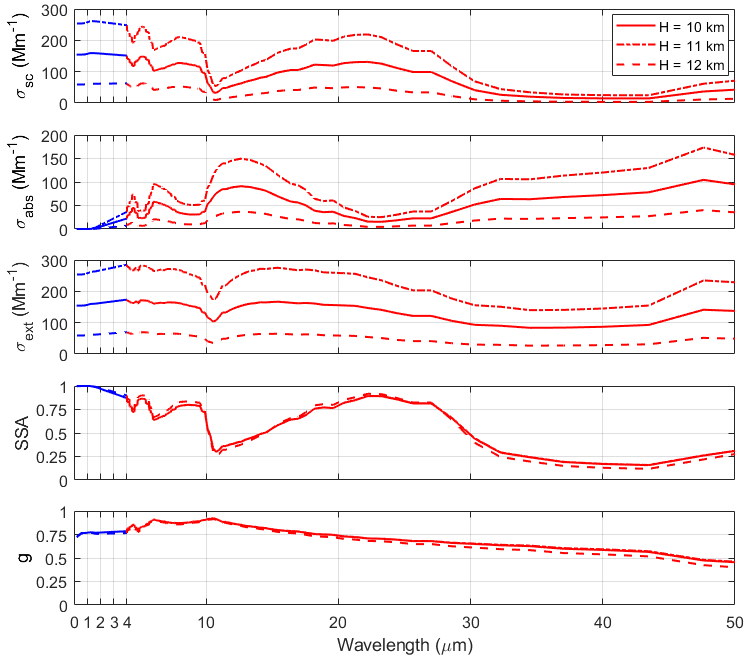
Figure 2Spectral dependence of the optical scattering properties obtained by the self-consistent scattering model for cirrus clouds: scattering, absorption, extinction coefficients, single-scattering albedo and asymmetry factor (from top to bottom) for a three-level discretized cirrus cloud of 8 December 2018 at 12:00 UTC, measured in Barcelona. The colours indicate the shortwave range (blue; 0.2–4 µm) and longwave range (red; 4–50 µm). The extinction coefficients in each vertical layer used as input of the self-consistent scattering model for cirrus clouds are 154, 254 and 59 Mm−1. The temperatures in each vertical layer used also as input are −51, −58 and −62 °C. The ice water contents calculated using the self-consistent scattering model for cirrus clouds in each vertical layer are 3.8, 6.2 and 1.4 mg m−3.
Figure 2 shows the spectral dependence of the optical scattering properties obtained by the self-consistent scattering model for cirrus clouds for each vertical layer of the cirrus cloud. Extinction and scattering exhibit significant variation across the vertical layers of the cirrus cloud, while absorption shows a comparatively smaller variation. Nonetheless, the single-scattering albedo and asymmetry factor remain remarkably consistent across all three layers. These optical scattering properties are characteristic of ice crystals, reflecting their strong influence on the cloud optical behaviour. For example, it shows an absorption phenomenon negligible in the spectral range between 0.2 and 2 µm, and consequently, the single-scattering albedo is approximately unity. As expected, the scattering phenomenon dominates the whole spectrum with respect to absorption except in the regions around 12 µm and for wavelengths higher than 30 µm (Yang et al., 2005, 2013). It is also noteworthy that the single-scattering albedo varies generally between 0.1 and 1, and at the working wavelength used in the model (0.532 µm) it has a value of 0.99 (Sun and Shine, 1994). This fact supports the hypothesis made previously that the absorption phenomenon is negligible. The asymmetry factor presents much less variation than observed in the literature (Fu et al., 1998; Yang et al., 2005, 2013): it increases between 0.2 and 10 µm (in the range 0.75–0.95) and decreases afterwards (in the range 0.95–0.40).
3.2 The ARTDECO package
The Atmospheric Radiative Transfer Database for Earth and Climate Observation package (ARTDECO; https://www.icare.univ-lille.fr/artdeco/, last access: 1 March 2024) is a numerical tool that gathers models and data for the 1D simulation of Earth atmosphere radiances and fluxes from the ultraviolet to thermal infrared range (0.2–50 µm). It is developed and maintained at the Laboratoire d'Optique Atmosphérique (LOA) and distributed by the Data and Services Centre AERIS/ICARE (University of Lille) and funded by the TOSCA programme of the French space agency (CNES). In ARTDECO, users can either access a library for the scene or use their own description through ASCII input files. Optical properties for aerosols and clouds can be computed. Then, the user can choose among available models to solve the radiative transfer equation and to compute radiative quantities corresponding to the scene. ARTDECO is thus a flexible tool for remote sensing or direct radiative effect applications, such as sensitivity studies, development and optimization of retrieval algorithms, and evaluation of the future performances of instruments.
In this study, the DISORT model is employed to solve the radiative transfer equation by discretizing it (Stamnes et al., 2000). The ARTDECO environment allows us to solve the radiative transfer equation in two ways: (1) by introducing our own phase matrix as a function of wavelength and (2) by using the Henyey–Greenstein function (Henyey and Greenstein, 1941), given extinction, single-scattering albedo and asymmetry factor values over the whole spectral range in which the simulation will be done. Due to the lack of knowledge of the phase matrix of cirrus clouds with the observational measurements with which we work, the second option is chosen even though the Henyey–Greenstein function does not represent a good approximation to the real phase function, especially for ice crystals. Upward and downward radiative fluxes are calculated at different vertical levels: 31 layers (0–20 km) in the shortwave (SW; 0.2–4 µm) and 40 layers (0–100 km) in the longwave (LW; 4–50 µm) spectra. These spectral/vertical ranges are adjustable, together with their spectral/vertical resolution. Cirrus direct radiative effects at the bottom of the atmosphere (BOA) and top of the atmosphere (TOA) have been calculated as the difference between radiative fluxes:
where Fc and Fo are the radiative fluxes with and without the cirrus cloud, respectively. The ↓ and ↑ arrows indicate whether the fluxes are downward or upward, respectively. The simplification of Eq. (3) implies the assumption that the amount of the incoming solar radiation at the TOA is equal for cases both with and without aerosols. With this convention, a negative sign of DRE implies a cirrus cooling effect independently of whether it occurs at the BOA or at the TOA. In this study, four types of simulations are carried out: with gases only (G); with gases and aerosols in the layer closest to the surface (GA); with gases and a cirrus cloud (GC); and finally, with everything (GAC). In Sect. 4.3, the direct radiative effects of cirrus clouds in the full atmosphere and in the whole spectral range considering aerosols (GAC–GA) or no aerosols (GC–G) are compared. Besides aerosol optical properties, the radiative transfer model (RTM) DISORT is sensitive to atmospheric parameters such as the relative humidity, the air temperature profiles, the surface emissivity and temperature, or the aerosol vertical distribution (Sicard et al., 2014).
The cirrus clouds are parametrized in the RTM geometrically and optically, with the results obtained (Gil-Díaz et al., 2024) and the retrievals obtained with the self-consistent scattering model for cirrus clouds (see Sect. 3.1). At the same time, the planetary boundary layer is characterized in the DISORT model geometrically and optically with the MPLNET AER product and radiatively, on one hand, in the SW with the AERONET products and, on the other hand, in the LW with the LITMS database.
3.2.1 Atmospheric profiles
The DISORT RTM is run with atmospheric profiles (pressure, temperature, water vapour mixing ratio) obtained from radiosondes launched in Barcelona at 00:00 and 12:00 UTC. The profiles of ozone concentration are obtained from the Copernicus Atmosphere Monitoring Service (CAMS) global reanalysis (EAC4) (Inness et al., 2019). EAC4 (ECMWF Atmospheric Composition Reanalysis 4) is the fourth-generation ECMWF global reanalysis of atmospheric composition. Reanalysis combines model data with observations from across the world into a globally complete and consistent dataset using a model of the atmosphere based on the laws of physics and chemistry. The dataset is globally distributed with a horizontal resolution of 0.75° × 0.75° and a vertical extension of 60 modes (from 1000 to 1 hPa). In exceptional cases, when no radiosondes or CAMS data are available and for heights not covered by the radiosondes (generally above 30 km), the atmospheric profiles are taken from the 1976 standard atmosphere (COESA, 1976).
3.2.2 Surface properties
On one hand, the surface albedo in the SW range over the Barcelona region is estimated from AERONET data, while on the other hand, the LW surface albedo is obtained from NOAA-20 measurements. The surface temperature is also taken from the NOAA-20 observations. In the parametrization of cirrus scenes, the surface emissivity in the longwave spectrum, the surface albedo in the shortwave spectrum and the surface temperature measured by the NOAA-20 satellite have been incorporated as instantaneous values. In contrast, the surface albedo measured by AERONET has been averaged seasonally due to its smoother temporal variation and its small influence on the simulations in that spectrum.
3.2.3 Cloud/aerosol stratification
The vertical stratification of cloud/aerosols is reproduced according to the vertical profiles of MPLNET products. On the one hand, the base and top of the cirrus clouds are obtained from Gil-Díaz et al. (2024). On the other hand, the vertical distribution of the aerosols in the planetary boundary layer (PBL) is provided by the MPLNET AER product. When this product is not available for that specific time period, it is assumed that aerosols are uniformly distributed throughout the aerosol layer, which extends up to 1.5 km, the mean PBL height obtained in Barcelona over a 3-year period (Sicard et al., 2006).
3.3 The CLaMS-Ice Lagrangian microphysical cirrus model
CLaMS-Ice is a Lagrangian model for cirrus microphysics (Luebke et al., 2016; Baumgartner et al., 2022), intended to compute the evolution of ice microphysics along air parcel trajectories. The Chemical Lagrangian Model of the Stratosphere (CLaMS) (McKenna et al., 2002a, b; Konopka et al., 2004) performs the analysis of air mass back trajectories starting at arbitrary location in the atmosphere. The trajectories are derived from ECMWF windfields and are selectable over an arbitrary time frame. Small-scale temperature fluctuations not considered in the ECMWF wind fields are accounted for by superimposing temperature fluctuations according to Podglajen et al. (2016). Next, the CLaMS-Ice model is run in the trajectories' forward direction using the two-moment box model developed by Spichtinger and Gierens (2009) to simulate cirrus cloud development. The two-moment scheme includes homogeneous and heterogeneous nucleation of ice; depositional growth of ice crystals; and their evaporation, aggregation and sedimentation (sedimentation parametrization after Spichtinger and Cziczo, 2010; the sedimentation parameter is set to 0.97). Heterogeneous freezing starts at a critical supersaturation of 120 %. The initial concentration of ice-nucleating particles is prescribed in the model (mean value: 0.01 cm−3). As ice particles evaporate, ice nucleating particles are released back into the air parcel. The model predicts the ice number concentration and the ice water content. The two-moment scheme only considers the trajectories that end at T<238 K. If a part of the trajectory existed at T>238 K before crossing into the colder cirrus environment, then the forward model is initialized with pre-existing ice from mixed-phase clouds, if present in the IWCs found in the ECMWF data. The IWC of the pre-existing ice is converted to ice number concentration using a reparametrization (Costa, 2017), and then CLaMS-Ice proceeds as for newly formed cirrus clouds.
This study analyses the optical scattering properties of cirrus clouds that were previously characterized geometrically, thermally and optically in Gil-Díaz et al. (2024). In the latter paper, 203 cases were analysed. Here, atmospheric scenes with only one cirrus cloud in the vertical profile are studied; 125 single-cirrus cloud scenes are found, which constitutes 61 % of all cases. Case selection involves discarding cirrus scenes where a mid-level cloud has been detected below the cirrus cloud. Mid-level cloud detection was performed through visual analysis during the application of the two-way transmittance method (Gil-Díaz et al., 2024). This selection ensures the simulated cirrus scenes accurately represent reality (see Sect. 4.2).
4.1 Cirrus optical scattering properties
After having carried out the identification of 125 high-altitude cirrus scenes with only a cirrus cloud in the vertical profile (being the 39 % of cirrus clouds measured in the daytime), the self-consistent scattering model for cirrus clouds is applied to obtain their optical scattering properties (see Sect. 3.1). In this section the optical scattering properties of cirrus clouds are presented and discussed. For this purpose, probability distributions of the following vertical averages of optical scattering properties for each cirrus scene, ice water content, single-scattering albedo and asymmetry factor, calculated at 0.55 µm are shown in Fig. 3.
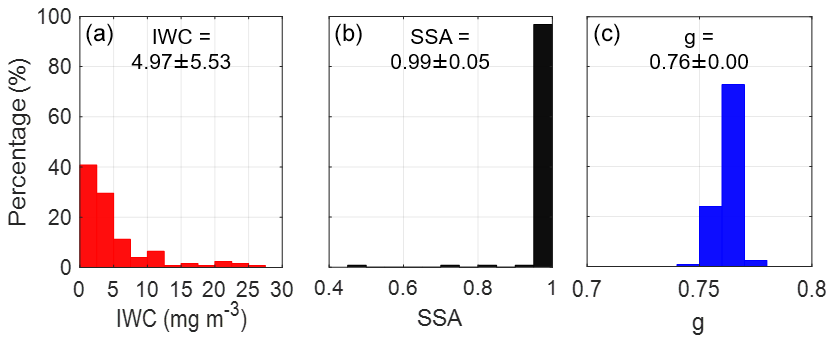
Figure 3Probability distribution of averages of (a) ice water content (IWC), (b) single-scattering albedo (SSA) and (c) asymmetry factor (g) for different cirrus scenes at 0.55 µm, measured from 2018 to 2022 in Barcelona.
In Fig. 3 one observes that cirrus clouds have an IWC between 0.03 and 30 mg m−3, which is characteristic of mid-latitude cirrus clouds (Korolev et al., 2001; Field et al., 2005, 2006; Schiller et al., 2008; Baran et al., 2011b; Sourdeval, 2012; Kramer et al., 2016, 2020). The average of IWC is ∼5 mg m−3, which is a value close to 3 mg m−3, which is the central value of the mid-latitude ice cloud distributions obtained by Sourdeval (2012) and the mean value of IWC for temperatures between 210 and 235 K found in Kramer et al. (2016). A slightly higher measured IWC value of 7 mg m−3 was found by Korolev et al. (2001) for cirrus clouds whose temperature ranged from 233 to 243 K. The single-scattering albedo of most cirrus clouds (97 %) has a value between 0.95 and 1, as expected at 0.55 µm (Hess and Wiegner, 1994; Sun and Shine, 1994; Yang et al., 2013; Hemmer, 2018). However, there are three cases of cirrus clouds whose SSA < 0.9. These cases correspond to sub-visible cirrus clouds with an IWC less than 1 mg m−3. These three cases have in common that the cirrus cloud extends in two vertical layers of the model, and in one of the layers, the extinction coefficient is less than 1 Mm−1. In this layer, a low value of SSA is obtained, associated with its low value of the extinction coefficient, and consequently, when averaging the optical scattering properties in the two layers for each cirrus scene, the values of SSA < 0.9 observed in Fig. 3 are obtained. Therefore, the coefficients of the self-consistent scattering model for cirrus clouds might only yield valid results for an initial extinction larger than 1 Mm−1. The asymmetry factor of cirrus clouds varies between 0.7 and 0.8, with an average of 0.76, as expected at 0.55 µm (Hess and Wiegner, 1994; Sun and Shine, 1994; Yang et al., 2013; Hemmer, 2018).
4.2 Validation of radiative fluxes
The validation of the ARTDECO package is performed by comparing the simulated radiative fluxes with observed ones. For that purpose, the radiative fluxes from ARTDECO were recalculated in the range 0.305–2.8 µm corresponding to the spectral range of the SolRad-Net pyranometer (BOA) and in the range 5–100 µm corresponding to the spectral range of NOAA-20 (TOA). The scatter plot of the simulated vs. observed SW downward radiative fluxes of cirrus clouds classified according to their cloud optical depth (Sassen and Cho, 1992), at the surface, and the LW upward radiative fluxes at TOA is shown in Fig. 4.
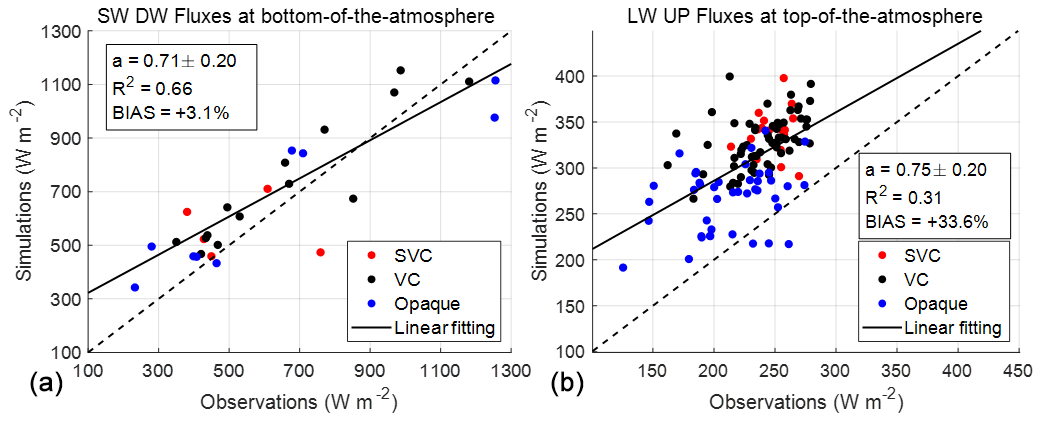
Figure 4Comparison of (a) simulated shortwave downward (SW DW) radiative fluxes at the bottom of the atmosphere and SolRad-Net observations and (b) simulated longwave upward (LW UP) radiative fluxes at the top of the atmosphere and NOAA-20 observations. The dashed black line is the curve with the slope unity, and the solid black line is the linear fitting of the fluxes (, where a is the slope and R2 its determination coefficient). The cirrus clouds have been classified according to Sassen and Cho (1992) criteria: sub-visible (SVC; COD < 0.03), visible (VC; 0.03 < COD < 0.3) and opaque clouds (opaque; COD > 0.3).
The validation of the SW downward radiative fluxes is performed with 59 % of the cirrus clouds measured in the daytime and the validation of the LW upward radiative fluxes with 81 % of all cirrus clouds considered in this study. The cases of cirrus clouds that could not be validated are due to the lack of observations. In addition, to reduce the effect of cloud movement on the radiation measurement with the pyranometer, the observed radiation fluxes are averaged over 30 min. In Fig. 4 (left), it can be seen that most downward radiative fluxes calculated with the DISORT model overestimate the SolRad-Net observations: the mean and standard deviation of the simulated fluxes are 694 ± 247 W m−2, while it is 621 ± 283 W m−2 for the observations. This translates into a systematic bias (hereafter denoted as BIAS) of +11.6 %, with a steep slope of the linear regression (a=0.71 ± 0.20). The overestimation may be related to the error associated with variables obtained by the self-consistent scattering model for cirrus clouds, as cirrus clouds govern the radiation interactions in these simulations because of their cloud optical depth. The ensemble scattering model for cirrus clouds has a large error for small ice crystals (less than 100 µm), corresponding to cirrus clouds with low IWC values (Liou et al., 2008). In particular, the model tends to underestimate the IWC for mid-latitude cirrus clouds (Baran and Labonnote, 2007). Therefore, when the IWC is lower, the extinction of cirrus clouds is smaller as demonstrated in Fu (1996) and Heymsfield et al. (2014) and, consequently, allows more radiation to pass into the atmosphere than actually does.
For validation in the longwave spectrum, NOAA-20 measurements have been selected based on their geographical proximity to the Barcelona lidar station. The measurements closest to this station were chosen, even though the measurement times do not exactly match the atmospheric scene. On average, the time difference between observations and simulations is 1 h, with a maximum difference of 3 h. However, this discrepancy is not significant for the validation of longwave radiation fluxes, since they are almost constant during daytime hours (Sicard et al., 2014). In Fig. 4 (right), a large horizontal dispersion can be observed. In addition, a general overestimation of the NOAA-20 observations with the ARTDECO simulations is produced, for simulated fluxes 310 ± 43 W m−2 and for the observations 232 ± 32 W m−2. In our case, the large BIAS = +33.6 % obtained could be due to the spatial resolution of the observed measurements taken, which may cover part of the Mediterranean Sea. In addition, the cloud mask associated with each observation indicates that in 14 % of the cases it has more than 90 % of clear-sky footprint area. As demonstrated by Gil-Díaz et al. (2024), most of the cirrus clouds are visible, and their horizontal extension is smaller than the cirrus clouds that form at higher altitudes (well-known as sub-visible cirrus clouds) (Kramer et al., 2020). This makes them more challenging to detect from top of the atmosphere. Hence, the comparison of simulated radiative fluxes and NOAA-20 observations is not as trivial and conclusive as with SolRad-Net observations, since the NOAA-20 satellite can observe a slightly different atmospheric situation, as mentioned above. It is important to mention the limitations of the 1-D radiative transfer model DISORT to represent an irregular composition of broken and/or overlapping clouds that the NOAA-20 satellite could observe.
4.3 Study of the influence of aerosols on radiative simulations of cirrus clouds
The cloud direct radiative effect is often calculated as the difference between radiative fluxes under cloudy and cloud-free conditions (see Eqs. 2, 3), without considering the aerosols found in the layer of the atmosphere closest to the surface (Ramanathan et al., 1989; Hartmann et al., 2001; Barja and Antuña, 2007; Yang et al., 2007; Lee et al., 2009; Campbell et al., 2016; Lolli et al., 2017b). In this way, simpler simulations are carried out, as it is only necessary to characterize the cloud. It is known that radiation does not interfere linearly with the components of the atmosphere: clouds, aerosols and gases. Therefore, in this subsection we analyse whether or not the insertion of aerosols in the lowest atmospheric layer in cirrus cloud scenes modifies the calculation of cirrus direct radiative effects. For this purpose, the net direct radiative effect (NET; SW + LW) in the atmosphere (ATM; TOA − BOA) of cirrus clouds calculated with simulations in which aerosols have been considered or not is compared, as shown in Fig. 5.
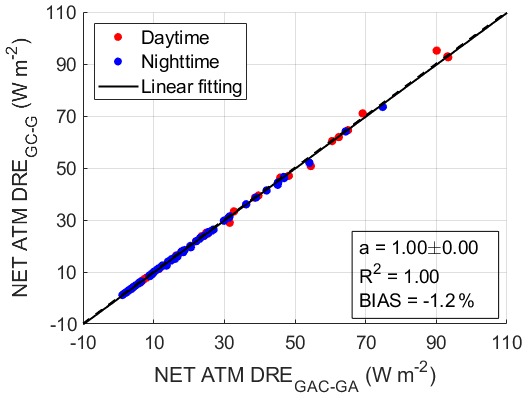
Figure 5Comparison of net direct radiative effects in the full atmosphere (NET ATM DRE) between simulations made with (x axis) and without (y axis) aerosols. The dashed black line is the curve with the slope unity, and the solid black line is the linear fitting of the direct radiative effects (y = ax+b, where a is the slope). The cirrus clouds have been classified according to Sassen and Cho (1992) criteria: sub-visible (SVC; COD < 0.03), visible (VC; 0.03 < COD < 0.3) and opaque clouds (opaque; COD > 0.3).
Figure 5 shows that the NET ATM direct radiative effects calculated with and without aerosols fit well, with most of the points lying slightly above the curve with slope unity. As a consequence, its linear fitting rounded to the tenth has also a unity slope, with a R2 value of 1.00. In addition, the mean and standard deviations of simulations reflect the fact that there is a negligible underestimation of the forcings when not considering aerosols, with values for the simulation with aerosols (x axis) of +21.2 ± 20.3 W m−2 and without aerosols (y axis) of +20.9 ± 20.3 W m−2. Furthermore, the BIAS is −1.2 %, which is a low value, possibly due to the distance between the aerosol layer and the cirrus cloud (being on average 6.76 ± 2.24 km). With these results where the aerosol layer was well distinguished vertically from the cirrus clouds, the simplification of the atmospheric scenes can be done without considering aerosols, but to be more rigorous, in the following results, only the radiative effects in which aerosols are present will be considered. In the other case where the aerosols are vertically closer to the clouds (lower than 1 km, which is the minimum distance found between the cirrus cloud and the aerosol layer), the simplification of not considering aerosols in the calculation of cloud radiative effects may not be valid, leading to a significant underestimation of cloud direct radiative effects.
4.4 Direct radiative effects of cirrus clouds depending on COD
In this section, only direct radiative effects of cirrus clouds calculated with simulations in which aerosols are present, DREGAC-GA, will be considered and will be denoted as DRE. Special attention will be paid to net direct radiative effects of cirrus clouds in the daytime because they are the only clouds that can readily cool or warm the top and bottom of the atmosphere, during the daytime, depending on their properties (Campbell et al., 2016). In order to quantify this phenomenon, cirrus clouds in the daytime and nighttime have been distinguished. The net direct radiative effects of cirrus clouds in the nighttime and daytime, at BOA and TOA, are shown in Fig. 6.
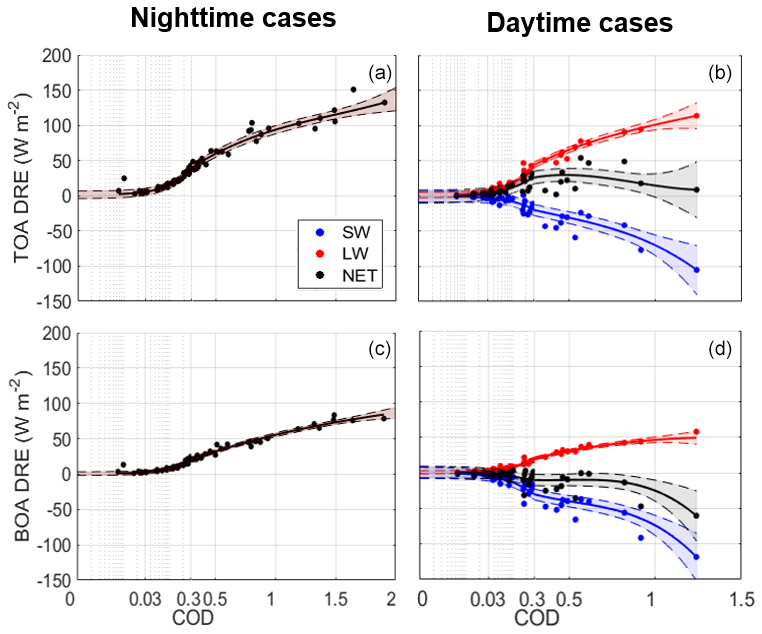
Figure 6Distribution of direct radiative effects of cirrus clouds in the (a, c) nighttime and (b, d) daytime, at (c, d) the bottom of the atmosphere (BOA) and (a, b) the top of the atmosphere (TOA), as a function of their cloud optical depth (COD). Shortwave (SW), longwave (LW) and net (NET = SW + LW) components of direct radiative effects have been distinguished. For COD < 0.3 a logarithmic scale has been considered in order to discern sub-visible and visible cirrus clouds more clearly (Sassen and Cho, 1992). The solid line corresponds to the polynomial fitting performed on the dataset. The shaded area represents the region with a 95 % probability of containing the points, adjusted by the mean absolute value of the differences between the actual and fitted values.
In Fig. 6 one observes a positive trend between the net direct radiative effects with the COD, where the thicker cirrus clouds contribute more to the overall direct radiative effect budget, as has been observed in other studies (Barja and Antuña, 2007; Lee et al., 2009; Campbell et al., 2016; Lolli et al., 2017b). Some COD gaps are also found because the cirrus observations considered do not have a homogeneous and equidistant distribution of COD. At nighttime, the net cirrus direct radiative effect at TOA is approximately twice that at BOA, which is always positive, as expected. Cirrus clouds in the nighttime act as a cover in the atmosphere; they do not let through all the infrared radiation emitted by the Earth as it cools, inducing a warming of the atmosphere. This direct radiative effect as a function of COD is more pronounced at TOA than at BOA because the atmosphere at BOA is strongly influenced by the surface, which acts as a black body emitting infrared radiation in the nighttime. Consequently, the positive direct radiative effect at BOA is milder than at TOA.
At daytime, at TOA, the net direct radiative effect remains positive for all cirrus clouds, dominating the positive longwave component. This effect has been observed in Campbell et al. (2016) for COD up to approximately 0.6. For higher COD values, Campbell et al. (2016) report a negative NET TOA DRE. In this study, a decreasing trend in NET TOA DRE is observed from COD values of 0.5, although no negative values are obtained. Additionally, the LW NET TOA DRE component grows faster than the one reported by Campbell et al. (2016), suggesting that negative values of NET TOA DRE could occur for cirrus clouds with higher COD than those found in Campbell et al. (2016). This discrepancy may be due to the higher surface emissivity and temperature values considered in the present work. Further measurements of NET TOA DRE for cirrus clouds with higher COD are needed to confirm the decreasing trend. In contrast, at BOA, the net direct radiative effect is almost always negative (only 18 % of the cases show a positive net direct radiative effect, whose value is close to 0), where the outgoing shortwave radiation in the presence of cirrus clouds is larger than in cirrus-cloud-free conditions. The albedo effect overcomes the greenhouse effects in the SW range because of low absorption capacity of the small crystals, as shown in Fig. 2. These changes of sign occur for thin cirrus clouds, like in other studies (Campbell et al., 2016; Lolli et al., 2017b; Kramer et al., 2020), where the dominant factor in the change of sign of forcing is unclear. Multiple factors are involved, from the optical properties of the cirrus to the solar zenith angle or the surface temperature and surface albedo (Wolf et al., 2023).
In order to complete this analysis, the net direct radiative effects in the full atmosphere are analysed for cirrus clouds in the nighttime and daytime, as shown in Fig. 7.
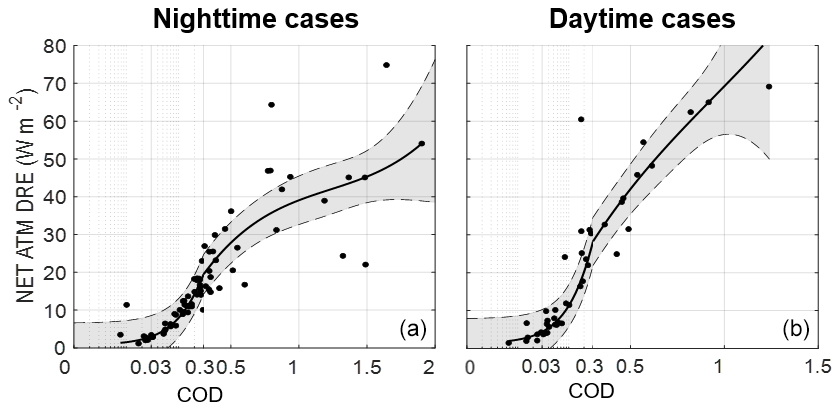
Figure 7Distribution of net direct radiative effects of cirrus clouds in the full atmosphere at (a) the nighttime and (b) the daytime, as a function of their cloud optical depth (COD). For COD < 0.3 a logarithmic scale has been considered in order to discern sub-visible and visible cirrus clouds more clearly (Sassen and Cho, 1992). The solid line corresponds to the polynomial fitting performed on the dataset. The shaded area represents the region with a 95 % probability of containing the points, adjusted by the mean absolute value of the differences between the real and fitted values.
Figure 7 shows a net warming of the atmosphere (always a positive direct radiative effect) for cirrus clouds during both nighttime and daytime, as the presence of cirrus clouds reduces outgoing radiation in the full atmosphere. This phenomenon could have been perceived in the previous figure (Fig. 6) as the direct radiative effect at TOA was always higher than at BOA. It also results in the atmosphere warming faster as a function of the COD during the daytime than in the nighttime (see their regression slopes), as expected due to the contribution of solar radiation to the net direct radiative effect. The net direct radiative effect in the full atmosphere fits very well with the polynomial regressions for both time periods, R2=0.96 in the nighttime and R2=0.95 in the daytime, although some instances outside the shaded area are observed. These strong variations of the direct radiative effect for cirrus clouds with very similar COD are due to the consideration in the simulations of different optical scattering properties of the cirrus clouds, thermodynamic profiles, surface temperature and albedo values for each cirrus scene.
Then, the direct radiative effects for cirrus clouds in the nighttime and daytime, which are classified according to Sassen and Cho (1992) criteria, are quantified, as shown in Table 1.
Table 1Average and standard deviation of direct radiative effects of cirrus clouds (W m−2) at the bottom of the atmosphere (BOA), at the top of the atmosphere (TOA) and in the full atmosphere (ATM), in the nighttime and daytime, classified with Sassen and Cho (1992) criteria in Barcelona. Cloud optical depth values are obtained from Gil-Díaz et al. (2024).
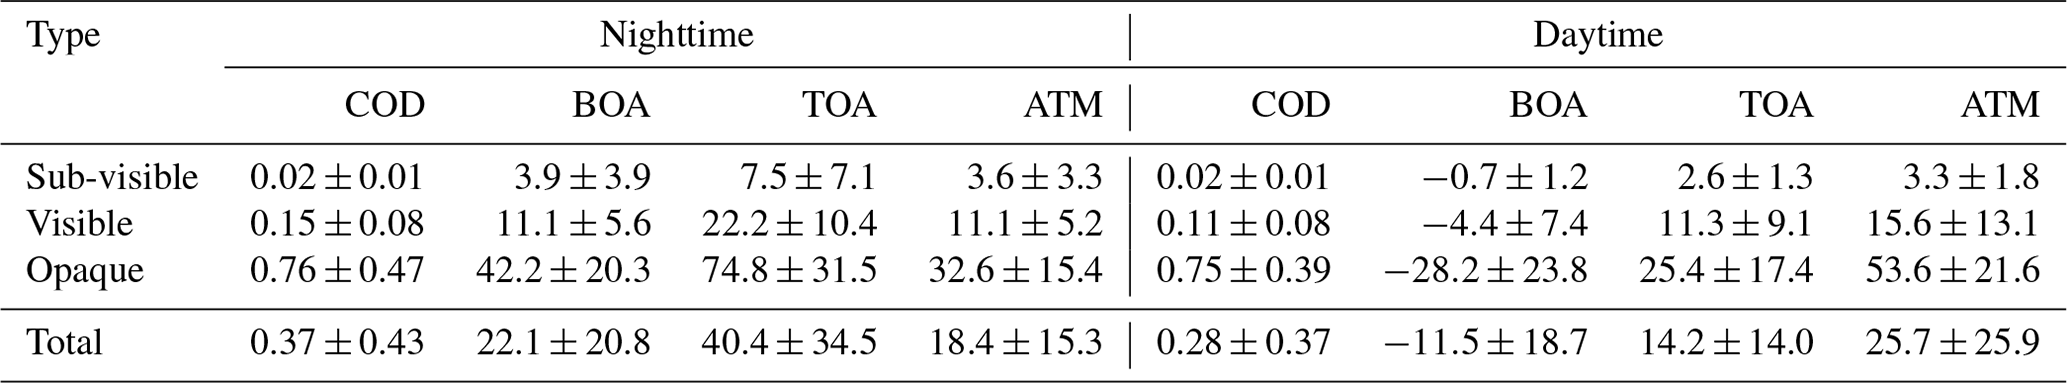
In Table 1 it is discernible that thicker cirrus clouds produce a higher direct radiative effect than thinner clouds, as observed above. At nighttime, cirrus clouds produce an average net warming in the full atmosphere of +40.4 ± 34.5 W m−2, with opaque cirrus clouds being the main source. At daytime, cirrus clouds produce generally a negative direct radiative effect at BOA and a positive effect at TOA, resulting in a warming of the full atmosphere. The net direct radiative effect at BOA ranges between −73 and +3 W m−2 for all cirrus. In particular, for thin cirrus clouds the net direct radiative effect is in a range from −31 to +3 W m−2, which is a similar range to Lee et al. (2009), covering from −20 to 0 W m−2. Therefore, shortwave negative direct radiative effect generally dominates at the BOA, with an average of −3.6 ± 6.7 W m−2 for thin cirrus clouds, which is slightly lower than −1.35 W m−2 (Lee et al., 2009). The net direct radiative effect at TOA ranges between +1 and +54 W m−2 for all cirrus, which is a wider interval than Campbell et al. (2016), Lolli et al. (2017b), Kramer et al. (2020) and Kienast-Sjögren et al. (2016). In particular, for thin cirrus clouds, the net direct radiative effect is in a range from +1 to +32 W m−2, where the maximum value is considerably higher than the value of +5.71 W m−2 (Campbell et al., 2016) or +10 W m−2 (Kramer et al., 2020). The average of the net direct radiative effect for thin cirrus clouds is +9.4 ± 8.8 W m−2, which is a close value compared to that obtained in Kienast-Sjögren et al. (2016), covering on average from 6.2 to 11 W m−2, although it is also significantly higher than the value of +1 W m−2 (Lee et al., 2009). Despite the differences found, the values are in agreement in magnitude with other studies such as Ackerman et al. (1988), Jensen et al. (1994), Lee et al. (2009), Berry and Mace (2014), Campbell et al. (2016), Kienast-Sjögren et al. (2016), and Kramer et al. (2020). The average net warming in the full atmosphere is a little higher in the daytime, with an average value of +25.7 ± 25.9 W m−2. This difference is apparently not related with the fraction of opaque cirrus, as the percentage of opaque cirrus is lower during nighttime (28 %) than in the daytime (38 %).
4.5 Direct radiative effects of cirrus clouds depending on solar zenith angle
In this section, only net direct radiative effects of cirrus clouds in the daytime will be considered. The distinction between the shortwave and longwave spectral ranges will not be made because the direct radiative effect does not depend on the solar zenith angle in the longwave spectrum (Lee et al., 2009; Wolf et al., 2023). The net direct radiative effect of cirrus clouds in the daytime at BOA and TOA, together with the results of a brief sensitivity study, in which all parameters of the simulations except the solar zenith angle are kept constant, is shown in Fig. 8.
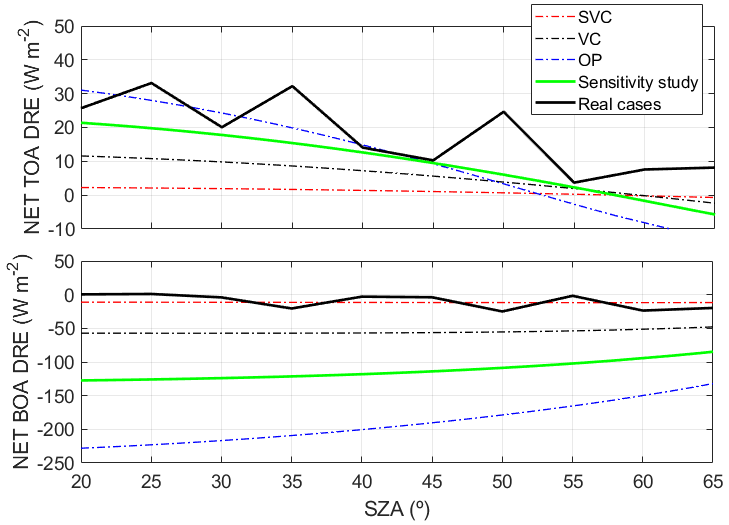
Figure 8Distribution of the net direct radiative effects of cirrus clouds in the daytime at (a) top of the atmosphere (TOA) and (b) bottom of the atmosphere (BOA) as a function of their solar zenith angle (SZA) resulting from the (dashed curves correspond to each cirrus cloud type according to the Sassen and Cho (1992) criteria, and the green curves correspond to the mean values for all daytime cirrus clouds) sensitivity study and (black curve) the real cases.
In the sensitivity study, three cloud types were considered, according to the Sassen and Cho (1992) criteria; the cloud optical depth is shown in Table 1 for the daytime cirrus clouds. The geometrical and optical properties correspond to the mean values of the cirrus clouds measured at Barcelona lidar station (Gil-Díaz et al., 2024) and the optical scattering properties are obtained from the mean values resulting from the statistic. The longwave surface albedo considered is 0.0157, and the surface temperature is 28 °C. The thermodynamic profiles have been selected from the 1976 standard atmosphere (COESA, 1976). By keeping all other properties of cirrus clouds scenes constant, the results are expected to be exclusively due to the variation in the value of the solar zenith angle. On the other hand, in the real cases that have been analysed in Sect. 4.4 and 4.5 as a function of cloud optical depth, the net direct radiative effect values for the three cloud types have been averaged, with a SZA resolution of 5°.
In Fig. 8 one observes a higher variability of net direct radiative effect for the real cases than for the sensitivity study. This variability could be explained by other parameters that are considered in the simulations, such as cloud optical depth, cirrus optical scattering properties, surface albedo and temperature (Sicard et al., 2014; Wolf et al., 2023). While a detailed sensitivity analysis is needed to assess the contribution of each variable, cloud optical depth appears to have the most significant impact, as the difference in mean CODs for each averaged SZA value is substantial. In addition, a generally higher mean net direct radiative effect is discerned for the real cases than for the sensitivity study results, especially at BOA despite having taken the average properties resulting from the statistics. At TOA, a slight downward tendency of the net direct radiative effect is obtained as the SZA increases, as found in Wolf et al. (2023). As SZA increases, cloud solar extinction is enhanced regarding thermal effects (Campbell et al., 2016). All mean net direct radiative effect values for the real cases are positive, but there is a large fluctuation in certain values of SZA. Moreover, there is no crossover where the mean net direct radiative effect shifts from positive to negative values between a SZA of 20 and 65°. Conversely, for the results from the sensitivity study, a change of sign is observed at 58°, agreeing well with results from Campbell et al. (2016) and Lolli et al. (2017b). At BOA, most net direct radiative effect values are negative, presenting a slight increasing trend unlike the TOA. Since the angle of incidence of the incoming solar radiation increases, the incident solar radiation is lower, and the scattering produced by the ice crystals increases because optical path is larger (Lee et al., 2009; Wolf et al., 2023). This enhancement of the extinction of incident solar radiation, which is lower, results in a reduction of the net positive direct radiative effect at TOA and a net negative effect of the atmosphere at BOA. The change from positive to negative values of the mean net direct radiative effect is only observed for the real cases, with a SZA crossover of 25°, a considerably lower value than that observed for the results of the TOA sensitivity study.
4.6 Case study of direct radiative effects of an evolving cirrus cloud
In this section the role of time is added to the analysis, and the direct radiative effect produced by a cirrus cloud is studied along its back-trajectory. The final objective of this case is to simultaneously analyse the evolution of different physical agents such as the surface albedo, the solar zenith angle, the cloud optical depth or the ice water content in the quantification of the cirrus cloud direct radiative effect. The case study corresponds to the back-trajectory of a cirrus cloud measured at Barcelona lidar station on 11 February 2019 at 02:03 UTC (Gil-Díaz et al., 2024), where simultaneous measurements of the MPL and CALIPSO were performed. To simulate the evolution of the cirrus cloud as realistically as possible, its microphysical properties along its back-trajectory are calculated with the CLaMS-Ice model. Apart from the basic back-trajectory variables such as temperature, altitude, geographic coordinates and time, this model provides microphysical properties like ice water content, ice crystal number concentration or ice nuclei concentration. Considering the temperature provided by the model as cloud temperature and together with the ice water content, the optical scattering properties of cirrus clouds are specifically calculated with the self-consistent scattering model for cirrus clouds. Assuming the cirrus cloud geometric thickness decreases linearly, using the CALIPSO measurements of 1 km on 10 February 2019 at 14:00 UTC and 1.74 km on 11 February 2019 at 02:00 UTC, and considering that the geometrical thickness is 0 km when the IWC is null, the COD is estimated as the product of the extinction coefficient and the geometric thickness. The back-trajectory of the cirrus cloud and the properties, ice water content, mid-cloud temperature, mid-cloud altitude, cloud geometrical thickness and cloud optical depth, are shown in Fig. 9.
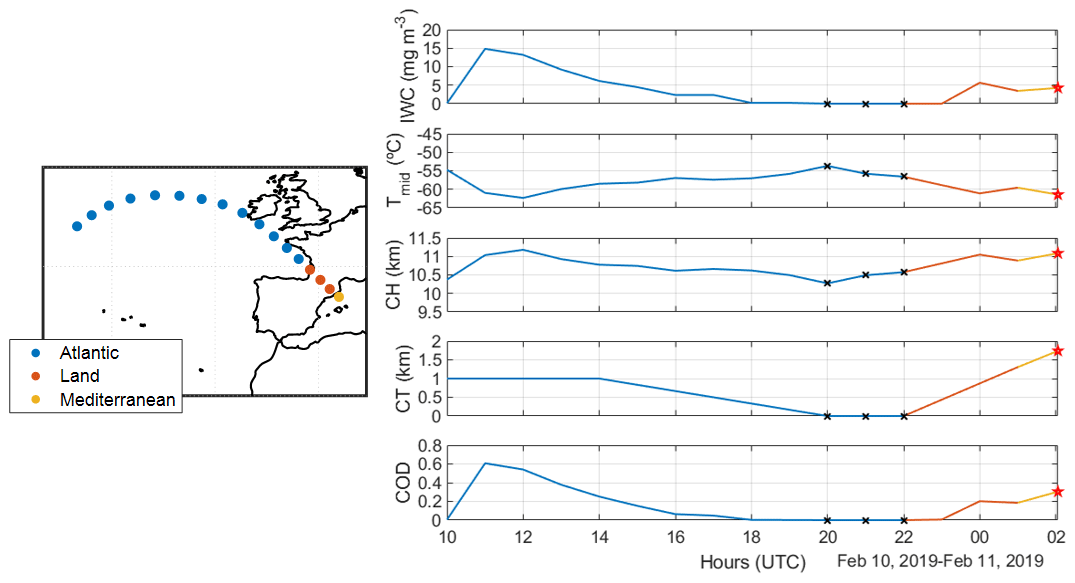
Figure 9(a) Hourly back-trajectory of the cirrus cloud for the last 16 h before arrival in Barcelona. (b–f) Evolution of cirrus cloud properties along its back-trajectory: ice water content (IWC), mid-cloud temperature (Tmid), mid-cloud altitude (CH), cloud geometrical thickness (CT) and cloud optical depth (COD). Colours indicate the type of surface over which the cloud is located, black crosses mark the non-existence of cirrus cloud during those hours, and the red star points to the case measured by the MPL and CALIPSO in Gil-Díaz et al. (2024).
In Fig. 9 one observes that the cirrus cloud comes from the Atlantic Ocean, passing through part of France and Barcelona to reach the Mediterranean Sea. The selected points of the trajectory are spaced 1 h apart backward from 11 February 2019 at 02:00 UTC. During this journey, the air mass which corresponds to the cloud undergoes a rise in height, reaching a minimum in temperature and a COD of 0.6. After this initial cirrus cloud fast growth, the cloud gradually fades away until 20:00 UTC, where the CLaMS-Ice model gives a null ice water content. Afterwards, a new cirrus begins to form over land surface and to grow until 00:00 UTC and remains relatively stable.
Taking advantage of the overlap between the back-trajectory of this cirrus cloud and the CALIPSO satellite, a brief evaluation of the ice water content is carried out on 11 February 2019 at 02:03:20 UTC. The difference in IWC between the CLaMS-Ice output and the CALIPSO measurement is 0.88 mg m−3, resulting in a relative deviation of 29 % for the CLaMS-Ice output. This difference obtained by CLaMS-Ice and CALIPSO, well within a factor of 2, is considered reasonable given the different parametrizations involved in the calculation of the IWC and their respective uncertainties. To fully characterize the cirrus cloud scenes along its back-trajectory, it is considered that the height from the CLaMS-Ice model is the mid-cloud height. The surface albedo and surface temperature considered are from the NOAA-20 satellite. With all these assumptions, radiative simulations are calculated with the ARTDECO package, and the direct radiative effects at TOA, at BOA and in the full atmosphere are shown in Fig. 10.
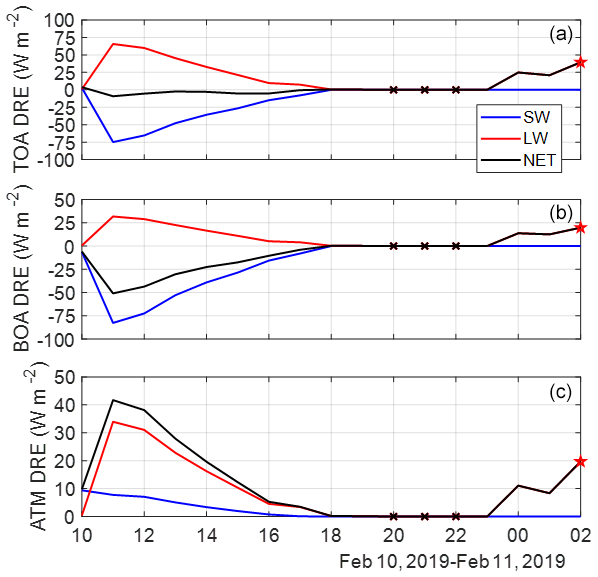
Figure 10Distribution of direct radiative effects of the cirrus cloud along its back-trajectory (a) at the top of the atmosphere (TOA), (b) at the bottom of the atmosphere (BOA) and (c) in the full atmosphere (ATM). Shortwave (SW), longwave (LW) and net (NET = SW + LW) components of direct radiative effects have been distinguished. Black crosses mark the non-existence of cirrus cloud during those hours.
Figure 10 shows that at TOA the net direct radiative effect is close to zero, with values shifting between positive and negative during the first hours where the cirrus cloud is over the Atlantic Ocean. During this period, the SW component is almost completely balanced by the LW component and it is zero when there is no incident solar radiation, i.e. in the nighttime; therefore the net direct radiative effect corresponds to the LW component. In the nighttime, the net direct radiative effect at TOA is also approximately double that at BOA, in agreement with previous results. At BOA, the net direct radiative effect changes from negative to positive, since the incident solar radiation means that the albedo effect overcomes the greenhouse effect during daytime. In the full atmosphere, the direct radiative effects are always positive, as the direct radiative effect at TOA is higher than at BOA. In summary, these simulations reveal the evolution of the net direct radiative effect produced by the cirrus cloud, going from values close to 0 to +40 W m−2 at TOA, from negative values whose minimum is −51 W m−2 to positive values reaching a maximum of +20 W m−2 at BOA, and in the full atmosphere varying between values close to 0 and +42 W m−2, which is the maximum. The complexity of calculating the direct radiative effect of a cirrus cloud lies in the fact that this value is highly sensitive to its scene cloud properties like cloud optical depth, solar zenith angle or surface albedo as seen in this case study.
Finally, we compare the direct radiative effect of the cirrus cloud (red star mark) measured by MPL at the Barcelona lidar station, by CALIPSO satellite at 78 km from Barcelona lidar station (Gil-Díaz et al., 2024) and with the properties obtained with CLaMS-Ice, as shown in Table 2.
Table 2Mid-cloud temperature (Tmid), extinction coefficient (σext) and ice water content (IWC) as well as the net direct radiative effect of the cirrus cloud measured by Micro Pulse Lidar at the Barcelona lidar station, by CALIPSO satellite (Gil-Díaz et al., 2024) and with the properties obtained with CLaMS-Ice, at the bottom of the atmosphere (BOA), at the top of the atmosphere (TOA) and in the full atmosphere (ATM).
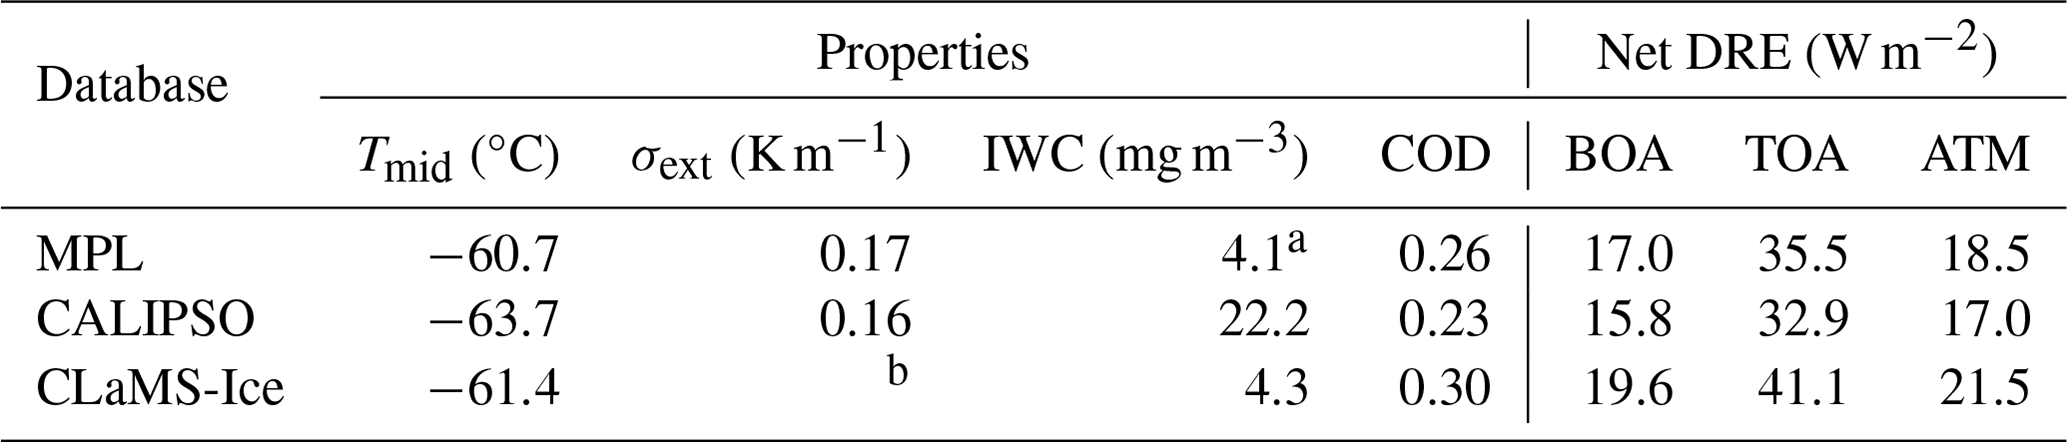
a The value of ice water content is calculated with the self-consistent scattering model for cirrus cloud (see Sec. 3.1). b The CLaMS-Ice product does not provide a value of extinction of the cirrus cloud.
Taking the new methodology explained above to characterize optically cirrus scattering properties, the self-consistent scattering model for cirrus clouds is used to obtain the extinction coefficient, single-scattering albedo and asymmetry factor to introduce them into the ARTDECO package and calculate its net direct radiative effect. In the case of cirrus cloud detection with MPL measurements, as described above, the mid-cloud temperature and the extinction coefficient, obtained by the two-way transmittance method (Gil-Díaz et al., 2024), are employed to characterize the cirrus optically. Alternatively, as the CALIPSO and CLaMS-Ice data provide an IWC measurement for such cirrus clouds, these data together with the mid-cloud temperature are used to represent the cirrus.
In Table 2 one observes that the properties of the cirrus cloud are similar, except for the IWC, which is considerably higher for the cirrus characterized with CALIPSO measurements. If the IWC is calculated using the extinction coefficient and mid-cloud temperature values provided by CALIPSO, the ensemble scattering model for cirrus clouds yields an IWC value of 3.9 mg m−3. This result is significantly lower than the IWC measured by CALIPSO, since the self-consistent scattering model for cirrus clouds often underestimates the IWC of cirrus clouds measured at mid-latitude (Baran and Labonnote, 2007). So a certain discordance between the net direct radiative effect magnitudes would be expected. For all three simulations, the cirrus cloud has a positive direct radiative effect both at TOA and at BOA, since due to the time (02:00 UTC) the solar radiation component is null. Moreover, as the direct radiative effect is proportional to the COD, the cirrus characterized with the CLaMS-Ice products produces a slightly higher forcing than with the other data. On average, it can be established that the cirrus cloud measured at Barcelona lidar station produces a positive direct radiative effect of +17.5 ± 1.9 W m−2 at BOA, of +36.5 ± 4.2 W m−2 at TOA and of +19.0 ± 2.3 W m−2 in the full atmosphere.
In this paper, a study of optical scattering properties and direct radiative effects of cirrus clouds based on 4 years of continuous ground-based lidar measurements with the Barcelona (Spain) Micro Pulse Lidar (MPL) is analysed. First, a new approach of a self-consistent scattering model for cirrus clouds is presented to get the optical scattering properties of cirrus clouds at different wavelengths with only the extinction coefficient at each cloud layer calculated with the two-way transmittance method and cloud temperature, from radiosounding data. The self-consistent scattering model for cirrus clouds consists of an ensemble of six ice crystal types, where the simplest form is an hexagonal ice column with an unity aspect ratio, and the more complex ice crystals are formed by randomly attaching other hexagonal elements until a chain-like structure is formed. The members are evenly distributed across the PSD. The self-consistent scattering model for cirrus cloud database consists of more than 20 000 PSDs of tropical and mid-latitude cirrus at temperatures between −60 and 0 °C. For each PSD this database provides the simulated optical scattering properties (scattering, absorption coefficient and asymmetry factor) as a function of the decimal logarithm of ice water content (LIWC) and the cloud temperature (T) by nonlinear least-squares fitting. The new approach consists of first calculating the IWC of the cirrus cloud by introducing the extinction coefficient of each cloud layer in an equation derived from the model, for a cloud temperature. This equation is obtained by assuming the absence the absorption, which is entirely reasonable because the wavelength used belongs to the visible spectral range. Once the IWC is estimated, this variable is introduced again into the model to get the absorption, scattering and asymmetry factor coefficients for each wavelength, respectively. Applying this method to cirrus clouds measured in Barcelona during November 2018 to September 2022 at 00:00 and 12:00 UTC, it is found that the average of the ice water content is 4.97 ± 5.53 mg m−3, the single-scattering albedo is 0.99 ± 0.05 and the asymmetry factor is 0.76 ± 0.00 at 0.55 µm. Second, the direct radiative effect of cirrus clouds is calculated with the radiative transfer model DISORT. Radiative fluxes are validated at the bottom of the atmosphere with SolRad-Net pyranometers in the shortwave spectral range and at the top of the atmosphere with NOAA-20 measurements in the longwave spectral range. On the one hand, most downward radiative fluxes calculated with the DISORT model overestimate the SolRad-Net observations, resulting in a BIAS of +11.6 % and a slope of the linear regression (a = 0.71 ± 0.20). On the other hand, a large difference in upward radiative fluxes between simulated and observations is found for each cirrus cloud scene, resulting in a BIAS of +33.6 %. Third, a validation of the importance of the planetary boundary layer aerosols in the cirrus scenes simulations is carried out. Calculations with and without aerosols of the cirrus direct radiative effect are done to assess the error induced by neglecting tropospheric aerosols, which results in a negligible BIAS of −1.2 %. In the other case where the aerosols are vertically closer to the clouds, the simplification of not considering aerosols in the calculation of cloud direct radiative effect may not be valid, leading to a significant underestimation of cloud direct radiative effect. Fourth, the direct radiative effect of cirrus clouds is calculated distinguishing between nighttime and daytime. At nighttime, cirrus clouds warm the atmosphere with direct radiative effects at TOA almost double those at BOA, with the thicker cirrus clouds contributing most. At daytime, cirrus clouds generally have a negative direct radiative effect at BOA (82 % of the cases) and always a positive effect at TOA, resulting in a warming of the full atmosphere. On average, in the nighttime, cirrus clouds have a positive direct radiative effect of +22.1 ± 20.8 W m−2 at BOA, +40.4 ± 34.5 W m−2 at TOA and +18.4 ± 15.3 W m−2 in the full atmosphere; in the daytime, cirrus clouds have a negative direct radiative effect of −11.5 ± 18.7 W m−2 at BOA, a positive effect of +14.2 ± 14.0 W m−2 at TOA and +25.7 ± 25.9 W m−2 in the full atmosphere. Fifth, the variation of the cirrus cloud direct radiative effect in the daytime is also analysed as a function of the SZA: it shows that at TOA for the real cases the average net direct radiative effect is always positive and for the results from a sensitivity study, the mean net direct radiative effect shifts from positive to negative values at 58°. For the real cases and the sensitivity study, a slight downward tendency of the net direct radiative effect is also found. At BOA, most net direct radiative effect values are negative. The change from positive to negative values of the mean net direct radiative effect is only observed for the real cases, with a SZA crossover of 25°. Sixth, for a case study, the direct radiative effect of a cirrus cloud along its back-trajectory is analysed using CLaMS-Ice products. During the overlap between the back-trajectory of this cirrus cloud and the CALIPSO satellite on 11 February 2019 at 02:03:20 UTC, a brief evaluation of the IWC is done, resulting in a relative deviation of 29 % for the CLaMS-Ice output. This cirrus cloud comes from the Atlantic Ocean, passing through part of France and Barcelona to reach the Mediterranean Sea. Over the Atlantic Ocean, the air mass which corresponds to the cloud undergoes a rise in height, reaching a minimum in temperature and a COD of 0.6. After this initial fast growth of cirrus cloud, the cloud gradually fades away as it approaches France, where the CLaMS-Ice model gives a null IWC. Afterwards, the cirrus cloud begins to form again on land surface and to grow. Along its trajectory, the cirrus cloud produces a net direct radiative effect that goes from values close to 0 to +40 W m−2 at TOA, from negative values whose minimum is −51 W m−2 to positive values reaching a maximum of +20 W m−2 at BOA and in the full atmosphere varying between values close to 0 and +42 W m−2, which is the maximum. Finally, the direct radiative effects that the cirrus cloud has at the beginning of the back-trajectory are compared using different measurements (MPL and CALIPSO measurements and CLaMS-Ice outputs) and making use of the self-consistent scattering model for cirrus clouds. It results in an average positive direct radiative effect of +17.5 ± 1.9 W m−2 at BOA, of +36.5 ± 4.2 W m−2 at TOA and +19.0 ± 2.3 W m−2 in the full atmosphere.
The MPLNET products are publicly available on the MPLNET website (https://mplnet.gsfc.nasa.gov/download_tool/, MPLNET, 2024) in accordance with the data policy statement. Radiosounding data are available upon request from the authors or Meteocat. The SolRad-Net product is publicly available on the SolRad-Net website (https://solrad-net.gsfc.nasa.gov/cgi-bin/type_piece_of_map_flux, Goddard Space Flight Center, 2024a) in accordance with the data policy statement. The NOAA-20 products are publicly available on the CERES website (https://ceres.larc.nasa.gov/data/, Langley Research Center, 2024). The AERONET products are provided by a federation of ground-based remote sensing aerosol networks established by NASA and PHOTONS (PHOtométrie pour le Traitement Opérationnel de Normalisation Satellitaire) and are greatly expanded by collaborators from national agencies, institutes, universities, individual scientists and partners. The AERONET products are publicly available on the AERONET website (https://aeronet.gsfc.nasa.gov/new_web/webtool_inv_v3.html, Goddard Space Flight Center, 2024b). The CALIPSO product is provided by the NASA Langley Research Center's (LaRC) ASDC DAAC and is managed by the NASA Earth Science Data and Information System (ESDIS) project. NASA data are freely accessible and available on the Atmospheric Science Data Center website (https://opendap.larc.nasa.gov/opendap/CALIPSO/LID_L2_05kmCLay-Standard-V4-20/contents.html, NASA, 2024).
CGD prepared the automatic algorithms to calculate the optical scattering properties and direct radiative effects of cirrus clouds for MPL and radiosounding data. CGD prepared the figures of the paper. MS, OS, AS, CMP, AC, ARG and DCFSO reviewed different parts of the results. CGD prepared the paper, with contributions from all co-authors. MS reviewed the entire article and provided supervision and funding for this research.
At least one of the (co-)authors is a member of the editorial board of Atmospheric Chemistry and Physics. The peer-review process was guided by an independent editor, and the authors also have no other competing interests to declare.
Publisher's note: Copernicus Publications remains neutral with regard to jurisdictional claims made in the text, published maps, institutional affiliations, or any other geographical representation in this paper. While Copernicus Publications makes every effort to include appropriate place names, the final responsibility lies with the authors.
The CLaMS-Ice model is based at Forschungszentrum Jülich, ICE-4, Germany, and has been used with their kind permission. The authors acknowledge the support of the ACTRIS European Research Infrastructure Consortium (ERIC). The first author would like to express her gratitude to all the members of the Laboratoire d'Optique Atmosphérique (LOA), and especially to Philippe Dubuisson and Odran Sourdeval, for their welcome and hospitality.
This research has been partly funded by the Spanish Agencia Estatal de Investigación (grant no. PID2019-103886RB-I00 and PID2023-149747NB-I00) and the European Commission through the Horizon 2020 programme (project ACTRIS IMP, grant agreement no. 871115; ATMO-ACCESS, grant agreement no. 101008004; GRASP-ACE, grant agreement no. 778349; and project REALISTIC, grant agreement no. 101086690). Michäel Sicard also received funding from CNES through the EECLAT, AOS and EXTRA-SAT projects.
This paper was edited by Martina Krämer and reviewed by two anonymous referees.
Ackerman, S. A., Smith, W. L., Revercomb, H. E., and Spinhirne, J. D.: The 27–28 October 1986 FIRE IFO Cirrus Case Study: Spectral Properties of Cirrus Clouds in the 8–12 µm Window, Mon. Weather Rev., 118, 2377–2388, https://doi.org/10.1175/1520-0493(1990)118<2377:TOFICC>2.0.CO;2, 1990. a
Ackerman, T. P., Liou, K.-N., Valero, F. P. J., and Pfister, L.: Heating rates in tropical anvils, J. Atmos. Sci., 45, 1606–1623, https://doi.org/10.1175/1520-0469(1988)045<1606:HRITA>2.0.CO;2, 1988. a
Baran, A. J. and Labonnote, L.-C.: A self-consistent scattering model for cirrus. I: The solar region, Q. J. Roy. Meteor. Soc., 133, 1899–1912, https://doi.org/10.1002/qj.164, 2007. a, b, c, d, e
Baran, A. J., Connolly, P. J., and Lee, C.: Testing an ensemble model of cirrus ice crystals using midlatitude in-situ estimates of ice water content, volumen extinction coefficient and the total solar optical depth, Q. J. Roy. Meteor. Soc., 110, 1579–1598, https://doi.org/10.1016/j.jqsrt.2009.02.021, 2009. a
Baran, A. J., Bodas-Salcedo, A., Cotton, R., and Lee, C.: Simulating the equivalent radar reflectivity of cirrus at 94 GHz using an ensemble model of cirrus ice crystals: a test of the Met Office global numerical weather prediction model, Q. J. Roy. Meteor. Soc., 137, 1547–1560, https://doi.org/10.1002/qj.870, 2011a. a
Baran, A. J., Connolly, P. J., Heymsfield, A. J., and Bansemer, A.: Using in-situ estimates of ice water content, volume extinction coefficient, and the total solar optical depth obtained during the tropical ACTIVE campaign to test an ensemble model of cirrus ice crystals, Q. J. Roy. Meteor. Soc., 137, 199–218, https://doi.org/10.1002/qj.731, 2011b. a, b
Baran, A. J., Cotton, R., Furtado, K., Havemann, S., Labonnote, L. C., Marenco, F., Smith, A., and, Thelen, J. C.: A self-consistent scattering model for cirrus. II: The high and low frequencies, Q. J. Roy. Meteor. Soc., 140, 1039–1057, https://doi.org/10.1002/qj.2193, 2014. a, b, c
Barja, B. and Antuña, C. J.: Numerical simulation of cirrus cloud radiative forcing using lidar backscatter data. Preliminary results Simulación numérica de forzamiento radiativo de nubes cirros usando datos de retrodispersión lidar. Resultados preliminares, Opt. Pura Apl., Vol. 41, https://www.sedoptica.es (last access: 1 March 2024), 2007. a, b
Baumgartner, M., Rolf, C., Grooß, J.-U., Schneider, J., Schorr, T., Möhler, O., Spichtinger, P., and Krämer, M.: New investigations on homogeneous ice nucleation: the effects of water activity and water saturation formulations, Atmos. Chem. Phys., 22, 65–91, https://doi.org/10.5194/acp-22-65-2022, 2022. a
Berry, E., and Mace, G.G.: Cloud properties and radiative effects of the Asian summer monsoon derived from A-Train data. J. Geophys. Res., 119, 9492–9508, https://doi.org/10.1002/2014JD021458, 2014. a
Brogniez, G., Parol, F., Becu, L., Jourdan, O., Gayet, J.-F., Auriol, F., Verwaerde, C., Balois, J.-Y., and Damiri, B.: Determination of cirrus radiative parameters from combination between active and passive remote sensing measurements during FRENCH/DIRAC 2001, Atmos. Res., 72, 425–452, https://doi.org/10.1016/j.atmosres.2004.03.026, 2004. a
Bunz, H., Benz, S., Gensch, I., and Krämer, M.: MAID: a model to simulate UT/LS aerosols and ice clouds, Environ. Res. Lett., 3, 035001, https://doi.org/10.1088/1748-9326/3/3/035001, 2008. a
Campbell, J. R., Lolli, S., Lewis, J. R., Gu, Y., and Welton, E. J.: Daytime Cirrus Cloud top-of-the-atmosphere Radiative Forcing Properties at a Midlatitude Site and their Global Consequence, J. Appl. Meteorol. Clim., 55, 1667–1679, https://doi.org/10.1175/JAMC-D-15-0217.1, 2016. a, b, c, d, e, f, g, h, i, j, k, l, m, n, o
COESA: U.S. Standard Atmosphere, U.S. Government Printing Office, Washington, D.C., 003-017-00323-0, 1976. a, b
Connolly, P. J., Saunders, C. P. R., Gallagher, M. W., Bower, K. N., Flynn, M. J., Choularton, T. W., Whiteway, J., and Lawson, R. P.: Aircraft observations of the influence of electric fields on the aggregation of ice crystals, Q. J. Roy. Meteor. Soc., 131, 1695–1712, https://doi.org/10.1256/qj.03.217, 2005. a
Costa, A.: Mixed-phase and ice cloud observations with NIXE-CAPS, E-Book: Forschungszentrum Jülich GmbH Zentralbibliothek, Verlag Jülich, ISBN 978-3-95806-273-3, 2017. a
De La Torre Castro, E., Jurkat-Witschas, T., Afchine, A., Grewe, V., Hahn, V., Kirschler, S., Krämer, M., Lucke, J., Spelten, N., Wernli, H., Zöger, M., and Voigt, C.: Differences in microphysical properties of cirrus at high and mid-latitudes, Atmos. Chem. Phys., 23, 13167–13189, https://doi.org/10.5194/acp-23-13167-2023, 2023. a
Dolinar, E. K., Campbell, J. R., Marquis, J. W., Garnier, A. E., and Karpowicz, B. M.: Novel Parameterization of Ice Cloud Effective Diameter from Collocated CALIOP-IIR and CloudSat Retrievals, J. Appl. Meteor. Clim., 61, 891–907, https://doi.org/10.1175/JAMC-D-21-0163.1, 2022. a
Eisinger, M., Maeusli, D., and Lefebvre, A.: EarthCARE Project Ground Segment EarthCARE Production Model, European Space Agency, Doc. No. EC-TN-ESA-SYS-0380, 1–9, https://earth.esa.int/eogateway/documents/20142/37627/EarthCARE-Production-Model.pdf (last access: 3 June 2023), 2017. a
Field, P. R., Wood, R., Brown, P. R. A., Kaye, P. H., Hirst, E., Greenaway, R., and Smith, J. A.: Ice particle interarrival times measured with a fast, FSSP, J. Atmos. Ocean. Tech., 20, 249–261, https://doi.org/10.1175/1520-0426(2003)020<0249:IPITMW>2.0.CO;2, 2003. a
Field, P. R., Hogan, R. J., Brown, P. R. A., Illingworth, A. J., Choularton, T. W., and Cotton, R. J.: Parametrization of ice-particle size distributions for mid-latitude stratiform cloud, Q. J. Roy. Meteor. Soc., 131, 1997–2017, https://doi.org/10.1256/qj.04.134, 2005. a
Field, P. R., Heymsfield, A. J., and Bansemer, A.: Shattering and particle interarrival times measured by optical array probes in ice clouds, J. Atmos. Ocean. Tech., 23, 1357–1371, https://doi.org/10.1175/JTECH1922.1, 2006. a
Field, P. R., Heymsfield, A. J., and Bansemer, A.: Snow size distribution parameterization for midlatitude and tropical ice clouds, J. Atmos. Sci., 64, 4346–4365, https://doi.org/10.1175/2007JAS2344.1, 2007. a
Fu, Q.: An accurate parameterization of the solar radiative properties of cirrus clouds for climate models, J. Climate, 9, 2058–2082, https://doi.org/10.1175/1520-0442(1996)009<2058:AAPOTS>2.0.CO;2, 1996. a
Fu, Q., Yang, P., and Sun, W. B.: An accurate parameterization of the infrared radiative properties of cirrus clouds for climate models, J. Climate, 11, 2223–2237, https://doi.org/10.1175/1520-0442(1998)011<2223:AAPOTI>2.0.CO;2, 1998. a, b
Fu, Q., Sun, W. B., and Yang, P.: Modeling of scattering and absorption by nonspherical cirrus ice particles at thermal infrared wavelengths, J. Atmos. Sci., 56, 2937–2947, https://doi.org/10.1175/1520-0469(1999)056<2937:MOSAAB>2.0.CO;2, 1999. a
Gil-Díaz, C., Sicard, M., Comerón, A., dos Santos Oliveira, D. C. F., Muñoz-Porcar, C., Rodríguez-Gómez, A., Lewis, J. R., Welton, E. J., and Lolli, S.: Geometrical and optical properties of cirrus clouds in Barcelona, Spain: analysis with the two-way transmittance method of 4 years of lidar measurements, Atmos. Meas. Tech., 17, 1197–1216, https://doi.org/10.5194/amt-17-1197-2024, 2024. a, b, c, d, e, f, g, h, i, j, k, l, m, n, o, p, q
Goddard Space Flight Center: The SolRad-Net products publication, Goddard Space Flight Center [data set], https://solrad-net.gsfc.nasa.gov/cgi-bin/type_piece_of_map_flux (last access: 8 July 2024), 2024a. a
Goddard Space Flight Center: The AERONET products publication, Goddard Space Flight Center [data set], https://aeronet.gsfc.nasa.gov/new_web/webtool_inv_v3.html (last access: 8 July 2024), 2024b. a
Hartmann, D. L., Moy, L. A., and Fu, Q.: Tropical convection and energy balance at the top of the atmosphere, J. Climate, 14, 4495–4511, https://doi.org/10.1175/1520-0442(2001)014<4495:TCATEB>2.0.CO;2, 2001. a
Hemmer, F.: Characterization of Cirrus Clouds from Ground-Based Remote Sensing Using the Synergy of Lidar and Multi-Spectral Infrared Radiometry, thèse de doctorat at École doctorale SMRE, Université de Lille, dans la spécialité Optique et Lasers, Physico-Chimie, Atmosphere, https://pepite-depot.univ-lille.fr/LIBRE/EDSMRE/2018/50376-2018-Hemmer.pdf (last access: 1 March 2024), 2018. a, b
Heymsfield, A. J., Miller, K. M., and Spinhirne, J. D.: The 27–28 October 1986 FIRE IFO Cirrus Case Study: Cloud Microstructure, Mon. Weather Rev., 118, 2313–2318, https://doi.org/10.1175/1520-0493(1990)118<2313:TOFICC>2.0.CO;2, 1990. a
Heymsfield, A. J. and Miloshevich, L. M.: Relative Humidity and Temperature Influences on Cirrus Formation and Evolution: Observations from Wave Clouds and FIRE II, J. Atmos. Sci., 52, 4302–4326, https://doi.org/10.1175/1520-0469(1995)052<4302:RHATIO>2.0.CO;2, 1995. a
Heymsfield, A. J. and Miloshevich, L. M.: Parametrizations for the cross-sectional area and extinction of cirrus and stratiform ice cloud particles, J. Atmos. Sci., 60, 936–956, https://doi.org/10.1175/1520-0469(2003)060<0936:PFTCSA>2.0.CO;2, 2003. a, b
Heymsfield, A., Winker, D., Avery, M., Vaughan, M., Diskin, G., Deng, M., Mitev, V., and Matthey, R.: Relationships between ice water content and volume extinction coefficient from in-situ observations for temperatures from 0° to −86 °C: Implications for spaceborne lidar retrievals, JAMC, 53, 479–505, https://doi.org/10.1175/JAMC-D-13-087.1, 2014. a, b
Henyey, L. G. and Greenstein, J. L.: Diffuse radiation in the galaxy, Astrophys. J., 93, 70–83, https://doi.org/10.1086/144246, 1941. a
Hess, M. and Wiegner, M.: COP: a data library of optical properties of hexagonal ice crystals, Appl. Optics, 33, 7740, https://doi.org/10.1364/ao.33.007740, 1994. a, b
Holz, R. E., Ackerman, S. A., Nagle, F. W., Frey, R., Dutcher, S., Kuehn, R. E., Vaughan, M. A., and Baum, B.: Global Moderate Resolution Imaging Spectroradiometer (MODIS) cloud detection and height evaluation using CALIOP, J. Geophys. Res., 113, D00A19, https://doi.org/10.1029/2008JD009837, 2008. a
Ingmann, P. and Straume, A. G.: ADM-Aeolus Mission Requirements Document, European Space Agency, 2, 57, https://esamultimedia.esa.int/docs/EarthObservation/ADM-Aeolus_MRD.pdf (last access: 3 June 2023), 2016. a
IPCC: Climate Change 2021: The Physical Science Basis. Contribution of Working Group I to the Sixth Assessment Report of the Intergovernmental Panel on Climate Change, edited by: Masson-Delmotte, V., Zhai, P., Pirani, A., Connors, S. L., Péan, C., Berger, S., Caud, N., Chen, Y., Goldfarb, L., Gomis, M. I., Huang, M., Leitzell, K., Lonnoy, E., Matthews, J. B. R., Maycock, T. K., Waterfield, T., Yelekçi, O., Yu, R., and Zhou, B., Cambridge University Press, Cambridge, United Kingdom and New York, NY, USA, https://doi.org/10.1017/9781009157896, 2023. a, b, c
Inness, A., Ades, M., Agustí-Panareda, A., Barré, J., Benedictow, A., Blechschmidt, A.-M., Dominguez, J. J., Engelen, R., Eskes, H., Flemming, J., Huijnen, V., Jones, L., Kipling, Z., Massart, S., Parrington, M., Peuch, V.-H., Razinger, M., Remy, S., Schulz, M., and Suttie, M.: The CAMS reanalysis of atmospheric composition, Atmos. Chem. Phys., 19, 3515–3556, https://doi.org/10.5194/acp-19-3515-2019, 2019. a
Jensen, E. J., Kinne, S., and Toon, O. B.: Tropical cirrus cloud radiative forcing: Sensitivity studies, Geophys. Res. Lett., 21, 2023–2026, https://doi.org/10.1029/94GL01358, 1994. a
Kienast-Sjögren, E., Rolf, C., Seifert, P., Krieger, U. K., Luo, B. P., Krämer, M., and Peter, T.: Climatological and radiative properties of midlatitude cirrus clouds derived by automatic evaluation of lidar measurements, Atmos. Chem. Phys., 16, 7605–7621, https://doi.org/10.5194/acp-16-7605-2016, 2016. a, b, c
King, M. D., Platnick, S., Wind, G., Arnold, G. T., and Dominguez, R. T.: Remote sensing of radiative and microphysical properties of clouds during TC4: Results from MAS, MASTER, MODIS, and MISR. J. Geophys. Res., 115, D00J07, https://doi.org/10.1029/2009JD013277, 2010. a
Konopka, P., Steinhorst, H.-M., Grooß, J.-U., Günther, G., Müller, R., Elkins, J. W., Jost, H.-J., Richard, E., Schmidt, U., Toon, G., and McKenna, D. S.: Mixing and ozone loss in the 1999–2000 Arctic vortex: Simulations with the three-dimensional Chemical Lagrangian Model of the Stratosphere (CLaMS), J. Geophys. Res., 109, D02315, https://doi.org/10.1029/2003JD003792, 2004. a
Korolev, A. V., Mazin, I. P., and Barker, H.: Microphysical properties of continental clouds from in-situ measurements, Q. J. Roy. Meteor. Soc., 127, 2117–2151, https://doi.org/10.1002/qj.49712757614, 2001. a, b
Korolev, A. V., Emery, E. F., Strapp, J. W., Cober, S. G., Isaac, G. A., Wasey, M., and Marcotte, D.: Small ice particles in tropospheric clouds: Fact or artifact? Airborne icing instrumentation evaluation experiment, B. Am. Meteorol. Soc., 92, 967–973, https://doi.org/10.1175/2010BAMS3141.1, 2011. a, b
Krämer, M., Rolf, C., Luebke, A., Afchine, A., Spelten, N., Costa, A., Meyer, J., Zöger, M., Smith, J., Herman, R. L., Buchholz, B., Ebert, V., Baumgardner, D., Borrmann, S., Klingebiel, M., and Avallone, L.: A microphysics guide to cirrus clouds – Part 1: Cirrus types, Atmos. Chem. Phys., 16, 3463–3483, https://doi.org/10.5194/acp-16-3463-2016, 2016. a, b, c, d
Krämer, M., Rolf, C., Spelten, N., Afchine, A., Fahey, D., Jensen, E., Khaykin, S., Kuhn, T., Lawson, P., Lykov, A., Pan, L. L., Riese, M., Rollins, A., Stroh, F., Thornberry, T., Wolf, V., Woods, S., Spichtinger, P., Quaas, J., and Sourdeval, O.: A microphysics guide to cirrus – Part 2: Climatologies of clouds and humidity from observations, Atmos. Chem. Phys., 20, 12569–12608, https://doi.org/10.5194/acp-20-12569-2020, 2020. a, b, c, d, e, f
Langley Research Center: The NOAA-20 products publication, Langley Research Center [data set], https://ceres.larc.nasa.gov/data/ (last access: 8 July 2024), 2024. a
Lawson, R. P., Baker, B. A., and Pilson, B. L.: in-situ measurements of microphysical properties of mid-latitude and anvil cirrus and validation of satellite retrievals, in Proc 30th International Symposium on Remote Sensing of Environment, Honolulu, Hawaii, USA, http://www.specinc.com/sites/default/files/pdfs/lSRSE_cirrus_anvil_presentation.pdf (last access: 1 March 2024), 2003. a
Lawson, R. P., Baker, B. A., Zmarzly, P., O'Connor, D., Mo, Q., Gayet, J.-F., and Shcherbakov, V.: Microphysical and optical properties of atmospheric ice crystals at South Pole station, J. Appl. Meteorol. Clim., 45, 1505–1524, https://doi.org/10.1175/JAM2421.1, 2006. a
Lee, J., Yang, P., Dessler, A. E., Gao, B. C., and Platnick, S.: Distribution and radiative forcing of tropical thin cirrus clouds, J. Atmos. Sci., 66, 3721–3731, https://doi.org/10.1175/2009JAS3183.1, 2009. a, b, c, d, e, f, g, h
Levy, R. C., Mattoo, S., Munchak, L. A., Remer, L. A., Sayer, A. M., Patadia, F., and Hsu, N. C.: The Collection 6 MODIS aerosol products over land and ocean, Atmos. Meas. Tech., 6, 2989–3034, https://doi.org/10.5194/amt-6-2989-2013, 2013. a
Liou, K. N.: The influence of cirrus on weather and climate processes: A global perspective, Mon. Weather Rev., 114, 1167–1199, https://doi.org/10.1175/1520-0493(1986)114<1167:IOCCOW>2.0.CO;2, 1986. a
Liou, K. N., Gu, Y., Yue, Q., and McFarguhar, G.: On the correlation between ice water content and ice crystal size and its application to radiative transfer and general circulation models, Geophys. Res. Lett., 35, L13805, https://doi.org/10.1029/2008GL033918, 2008. a
Loeb, N.G., Manalo-Smith, N., Su, W., Shankar, M., and Thomas, S.: CERES top-of-the-atmosphere earth radiation budget climate data record: Accounting for in-orbit changes in instrument calibration, Remote Sens., 8, 182, https://doi.org/10.3390/rs8030182, 2016. a
Loeb, N. G., Wielicki, B. A., Doelling, D. R., Smith, G. L., Keyes, D. F., Kato, S., Manalo-Smith, N., and Wong, T.: Toward optimal closure of the Earth’s top-of-atmosphere radiation budget, J. Climate, 22, 748–766, https://doi.org/10.1175/2008JCLI2637.1, 2009. a
Lolli, S., Vivone, G., Lewis, J. R., Sicard, M., Welton, E. J., Campbell, J. R., Comerón, A., D'Adderio, L. P., Tokay, A., Giunta, A., and, Pappalardo, G.: Overview of the new version 3 NASA Micro-Pulse Lidar Network (MPLNET) automatic precipitation detection algorithm, Remote Sens., 12, 71, https://doi.org/10.3390/rs12010071, 2019. a
Lolli, S., Campbell, J. R., Lewis, J. R., Gu, Y., and Welton, E. J.: Technical note: Fu–Liou–Gu and Corti–Peter model performance evaluation for radiative retrievals from cirrus clouds, Atmos. Chem. Phys., 17, 7025–7034, https://doi.org/10.5194/acp-17-7025-2017, 2017a. a
Lolli, S., Campbell, J. R., Lewis, J. R., Gu, Y., Marquis, J. W., Chew, B. N., Liew, S. C., Salinas, S. V., and Welton, E. J.: Daytime top-of-the-atmosphere cirrus cloud radiative forcing properties at Singapore, J. Appl. Meteorol. Clim., 56, 1249–1257, https://doi.org/10.1175/JAMC-D-16-0262.1, 2017b. a, b, c, d, e, f
Luebke, A. E., Afchine, A., Costa, A., Grooß, J.-U., Meyer, J., Rolf, C., Spelten, N., Avallone, L. M., Baumgardner, D., and Krämer, M.: The origin of midlatitude ice clouds and the resulting influence on their microphysical properties, Atmos. Chem. Phys., 16, 5793–5809, https://doi.org/10.5194/acp-16-5793-2016, 2016. a
Macke, A., Mueller, J., and Raschke, E.: Single scattering properties of atmospheric ice crystals, J. Atmos. Sci. 53: 2813–2825, https://doi.org/10.1175/1520-0469(1996)053<2813:SSPOAI>2.0.CO;2, 1996. a
McKenna, D. S., Grooß, J.-U., Günther, G., Konopka, P., Müller, R., Carver, G., and Sasano, Y.: A new Chemical Lagrangian Model of the Stratosphere (CLaMS) 2. Formulation of chemistry scheme and initialization, J. Geophys. Res., 107, 4256, https://doi.org/10.1029/2000JD000113, 2002a. a
McKenna, D. S., Konopka, P., Grooß, J.-U., Günther, G., Müller, R., Spang, R., Offermann, D., and Orsolini, Y.: A new Chemical Lagrangian Model of the Stratosphere (CLaMS) – 1. Formulation of advection and mixing, J. Geophys. Res., 107, 4309, https://doi.org/10.1029/2000JD000114, 2002b. a
MPLNET: The NASA Micro-Pulse Lidar Network products publication, MPLNET [data set], https://mplnet.gsfc.nasa.gov/download_tool (last access: 8 July 2024), 2024. a
NASA/LARC/SD/ASDC: CALIPSO Lidar Level 2 Standard, 5 km Cloud Layer, V4-20, NASA Langley Atmospheric Science Data Center DAAC [data set], https://opendap.larc.nasa.gov/opendap/CALIPSO/LID_L2_05kmCLay-Standard-V4-20/contents.html (last access: 8 July 2024), 2024. a
Pappalardo, G., Amodeo, A., Apituley, A., Comeron, A., Freudenthaler, V., Linné, H., Ansmann, A., Bösenberg, J., D'Amico, G., Mattis, I., Mona, L., Wandinger, U., Amiridis, V., Alados-Arboledas, L., Nicolae, D., and Wiegner, M.: EARLINET: towards an advanced sustainable European aerosol lidar network, Atmos. Meas. Tech., 7, 2389–2409, https://doi.org/10.5194/amt-7-2389-2014, 2014. a
Podglajen, A., Hertzog, A., Plougonven, R., and Legras, B.: Lagrangian temperature and vertical velocity fluctuations due to gravity waves in the lower stratosphere, Geophys. Res. Lett., 43, 3543–3553, https://doi.org/10.1002/2016GL068148. a
Ramanathan, V., Cess, R. D., Harrison, E. F., Minnis, P., Barkstrom, B. R., Ahmad, E., and Hartmann, D.: Cloud-radiative forcing and climate: Results from the Earth Radiation Budget Experiment, Science, 243, 57–63, https://doi.org/10.1126/science.243.4887.57, 1989. a
Raschke, E.: Ice-International Cirrus Experiment (In Europe), in: Liou, K. N. and Xiuji, Z., Atmospheric Radiation, AMS, Boston, MA, https://doi.org/10.1007/978-1-935704-18-8_76, 1987. a
Rolf, C., Krämer, M., Schiller, C., Hildebrandt, M., and Riese, M.: Lidar observation and model simulation of a volcanic-ash-induced cirrus cloud during the Eyjafjallajökull eruption, Atmos. Chem. Phys., 12, 10281–10294, https://doi.org/10.5194/acp-12-10281-2012, 2012. a
Rublev, A. N.: Algorithm and computation of aerosol phase functions, Internal Note IAE-5715/16 of Russian Research Center (Kurchatov Institute), Moscow, 51 pp., https://aeris-geisa.ipsl.fr/geisa_files/fichiers_pdf/2011/rublev.pdf (last access: 1 March 2024), 1994. a
Saponaro, G., Tukiainen, S., and Sorvari, S.: Deliverable 1.5 ACTRIS Stakeholder Handbook 2018, edited by: Tukiainen, S. and Sorvari, S., ISBN 978-952-336-067-9, 2019. a
Sassen, K. and Cho, B. S.: Subvisual-thin cirrus lidar dataset for satellite verification and climatological research, J. Appl. Meteorol., 31, 1275–1285, http://www.jstor.org/stable/26186567 (last access: 1 March 2024), 1992. a, b, c, d, e, f, g, h, i
Sauvage, L., Chepfer, H., Trouillet, V., Flamant, P. H., Brogniez, G., Pelon, J., and Albers, F.: Remote sensing of cirrus radiative parameters during EUCREX’94. Case study of 17 April 1994. Part I: Observations, Mon. Weather Rev., 127, 486–503, https://doi.org/10.1175/1520-0493(1999)127<0486:RSOCRP>2.0.CO;2, 1999. a
Schiller, C., Krämer, M., Afchine, A., Spelten, N., and, Sitnikov, N.: Ice water content in Arctic, midlatitude, and tropical cirrus, J. Geophys. Res., 113, D24208, https://doi.org/10.1029/2008JD010342, 2008. a
Schmitt, C. G., Iaquinta, J., and Heymsfield, A. J.: The asymmetry parameter of cirrus clouds composed of hollow bullet rosette-shaped ice crystals from ray-tracing calculations, J. Appl. Meteorol. Clim., 45, 973–981, https://doi.org/10.1175/JAM2384.1, 2006. a
Sicard, M., Pérez, C., Rocadenbosch, F., Baldasano, J. M., and García-Vizcaino, D.: Mixed-layer depth determination in the Barcelona coastal area from regular lidar measurements: Methods, results and limitations, Bound.-Lay, Meteorol., 119, 135–157, https://doi.org/10.1007/s10546-005-9005-9, 2006. a
Sicard, M., Bertolín, S., Mallet, M., Dubuisson, P., and Comerón, A.: Estimation of mineral dust long-wave radiative forcing: sensitivity study to particle properties and application to real cases in the region of Barcelona, Atmos. Chem. Phys., 14, 9213–9231, https://doi.org/10.5194/acp-14-9213-2014, 2014. a, b, c
Sourdeval, O.: Étude des propriétés optiques et radiatives des nuages de type cirrus déduites de la synergie des mesures de rayonnement passif et actif: application dans le contexte de l'A-Train et des futures missions spatiales, thèse de doctorat at École doctorale SMRE, Université de Lille, dans la spécialité Optique et Lasers, Physico-Chimie, Atmosphere, https://pepite-depot.univ-lille.fr/LIBRE/EDSMRE/2012/50376-2012-Sourdeval.pdf (last access: 1 March 2024), 2012. a, b
Spichtinger, P., and Cziczo, D.J.: Impact of heterogeneous ice nuclei on homogeneous freezing events in cirrus clouds, J. Geophys. Res.-Atmos., 115, D14208, https://doi.org/10.1029/2009JD012168, 2010. a
Spichtinger, P. and Gierens, K. M.: Modelling of cirrus clouds – Part 1a: Model description and validation, Atmos. Chem. Phys., 9, 685–706, https://doi.org/10.5194/acp-9-685-2009, 2009. a, b
Stamnes, K., Tsay, S., and Istvan, L.: DISORT, a general-purpose Fortran program for discrete-ordinate-method radiative transfer in scattering and emitting layered media: documentation of methodology, DISORT Report v1.1, 112, https://www.libradtran.org/lib/exe/fetch.php?media=disortreport1.1.pdf (last access: 1 March 2024), 2000. a
Su, W., Corbett, J., Eitzen, Z., and Liang, L.: Next-generation angular distribution models for top-of-atmosphere radiative flux calculation from CERES instruments: methodology, Atmos. Meas. Tech., 8, 611–632, https://doi.org/10.5194/amt-8-611-2015, 2015. a
Sun, Z. and Shine, K. P.: Studies of the radiative properties of ice and mixed‐phase clouds, Q. J. Roy. Meteorol. Soc., 120, 111–137, https://doi.org/10.1002/qj.49712051508, 1994. a, b, c, d
Toon, O. B., Starr, D. O., Jensen, E. J., Newman, P. A., Platnick, S., Schoeberl, M. R., Wennberg, P. O., Wofsy, S. C., Kurylo, M. J., Maring, H., Jucks, K. W., Craig, M. S., Vasques, M. F., Pfister, L., Rosenlof, K. H., Selkirk, H. B., Colarco, P. R., Kawa, S. R., Mace, G. G., Minnis, P., and Pickering, K. E.: Planning, implementation, and first results of the Tropical Composition, Cloud and Climate Coupling Experiment (TC4), J. Geophys. Res., 115, D00J04, https://doi.org/10.1029/2009JD013073, 2010. a
Vidot, J., Baran, A. J., and, Brunel, P.: A new ice cloud parameterization for infrared radiative transfer simulation of cloudy radiances: Evaluation and optimization with IIR observations and ice cloud profile retrieval products, J. Geophys. Res., 120, 6937–6951, https://doi.org/10.1002/2015JD023462, 2015. a, b, c, d, e, f, g
Voigt, C., Schumann, U., Minikin, A., Abdelmonem, A., Afchine, A., Borrmann, S., Boettcher, M., Buchholz, B., Bugliaro, L., Costa, A., Curtius, J., Dollner, M., Dörnbrack, A., Dreiling, V., Ebert, V., Ehrlich, A., Fix, A., Forster, L., Frank, F., and Zoeger, M.: ML-CIRRUS: The Airborne Experiment on Natural Cirrus and Contrail Cirrus with the High-Altitude Long-Range Research Aircraft HALO, B. Am. Meteorol. Soc., 98, 271–288, https://doi.org/10.1175/BAMS-D-15-00213.1, 2017. a
Wagner, F. and Silva, A. M.: Some considerations about Ångström exponent distributions, Atmos. Chem. Phys., 8, 481–489, https://doi.org/10.5194/acp-8-481-2008, 2008. a
Welton, E. J. Voss, K. J., Gordon, H. R., Maring, H., Smirnov, A., Holben, B., Schmid, B., Livingston, J. M., Russell, P. B., Durkee, P. A., Formenti, P., and Andreae, M. O.: Ground-based Lidar Measurements of Aerosols During ACE-2: Instrument Description, Results, and Comparisons with other Ground-based and Airborne Measurements, Tellus B, 52, 635–650, https://doi.org/10.3402/tellusb.v52i2.17124, 2000. a
Welton, E. J., Campbell, J. R., Spinhirne, J. D., and Scott, V. S.: Global monitoring of clouds and aerosols using a network of micro-pulse lidar 680 systems, P. SPIE, 4153, 151–158, https://doi.org/10.1117/12.417040, 2001. a
Welton, E. J. Voss, K. J., Quinn, P. K., Flatau, P. J., Markowicz, K., Campbell, J. R., Spinhirne, J. D., Gordon, H. R., and Johnson, J. E.: Measurements of aerosol vertical profiles and optical properties during INDOEX 1999 using micro-pulse lidars, J. Geophys. Res., 107, 8019, https://doi.org/10.1029/2000JD000038, 2002. a
Welton, E. J., Stewart, S. A., Lewis, J. R., Belcher, L. R., Campbell, J. R., and Lolli, S.: Status of the NASA Micro Pulse Lidar Network (MPLNET): overview of the network and future plans, new version 3 data products, and the polarized MPL, EPJ Web Conf., 176, 09003, https://doi.org/10.1051/epjconf/201817609003, 2018. a
Winker, D. M., Hunt, W. H., and McGill, M. J.: Initial performance assessment of CALIOP, Geophys. Res. Lett., 34, L19803, https://doi.org/10.1029/2007GL030135, 2007. a
Wolf, K., Bellouin, N., and Boucher, O.: Sensitivity of cirrus and contrail radiative effect on cloud microphysical and environmental parameters, Atmos. Chem. Phys., 23, 14003–14037, https://doi.org/10.5194/acp-23-14003-2023, 2023. a, b, c, d, e
Yang, P., Wei, H., Huang, H. L., Baum, B. A., Hu, Y. X., Kattawar, G. W., Mishchenko, M. I., and Fu, Q.: Scattering and absorption property database for nonspherical ice particles in the near-Through far-infrared spectral region, Appl. Optics, 44, 5512–5523, https://doi.org/10.1364/AO.44.005512, 2005. a, b
Yang, P., Zhang, L., Hong, G., Nasiri, S. L., Baum, B. A., Huang, H.-L., King, M. D., and Platnick, S.: Differences between collection 4 and 5 MODIS ice cloud optical/microphysical products and their impact on radiative forcing simulations, IEEE T. Geosci. Remote Sens., 45, 2886–2899, https://doi.org/10.1109/TGRS.2007.898276, 2007. a
Yang, P., Bi, L., Baum, B. A., Liou, K. N., Kattawar, G. W., Mishchenko, M. I., and Cole, B.: Spectrally consistent scattering, absorption, and polarization properties of atmospheric ice crystals at wavelengths from 0.2 to 100 µm, J. Atmos. Sci., 70, 330–347, https://doi.org/10.1175/JAS-D-12-039.1, 2013. a, b, c, d