the Creative Commons Attribution 4.0 License.
the Creative Commons Attribution 4.0 License.
 | 21 Mar 2025
Measurement report: Vertically resolved atmospheric properties observed over the Southern Great Plains with the ArcticShark uncrewed aerial system
Damao Zhang
Jerome D. Fast
Gourihar Kulkarni
Mikhail S. Pekour
Christopher R. Niedek
Susanne Glienke
Israel Silber
Beat Schmid
Jason M. Tomlinson
Hardeep S. Mehta
Xena Mansoura
Zezhen Cheng
Gregory W. Vandergrift
Nurun Nahar Lata
Swarup China
Zihua Zhu
This study presents the unique capability of the Department of Energy (DOE) ArcticShark – a mid-size fixed-wing uncrewed aerial system (UAS) – for measuring vertically resolved atmospheric properties over the Southern Great Plains (SGP) of the United States. Focusing on atmospheric states, such as ambient temperature, wind, and aerosol properties, we overview measurements from 32 research flights (∼ 97 flight hours) in 2023. The August operations, aided by a visual observer on a chase plane, allowed for extensive UAS coverage, surpassing typical UAS operation envelopes. Our data from March, June, and August 2023 reveal distinctive seasonal patterns within the atmospheric column through unique chemical composition measurements. In situ measurements combined with remote sensing retrievals and radiosonde measurements provided valuable insights into their consistency and complementarity. Furthermore, we demonstrate the capabilities of the ArcticShark through several case studies, including the analyses of correlations between UAS-derived atmospheric profiles and conventional radiosonde measurements, as well as the derivation of vertically resolved profiles of aerosol chemical, optical, and microphysical properties. These case studies highlight the versatility of the ArcticShark UAS as a powerful tool for comprehensive atmospheric research, effectively bridging data gaps and enhancing our understanding of vertical atmospheric structures in the region.
- Article
(4730 KB) - Full-text XML
-
Supplement
(1522 KB) - BibTeX
- EndNote


The Southern Great Plains (SGP) region of the United States has long been a focal point for atmospheric research due to its unique geographical and meteorological characteristics (Phillips and Klein, 2014; Williams et al., 2016). Extending across several states, including Oklahoma, Kansas, and Texas, this area offers diverse environmental conditions, making it an ideal location for studying various atmospheric phenomena (Sisterson et al., 2016; Song et al., 2005). This region is also susceptible to extreme weather events (Kelley and Ardon-Dryer, 2021; Mullens and McPherson, 2019). All of these factors led the Department of Energy (DOE) Atmospheric Radiation Measurement (ARM) program to establish its first comprehensive measurement site at this location in the 1990s (Sisterson et al., 2016). For 30 years, measurement capabilities at the ARM SGP observatory have kept expanding, including multiple observational platforms with comprehensive instruments for extensive atmospheric, aerosol, and cloud observations. Researchers have utilized the long-term observations from the ARM SGP observatory to gain valuable insights into the dynamics of convective systems, to enable the development of more accurate climate model simulation, and to further investigate aerosol–cloud interactions (Phillips et al., 2017; Tao et al., 2019; Zheng et al., 2020).
Moreover, the ARM SGP observatory has been a hub for pioneering efforts in atmospheric remote sensing to provide a vertical context of atmospheric processes. Radiosondes are launched regularly to collect temperature, humidity, and pressure data at various altitudes (Berg et al., 2015; Gartzke et al., 2017). State-of-the-art instruments, such as radar systems, lidars, and advanced meteorological towers, have been deployed to capture data on the vertical structure and dynamics of the atmosphere (Dupont et al., 2011; Thorsen and Fu, 2015; Turner et al., 2016; Jensen et al., 2016; Naud et al., 2003). These capabilities have revolutionized ARM's ability to monitor and analyze atmospheric processes, from boundary layer evolution to cloud microphysics (Dupont et al., 2011; Kennedy et al., 2014; Ou et al., 2002; Riedi et al., 2001; Zhang et al., 2013). Although the continuous monitoring of boundary layer dynamics, along with specific aerosol and cloud vertical properties provided by radiosondes and remote sensing measurements, provides valuable data, these methods have certain limitations, such as reduced vertical measurement accuracy due to dense clouds and heavy aerosol pollution and insufficient spatial and temporal resolution (Balsamo et al., 2018; Geerts et al., 2018; Rahman, 2023).
Airborne measurements offer crucial insights into the dynamic interactions within Earth's atmosphere due to their extensive spatial coverage, high vertical resolution, and flexibility (Wendisch and Brenguier, 2013). In the past decades, the SGP observatory has functioned as a central hub, facilitating numerous field studies for collaborative research involving ground and airborne measurements (Andrews et al., 2004; Delle Monache et al., 2004; Feingold et al., 2006; Knobelspiesse et al., 2008; Vogelmann et al., 2012; Biraud et al., 2013; Turner et al., 2014; Endo et al., 2015; Lu et al., 2016; Fast et al., 2019; Schobesberger et al., 2023). During these field campaigns, research aircraft were deployed to conduct intensive observations. The airborne platforms carried specialized instruments at various altitudes to capture detailed information on atmospheric properties in the SGP region, such as seasonal differences in the vertical profiles of aerosol optical properties (Andrews et al., 2011). The presence of varied land cover, including agricultural fields, grasslands, and urban areas, also offers an excellent opportunity for examining land–atmosphere interactions and understanding how different surfaces influence local weather patterns, energy fluxes, and greenhouse gas exchanges (Fast et al., 2022, 2019; Parworth et al., 2015; Tao et al., 2019; Wang et al., 2023; Zheng et al., 2020).
Anchored at the SGP observatory, the ARM program has continually expanded its capabilities by developing various observational platforms to support the science community. To improve the current understanding of cloud–aerosol interactions, radiative processes, and the impacts of aerosols on both regional and global climate, the ARM program has enhanced its capabilities by incorporating tethered balloon systems and uncrewed aerial systems (UASs) alongside traditional (crewed) aircraft since 2017 (Creamean et al., 2021; Dexheimer et al., 2019; Mei et al., 2022). The ARM Aerial Facility (AAF) (Schmid et al., 2014) has successfully transitioned a mid-size UAS, the ArcticShark, from test flights to an operational platform available to community users (https://arm.gov/news/facility/post/97628, last access: 27 September 2024). The ArcticShark offers flexibility, cost-effectiveness, and operational advantages. It is highly suitable for supporting the DOE mission to enhance our understanding of atmospheric processes and enable more precise and comprehensive environmental monitoring.
This paper introduces a novel dataset of airborne measurements collected in 2023 above the central facility of the ARM SGP observatory using the ArcticShark UAS. The study employed various flight patterns to optimize the integration of ground-based and UAS-borne instruments, focusing on vertically resolved aerosol properties in the SGP region. By combining ARM's UAS capabilities with the established ground-based remote sensing data, this research provides a unique dataset that enables the scientific community to explore atmospheric vertical structures in unprecedented detail. Additionally, insights into aerosol chemical properties at higher altitudes can be obtained through innovative analyses of particle samples collected during UAS deployments. Overall, with its ability to conduct long-duration flights and carry multiple payloads, the ArcticShark successfully bridged observational gaps and showed great potential to enhance our understanding of vertical atmospheric structures. This integration of UAS and ground-based measurements represents a significant advancement in atmospheric data collection, particularly for studying aerosols and their impacts on weather and climate.
2.1 ArcticShark in situ measurements
The ArcticShark is an advanced fixed-wing (6.7 m wingspan) UAS supported by the DOE ARM program to conduct atmospheric research (https://www.arm.gov/guidance/campaign-guidelines/arcticshark, last access: 5 September 2024). The ArcticShark can carry a scientific payload of up to 45 kg (∼ 100 lb), which can include a variety of meteorological, aerosol, trace-gas, and cloud instruments. The ArcticShark can reach altitudes of up to 5500 m and has a flight duration of up to 8 h. This operational range enables data collection over a large spatial area and extended periods, providing a detailed picture of the atmospheric state. The ArcticShark was intensively operated by the AAF in March, June, and August of 2023, allowing for comprehensive data collection above the ARM SGP observatory and contributing valuable data to the scientific community. Throughout three deployments, the AAF engineering and science flights primarily aimed to comprehend the flight operation envelope and determine the optimal operational parameters. Additionally, these flights carried out the scientific measurements of thermodynamics, aerosols, and land-surface properties and explored various flight patterns to effectively address various scientific questions.
The ArcticShark has an interior payload bay of around 85 L and four underwing-mounted pylons to carry these various instrument packages. It provides 2500 W of electrical power specifically for operating the scientific payloads, enabling the integration of multiple sensors simultaneously. The typical measurements include atmospheric state and thermodynamic properties (temperature, humidity, pressure, and 3-D wind components), aerosol (total number concentration, size distribution, optical properties, and chemical compositions) and cloud measurements, atmospheric gases (water vapor and carbon dioxide concentrations), and land-surface monitoring (infrared surface temperature and multispectral images) (detailed in Table 1). More information about the instrumentation has been published before and included in the Supplement (Mei et al., 2022, 2024). Although the typical measurements acquire data at a 1 Hz sampling rate, the ArcticShark is also equipped with the advanced meteorological instrument, the Aircraft Integrated Meteorological Measurement System (AIMMS-30), to provide high-frequency wind measurements. The AIMMS-30 was tested and calibrated using specific flight maneuvers and patterns to ensure the accuracy and reliability of the data collected during the first flight of each mission. Using the data from these calibration flights and appropriate post-processing, the ArcticShark can provide wind data at a rate of 100 Hz to the scientific community (https://doi.org/10.5439/2204047), which can be used to derive further turbulence parameters, such as turbulence kinetic energy (TKE). Before and after each deployment, the aerosol instruments were calibrated in the lab to ensure counting efficiency and sizing accuracy. During deployment, their performance was checked against AAF standard instruments to maintain data consistency and high-quality results (Mei et al., 2022).
2.2 Offline chemical analysis
The primary advantage of offline chemical analysis is the ability to employ sophisticated laboratory-based analytical techniques impractical for airborne deployment due to payload weight and capacity constraints. The ArcticShark is equipped with an eight-spot filter sampler (model 9401, Brechtel), which collects ambient particles at a 2.5 L min−1 flow rate on the 13 mm polytetrafluoroethylene (PTFE) filter media. The filter samples collected by the ArcticShark leverage the advanced chemical analysis capabilities of facilities such as the Environmental Molecular Sciences Laboratory (EMSL), another DOE user facility operated by the Pacific Northwest National Laboratory.
The advanced chemical analysis allows for more comprehensive and detailed analysis of chemical composition to provide deeper insights into the chemical properties of atmospheric particles, including the use of highly sophisticated analytical instruments like a micro-nebulization aerosol mass spectrometer (MN-AMS), computer-controlled scanning electron microscopy with energy dispersive X-ray spectroscopy (CCSEM-EDX), Orbitrap high-resolution mass spectrometry (HRMS), and a time-of-flight secondary ion mass spectrometer (TOF-SIMS). The MN-AMS enables highly sensitive quantification of aerosol composition from the UAS-collected filter samples, with detection limits down to nanogram levels for species like sulfate, nitrate, and organics (Niedek et al., 2023). The chemical compositions of collected samples from 2023 deployments are included in Table 2 and discussed in Sect. 3.1.5. Combining the MN-AMS technique with other offline methods like TOF-SIMS provides comprehensive insights into organic aerosol composition, oxidation state, mixing state with inorganics, and source differentiation (e.g., biomass burning vs. biogenic).
Integrating the STAC (size and time-resolved aerosol collector) impactor (Cheng et al., 2022) with the ArcticShark sampler, aerosol samples can also be collected on TEM grids and silicon nitride (SiNx) substrates. These substrates can be further analyzed in EMSL using CCSEM-EDX to determine individual particle characteristics, such as size, morphology, mixing state, water uptake potential, and elemental composition (Cheng et al., 2023). This method offers valuable information about various atmospheric particle types and their potential sources (Lata et al., 2023). Alternatively, these substrates can be directly analyzed with HRMS coupled with a nanospray desorption electrospray ionization (nano-DESI) source to elucidate intact organic molecular formulas. Researchers can derive key parameters from the mass spectrometer data, including O:C ratios, carbon oxidation states, aromaticity indices, and organic aerosol volatility distributions (Roach et al., 2010; Vandergrift et al., 2024, 2022). During the 2023 deployment, samples collected from the flights on 19 June and 20 August were further analyzed using the above EMSL chemical analysis capabilities.
2.3 ARM value-added products
To facilitate the use of ARM data more effectively, ARM has developed higher-order data products known as value-added products (VAPs) (https://www.arm.gov/data/science-data-products/vaps, last access: 5 September 2024). These VAPs are generated by applying advanced, well-developed retrieval algorithms or implementing additional quality control for existing ARM datastreams, enhancing the user's scientific research and model development. Over a hundred baseline VAPs currently cover a wide range of atmospheric parameters, including aerosol and cloud macro- and microphysical properties, chemical properties, precipitating retrievals, atmospheric environment and radiation budget, and various modeling VAPs.
In this study, we utilized the ARM Cloud Type Classification (CLDTYPE) VAP (Flynn et al., 2017) and the Micropulse Lidar Cloud Mask Machine Learning (MPLCMASKML) VAP (Flynn et al., 2023) for tracking clouds and determining cloud boundaries. For planetary boundary layer (PBL) height estimations, we overlaid our flight tracks with the best-estimate PBL height derived from multiple lidar-based PBL height estimates and ancillary environmental parameters (Zhang et al., 2025). The multiple lidar-based PBL height estimates include PBL height from ceilometer (CEILPBLHT) (Sivaraman et al., 2013) and from Raman lidar data (PBLHTRL1ZHANG) VAPs. The “Raman Lidar Profiles – Feature detection and Extinction” (RLPROF-FEX) (Chand et al., 2022) VAP was used to obtain aerosol particulate backscatter coefficients and aerosol extinction coefficients.
The ARM air mass trajectory (ARMTRAJ-AAF) VAP, offering a Lagrangian back-trajectory dataset, was also used in this study (Silber et al., 2025). This dataset provided detailed information about the coordinates and thermodynamic properties of air masses prior to their transport to the UAS sampling region. Trajectories are calculated using the Hybrid Single-Particle Lagrangian Integrated Trajectory (HYSPLIT) model informed by the European Centre for Medium-Range Weather Forecasts ERA5 reanalysis dataset at its highest spatial resolution (0.25°). They are initialized using ArcticShark sampling times and coordinates (latitude, longitude, and altitude range). Like other ARMTRAJ datasets, ARMTRAJ-AAF provides ensemble run statistics, which are used here to enhance the trajectory robustness (Silber et al., 2024).
The Retrieved Number Concentration of CCN (RNCCN) VAP provides hourly vertical profiles of CCN concentration at various supersaturation values (Kulkarni et al., 2023b). The VAP algorithm is based on the Ghan and Collins (2004) and Ghan et al. (2006) methods that scale the surface CCN concentration with the dry extinction profiles. The dry extinction profiles are calculated after removing the influence of humidification from the extinction profiles. To retrieve the vertical CCN concentration, the VAP assumes that aerosol composition is uniform vertically and larger aerosol particles (> 100 nm) induce droplet activation first. Note that the assumption of uniform aerosol composition in the current VAP increases the uncertainty of the vertical CCN concentration retrievals.
3.1 Overview of the airborne observations
3.1.1 Flight tracks
The AAF deployments at the SGP site consisted of a series of flights designed to gather data on the optimal operational parameters under various atmospheric conditions. The Federal Aviation Administration (FAA) mandates that operators keep the UAS within visual line of sight during the SGP deployment. The diverse flight tracks ensured comprehensive scientific data collection across different geographical areas and weather systems. Figure 1 illustrates the flight tracks from 2021 to 2023, highlighting an extension of the sampling areas in August 2023. This August expansion (flight track in white color) is notably larger compared to the flights conducted before August (represented in light blue), which relied on ground-based visual observers (VOs). This improvement in flight range is attributed to operational advancements enabled by having a VO aboard a chase plane. Previously, the UAS was restricted to the red certificate of authorization (COA) area with the ground-based VOs. With permission to reach into the yellow COA area, the ArcticShark operated in a larger area and reached higher altitudes in the dark-blue area where the UAS is allowed to fly up to 5334 m above sea level. This allows the UAS to gather data from higher altitudes, which can be crucial for studying the planetary boundary layer and the lower troposphere. It also indicates the robust performance of the UAS in terms of altitude range, as shown in Fig. 2.
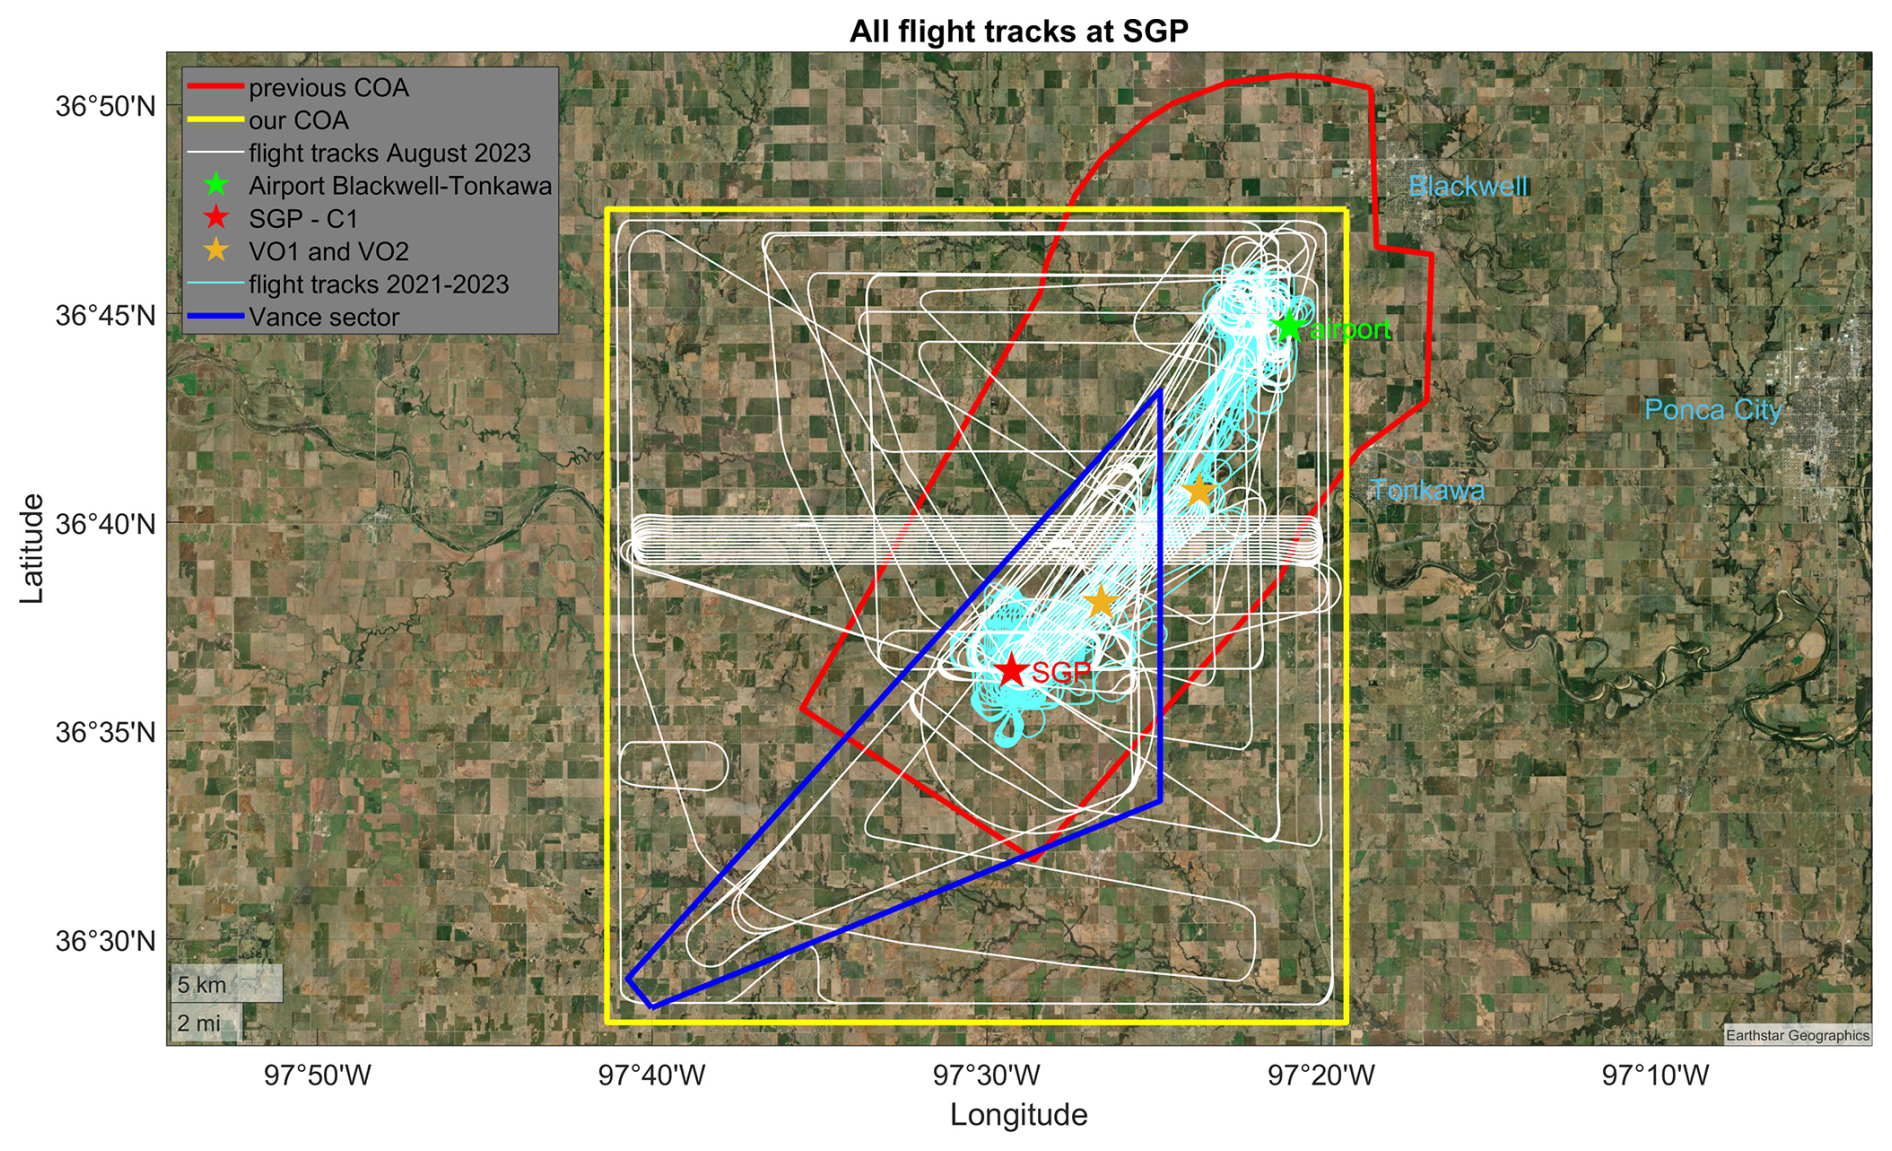
Figure 1All ArcticShark flight tracks above the SGP central facility between 2021 and 2023. The certificate of authorization (COA) area expanded from the red area in 2021 to the yellow box in 2023. Due to airspace restrictions, flights above 1828.8 m (6000 ft) are permitted only inside the blue triangle. The white flight tracks show the UAS flight range in August 2023 with the chase plane. The light-blue flight tracks show the flights between 2021 and 2023 with the visual observers on the ground (green, orange, and red asterisks depict their locations).
3.1.2 Overview of vertical profiles from data collected in March, June, and August 2023
The March, June, and August 2023 flights provided vertical meteorological information from the airborne measurements, as shown in Figs. 2, S1, S2, and S3. The flight dates and durations are listed in Table S2 in the Supplement. We conducted and averaged 10 flights in March, 10 flights in June, and 12 flights in August separately. In Fig. 2, the data from all the research flights in each month were averaged within altitude intervals of 100 m for March and June flights and 500 m for August flights. As shown in Fig. 2a, the ambient temperature decreases as expected with the increase in altitude. The average temperature in March was around 5 °C, which is typical for the tail end of winter and the beginning of spring. By June, the average temperature had increased significantly, reflecting the onset of summer. By August, the average temperature reached nearly 30 °C at the lowest flight level, indicating the peak of the summer season. The relative humidity (Fig. 2b) showed a similar range across all 3 months up to 2000 m above the ground but showed more variation in March. Although the average relative humidity (RH) values for the 3 months are similar, the 25th to 75th percentile RH span for March ranges from 35 % to 73 %, which is twice as large as the spread observed in June (54 % to 70 %) and August (46 % to 64 %). This could be due to the transition from winter to spring, which could bring a mix of weather conditions and, therefore, a wider range of humidity levels. Above 2000 m, relative humidity (RH) values in August increased and exhibited considerable variation, probably due to air cooling, proximity to moisture sources, and atmospheric dynamics. With the chase plane, the ArcticShark can fly through holes in broken cloud fields and reach altitudes above the cloud tops, allowing it to operate in areas with higher relative moisture content, closer to the air's saturation point.
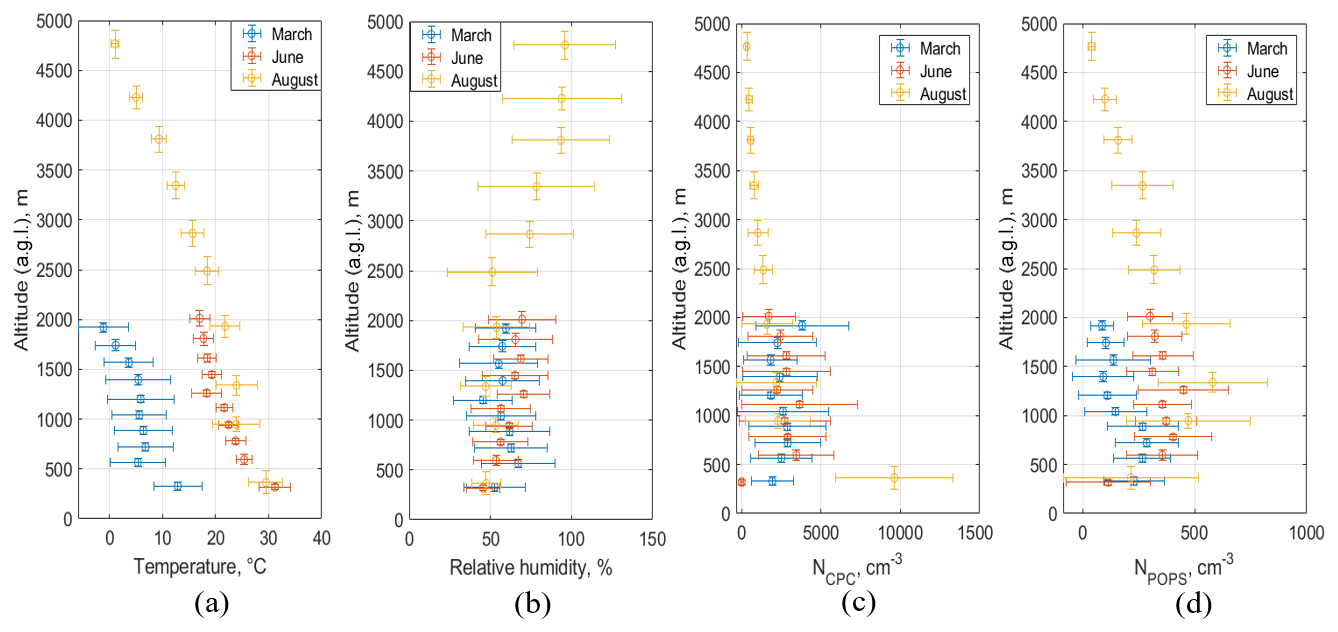
Figure 2Atmospheric conditions encountered during the March, June, and August 2023 flights. (a) Ambient temperature, (b) ambient relative humidity, (c) total number concentration from the mixing condensation particle counter (CPC > 7 nm), and (d) total number concentration from the portable optical particle spectrometer (POPS, 135–3000 nm).
The mean values of the total number concentrations of ambient particles measured by the mixing CPC (NCPC) remain relatively stable across all 3 months within the 500 to 2000 m altitude range and decrease with the increase in altitude, as shown in Fig. 2c. The 25th to 75th percentiles of NCPC range from 1000 to 3000 cm−3 for March and June and from 900 to 2150 cm−3 for August. This uniformity suggests that the overall particle load in the atmosphere at these elevations does not vary significantly in those 3 months. Meanwhile, near the surface, we observed a notable increase in particle concentration close to the ground in August. This might be related to the haze environment prevalent during that month due to local agricultural burning events. In contrast, the number concentration of larger particles, specifically those with a diameter greater than 135 nm (as shown in Fig. 2d), rose steadily from March to August. In March, the concentration of these larger particles was relatively lower, which might indicate a slower growth rate. This slower growth could be linked to the colder temperatures typical of early spring, which may have inhibited atmospheric aerosol particle growth or source activities responsible for forming and accumulating larger particles. As temperatures warmed from March through August, the increase in particle concentration, especially in the accumulation size range measured by POPS (135–3000 nm), could reflect enhanced atmospheric processes, such as more active secondary particle formation or increased emissions from local agriculture sources. The warmer temperatures likely facilitated these processes, leading to the observed rise in larger particles as the months progressed. Furthermore, chemical measurements (discussed later in Table 2) revealed higher particle mass loading during summer, characterized by a significant fraction of organic compounds.
3.1.3 Comparison of meteorological data collected by UAS payload and balloon-borne sounding systems
Figure 3 compares meteorological data collected by the ArcticShark with the data collected by a balloon-borne sounding system (Vaisala radiosonde) (Holdridge, 2020) when both were in the air for March, June, and August flights. These two platforms offer different advantages and can provide complementary information about atmospheric conditions. Radiosondes are among the most straightforward and cost-effective tools for atmospheric measurements, with a well-established history of providing consistent long-term data (Vömel and Ingleby, 2023). In contrast, UAS enables more targeted data collection, allowing for the simultaneous operation of multiple sensors to gather diverse datasets during the same airborne mission. In this study, we used orthogonal linear regression to fit a linear model to the data because there are measurement errors in both ArcticShark and radiosonde measurements. Strong agreement was observed between the ArcticShark and radiosonde data for ambient temperature and humidity, with slopes near 1 and high R-squared values indicating strong correlations, as shown in Fig. 3a and b. The ArcticShark was equipped with redundant temperature sensors (AIMMS-30 and a fiber-optic thermal sensor) and humidity sensors (AIMMS-30 and a LI-COR analyzer), which showed strong agreement with the radiosonde measurements. The discrepancy between the AIMMS-30 and LI-COR measurements can be attributed to several factors, including the spatial separation of the two platforms and the performance degradation of the AIMMS-30 sensor.
Additionally, the study found a good correlation (R2>0.92) for wind speed and direction comparison between the ArcticShark and the radiosonde data. The radiosonde provided a snapshot of wind conditions as it ascended over time, while the UAS profiling above the SGP site captured more measurements within the same altitude range, covering a much larger spatial area. Additionally, the spatial separation (up to 6 km) between the two platforms contributes to the scattering of comparison. These agreements confirm that the ArcticShark's sensors accurately captured the atmospheric conditions at various altitudes, validating its use for meteorological research. While radiosondes remain the standard for high-altitude measurements, UASs are emerging as a valuable complementary tool, offering flexibility, reusability, and high-spatial-resolution measurements.
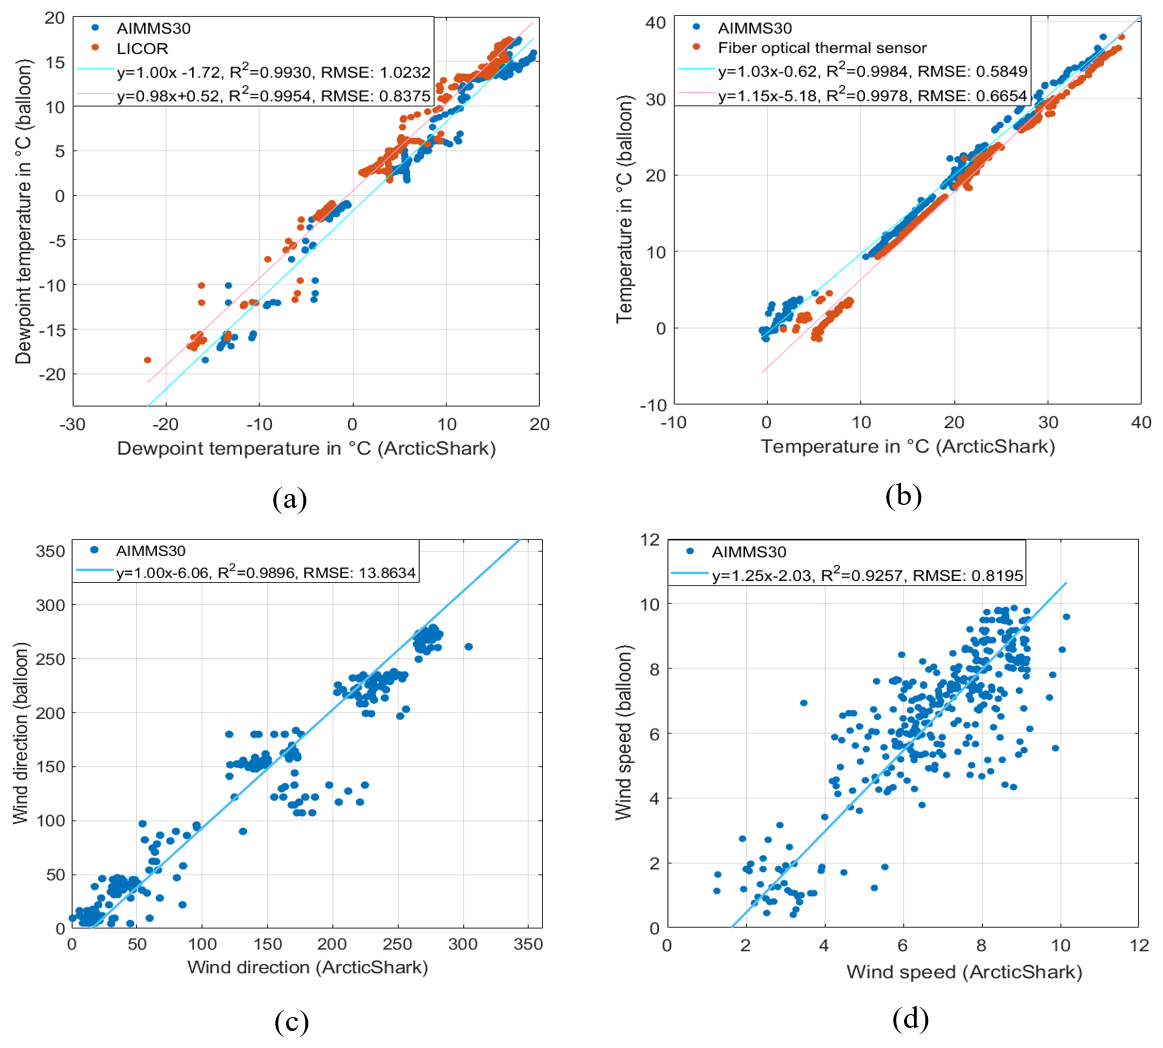
Figure 3Meteorological data comparison between the ArcticShark flights (for March, June, and August) and the radiosonde measurements in 2023. (a) Dew point temperature comparison for AIMMS-30 and LI-COR aboard the ArcticShark, (b) temperature comparison for AIMMS-30 and the fiber optical thermal sensor aboard the ArcticShark, (c) wind direction comparison, and (d) wind speed comparison.
3.1.4 Combining UAS payload measurements with remote sensing retrievals
Integrating ArcticShark flight data with ARM remote sensing observations (Figs. 4 and 5) offers valuable insights into the varying atmospheric conditions encountered across different months, how these conditions influence UAS operations, and the data types collected. Figure 4 overlays the cloud masks from the MPLCMASKML VAP, flight altitude, and best-estimate PBL heights for the three typical March, June, and August flight days. The best-estimate PBL heights are obtained from ARM VAPs, as referenced in Sect. 2.3. The height of the PBL varies with the seasons, generally lower in the spring due to less intense solar heating of the Earth's surface and higher in the summer due to increased solar heating. As shown in Fig. 4, the PBL height in March and June was generally lower compared to August due to several factors: lower solar radiation and surface heating in early spring, the stabilizing temperature gradient, and different atmospheric dynamics. In March and June, increased moisture and still-growing vegetation contribute to lower sensible heat flux. Conversely, August typically experiences intense solar heating, stronger convective currents, and drier conditions, all leading to a higher PBL.
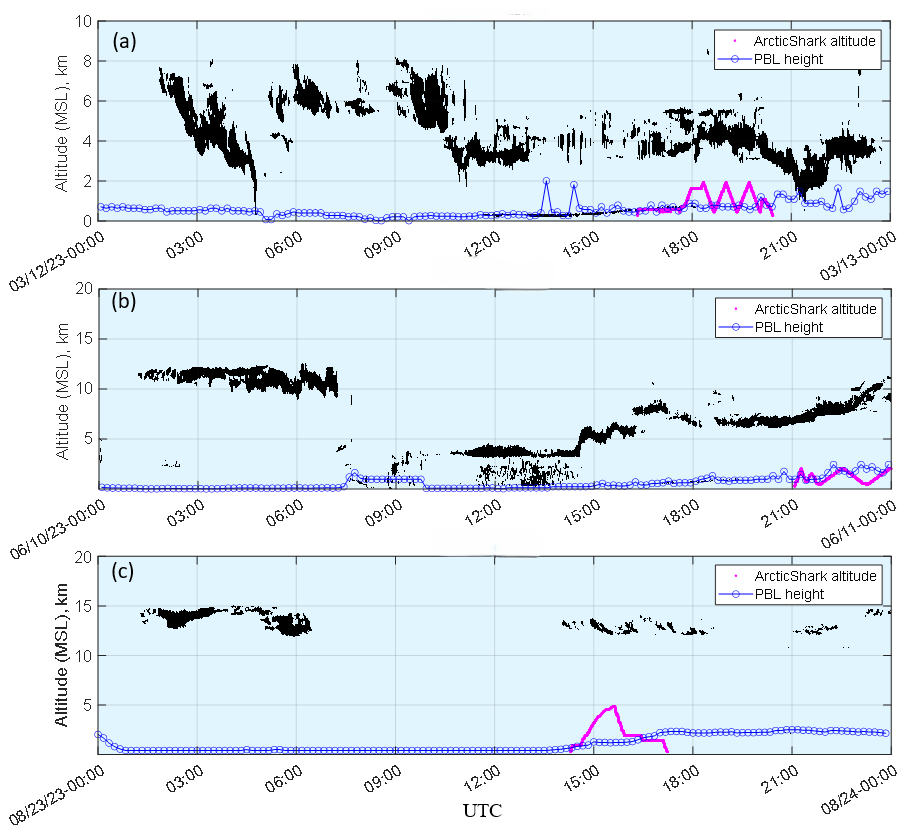
Figure 4Typical ArcticShark flight altitude overlay with the cloud masks from MPLCMASKML and the planetary boundary layer (PBL) height on (a) 12 March, (b) 10 June, and (c) 23 August in 2023. The y axis is the altitude above the mean sea level (m.s.l.).
Additionally, Fig. 4 shows that the clouds on flight days in March were much lower than in June and August, which aligns with the lower PBL height in the spring. In March, cumulus congestus clouds were most common in the region and more common in spring's cooler, more variable weather. Cumulus and convective clouds are observed for flight days in June. These clouds were typically associated with warm weather and were more prevalent as our flights moved into the summer months. By August, cirrus clouds were the dominant cloud type on flight days. These are high-altitude clouds that form above 6000 m and are often associated with fair weather, which is favored for the UAS flight operation.
The combination of the lidar backscatter coefficient (from the RLPROF-FEX VAP), flight altitude, PBL height, and TKE (estimated based on ArcticShark measurement) provides a comprehensive picture of the composition and structure of the atmosphere, as shown in Fig. 5. The figure showed that the TKE values were nearly zero when the ArcticShark flew above the PBL. When the ArcticShark was within the PBL, the TKE values significantly increased. As expected, the turbulence intensity should be higher within the PBL because this is where the sun's heating of the Earth's surface generates thermal turbulence. This observation is particularly useful in August when reliable measurements of the PBL height are unavailable. Vertical gradients in TKE can indirectly indicate the PBL height, as the boundary between the turbulent and non-turbulent regions of the atmosphere corresponds to the top of the PBL. Therefore, by observing where the TKE values increase, we can infer the height of the PBL.
The lidar backscatter coefficients exhibited varying ranges from March to August, with values in March being 10 times higher than those in August. An aerosol layer was aloft at the beginning of the March flight (Fig. 5a) above the SGP observatory. However, the UAS was flown between the SGP site and Blackwell airport and did not capture more information about that layer. In addition, we observed a relatively uniform aerosol concentration below 1 km in the lidar backscatter images, with no significant signal detected above 1 km. Between 18:20 and 20:10 UTC, the ArcticShark conducted five profiling flights between 600 and 2000 m above the SGP site, consistently yielding similar results. When the ArcticShark flew below 1000 m, the total number concentration of aerosols measured by the CPC increased from approximately 1300 to 3000 cm−3 as altitude increased. In contrast, the concentration measured by the POPS decreased from around 400 to 35 cm−3. Notably, the ArcticShark also captured the opposite trend in the total concentrations of CPC and POPS above 1.2 km. As the UAS ascended from 1.2 to 2 km, the CPC concentration decreased to about 1500 cm−3, while the POPS concentration increased to 300 cm−3. These observations suggest distinct aerosol dynamics at different altitude ranges, likely influenced by varying sources and processes affecting aerosol distributions.
The lidar backscatter plot captured the residual layer in the June flight while the ArcticShark flew into it between 23:00 and 23:30 UTC, as shown in Fig. 5b. This near-surface layer exhibited a very high particle concentration according to the CPC reading (∼ 8000 cm−3) but a lower reading in the POPS (∼ 200 cm−3), suggesting that a local emission source influenced the area. On 22 August, the ArcticShark conducted profiling flights above the SGP site, during which the planetary boundary layer (PBL) height grew to around 1.8 km between 15:05 and 17:10 UTC, as shown in Fig. 5c. Throughout this period, we observed that the total aerosol number concentration measured by the CPC increased with altitude while the readings from the POPS decreased. However, an interesting inversion behavior was noted at the top of the boundary layer, between approximately 1700 and 1900 m. Within this altitude range, the POPS concentration initially increased from 400 to 600 cm−3 before decreasing again as the UAS ascended above 1800 m. Such observations highlight the complex vertical distribution of aerosols and underscore the importance of profiling different atmospheric layers to understand the dynamics affecting aerosol behavior and concentration.
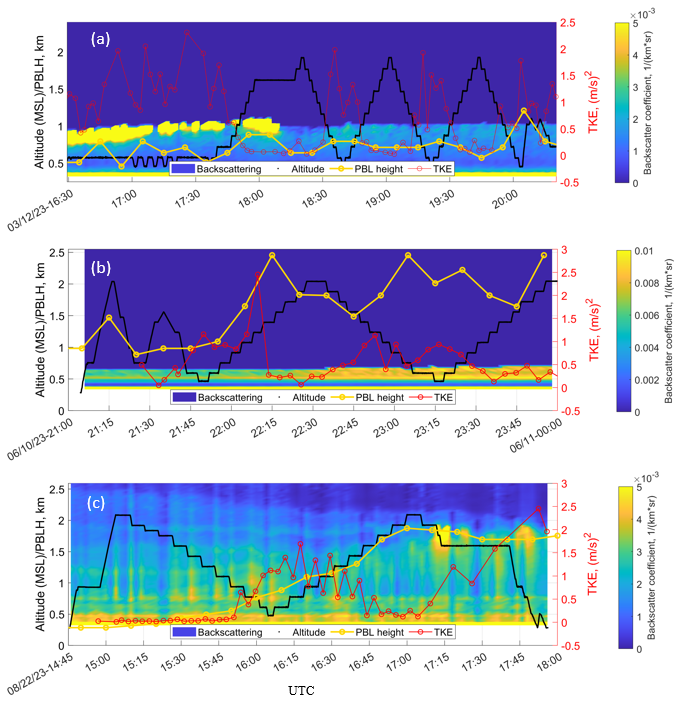
Figure 5Lidar-measured aerosol backscatter overlaid with the ArcticShark flight altitude, the PBL height, and TKE values (right y axis) on (a) 12 March, (b) 10 June, and (c) 22 August in 2023. The left y axis is the altitude above mean sea level (m.s.l.).
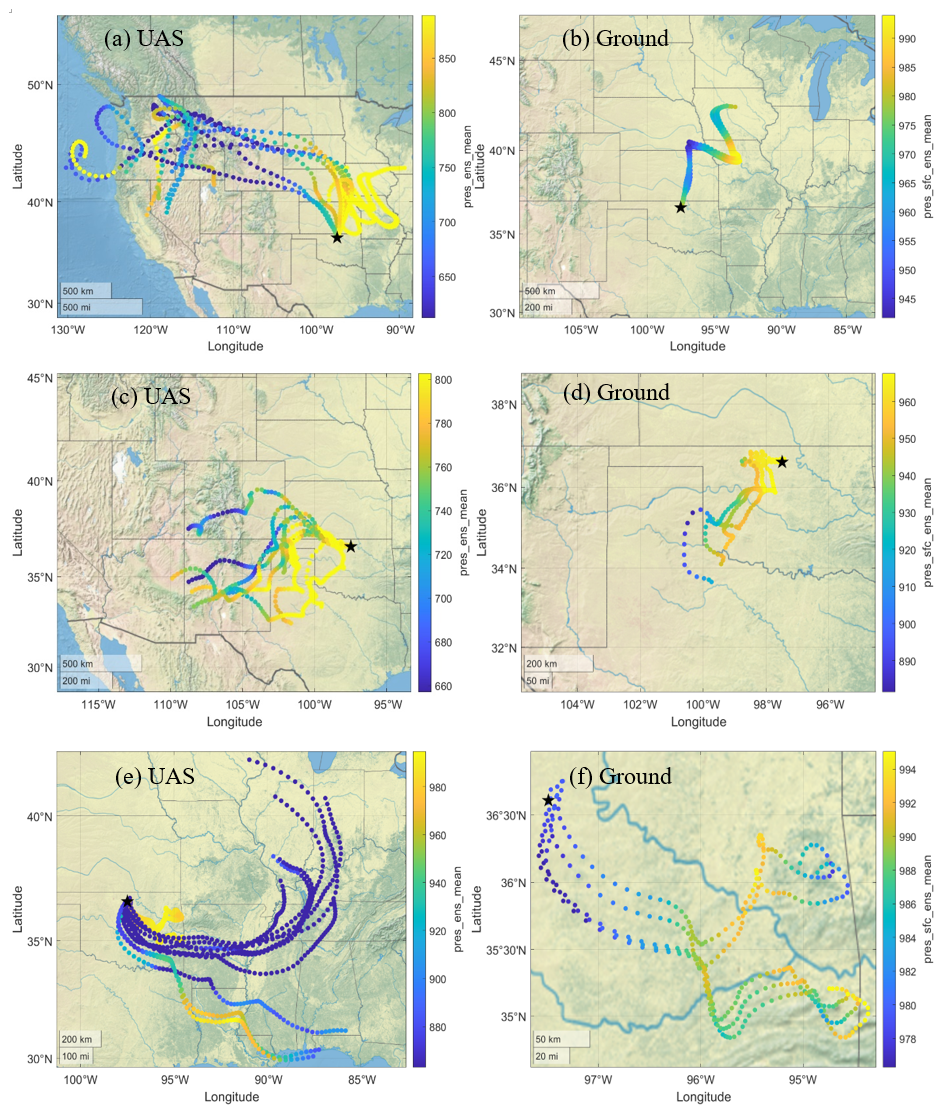
Figure 6ARMTRAJ-AAF 5 d back-trajectory properties in 2023 on 12 March (a, b), 10 June (c, d), and 23 August (e, f). The illustrated ensemble mean pressure trajectories (press_ens_mean) are calculated based on the flight coordinates and altitude range during measurement periods in panels (a), (c), and (e) and based on the ground level at the ArcticShark's flight coordinates in panels (b), (d), and (f). The star is the central facility at the SGP site. All figures are generated using Natural Earth by MATLAB®.
The back trajectory of air masses can support aerosol studies by providing context to long-range aerosol transport and suggest potential interactions during their path. Figure 6 presents a comparison of ARMTRAJ 5 d back-trajectory properties on three separate dates: 12 March, 10 June, and 23 August. For each date, two types of trajectories are shown: one set based on flight coordinates and altitude range during measurement periods (Fig. 6a, c, and e) and another set of trajectories initialized at the ground level at the ArcticShark's flight coordinates (Fig. 6b, d, and f). The ensemble statistics presented here are based on 25-member ensembles generated for each trajectory initialization altitude over a 5×5 grid typically spanning several kilometers in each direction relative to the ArcticShark's coordinates. The ensemble mean trajectories calculated using the flight altitudes (Fig. 6a, c, and e) indicate longer travel pathway distances compared to those calculated based on ground-level initialization. The trajectories suggest that the flight period measurements included a wider range of atmospheric conditions and altitudes, capturing more variant and extended air mass pathways compared to ground-level measurements that were more localized. On 12 March, air mass trajectories originated mainly from the north region of the US before reaching the sampling area near the Southern Great Plains (SGP) site. The trajectories showed that the air mass traveled from the southwest on 12 June. On 23 August, the air mass was more influenced by the southeast region. The differences in air mass origin and trajectory paths between the three dates could be attributed to seasonal atmospheric circulation patterns, which vary with changes in temperature, pressure systems, and overall weather conditions.
3.1.5 Offline chemical analysis of filter samples collected in March, June, and August
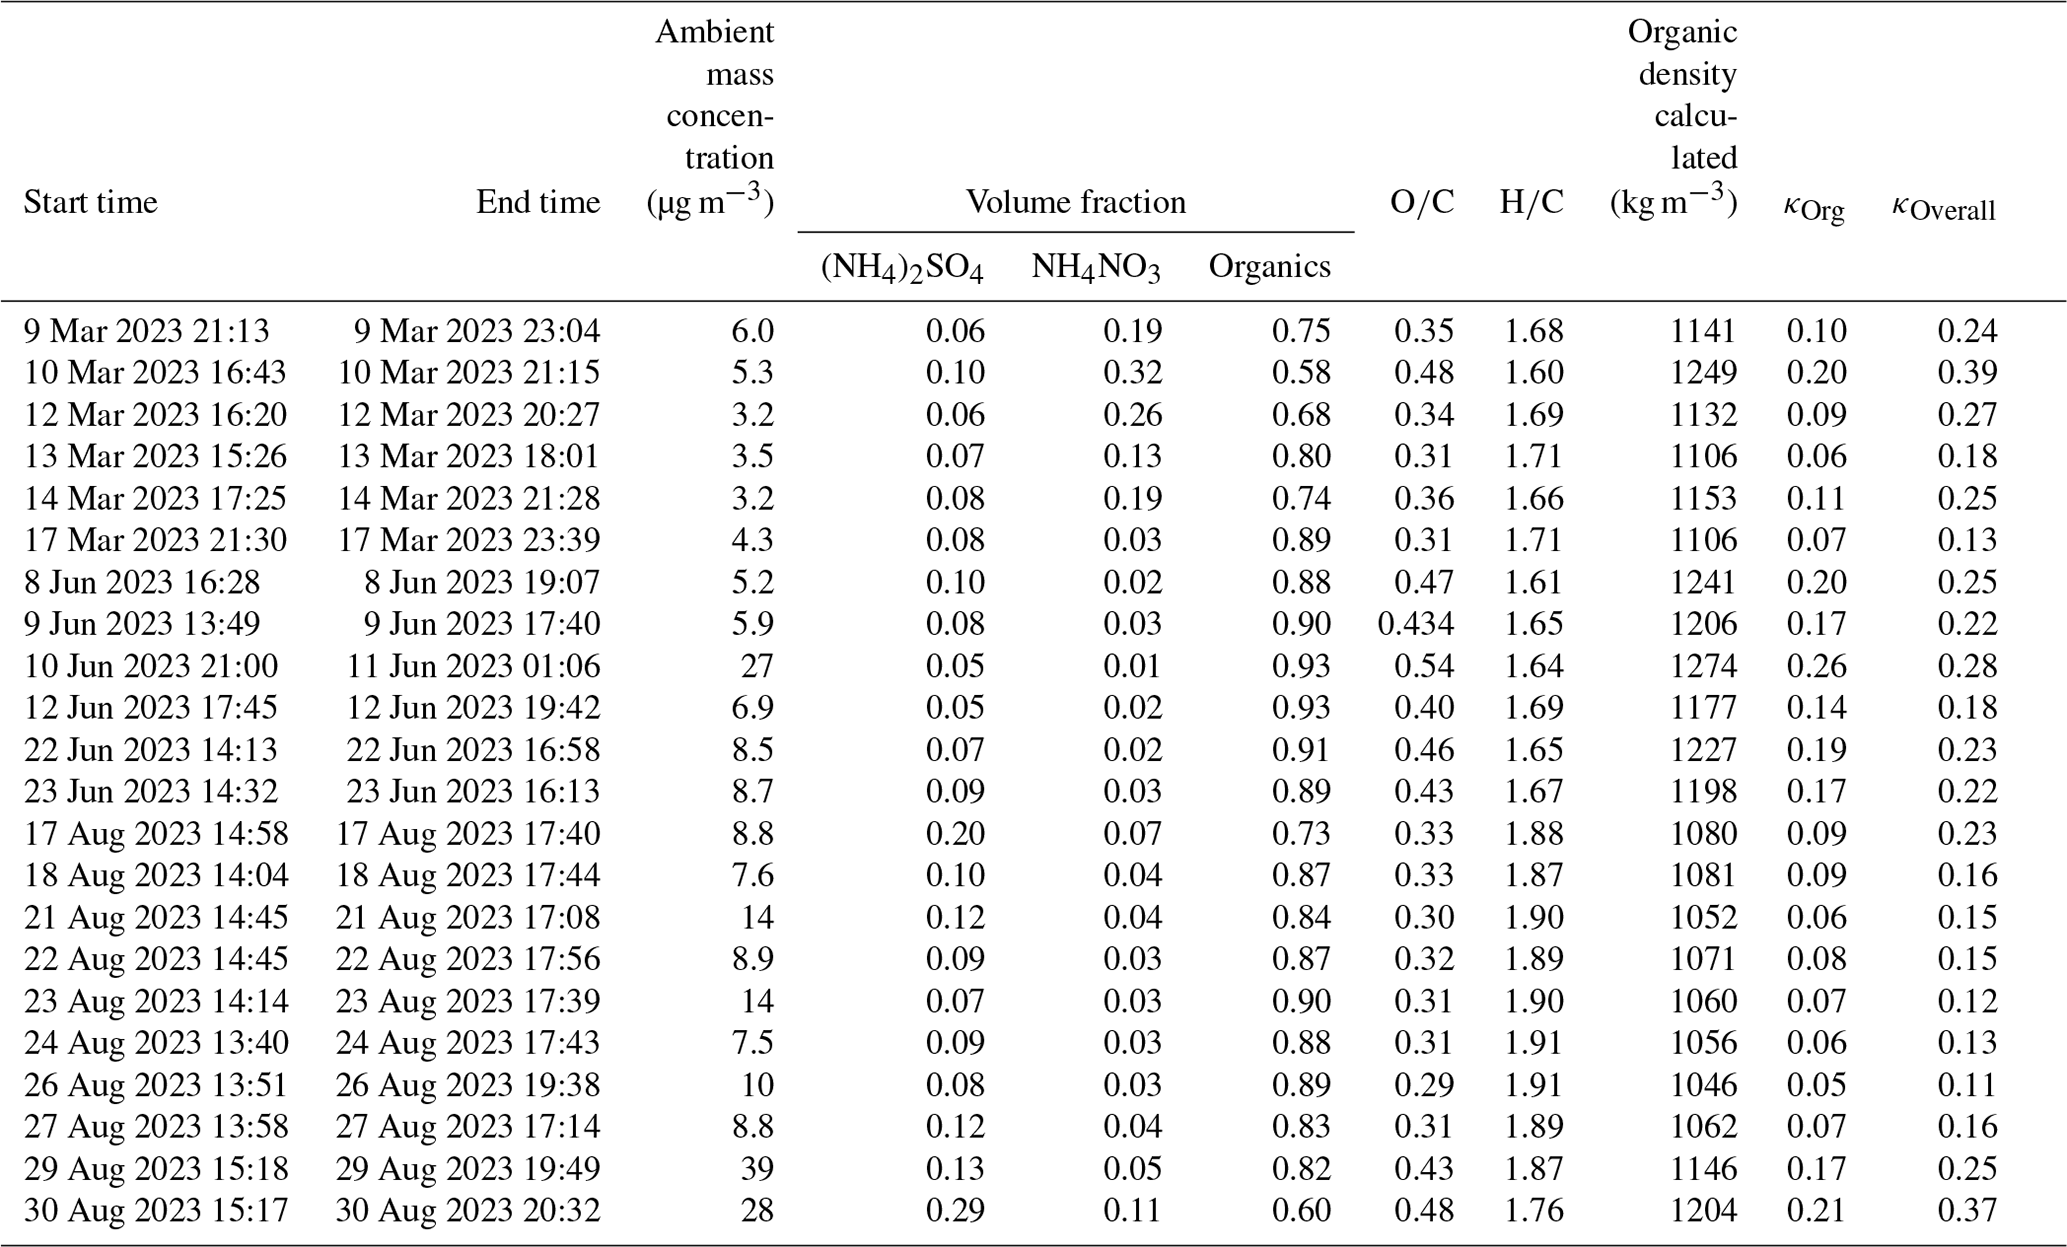
Based on the chemical analysis results from the MN-AMS, we summarized the chemical compositions observed during individual flights in Table 2. The data displayed a clear seasonal trend in the chemical composition of aerosols over the ARM SGP site. The total mass loading increased from March to August, consistent with the seasonal rise in aerosol total number concentrations. In March, the average total mass concentration of organic species and ammonium salts was 4.2 µg m−3, which doubled to 10.4 µg m−3 in June and further escalated to 14.7 µg m−3 in August. This seasonal pattern is consistent with trends observed in previous studies (Fast et al., 2022; Liu et al., 2021; Parworth et al., 2015). Interestingly, the organic volume fraction in the samples from March was lower (typically less than 80 %) than those from June. The June samples exhibited a higher oxygen-to-carbon (O:C) ratio, indicating that the organic aerosols were more oxidized during this period. This trend can be attributed to the increased atmospheric oxidative reactions associated with warmer weather. The presence of more organic aerosols in the atmosphere in June and August could also result from increased biological activity during the summer months. This seasonal variability in chemical composition explains the increased variability (O:C ratios and organic volumetric fractions) observed in the August samples.
Table 2Chemical composition of UAS filter samples measured by the MN-AMS analysis.
3.2 Case study with unique measurement capabilities
3.2.1 Advanced offline chemical analysis with EMSL capability
The integration of samples collected from the ArcticShark with advanced offline high-resolution mass spectrometry techniques is shown in Fig. 7 for the flight on 19 June 2023 (continuous collection from 600–2000 m above sea level). For this representative sample, analysis via the nano-DESI HRMS pipeline resulted in 767 individual molecular formula (MF) assignments, including a high proportion of organosulfates (99 MFs containing C, H, O, and S atoms) and organonitrates (230 MFs containing C, H, N, and O atoms; mass spectrum shown in Fig. 7a). The assigned MFs are then parameterized according to the strategy from Li et al. (2016), resulting in a volatility distribution (individual MFs are classified as volatile organic compound (VOC), intermediate-volatility organic compound (IVOC), semi-volatile organic compound (SVOC), low-volatility organic compound (LVOC), or extremely low volatility organic compound (ELVOC); Fig. 7b). For the same sample, Fig. 7c shows an exemplary top-view scanning electron microscopy (SEM) image, showing the dominance of organic particles and the potential for K2SO4 inclusion within the organic particles. Figure 7d depicts the size-resolved chemical composition, acquired via CCSEM/EDX, indicating the dominance of carbonaceous (CNO, 38.4 %) and carbonaceous sulfate (CNOS, 61.1 %) aerosol with a minor fraction of K2SO4 (0.4 %) containing aerosol. The particle classification scheme is illustrated in Fig. S4. More studies on the chemical characterization of the 2023 flight samples or size-resolved compositions are under preparation (Niedek et al., 2025; Mansoura et al., 2025).
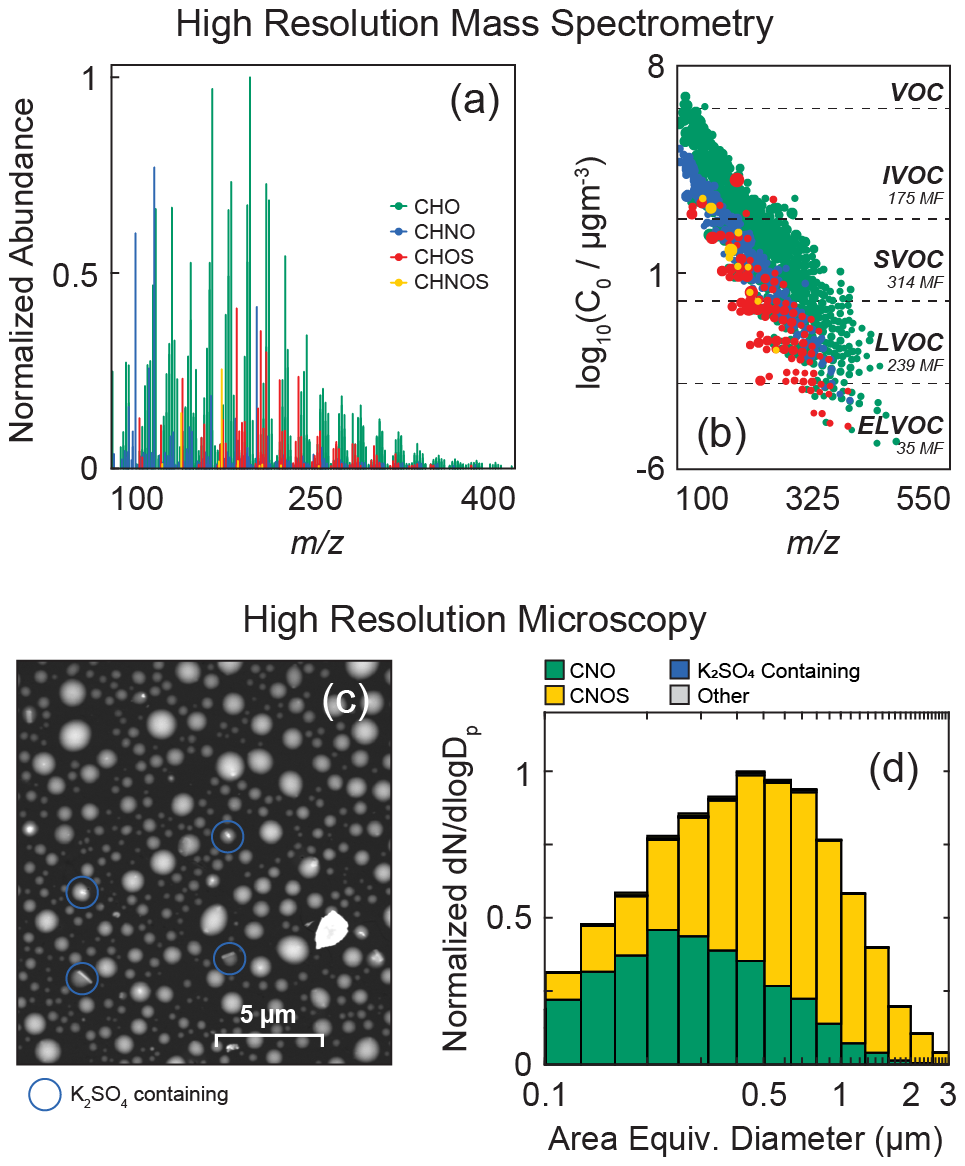
Figure 7Offline high-resolution analyses of the molecular composition of organic aerosols and size-resolved chemical composition for a representative sample from the 19 June 2023 flight (continuous sample collection over 600–2000 m m.s.l.). (a) Mass spectrum from direct nano-DESI HRMS analysis; (b) volatility distribution from parameterized mass spectrum data; (c) size-resolved chemical composition from CCSEM/EDX; and (d) top-view SEM image, highlighting instances of inorganic inclusion.
3.2.2 Vertical profile of aerosol optical properties
With an overview of the atmospheric parameters, the following sections explore two case studies that further illuminate our UAS capabilities – providing detailed vertical information on aerosol optical properties and aerosol's potential to form clouds (cloud condensation nuclei (CCN) concentrations), which enable a more accurate and comprehensive assessment of aerosol impacts on the Earth's radiation budget.
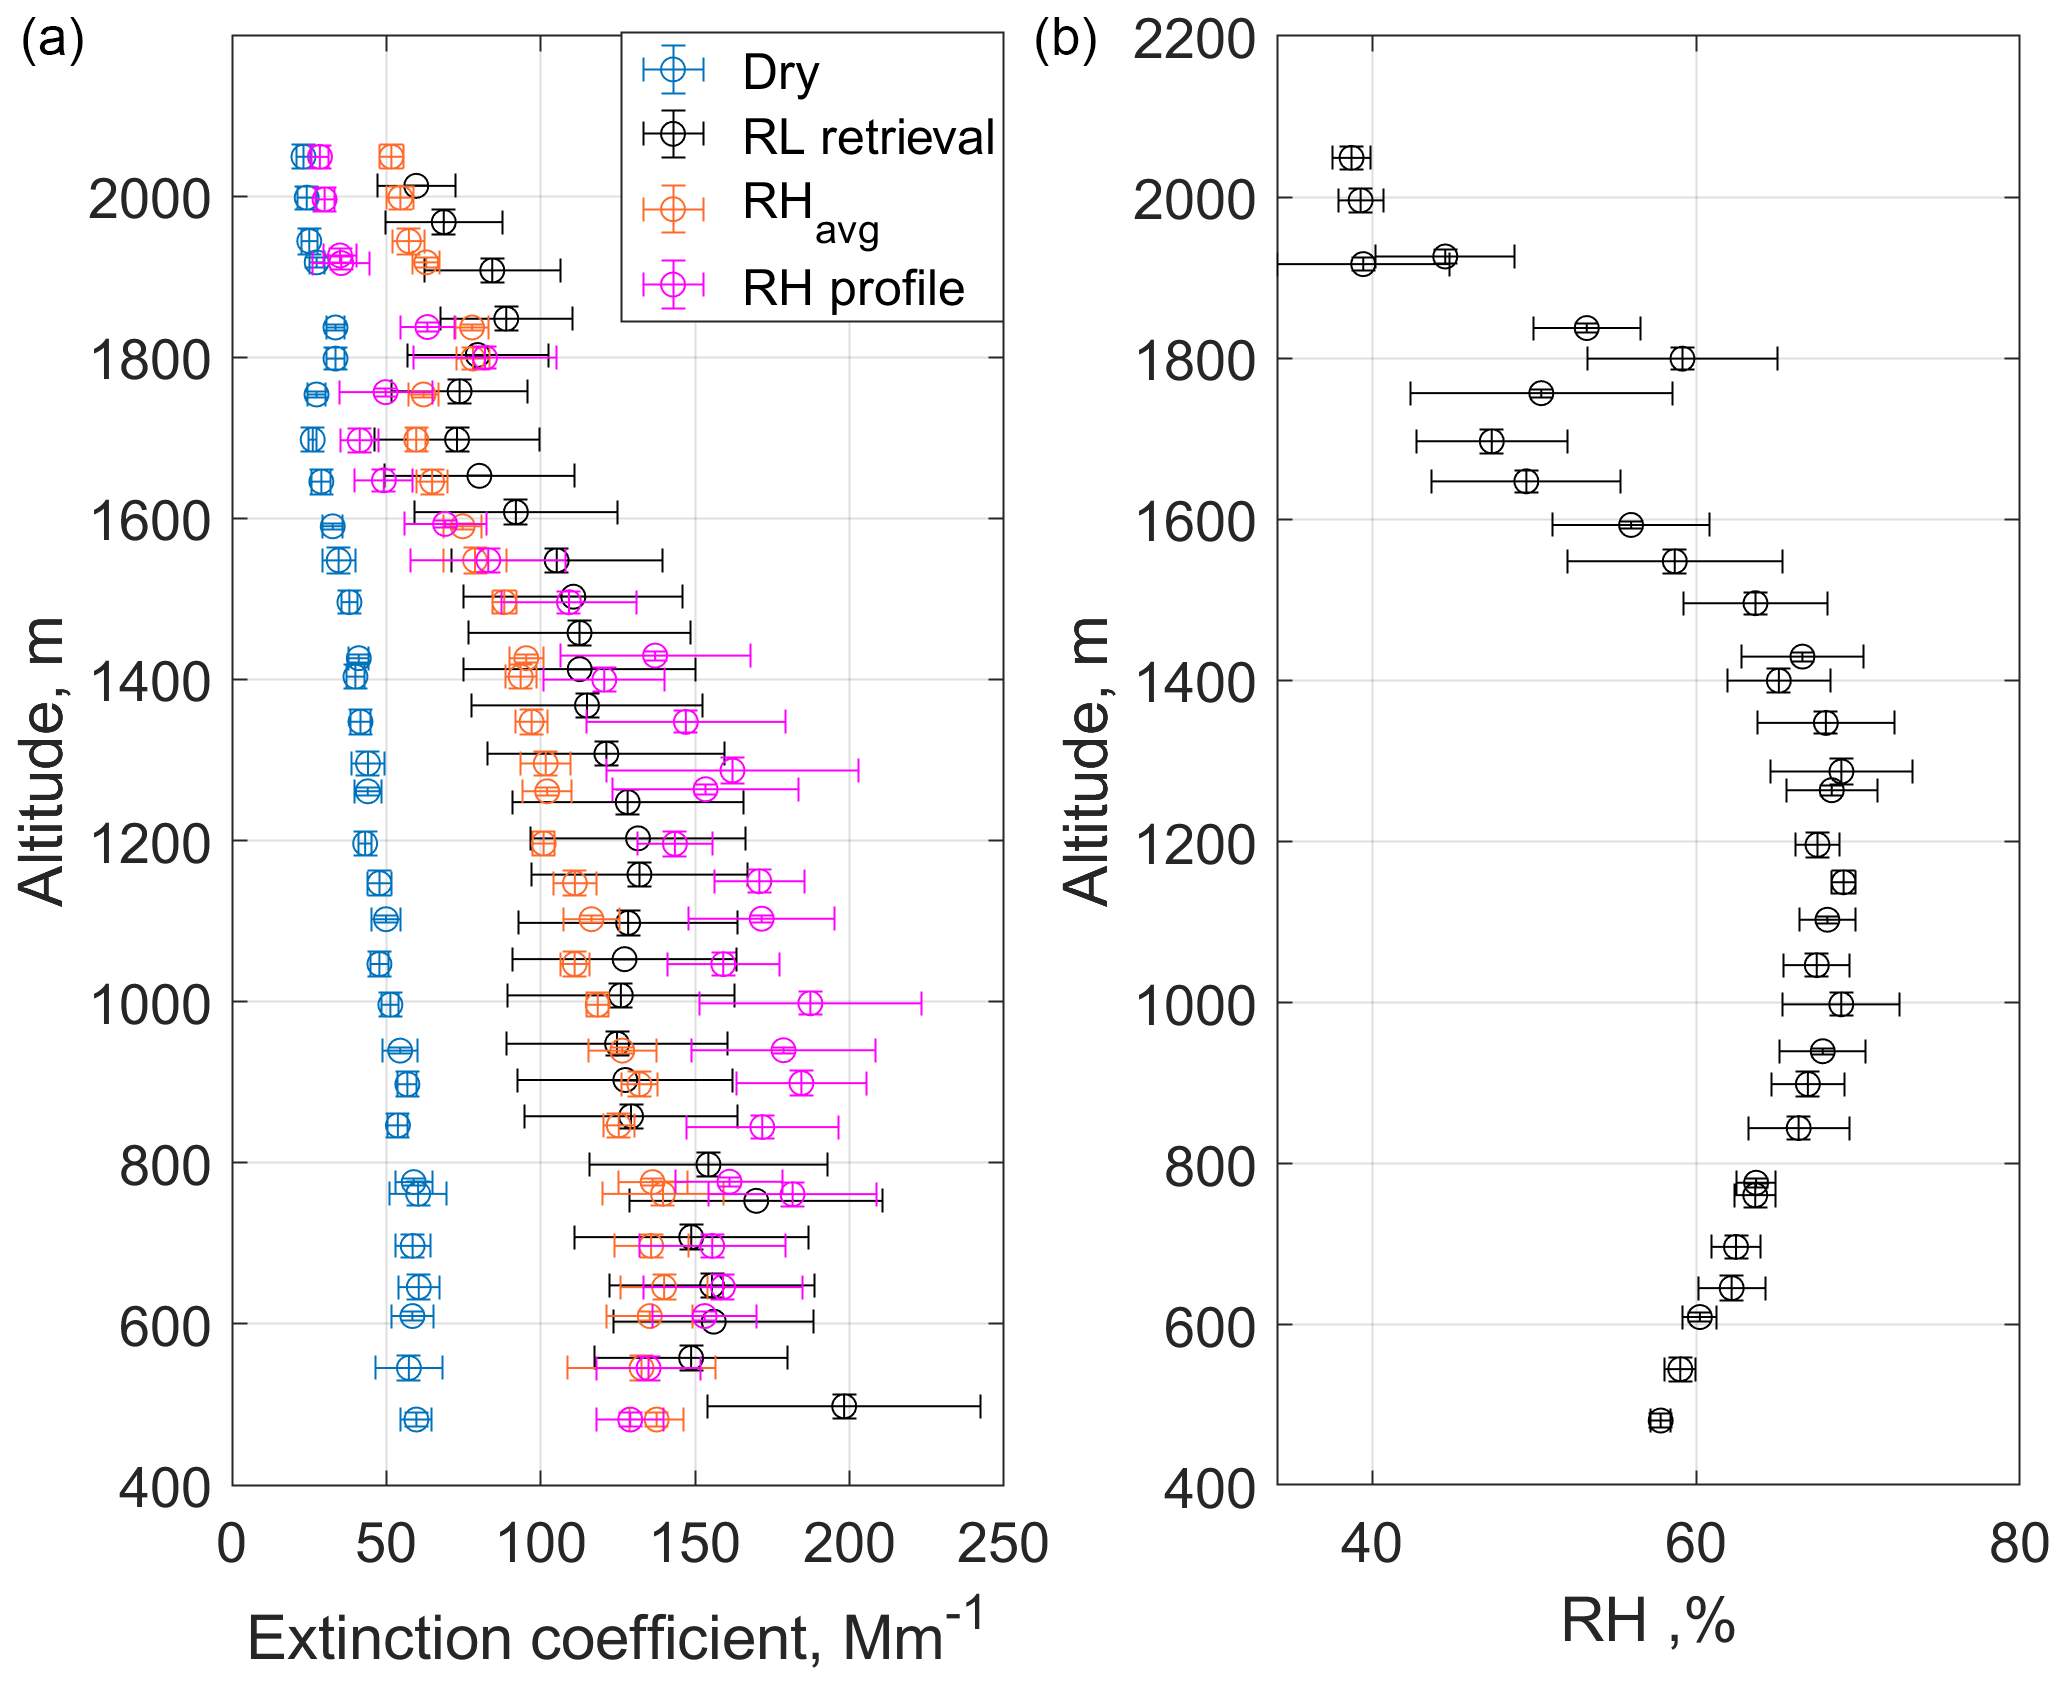
Figure 8Comparison of aerosol extinction coefficient with the Raman lidar (RL) retrievals on 22 August 2023. Note that the altitude is above the mean sea level. (a) Estimated aerosol extinction coefficients under three conditions: sampling under dry conditions, corrected with the averaged ambient RH condition, and corrected using the ambient RH profile condition shown in panel (b).
Aerosol optical properties depend on relative humidity, aerosol size distributions (usually measured at RHs lower than ambient RH), and the complex refractive index, which should be adjusted accordingly (Ghan and Schwartz, 2007; McComiskey and Ferrare, 2016). In this section, we discuss our approaches to estimating aerosol optical profiles under ambient conditions, which involve accounting for various factors (e.g., ambient temperature, pressure, and RH) that influence how aerosol interacts with light. The aerosol profiles of the extinction coefficients are shown in Fig. 8a. The ambient RH profile is shown in Fig. 8b. All the extinction coefficient values were derived under the ambient temperature and pressure, which allows us to focus on the ambient RH effect on this aerosol optical property. Changes in RH can significantly alter aerosol size, chemical composition, and refractive index. In this study, we assume that the RH effect on the refractive index and composition is negligible and only consider the effect on the size distribution.
During the airborne sampling, aerosol particles were dried to RH lower than 40 % in the inlet manifold. Using the size distribution directly from the portable optical particle spectrometer (POPS), we can derive the dry aerosol extinction coefficient, as shown in Fig. 8a (blue symbol). The result is consistent with the previous study under low RH (< 40 %) – the aerosol extinction decreased with altitude increase (Andrews et al., 2011, 2004). Then, two approaches were used to study the influence of the RH on the estimated aerosol optical profiles. The first one used the averaged RH value of the profile (based on Fig. 8b), and the growth factor (GF) was calculated as a function of this averaged RH (RHavg) value and hygroscopicity (Eq. 11 in Petters and Kreidenweis's paper, 2008, and κOverall from Table 2), which used the chemical analysis results from the MN-AMS. Then, we assumed that the same GF would weigh the whole size distribution and used the weighted size distribution to estimate the extinction under the ambient RH condition (light-brown symbol). The second approach used the f(RH) profile correction (RH profile with magenta symbol). This correction was performed by applying the f(RH) parameterization (Zieger et al., 2013) to the estimated aerosol extinction profile based on the POPS size distribution (Mei et al., 2024). The fitted gamma parameter (γ=1.53, as shown in Fig. S5) in this parameterization was obtained from the bulk dataset of all collocated extinction and RH profiles in time with the aircraft sampling periods during the June deployment. The black symbol depicts the retrieved values from Raman lidar (RLPROF-FEX) at 355 nm wavelength. The comparison showed a good agreement between the aerosol extinction profiles corrected for relative humidity (RH) and the extinction profiles retrieved from lidar in Fig. 8. This agreement emphasizes the significant impact of ambient RH on the aerosol extinction coefficients.
This study highlights several promising avenues for future research. Firstly, leveraging UAS to estimate aerosol optical profiles and validate lidar retrievals presents a valuable opportunity. UAS can provide high-resolution vertical profiles and targeted measurements in specific areas of interest, complementing the broader spatial coverage of lidar systems. Additionally, integrating high-resolution sensors for relative humidity (RH) and temperature on UAS platforms represents a significant advancement in vertical atmospheric profiling. Furthermore, combining UAS-borne measurements with lidar retrievals can greatly enhance aerosol research. While lidar systems offer continuous data, UAS provides detailed snapshots at various altitudes, contributing to improved temporal resolution. This synergistic approach not only refines the accuracy of aerosol optical profiles but also introduces a versatile and comprehensive methodology for atmospheric studies.
3.2.3 Vertical profile of CCN concentration (CCNc)
Understanding the vertical distribution of CCNc is essential for elucidating how aerosols influence cloud formation and properties throughout the atmospheric column. CCN is pivotal in the nucleation process, affecting both the formation and characteristics of cloud droplets. Specifically, higher CCN concentrations result in numerous smaller droplets, whereas lower concentrations lead to fewer larger droplets. These variations in droplet size significantly impact cloud albedo, cloud lifetime, and precipitation processes (Li et al., 2022; Seinfeld et al., 2016; Rosenfeld et al., 2014). Detailed CCNc profiles, particularly at the cloud base where air is predominantly entrained into the cloud, are crucial for accurately assessing aerosol–cloud interactions (ACIs) (Bellouin et al., 2020). We can evaluate and refine model predictions by examining these profiles, especially at the cloud base. Discrepancies between observed and predicted CCN concentrations can reveal areas where models may need adjustments and lead to ultimately improving the accuracy of CCN predictions and their integration into climate models.
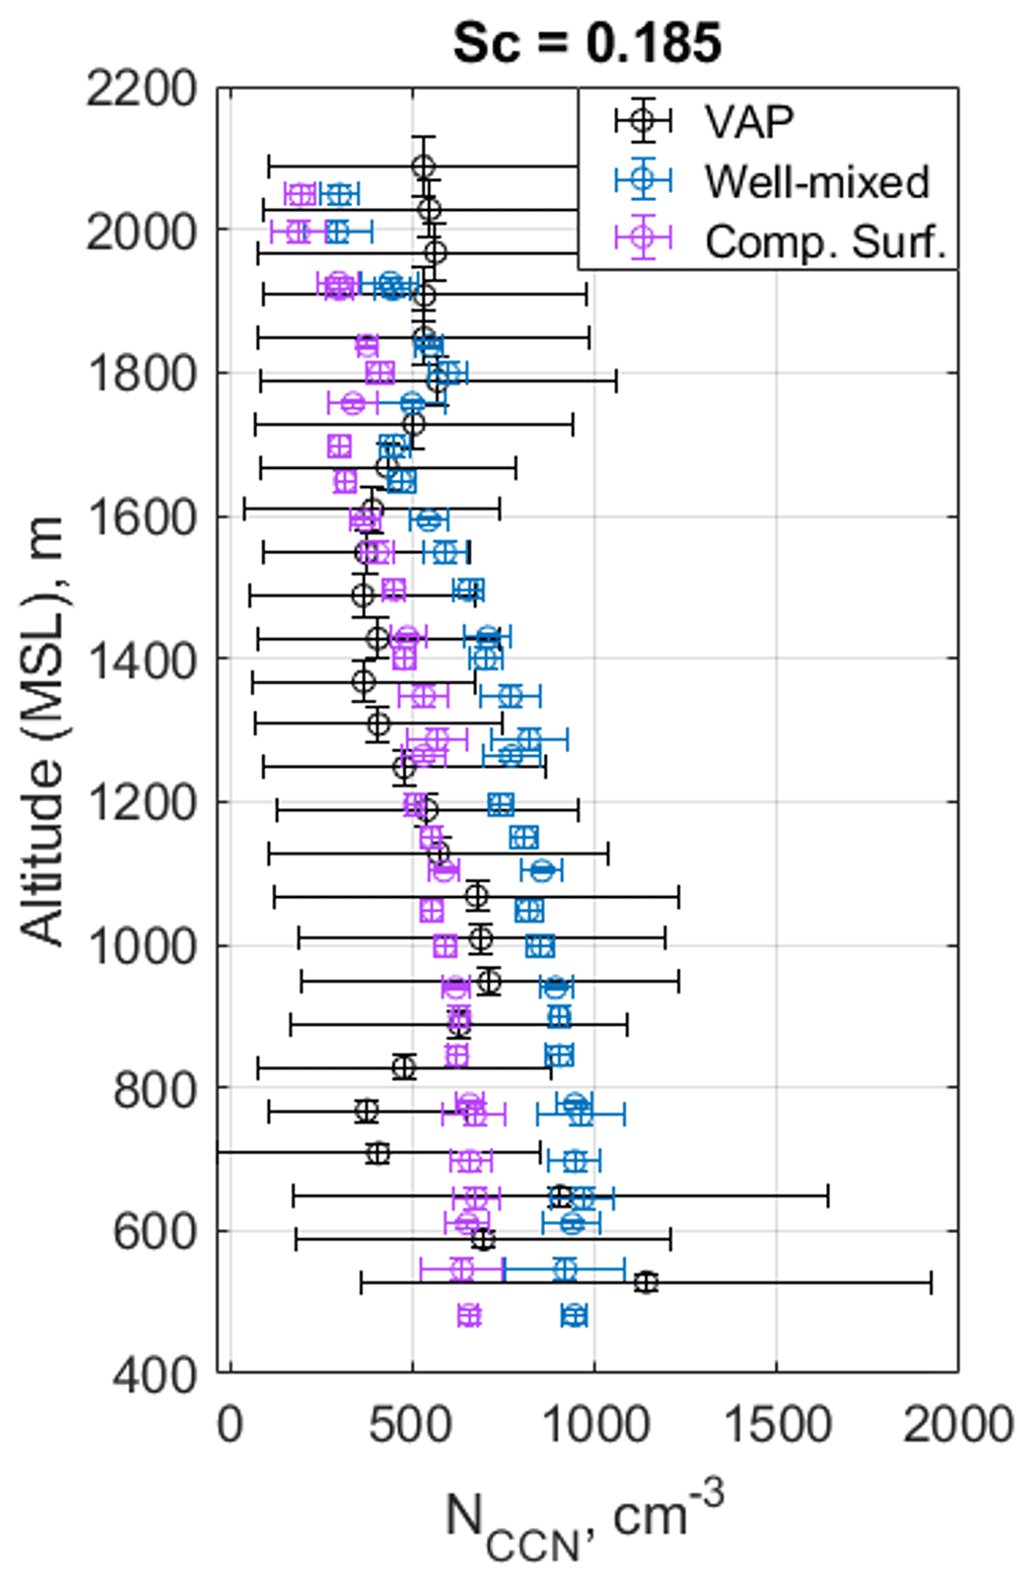
Figure 9Cloud condensation nuclei (CCN) concentration (NCCN) comparison with the CCNc profile from the RNCCN VAP on 22 August 2023. The estimated CCN concentrations at a critical supersaturation (Sc) of 0.185 were under two conditions: (1) chemical species in the CCN population were well mixed (“Well-mixed”) and (2) the surface activity can be explained by a compressed-film model (“Comp. Surf.”).
This study estimated the CCNc profile based on the in situ aerosol size distribution data from a portable optical particle spectrometer (POPS) and the chemical composition derived from offline MN-AMS analysis. As shown in Fig. 9, two approaches were used to derive the CCNc profiles. The first approach assumed that the aerosol particles were well mixed. This assumption is based on the premise that the aerosol particles are homogeneously distributed within the air mass, and their chemical and physical properties are uniform throughout the measured size range. This approach allows for estimating the CCNc profile using the κ-Kohler theory (Mei et al., 2013; Petters and Kreidenweis, 2007; Thalman et al., 2017; Kulkarni et al., 2023a). The second approach assumes the formation of a compressed film in the growing droplet, leading to surface tension depression by interfacial organic molecules (Lowe et al., 2019; Ruehl et al., 2016). The second approach considers the potential influence of organic compounds on CCN activity. Organic molecules in the aerosol particles can migrate to the particle–water interface, forming a compressed film that can significantly reduce the droplet's surface tension, thereby enhancing the droplet size observed at activation. The well-mixed assumption led to 30 %–50 % more CCN concentration prediction than the compressed surface assumptions. While overlaying the ARM RNCCN VAP data with two profiles, we noticed that both are within the uncertainty range of the CCNc profiles derived by the ARM RNCCN VAP.
Current estimates of CCNc profiles are constrained by the size range of the POPS, which only measures particles larger than 135 nm in diameter. This limitation restricts the ability to estimate the CCN concentrations at the higher supersaturation range (often limited to less than 0.2 % for most flight conditions). This narrow supersaturation range can lead to inaccuracies in estimating CCN concentrations, particularly for smaller particles that may play a significant role in cloud nucleation. To address this limitation and provide more accurate CCN profile estimations, AAF has incorporated a miniaturized scanning electrical mobility spectrometer (mSEMS) to extend the measurement range to include smaller aerosol particles (approximately 10 nm). The mSEMS, POPS, and a custom-built water CPC (with particle collection capability for chemical composition analysis) form an additional payload package designed to study aerosol size distribution and its applications in atmospheric research. Note that the accuracy of estimated CCN profiles is often uncertain due to the reliance on indirect measurements and assumptions. To quantify this uncertainty and assess the limitations of current estimation methods, it is also desirable to compare estimated CCN profiles with direct in situ CCN measurements with a piloted aircraft campaign. A comparison study can thoroughly evaluate the estimation accuracy, identify discrepancies between estimated and observed CCN concentrations and highlight potential sources of error in the estimation methods.
This study summarizes measurements obtained during the ArcticShark deployments to the ARM SGP observatory in March, June, and August 2023. We provided an overview of the typical atmospheric conditions observed across these seasons, including temperature, relative humidity, aerosol particle concentrations, and chemical compositions. The data reveal significant seasonal variations: temperature and total mass loading increased from March to August, with a notable rise in oxidized and hygroscopic organic aerosols observed in June. Notably, there was strong agreement between temperature and humidity recorded by radiosonde sensors and ArcticShark sensors. This indicated the high correlations among various sensors for critical meteorological parameters, including temperature, humidity, wind speed, and wind direction.
Based on the ground remote sensing retrieval, cloud masks, flight altitudes, and planetary boundary layer (PBL) heights overlaid with the UAS measurements from each month's flight illustrated that clouds in March were considerably lower in altitude than those in June and August, with distinct cloud types observed in each period. In contrast, higher turbulence was observed within the PBL, as indicated by increased turbulent kinetic energy (TKE) values in June.
Understanding these trajectory differences based on ARMTRAJ-AAF helps interpret the aerosol, cloud, and meteorological measurements recorded by ARM facilities. Recognizing the air mass origins provides insight into potential sources of aerosols or precipitation patterns, impacting cloud formation mechanisms and radiative properties.
We analyzed several cases to further demonstrate the ArcticShark's measurement capabilities. On 19 June 2023, advanced offline analyses of field-collected particles using high-resolution microscopy and mass spectrometry provided detailed insights into particle size, morphology, and composition. Based on the 22 August 2023 data, we compared aerosol extinction coefficient profiles obtained from lidar with those estimated from airborne measurements, as shown in Fig. 8. The optical comparison indicated good agreement between the lidar-retrieved extinction profiles and those corrected for relative humidity. Similarly, Fig. 9 demonstrates that CCNc profiles derived from airborne measurements closely matched the ARM RNCCN VAP data, highlighting the potential of using airborne data to validate the remote sensing retrieval techniques through further in-depth studies.
In summary, the ArcticShark has proven capable of collecting vertically resolved data under various atmospheric conditions at the ARM SGP site. Integrating UAS data with ground-based observations has provided critical datasets to study atmospheric parameters, aerosol concentrations, chemical composition, and turbulence within the boundary layers. Future work will focus on leveraging both ground-based and airborne measurements, as well as remote sensing techniques, to advance atmospheric research.
Data described in this paper can be accessed under each data DOI listed in Table 1; for example, the high-frequency navigation data aafnavaims100hz can be accessed at https://doi.org/10.5439/2204048 (Mei and Ermold, 2023c). Data collected from the various observation platforms in the SGP region are made freely accessible to the scientific community through public repositories (https://adc.arm.gov/discovery/#/results, ARM Data Discovery, 2025), facilitating a wide range of research endeavors.
The supplement related to this article is available online at https://doi.org/10.5194/acp-25-3425-2025-supplement.
FM led the formulation of this paper. FM, GK, and GWV provided the figures. QZ, FM, MSP, JMT, FM, MSP, CRN, SG, BS, and HSM participated in the field study and collected the data. XM ZC, GWV, NNL, WC, and ZZ analyzed the chemical samples. FM wrote the draft and all coauthors provided editing suggestions for the manuscript.
The contact author has declared that none of the authors has any competing interests.
Publisher’s note: Copernicus Publications remains neutral with regard to jurisdictional claims made in the text, published maps, institutional affiliations, or any other geographical representation in this paper. While Copernicus Publications makes every effort to include appropriate place names, the final responsibility lies with the authors.
This research was supported by the ARM user facility, a US DOE Office of Science user facility managed by the Biological and Environmental Research (BER) program. A portion of this research was performed on project awards (https://doi.org/10.46936/lser.proj.2020.51377/60000185 and https://doi.org/10.46936/expl.proj.2021.60186/60008210) under the user projects at the Environmental Molecular Sciences Laboratory (EMSL). Battelle operates the Pacific Northwest National Laboratory (PNNL) for the DOE under contract DE-AC05-76RL01830 to support both EMSL and ARM user facilities. Jerome D. Fast acknowledges support from the Atmospheric System Research (ASR) program under the Integrated Cloud, Land-surface, and Aerosol System Study (ICLASS) Science Focus Area. Qi Zhang and Christopher R. Niedek also acknowledge DOE funding from DE-SC0022140. Christopher R. Niedek also acknowledges the DOE Office of Science Graduate Student Research (SCGSR) award to support his research and collaboration between UC Davis and PNNL. We acknowledge the use of OpenAI's ChatGPT to assist in refining the language used in this document.
This research has been supported by the Biological and Environmental Research program (grant nos. DE-AC05-76RL01830 and DE-SC0022140).
This paper was edited by Markus Petters and reviewed by two anonymous referees.
Andrews, E., Sheridan, P. J., Ogren, J. A., and Ferrare, R.: In situ aerosol profiles over the Southern Great Plains cloud and radiation test bed site: 1. Aerosol optical properties, J. Geophys. Res.-Atmos., 109, D06208, https://doi.org/10.1029/2003JD004025, 2004.
Andrews, E., Sheridan, P. J., and Ogren, J. A.: Seasonal differences in the vertical profiles of aerosol optical properties over rural Oklahoma, Atmos. Chem. Phys., 11, 10661–10676, https://doi.org/10.5194/acp-11-10661-2011, 2011.
ARM Data Discovery: ARM Data Discovery website, ARM Data Center, https://adc.arm.gov/discovery/#/results (last access: 5 September 2024), 1980–present, 2025.
Balsamo, G., Agusti-Panareda, A., Albergel, C., Arduini, G., Beljaars, A., Bidlot, J., Blyth, E., Bousserez, N., Boussetta, S., Brown, A., Buizza, R., Buontempo, C., Chevallier, F., Choulga, M., Cloke, H., Cronin, M. F., Dahoui, M., De Rosnay, P., Dirmeyer, P. A., Drusch, M., Dutra, E., Ek, M. B., Gentine, P., Hewitt, H., Keeley, S. P. E., Kerr, Y., Kumar, S., Lupu, C., Mahfouf, J.-F., McNorton, J., Mecklenburg, S., Mogensen, K., Muñoz-Sabater, J., Orth, R., Rabier, F., Reichle, R., Ruston, B., Pappenberger, F., Sandu, I., Seneviratne, S. I., Tietsche, S., Trigo, I. F., Uijlenhoet, R., Wedi, N., Woolway, R. I., and Zeng, X.: Satellite and In Situ Observations for Advancing Global Earth Surface Modelling: A Review, Remote Sens.-Basel, 10, 2038, https://doi.org/10.3390/rs10122038, 2018.
Bellouin, N., Quaas, J., Gryspeerdt, E., Kinne, S., Stier, P., Watson-Parris, D., Boucher, O., Carslaw, K. S., Christensen, M., Daniau, A.-L., Dufresne, J.-L., Feingold, G., Fiedler, S., Forster, P., Gettelman, A., Haywood, J. M., Lohmann, U., Malavelle, F., Mauritsen, T., McCoy, D. T., Myhre, G., Mülmenstädt, J., Neubauer, D., Possner, A., Rugenstein, M., Sato, Y., Schulz, M., Schwartz, S. E., Sourdeval, O., Storelvmo, T., Toll, V., Winker, D., and Stevens, B.: Bounding Global Aerosol Radiative Forcing of Climate Change, Rev. Geophys., 58, e2019RG000660, https://doi.org/10.1029/2019RG000660, 2020.
Berg, L. K., Riihimaki, L. D., Qian, Y., Yan, H., and Huang, M.: The Low-Level Jet over the Southern Great Plains Determined from Observations and Reanalyses and Its Impact on Moisture Transport, J. Climate, 28, 6682–6706, https://doi.org/10.1175/JCLI-D-14-00719.1, 2015.
Biraud, S. C., Torn, M. S., Smith, J. R., Sweeney, C., Riley, W. J., and Tans, P. P.: A multi-year record of airborne CO2 observations in the US Southern Great Plains, Atmos. Meas. Tech., 6, 751–763, https://doi.org/10.5194/amt-6-751-2013, 2013.
Burk, K., Mei, F., and Stephenson, J.: ARM Aerial Facility (AAF) – Unmanned Aircraft Systems, Filter Aerosol Sampler (AAFFILTSAMP), Atmospheric Radiation Measurement (ARM) User Facility [data set], https://doi.org/10.5439/1821176, 2023a.
Burk, K., Mei, F., Stephenson, J., and Pekour, M.: Condensation particle counter aboard aircraft (AAFMCPC), Atmospheric Radiation Measurement (ARM) User Facility [data set], https://doi.org/10.5439/1820906, 2023b.
Burk, K., Mei, F., Tomlinson, J., and Mehta, H.: Trace gas concentrations – airborne (AAFH2O), Atmospheric Radiation Measurement (ARM) User Facility [data set], https://doi.org/10.5439/1821160, 2023c.
Burk, K., Mei, F., Tomlinson, J., and Mehta, H.: Meteorological Instrumentation aboard Aircraft (AAFTRH), Atmospheric Radiation Measurement (ARM) User Facility [data set], https://doi.org/10.5439/1820905, 2023d.
Burk, K., Mei, F., Tomlinson, J., and Morris, V.: Infrared Thermometer – Airborne (AAFIRT), Atmospheric Radiation Measurement (ARM) User Facility [data set], https://doi.org/10.5439/1821129, 2023e.
Chand, D., Newsom, R., Thorsen, T., Cromwell, E., Sivaraman, C., Flynn, C., Shilling, J., and Comstock, J.: Aerosol and Cloud Optical Properties from the ARM Raman Lidars: The Feature Detection and Extinction (RLPROF-FEX) Value-Added Product, ARM user facility, Pacific Northwest National Laboratory, Richland, WA, United States, Medium: ED; Size: 34 p., https://arm.gov/data/science-data-products/vaps/rlprof-fex (last access: 14 March 2025), 2022.
Cheng, Z., Liyu, A., Dexheimer, D., Lata, N. N., Kulkarni, G., Longbottom, C. M., Mei, F., and China, S.: An automated size and time-resolved aerosol collector platform integrated with environmental sensors to study the vertical profile of aerosols, Environ. Sci. Atmospheres, 2, 1263–1276, 2022.
Cheng, Z., Morgenstern, M., Henning, S., Zhang, B., Roberts, G. C., Fraund, M., Marcus, M. A., Lata, N. N., Fialho, P., Mazzoleni, L., Wehner, B., Mazzoleni, C., and China, S.: Cloud condensation nuclei activity of internally mixed particle populations at a remote marine free troposphere site in the North Atlantic Ocean, Sci. Total Environ., 904, 166865, https://doi.org/10.1016/j.scitotenv.2023.166865, 2023.
Creamean, J. M., de Boer, G., Telg, H., Mei, F., Dexheimer, D., Shupe, M. D., Solomon, A., and McComiskey, A.: Assessing the vertical structure of Arctic aerosols using balloon-borne measurements, Atmos. Chem. Phys., 21, 1737–1757, https://doi.org/10.5194/acp-21-1737-2021, 2021.
Cristina, M., Mei, F., Ermold, B., and Mehta, H.: Navigational Location, Motion, and Attitude for Airborne Platforms (AAFNAVAIMS), Atmospheric Radiation Measurement (ARM) User Facility [data set], https://doi.org/10.5439/1238157, 2023.
Cromwell, E., Flynn, D., and Zhang, D.: Micropulse Lidar Cloud Mask Machine Learning VAP (MPLCMASKML), Atmospheric Radiation Measurement (ARM) User Facility [data set], https://doi.org/10.5439/1637940, 2023a.
Cromwell, E., Newsom, R., Zhang, D., and Chand, D.: Raman Lidar Vertical Profiles Feature Detection and Extinction (RLPROFFEX1THOR), Atmospheric Radiation Measurement (ARM) User Facility [data set], https://doi.org/10.5439/1373934, 2023b.
Delle Monache, L., Perry, K. D., Cederwall, R. T., and Ogren, J. A.: In situ aerosol profiles over the Southern Great Plains cloud and radiation test bed site: 2. Effects of mixing height on aerosol properties, J. Geophys. Res.-Atmos., 109, D06209, https://doi.org/10.1029/2003JD004025, 2004.
Dexheimer, D., Airey, M., Roesler, E., Longbottom, C., Nicoll, K., Kneifel, S., Mei, F., Harrison, R. G., Marlton, G., and Williams, P. D.: Evaluation of ARM tethered-balloon system instrumentation for supercooled liquid water and distributed temperature sensing in mixed-phase Arctic clouds, Atmos. Meas. Tech., 12, 6845–6864, https://doi.org/10.5194/amt-12-6845-2019, 2019.
Dupont, J.-C., Haeffelin, M., Morille, Y., Comstock, J. M., Flynn, C., Long, C. N., Sivaraman, C., and Newson, R. K.: Cloud properties derived from two lidars over the ARM SGP site, Geophys. Res. Lett., 38, L08814, https://doi.org/10.1029/2010GL046274, 2011.
Endo, S., Fridlind, A. M., Lin, W., Vogelmann, A. M., Toto, T., Ackerman, A. S., McFarquhar, G. M., Jackson, R. C., Jonsson, H. H., and Liu, Y.: RACORO continental boundary layer cloud investigations: 2. Large-eddy simulations of cumulus clouds and evaluation with in situ and ground-based observations, J. Geophys. Res.-Atmos., 120, 5993–6014, https://doi.org/10.1002/2014JD022525, 2015.
Fast, J. D., Berg, L. K., Alexander, L., Bell, D., D'Ambro, E., Hubbe, J., Kuang, C., Liu, J., Long, C., Matthews, A., Mei, F., Newsom, R., Pekour, M., Pinterich, T., Schmid, B., Schobesberger, S., Shilling, J., Smith, J. N., Springston, S., Suski, K., Thornton, J. A., Tomlinson, J., Wang, J., Xiao, H., and Zelenyuk, A.: Overview of the HI-SCALE Field Campaign: A New Perspective on Shallow Convective Clouds, B. Am. Meteorol. Soc., 100, 821–840, https://doi.org/10.1175/BAMS-D-18-0030.1, 2019.
Fast, J. D., Bell, D. M., Kulkarni, G., Liu, J., Mei, F., Saliba, G., Shilling, J. E., Suski, K., Tomlinson, J., Wang, J., Zaveri, R., and Zelenyuk, A.: Using aircraft measurements to characterize subgrid-scale variability of aerosol properties near the Atmospheric Radiation Measurement Southern Great Plains site, Atmos. Chem. Phys., 22, 11217–11238, https://doi.org/10.5194/acp-22-11217-2022, 2022.
Feingold, G., Furrer, R., Pilewskie, P., Remer, L. A., Min, Q., and Jonsson, H.: Aerosol indirect effect studies at Southern Great Plains during the May 2003 Intensive Operations Period, J. Geophys. Res.-Atmos., 111, D05S14, https://doi.org/10.1029/2004JD005648, 2006.
Flynn, D., Shi, Y., Lim, K.-S., and Riihimaki, L.: Cloud Type Classification (cldtype) Value-Added Product, ARM Climate Research Facility, Pacific Northwest National Laboratory, Richland, WA, United States, Medium: ED; Size: 16 p., https://arm.gov/data/science-data-products/vaps/cldtype (last access: 14 March 2025), 2017.
Flynn, D., Cromwell, E., and Zhang, D.: Micropulse Lidar Cloud Mask Machine-Learning Value-Added Product Report, United States, Medium: ED; Size: 17 p., https://arm.gov/data/science-data-products/vaps/mplcmaskml (last access: 14 March 2025), 2023.
Gartzke, J., Knuteson, R., Przybyl, G., Ackerman, S., and Revercomb, H.: Comparison of Satellite-, Model-, and Radiosonde-Derived Convective Available Potential Energy in the Southern Great Plains Region, J. Appl. Meteorol. Climatol., 56, 1499–1513, https://doi.org/10.1175/JAMC-D-16-0267.1, 2017.
Geerts, B., Raymond, D. J., Grubišić, V., Davis, C. A., Barth, M. C., Detwiler, A., Klein, P. M., Lee, W.-C., Markowski, P. M., Mullendore, G. L., and Moore, J. A.: Recommendations for In Situ and Remote Sensing Capabilities in Atmospheric Convection and Turbulence, B. Am. Meteorol. Soc., 99, 2463–2470, https://doi.org/10.1175/BAMS-D-17-0310.1, 2018.
Ghan, S. J. and Collins, D. R.: Use of In Situ Data to Test a Raman Lidar–Based Cloud Condensation Nuclei Remote Sensing Method, J. Atmos. Ocean. Technol., 21, 387–394, https://doi.org/10.1175/1520-0426(2004)021<0387:UOISDT>2.0.CO;2, 2004.
Ghan, S. J. and Schwartz, S. E.: Aerosol Properties and Processes: A Path from Field and Laboratory Measurements to Global Climate Models, B. Am. Meteorol. Soc., 88, 1059–1084, https://doi.org/10.1175/BAMS-88-7-1059, 2007.
Ghan, S. J., Rissman, T. A., Elleman, R., Ferrare, R. A., Turner, D., Flynn, C., Wang, J., Ogren, J., Hudson, J., Jonsson, H. H., VanReken, T., Flagan, R. C., and Seinfeld, J. H.: Use of in situ cloud condensation nuclei, extinction, and aerosol size distribution measurements to test a method for retrieving cloud condensation nuclei profiles from surface measurements, J. Geophys. Res.-Atmos., 111, D05510, https://doi.org/10.1029/2004JD005752, 2006.
Gibler, G., Mei, F., and Stephenson, J.: Tricolor Absorption Photometer aboard aircraft (AAFSTAP), Atmospheric Radiation Measurement (ARM) User Facility [data set], https://doi.org/10.5439/1838697, 2023a.
Gibler, G., Mei, F., and Stephenson, J.: Optical Particle Counter aboard aircraft (AAFMOPC), Atmospheric Radiation Measurement (ARM) User Facility [data set], https://doi.org/10.5439/1838698, 2023b.
Holdridge, D.: Balloon-borne sounding system (sonde) instrument handbook, DOE Office of Science Atmospheric Radiation Measurement (ARM) Program, 38 pp., https://arm.gov/capabilities/instruments/sonde (14 March 2025), 2020.
Jensen, M. P., Holdridge, D. J., Survo, P., Lehtinen, R., Baxter, S., Toto, T., and Johnson, K. L.: Comparison of Vaisala radiosondes RS41 and RS92 at the ARM Southern Great Plains site, Atmos. Meas. Tech., 9, 3115–3129, https://doi.org/10.5194/amt-9-3115-2016, 2016.
Kelley, M. C. and Ardon-Dryer, K.: Analyzing two decades of dust events on the Southern Great Plains region of West Texas, Atmos. Poll. Res., 12, 101091, https://doi.org/10.1016/j.apr.2021.101091, 2021.
Kennedy, A. D., Dong, X., and Xi, B.: Cloud fraction at the ARM SGP site, Theor. Appl. Climatol., 115, 91–105, https://doi.org/10.1007/s00704-013-0853-9, 2014.
Knobelspiesse, K. D., Cairns, B., Schmid, B., Román, M. O., and Schaaf, C. B.: Surface BRDF estimation from an aircraft compared to MODIS and ground estimates at the Southern Great Plains site, J. Geophys. Res.-Atmos., 113, D20105, https://doi.org/10.1029/2008JD010062, 2008.
Koontz, A., Mei, F., Tomlinson, J., and Mehta, H.: Meteorological Instrumentation aboard Aircraft (AAFMETAIMS), Atmospheric Radiation Measurement (ARM) User Facility [data set], https://doi.org/10.5439/1349241, 2023.
Kulkarni, G., Mei, F., Shilling, J. E., Wang, J., Reveggino, R. P., Flynn, C., Zelenyuk, A., and Fast, J.: Cloud Condensation Nuclei Closure Study Using Airborne Measurements Over the Southern Great Plains, J. Geophys. Res.-Atmos., 128, e2022JD037964, https://doi.org/10.1029/2022JD037964, 2023a.
Kulkarni, G., Sivaraman, C., and Shilling, J. E.: Retrieved Number Concentration of Cloud Condensation Nuclei (RNCCN) Profile Value-Added Product Report, ARM user facility, https://arm.gov/data/science-data-products/vaps/rnccn (last access: 14 March 2025), 2023b.
Lata, N. N., Cheng, Z., Dexheimer, D., Zhang, D., Mei, F., and China, S.: Vertical Gradient of Size-Resolved Aerosol Compositions over the Arctic Reveals Cloud Processed Aerosol in-Cloud and above Cloud, Environ. Sci. Technol., 57, 5821–5830, https://doi.org/10.1021/acs.est.2c09498, 2023.
Li, J., Carlson, B. E., Yung, Y. L., Lv, D., Hansen, J., Penner, J. E., Liao, H., Ramaswamy, V., Kahn, R. A., Zhang, P., Dubovik, O., Ding, A., Lacis, A. A., Zhang, L., and Dong, Y.: Scattering and absorbing aerosols in the climate system, Nat. Rev. Earth Environm., 3, 363–379, https://doi.org/10.1038/s43017-022-00296-7, 2022.
Li, Y., Pöschl, U., and Shiraiwa, M.: Molecular corridors and parameterizations of volatility in the chemical evolution of organic aerosols, Atmos. Chem. Phys., 16, 3327–3344, https://doi.org/10.5194/acp-16-3327-2016, 2016.
Liu, J., Alexander, L., Fast, J. D., Lindenmaier, R., and Shilling, J. E.: Aerosol characteristics at the Southern Great Plains site during the HI-SCALE campaign, Atmos. Chem. Phys., 21, 5101–5116, https://doi.org/10.5194/acp-21-5101-2021, 2021.
Lowe, S. J., Partridge, D. G., Davies, J. F., Wilson, K. R., Topping, D., and Riipinen, I.: Key drivers of cloud response to surface-active organics, Nat. Commun., 10, 5214, https://doi.org/10.1038/s41467-019-12982-0, 2019.
Lu, C., Liu, Y., Zhang, G. J., Wu, X., Endo, S., Cao, L., Li, Y., and Guo, X.: Improving Parameterization of Entrainment Rate for Shallow Convection with Aircraft Measurements and Large-Eddy Simulation, J. Atmos. Sci., 73, 761–773, https://doi.org/10.1175/JAS-D-15-0050.1, 2016.
Mansoura, X., Cheng, Z., Vandergrift, G., Lata, N. N., Sola, V., Lai, Z., Rahman, A., Dhas, J., Zhu, Z., Zhang, D., Mei, F., and China, S.: Vertical profile of the chemical composition and mixing state of summertime ambient aerosols in the Southern Great Plains, Environ. Sci. Technol., under preparation, 2025.
McComiskey, A. and Ferrare, R. A.: Aerosol Physical and Optical Properties and Processes in the ARM Program, Meteorol. Monogr., 57, 21.21–21.17, https://doi.org/10.1175/AMSMONOGRAPHS-D-15-0028.1, 2016.
Mei, F., Setyan, A., Zhang, Q., and Wang, J.: CCN activity of organic aerosols observed downwind of urban emissions during CARES, Atmos. Chem. Phys., 13, 12155–12169, https://doi.org/10.5194/acp-13-12155-2013, 2013.
Mei, F., Pekour, M. S., Dexheimer, D., de Boer, G., Cook, R., Tomlinson, J., Schmid, B., Goldberger, L. A., Newsom, R., and Fast, J. D.: Observational data from uncrewed systems over Southern Great Plains, Earth Syst. Sci. Data, 14, 3423–3438, https://doi.org/10.5194/essd-14-3423-2022, 2022.
Mei, F. and Ermold, B.: Portable optical particle spectrometer aboard an airborne platform (AAFPOPS), Atmospheric Radiation Measurement (ARM) User Facility [data set], https://doi.org/10.5439/2322345, 2023a.
Mei, F. and Ermold, B.: Aircraft Integrated Meteorological Measurement System aboard aircraft (AAFMETAIMS100HZ), Atmospheric Radiation Measurement (ARM) User Facility [data set], https://doi.org/10.5439/2204047, 2023b.
Mei, F. and Ermold, B.: Aircraft Integrated Meteorological Measurement System aboard aircraft (AAFNAVAIMS100HZ), Atmospheric Radiation Measurement (ARM) User Facility [data set], https://doi.org/10.5439/2204048, 2023c.
Mei, F., Ermold, B., and Mehta, H.: Navigational Location, Motion, and Attitude for Airborne Platforms (AAFNAV), Atmospheric Radiation Measurement (ARM) User Facility [data set], https://doi.org/10.5439/1339718, 2023a.
Mei, F., Ermold, B., and Mehta, H.: Navigational Location, Motion, and Attitude for Airborne Platforms (AAFNAVVEC), Atmospheric Radiation Measurement (ARM) User Facility [data set], https://doi.org/10.5439/1238153, 2023b.
Mei, F., Wang, H., Zhu, Z., Zhang, D., Zhang, Q., Fast, J. D., Gustafson, W. I., Li, X.-Y., Schmid, B., Niedek, C., Tomlinson, J., and Flynn, C.: Bridging New Observational Capabilities and Process-Level Simulation: Insights into Aerosol Roles in the Earth System, B. Am. Meteorol. Soc., 105, E709–E724, https://doi.org/10.1175/BAMS-D-23-0110.1, 2024.
Morris, V., Ermold, B., Zhang, D., and Shi, Y.: Boundary-layer height data with CEIL (CEILPBLHT), Atmospheric Radiation Measurement (ARM) User Facility [data set], https://doi.org/10.5439/1095593, 2023.
Mullens, E. D. and McPherson, R. A.: Quantitative scenarios for future hydrologic extremes in the U.S. Southern Great Plains, Int. J. Climatol., 39, 2659–2676, https://doi.org/10.1002/joc.5979, 2019.
Naud, C. M., Muller, J.-P., and Clothiaux, E. E.: Comparison between active sensor and radiosonde cloud boundaries over the ARM Southern Great Plains site, J. Geophys. Res.-Atmos., 108, 4140, https://doi.org/10.1029/2002JD002887, 2003.
Niedek, C. R., Mei, F., Zawadowicz, M. A., Zhu, Z., Schmid, B., and Zhang, Q.: Quantitative chemical assay of nanogram-level particulate matter using aerosol mass spectrometry: characterization of particles collected from uncrewed atmospheric measurement platforms, Atmos. Meas. Tech., 16, 955–968, https://doi.org/10.5194/amt-16-955-2023, 2023.
Niedek, C. R., Mei, F., Jiang, W., Trousdell, J., Zawadowicz, M., Schmid, B., and Zhang, Q.: Advancing aerosol chemical characterization and vertical profiling over the Southern Great Plains via integrated uncrewed aerial sampling and aerosol mass spectrometry analyses, ACS Environ. Sci. Technol. – Air, under preparation, 2025.
Ou, S. C., Chen, Y., Liou, K. N., Cosh, M., and Brutsaert, W.: Satellite remote sensing of land surface temperatures: Application of the atmospheric correction method and split-window technique to data of ARM-SGP site, Int. J. Remote Sens., 23, 5177–5192, https://doi.org/10.1080/01431160110115050, 2002.
Parworth, C., Fast, J., Mei, F., Shippert, T., Sivaraman, C., Tilp, A., Watson, T., and Zhang, Q.: Long-term measurements of submicrometer aerosol chemistry at the Southern Great Plains (SGP) using an Aerosol Chemical Speciation Monitor (ACSM), Atmos. Environ., 106, 43–55, https://doi.org/10.1016/j.atmosenv.2015.01.060, 2015.
Petters, M. D. and Kreidenweis, S. M.: A single parameter representation of hygroscopic growth and cloud condensation nucleus activity, Atmos. Chem. Phys., 7, 1961–1971, https://doi.org/10.5194/acp-7-1961-2007, 2007.
Phillips, T. J. and Klein, S. A.: Land-atmosphere coupling manifested in warm-season observations on the U.S. southern great plains, J. Geophys. Res.-Atmos., 119, 509–528, https://doi.org/10.1002/2013JD020492, 2014.
Phillips, T. J., Klein, S. A., Ma, H.-Y., Tang, Q., Xie, S., Williams, I. N., Santanello, J. A., Cook, D. R., and Torn, M. S.: Using ARM Observations to Evaluate Climate Model Simulations of Land-Atmosphere Coupling on the U.S. Southern Great Plains, J. Geophys. Res.-Atmos., 122, 524–511, https://doi.org/10.1002/2017JD027141, 2017.
Rahman, M. M.: Recommendations on the measurement techniques of atmospheric pollutants from in situ and satellite observations: a review, Arab. J. Geosci., 16, 326, https://doi.org/10.1007/s12517-023-11410-4, 2023.
Riedi, J., Goloub, P., and Marchand, R. T.: Comparison of POLDER cloud phase retrievals to active remote sensors measurements at the ARM SGP site, Geophys. Res. Lett., 28, 2185–2188, https://doi.org/10.1029/2000GL012758, 2001.
Roach, P. J., Laskin, J., and Laskin, A.: Molecular Characterization of Organic Aerosols Using Nanospray-Desorption/Electrospray Ionization-Mass Spectrometry, Anal. Chem., 82, 7979–7986, https://doi.org/10.1021/ac101449p, 2010.
Rosenfeld, D., Fischman, B., Zheng, Y., Goren, T., and Giguzin, D.: Combined satellite and radar retrievals of drop concentration and CCN at convective cloud base, Geophys. Res. Lett., 41, 3259–3265, https://doi.org/10.1002/2014GL059453, 2014.
Ruehl, C. R., Davies, J. F., and Wilson, K. R.: An interfacial mechanism for cloud droplet formation on organic aerosols, Science, 351, 1447–1450, https://doi.org/10.1126/science.aad4889, 2016.
Schmid, B., Tomlinson, J. M., Hubbe, J. M., Comstock, J. M., Mei, F., Chand, D., Pekour, M. S., Kluzek, C. D., Andrews, E., Biraud, S. C., and McFarquhar, G. M.: The DOE ARM Aerial Facility, B. Am. Meteorol. Soc., 95, 723–742, https://doi.org/10.1175/BAMS-D-13-00040.1, 2014.
Schobesberger, S., D'Ambro, E. L., Vettikkat, L., Lee, B. H., Peng, Q., Bell, D. M., Shilling, J. E., Shrivastava, M., Pekour, M., Fast, J., and Thornton, J. A.: Airborne flux measurements of ammonia over the southern Great Plains using chemical ionization mass spectrometry, Atmos. Meas. Tech., 16, 247–271, https://doi.org/10.5194/amt-16-247-2023, 2023.
Seinfeld, J. H., Bretherton, C., Carslaw, K. S., Coe, H., DeMott, P. J., Dunlea, E. J., Feingold, G., Ghan, S., Guenther, A. B., Kahn, R., Kraucunas, I., Kreidenweis, S. M., Molina, M. J., Nenes, A., Penner, J. E., Prather, K. A., Ramanathan, V., Ramaswamy, V., Rasch, P. J., Ravishankara, A. R., Rosenfeld, D., Stephens, G., and Wood, R.: Improving our fundamental understanding of the role of aerosol−cloud interactions in the climate system, P. Natl. Acad. Sci. USA, 113, 5781–5790, https://doi.org/10.1073/pnas.1514043113, 2016.
Silber, I., Comstock, J. M., Kieburtz, M. R., and Russell, L. M.: ARMTRAJ: A Set of Multi-Purpose Trajectory Datasets Augmenting the Atmospheric Radiation Measurement (ARM) User Facility Measurements, Earth Syst. Sci. Data Discuss., 2024, 1-18, 10.5194/essd-2024-127, 2024.
Silber, I., Comstock, J. M., Kieburtz, M. R., and Russell, L. M.: ARMTRAJ: a set of multipurpose trajectory datasets augmenting the Atmospheric Radiation Measurement (ARM) user facility measurements, Earth Syst. Sci. Data, 17, 29–42, https://doi.org/10.5194/essd-17-29-2025, 2025.
Sisterson, D. L., Peppler, R. A., Cress, T. S., Lamb, P. J., and Turner, D. D.: The ARM Southern Great Plains (SGP) Site, Meteorol. Monogr., 57, 6.1–6.14, https://doi.org/10.1175/AMSMONOGRAPHS-D-16-0004.1, 2016.
Sivaraman, C., McFarlane, S., Chapman, E., Jensen, M., Toto , T., Liu, S., and Fischer, M.: Planetary Boundary Layer Height (PBL) Value Added Product (VAP): Radiosonde Retrievals, ARM user facility, Pacific Northwest National Laboratory, Richland, WA, United States, Medium: ED; Size: 36 p., https://arm.gov/data/science-data-products/vaps/pblht (last access: 14 March 2025), 2013.
Sivaraman, C., Shilling, J., and Kulkarni, G.: Retrieved Number concentration of CCN (RNCCNPROF1KULKARNI), Atmospheric Radiation Measurement (ARM) User Facility [data set], https://doi.org/10.5439/1813858, 2023.
Song, J., Liao, K., Coulter, R. L., and Lesht, B. M.: Climatology of the Low-Level Jet at the Southern Great Plains Atmospheric Boundary Layer Experiments Site, J. Appl. Meteorol., 44, 1593–1606, https://doi.org/10.1175/JAM2294.1, 2005.
Tao, C., Zhang, Y., Tang, S., Tang, Q., Ma, H.-Y., Xie, S., and Zhang, M.: Regional Moisture Budget and Land-Atmosphere Coupling Over the U.S. Southern Great Plains Inferred From the ARM Long-Term Observations, J. Geophys. Res.-Atmos., 124, 10091–10108, https://doi.org/10.1029/2019JD030585, 2019.
Thalman, R., de Sá, S. S., Palm, B. B., Barbosa, H. M. J., Pöhlker, M. L., Alexander, M. L., Brito, J., Carbone, S., Castillo, P., Day, D. A., Kuang, C., Manzi, A., Ng, N. L., Sedlacek III, A. J., Souza, R., Springston, S., Watson, T., Pöhlker, C., Pöschl, U., Andreae, M. O., Artaxo, P., Jimenez, J. L., Martin, S. T., and Wang, J.: CCN activity and organic hygroscopicity of aerosols downwind of an urban region in central Amazonia: seasonal and diel variations and impact of anthropogenic emissions, Atmos. Chem. Phys., 17, 11779–11801, https://doi.org/10.5194/acp-17-11779-2017, 2017.
Thorsen, T. J. and Fu, Q.: Automated retrieval of cloud and aerosol properties from the ARM Raman lidar. Part II: Extinction, J. Atmos. Ocean. Technol., 32, 1999–2023, 2015.
Turner, D., Goldsmith, J., and Ferrare, R.: Development and applications of the ARM Raman lidar, Meteorol. Monogr., 57, 18.11–18.15, 2016.
Turner, D. D., Ferrare, R. A., Wulfmeyer, V., and Scarino, A. J.: Aircraft Evaluation of Ground-Based Raman Lidar Water Vapor Turbulence Profiles in Convective Mixed Layers, J. Atmos. Ocean. Technol., 31, 1078–1088, https://doi.org/10.1175/JTECH-D-13-00075.1, 2014.
Vandergrift, G. W., Shawon, A. S. M., Dexheimer, D. N., Zawadowicz, M. A., Mei, F., and China, S.: Molecular Characterization of Organosulfate-Dominated Aerosols over Agricultural Fields from the Southern Great Plains by High-Resolution Mass Spectrometry, ACS Earth Space Chem., 6, 1733–1741, https://doi.org/10.1021/acsearthspacechem.2c00043, 2022.
Vandergrift, G. W., Dexheimer, D. N., Zhang, D., Cheng, Z., Lata, N. N., Rogers, M. M., Shrivastava, M., Zhang, J., Gaudet, B. J., Mei, F., and China, S.: Tethered balloon system and High-Resolution Mass Spectrometry Reveal Increased Organonitrates Aloft Compared to the Ground Level, Environ. Sci. Technol., 58, 10060–10071, https://doi.org/10.1021/acs.est.4c02090, 2024.
Vogelmann, A. M., McFarquhar, G. M., Ogren, J. A., Turner, D. D., Comstock, J. M., Feingold, G., Long, C. N., Jonsson, H. H., Bucholtz, A., Collins, D. R., Diskin, G. S., Gerber, H., Lawson, R. P., Woods, R. K., Andrews, E., Yang, H.-J., Chiu, J. C., Hartsock, D., Hubbe, J. M., Lo, C., Marshak, A., Monroe, J. W., McFarlane, S. A., Schmid, B., Tomlinson, J. M., and Toto, T.: RACORO Extended-Term Aircraft Observations of Boundary Layer Clouds, B. Am. Meteorol. Soc., 93, 861–878, https://doi.org/10.1175/BAMS-D-11-00189.1, 2012.
Vömel, H. and Ingleby, B.: Chapter 2 – Balloon-borne radiosondes, in: Field Measurements for Passive Environmental Remote Sensing, edited by: Nalli, N. R., Elsevier, 23–35, https://doi.org/10.1016/B978-0-12-823953-7.00010-1, 2023.
Wang, Y., Bagya Ramesh, C., Giangrande, S. E., Fast, J., Gong, X., Zhang, J., Tolga Odabasi, A., Oliveira, M. V. B., Matthews, A., Mei, F., Shilling, J. E., Tomlinson, J., Wang, D., and Wang, J.: Examining the vertical heterogeneity of aerosols over the Southern Great Plains, Atmos. Chem. Phys., 23, 15671–15691, https://doi.org/10.5194/acp-23-15671-2023, 2023.
Wendisch, M. and Brenguier, J.-L.: Airborne measurements for environmental research: methods and instruments, John Wiley & Sons, https://doi.org/10.1002/9783527653218.ch2, 2013.
Williams, I. N., Lu, Y., Kueppers, L. M., Riley, W. J., Biraud, S. C., Bagley, J. E., and Torn, M. S.: Land-atmosphere coupling and climate prediction over the U.S. Southern Great Plains, J. Geophys. Res.-Atmos., 121, 125–112, https://doi.org/10.1002/2016JD025223, 2016.
Zhang, D. and Silber, I.: Airmass trajectories to support studies using ARM Aerial Facility (AAF) data (ARMTRAJAAF), Atmospheric Radiation Measurement (ARM) User Facility [data set], https://doi.org/10.5439/2473260, 2024.
Zhang, D. and Sivaraman, C.: Planetary Boundary Layer Height (PBLHTRL1ZHANG), Atmospheric Radiation Measurement (ARM) User Facility [data set], https://doi.org/10.5439/2282350, 2023.
Zhang, D., Shi, Y., and Riihimaki, L.: Cloud Type Classification (CLDTYPE), Atmospheric Radiation Measurement (ARM) User Facility [data set], https://doi.org/10.5439/1349884, 2023.
Zhang, D., Comstock, J., Sivaraman, C., Mo, K., Krishnamurthy, R., Tian, J., Su, T., Li, Z., and Roldán-Henao, N.: Best Estimate of the Planetary Boundary Layer Height from Multiple Remote Sensing Measurements, EGUsphere [preprint], https://doi.org/10.5194/egusphere-2024-3959, 2025.
Zhang, J., Li, Z., Chen, H., and Cribb, M.: Validation of a radiosonde-based cloud layer detection method against a ground-based remote sensing method at multiple ARM sites, J. Geophys. Res.-Atmos., 118, 846–858, https://doi.org/10.1029/2012JD018515, 2013.
Zheng, X., Xi, B., Dong, X., Logan, T., Wang, Y., and Wu, P.: Investigation of aerosol–cloud interactions under different absorptive aerosol regimes using Atmospheric Radiation Measurement (ARM) southern Great Plains (SGP) ground-based measurements, Atmos. Chem. Phys., 20, 3483–3501, https://doi.org/10.5194/acp-20-3483-2020, 2020.
Zieger, P., Fierz-Schmidhauser, R., Weingartner, E., and Baltensperger, U.: Effects of relative humidity on aerosol light scattering: results from different European sites, Atmos. Chem. Phys., 13, 10609–10631, https://doi.org/10.5194/acp-13-10609-2013, 2013.