the Creative Commons Attribution 4.0 License.
the Creative Commons Attribution 4.0 License.
 | 14 Mar 2025
Enhanced understanding of atmospheric blocking modulation on ozone dynamics within a high-resolution Earth system model
Wenbin Kou
Dan Tong
Xiaojie Guo
Xiadong An
Wenyu Liu
Mengshi Cui
Xiuwen Guo
Shaoqing Zhang
Huiwang Gao
Lixin Wu
High surface ozone concentrations pose substantial health risks, yet understanding the factors influencing ozone levels, especially the role of large-scale circulations, remains incomplete. A key challenge is accurately modeling both large-scale circulations and ozone concentrations. Using a high-resolution Earth system model (25 km atmospheric resolution), we explore how local meteorology and large-scale circulations affect ozone levels. Our results show that heat waves can trigger substantial increases in ozone concentrations by stimulating biogenic volatile organic compound (BVOC) emissions during the summers of 2015–2019. For example, maximum daily 8 h (MDA8) ozone concentrations during heat waves increase by 12.0 ppbv in the southeastern US, 9.7 ppbv in Europe, 17.6 ppbv in North China, and 9.0 ppbv in central eastern China compared to non-heat-wave periods. In addition to local effects, atmospheric blocking strongly influences downstream meteorological conditions and ozone formation. Focusing on ozone pollution in eastern China, we identify three major pathways of Rossby wave propagation based on blocking locations: the Euro-Atlantic sector, northern Russia, and the North Pacific. These pathways lead to increased air temperature and intensify downward surface solar radiation downstream. The impact of blocking is most pronounced in central eastern China, where MDA8 ozone concentrations increase by 5.9 to 10.7 ppbv during blocking compared to non-blocking periods, followed by North China (2.1 to 4.9 ppbv). Blocking also stimulates BVOC emissions, enhancing MDA8 ozone concentrations by 10.6 to 15.9 ppbv in these regions. These findings highlight the critical role of large-scale atmospheric circulation in shaping regional air quality, especially under a warming climate.
- Article
(7589 KB) - Full-text XML
-
Supplement
(3066 KB) - BibTeX
- EndNote


Air pollution ranks as the fourth leading global risk factor for mortality, preceded by high systolic blood pressure, tobacco use, and dietary risks (Brauer et al., 2021). Among atmospheric pollutants, ozone is an important contributor to this burden (Fuller et al., 2022), affecting human health (Nuvolone et al., 2018), global climate (Deitrick and Goldblatt, 2023), and ecosystem health through exacerbating crop yield losses (Emberson et al., 2018).
The Hemispheric Transport of Air Pollution (HTAP; Dentener et al., 2010; Parrish et al., 2012) and Tropospheric Ozone Assessment Report (TOAR; Tarasick et al., 2019) programs have extensively studied long-term ozone trends. Their synthesis in 2021 (Parrish et al., 2021b) reveals a twofold increase in lower-tropospheric ozone at northern mid-latitudes from 1950–2000. The World Health Organization (WHO) strengthened air quality standards in 2021, emphasizing the critical need to assess ozone trends and their key drivers.
Ozone, a secondary air pollutant, forms when emission precursors such as volatile organic compounds (VOCs) and NOx are present (Fu and Tian, 2019). While anthropogenic emissions are significant, biogenic VOC (BVOC) emissions, which comprise about 90 % of global VOC emissions (Guenther et al., 2012), are particularly sensitive to temperature. For instance, BVOC emissions notably elevate ozone levels in the North China Plain, particularly at the surface, contributing to increases of 7.8 and 10.0 ppbv in the regional average maximum daily 8 h (MDA8) ozone concentrations in the North China Plain and Beijing, respectively, during the summer of 2017 (Ma et al., 2019). Note that unless otherwise specified, ozone in this study refers to surface ozone. Even in less polluted regions such as the US, BVOC emissions contribute a notable fraction of ozone, averaging 10 % and 19 % in the western and southeastern US, respectively (Zhang et al., 2017).
This effect is amplified under favorable meteorological conditions. Compared to non-heat-wave periods, heat waves trigger increased BVOC emissions, resulting in regional daytime ozone concentration increases of 10 µg m−3 in the Pearl River Delta, with peaks reaching 42.1 µg m−3 (Wang et al., 2021). In southwestern Europe, heat waves induce a 33 % rise in BVOC emissions, resulting in ozone concentration increases of 9 µg m−3 during the summers of 2012–2014 (Guion et al., 2023). However, biases in modeling heat waves (Gao et al., 2012) and ozone, such as overestimations up to 20 ppbv in low-resolution global models (Emmons et al., 2020; Lamarque et al., 2012), have hindered previous investigations, primarily conducted using regional weather and chemistry models (Gao et al., 2020; Zhang et al., 2022). Addressing these challenges, especially the biases from low-resolution global models in boundary conditions (Zeng et al., 2022), is crucial for advancing Earth system models to better understand the impact of heat waves on ozone through BVOC emissions.
Local meteorological factors, particularly high temperatures, are closely linked to large-scale circulations (Li and Sun, 2018), which further influence the ozone–temperature relationship. For instance, the correlation between summer ozone and temperature over eastern North America correlates with the position of the jet stream, defined by the latitude of the maximum 500 hPa zonal wind averaged across the region (Barnes and Fiore, 2013). Atmospheric circulations, such as the North Atlantic Oscillation, significantly affect moisture transport and precipitation and, subsequently, trace gas transport, deposition, and air pollutant concentrations (Christoudias et al., 2012). In central eastern China, the East Asian summer monsoon explains 2 %–5 % of interannual variations in ozone concentrations (Yang et al., 2014). Moreover, a positive phase of the Eurasian teleconnection induces Rossby wave train propagation from Europe to North China, influencing downward surface solar radiation intensity and temperatures, thereby modulating ozone concentration variability (Yin et al., 2019).
Recently, Yang et al. (2022) highlighted that high temperatures alone may not always enhance ozone formation. For instance, high temperatures induced by a zonal “” wave train pattern over Eurasia at 300 hPa may not favor ozone enhancement in North China. In contrast, circulation anomalies resembling an atmospheric blocking pattern, including positive geopotential height anomalies at 300 hPa over North China and eastern Eurasia, can lead to weaker meridional temperature gradients, intensified downward solar radiation, reduced cloud cover, and aggravated ozone pollution. Atmospheric blocking, a quasi-stationary, large-scale extra-tropical weather system, often occurs over expansive regions like the North Atlantic–Europe and North Pacific (Pelly and Hoskins, 2003; Schwierz et al., 2004; Woollings et al., 2018). Blocking highs are frequently associated with extreme weather events (Barriopedro et al., 2011; Cattiaux et al., 2010). For example, through downstream Rossby wave propagation from Alaska to East Asia, Alaska blocking can induce subsequent blocking over the Urals, influencing extreme cold events across North America and Eurasia (Yao et al., 2023).
Despite significant advancements, the impact of atmospheric blocking on extreme weather events and ozone remains insufficiently explored. For example, using a Hovmöller diagram and local wave activity calculated from 500 hPa geopotential height, Sun et al. (2019) found that variations in wave activity can explain 30 %–40 % of ozone variability in historical US summers. Challenges in global models, such as simulated biases in atmospheric blocking and ozone, including overestimations (Clifton et al., 2020), have undermined confidence in linking large-scale circulation patterns with ozone levels (Barnes and Fiore, 2013).
Building on recent advances in high-resolution Earth system models that mitigate ozone biases (Gao et al., 2025b) and simulate meteorological parameters and climate extremes (Chang et al., 2020; Gao et al., 2023, 2025a; Guo et al., 2022), this study is structured as follows. Section 2 describes the model setup. It is followed by an analysis of observational ozone data, the effects of BVOC emissions, and heat waves on ozone concentrations. Finally, we explore how atmospheric blocking influences ozone pollution in eastern China.
2.1 Model configurations
In this study, we utilize the Community Earth System Model version 1.3, employing the Community Atmosphere Model 5.0 (CAM5) as its atmospheric component. CAM5 runs at two spatial resolutions: nominal 1 and 0.25°. Sea surface temperature (SST) and sea ice are prescribed at a spatial resolution of 1.0°×1.0°. Atmospheric gas chemistry and aerosol processes are simulated using the Model for OZone And Related chemical Tracers (MOZART) and the three-mode version of the Modal Aerosol Module (MAM3). The high-resolution and low-resolution configurations of CESM are denoted as SW-HRESM and CESM-LR, respectively. Further details can be found in Gao et al. (2025b). The simulation period covers June to August from 2015 to 2019, with May used for spin-up to mitigate initial condition influences. Prior to that, a half-year spin-up is applied due to the fact that tropospheric ozone initially starts from zero. Specifically, we used a total of 7 months of spin-up, ensuring that the influence of initial conditions was fully minimized, thereby guaranteeing the accuracy of the tropospheric ozone simulation.
Emissions for the simulations are sourced as follows: global anthropogenic emissions from the Copernicus Atmosphere Monitoring Service (CAMS-GLOB-ANT v4.2-R1.1; Granier et al., 2019), with updates for China based on the Multi-resolution Emission Inventory for China (MEIC; Li et al., 2017). Volcanic emissions are from the Global Emission Inventory Activity (GEIA), and aircraft emissions are from the Community Emission Data System (CEDS). Biomass burning emissions data are sourced from the Fire INventory from the National Center for Atmospheric Research (FINN) version 2.5 (Wiedinmyer et al., 2023). High-resolution simulations use emissions data at 0.1° resolution, while low-resolution simulations aggregate emissions from 0.1° to ∼ 1.0° resolution. Biogenic emissions are calculated online using the Model of Emissions of Gases and Aerosols from Nature version 2.1 (MEGAN2.1; Guenther et al., 2012). Further emission details are available in Gao et al. (2025b).
Two numerical experiments are designed to assess the impact of BVOC emissions on ozone. The first experiment includes all emissions (base case), while the second experiment turns off BVOC emissions (no-BVOC case). By subtracting the results from the no-BVOC case from those of the base case, we isolate the contribution of BVOC emissions to ozone.
2.2 Blocking detection method and Rossby wave flux calculation
To identify atmospheric blocking, we use a two-dimensional hybrid blocking index based on 500 hPa geopotential height. The index is applied across a range of latitudes, ϕ (40 to 75° N), for each longitude, λ, incorporating meridional gradients to identify blocked grid points:
where GHGN (GHGS) indicates the meridional gradient to the north (south) of geopotential height at 500 hPa, Z means the 500 hPa geopotential height at longitude λ along latitude ϕ, and is the zonal (0 to 360°) average of Z at latitude ϕ; Δ is set as 15°.
A blocking region is defined when the meridional extension of blocked grid points exceeds 15°. The center of each blocking region is determined as the grid point with maximal 500 hPa geopotential height. Sequential blocking events are identified if the center of a blocking region on 1 d was within a specified distance (27° in latitude × 36° in longitude) of the center on the previous day. We restrict a blocking event lasting at least 5 d. More information can be found in Masato et al. (2013) and Gao et al. (2025a).
To examine Rossby wave propagation, the horizontal stationary wave activity flux (W) is calculated following Takaya and Nakamura (2001). Key variables used for flux calculation include zonal wind (U), meridional wind (V), wind speed (|U|), and anomalous geopotential height (Φ′):
where W represents the wave activity flux (unit: m2 s−2), ψ′ () represents the geostrophic stream function, f (= 2Ωsinϕ) is the Coriolis parameter, P is the normalized pressure (P per 1000 hPa), and a is Earth's radius. λ and ϕ denote the longitude and latitude, respectively.
2.3 Observational data
Observational ozone data are collected from several platforms, including the Air Quality System (AQS; https://www.epa.gov/aqs; last access: 30 June 2023) and the Clean Air Status and Trends Network (CASTNET; https://www.epa.gov/castnet; last access: 30 April 2023) in the US, the European Monitoring and Evaluation Programme (EMEP) database (http://ebas.nilu.no; last access: 30 January 2023) in Europe, and the China National Environmental Monitoring Centre (CNEMC; http://www.pm25.in; last access: 8 December 2021) in China. The monitoring network comprises 1293 sites for AQS, 99 for CASTNET, 286 for EMEP, and 2025 for CNEMC. Meteorological data used in this study are sourced from the National Centers for Environmental Prediction (NCEP) Reanalysis-1 (Kalnay et al., 1996).
3.1 Characteristics of observed ozone in the Northern Hemisphere
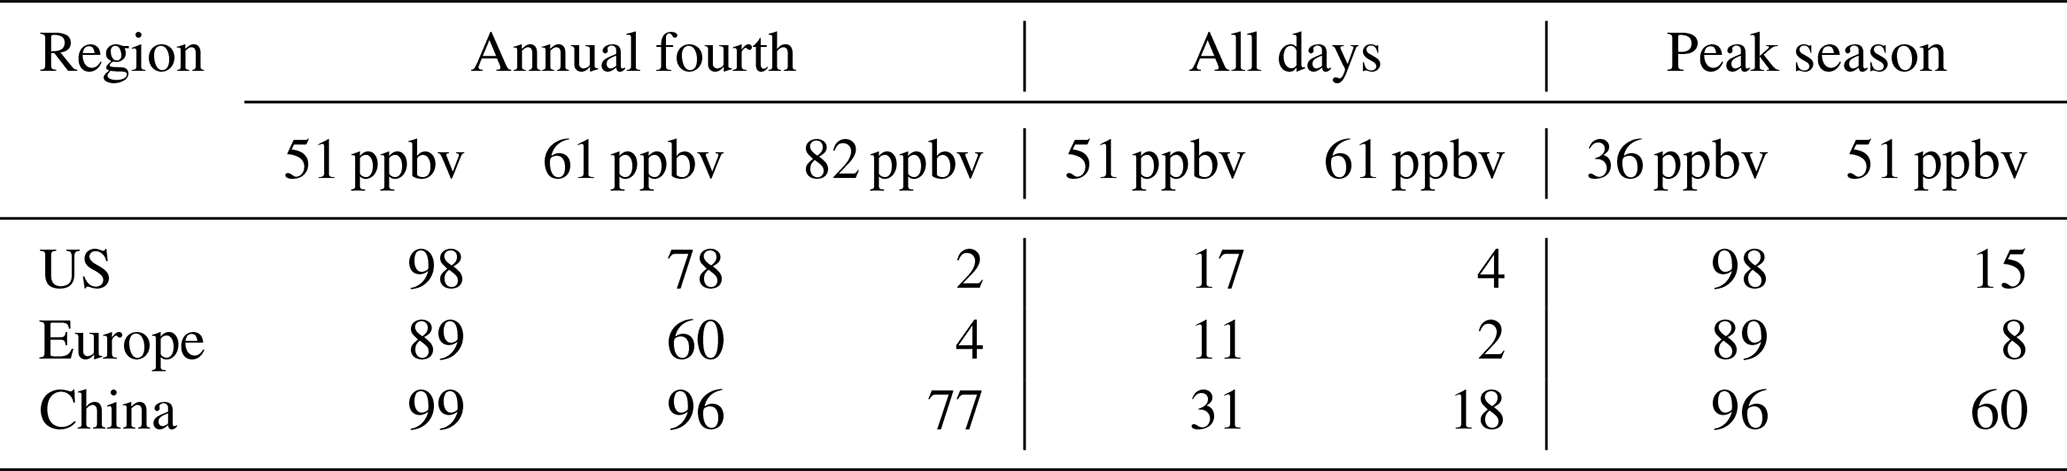
Figure 1 illustrates the characteristics of observed ozone levels based on a comprehensive analysis of extensive observational datasets, with ozone exceedance rates shown in Table 1. Peak season ozone (Fig. 1a), as defined by the WHO in 2021, is determined using a 6-month running average of maximum daily 8 h ozone concentrations for each grid, with the maximum value being considered. The WHO air quality guideline is set at 60 µg m−3 (31 ppbv; level II), with additional standards of 100 µg m−3 (51 ppbv; level I) and 70 µg m−3 (36 ppbv; Air Quality Guideline). Regional differences in ozone pollution are apparent: higher concentrations are observed in the western US due to elevated altitude and background levels (Parrish et al., 2021a). Specific sites with significant ozone pollution include Los Angeles and Houston, as previously documented (Dunker et al., 2017). In Europe, ozone pollution is more pronounced in southern regions, particularly around the Mediterranean, consistent with earlier studies (Zohdirad et al., 2022). In China, the eastern region exhibits concentrated pollution. Mean peak season ozone levels are 45.5 ppbv in the US, 42.9 ppbv in Europe, and 53.7 ppbv in China.
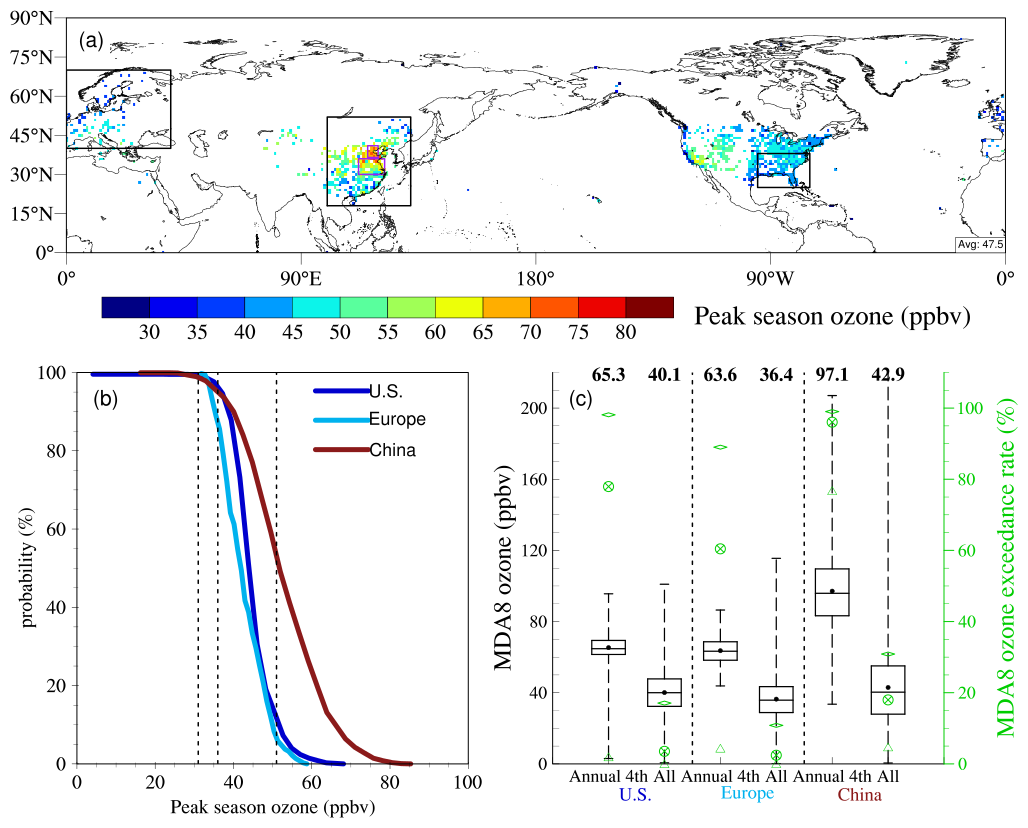
Figure 1Peak season ozone concentrations and maximum daily 8 h ozone concentrations. (a) Spatial distribution of mean peak season ozone concentrations in the Northern Hemisphere from 2015–2019. The black squares represent regions in Europe, eastern China, and the US, while the purple squares in eastern China denote North China and central eastern China regions. (b) Cumulative distribution function of peak season ozone concentrations, with dashed lines indicating WHO standard values (31, 36, 51 ppbv) set by WHO. (c) Box-and-whisker plot of annual fourth-highest (left) and all (right) MDA8 ozone concentrations during 2015–2019 in the US, Europe, and China. The boxes represent the interquartile range (25th to 75th percentiles), horizontal lines denote medians, solid points indicate averages, and line end points show maximum and minimum values with the averages shown on top of each box. Exceedance rates (%) of MDA8 ozone to WHO standards of 82, 61, and 51 ppbv are marked with the green triangle, crossed-out circle, and diamond symbols, respectively.
The cumulative distribution function of peak season ozone concentrations is shown in Fig. 1b using gridded data. In the US and Europe, only 15 % and 8 % of the peak season ozone concentrations, respectively, exceed level I (51 ppbv) from 2015 to 2019, whereas in China, almost 60 % exceed this threshold. However, when applying the stricter standard (36 ppbv), exceedance rates are notably high: 98 %, 89 %, and 96 % in the US, Europe, and China, respectively.
Figure 1c presents the fourth-highest MDA8 ozone values annually from 2015–2019, alongside daily values for the US, Europe, and China. The WHO has established standards at 82 and 61 ppbv, with an air quality guideline of 51 ppbv. Exceedance rates (Table 1) for the strictest guideline (51 ppbv) are 98 %, 89 %, and 99 % in the US, Europe, and China, respectively. Considering all daily values, with a sample size approximately 365 times larger than the annual fourth-highest value, the rates of ozone exceedance (i.e., exceeding 51 ppbv) are observed to be 17 % in the US, 11 % in Europe, and 31 % in China. This indicates that there are significantly more days where ozone levels exceed the threshold beyond just the fourth-highest maximum daily 8 h ozone level in these regions. This suggests that air quality issues related to ozone are more persistent and widespread than what might be inferred solely from the fourth-highest MDA8 metric.
Table 1Regional mean ozone exceedance rates (%) during 2015–2019.
3.2 BVOC emissions and their effects on ozone
BVOC emissions during the summer months of 2015–2019 are depicted in Fig. 2a and b, with global totals of 86.0 Tg per month in SW-HRESM and 90.7 Tg per month in CESM-LR. Isoprene emissions (Fig. 2c, d) account for nearly half of these totals, amounting to 42.3 Tg per month in SW-HRESM and 45.2 Tg per month in CESM-LR. This predominance of isoprene emissions aligns with previous studies (Ma et al., 2022; Mochizuki et al., 2020). Isoprene emissions are predominantly concentrated in tropical regions, reflecting the prevalence of dense forest cover. Our study indicates values approximately 30 % higher than those (Fig. S1) reported in Weng et al. (2020) due to previously underestimated emissions in tropical regions.
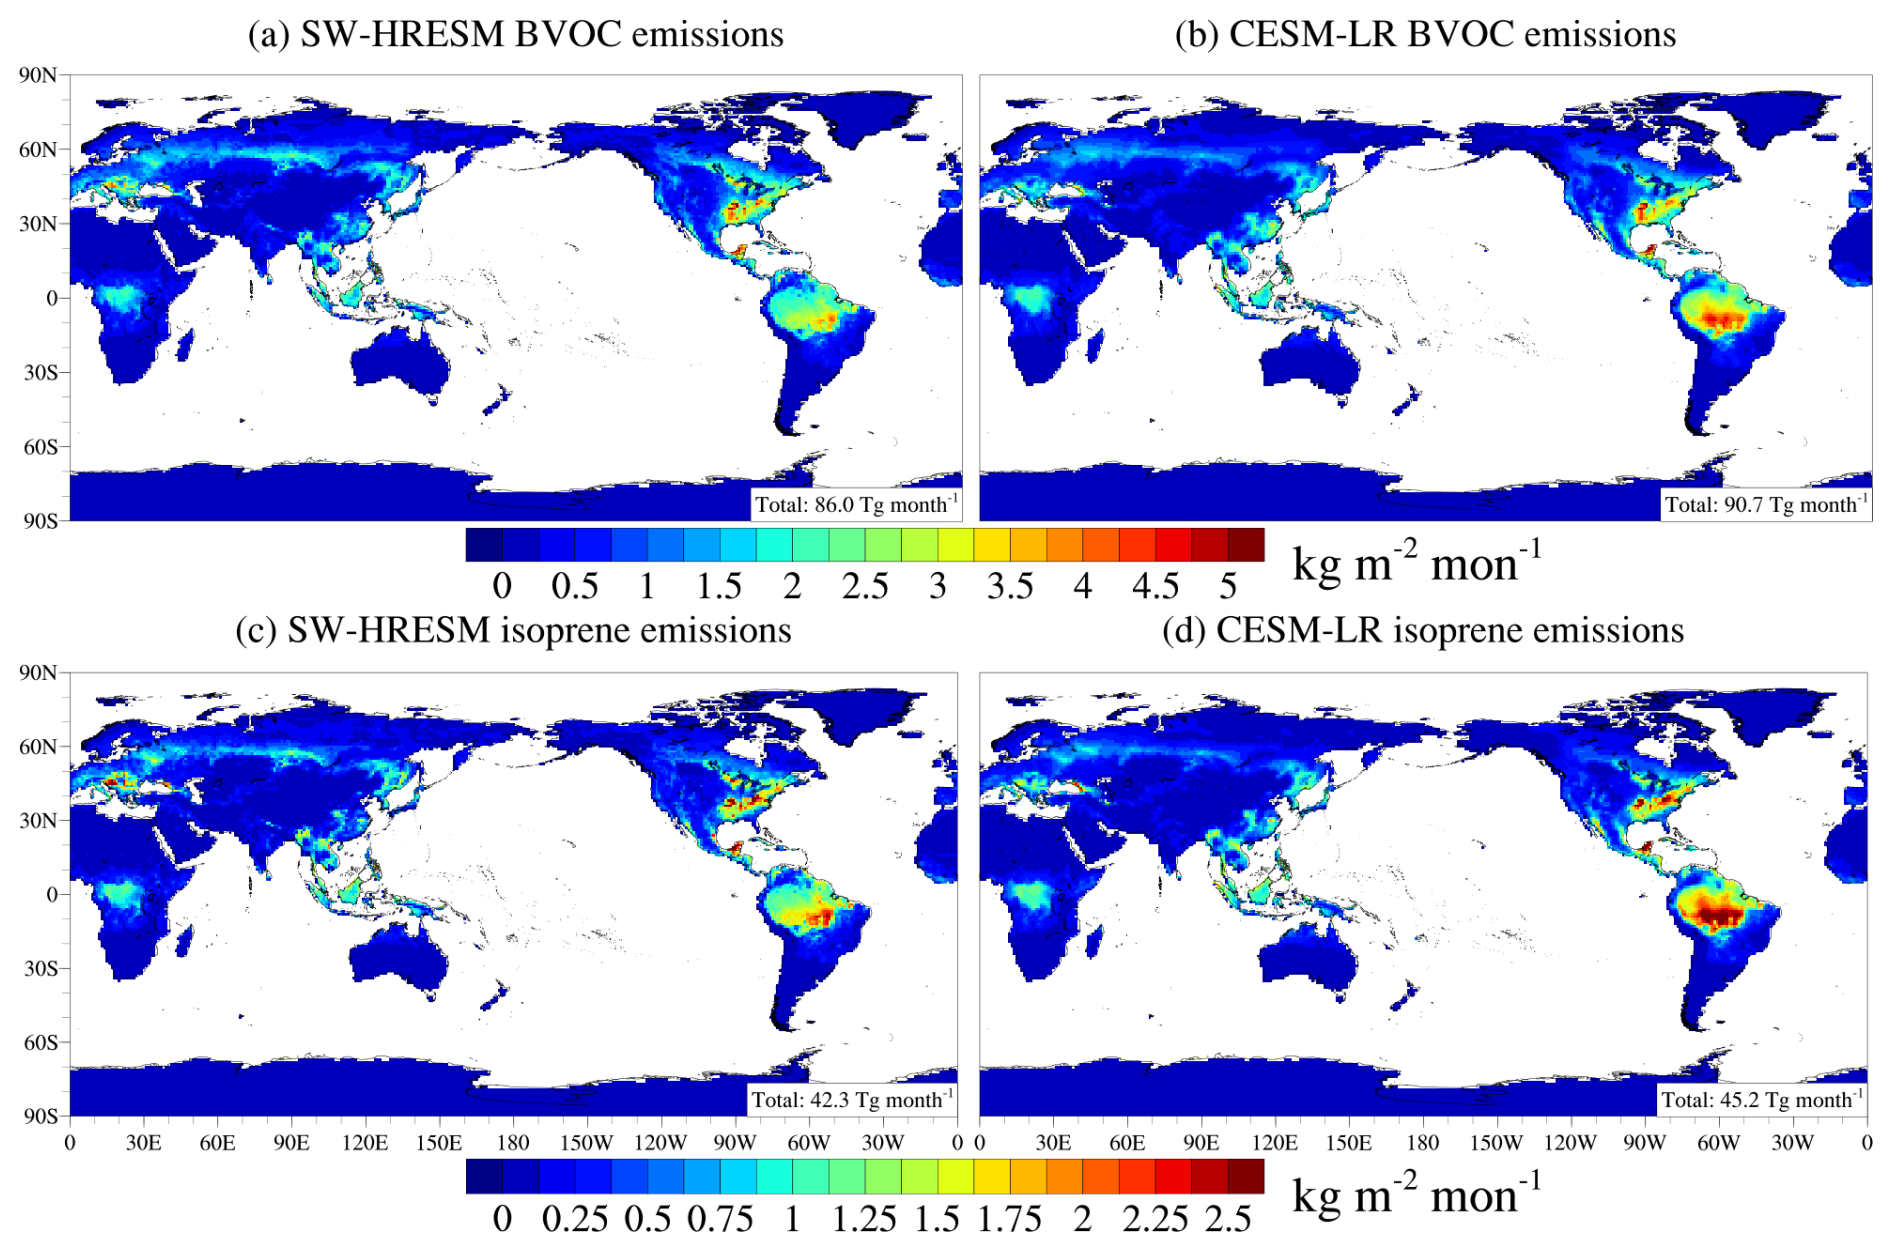
Figure 2Spatial distribution of BVOC (a, b) and isoprene (c, d) emissions based on SW-HRESM (a, c) and CESM-LR (b, d). Shown are monthly total emissions averaged during the summers of 2015–2019.
To assess the utility of high-resolution simulations, we compute the standard deviation across 16 grid points in SW-HRESM, corresponding to a single low-resolution grid (Fig. S2). The average monthly isoprene emissions during 2015–2019 are 0.63, 0.51, and 0.21 kg m−2 over the US, Europe, and China (Fig. 2c), respectively, with mean standard deviations of 0.13, 0.11, and 0.05 kg m−2 (Fig. S2). This ratio also applies to biogenic-emission-rich areas such as the southeastern US, southern Europe, and eastern China, highlighting the importance of using finer grid spacings for accurately capturing the spatial heterogeneity in BVOC emissions.
The spatial distribution of BVOC emissions closely correlates with the distribution of broadleaf trees (Fig. S3), which have higher emission factors compared to other plant types (Table 2 in Guenther et al., 2012). Isoprene emissions are most intense in tropical regions where broadleaf evergreen and deciduous tropical trees predominate, as well as in mid- to high-latitude belts and isolated hotspots in mid-latitudes like the southeastern US, southern Europe, and eastern China.
An exception is observed in the Amazon region, where, despite dense broad evergreen tropical forest cover, the largest isoprene and BVOC emissions occur away from the main forest area. This Amazon hotspot, noted in previous studies (Opacka et al., 2021), is influenced by key meteorological factors such as 2 m air temperature and downward surface solar radiation (Fig. S4). Specifically, areas with higher temperatures and stronger solar radiation exhibit greater BVOC and isoprene emissions. The discrepancy in temperature between CESM-LR and SW-HRESM simulations reveals nuances in emission patterns, with CESM-LR showing slightly higher temperatures that lead to increased emissions. The slightly lower temperature in higher-grid-spacing simulations in regional climate models was also reported by Pugh et al. (2013). They suggested that improved representation of forests could increase latent heat flux and thereby mitigate temperature rises through a reduced sensible heat. The study compared three grid spacings: 0.1, 0.5, and 2.0°, showing that across regions such as South America, southeastern Asia, and the southeastern US, there was a small overall difference of about 2 % in BVOC emissions on a regional scale. However, this difference could reach up to 150 % in high-emission areas.
To understand the contribution of BVOC emissions to ozone concentrations across different grid resolutions, we compare two scenarios: one with biogenic emissions included and one without. Figure 3a and b illustrate the spatial distribution of ozone concentrations averaged over the summers of 2015–2019 for both SW-HRESM and CESM-LR. Both models identify significant ozone pollution areas in the Northern Hemisphere, particularly over southern Europe, the southeastern US, and eastern China. The contribution of BVOC emissions to ozone concentrations is further detailed in Fig. 3c–f.
In SW-HRESM, BVOC emissions contribute approximately 2.2 ppbv to the global mean ozone concentrations over land, representing 7 % relative to the mean value of 31.3 ppbv (Fig. 3c, e). However, the impact of BVOC emissions on ozone concentrations is modulated by factors such as anthropogenic emissions and meteorological conditions. Regions with abundant BVOC emissions and higher ozone concentrations, such as the US, Europe, and eastern China, show a substantial contribution of 15 % to 30 % from BVOC emissions to ozone levels. In contrast, the Amazon rainforest in Brazil, despite having the highest BVOC emissions, exhibits a negative contribution to ozone levels. This is attributed to the fact that in regions with low NOx concentrations, increased VOCs initiated by OH oxidation can lead to the formation of stable organic nitrogen compounds, through increasing organic peroxy radicals and elevating the reaction with NO2 (Tonnesen and Jeffries, 1994). It reduces the availability of NO2 and the subsequent photolysis such as a reduction in O3P, thereby reducing ozone concentrations (Kang et al., 2003; Unger, 2014). While this effect is evident in CESM-LR, lower-resolution simulations may overlook finer-scale variability, affecting the accuracy of quantifying the impact of BVOC emissions on ozone.
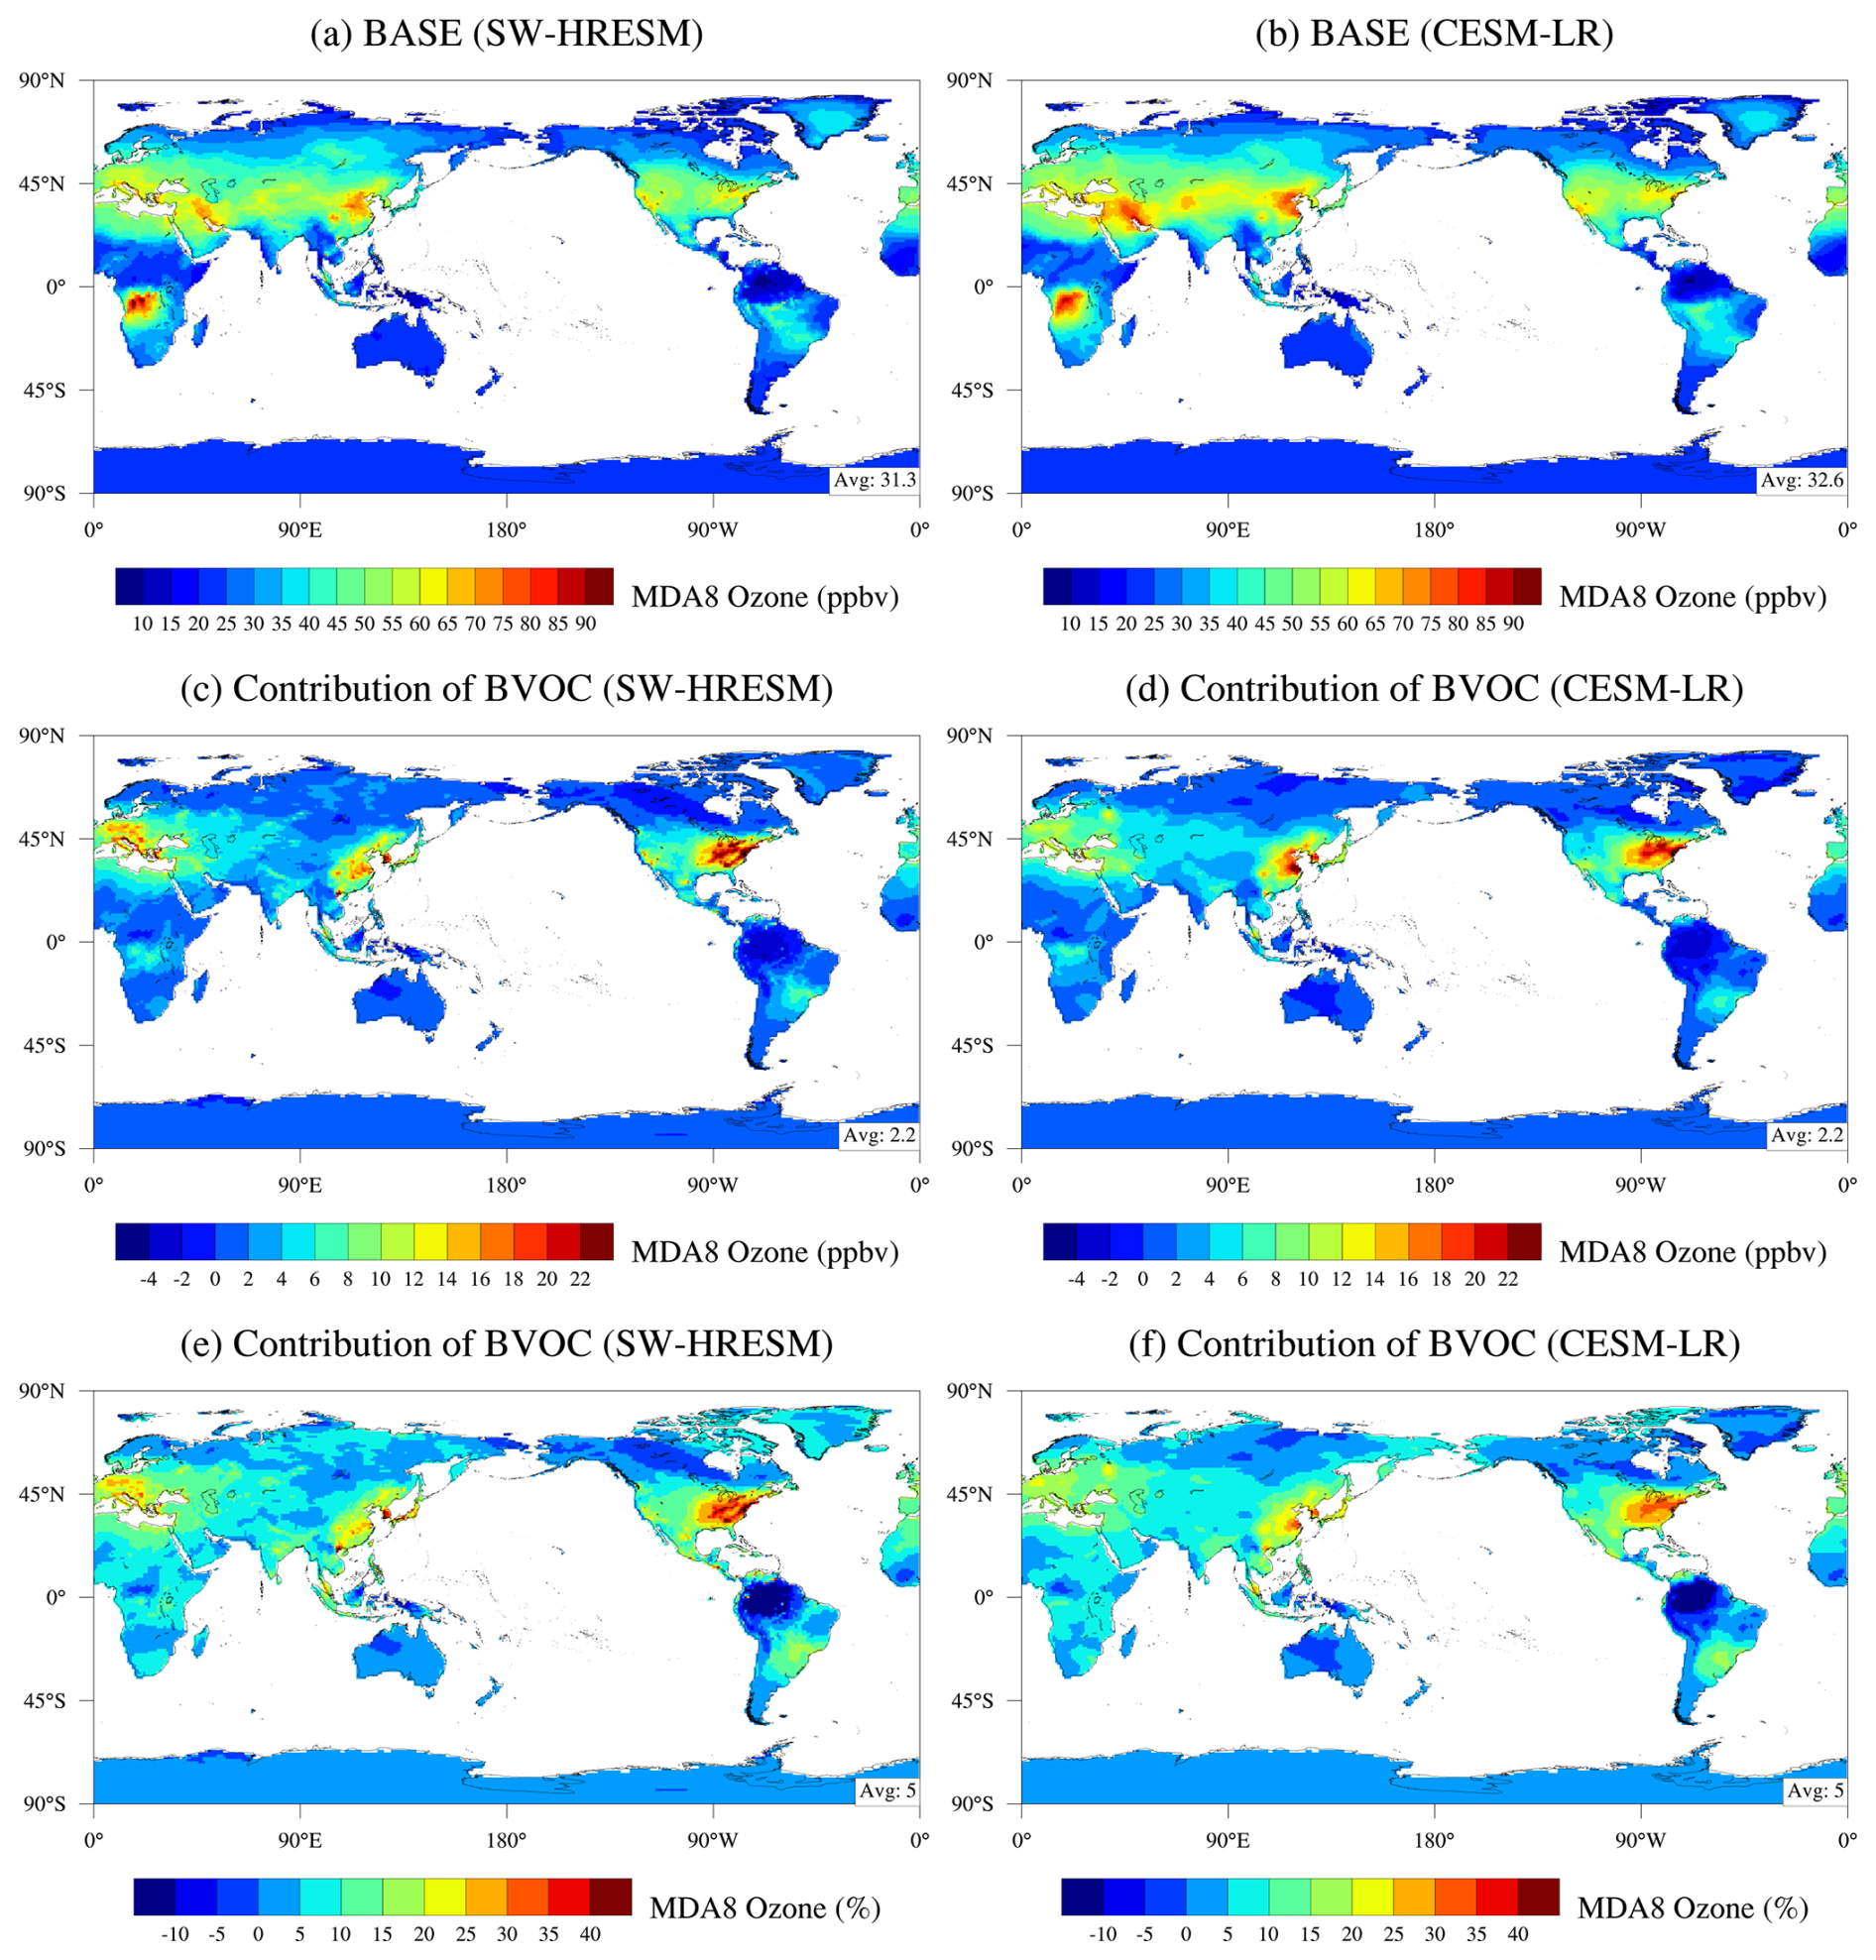
Figure 3Spatial distribution of MDA8 ozone from SW-HRESM (a, c, e) and CESM-LR (b, d, f). Shown are results of ozone concentrations in the base case (top) and the contribution of BVOC emissions to ozone (middle row: ppbv; bottom row: %). Global mean values over land are indicated in the bottom right.
3.3 Effects of heat waves on ozone
Heat waves not only accelerate photochemical reactions but also intensify BVOC emissions, thereby amplifying ozone production and exacerbating ozone pollution. Building on previous studies (Gao et al., 2012; Sillmann et al., 2013), heat waves are defined within each grid as periods when the daily mean near-surface air temperature exceeds the 90th percentile of the climatological mean, focusing on the summer period from 2015–2019 in this study. To quantify the impact of heat waves on ozone concentrations, Fig. 4 illustrates the probability distribution function (PDF) of MDA8 ozone concentrations for both the base case and a scenario without BVOC emissions, aggregated across entire summer periods and specifically during heat wave days. Given the superior capability of high-resolution simulations in reproducing heat waves and ozone concentrations (Gao et al., 2023, 2025b), we present results solely from SW-HRESM hereafter.
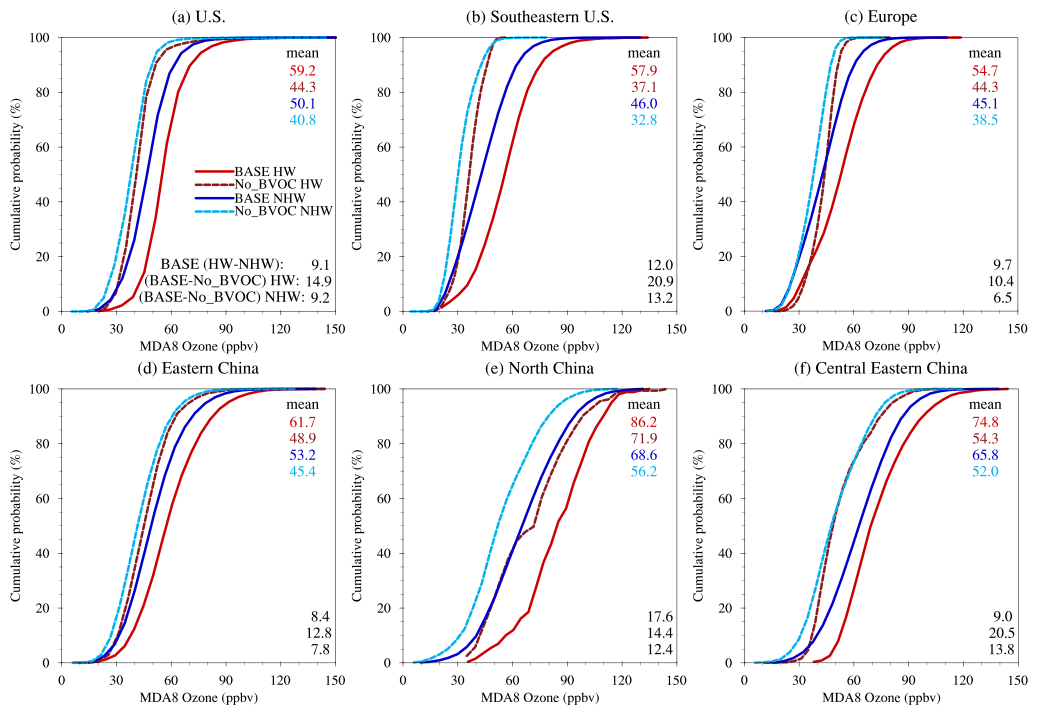
Figure 4Cumulative density function (CDF) of MDA8 ozone concentrations. Shown are results for the base case (solid line) and the case without BVOC emissions (dashed line), during heat waves (red) and non-heat-waves (blue) based on SW-HRESM.
Several notable observations emerge. Firstly, a comparison of heat wave periods to non-heat-wave periods (solid red vs. solid blue lines in Fig. 4) reveals a noticeable rightward shift in the PDF, indicating an increase in ozone levels due to heat wave impacts, a well-established phenomenon (e.g., Gao et al., 2020; Zhang et al., 2018). Specifically, compared to non-heat-wave periods, mean ozone concentrations increase by 9.1, 9.7, and 8.4 ppbv during heat waves over the US, Europe, and eastern China, respectively. This effect is more pronounced in specific regions, such as North China (NC) with an increase of 17.6 ppbv, followed by the southeastern US (12.0 ppbv) and central eastern China (CECN) (9.0 ppbv), accounting for 12 % to 21 % of regional mean ozone levels. A previous study noted that median ozone concentrations during US heat waves from 1990–2016 could increase by 10 % to 80 % (Meehl et al., 2018).
Comparing scenarios with and without BVOC emissions (solid vs. dashed lines in Fig. 4), BVOC emissions significantly contribute to ozone enhancement during both non-heat-wave and heat wave periods. For instance, during heat waves, BVOC emissions contribute 20.9, 10.4, 14.4, and 20.5 ppbv over the southeastern US, Europe, North China, and central eastern China, respectively. A study by Churkina et al. (2017) found that biogenic emissions contributed 17 %–20 % to ozone formation in Berlin, Germany, in July 2006, with this contribution potentially increasing to 60 % during heat waves.
It is important to note that the influence of BVOC emissions persists outside of heat wave periods, particularly when downward surface solar radiation remains sufficiently high (Fig. S5). The differences in BVOC contributions to ozone between heat wave and non-heat-wave periods represent the incremental effect of BVOCs during heat waves, accounting for 7.7, 3.9, 2.0, and 6.7 ppbv over these four regions, respectively. This incremental effect constitutes 64 %, 40 %, 11 %, and 74 % of the total heat wave effects, indicating varying degrees of BVOC influence across different regions. The relatively smaller incremental BVOC effect during heat waves over North China is partly attributed to higher anthropogenic emissions and lower BVOC emissions compared to the other regions. With potential reductions in anthropogenic emissions in China, BVOC emissions could assume a more pivotal role, especially given projections of an increased frequency of heat waves in a warming climate (Gao et al., 2022, 2023).
3.4 The role of atmospheric blocking in ozone pollution in eastern China
Eastern China has emerged as a significant region grappling with severe ozone pollution. Numerous studies have endeavored to explore the driving factors, particularly in the last decade, leveraging the widespread availability of ozone data across China. For example, through the examination of ozone pollution events in North China during 2014–2017, Gong and Liao (2019) investigated ozone pollution episodes in North China from 2014–2017 and identified that under weather conditions characterized by high near-surface air temperatures, low relative humidity, and anomalous southerly winds in the lower troposphere, ozone concentrations tend to accumulate in this region. Mousavinezhad et al. (2021) utilized a multiple linear regression model to disentangle the contributions of meteorology and emissions to ozone levels in North China during 2015–2019. Their findings indicated that meteorological factors such as increased downward surface solar radiation and near-surface air temperatures accounted for 32 % of the observed ozone increase, while changes in emission precursors contributed 68 %. To elucidate the interannual variability of ozone in North China, Gong et al. (2020) employed tagged O3 simulations with the Goddard Earth Observing System chemical transport model (GEOS-Chem) and suggested that one-third of the rise in ozone pollution days observed from 2014–2018, particularly in 2018, could be attributed to emissions transport from central eastern China. Considering the intertwined roles of meteorology and emissions, the focus shifted to examining ozone anomalies relative to their respective monthly averages, thereby minimizing the influence of emissions on ozone variability.
The study focuses on two specific regions – North China and central eastern China – to analyze days where regional mean MDA8 ozone levels exceeded 10 ppbv of their respective monthly means, defined as regional ozone pollution events. Observational data indicate a total of 131 and 89 such events in North China and central eastern China, respectively, during the summers of 2015–2019. Ozone pollution events are observed to extend meridionally (Figs. 5, 6), moving northward into northeastern China from North China (Fig. 5a, b) and covering large areas of northern and southern China from central eastern China (Fig. 6a, b).
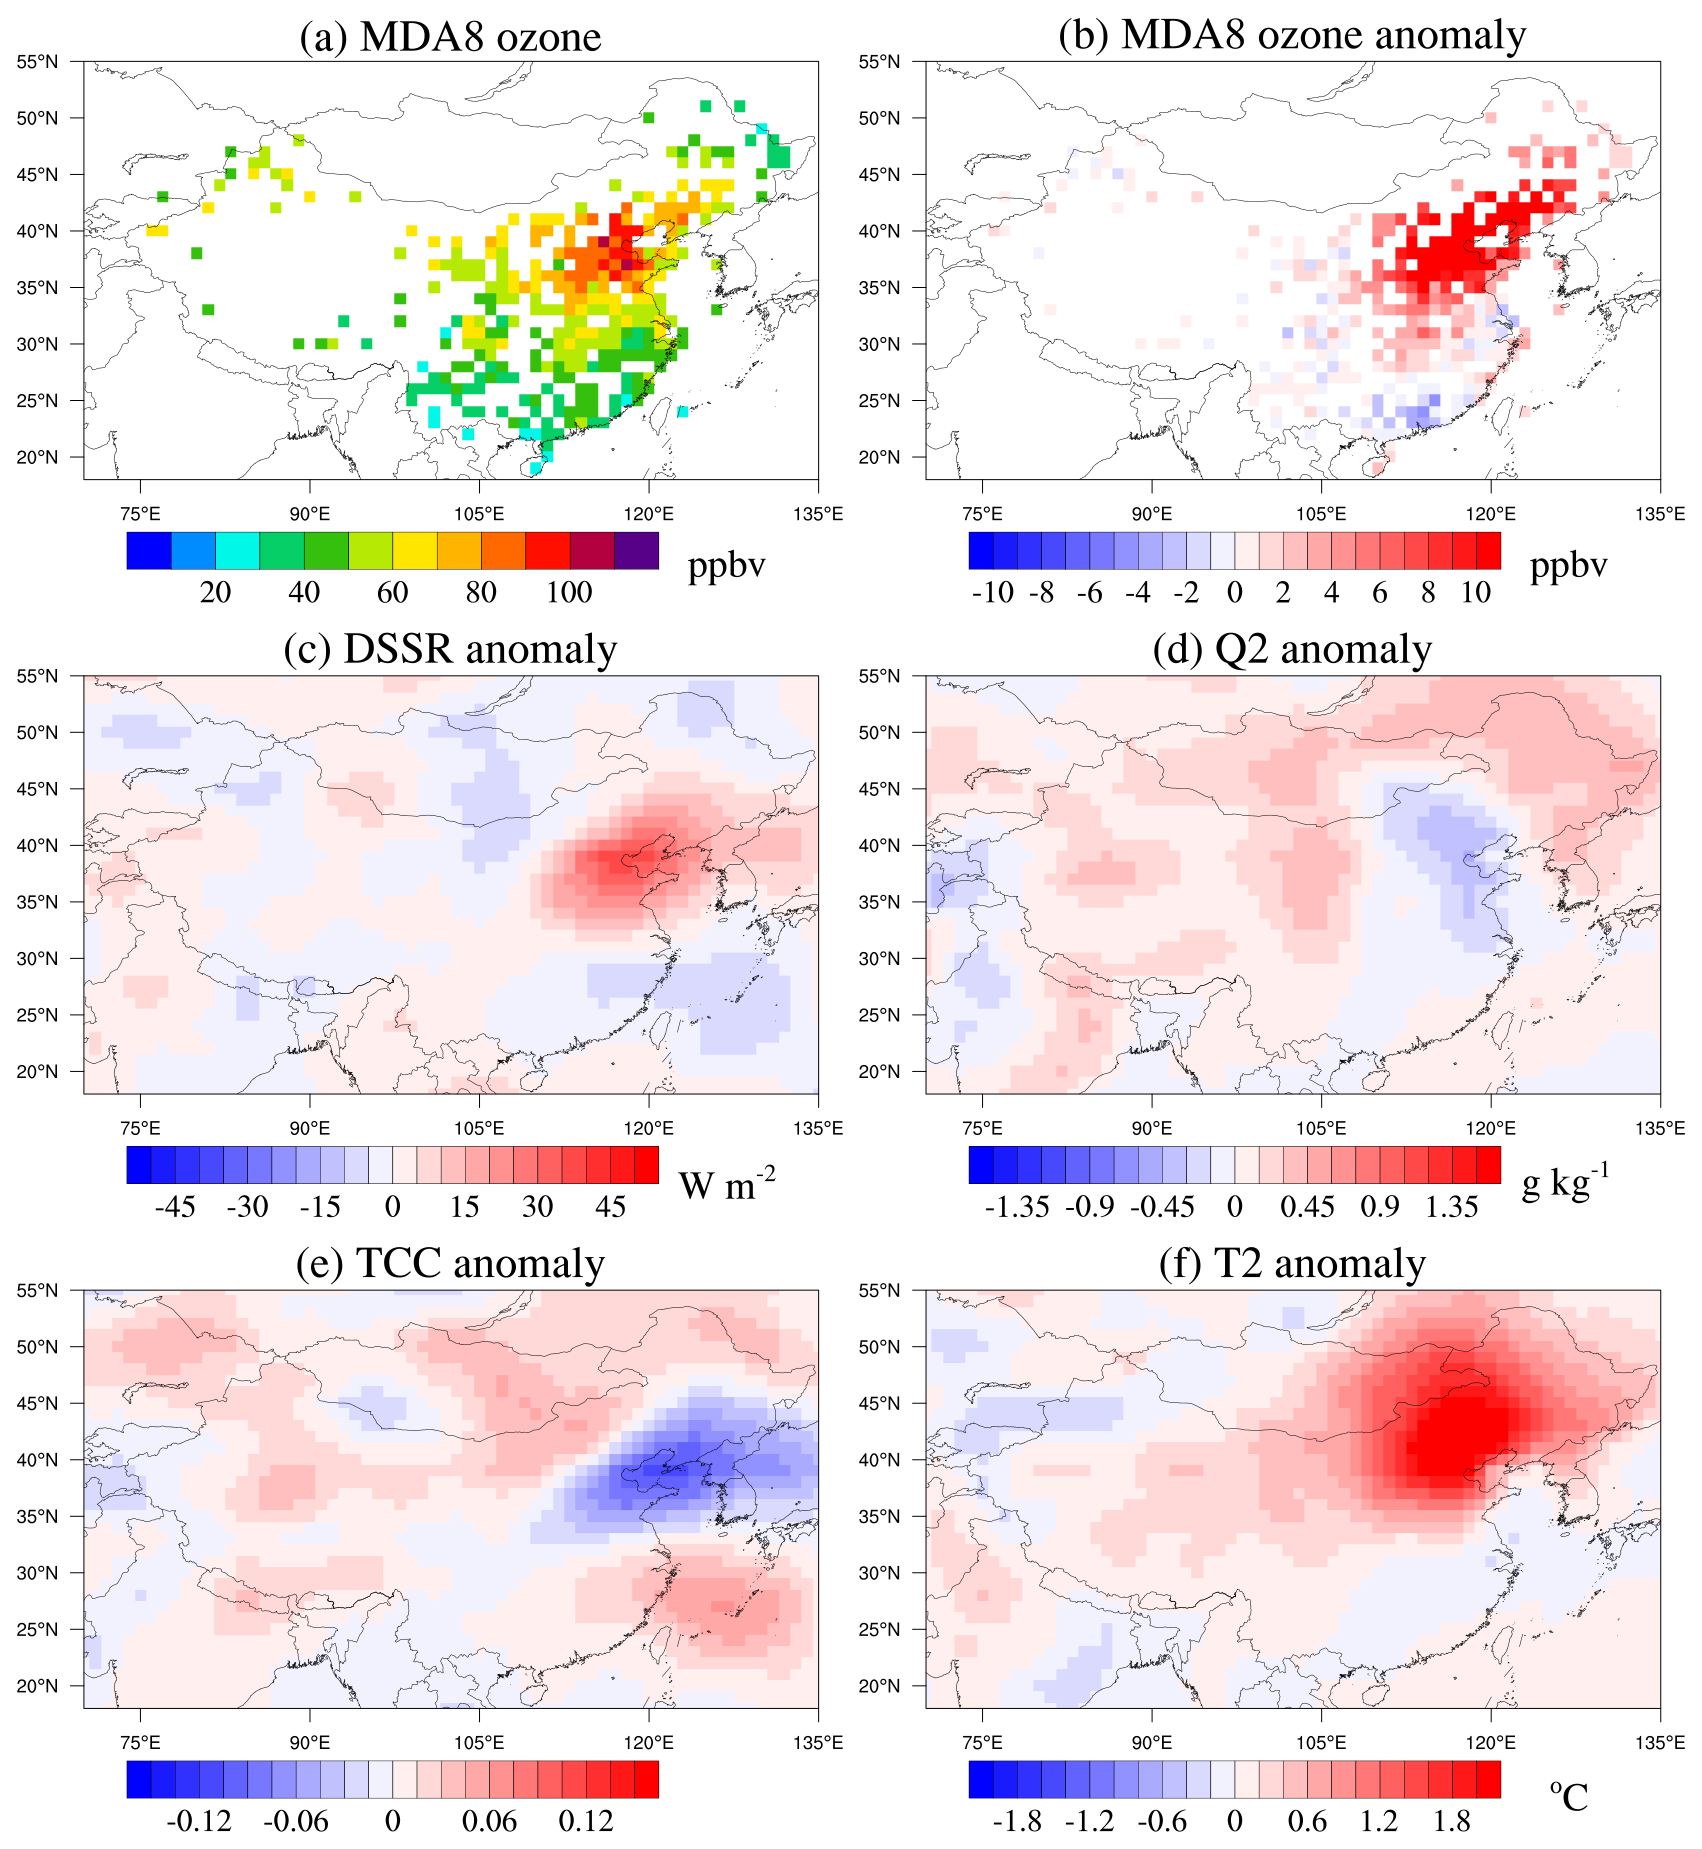
Figure 5Spatial distributions of ozone and meteorological conditions during ozone pollution events in North China. Shown are composited results of (a) mean MDA8 ozone concentrations and anomalies of (b) MDA8 ozone, (c) downward surface solar radiation, (d) 2 m air temperature, (e) total cloud cover, and (f) 2 m specific humidity during the summers of 2015–2019.
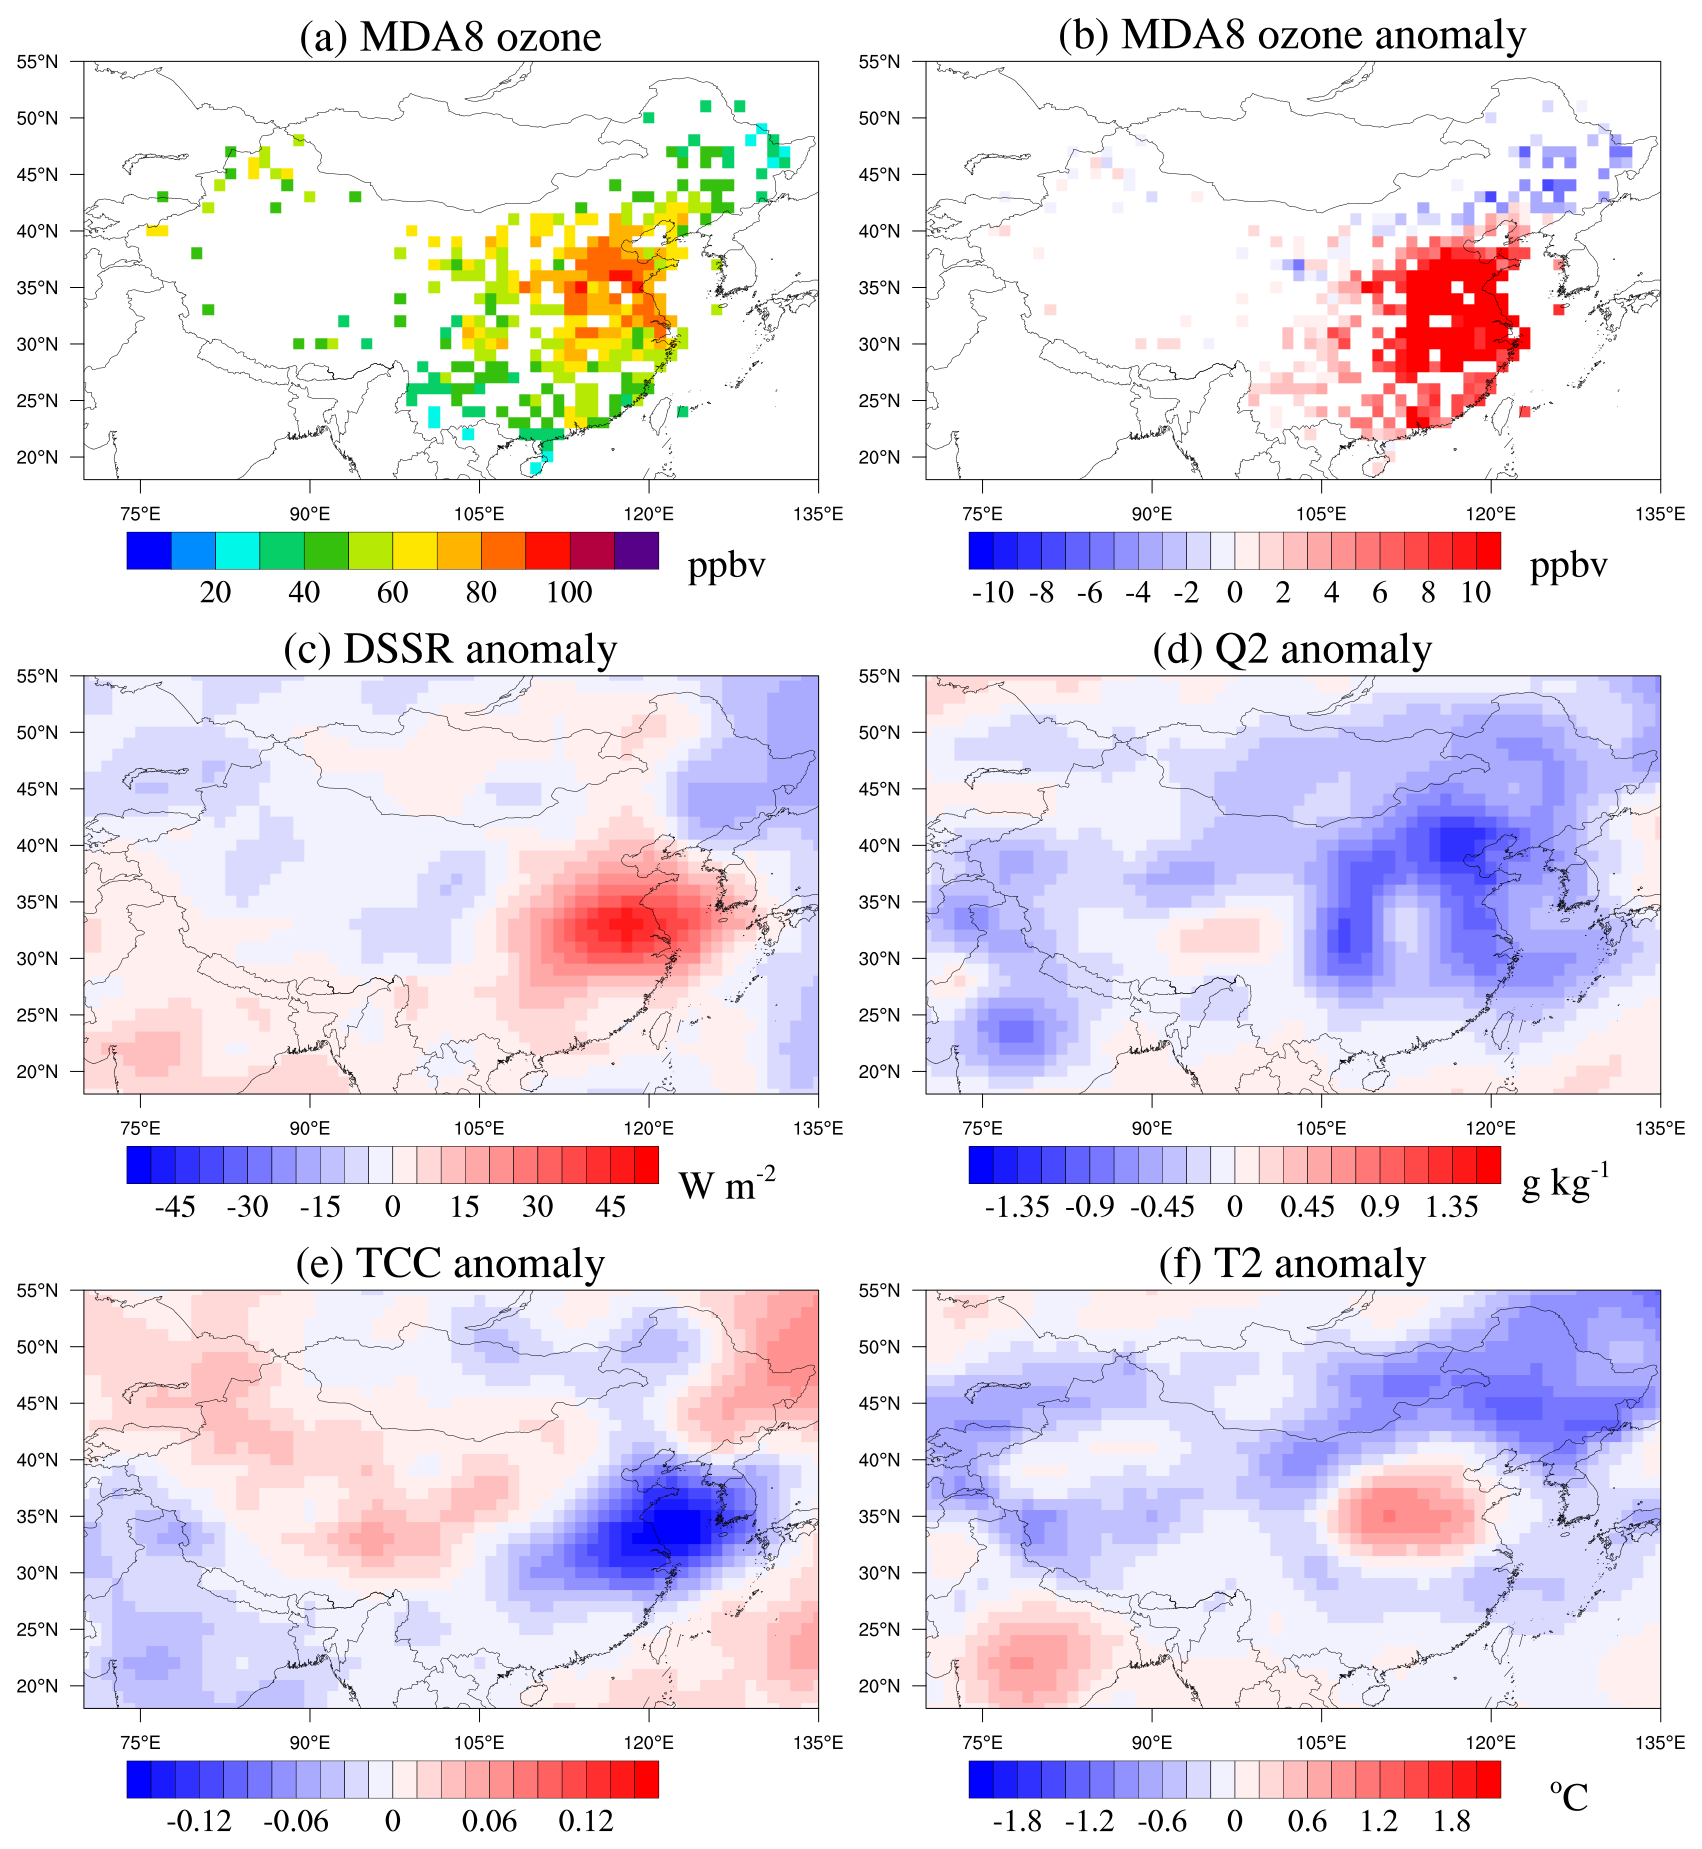
Figure 6Spatial distributions of ozone and meteorological conditions during ozone pollution events in central eastern China. Shown are composited results of (a) mean MDA8 ozone concentrations and anomalies of (b) MDA8 ozone, (c) downward surface solar radiation, (d) 2 m air temperature, (e) total cloud cover, and (f) 2 m specific humidity during the summers of 2015–2019.
During regional ozone pollution events, concurrent meteorological conditions typically feature higher downward surface solar radiation, 2 m air temperatures, reduced water vapor, and decreased total cloud cover, all of which favored ozone accumulation. Meteorological anomalies for each day are computed relative to their respective months, with the study testing four different methods for deriving climatology, including averages from the same day, same month, summer periods from 2015–2019, and summers from 1990–2019. They all yield comparable results. Analyzing atmospheric blocking, we find that 43 % (56 events) of regional ozone pollution events in North China and 48 % (43 events) in central eastern China are accompanied by blocking. Notably, among the 36 events where ozone pollution concurrently affected both North China and central eastern China, nearly 40 % are associated with blocking events.
The impact of blocking events on downstream meteorological conditions and ozone pollution is examined, primarily based on Rossby wave propagation, which profoundly affects large-scale circulations. For example, Ding and Li (2017) analyzed reanalysis data from 1951–2015 and found that Rossby waves originating from northwestern Europe entered the North Africa–Asia westerly jet in the upper troposphere, propagating eastward along the subtropical westerly jet. This circulation favored persistent heavy rainfall events in southern China (20–30° N). Liu et al. (2022) studied data from 1979–2020 and observed positive anomalies in summer shortwave cloud radiative effects over northern Russia, promoting the generation of Ural blocking. This blocking dynamically triggered a positive Eurasian pattern characterized by a wave train, resulting in positive precipitation anomalies in North China and strong heat waves in southern China. In addition to northwestern Europe and northern Russia, blocking also occurs over northeastern Russia. This, combined with the land–sea temperature contrast between warm northeastern Eurasia and the colder Oyashio region in the North Pacific, may induce a north- to south-tilting anticyclone, leading to increased temperatures across a wide area of China (Amano et al., 2023).
Blocking events are categorized into Euro-Atlantic, northern Russia, and North Pacific regions (Fig. 7), based on their geographical locations. Analysis of NCEP reanalysis data during the summers of 2015–2019 identified a total of 227 blocking days in the Northern Hemisphere, with approximately 50 % occurrence. Of these, 60 d occurred over the Euro-Atlantic sector, 68 d over northern Russia, and 162 d over the North Pacific. The higher frequency of blocking in the North Pacific is partly due to conducive conditions in northeastern Russia and Alaska. Notably, the sum of blocking events across these regions exceeds the total for the Northern Hemisphere, owing to concurrent events in multiple areas. High blocking frequency has previously been reported (Lupo, 2021), indicating climatologically in the Northern Hemisphere there are 30–35 blocking events per year with a mean duration of 9 d. This occurrence rate is higher than in our study, partly due to the larger frequency in winter and fall compared to summer.
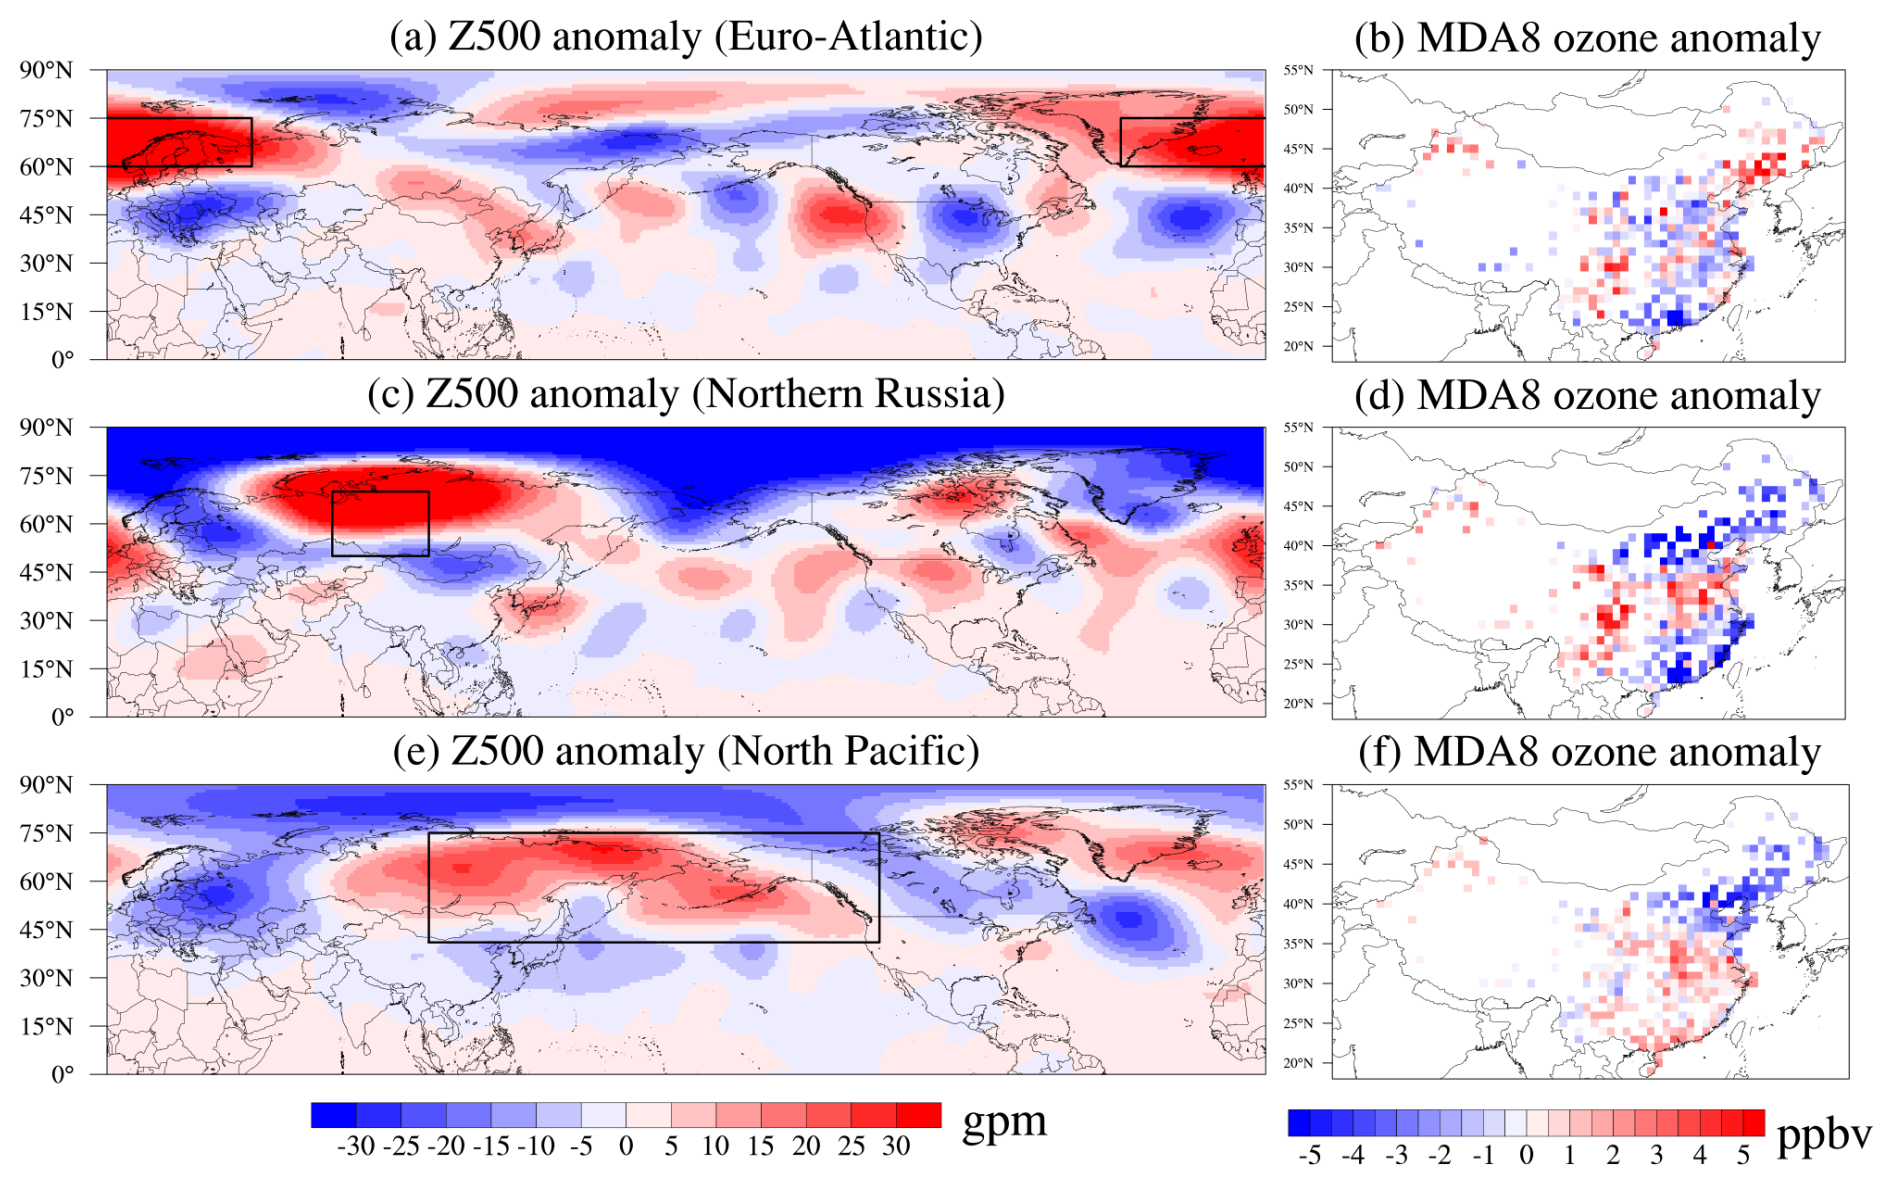
Figure 7Spatial distributions of anomalies in 500 hPa geopotential height (gpm) and ozone. Shown are composited results during blocking events over the Euro-Atlantic sector (a, b), northern Russia (c, d), and the North Pacific (e, f), indicated by the black square.
Anomalies of 500 hPa geopotential height from reanalysis data and MDA8 ozone from observations during composite blocking events over Euro-Atlantic, northern Russia, and North Pacific are depicted in Fig. 7. These illustrations highlight the characteristics of Rossby wave propagation and the corresponding variations in ozone. For instance, when blocking occurs over the Euro-Atlantic (top of Fig. 7), it coincides with anomalously high pressure, triggering a wave number of 5 and resulting in high pressure over northern China. This configuration leads to high ozone anomalies over northeastern China, with scattered spots of high ozone anomalies over parts of North China and central eastern China. When blocking shifts eastward to northern Russia (middle row in Fig. 7), a positive Eurasian pattern emerges with a wave train. This pattern manifests in negative anomalies in the northern flank of China and positive pressure anomalies in central to southern eastern China, South Korea, and southern Japan. During blocking over the North Pacific, spanning northeastern Russia and Alaska (Fig. 7e), broad positive anomalies are observed in southern China. However, notable anomalies of 500 hPa geopotential height are absent in southern China, and positive high pressure is not always present during ozone pollution events (Yang et al., 2024).
To further elucidate the pathway of Rossby wave propagation, we focus on a typical blocking event from 27 June to 4 July 2019. During this period, a blocking high is situated over northern Russia and the eastern flank of the Ural Mountains (Fig. 8a). Coincidentally, another blocking event (29 June–4 July 2019) occurs over the North Pacific near Alaska. Regions with convergence of wave activity flux indicate weakened westerlies, suggesting an incoming wave train and accumulation of wave activity in these areas. This accumulation could further amplify the blocking high (Nakamura et al., 1997; Schneidereit et al., 2012), serving as a source region for Rossby wave propagation.
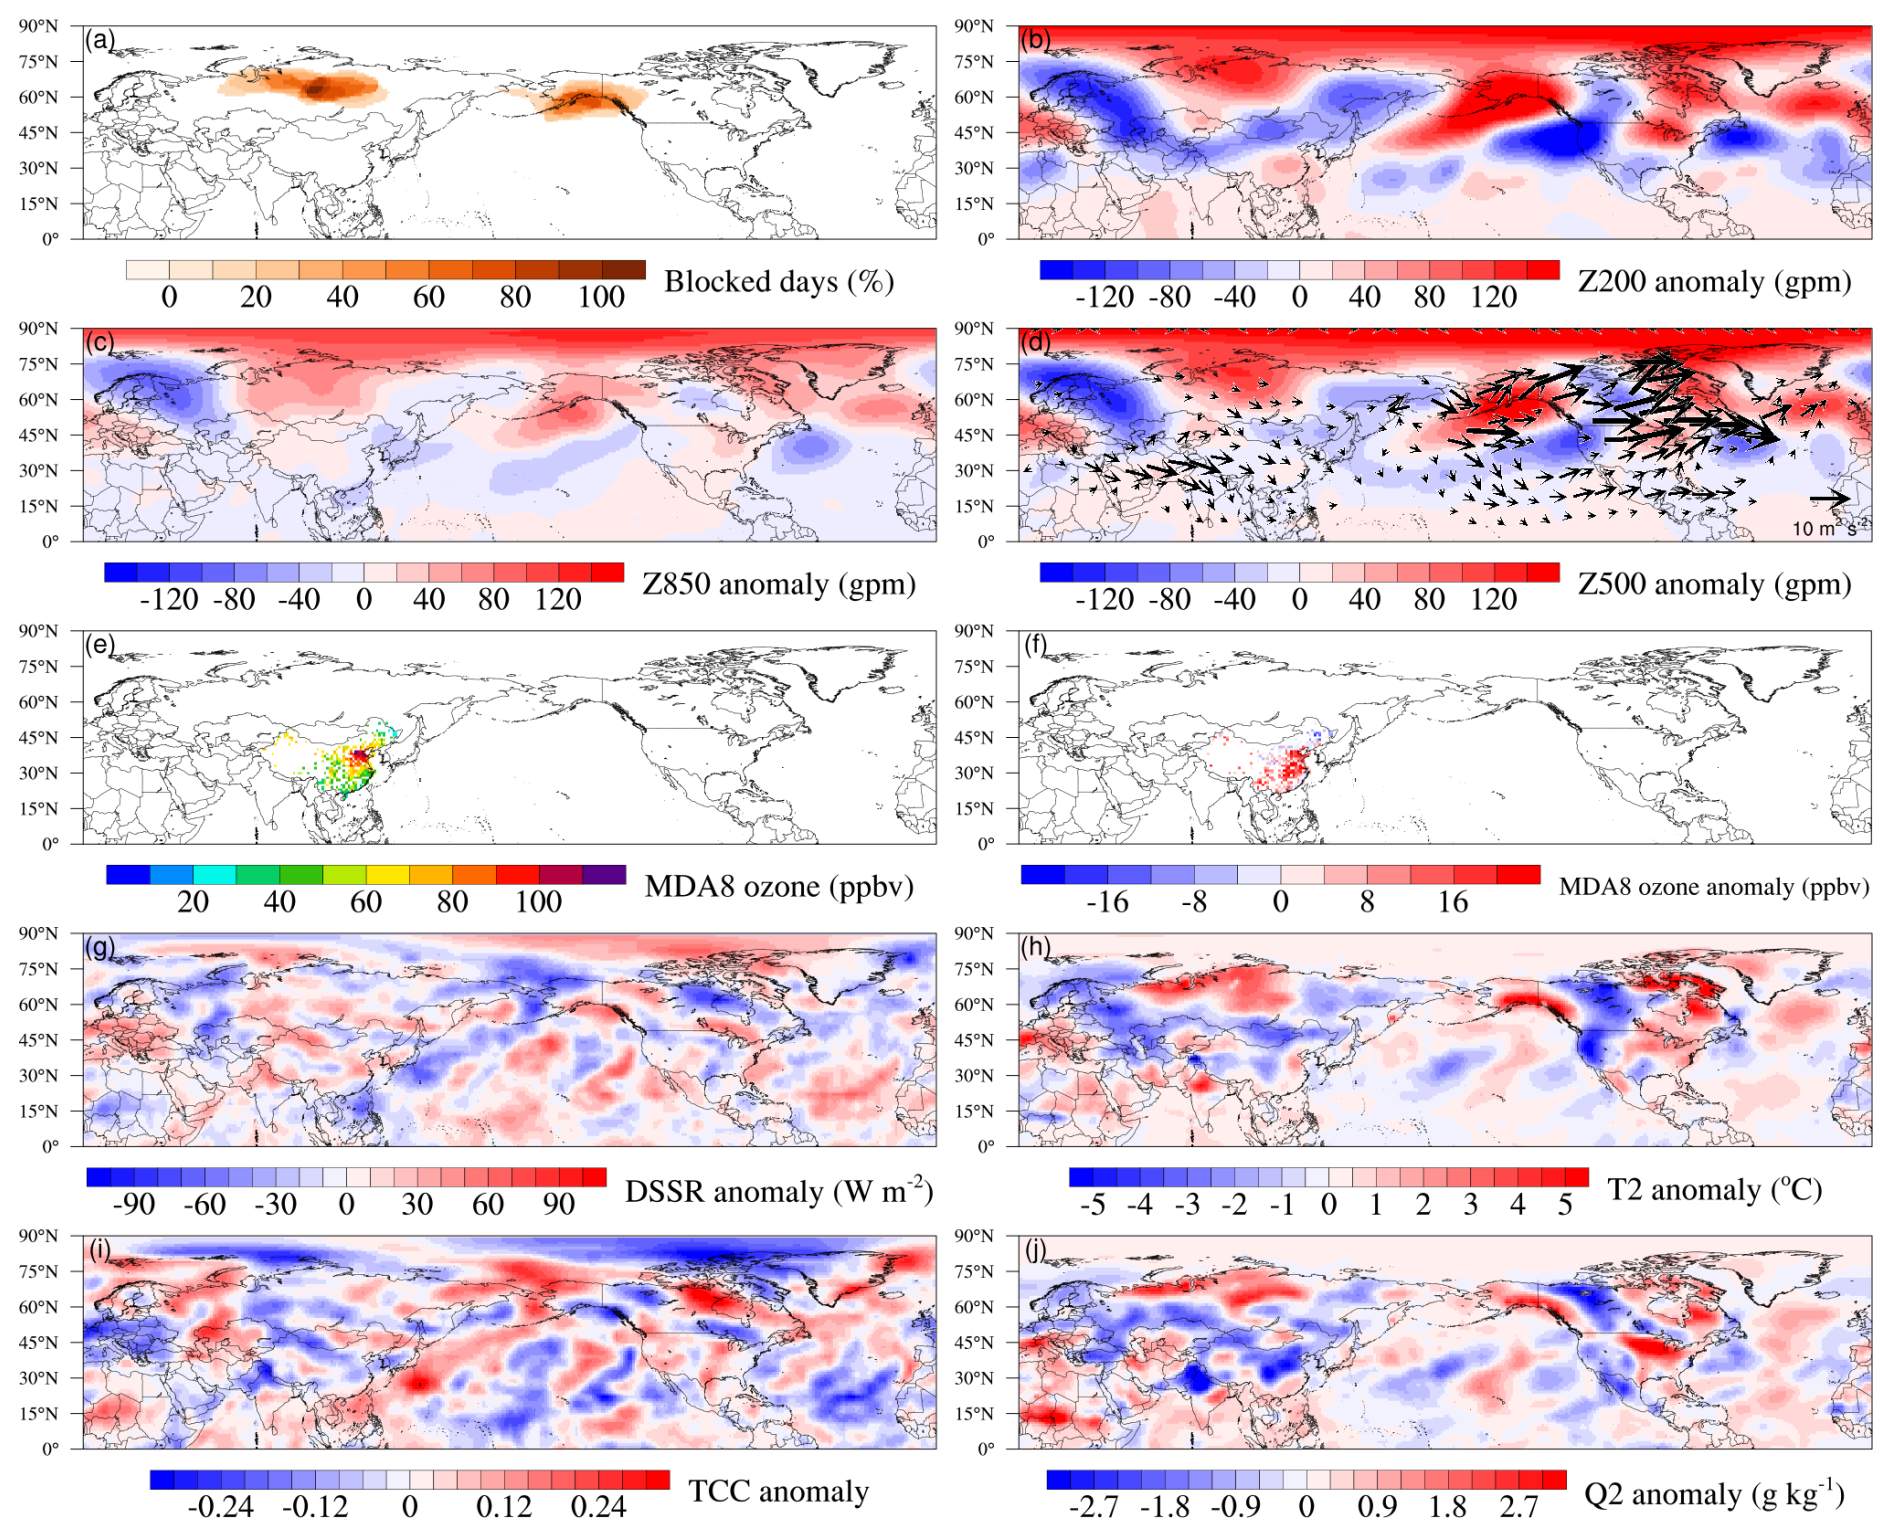
Figure 8Spatial distribution of blocking, ozone, and geopotential height. Shown are results of anomalies of geopotential height at (b), 200 hPa, (c) 850 hPa, and (d) 500 hPa; (e) ozone concentrations; and anomalies of (f) ozone, (g), DSSR, (h) 2 m air temperature, (i) total cloud cover, and (j) 2 m specific humidity. The results are composited during a specific blocking event over northern Russia.
A strong high-pressure system over northern Russia (Fig. 8a), propagating southeastward (arrows in Fig. 8d), can be seen. This propagation stimulates positive height anomalies over central eastern China, evident in both the upper (200 hPa; Fig. 8b) and the middle troposphere (500 hPa; Fig. 8d), with a weaker signal observed at the lower troposphere (850 hPa; Fig. 8c), indicating a barotropic structure (Barriopedro et al., 2006; Sui et al., 2022). The blocking events over northern Russia may originate from the North Atlantic, as indicated by Liu et al. (2022). This is suggested by the presence of a positive geopotential height anomaly over the northern North Atlantic, which then propagates northeastward towards northern Europe and Russia. This pattern resembles the Rossby wave train with a zonal wavenumber of 5, as described in Xu et al. (2019). It originates west of the British Isles and propagates towards Lake Baikal, simulating a high-pressure system on the southern flank of China. The blocking over Alaska serves as another source of Rossby waves, propagating eastward towards the Atlantic and triggering another pathway through the Mediterranean Sea along the subtropical jet. This process further enhances high-pressure anomalies over central eastern China (Fig. 8d).
Modulated by this large-scale circulation, there is an increase in downward surface solar radiation, 2 m air temperature, reduced water vapor, and total cloud cover over areas spanning 25 to 40° N (Fig. 8g–j). These conditions contribute to widespread ozone increases in this region, extending slightly into North China and southern China (Fig. 8e, f). Comparably, when atmospheric blocking occurs over the Euro-Atlantic region, a Rossby wave propagates southeastward from the northern Atlantic. This triggers high-pressure anomalies in North China and central eastern China, creating meteorological conditions that favor anomalously high ozone concentrations (20–24 July 2017, Fig. S6). Additionally, a concurrent blocking event over the North Pacific initiates another Rossby wave propagation, which converges with the Rossby wave originating from the Euro-Atlantic blocking. This convergence reinforces the eastward propagation of the Rossby wave.
Next, we explore how atmospheric blocking influences ozone through the effect of BVOC emissions. In a previous study, significant improvements in summer blocking simulations were achieved by increasing horizontal resolution in an Earth system model with coupled atmosphere and ocean components (Gao et al., 2025a). Driven by the prescribed SST, high-resolution simulations have shown enhanced blocking frequencies, particularly over the Ural Mountains and North Pacific (Fig. S7). Therefore, the analysis below is based solely on SW-HRESM.
We composite blocking events occurring over the Euro-Atlantic sector (100 d), northern Russia (47 d), and the North Pacific (119 d), and the spatial distribution of ozone concentrations is shown in Fig. 9. The probability distribution function of ozone concentrations is shown in Fig. 10. Several distinctive features emerge. During non-blocking periods (Fig. S8a; Fig. 10), the mean ozone concentrations over North China are slightly higher (66.3 ppbv) than in central eastern China (63.3 ppbv). Among all three blocking categories, ozone concentrations over central eastern China tend to increase to a larger extent compared to North China, resulting in comparable or higher ozone concentration in central eastern China relative to North China (Fig. 9d, e, f). Specifically, blocking triggers ozone increases of 10.7, 7.1, and 5.9 ppbv when blocking occurs in the Euro-Atlantic, northern Russia, and North Pacific sectors, respectively, compared to values of 4.9, 4.2, and 2.1 ppbv in North China (Fig. 10). When blocking occurs in northern Russia and the North Pacific, the effect can extend further south from central to southeastern China. Accompanied by the blocking, an increase in downward surface solar radiation and 2 m air temperature, along with reduced water vapor and total cloud cover, emerges primarily over North China and central eastern China (Fig. S9). Despite slight differences, this feature is consistent with the observed patterns (Fig. 7b, d, f).
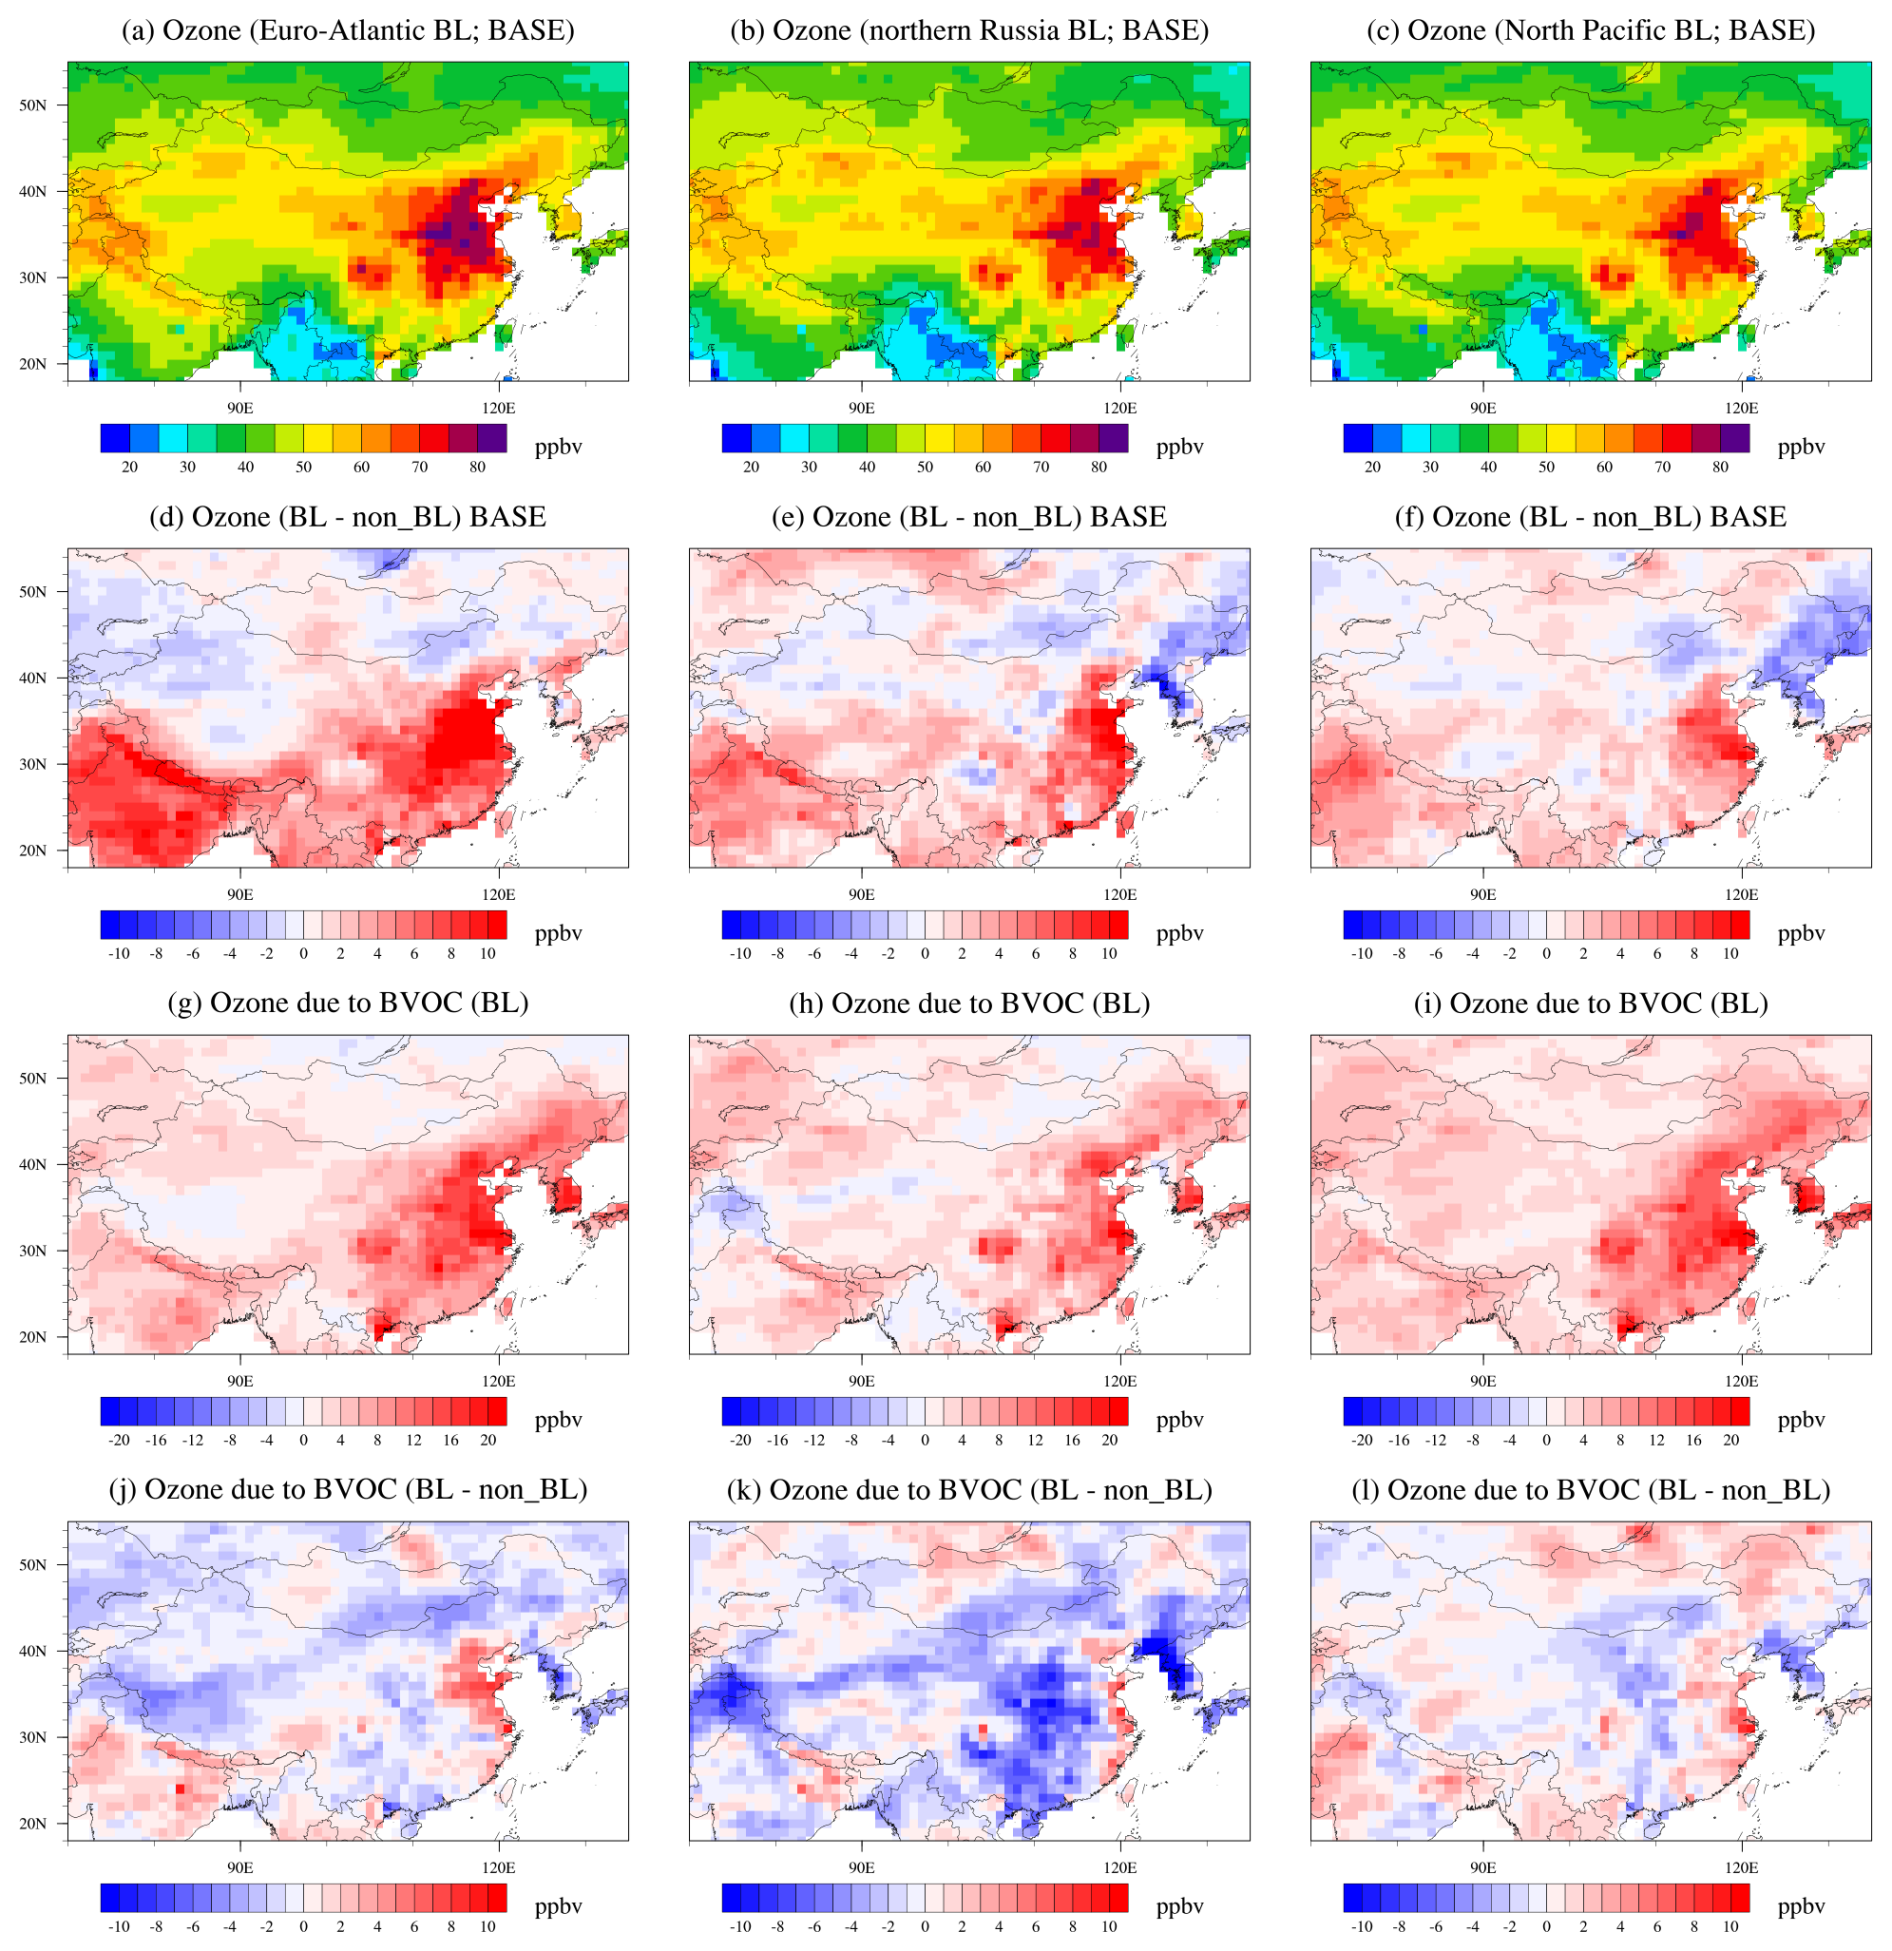
Figure 9Spatial distributions of ozone concentrations. Shown are results during blocking over the Euro-Atlantic (left column), northern Russia (middle column), and North Pacific (right column) regions for (a, b, c) the base case, (d, e, f) ozone difference between blocking and non-blocking, (g, h, i) effect of BVOC emissions, and (j, k, l) differences in effects of BVOC emissions on ozone between blocking and non-blocking.
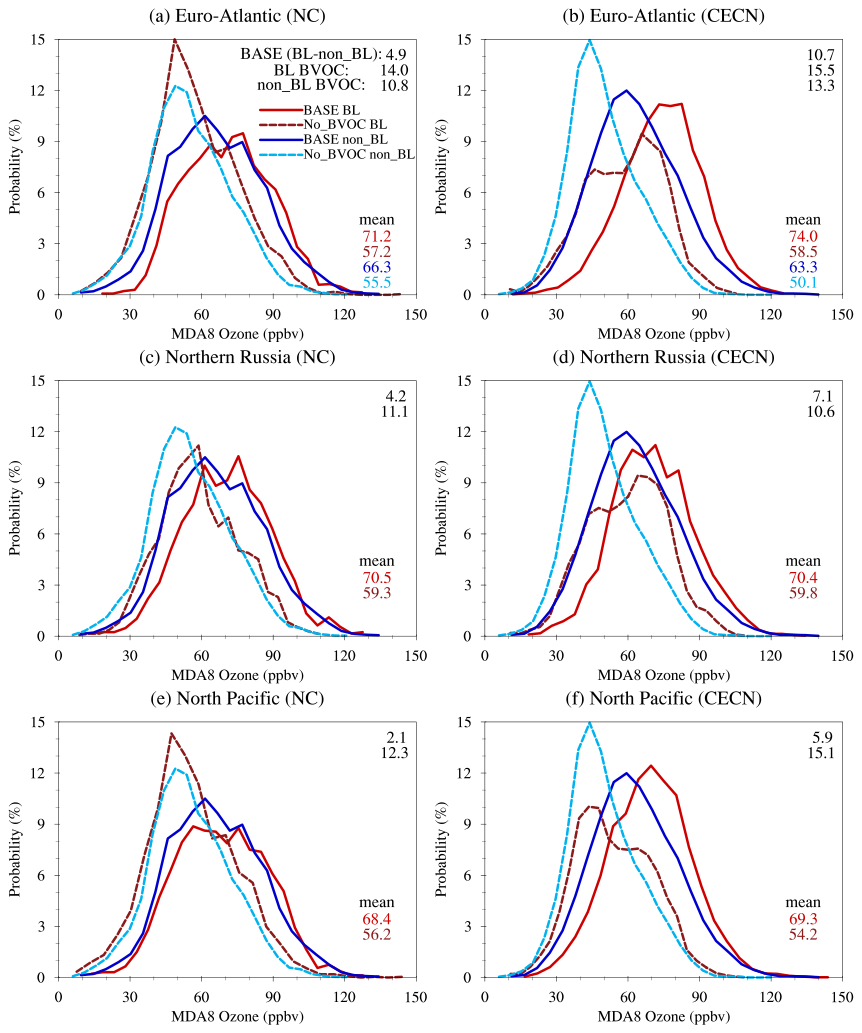
Figure 10Probability distribution function of MDA8 ozone concentrations. Shown are results over North China (NC; left column) and central eastern China (CECN; right column) during blocking events that occurred in the Euro-Atlantic sector (a, b), northern Russia (c, d), and the North Pacific (e, f). The numbers on the top right of each panel represent the MDA8 ozone enhancement between blocking and non-blocking (BASE (BL-non_BL)) and the effect of BVOC emissions during blocking (BL BVOC) and non-blocking (non_BL BVOC). The numbers on the bottom right of each panel show the mean MDA8 ozone concentrations during blocking (in red) and non-blocking (in blue) for the base scenario and the case without BVOC emissions. Since ozone values in the non-blocking case are the same no matter where the blocking is, values for the non-blocking case are only listed on the top row. The solid and dashed blue lines are the same between the middle and bottom rows and the top row.
BVOC emissions play important roles in modulating ozone concentrations. When the blocking occurs, the effects of BVOC emissions on ozone concentrations range from 10.6 to 15.5 ppbv over North China and central eastern China (Figs. 9g, h, i, 10), with the largest effect when blocking occurs over the Euro-Atlantic sector. Consistent with the previous discussion on heat waves (Sect. 3.3), BVOC emissions play a role even in the absence of blocking (Fig. S8b), with effects of 10.8 ppbv over North China and 13.3 ppbv over central eastern China. The effect of BVOC emission on ozone during blocking is larger than during non-blocking for most cases, except over central eastern China during blocking in northern Russia, which is visible when blocking is compared to a lower temperature range (i.e., < 26°; Fig. S10). Overall, the incremental effect of BVOC emissions on ozone during blocking, similar to that defined in Sect. 3.3, is calculated, and it could reach as much as 65 % of the ozone increase during blocking in North China and 31 % of the ozone increase during blocking in central eastern China (Fig. 9j, k, l vs. Figs. 9g, h, i, 10).
Through the combination of high-resolution Earth system models and observations, the effects of local meteorology and large-scale circulation on ozone concentrations are elucidated. Based on observations and focusing on eastern China, we identify that ozone pollution events are accompanied by anomalously high near-surface air temperature, increased downward surface solar radiation, reduced water vapor, and decreased total cloud cover. We further find that blocking events over the Euro-Atlantic sector, northern Russia, and the North Pacific behave differently in modulating ozone pollution in eastern China, controlled by the pathways of Rossby wave propagation. While blocking in all three regions plays the most significant role in central eastern China, blocking over northern Russia and the North Pacific may also impact the southern part of China. Over the North Pacific, the large high-pressure system seems to form a saddle-like structure, affecting widespread areas in southern China.
Moreover, blocking events could substantially trigger BVOC emission increases and aggravate ozone pollution. Numerical experiments reveal that under favorable meteorological conditions, such as heat waves, BVOC emissions could play an even larger role in triggering ozone increases, particularly in areas with lower anthropogenic emissions. This highlights a potentially more critical role for BVOC emissions, especially when anthropogenic emissions are projected to decrease. This is the first attempt to link atmospheric blocking, BVOC emissions, and ozone pollution, which has important implications for future studies, particularly those associated with the mechanisms of how large-scale circulations affect ozone concentrations under a warming climate.
Our findings are subject to some uncertainties and limitations. In this study, the contribution of BVOC to ozone is not necessarily limited to VOC-limited regions but rather results from a combination of various effects. In VOC-limited regions, the increase in BVOCs has a clear promoting effect on ozone formation. Even in NOx-limited regions or areas with low BVOC emissions, the positive role of BVOCs in ozone formation can still be observed, with one of the key reasons being the influence of atmospheric transport. In one of our previous studies (Wang et al., 2022), taking Shandong Province as an example, we found that although BVOC emissions in Shandong were relatively low, the impact of BVOCs on ozone levels in the province could exceed 10 ppbv. Sensitivity numerical experiments revealed that biogenic emissions from southern China led to an increase in ozone, which was subsequently transported northeastward, contributing to the elevated ozone concentrations in Shandong.
In addition to the traditional VOC-limited and NOx-limited regimes, the inhibition effect of aerosol uptake on ozone production is also an important influencing factor (Kanaya et al., 2009; Li et al., 2019). In urban areas with relatively sufficient NOx but insufficient VOCs, the reaction between VOCs and OH generally has a greater impact on ozone than the effect of aerosol uptake (Song et al., 2020; Tang et al., 2017). In regions with relatively insufficient NOx and heavy pollution, such as parts of eastern China, the aerosol uptake of HO2 may also become the dominant mechanism driving changes in ozone concentration (Ivatt et al., 2022). With future reductions in air pollution, the aerosol HO2 uptake effect may weaken, which could, in turn, promote an increase in ozone. The impact of BVOCs on ozone in this study can be interpreted as the impact of ozone precursors such as VOCs and NOx on ozone, as well as the effect of aerosol uptake. Future research could further explore isolating the impact of HO2 aerosol uptake on ozone, which would help enhance the understanding of the mechanisms and sources of BVOC effects on ozone. Meanwhile, future ozone pollution management needs to consider both the emission of ozone precursors and the potential weakening effect of aerosol reductions.
Using high-resolution models can better distinguish the spatial heterogeneity in BVOC emissions, thereby facilitating the evaluation of their impact on atmospheric pollutants. The differences in BVOC emissions between the high-resolution and low-resolution models in this study arise from both resolution differences and meteorological variations. This study has not separated these factors, and further investigation is needed to understand the effects caused solely by changes in resolution.
Considering that halogens play an important role in affecting tropospheric ozone concentrations, we have conducted preliminary tests using Community Earth System Model (CESM) version 2.2, referencing relevant studies (e.g., Badia et al., 2021; Li et al., 2022; Saiz-Lopez et al., 2023). The atmospheric and land components are CAM6 and CLM5, respectively. The ocean and sea ice data are prescribed from the merged Hadley–NOAA/OI sea surface temperature and sea ice concentration dataset (Hurrell et al., 2008). To improve the accuracy of meteorological simulations, we applied the nudging method. The reanalysis data used are the 6-hourly reanalysis dataset from the Modern-Era Retrospective Analysis for Research and Applications, version 2 (MERRA-2). The variables nudged include air temperature, eastward wind, and northward wind. We selected the period from January to December 2019 as the study period (with a spin-up time of 6 months). The model was configured with low-resolution (∼ 1°) simulations. The emissions are based on the Community Emissions Data System (CEDS) emission dataset under the SSP370 scenario, and two sets of numerical simulations were conducted: one without complex halogen chemistry and the other with complex halogen chemistry included (details on halogen reactions in Saiz-Lopez et al., 2023).
Figure S11 shows that compared to the case without halogen chemistry, the inclusion of halogen chemistry substantially reduces the simulated ozone concentrations for the US, Europe, and eastern China. Relative to the observations, when examining this single year of simulation, the average bias is reduced from 10 % (7 %–13 % for the three regions) to 3 % (2 %–6 % for the three regions). Most of the improvement occurs in winter, spring, and fall, while changes during summer are relatively smaller.
However, note that this is only a 1-year simulation, and more future work is needed to fully examine the effectiveness of halogen chemistry on ozone. For instance, useful tests include, firstly, simulations across multiple years instead of only 1 year. Secondly, it is useful to conduct high-resolution Earth system simulations (e.g., 25 km) to take advantage of finer-resolution emissions and the spatial heterogeneities in emissions. Thirdly, this study primarily focuses on large regional scales; future evaluations can further assess simulations over smaller regions and specific ozone pollution episodes.
The above tests were conducted for Cl, Br, and I. In the future, individual halogens, such as iodine, could be tested separately. Iodine serves as an important ozone sink (Alicke et al., 1999; Pound et al., 2023; Saiz-Lopez et al., 2012; Sherwen et al., 2016). Based on Sherwen et al. (2016), the impact of iodine on ozone is primarily observed over tropical oceans, with relatively limited effects on near-surface ozone. More information can be investigated in future studies.
The simulation data used in this study are available upon request to the corresponding author.
The supplement related to this article is available online at https://doi.org/10.5194/acp-25-3029-2025-supplement.
YG conceived the project and designed the method; WK performed the analysis and drafted the paper; XG and XA helped with the analysis; DT, WL, MC, XG, SZ, HG, and LW helped with the interpretation of the results. All authors contributed to the writing of the paper.
The contact author has declared that none of the authors has any competing interests.
Publisher's note: Copernicus Publications remains neutral with regard to jurisdictional claims made in the text, published maps, institutional affiliations, or any other geographical representation in this paper. While Copernicus Publications makes every effort to include appropriate place names, the final responsibility lies with the authors.
This work was supported by the National Natural Science Foundation of China (42122039, 42375189), the Science and Technology Innovation Project of Laoshan Laboratory (LSKJ202300401, LSKJ202202201), and the Hainan Provincial Joint Project of Sanya Yazhou Bay Science and Technology City (2021JJLH0050).
This research has been supported by the National Natural Science Foundation of China (grant nos. 42122039 and 42375189).
This paper was edited by Dantong Liu and reviewed by three anonymous referees.
Alicke, B., Hebestreit, K., Stutz, J., and Platt, U.: Iodine oxide in the marine boundary layer, Nature, 397, 572–573, https://doi.org/10.1038/17508, 1999.
Amano, M., Tachibana, Y., and Ando, Y.: Consideration of whether a climatic regime shift has prevented the occurrence of a cold summer in northeast Eurasia since 2010, J. Clim., 36, 8059–8071, https://doi.org/10.1175/jcli-d-23-0191.1, 2023.
Badia, A., Iglesias-Suarez, F., Fernandez, R. P., Cuevas, C. A., Kinnison, D. E., Lamarque, J.-F., Griffiths, P. T., Tarasick, D. W., Liu, J., and Saiz-Lopez, A.: The Role of Natural Halogens in Global Tropospheric Ozone Chemistry and Budget Under Different 21st Century Climate Scenarios, J. Geophys. Res.-Atmos., 126, e2021JD034859, https://doi.org/10.1029/2021JD034859, 2021.
Barnes, E. A. and Fiore, A. M.: Surface ozone variability and the jet position: Implications for projecting future air quality, Geophys. Res. Lett., 40, 2839–2844, https://doi.org/10.1002/grl.50411, 2013.
Barriopedro, D., García-Herrera, R., Lupo, A. R., and Hernández, E.: A Climatology of Northern Hemisphere Blocking, J. Clim., 19, 1042–1063, https://doi.org/10.1175/JCLI3678.1, 2006.
Barriopedro, D., Fischer, E. M., Luterbacher, J., Trigo, R., and Garcia-Herrera, R.: The Hot Summer of 2010: Redrawing the Temperature Record Map of Europe, Science, 332, 220–224, https://doi.org/10.1126/science.1201224, 2011.
Brauer, M., Casadei, B., Harrington, R. A., Kovacs, R., Sliwa, K., and Grp, W. A. P. E.: Taking a stand against air pollution – the impact on cardiovascular disease, Eur. Heart J., 42, 1460–1463, https://doi.org/10.1093/eurheartj/ehaa1025, 2021.
Cattiaux, J., Vautard, R., Cassou, C., Yiou, P., Masson-Delmotte, V., and Codron, F.: Winter 2010 in Europe: A cold extreme in a warming climate, Geophys. Res. Lett., 37, L20704, https://doi.org/10.1029/2010gl044613, 2010.
Chang, P., Zhang, S., Danabasoglu, G., Yeager, S. G., Fu, H., Wang, H., Castruccio, F. S., Chen, Y., Edwards, J., Fu, D., Jia, Y., Laurindo, L. C., Liu, X., Rosenbloom, N., Small, R. J., Xu, G., Zeng, Y., Zhang, Q., Bacmeister, J., Bailey, D. A., Duan, X., DuVivier, A. K., Li, D., Li, Y., Neale, R., Stössel, A., Wang, L., Zhuang, Y., Baker, A., Bates, S., Dennis, J., Diao, X., Gan, B., Gopal, A., Jia, D., Jing, Z., Ma, X., Saravanan, R., Strand, W. G., Tao, J., Yang, H., Wang, X., Wei, Z., and Wu, L.: An Unprecedented Set of High-Resolution Earth System Simulations for Understanding Multiscale Interactions in Climate Variability and Change, J. Adv. Model. Earth Syst., 12, e2020MS002298, https://doi.org/10.1029/2020MS002298, 2020.
Christoudias, T., Pozzer, A., and Lelieveld, J.: Influence of the North Atlantic Oscillation on air pollution transport, Atmos. Chem. Phys., 12, 869–877, https://doi.org/10.5194/acp-12-869-2012, 2012.
Churkina, G., Kuik, F., Bonn, B., Lauer, A., Grote, R., Tomiak, K., and Butler, T. M.: Effect of VOC Emissions from Vegetation on Air Quality in Berlin during a Heatwave, Environ. Sci. Technol., 51, 6120–6130, https://doi.org/10.1021/acs.est.6b06514, 2017.
Clifton, O. E., Fiore, A. M., Massman, W. J., Baublitz, C. B., Coyle, M., Emberson, L., Fares, S., Farmer, D. K., Gentine, P., Gerosa, G., Guenther, A. B., Helmig, D., Lombardozzi, D. L., Munger, J. W., Patton, E. G., Pusede, S. E., Schwede, D. B., Silva, S. J., Sörgel, M., Steiner, A. L., and Tai, A. P. K.: Dry Deposition of Ozone Over Land: Processes, Measurement, and Modeling, Rev. Geophys., 58, e2019RG000670, https://doi.org/10.1029/2019RG000670, 2020.
Deitrick, R. and Goldblatt, C.: Effects of ozone levels on climate through Earth history, Clim. Past., 19, 1201–1218, https://doi.org/10.5194/cp-19-1201-2023, 2023.
Dentener, F., Keating, T., and Akimoto, H.: Hemispheric transport of air pollution 2010, Part A Ozone and Particulate Matter, Air Pollution Studies No.17, United Nations, New York and Geneva, ISBN 978-92-1-117043-6, 2010.
Ding, F. and Li, C.: Subtropical westerly jet waveguide and winter persistent heavy rainfall in south China, J. Geophys. Res.-Atmos., 122, 7385–7400, https://doi.org/10.1002/2017JD026530, 2017.
Dunker, A. M., Koo, B., and Yarwood, G.: Contributions of foreign, domestic and natural emissions to US ozone estimated using the path-integral method in CAMx nested within GEOS-Chem, Atmos. Chem. Phys., 17, 12553–12571, https://doi.org/10.5194/acp-17-12553-2017, 2017.
Emberson, L. D., Pleijel, H., Ainsworth, E. A., van den Berg, M., Ren, W., Osborne, S., Mills, G., Pandey, D., Dentener, F., Büker, P., Ewert, F., Koeble, R., and Van Dingenen, R.: Ozone effects on crops and consideration in crop models, Eur. J. Agron., 100, 19–34, https://doi.org/10.1016/j.eja.2018.06.002, 2018.
Emmons, L. K., Schwantes, R. H., Orlando, J. J., Tyndall, G., Kinnison, D., Lamarque, J.-F., Marsh, D., Mills, M. J., Tilmes, S., Bardeen, C., Buchholz, R. R., Conley, A., Gettelman, A., Garcia, R., Simpson, I., Blake, D. R., Meinardi, S., and Pétron, G.: The Chemistry Mechanism in the Community Earth System Model Version 2 (CESM2), J. Adv. Model. Earth Syst., 12, e2019MS001882, https://doi.org/10.1029/2019MS001882, 2020.
Fu, T.-M. and Tian, H.: Climate Change Penalty to Ozone Air Quality: Review of Current Understandings and Knowledge Gaps, Curr. Pollut. Rep., 5, 159–171, https://doi.org/10.1007/s40726-019-00115-6, 2019.
Fuller, R., Landrigan, P. J., Balakrishnan, K., Bathan, G., Bose-O'Reilly, S., Brauer, M., Caravanos, J., Chiles, T., Cohen, A., Corra, L., Cropper, M., Ferraro, G., Hanna, J., Hanrahan, D., Hu, H., Hunter, D., Janata, G., Kupka, R., Lanphear, B., Lichtveld, M., Martin, K., Mustapha, A., Sanchez-Triana, E., Sandilya, K., Schaefli, L., Shaw, J., Seddon, J., Suk, W., Téllez-Rojo, M. M., and Yan, C. H.: Pollution and health: a progress update, Lancet Planet. Health, 6, E535–E547, https://doi.org/10.1016/S2542-5196(22)00090-0, 2022.
Gao, Y., Fu, J. S., Drake, J. B., Liu, Y., and Lamarque, J. F.: Projected changes of extreme weather events in the eastern United States based on a high resolution climate modeling system, Environ. Res. Lett., 7, 044025, https://doi.org/10.1088/1748-9326/7/4/044025, 2012.
Gao, Y., Zhang, J., Yan, F., Leung, L. R., Luo, K., Zhang, Y., and Bell, M. L.: Nonlinear effect of compound extreme weather events on ozone formation over the United States, Weather Clim. Extremes, 30, 100285, https://doi.org/10.1016/j.wace.2020.100285, 2020.
Gao, Y., Yan, F., Ma, M., Ding, A., Liao, H., Wang, S., Wang, X., Zhao, B., Cai, W., Su, H., Yao, X., and Gao, H.: Unveiling the dipole synergic effect of biogenic and anthropogenic emissions on ozone concentrations, Sci. Total Environ., 818, 151722, https://doi.org/10.1016/j.scitotenv.2021.151722, 2022.
Gao, Y., Wu, Y., Guo, X., Kou, W., Zhang, S., Leung, L. R., Chen, X., Lu, J., Diffenbaugh, N. S., Horton, D. E., Yao, X., Gao, H., and Wu, L.: More Frequent and Persistent Heatwaves Due To Increased Temperature Skewness Projected by a High-Resolution Earth System Model, Geophys. Res. Lett., 50, e2023GL105840, https://doi.org/10.1029/2023GL105840, 2023.
Gao, Y., Guo, X., Lu, J., Woolings, T., Chen, D., Guo, X., Kou, W., Zhang, S., Leung, L. R., Schiemann, R., O'Reilly, C., Guo, C., Li, J., Gao, H., and Wu, L.: Enhanced Simulation of Atmospheric Blocking in a High-Resolution Earth System Model: Projected Changes and Implications for Extreme Weather Events, J. Geophys. Res.-Atmos., 130, e2024JD042045, https://doi.org/10.1029/2024JD042045, 2025a.
Gao, Y., Kou, W., Cheng, W., Guo, X., Qu, B., Wu, Y., Zhang, S., Liao, H., Chen, D., Leung, L. R., Wild, O., Zhang, J., Lin, G., Su, H., Cheng, Y., Pöschl, U., Pozzer, A., Zhang, L., Lamarque, J.-F., Guenther, A. B., Brasseur, G., Liu, Z., Lu, H., Li, C., Zhao, B., Wang, S., Huang, X., Pan, J., Liu, G., Liu, X., Lin, H., Zhao, Y., Zhao, C., Meng, J., Yao, X., Gao, H., and Wu, L.: Reducing long-standing surface ozone overestimation in Earth system modeling by high-resolution simulation and dry deposition improvement, J. Adv. Model. Earth Syst., 17, e2023MS004192, https://doi.org/10.1029/2023MS004192, 2025b.
Gong, C. and Liao, H.: A typical weather pattern for ozone pollution events in North China, Atmos. Chem. Phys., 19, 13725–13740, https://doi.org/10.5194/acp-19-13725-2019, 2019.
Gong, C., Liao, H., Zhang, L., Yue, X., Dang, R., and Yang, Y.: Persistent ozone pollution episodes in North China exacerbated by regional transport, Environ. Pollut., 265, 115056, https://doi.org/10.1016/j.envpol.2020.115056, 2020.
Granier, C., Darras, S., Denier van der Gon, H., Doubalova, J., Elguindi, N., Galle, B., Gauss, M., Guevara, M., Jalkanen, J.-P., Kuenen, J., Liousse, C., Quack, B., Simpson, D., and Sindelarova, K.: The Copernicus Atmosphere Monitoring Service global and regional emissions (April 2019 version), Copernicus Atmosphere Monitoring Service (CAMS) report, CAMS, https://doi.org/10.24380/d0bn-kx16, 2019.
Guenther, A. B., Jiang, X., Heald, C. L., Sakulyanontvittaya, T., Duhl, T., Emmons, L. K., and Wang, X.: The Model of Emissions of Gases and Aerosols from Nature version 2.1 (MEGAN2.1): an extended and updated framework for modeling biogenic emissions, Geosci. Model Dev., 5, 1471–1492, https://doi.org/10.5194/gmd-5-1471-2012, 2012.
Guion, A., Turquety, S., Cholakian, A., Polcher, J., Ehret, A., and Lathiere, J.: Biogenic isoprene emissions, dry deposition velocity, and surface ozone concentration during summer droughts, heatwaves, and normal conditions in southwestern Europe, Atmos. Chem. Phys., 23, 1043–1071, https://doi.org/10.5194/acp-23-1043-2023, 2023.
Guo, X., Gao, Y., Zhang, S., Wu, L., Chang, P., Cai, W., Zscheischler, J., Leung, L. R., Small, J., Danabasoglu, G., Thompson, L., and Gao, H.: Threat by marine heatwaves to adaptive large marine ecosystems in an eddy-resolving model, Nat. Clim. Change, 12, 179–186, https://doi.org/10.1038/s41558-021-01266-5, 2022.
Hurrell, J. W., Hack, J. J., Shea, D., Caron, J. M., and Rosinski, J.: A New Sea Surface Temperature and Sea Ice Boundary Dataset for the Community Atmosphere Model, J. Clim., 21, 5145–5153, https://doi.org/10.1175/2008JCLI2292.1, 2008.
Ivatt, P. D., Evans, M. J., and Lewis, A. C.: Suppression of surface ozone by an aerosol-inhibited photochemical ozone regime, Nat. Geosci., 15, 536–540, https://doi.org/10.1038/s41561-022-00972-9, 2022.
Kalnay, E., Kanamitsu, M., Kistler, R., Collins, W., Deaven, D., Gandin, L., Iredell, M., Saha, S., White, G., Woollen, J., Zhu, Y., Chelliah, M., Ebisuzaki, W., Higgins, W., Janowiak, J., Mo, K. C., Ropelewski, C., Wang, J., Leetmaa, A., Reynolds, R., Jenne, R., and Joseph, D.: The NCEP/NCAR 40-Year Reanalysis Project, Bull. Am. Meteorol. Soc., 77, 437–472, https://doi.org/10.1175/1520-0477(1996)077<0437:TNYRP>2.0.CO;2, 1996.
Kanaya, Y., Pochanart, P., Liu, Y., Li, J., Tanimoto, H., Kato, S., Suthawaree, J., Inomata, S., Taketani, F., Okuzawa, K., Kawamura, K., Akimoto, H., and Wang, Z. F.: Rates and regimes of photochemical ozone production over Central East China in June 2006: a box model analysis using comprehensive measurements of ozone precursors, Atmos. Chem. Phys., 9, 7711–7723, https://doi.org/10.5194/acp-9-7711-2009, 2009.
Kang, D. W., Aneja, V. P., Mathur, R., and Ray, J. D.: Nonmethane hydrocarbons and ozone in three rural southeast United States national parks: A model sensitivity analysis and comparison to measurements, J. Geophys. Res.-Atmos., 108, 4604, https://doi.org/10.1029/2002jd003054, 2003.
Lamarque, J. F., Emmons, L. K., Hess, P. G., Kinnison, D. E., Tilmes, S., Vitt, F., Heald, C. L., Holland, E. A., Lauritzen, P. H., Neu, J., Orlando, J. J., Rasch, P. J., and Tyndall, G. K.: CAM-chem: description and evaluation of interactive atmospheric chemistry in the Community Earth System Model, Geosci. Model Dev., 5, 369–411, https://doi.org/10.5194/gmd-5-369-2012, 2012.
Li, K., Jacob, D. J., Liao, H., Shen, L., Zhang, Q., and Bates, K. H.: Anthropogenic drivers of 2013–2017 trends in summer surface ozone in China, P. Natl. Acad. Sci. USA, 116, 422–427, https://doi.org/10.1073/pnas.1812168116, 2019.
Li, M., Liu, H., Geng, G., Hong, C., Liu, F., Song, Y., Tong, D., Zheng, B., Cui, H., Man, H., Zhang, Q., and He, K.: Anthropogenic emission inventories in China: a review, Natl. Sci. Rev., 4, 834–866, https://doi.org/10.1093/nsr/nwx150, 2017.
Li, Q., Fernandez, R. P., Hossaini, R., Iglesias-Suarez, F., Cuevas, C. A., Apel, E. C., Kinnison, D. E., Lamarque, J.-F., and Saiz-Lopez, A.: Reactive halogens increase the global methane lifetime and radiative forcing in the 21st century, Nat. Commun., 13, 2768, https://doi.org/10.1038/s41467-022-30456-8, 2022.
Li, R.-X. and Sun, J.-Q.: Interdecadal variability of the large-scale extreme hot event frequency over the middle and lower reaches of the Yangtze River basin and its related atmospheric patterns, Atmos. Ocean. Sci. Lett., 11, 63–70, https://doi.org/10.1080/16742834.2017.1335580, 2018.
Liu, L., Wu, B., and Ding, S.: On the Association of the Summertime Shortwave Cloud Radiative Effect in Northern Russia With Atmospheric Circulation and Climate Over East Asia, Geophys. Res. Lett., 49, e2021GL096606, https://doi.org/10.1029/2021GL096606, 2022.
Lupo, A. R.: Atmospheric blocking events: a review, Ann. N. Y. Acad. Sci., 1504, 5–24, https://doi.org/10.1111/nyas.14557, 2021.
Ma, M., Gao, Y., Wang, Y., Zhang, S., Leung, L. R., Liu, C., Wang, S., Zhao, B., Chang, X., Su, H., Zhang, T., Sheng, L., Yao, X., and Gao, H.: Substantial ozone enhancement over the North China Plain from increased biogenic emissions due to heat waves and land cover in summer 2017, Atmos. Chem. Phys., 19, 12195–12207, https://doi.org/10.5194/acp-19-12195-2019, 2019.
Ma, M., Gao, Y., Ding, A., Su, H., Liao, H., Wang, S., Wang, X., Zhao, B., Zhang, S., Fu, P., Guenther, A. B., Wang, M., Li, S., Chu, B., Yao, X., and Gao, H.: Development and Assessment of a High-Resolution Biogenic Emission Inventory from Urban Green Spaces in China, Environ. Sci. Technol., 56, 175-184, https://doi.org/10.1021/acs.est.1c06170, 2022.
Masato, G., Hoskins, B. J., and Woollings, T.: Winter and Summer Northern Hemisphere Blocking in CMIP5 Models, J. Clim., 26, 7044–7059, https://doi.org/10.1175/JCLI-D-12-00466.1, 2013.
Meehl, G. A., Tebaldi, C., Tilmes, S., Lamarque, J. F., Bates, S., Pendergrass, A., and Lombardozzi, D.: Future heat waves and surface ozone, Environ. Res. Lett., 13, 064004, https://doi.org/10.1088/1748-9326/aabcdc, 2018.
Mochizuki, T., Ikeda, F., and Tani, A.: Effect of growth temperature on monoterpene emission rates of Acer palmatum, Sci. Total Environ., 745, 140886, https://doi.org/10.1016/j.scitotenv.2020.140886, 2020.
Mousavinezhad, S., Choi, Y., Pouyaei, A., Ghahremanloo, M., and Nelson, D. L.: A comprehensive investigation of surface ozone pollution in China, 2015–2019: Separating the contributions from meteorology and precursor emissions, Atmos. Res., 257, 105599, https://doi.org/10.1016/j.atmosres.2021.105599, 2021.
Nakamura, H., Nakamura, M., and Anderson, J. L.: The Role of High- and Low-Frequency Dynamics in Blocking Formation, Mon. Weather Rev., 125, 2074–2093, https://doi.org/10.1175/1520-0493(1997)125<2074:TROHAL>2.0.CO;2, 1997.
Nuvolone, D., Petri, D., and Voller, F.: The effects of ozone on human health, Environ. Sci. Pollut. Res., 25, 8074–8088, https://doi.org/10.1007/s11356-017-9239-3, 2018.
Opacka, B., Müller, J. F., Stavrakou, T., Bauwens, M., Sindelarova, K., Markova, J., and Guenther, A. B.: Global and regional impacts of land cover changes on isoprene emissions derived from spaceborne data and the MEGAN model, Atmos. Chem. Phys., 21, 8413–8436, https://doi.org/10.5194/acp-21-8413-2021, 2021.
Parrish, D. D., Law, K. S., Staehelin, J., Derwent, R., Cooper, O. R., Tanimoto, H., Volz-Thomas, A., Gilge, S., Scheel, H. E., Steinbacher, M., and Chan, E.: Long-term changes in lower tropospheric baseline ozone concentrations at northern mid-latitudes, Atmos. Chem. Phys., 12, 11485–11504, https://doi.org/10.5194/acp-12-11485-2012, 2012.
Parrish, D. D., Derwent, R. G., and Faloona, I. C.: Long-term baseline ozone changes in the Western US: A synthesis of analyses, J. Air Waste Manage. Assoc., 71, 1397–1406, https://doi.org/10.1080/10962247.2021.1945706, 2021a.
Parrish, D. D., Derwent, R. G., and Staehelin, J.: Long-term changes in northern mid-latitude tropospheric ozone concentrations: Synthesis of two recent analyses, Atmos. Environ., 248, 118227, https://doi.org/10.1016/j.atmosenv.2021.118227, 2021b.
Pelly, J. L. and Hoskins, B. J.: A new perspective on blocking, J. Atmos. Sci., 60, 743–755, https://doi.org/10.1175/1520-0469(2003)060<0743:Anpob>2.0.Co;2, 2003.
Pound, R. J., Durcan, D. P., Evans, M. J., and Carpenter, L. J.: Comparing the Importance of Iodine and Isoprene on Tropospheric Photochemistry, Geophys. Res. Lett., 50, e2022GL100997, https://doi.org/10.1029/2022GL100997, 2023.
Pugh, T. A. M., Ashworth, K., Wild, O., and Hewitt, C. N.: Effects of the spatial resolution of climate data on estimates of biogenic isoprene emissions, Atmos. Environ., 70, 1–6, https://doi.org/10.1016/j.atmosenv.2013.01.001, 2013.
Saiz-Lopez, A., Plane, J. M. C., Baker, A. R., Carpenter, L. J., von Glasow, R., Gómez Martín, J. C., McFiggans, G., and Saunders, R. W.: Atmospheric Chemistry of Iodine, Chem. Rev., 112, 1773–1804, https://doi.org/10.1021/cr200029u, 2012.
Saiz-Lopez, A., Fernandez, R. P., Li, Q., Cuevas, C. A., Fu, X., Kinnison, D. E., Tilmes, S., Mahajan, A. S., Gómez Martín, J. C., Iglesias-Suarez, F., Hossaini, R., Plane, J. M. C., Myhre, G., and Lamarque, J.-F.: Natural short-lived halogens exert an indirect cooling effect on climate, Nature, 618, 967–973, https://doi.org/10.1038/s41586-023-06119-z, 2023.
Schneidereit, A., Schubert, S., Vargin, P., Lunkeit, F., Zhu, X., Peters, D. H. W., and Fraedrich, K.: Large-Scale Flow and the Long-Lasting Blocking High over Russia: Summer 2010, Mon. Weather Rev., 140, 2967–2981, https://doi.org/10.1175/MWR-D-11-00249.1, 2012.
Schwierz, C., Croci-Maspoli, M., and Davies, H. C.: Perspicacious indicators of atmospheric blocking, Geophys. Res. Lett., 31, L06125, https://doi.org/10.1029/2003gl019341, 2004.
Sherwen, T., Schmidt, J. A., Evans, M. J., Carpenter, L. J., Großmann, K., Eastham, S. D., Jacob, D. J., Dix, B., Koenig, T. K., Sinreich, R., Ortega, I., Volkamer, R., Saiz-Lopez, A., Prados-Roman, C., Mahajan, A. S., and Ordóñez, C.: Global impacts of tropospheric halogens (Cl, Br, I) on oxidants and composition in GEOS-Chem, Atmos. Chem. Phys., 16, 12239–12271, https://doi.org/10.5194/acp-16-12239-2016, 2016.
Sillmann, J., Kharin, V. V., Zhang, X., Zwiers, F. W., and Bronaugh, D.: Climate extremes indices in the CMIP5 multimodel ensemble: Part 1. Model evaluation in the present climate, J. Geophys. Res.-Atmos., 118, 1716–1733, https://doi.org/10.1002/jgrd.50203, 2013.
Song, H., Chen, X., Lu, K., Zou, Q., Tan, Z., Fuchs, H., Wiedensohler, A., Moon, D. R., Heard, D. E., Baeza-Romero, M. T., Zheng, M., Wahner, A., Kiendler-Scharr, A., and Zhang, Y.: Influence of aerosol copper on HO2 uptake: a novel parameterized equation, Atmos. Chem. Phys., 20, 15835–15850, https://doi.org/10.5194/acp-20-15835-2020, 2020.
Sui, C., Karpechko, A. Y., Vihma, T., Yu, L., and Feng, L.: Influence of the Ural High on Air Temperatures over Eastern Europe and Northern China during Extended Winter, J. Clim., 35, 1309–1325, https://doi.org/10.1175/JCLI-D-21-0523.1, 2022.
Sun, W. X., Hess, P., Chen, G., and Tilmes, S.: How waviness in the circulation changes surface ozone: a viewpoint using local finite-amplitude wave activity, Atmos. Chem. Phys., 19, 12917–12933, https://doi.org/10.5194/acp-19-12917-2019, 2019.
Takaya, K. and Nakamura, H.: A Formulation of a Phase-Independent Wave-Activity Flux for Stationary and Migratory Quasigeostrophic Eddies on a Zonally Varying Basic Flow, J. Atmos. Sci., 58, 608–627, https://doi.org/10.1175/1520-0469(2001)058<0608:AFOAPI>2.0.CO;2, 2001.
Tang, M., Huang, X., Lu, K., Ge, M., Li, Y., Cheng, P., Zhu, T., Ding, A., Zhang, Y., Gligorovski, S., Song, W., Ding, X., Bi, X., and Wang, X.: Heterogeneous reactions of mineral dust aerosol: implications for tropospheric oxidation capacity, Atmos. Chem. Phys., 17, 11727–11777, https://doi.org/10.5194/acp-17-11727-2017, 2017.
Tarasick, D., Galbally, I. E., Cooper, O. R., Schultz, M. G., Ancellet, G., Leblanc, T., Wallington, T. J., Ziemke, J., Liu, X., Steinbacher, M., Staehelin, J., Vigouroux, C., Hannigan, J. W., García, O., Foret, G., Zanis, P., Weatherhead, E., Petropavlovskikh, I., Worden, H., Osman, M., Liu, J., Chang, K. L., Gaudel, A., Lin, M. Y., Granados-Muñoz, M., Thompson, A. M., Oltmans, S. J., Cuesta, J., Dufour, G., Thouret, V., Hassler, B., Trickl, T., and Neu, J. L.: Tropospheric Ozone Assessment Report: Tropospheric ozone from 1877 to 2016, observed levels, trends and uncertainties, Elementa-Sci. Anthrop., 7, 39, https://doi.org/10.1525/elementa.376, 2019.
Tonnesen, S. and Jeffries, H. E.: Inhibition of odd oxygen production in the carbon bond four and generic reaction set mechanisms, Atmos. Environ., 28, 1339–1349, https://doi.org/10.1016/1352-2310(94)90281-X, 1994.
Unger, N.: On the role of plant volatiles in anthropogenic global climate change, Geophys. Res. Lett., 41, 8563–8569, https://doi.org/10.1002/2014gl061616, 2014.
Wang, H., Gao, Y., Sheng, L., Wang, Y., Zeng, X., Kou, W., Ma, M., and Cheng, W.: The Impact of Meteorology and Emissions on Surface Ozone in Shandong Province, China, during Summer 2014-2019, Int. J. Environ. Res. Public. Health, 19, 6758, https://doi.org/10.3390/ijerph19116758, 2022.
Wang, H. L., Wu, K., Liu, Y. M., Sheng, B. S., Lu, X., He, Y. P., Xie, J. L., Wang, H. C., and Fan, S. J.: Role of Heat Wave-Induced Biogenic VOC Enhancements in Persistent Ozone Episodes Formation in Pearl River Delta, J. Geophys. Res.-Atmos., 126, e2020JD034317, https://doi.org/10.1029/2020JD034317, 2021.
Weng, H., Lin, J., Martin, R., Millet, D. B., Jaeglé, L., Ridley, D., Keller, C., Li, C., Du, M., and Meng, J.: Global high-resolution emissions of soil NOx, sea salt aerosols, and biogenic volatile organic compounds, Sci. Data, 7, 148, https://doi.org/10.1038/s41597-020-0488-5, 2020.
Wiedinmyer, C., Kimura, Y., McDonald-Buller, E. C., Emmons, L. K., Buchholz, R. R., Tang, W., Seto, K., Joseph, M. B., Barsanti, K. C., Carlton, A. G., and Yokelson, R.: The Fire Inventory from NCAR version 2.5: an updated global fire emissions model for climate and chemistry applications, Geosci. Model Dev., 16, 3873–3891, https://doi.org/10.5194/gmd-16-3873-2023, 2023.
Woollings, T., Barriopedro, D., Methven, J., Son, S.-W., Martius, O., Harvey, B., Sillmann, J., Lupo, A. R., and Seneviratne, S.: Blocking and its Response to Climate Change, Curr. Clim. Chang. Rep., 4, 287–300, https://doi.org/10.1007/s40641-018-0108-z, 2018.
Xu, P., Wang, L., and Chen, W.: The British–Baikal Corridor: A Teleconnection Pattern along the Summertime Polar Front Jet over Eurasia, J. Clim., 32, 877–896, https://doi.org/10.1175/JCLI-D-18-0343.1, 2019.
Yang, X., Zeng, G., Iyakaremye, V., and Zhu, B.: Effects of different types of heat wave days on ozone pollution over Beijing-Tianjin-Hebei and its future projection, Sci. Total Environ., 837, 155762, https://doi.org/10.1016/j.scitotenv.2022.155762, 2022.
Yang, Y., Liao, H., and Li, J.: Impacts of the East Asian summer monsoon on interannual variations of summertime surface-layer ozone concentrations over China, Atmos. Chem. Phys., 14, 6867–6879, https://doi.org/10.5194/acp-14-6867-2014, 2014.
Yang, Y., Zhou, Y., Wang, H., Li, M., Li, H., Wang, P., Yue, X., Li, K., Zhu, J., and Liao, H.: Meteorological characteristics of extreme ozone pollution events in China and their future predictions, Atmos. Chem. Phys., 24, 1177–1191, https://doi.org/10.5194/acp-24-1177-2024, 2024.
Yao, Y., Zhuo, W., Gong, Z., Luo, B., Luo, D., Zheng, F., Zhong, L., Huang, F., Ma, S., Zhu, C., and Zhou, T.: Extreme Cold Events in North America and Eurasia in November-December 2022: A Potential Vorticity Gradient Perspective, Adv. Atmos. Sci., 40, 953–962, https://doi.org/10.1007/s00376-023-2384-3, 2023.
Yin, Z., Wang, H., Li, Y., Ma, X., and Zhang, X.: Links of climate variability in Arctic sea ice, Eurasian teleconnection pattern and summer surface ozone pollution in North China, Atmos. Chem. Phys., 19, 3857–3871, https://doi.org/10.5194/acp-19-3857-2019, 2019.
Zeng, X. R., Gao, Y., Wang, Y. H., Ma, M. C., Zhang, J. X., and Sheng, L. F.: Characterizing the distinct modulation of future emissions on summer ozone concentrations between urban and rural areas over China, Sci. Total Environ., 820, 153324, https://doi.org/10.1016/j.scitotenv.2022.153324, 2022.
Zhang, J., Gao, Y., Luo, K., Leung, L. R., Zhang, Y., Wang, K., and Fan, J.: Impacts of compound extreme weather events on ozone in the present and future, Atmos. Chem. Phys., 18, 9861–9877, https://doi.org/10.5194/acp-18-9861-2018, 2018.
Zhang, J., Gao, Y., Leung, L. R., Luo, K., Wang, M., Zhang, Y., Bell, M. L., and Fan, J.: Isolating the modulation of mean warming and higher-order temperature changes on ozone in a changing climate over the contiguous United States, Environ. Res. Lett., 17, 094005, https://doi.org/10.1088/1748-9326/ac8695, 2022.
Zhang, R., Cohan, A., Biazar, A. P., and Cohan, D. S.: Source apportionment of biogenic contributions to ozone formation over the United States, Atmos. Environ., 164, 8–19, https://doi.org/10.1016/j.atmosenv.2017.05.044, 2017.
Zohdirad, H., Jiang, J. H., Aksoyoglu, S., Namin, M. M., Ashrafi, K., and Prevot, A. S. H.: Investigating sources of surface ozone in central Europe during the hot summer in 2018: High temperatures, but not so high ozone, Atmos. Environ., 279, 119099, https://doi.org/10.1016/j.atmosenv.2022.119099, 2022.