the Creative Commons Attribution 4.0 License.
the Creative Commons Attribution 4.0 License.
 | 10 Mar 2025
Natural emissions of VOC and NOx over Africa constrained by TROPOMI HCHO and NO2 data using the MAGRITTEv1.1 model
Beata Opacka
Trissevgeni Stavrakou
Jean-François Müller
Isabelle De Smedt
Jos van Geffen
Eloise A. Marais
Rebekah P. Horner
Dylan B. Millet
Kelly C. Wells
Alex B. Guenther
Natural emissions (vegetation, soil, and lightning) are the dominant sources of non-methane biogenic volatile organic compounds (BVOCs) and nitrogen oxides (NOx≡ NO + NO2) released into the atmosphere over Africa. BVOCs and NOx interact with each other and strongly impact their own chemical lifetimes and degradation pathways, in particular through their influence on hydroxyl radical levels. To account for this intricate interplay between NOx and VOCs, we design and apply a novel inversion setup aiming at simultaneous optimization of monthly VOC and NOx emissions in 2019 in a regional chemistry-transport model, based on Tropospheric Ozone Monitoring Instrument (TROPOMI) HCHO and NO2 satellite observations. The TROPOMI-based inversions suggest substantial underestimations of natural NOx and VOC emissions used as a priori in the model. The annual flux over Africa increases from 125 to 165 Tg yr−1 for isoprene, from 1.9 to 2.4 TgN yr−1 for soil NO emissions, and from 0.5 to 2.0 TgN yr−1 for lightning NO emissions. Despite the NOx emission increase, evaluation against in situ NO2 measurements at seven rural sites in western Africa displays significant model underestimations after optimization. The large increases in lightning emissions are supported by comparisons with TROPOMI cloud-sliced upper-tropospheric NO2 volume mixing ratios, which remain underestimated by the model even after optimization. Our study strongly supports the application of a bias correction to the TROPOMI HCHO data and the use of a two-species constraint (vs. single-species inversion), based on comparisons with isoprene columns retrieved from the Cross-track Infrared Sensor (CrIS).
- Article
(17285 KB) - Full-text XML
-
Supplement
(1821 KB) - BibTeX
- EndNote


Tropical regions are important sources of natural fluxes of nitrogen oxides (NOx≡ NO + NO2) and biogenic volatile organic compounds (BVOCs), due to environmental conditions that favour their emissions. Both species are key drivers of tropospheric chemistry through their impact on tropospheric ozone (Chameides et al., 1992) and hydroxyl radical (OH) levels via depletion or regeneration mechanisms (Fuchs et al., 2013; Hansen et al., 2017; Lelieveld et al., 2008), thereby altering the oxidizing capacity of the atmosphere and the lifetime of methane. In addition, BVOCs are important precursors of secondary organic aerosols (Carlton et al., 2009; Claeys et al., 2004), which, besides their direct effects on radiation, can also act as cloud condensation nuclei and alter cloud properties (Sporre et al., 2019). In recent years, air pollution in Africa has raised concerns due to rapid population and economic growth with harmful environmental and health repercussions (Brauer et al., 2012; Mead et al., 2023; Petkova et al., 2013; Singh et al., 2020). Megacities such as Lagos and Kinshasa, oil exploitation (e.g. in Nigeria), coal mining and power generation in South Africa, biomass burning that is predominantly human-initiated, and aerosol dust (predominantly from the Sahara and Sahel) are key examples of sources affecting air quality over the continent. While anthropogenic emissions are the dominant source of NOx globally (Soulie et al., 2024), natural sources from soil and lightning are responsible for ca. 30 % of the total global NOx emissions into the atmosphere and contribute an even greater share in remote environments (Jaeglé et al., 2005). Soil NOx emissions over Africa, due to soil microbial activity and fertilizer use, can be strong enough to be captured by spaceborne NO2 observations (Jaeglé et al., 2004, 2005; Stavrakou et al., 2013), while central Africa experiences some of the highest lightning flash rates globally (Cecil et al., 2014). Evergreen tropical forests in western and equatorial Africa are major sources of isoprene, which is by far the most dominant BVOC emitted by vegetation (Guenther et al., 2012; Lathière et al., 2006; Messina et al., 2016; Sindelarova et al., 2022). According to current estimates, ca. 80 % of the total isoprene emissions take place in the tropics due to high temperature and solar radiation and the widespread presence of broadleaved trees (Guenther et al., 2012; Opacka et al., 2021). Global bottom-up inventories for lightning and soil fluxes range from 1.3 to 6.6 TgN yr−1 (Murray, 2016; Vinken et al., 2014; Weng et al., 2020) and from 4 to 34 TgN yr−1 (Steinkamp and Lawrence, 2011; Yan et al., 2005), respectively, and isoprene fluxes range from 300 to 800 Tg yr−1 (Guenther et al., 2012; Sindelarova et al., 2022). These large ranges are a measure of the uncertainty of natural emissions, which stems from the paucity of local observations and complex mechanisms driving the emission fluxes.
Ground-based measurements in Africa have emerged from international efforts such as INDAAF (International Network to study Deposition and Atmospheric composition in Africa) for in situ measurements (Akpo et al., 2015; Ossohou et al., 2019; Ouafo-Leumbe et al., 2018), the rapidly growing Pandonia Global Network (PGN) that monitors tropospheric column data (https://www.pandonia-global-network.org/, last access: 1 July 2024), or, more recently, the multi-axis differential optical absorption spectroscopy (MAX-DOAS) observations of NO2 and HCHO at Kinshasa (Yombo Phaka et al., 2023) and Bujumbura (Gielen et al., 2017). With the exception of INDAAF, these sites are located in urban areas. A small number of field campaigns took place on the African continent, such as the Dynamics-Aerosol-Chemistry-Cloud Interactions in western Africa campaign (DACCIWA 2016; Knippertz et al., 2017), the African Monsoon Multidisciplinary Analysis (AMMA 2006; Lebel et al., 2011; Redelsperger et al., 2006), the Experiment for the Regional Sources and Sinks of Oxidants (EXPRESSO; Greenberg et al., 1999), and the Southern African Regional Science Initiative (SAFARI 2000; Swap et al., 2002). This is complemented by short-term monitoring of soil NO fluxes as reviewed in Liu et al. (2017), for instance.
By virtue of their global coverage and continuous monitoring, spaceborne data are great alternatives to studying air composition in Africa and can be used to constrain model emission estimates obtained with chemistry-transport models (CTMs). Since the oxidation of BVOC emissions is the dominant source of formaldehyde (HCHO) over African rainforests (De Smedt et al., 2008; Meyer-Arnek and Burrows, 2005), with HCHO being a high-yield product of the oxidation of those BVOCs and having a short atmospheric lifetime of several hours, spaceborne HCHO columns constitute an excellent proxy of BVOC emissions (Barkley et al., 2013; Bauwens et al., 2016; Kaiser et al., 2018; Marais et al., 2014; Millet et al., 2008; Palmer et al., 2003; Stavrakou et al., 2009). Moreover, the use of satellite NO2 data provides valuable information on the spatial distribution and magnitude of the natural sources of NOx over Africa. Several studies have inferred top-down isoprene or natural NOx emissions from satellite HCHO and NO2 column observations based on GOME, SCIAMACHY, GOME-2, or OMI (Bauwens et al., 2016; Jaeglé et al., 2005; Kaiser et al., 2018; Marais et al., 2012; Martin et al., 2003; Miyazaki et al., 2012; Palmer et al., 2003; Qu et al., 2020; Stavrakou et al., 2008). Global emission totals from top-down inventories range from 7.9 to 20.4 TgN yr−1 for soil NO (Boersma et al., 2005; Jaeglé et al., 2005; Miyazaki et al., 2017; Stavrakou et al., 2013; Vinken et al., 2014), from 3.3 to 7.5 TgN yr−1 for lightning (Miyazaki et al., 2020; Stavrakou et al., 2013), and from 272 to 445 Tg yr−1 for isoprene (Bauwens et al., 2016; Müller et al., 2024). Regional inversions over Africa led to a reduction of about 20 % in isoprene emissions (Bauwens et al., 2016; Marais et al., 2012, 2014) with respect to the a priori estimates obtained from the MEGAN bottom-up inventory (Guenther et al., 2012).
However, the top-down estimates contain errors due to uncertainties in the satellite retrievals, the challenge of differentiating between co-occurring sources, and uncertainties in the relevant chemical processes, in particular under relatively low NOx conditions (typically 0.1–1 ppb) that are typical in Africa (Marais et al., 2012). For instance, previous inverse modelling studies generally did not account for the existence of biases in spaceborne HCHO (De Smedt et al., 2021; Vigouroux et al., 2020; Zhu et al., 2020). The bias corrections were recently shown to enhance top-down isoprene emissions over source regions (Müller et al., 2024; Oomen et al., 2024). Moreover, the oxidation of isoprene and its associated HCHO formation are non-linearly dependent on NOx and isoprene levels, which therefore impact both the isoprene lifetime and the yield of formaldehyde (Atkinson, 2000; Wolfe et al., 2016). VOCs are oxidized through various photochemical pathways, leading potentially to the production of carbon dioxide and water, with HCHO being an important intermediate in this oxidation chain. The first stage of the photochemical oxidation of a hydrocarbon by OH generally leads to the production of organic peroxy radicals (RO2). Under high-NOx conditions, the peroxy radicals produced by isoprene oxidation react preferentially with NO, producing HCHO and other carbonyls that are further oxidized and eventually yield additional HCHO (Atkinson, 2013). Under low-NOx conditions, other reactions take place, leading to the formation of organic hydroperoxides (ROOH) and isomerization products (Peeters et al., 2009). Furthermore, the lower OH levels associated with lower NOX levels slow down photochemistry and delay the secondary formation of HCHO (Barkley et al., 2013; Marais et al., 2012). The HOx–NOx–VOC relationship is a linchpin for the derivation of a top-down isoprene emission inventory from orbital HCHO column observations. Marais et al. (2012) estimated errors between 40 % and 90 % in the inferred isoprene emissions, with the highest error being under low-NOx conditions (<1 ppbv). Acknowledging the intricate interplay between NOx and VOCs through the HOx–NOx–VOC feedback, we design and apply a novel inversion setup by relying on the concomitant use of HCHO and NO2 satellite observations from the Tropospheric Ozone Monitoring Instrument (TROPOMI; De Smedt et al., 2018; van Geffen et al., 2022) mounted on the Sentinel-5 Precursor (S5P) satellite to simultaneously infer VOC and NOx emissions from the African continent. The aim of this study is to better quantify natural emissions and assess the impact of a two-species optimization on those inferred emissions. For this purpose, the Model of Atmospheric composition at Global and Regional scales using Inversion Techniques for Trace Gas Emissions (MAGRITTEv1.1) chemistry-transport model (Müller et al., 2019) is employed and simulations are conducted for 2019 at 0.5° resolution. The model accounts for up-to-date OH-recycling mechanisms in isoprene degradation (Müller et al., 2019). This study is the first to (i) derive simultaneously NOx and VOC emissions based on TROPOMI data and (ii) account for biases in TROPOMI HCHO columns in the derivation of African emissions. A few other studies advocated for joint inversion and applied a similar approach (Souri et al., 2020, 2025; Wells et al., 2020).
The paper is structured as follows. Section 2 describes the methodology applied, i.e. the modelling framework including the chemistry-transport model and the inversion method, the list of sensitivity inversions performed to assess the robustness of the results, the a priori emissions used in the model, the satellite products that are used to constrain VOC and NOx emissions, and the in situ and satellite data products that are used to evaluate the top-down fluxes. Section 3 provides a detailed discussion and evaluation of the results against independent datasets. Finally, Sect. 4 presents the conclusions of this study.
2.1 MAGRITTEv1.1 chemistry-transport model
Simulations of atmospheric composition are performed using a chemistry-transport model (CTM), MAGRITTEv1.1 (Müller et al., 2019), which is based on the global CTM IMAGES (Bauwens et al., 2016; Müller and Brasseur, 1995; Stavrakou et al., 2015). It calculates the concentrations of 170 compounds with a time step of 6 h and a spin-up time of 6 months. The MAGRITTE model is first run in its global configuration at a spatial resolution of 2.5° × 2.5° (latitude, longitude). This simulation provides the boundary conditions for the regional MAGRITTEv1.1 model that covers the African domain delimited by 30° S–17° N and 18° W–56° E with a 0.5° × 0.5° horizontal resolution between the surface and the lower stratosphere, with 40 hybrid sigma-pressure levels in the vertical.
In particular, the oxidation mechanism of isoprene implemented in MAGRITTEv1.1 largely relies on the Leuven Isoprene Mechanism (Peeters et al., 2014), the Caltech oxidation mechanism (Wennberg et al., 2018), and the experimental investigation of Berndt et al. (2019). A thorough description can be found in Müller et al. (2019). Regarding the impact of isoprene on NOx levels, the model accounts for organic nitrate formation in isoprene oxidation by OH and NO3 (Kwan et al., 2012; Paulot et al., 2009; Wennberg et al., 2018), NOx-recycling pathways such as photolysis (Müller et al., 2014), and NOx terminal losses through heterogeneous hydrolysis in aqueous aerosols (Romer et al., 2016) and dry deposition (Nguyen et al., 2015).
Meteorological fields are obtained from ERA5 analyses (Hersbach et al., 2020). The model uses anthropogenic emissions of NOx, CO, SO2, NH3, and non-methane VOC species from the global CAMS-GLOB-ANTv5.3 inventory (Granier et al., 2019). The biomass burning inventory is provided by the Quick Fire Emissions Dataset (QFED) version 2.4 (Koster et al., 2015; Pan et al., 2020) with emission factors from Andreae (2019) and is vertically distributed according to Sofiev et al. (2013). Natural emissions of isoprene, monoterpenes, and methylbutenol as well as natural sources of NOx are prescribed as detailed in Sect. 2.1.1. Biogenic emissions of acetaldehyde and ethanol are parameterized following Millet et al. (2010), biogenic methanol emissions are from the MEGANv2.1 inventory, and biogenic CO emissions are accounted for following Müller and Stavrakou (2005).
The inverse modelling module and full (chemistry-transport) adjoint model were developed to perform tracer inversions of reactive species for the optimization of emissions, as described in Sect. 2.2. The bottom-up and top-down constraints used for the optimization are described as follows.
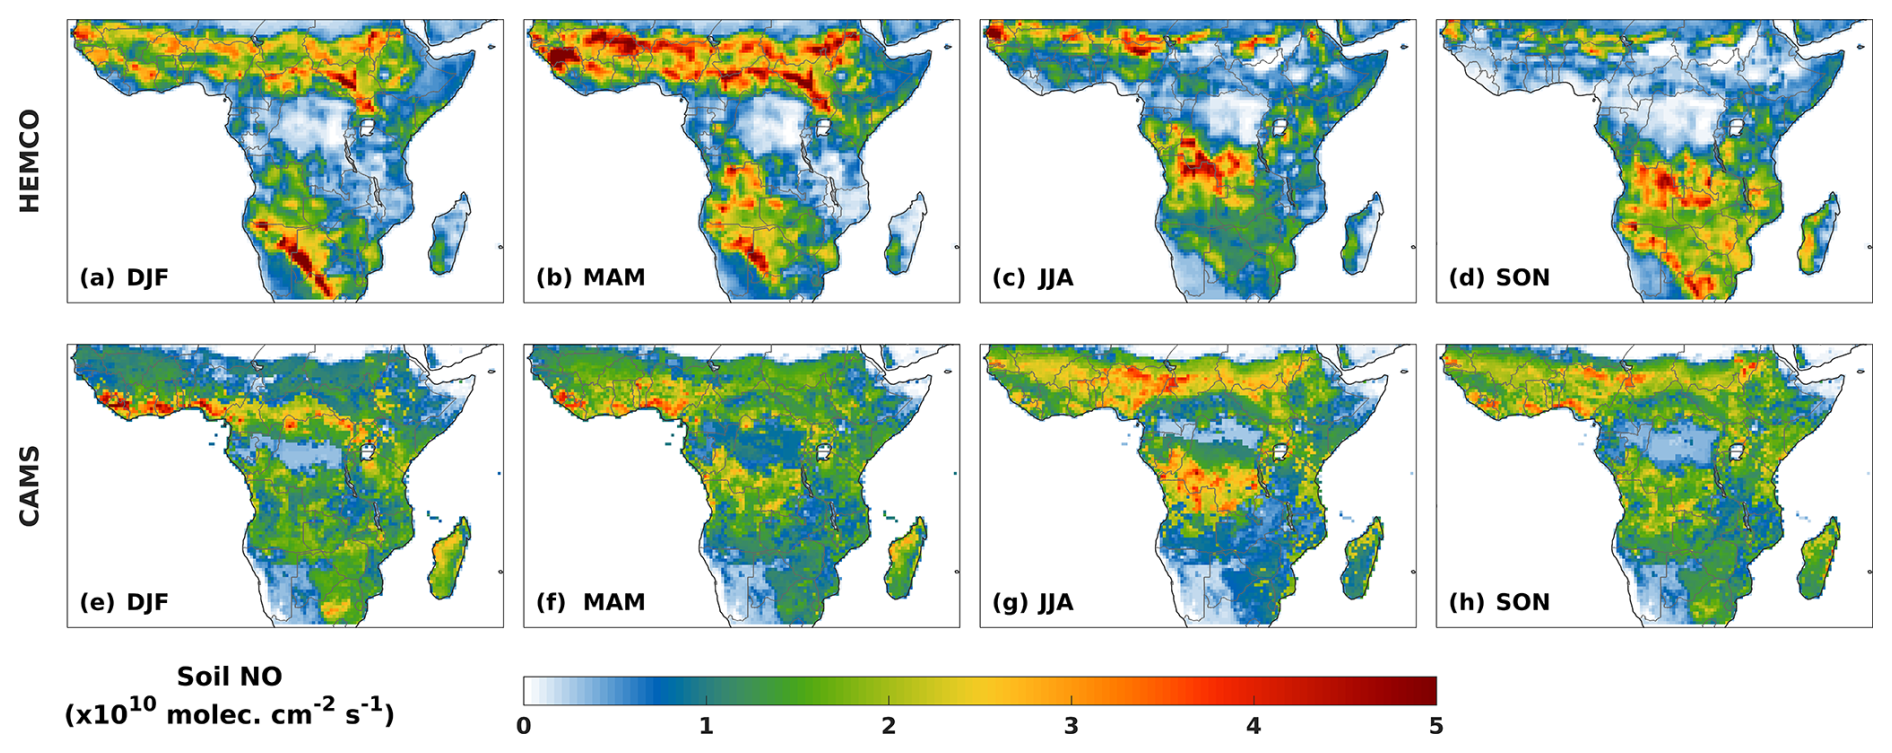
Figure 1Spatial seasonal distribution of above-canopy soil NO emissions (1010 molec. cm−2 s−1) from the HEMCO (a–d) and CAMS (e–h) inventories for DJF (December–January–February), MAM (March–April–May), JJA (June–July–August), and SON (September–October–November).
2.1.1 Bottom-up inventories for natural NOx and VOC emissions
A priori soil NO emissions are obtained from the dataset of Weng et al. (2020) generated with the Harvard-NASA Harmonized Emissions Component (HEMCO) version 2.1 model. Above-canopy fluxes accounting for biological and meteorological drivers are calculated following Steinkamp and Lawrence (2011) and Yienger and Levy (1995). The latter include (i) an exponential dependence on soil temperature between 0 and 30 °C (constant at T>30 °C), (ii) Poisson function scaling for soil moisture dependence, (iii) pulsing according to the parameterization of Yan et al. (2005), (iv) soil nitrogen input from chemical and manure fertilizers (atmospheric N deposition is not accounted for, as it contributes only ca. 5 % globally, according to Hudman et al., 2012), and (v) the canopy reduction factor. For this study, we use the monthly global emissions of a soil NOx dataset based on an assimilated MERRA-2 meteorology, originally at a resolution of 0.5° × 0.625° and regridded to 0.5° × 0.5°. Averaged over all the years (1980–2017), the global total soil NOx emissions amount to 9.5 TgN yr−1. As a sensitivity study, we use an alternative dataset, the CAMS-BIO-SOILv2.4 inventory (Simpson and Darras, 2021), hereafter referred to as CAMS. This inventory is also calculated following Hudman et al. (2012), with inputs from ERA5 reanalysis (Hersbach et al., 2020). While the global total CAMS emission (9.1 TgN) is very similar to the HEMCO inventory, the spatial distribution and seasonal evolution differ greatly, as shown in Fig. 1.
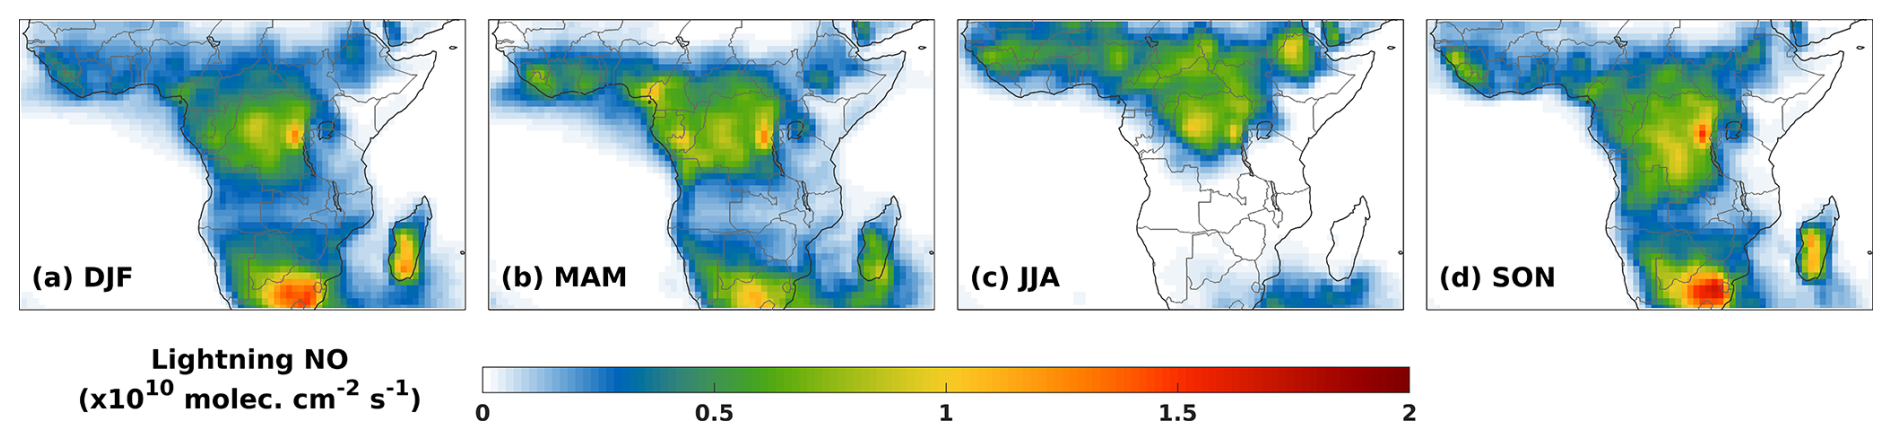
Figure 2The spatial seasonal distribution of lightning NO emissions (1010 molec. cm−2 s−1) for the reference run (a–d) is displayed for DJF, MAM, JJA, and SON.
The lightning emissions of NOx in the reference case rely on the parameterization of Price and Rind (1992) and Martin et al. (2007) with convective cloud top heights derived from ERA5 (Hersbach et al., 2020), assuming a ratio of 0.75 in the NO production per flash due to intra-cloud and cloud-to-ground flashes (Martin et al., 2007). The monthly averaged global distribution of lightning flash density follows the spaceborne climatology of the NASA Optical Transient Detector (OTD) and Lightning Imaging Sensor (LIS) satellite instruments (Cecil et al., 2014). The lightning emissions are distributed vertically according to Pickering et al. (1998). The mid-latitude lightning emissions are scaled up by a factor of 4, following Martin et al. (2007), and the total lightning emission is scaled to 3.4 TgN yr−1 globally. Seasonal distributions for the reference lightning emissions are shown in Fig. 2.
Biogenic emissions of isoprene, monoterpenes, and methylbutenol are calculated using the MEGANv2.1 model (Guenther et al., 2012) coupled with the MOHYCAN multi-layer canopy model (Müller et al., 2008). Emissions are driven by meteorological fields obtained from ERA5 (Hersbach et al., 2020). The effect of soil moisture stress is neglected (γSM=1), since several studies (Bauwens et al., 2016; Opacka et al., 2022) indicated that the MEGANv2.1 parameterization of soil moisture dependence is very uncertain and needs improvement (Bauwens et al., 2016; Opacka et al., 2022; Jiang et al., 2018; Wang et al., 2023). Monthly leaf area index (LAI) distributions at 0.5° × 0.5° resolution (m2 m−2) are based on the MODIS dataset (MODIS15A2H collection 6). Our reference isoprene inventory, referred to as MEGAN, uses a gridded distribution of the basal emission factor under standard conditions (provided in MEGANv2.1) based on species composition and species-specific emission factors. As an alternative option, the ALBERI inventory (Opacka et al., 2021) will be used a priori in the model. This inventory uses constant emission factors per plant functional type (PFT) (Martin et al., 2007; Guenther et al., 2012) and PFT distributions based on satellite-based datasets combining high-resolution tree cover maps from the Global Forest Watch (GFWv.1.9; Hansen et al., 2013) with MODIS land cover datasets (MCD12Q1; Friedl and Sulla-Menashe, 2019), as described in Opacka et al. (2021).
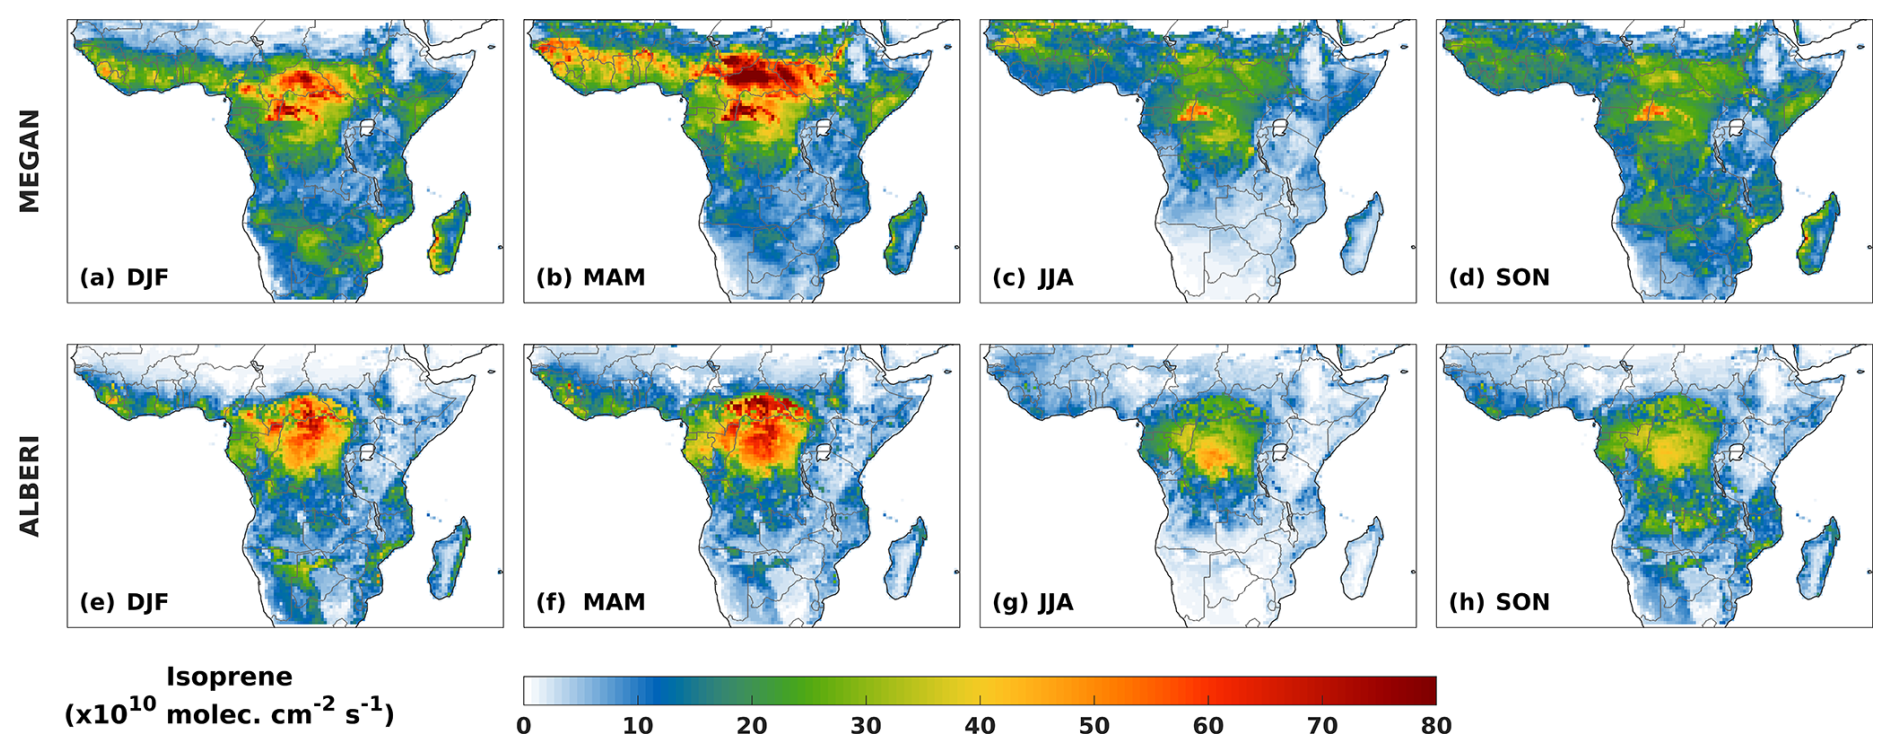
Figure 3The spatial seasonal distribution of isoprene emissions (1010 molec cm−2 s−1) from the MEGAN (a–d) and ALBERI (e–h) inventories is displayed for DJF, MAM, JJA, and SON.
The global annual emissions of isoprene in MEGAN and ALBERI in 2019 are estimated at 400 and 340 Tg, respectively, and their spatial distribution is shown in Fig. 3. The emissions account for the CO2 response factor, parameterized following Possell and Hewitt (2011) and equal to 0.9092 for 2019 CO2 concentrations (https://gml.noaa.gov/webdata/ccgg/trends/co2/co2_annmean_mlo.txt, last access: 28 February 2025).
2.1.2 Optimization constraints: TROPOMI HCHO and NO2 and INDAAF NO2
We use tropospheric HCHO and NO2 vertical column densities (VCDs) measured by TROPOMI on board the ESA S5P satellite that flies in a low Earth polar orbit with an Equator-crossing time of ∼ 13:30 local time. TROPOMI has a 2600 km wide swath and provides near-daily global coverage at a spatial resolution of 3.5 × 5.5 km2 at nadir. The TROPOMI NO2 dataset used in this study is the Products Algorithm Laboratory (PAL) version v2.3.1; for May 2018 to November 2021 this is the intermediate S5P–PAL reprocessing dataset (Eskes et al., 2021), which is followed by operational offline processing data (Eskes and Eichmann, 2024). These datasets include improved cloud pressure retrievals and a surface albedo correction, resulting in improved agreement with ground-based observations compared to previous product versions (van Geffen et al., 2022). Note that the v2.3.1 S5P–PAL data are no longer publicly available. Both these data and the v2.3.1 operational offline data have been superseded by the v2.4.0 (re)processing data. Updates implemented for v2.4.0 (Eskes and Eichmann, 2024) include the use of an improved surface albedo database and reprocessed Level-1b input spectra with improved degradation correction. These updates may affect tropospheric NO2 columns over polluted areas and vegetated areas, but as these effects are localized and relatively small, they are unlikely to significantly alter the main message of the present study. Tropospheric NO2 data are regridded to 0.5° resolution after selecting data with quality assurance (QA) values above 0.75, as per the product recommendation. We further remove TROPOMI NO2 data with strong biomass burning (BB) influences. For that, given the large disparities in BB emissions among bottom-up inventories (Pan et al., 2020), we filter out the TROPOMI NO2 data based on two global inventories, GFED4s (van der Werf et al., 2017) and QFED (Darmenov and da Silva, 2015), and consider the largest value between the two for each grid cell and month. More specifically, we exclude TROPOMI NO2 data when either the daily BB flux or the average flux from the previous 4 d, averaged spatially within a 2.5° × 2.5° box surrounding the 0.5° × 0.5° TROPOMI pixel, exceeds 5 × 10¹² molec. cm−2 s−1 (white areas in Fig. 4). This filtering reduces by 17 % (from 8.5 × 10⁴ to 7.0 × 10⁴) the number of monthly 0.5° × 0.5° TROPOMI NO2 pixels used in the inversions. The BB NOX emissions are not optimized in order to limit the number of categories in our inversion setup. Instead, the ratio of BB NOX to BB VOC is assumed constant, and the BB NOX emissions are adjusted based on the changes inferred for BB VOC emissions. The assumption of a constant ratio between NOx and VOC emission factors is clearly an approximation, but it is of little consequence for the other categories due to the NO2 filtering and the short lifetime of NOx (a few hours), which limits the spatial extent of the influence of fire emissions on the NO2 distribution. In contrast to this, the influence of fires on HCHO is sustained downwind by the oxidation of emitted VOCs (Marais et al., 2012; Trentmann et al., 2003), which makes it more difficult to filter out the influence of fires on TROPOMI HCHO data. Validation studies (Compernolle, 2024; van Geffen et al., 2022; Verhoelst et al., 2021) reported biases in TROPOMI NO2 columns based on ground-based MAX-DOAS stations. Most of these stations show median columns above 2 × 1015 cm−2, i.e. higher than the typically observed TROPOMI NO2 levels in Africa. Exceptions are two Japanese sites, Fukue and Cape Hedo, for which very large TROPOMI overestimations () were found (Compernolle, 2024). However, because these stations are maritime ones and the vertical sensitivities of TROPOMI and MAX-DOAS are very different (Oomen et al., 2024), these validation results should be considered with caution. Therefore, in the absence of a robust validation study in low-NOX areas typical of African NO2 levels, no bias correction was applied to TROPOMI NO2 column densities.
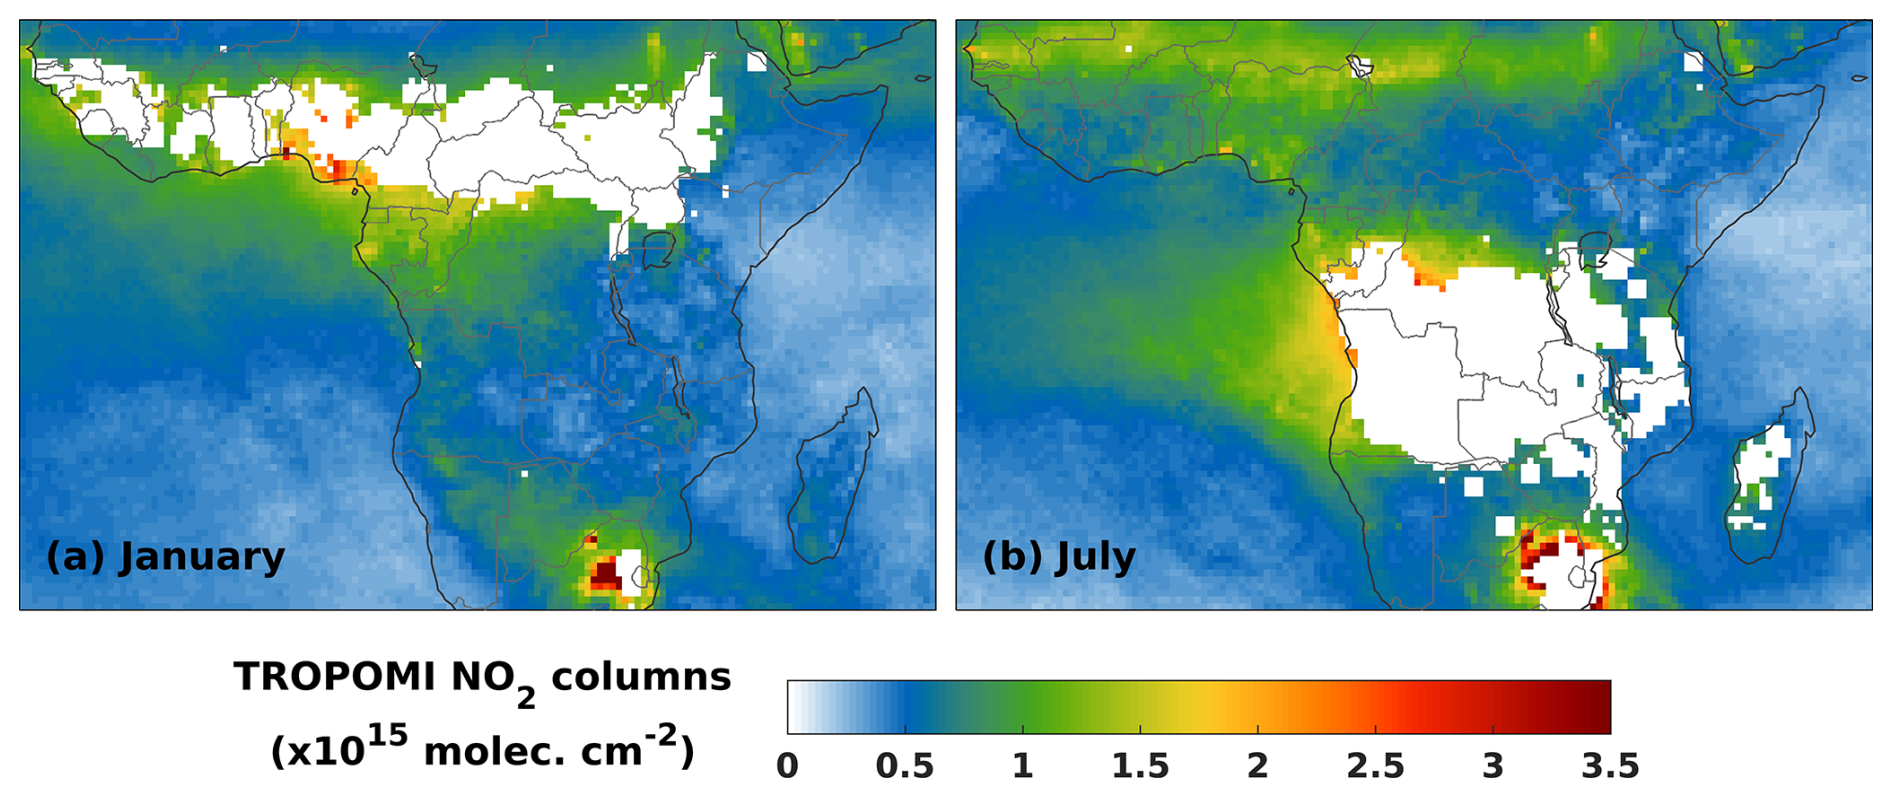
Figure 4Spatial distribution of TROPOMI NO2 columns (1015 molec cm−2) in (a) January and (b) July 2019 after the filtering of the fire scenes.
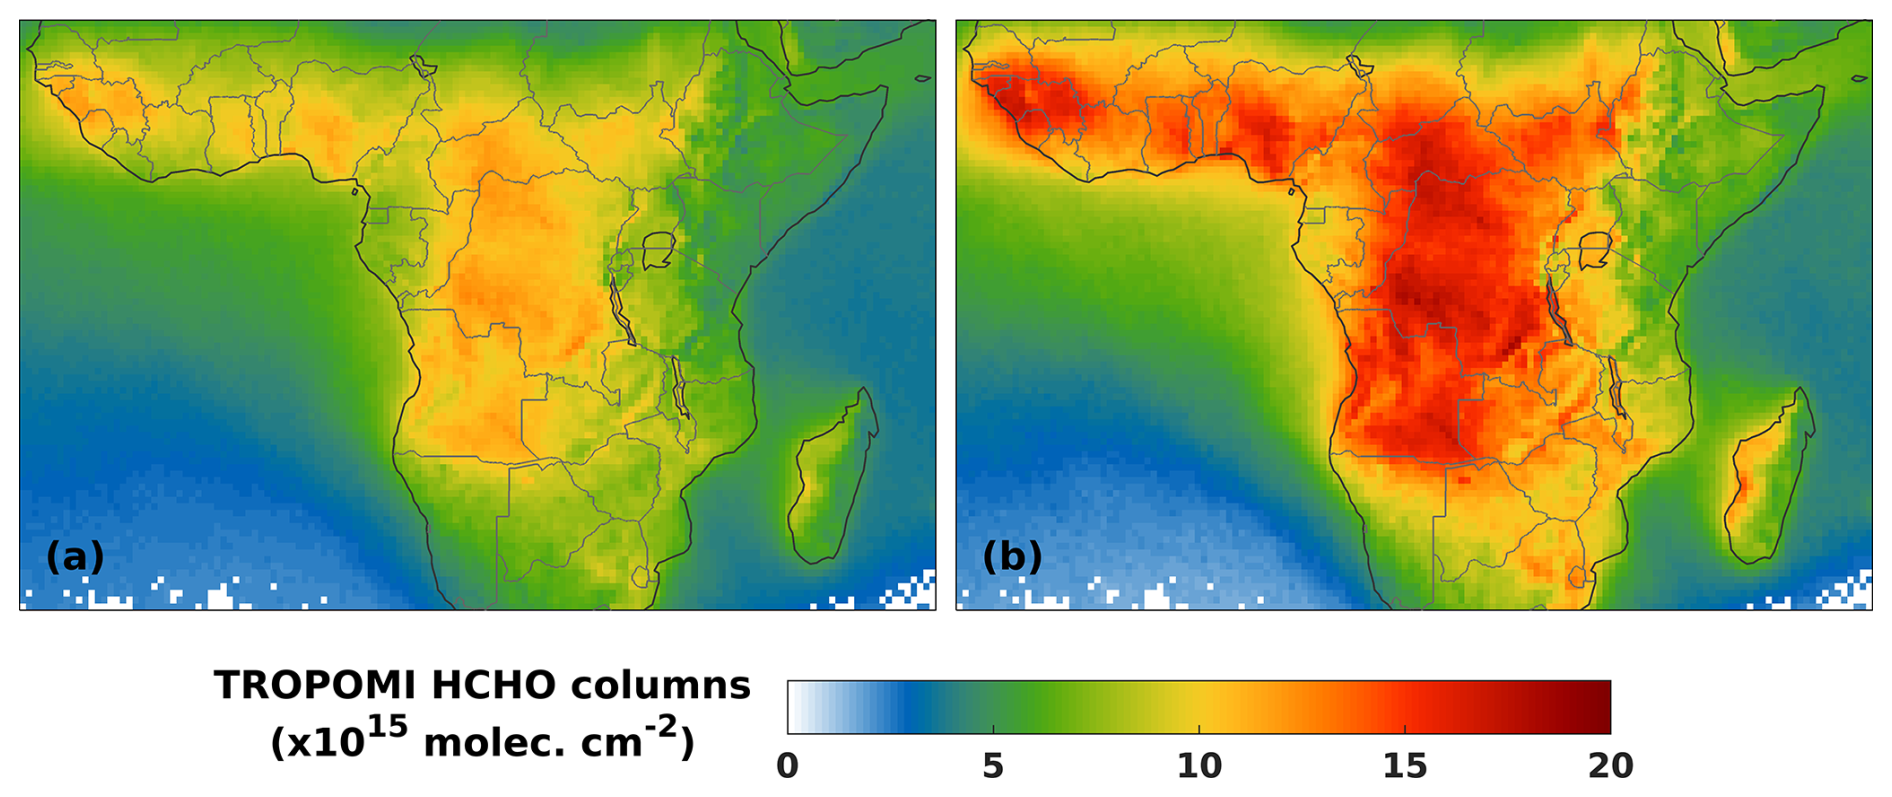
Figure 5Spatial distribution of annually averaged TROPOMI HCHO columns (1015 molec cm−2) in 2019 (a) before and (b) after the application of the bias correction.
We use the Copernicus operational product TROPOMI S5P HCHO columns (ΩHCHO) (De Smedt et al., 2021) with QA >0.5 gridded onto the model resolution (0.5°) and corrected for bias using the following linear relationship based on Vigouroux et al. (2020):
where is the bias-corrected column. This formula is derived from a global-scale validation study of TROPOMI HCHO data using Fourier transform infrared (FTIR) data from 25 stations worldwide. The linear regression parameters are based on monthly averaged FTIR data obtained within 2 h of the satellite overpass and monthly TROPOMI HCHO columns averaged within a 20 km radius from the stations. Annually averaged columns after bias correction are 30 % higher on average, increasing from a domain-mean column of 6.63 to 8.58 × 10¹⁵ molec. cm−2 (Fig. 5). The number of continental grid cells for TROPOMI HCHO in a year is about 8.5 × 10⁴.
In a sensitivity study, an additional constraint on surface NO2 mixing ratios obtained from a ground-based network of passive samplers in Africa is applied on top of the constraint on TROPOMI HCHO and NO2 data. INDAAF provides monthly surface concentrations of SO2, HNO3, NH3, NO2, and O3. For the year 2019, we use measurements of monthly NO2 concentrations at seven INDAAF sites (Fig. 6) located in rural, unperturbed areas in western and central Africa (Adon et al., 2010; Ossohou et al., 2023). We use a 6-year record of observations (2015–2020), except for the Agoufou (2015–2018) and Bambey (2016–2020) sites, for which only a shorter period is available. Adon et al. (2010) reported that intercomparison tests between passive and active samplers were performed in order to assess the performance and reliability of INDAAF passive instruments. A correlation of 0.95 within the 5–35 ppb range was inferred with a detection limit at 0.2±0.1 ppb, and the reproducibility was found to be 9.8 %. A linear regression yielded , where y denotes the active samplers and x the passive method used by INDAAF.

Figure 6Locations of the in situ NO2 concentration sites from INDAAF (blue) providing the NO2 mixing ratios and the in situ soil NO flux measurement sites (orange) used in this study.
2.2 The inversion setup and sensitivity tests
Top-down (TD) emission estimates are obtained through an inversion approach that relies on the full adjoint model technique detailed in Müller and Stavrakou (2005). The MAGRITTEv1.1 model is coupled with an iterative minimization algorithm optimizing the emission fluxes in order to minimize the discrepancies between the modelled and observed satellite columns while accounting for errors in the a priori emissions and column observations (Fig. 7).
The a priori emission distributions for a given species are expressed as follows:
with Φj(x,t) the initial flux depending on spatial coordinates (latitude and longitude) and time (month) and j=1…m the emission categories. The top-down fluxes G(x,t) are expressed in terms of the a priori emission distributions Φj(x,t) and a dimensionless control parameter f=(fj) as follows:
The optimization problem consists of the derivation of optimal dimensionless parameters fj(x,t) defined per emission category (biogenic, pyrogenic, anthropogenic), grid cell, and month. The method relies on the minimization of the scalar cost function J, which includes two terms. The first term, denoted JOBS, quantifies the discrepancy between the observations y and the model predictions H(f). The second term, denoted JB, is a regularization term that ensures that the optimized fluxes do not depart much from the a priori fluxes. The cost function is calculated as follows:
where E and B are the error covariance matrices. The former is assumed to be diagonal and accounts for both observational errors and model representativeness errors. The B matrix accounts for errors in the a priori emission parameters and for correlations between errors for different parameters. The adjoint of the model calculates the gradient of J with respect to the parameter vector f. The computation of the cost function and its gradient is performed iteratively until convergence is attained, i.e. when the norm of the gradient of the cost function is decreased by a large factor (>20) with respect to its initial value, which typically requires 30–60 iterations.
For this study, a simultaneous inversion of VOC and NOx emissions is performed, using monthly averaged TROPOMI HCHO and NO2 column data as top-down constraints, such that the cost function contains four terms:
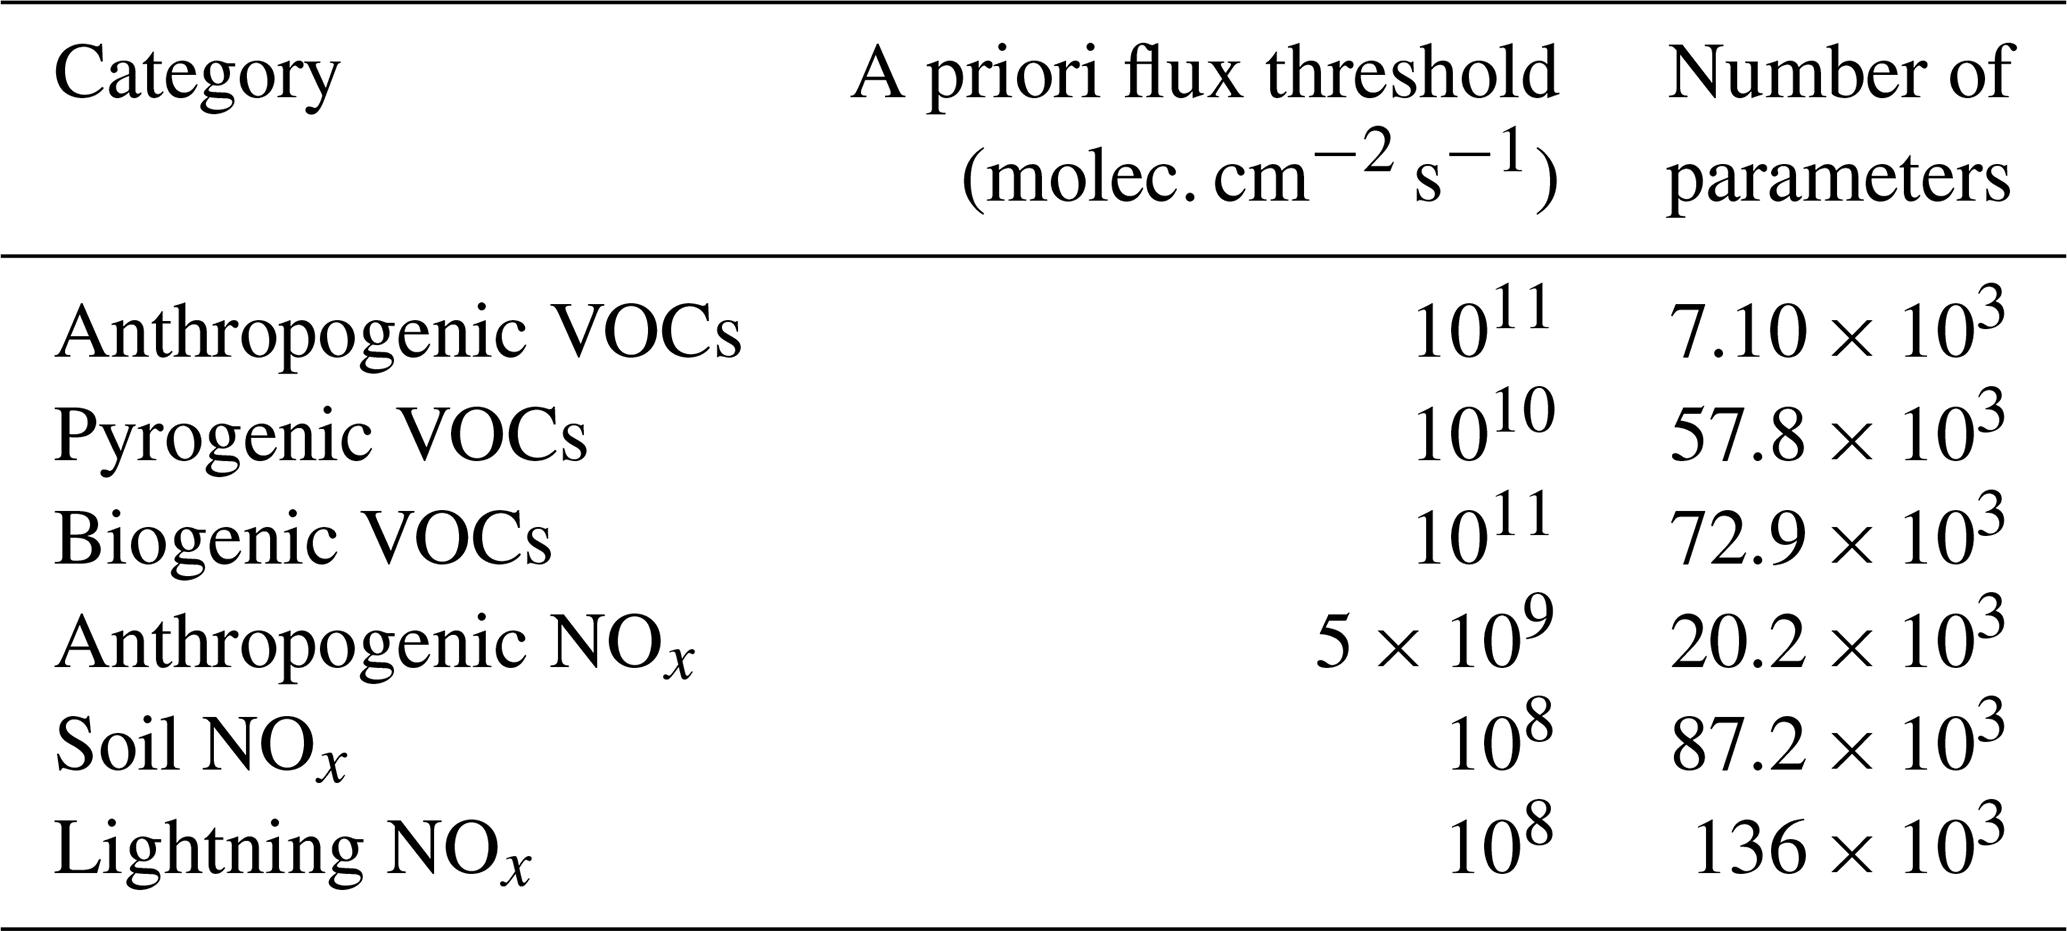
In the joint inversion setup, six emission categories are optimized at 0.5° × 0.5° resolution over the African domain (30° S–17° N, 18° W–56° E): anthropogenic VOCs, biomass burning VOCs, biogenic VOCs, anthropogenic NOx, soil NOx, and lightning NOx. Since fire scenes are filtered out of TROPOMI NO2 data, the pyrogenic NOx emissions are not optimized but are scaled as the biomass burning VOC emissions. Fluxes are only optimized over land and when the a priori maximum monthly flux exceeds a given threshold depending on the category (see Table 1). This brings the number of control parameters to be optimized to about 3.8 × 10⁵. Note that the total number of observational constraints is much lower, i.e. ca. 1.6 × 10⁵ after filtering. Filtered grid cells provide no constraints on NOX emissions for certain pixels and months. The effective number of control parameters is further reduced by defining spatio-temporal correlations between emission parameters of the error covariance matrix B.
Table 1Emission categories considered for the inversion and number of emission parameters per category. Emissions are optimized for a given category and pixel only when the maximum monthly flux exceeds the threshold given in the second column.
Spatial and temporal correlations are assumed to be decoupled, i.e. , where B(r) and B(t) are the spatial and temporal components, respectively. The assumed error in the a priori fluxes for all the emission parameters is taken to be equal to 1.1 (corresponding to an uncertainty factor of 3). The spatiotemporal correlation lengths of the biogenic and pyrogenic covariance matrices are set to 500 km for both VOCs and NOx. Acknowledging the arbitrary nature of these choices, sensitivity tests will be conducted to assess their impact (Sect. 2.3). Anthropogenic and biomass burning spatial and temporal correlations are defined as in Stavrakou and Müller (2006). For the soil and lightning emissions, the spatial correlations are assumed to decrease exponentially with the distance dij between two grid cells i and j, with a decorrelation length l set to 500 km:
where is the relative error in the flux. The diagonal components of the error covariance matrix are the squares of the relative errors in the fluxes emitted in grid cell i: . For isoprene, the error covariance matrix is defined based on the errors in the fluxes emitted from different grid cells and depends on the PFTs defined in the MEGAN–MOHYCAN model. The non-diagonal terms of the B matrix are defined as follows:
where represents the fraction of the flux emitted in cell i by the PFT n. In this way, the correlation is zero if the PFTs in pixels i and j are completely different. The temporal correlation of the errors is assumed constant for soil and is set to 0.3. For the lightning and isoprene emissions, it is assumed to decrease linearly from 0.7 for consecutive months to 0.4 after 6 months. The error covariance matrix E is assumed to be diagonal. That is, the errors are assumed to be uncorrelated. The errors in the monthly TROPOMI averages are estimated from the reported retrieval errors, to which an assumed model or representativity error (2 × 10¹⁵ molec. cm−2 for HCHO and 5 × 10¹⁴ molec. cm−2 for NO2) is added quadratically. In the case of HCHO, the reported error has systematic and random components, and the random part is strongly reduced upon data averaging. Regarding NO2, an error correlation of 50 % is assumed between retrieval errors in individual measurements contributing to the monthly average (Eskes et al., 2003; Stavrakou et al., 2013).
Monthly averages relying on less than 4 d of valid data and grid cells with fewer than 10 valid observations and oceanic columns are omitted from the inversion. The modelled monthly averages are sampled at the times and locations of the TROPOMI monthly means and account for the averaging kernels of the observations. The simultaneous optimization of VOC and NOx emissions takes advantage of the constraints provided by both satellite datasets while accounting for NOx–VOC chemical interdependencies. The impact of the two-species inversion will be assessed against the more usual single-species inversions (Sect. 2.3).
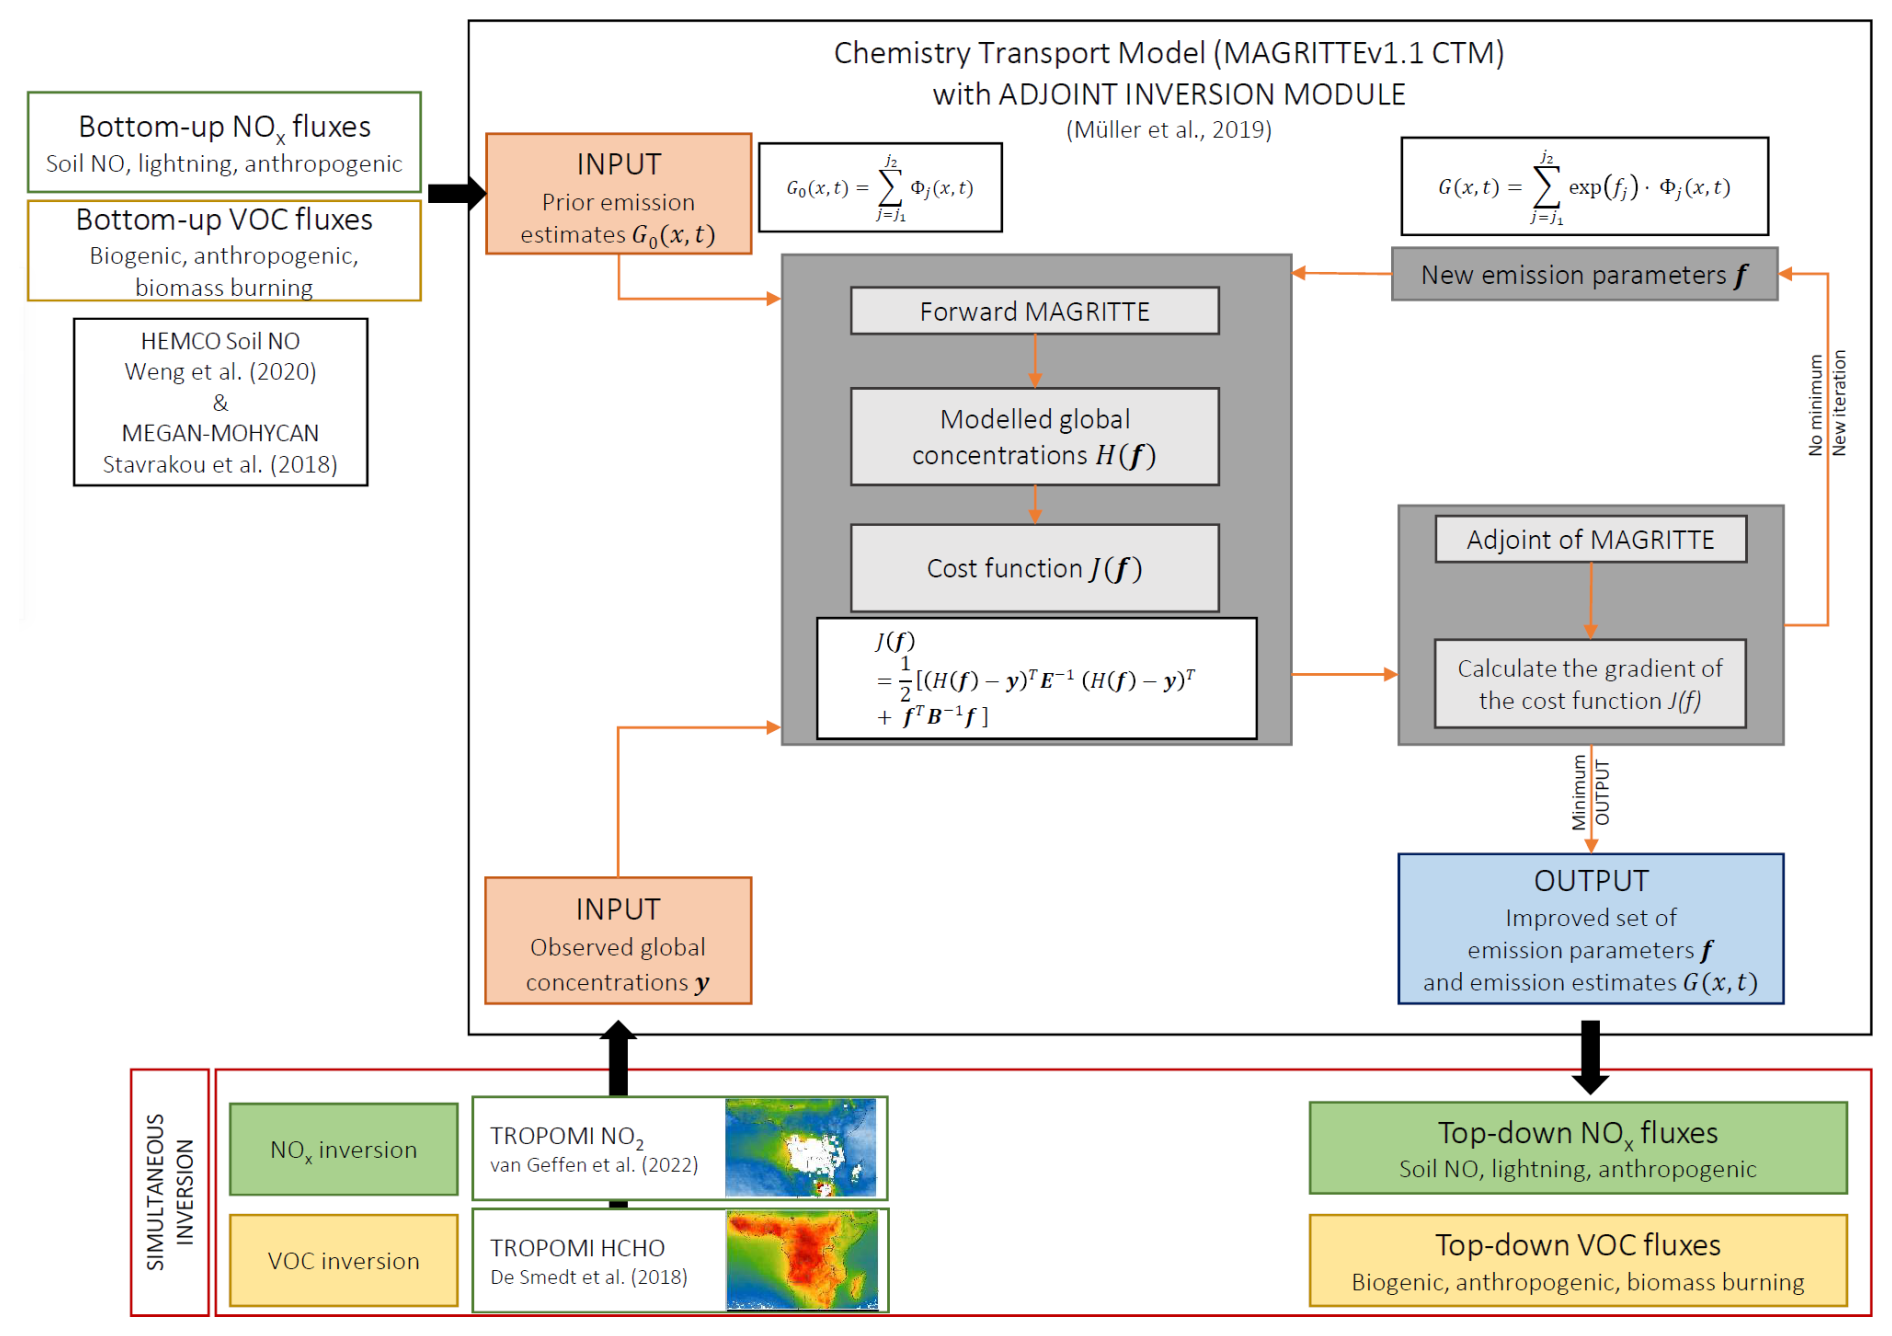
Figure 7Schematic flowchart of the inverse modelling approach using the adjoint inversion module of MAGRITTEv1.1 with inputs from bottom-up inventories and satellite observations. Descriptions of the different annotations used in the flowchart can be found in Sect. 2.2.
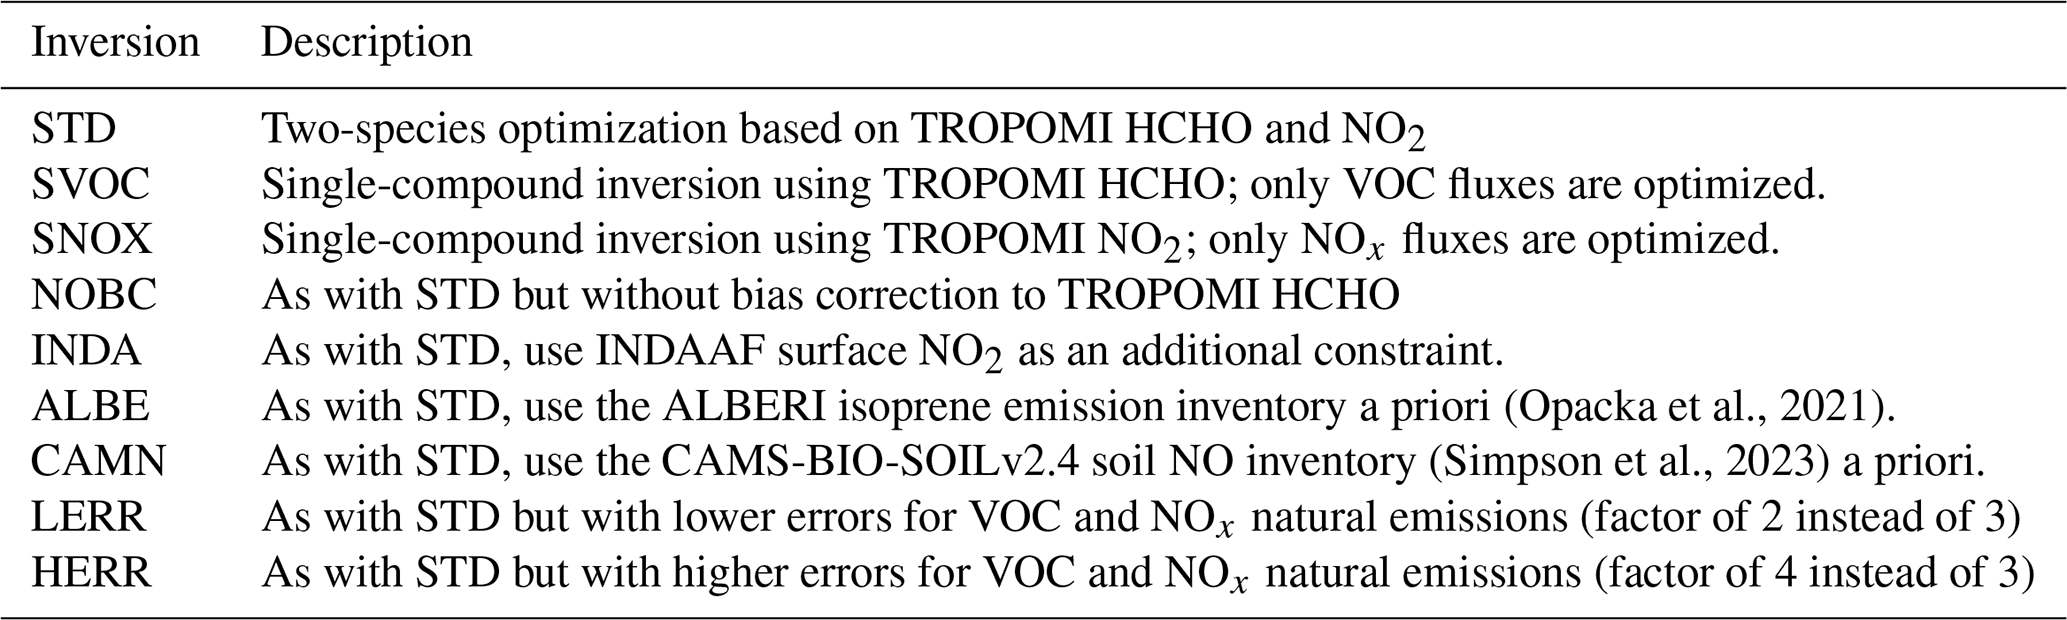
The reference inversion run, referred to as STD, is performed using a priori emissions for the natural sources of VOC and NOx provided by MEGAN, HEMCO, and the lightning parameterization of Price and Rind (1992), scaled globally to 3.4 TgN yr−1. For the evaluation of the range of uncertainty, we perform an ensemble of inversions (Table 2) that aims to assess the impact of (i) single-species inversion (SVOC and SNOX), (ii) the bias correction of the HCHO satellite data (NOBC), (iii) the use of in situ NO2 data from the INDAAF network (INDA) as additional constraints on NOx emissions, (iv) alternative choices for BVOC and soil emission inventories (ALBE and CAMN), and (v) different assumptions for critical inversion parameters (LERR and HERR). The a priori emissions used in simulations ALBE and CAMN were introduced and described in Sect. 2.1.1. All other inputs and model parameters are prescribed as defined in the STD simulation. For the INDA inversion, the assumed error in the INDAAF NO2 mixing ratio constraint is set to 10 %.
Table 2Description of the performed runs, including the standard inversion (STD) and the sensitivity runs.
2.3 Datasets for validation
2.3.1 In situ measurements
The a priori and top-down soil NO fluxes are evaluated against in situ soil NO measurements obtained from an extensive literature review. Measurements were performed in various biomes through various campaigns that took place during the 1991–2016 period. The compilation comprises 19 in situ soil NO flux data in Africa from 11 sites (Fig. 6). The mean fluxes over the wet and dry seasons are given in Table 3 for all the sites. Furthermore, the a priori and top-down surface concentrations of NO2 will be evaluated against the INDAAF data record introduced in Sect. 2.1.2.
Table 3Compilation of in situ flux measurements of soil NO from the literature (1010 molec. cm−2 s−1), with a distinction between the dry (D) and wet (W) seasons. Also given is the type of biome at the measurement site: savanna (S), forest (F), or mixed (M).
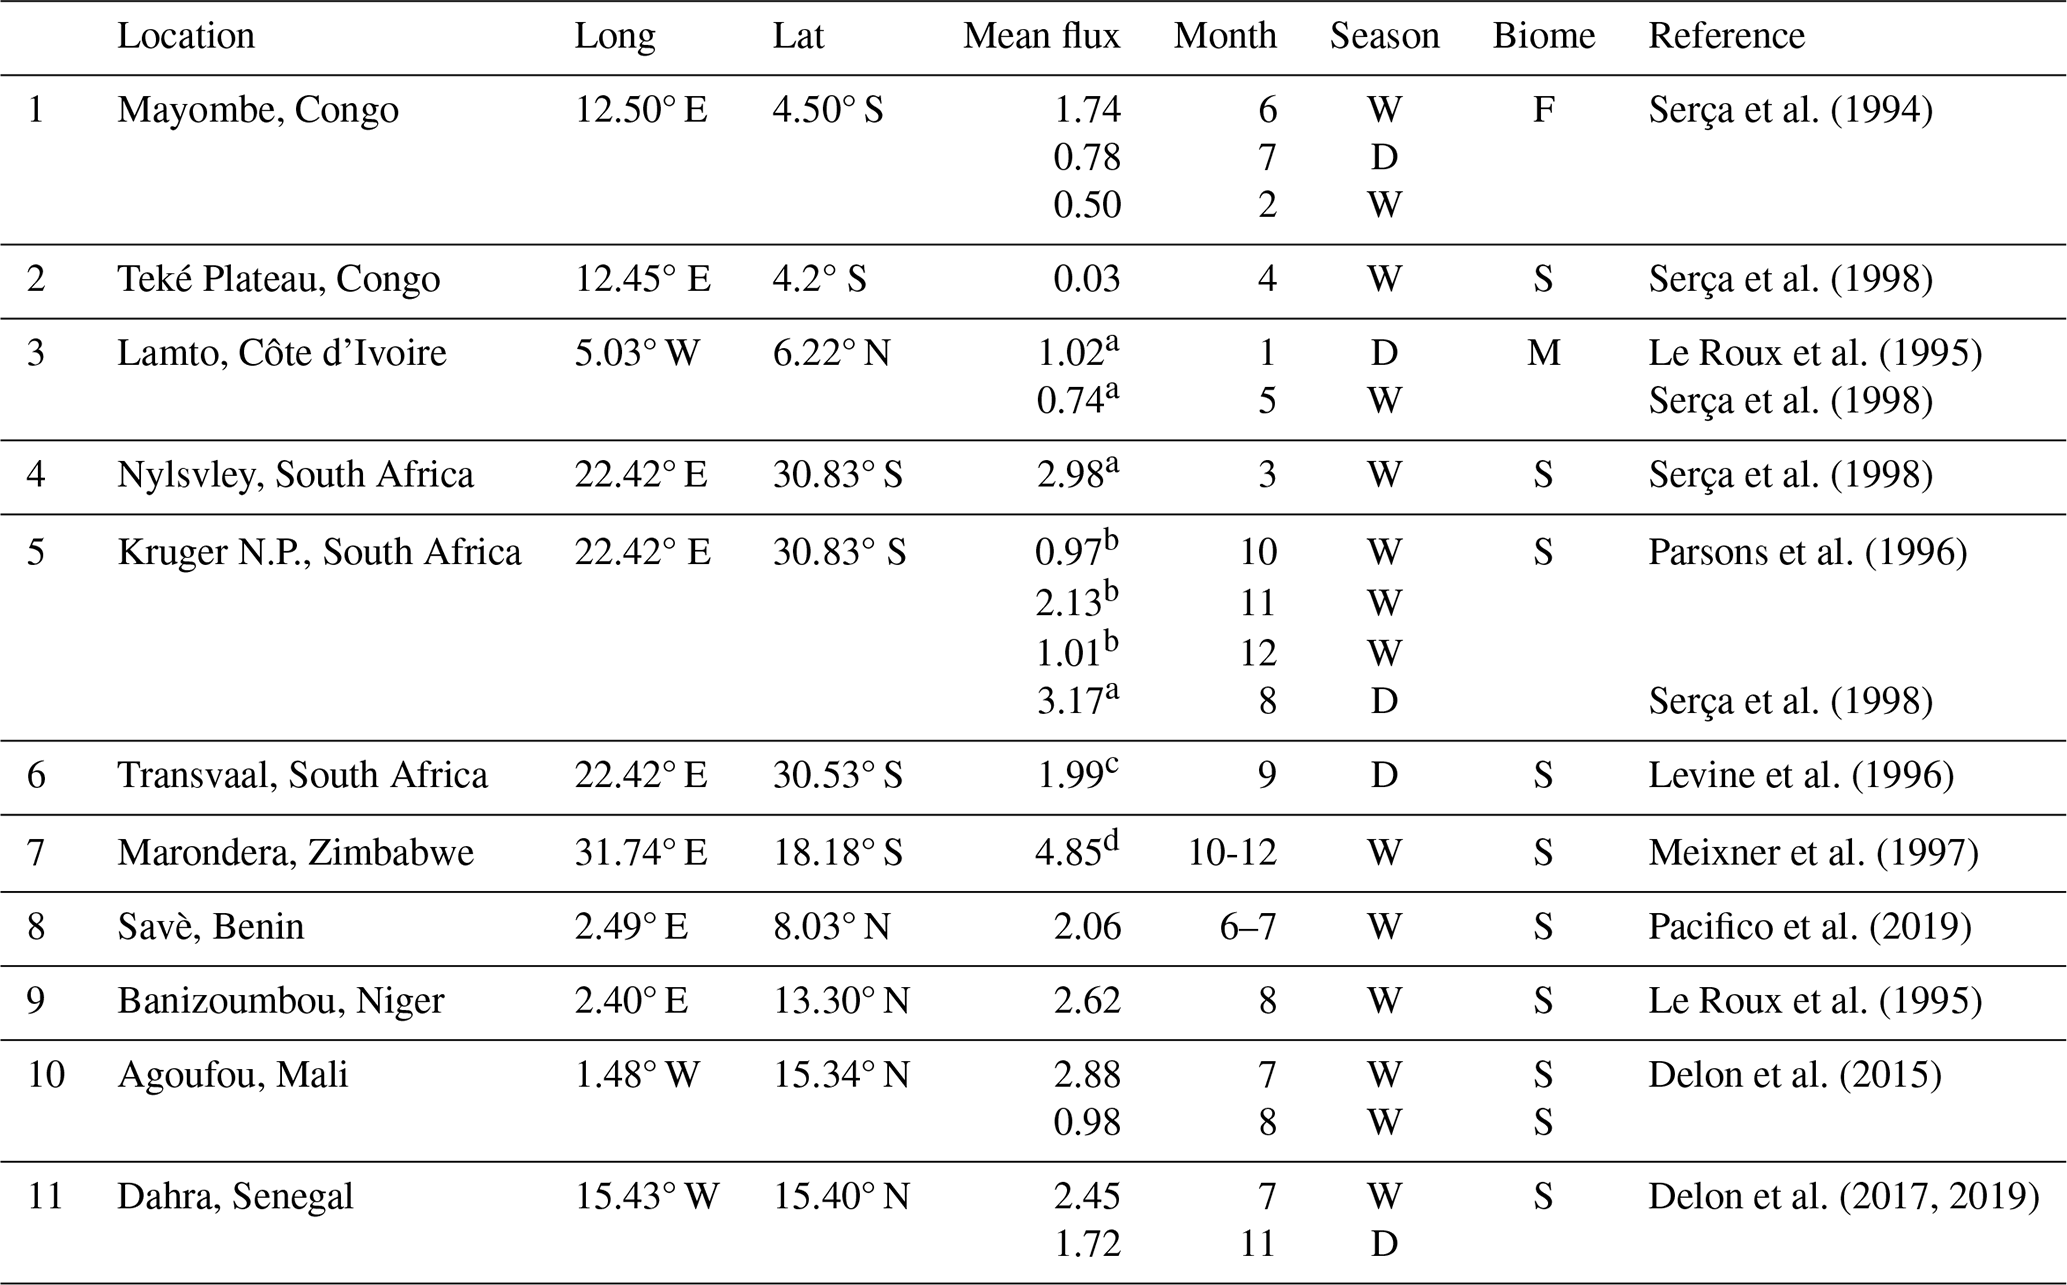
a Average of forests and/or savanna ecosystem mean fluxes weighted by the number of individual chamber measurements. b Arithmetic average over three unburned sites. c Arithmetic average of uncorrected NO fluxes at the dry control sites of Shabeni 6 and Kambeni 1. d Arithmetic average of measurements over grasslands, forests, fertilized and unfertilized crops, and fallow fields.
2.3.2 Upper-tropospheric NO2
While there are multiple sources of NOx in the upper troposphere (UT) (lightning, aircraft, deep convective uplift of boundary layer pollution, and downwelling from the stratosphere), lightning NO emissions are the dominant direct upper-tropospheric NOx source (Lamarque et al., 1996; Murray, 2016; Schumann and Huntrieser, 2007). Satellite-based NO2 volume mixing ratios (VMRs) in five discrete layers in the troposphere from the surface to the tropopause were obtained using the cloud-slicing technique applied to the total columns of NO2 from TROPOMI (Horner et al., 2024). This technique retrieves the NO2 VMR using the observed relationship between the cloud top pressure and the column above optically thick clouds developed by Ziemke et al. (2001) for ozone in the free troposphere. Five layers of seasonally averaged NO2 VMRs at 1° × 1° between 2018 and 2022 are available and were retrieved from corrected TROPOMI total columns using cloud fraction and cloud top height data from the FRESCO-wide algorithm (Eskes and Eichmann, 2023). After regridding to a finer spatial resolution of 0.5° × 0.5°, the cloud-sliced UT NO2 was obtained by averaging the two upper-tropospheric layers, i.e. 320–180 and 450–320 hPa. Here, we use the cloud-sliced TROPOMI UT NO2 VMRs to assess the a priori and top-down lightning emissions. This dataset will be referred to further as cloud-sliced NO2.
2.3.3 Cross-track Infrared Sounder (CrIS)
Satellite-based isoprene column products are obtained from CrIS, a Fourier transform spectrometer flying in a sun-synchronous orbit on board the NASA/NOAA Suomi-NPP satellite launched in October 2011 (Wells et al., 2020, 2022). The instrument features a high spectral performance (0.625 cm−1 resolution in the longwave IR 650–1095 cm−1), low noise (e.g. ∼0.04 K at 900 cm−1 and 280 K), and near-global coverage twice daily (01:30 and 13:30 local time), with the afternoon overpass corresponding to the peak of the isoprene emissions. The isoprene retrieval algorithm relies on the hyperspectral range index (HRI) to quantify column abundances (Franco et al., 2018) retrieved from thermal infrared radiances in the ν27 and ν28 (from 890 to 900 cm−1) absorption regions. Monthly distributions at 0.5° × 0.625° resolution (regridded onto 0.5°) for the year 2019 are used to evaluate the a priori and optimized isoprene columns.
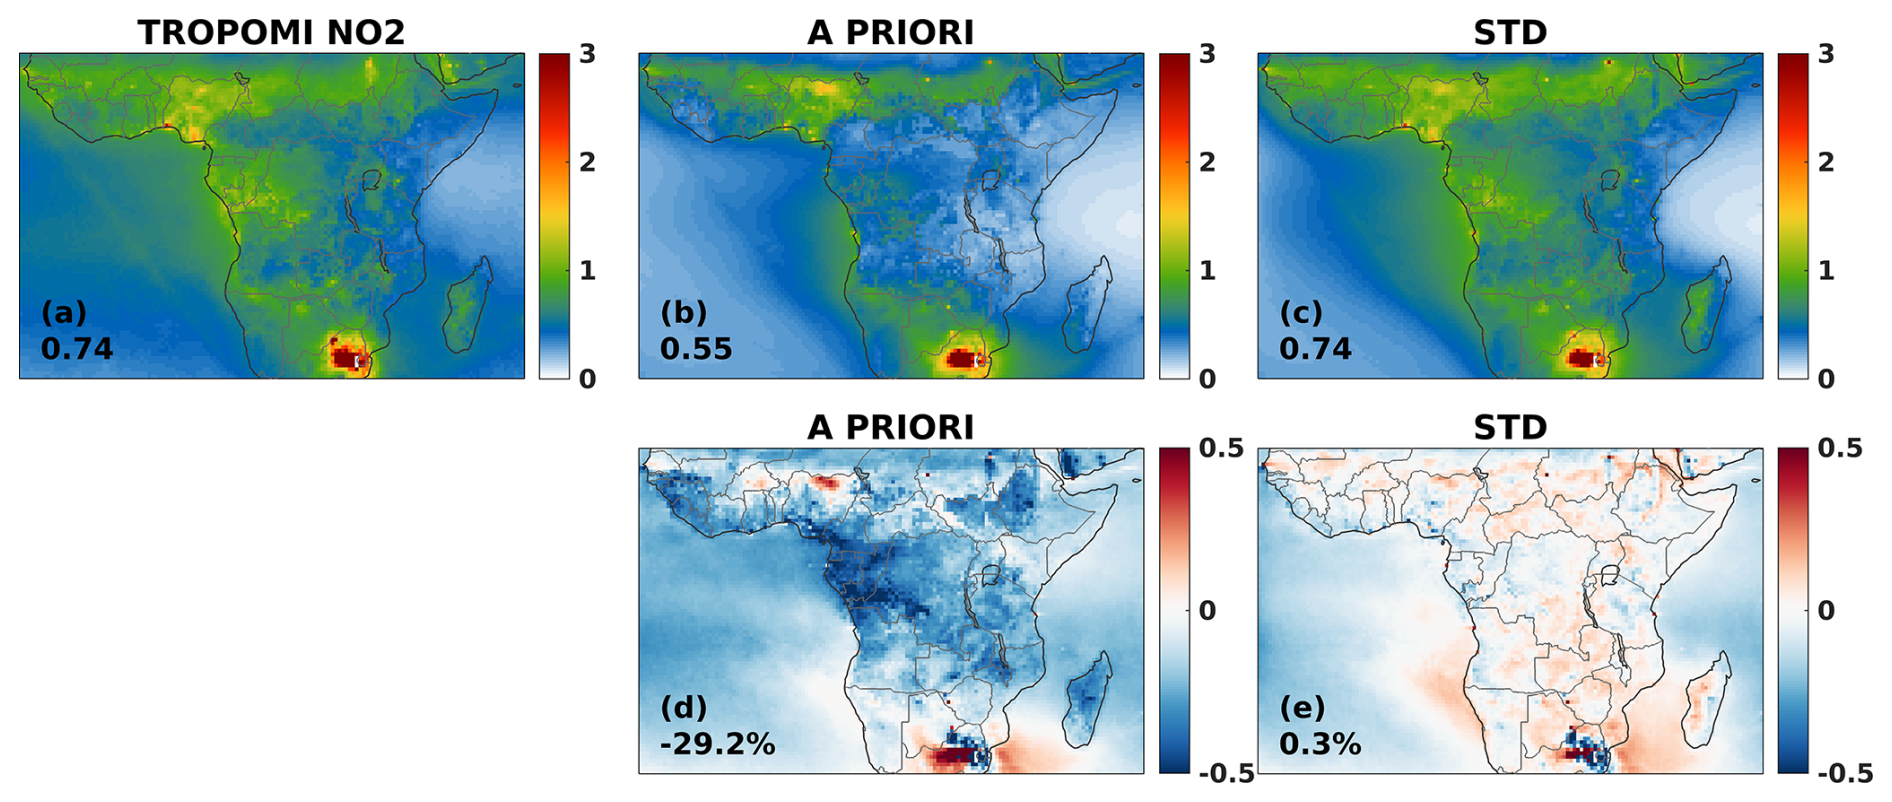
Figure 8Spatial distribution of the annual NO2 columns (1015 molec. cm−2) of (a) TROPOMI, (b) the a priori model, and (c) the STD inversion. Average annual columns over land are provided as an inset. The absolute differences (1015 molec. cm−2) are shown in the bottom row: (d) A PRIORI–TROPOMI and (e) STD–TROPOMI. The average percentage bias in NO2 column densities over the continent is provided as an inset.

Figure 9As in Fig. 8 but for HCHO.
3.1 Optimized HCHO and NO2 columns
As expected, the emission optimization leads to very good agreement with TROPOMI observations in terms of both spatial distribution and magnitude (Figs. 8 and 9). The domain-averaged MAGRITTE NO2 column over land increases from 0.55 × 10¹⁵ molec. cm−2 in the a priori run to 0.74 × 10¹⁵ molec. cm−2 in the STD inversion, resulting in a strong bias reduction from −26 % to almost zero after inversion. The a priori model underestimation is ubiquitous in Africa and is most pronounced in eastern Africa (−34 %, region 2 in Fig. 10) and above the rainforest (−42 %, region 3). These large biases are largely reduced after inversion. Discrepancies still persist, however, in the South African Highveld region (Fig. 8), where the annual TROPOMI NO2 columns reach their highest value over the domain (ca. 14 × 1015 molec. cm−2). This hotspot stems from the strong anthropogenic emission sources located in the Highveld region, i.e. the densely populated cities of Johannesburg and Pretoria, several unregulated large coal power plants, and highly concentrated, energy-intensive industrial facilities in the Mpumalanga region (Matandirotya and Burger, 2021). Tropospheric column densities over the oceans are very low due to the low emissions over the ocean and the short NOx lifetime. The main sources of NOx over the ocean are in-cloud lightning and continental outflow, in addition to a small contribution from ship and aircraft emissions (IPCC, 2007). Moreover, TROPOMI retrieval errors are much higher over the ocean than over continents (easily above 100 % and ranging up to 600 %), and therefore oceanic grid cells are not considered in the optimization. Nevertheless, the bias over the ocean is also reduced after inversion, from −34 % in the a priori run to −16 % in the STD run, with improvements occurring mainly along the western coast of Africa due to the transport of continental air masses by the southeasterly trade winds (Fig. 8).
Likewise, the domain-averaged bias in the HCHO columns is improved after inversion, from −12 % to −2 % (Fig. 9). The a posteriori columns match the bias-corrected HCHO data south of 8° S very well, where the large negative bias of the a priori simulation (−28 %) (regions 4 and 5 in Fig. 10) is largely reduced as a result of the strong enhancement of isoprene emissions, as discussed in Sect. 3.2. Over the equatorial region, the a priori columns reproduce the observed columns in the second half of the year very well and are moderately underestimated from February to May. The optimization corrects this mismatch by inferring an increase in isoprene emissions. The a priori model overestimation over the Central African Republic and South Sudan gives way to excellent agreement after the inversion, which is realized by strongly reducing the biogenic and biomass burning emissions in these areas (Fig. 13 for isoprene and Fig. 14 for biomass burning).
For all the regions of Fig. 10, the root-mean-square error (RMSE) lies below 1015 molec. cm−2 after optimization for both species. The a priori columns capture the observed seasonality relatively well, and the a posteriori agreement is greatly improved. The performed sensitivity inversions lead to very similar results with respect to TROPOMI HCHO and NO2 columns and are therefore not shown in Fig. 10 for the sake of simplicity.
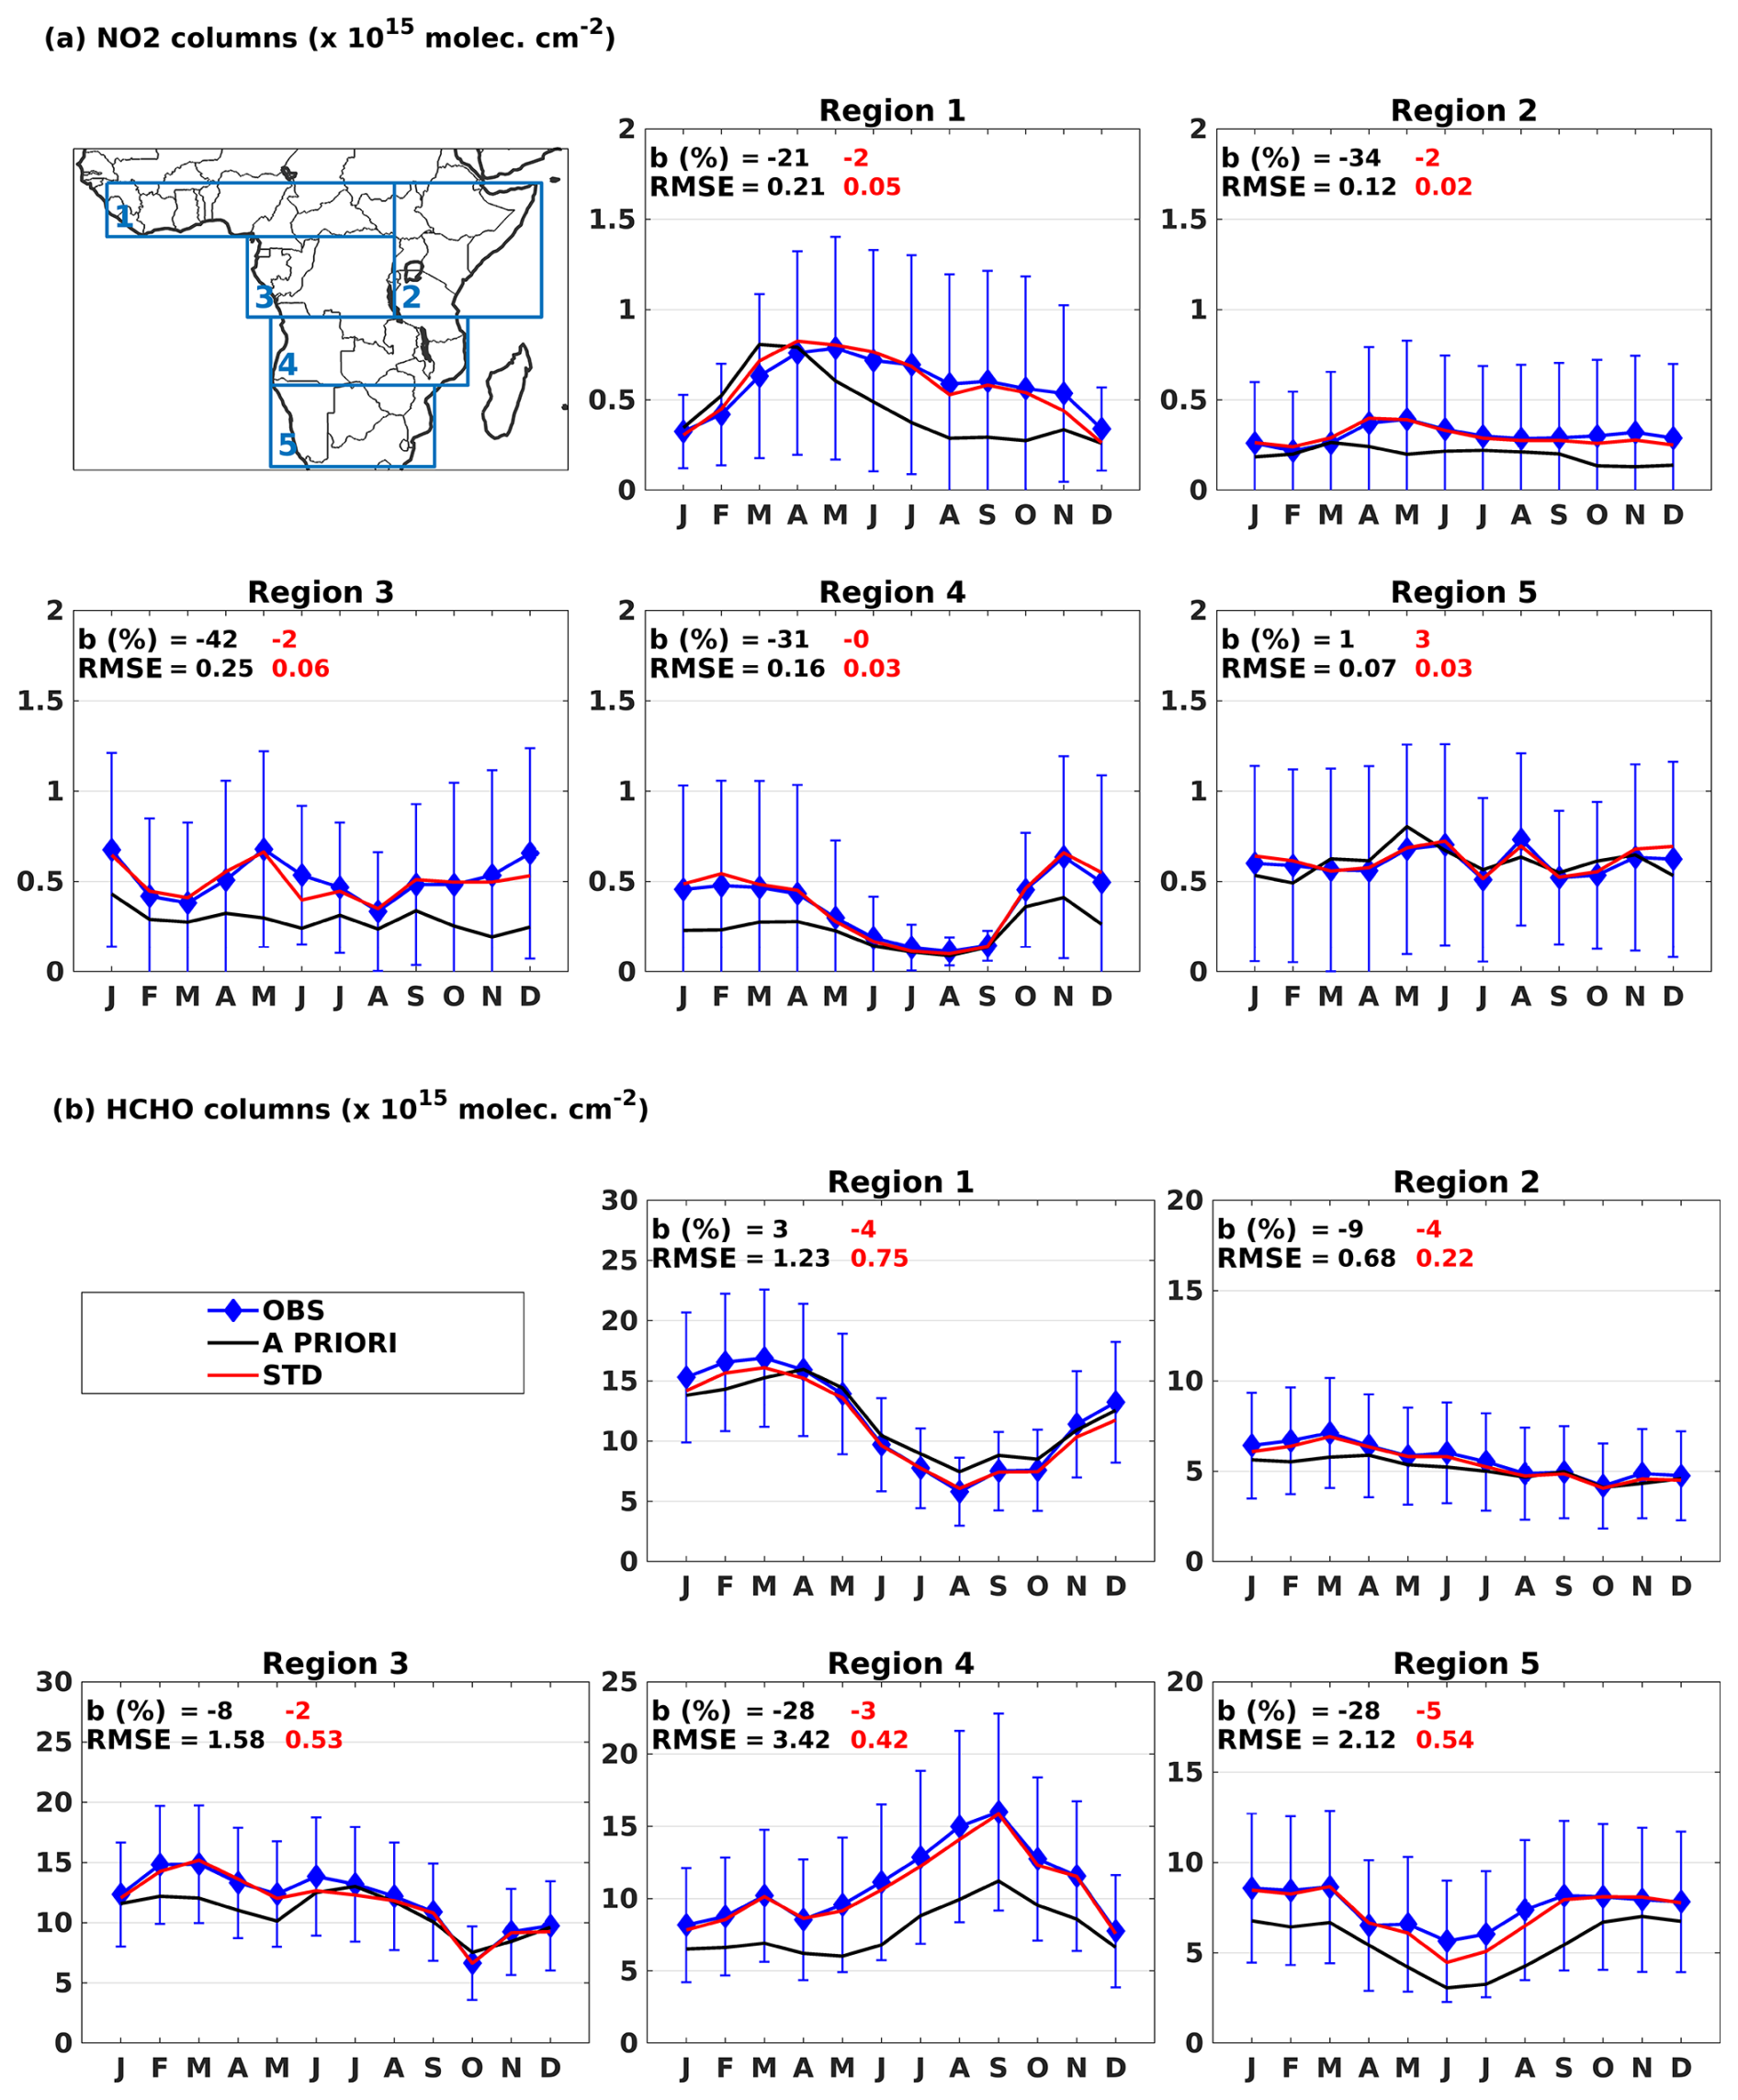
Figure 10Time series of continental (a) NO2 and (b) HCHO columns (1015 molec. cm−2) over the defined regions shown as an inset. TROPOMI NO2 and bias-corrected TROPOMI HCHO columns (referred to as OBS) are depicted as blue diamonds with their corresponding retrieval errors. The a priori and optimized modelled columns are shown in black and red, respectively. The annual bias (%) and the RMSE are shown as an inset for the a priori (black) and STD (red) inversions. The regions are defined as follows: region 1 (4–12° N, 13° W–30° E), region 2 (8° S–12° N, 30–52° E), region 3 (8° S–4° N, 8–30° E), region 4 (8–18° S, 11.5–41° E), and region 5 (18–29.5° S, 11.5–36° E).
3.2 Optimized fluxes
In the following we present the top-down distributions of soil and lightning NOx fluxes, isoprene, and biomass burning VOC fluxes (Figs. 11–14 and Fig. S1 in the Supplement), as summarized in Table 4 and Fig. 15. The satellite data indicate decreases in soil emissions in the Northern Hemisphere and a strong enhancement along the eastern coast of the continent (Fig. 11). Higher soil NOx emissions (up to a factor of 4) are inferred by the STD optimization in eastern Africa (between Tanzania and the Horn of Africa), moderate decreases (up to 30 %) over the Congo rainforest, where a priori emissions are very low, and a decrease (up to 80 %) in the largest part of northern Africa in the Sahel region. Large differences in the optimized soil NO fluxes are inferred from the different inversions (SNOX, CAMN, and INDA; Fig. 11) above the equatorial forest.
The single-species inversion SNOX leads to the same total annual soil NO flux as the STD inversion of 2.4 TgN (Fig. 15a). However, a higher emission reduction is found by the SNOX inversion in southern Congo and Angola compared to the base inversion (Fig. 11f–g), whereas a soil emission increase is derived over Gabon, where a decrease was found by STD. This difference can be explained by the impact of isoprene emission changes on the lifetime of NOx. Isoprene emissions have two opposing effects on the lifetime of NOx. On the one hand, the reaction of OH radicals with isoprene and its degradation products depletes OH levels, which tends to increase the lifetime of NOx (through the NO2+OH reaction). On the other hand, isoprene emissions enhance the sink of NOx due to the formation of organic nitrates (RONO2) through RO2+ NO2→ RONO2, where RO2 denotes peroxy radicals from isoprene oxidation (Romer Present et al., 2020). Organic nitrates are partially lost through either dry or wet deposition or heterogeneous reactions on aerosols, which result in a significant net loss of NOx (Müller et al., 2019). This effect tends to decrease the NOx lifetime. Over isoprene source areas with moderate to low NOx levels, the dominant influence is the increased loss of NOx through organic nitrates (Müller et al., 2019). Therefore, the higher (lower) isoprene fluxes derived from the STD inversion over southern Africa (Gabon) (Fig. 13) lead to decreased (increased) NOx lifetimes and increased (decreased) NOx emissions over these regions in the STD run.
The INDA inversion leads to the largest increase in the equatorial region (by a factor of up to 6) as a consequence of using the INDAAF in situ NO2 measurements at Zoetelé and Bomassa as constraints in the inversion, and it leads to localized enhancements in the western regions that coincide with the Katibougou, Lamto, and Banizoumbou sites (Fig. 6). Unlike the other inversions, CAMN predicts an enhancement in the soil NO emissions in Southern Hemisphere Africa (a factor of up to 4) with respect to the CAMS-BIO-SOIL bottom-up inventory, resulting in the highest annual flux estimate of 3.1 TgN (Fig. 15a), which is in very good agreement with a previous GOME-based estimate over Africa (3.3 TgN; Jaeglé et al., 2005) with almost equal contributions from northern and southern Africa.
The Sahel is of particular interest since it exhibits large pulses of soil NO emissions at the beginning of the rainy season in May to June and later on in September (Jaeglé et al., 2005). Based on OMI NO2 columns, Vinken et al. (2014) found that this region emitted a total of 0.52 TgN in 2005, half of which occurred during the pulsing period from April to June. Here we derive a total of 0.37 TgN in 2019 with a primary peak in June, with 40 % of the total top-down emissions released between April and June and a secondary peak in October (0.04 TgN vs. 0.06 TgN in June).
Top-down lightning emissions in STD are increased by a factor of 4 in the STD case relevant to the a priori estimate (0.54 TgN) and range between 1.5 TgN in the CAMN run and about 2 TgN in the STD, SNOX, and HERR inversions (Table 4 and Fig. 15b). The highest fluxes are found in the equatorial region and in western Africa. Note that the inversion with the highest soil NO emissions (CAMN) has the lowest optimized lightning fluxes among all the inversions. In all the scenarios, TROPOMI suggests that NO emissions from lightning should increase everywhere (except over South Africa). The sum of soil and lightning NOx emissions inferred by the standard and sensitivity inversions is consistently close to ca. 4 TgN, which is 67 % higher than the a priori estimates used in the inversion (2.4 TgN). The relative share of lightning emissions increases from 21 % of the total natural NOx flux in the a priori inversion to 45 % in the standard inversion, at the expense of soil emissions. This relative share of lightning ranges between 30 % and 50 % across the sensitivity runs. This underscores the inherent difficulty in separating their relative contributions to the total column over Africa, where both sources are important.
The bias-corrected TROPOMI data indicate an increase in the annual isoprene fluxes from 125 Tg in the a priori inversion to 165 Tg in the benchmark STD inversion, whereas the range of optimized emissions extends from 61 Tg for the NOBC inversion, for which no bias correction is applied, to 185 Tg in SVOCs, where only VOC fluxes are optimized (Fig. 15c and Table 4). The optimization yields similar distributions of the scaling factor across the sensitivity inversions, except for NOBC, which clearly stands out (Fig. 13). In the STD inversion, the isoprene decrease north of the Equator occurs mainly in August with a substantial drop suggested by TROPOMI, while in the equatorial region there is a moderate increase in the annual basis from 29 to 36 Tg and a strong enhancement of 70 % in isoprene emissions in March (Table 4 and Fig. S1). Most prominently, the distributions show strong emission enhancements in southern Africa, i.e. a factor of 2 or more over regions 4 and 5 (Table 4) and a factor of up to 5 locally. Similar emission adjustments, i.e. a decrease north of the Equator and an increase south of the Equator, were also derived from the inverse modelling of CrIS isoprene columns using the GEOS-Chem model for the year 2013 (Wells et al., 2020). The ALBE inversion leads to slightly lower annual isoprene emissions (135 Tg) compared to the base inversion estimate (165 Tg), which is due to the lower a priori total isoprene emissions of the ALBERI inventory (83 Tg, vs. 125 Tg in the a priori of STD) and the lower tree cover in this inventory (Opacka et al., 2021). At the lowest end of the range we find the inferred isoprene emissions of the NOBC inversion, which does not use a bias correction for the TROPOMI HCHO data (61 Tg). This estimate is in close agreement with previous top-down estimates (60–70 Tg) based on OMI HCHO data not corrected for biases (Bauwens et al., 2016; Marais et al., 2012). However, OMI HCHO data were recently reported to also be subject to biases thanks to an extensive evaluation using FTIR and in situ aircraft data (Müller et al., 2024; Vigouroux et al., 2020). After correcting for the bias in OMI HCHO columns, Müller et al. (2024) derived quite similar top-down isoprene emissions (153 Tg), as in the STD inversion using bias-corrected TROPOMI HCHO data (165 Tg), showing good consistency between both top-down emission estimates and much higher estimates with respect to previous studies. Finally, the inferred isoprene flux from the SVOC run is 14 % higher than in the standard inversion (SVOC/STD: 185/165; Table 4). This is attributed to chemical feedbacks, i.e. the influence of NOx on OH levels and the yield of HCHO from VOC oxidation. More specifically, the overall higher top-down natural NOx emissions from the STD inversion (4 TgN compared to 2.4 Tg in the a priori result in higher modelled HCHO, and therefore relatively lower isoprene fluxes are required to match the observations compared to the SVOC case.
For sub-equatorial Africa, the CrIS-derived isoprene emissions reported in Wells et al. (2020) indicate an emission hotspot over Angola, in very good agreement with the spatial distribution and magnitude found in our HCHO-based emissions (Fig. 13).
Although the top-down biomass burning VOC emissions (Fig. 14 and Table 4) remain close to the a priori estimates, important changes are found in the spatial patterns. Relevant to the a priori inventory (QFED), fluxes are reduced by a factor of 3 over western Africa, the Central African Republic, southern Congo, and Angola and are strongly enhanced in Mozambique, South Africa, and Madagascar (factors of 4–6), whereas moderate increases are derived above Nigeria (a factor of less than 2). The derived STD pyrogenic fluxes (33 Tg VOC; Table 4) show a comparable spatial distribution with OMI-based estimates in Africa (Müller et al., 2024) but are lower on average by 25 %. Closer agreement with Müller et al. (2024) is achieved in the SVOC setting, i.e. within 10 %. The top-down anthropogenic NOx and VOC emissions (Fig. S2) do not change much relative to the a priori, except in Nigeria, where NOx emissions decrease by about 30 % compared to CAMS. Anthropogenic VOC emissions decrease from 7 to 4 Tg VOC in the STD inversion.
Overall, the optimization based on both TROPOMI HCHO and NO2 reveals increases in natural fluxes compared to the bottom-up inventories of 26 %, 263 %, and 30 % for soil, lightning, and isoprene emissions, respectively, together with a small biomass burning decrease (Fig. 14 and Table 4). Good general consistency is found between the results of the different sensitivity inversions, although several inversions stand out, more specifically the NOBC, SVOC, ALBE, and CAMN inversions.
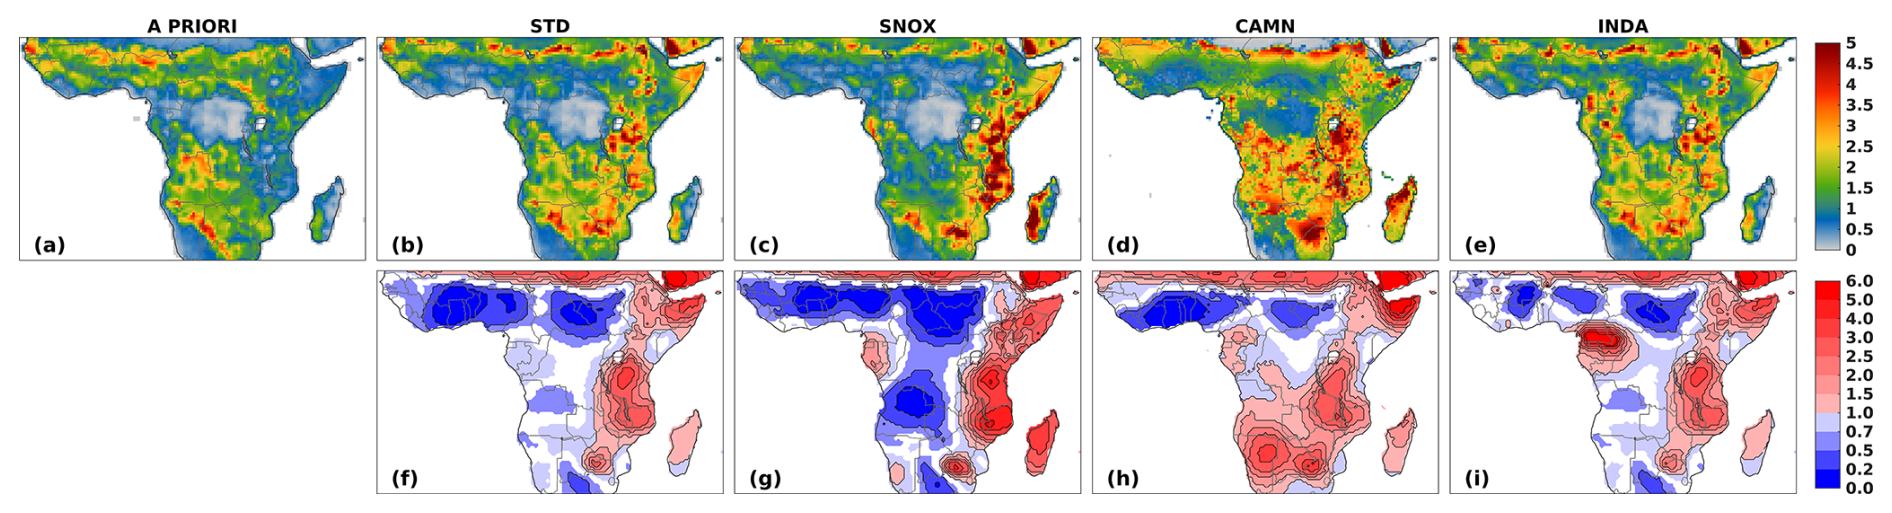
Figure 11The top row shows the spatial distribution of annual soil NOx emissions (1010 molec. cm−2 s−1) a priori and resulting from the different inversions (STD, SNOX, CAMN, and INDA). The bottom row shows the annual scaling factor resulting from the inversion (top-row maps divided by the corresponding a priori). The blanks represent regions where the annual scaling factors lie between 0.9 and 1.1, i.e. 10 % change with respect to a priori fluxes.
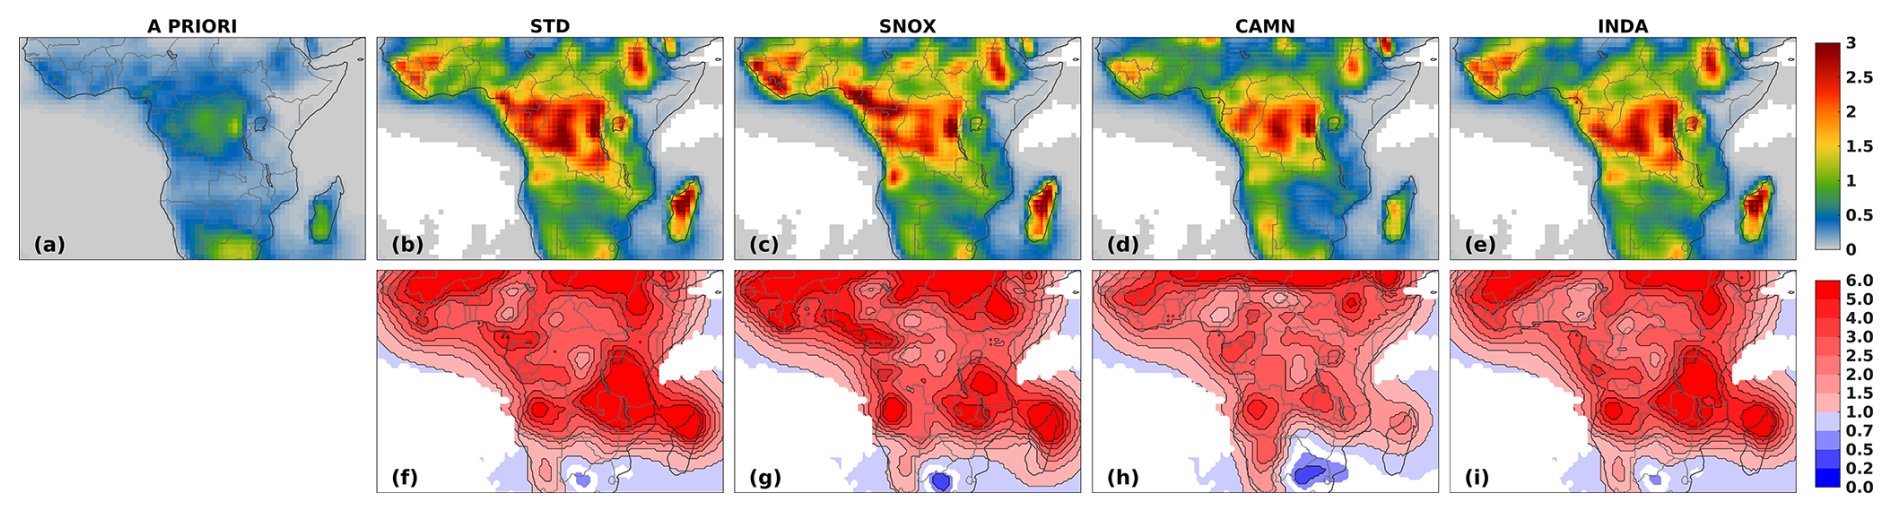
Figure 12As in Fig. 11 but for lightning NOX emissions.
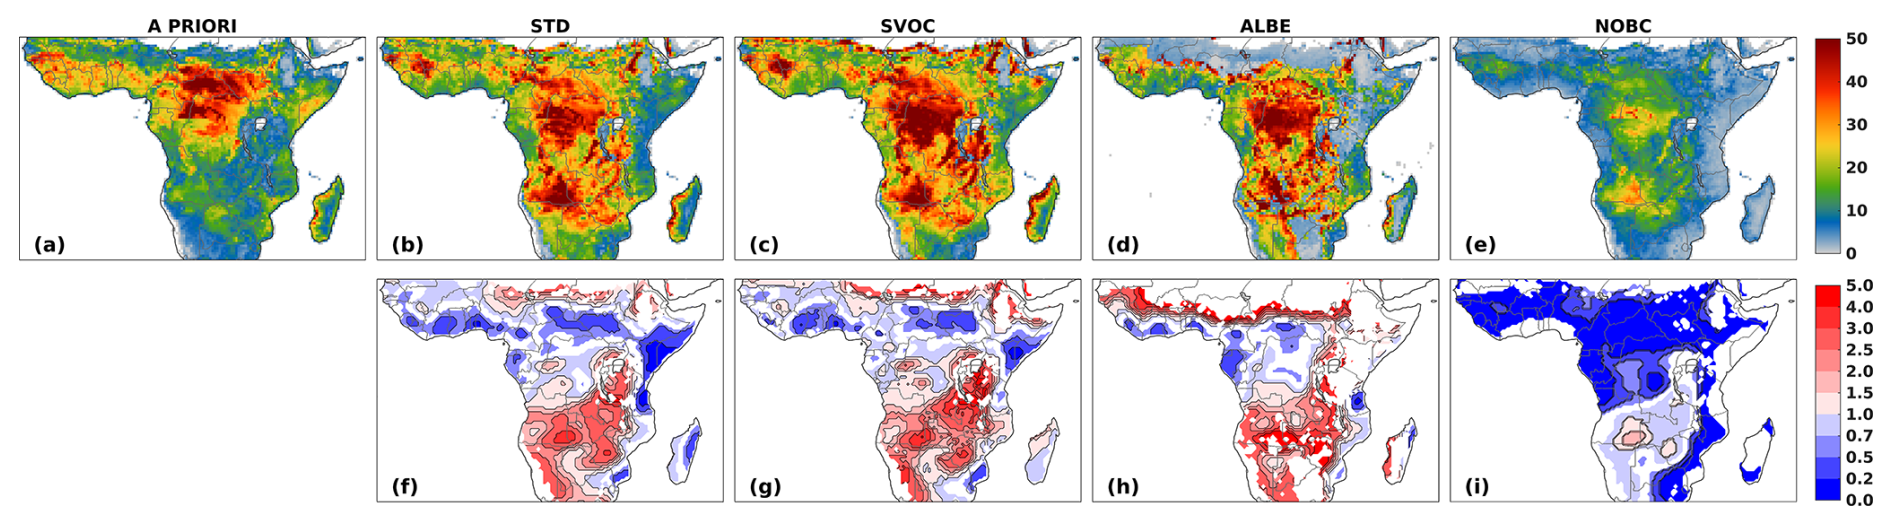
Figure 13The top row shows the spatial distribution of annual isoprene emissions (1010 molec. cm−2 s−1) a priori and resulting from the different inversions (STD, SVOC, ALBE, and NOBC). The bottom row shows the annual scaling factor resulting from the inversion (top-row maps divided by the corresponding a priori). The blanks represent regions where the annual scaling factors lie between 0.9 and 1.1, i.e. 10 % change with respect to a priori fluxes.
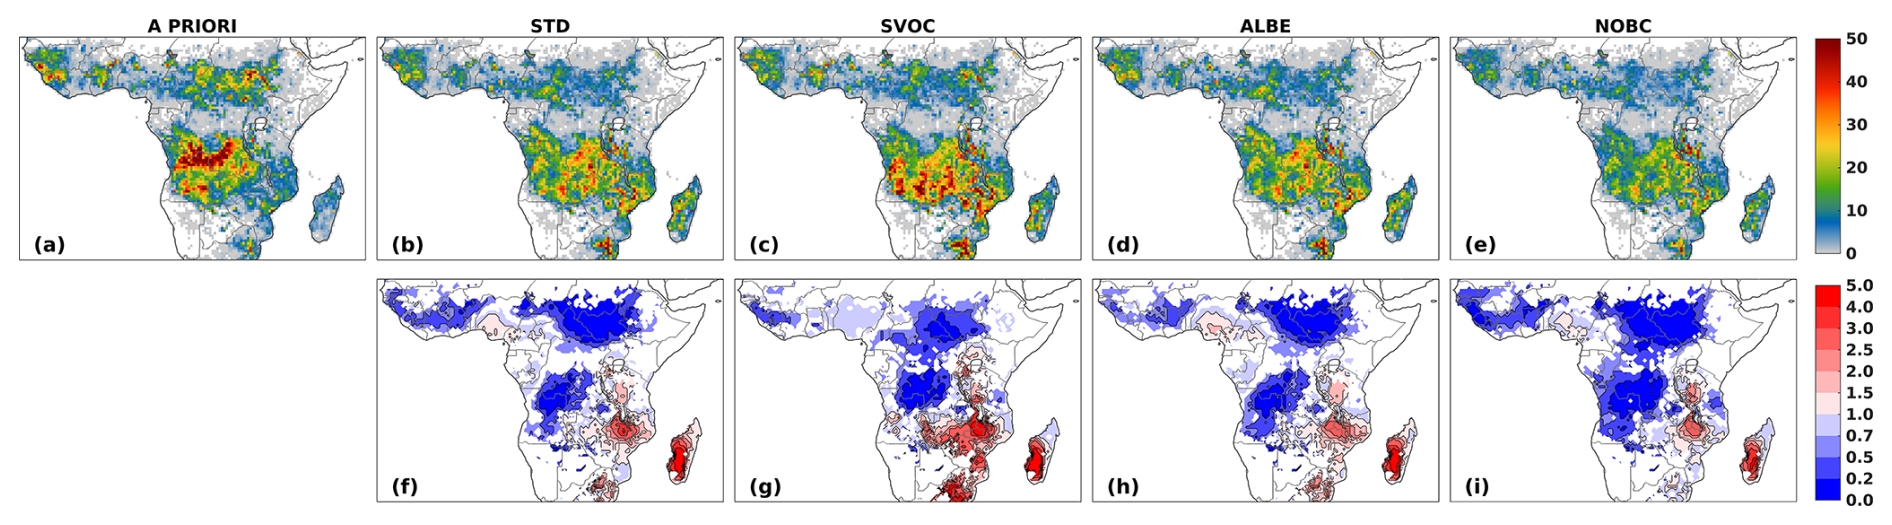
Figure 14As in Fig. 13 but for biomass burning VOC emissions.
Table 4A priori and optimized emissions of soil and lightning NO (TgN), isoprene (Tg), and biomass burning VOC emissions (Tg VOC) over the model domain and over the five regions depicted in Fig. 10. The ranges are based on the sensitivity inversions described in Table 2. The regions are defined as follows: region 1 (4–12° N, 13° W–30° E), region 2 (8° S–12° N, 30–52° E), region 3 (8° S–4° N, 8–30° E), region 4 (8–18° S, 11.5–41° E), and region 5 (18–29.5° S, 11.5–36° E).
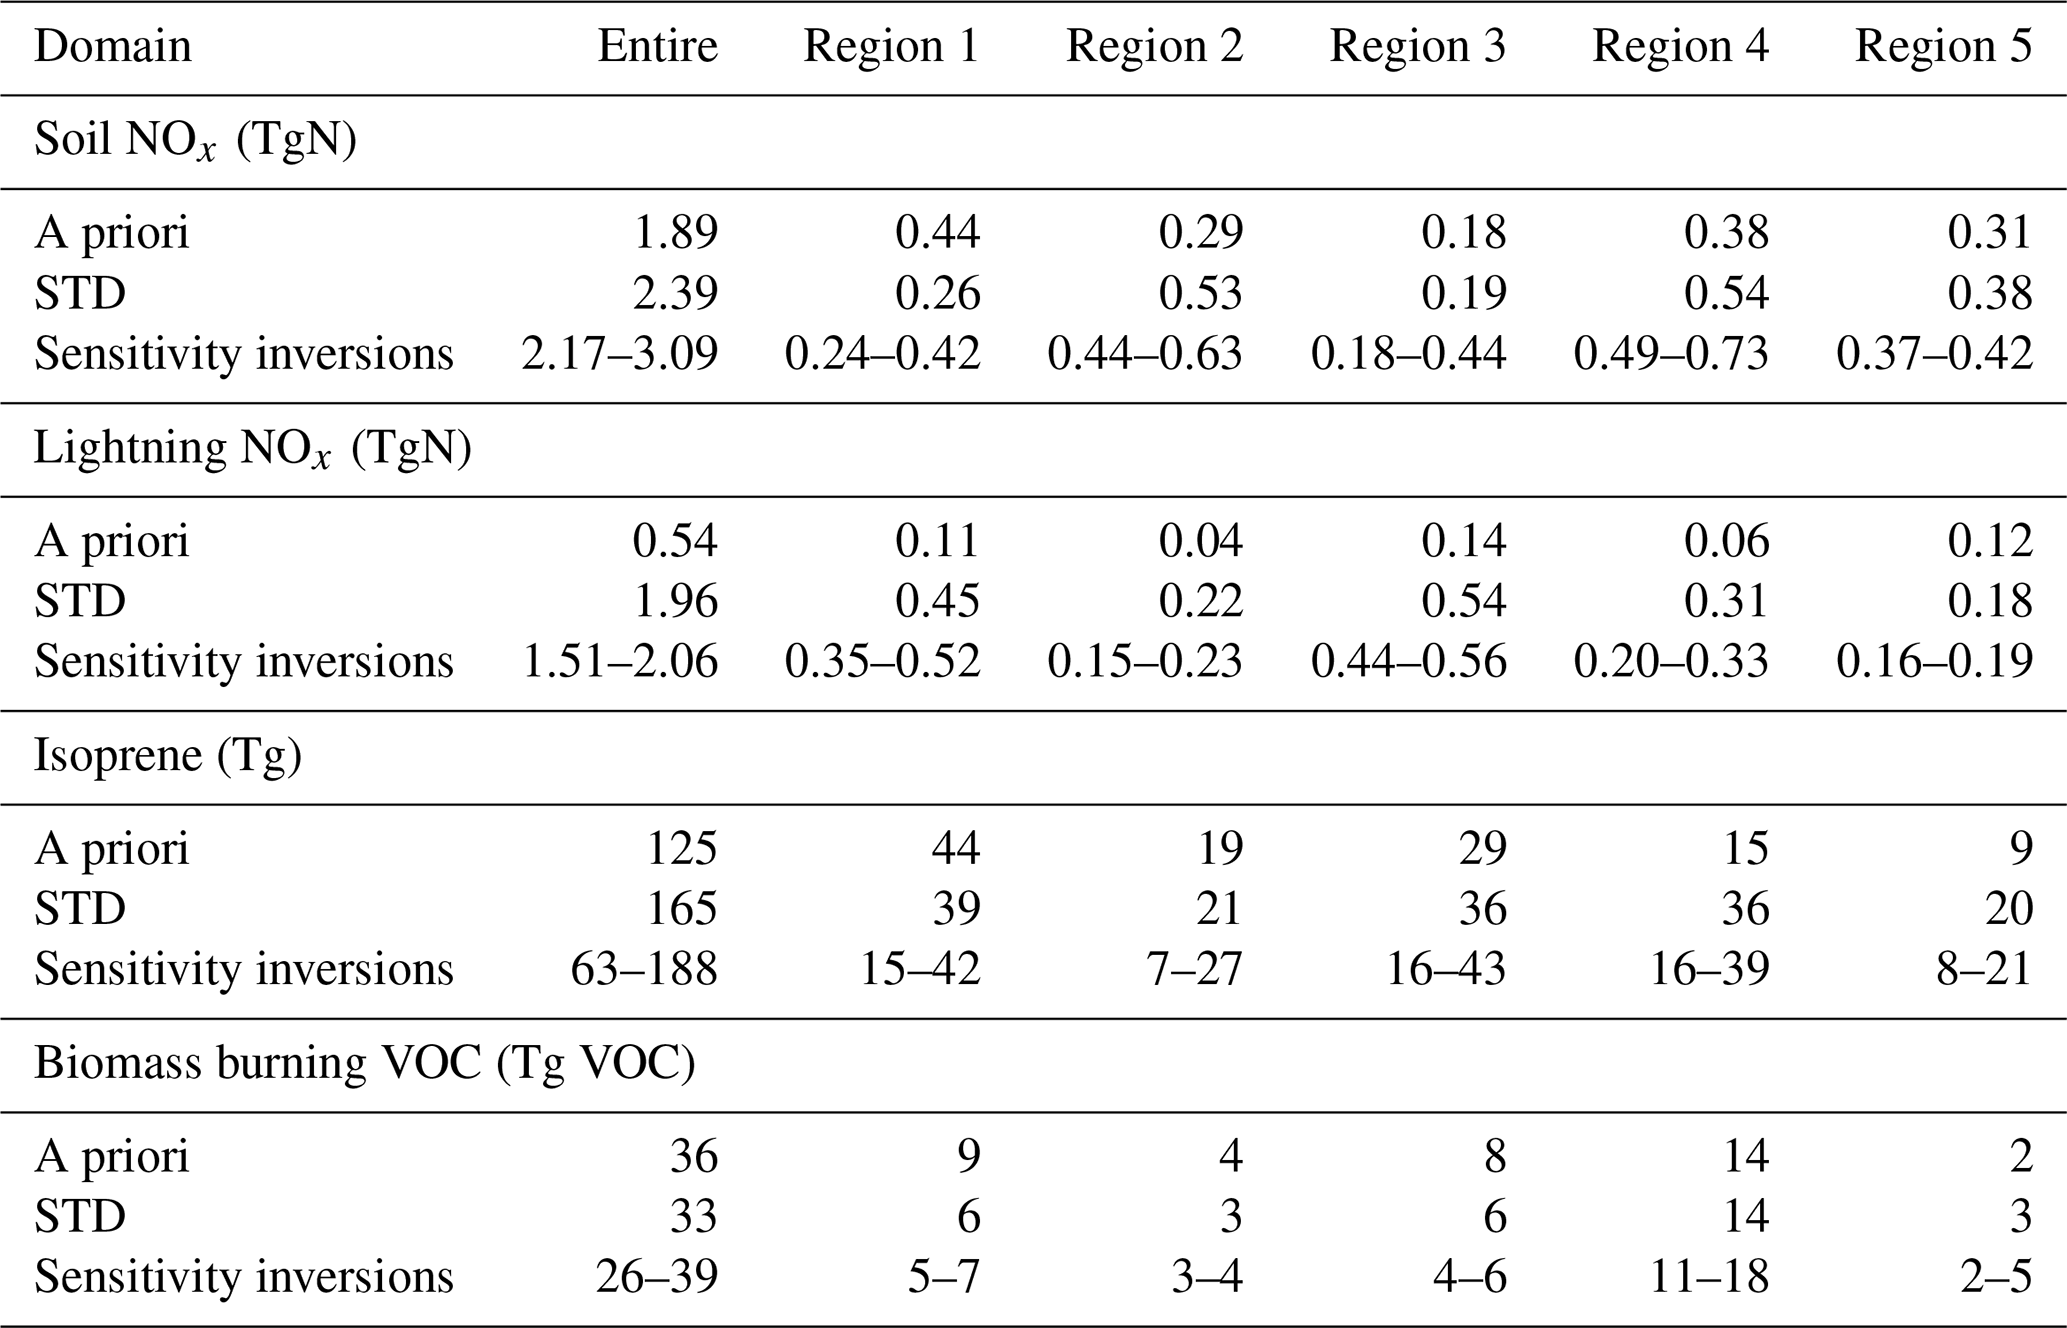

Figure 15Diagram of the total annual emissions for all inversions defined in Table 2 of (a) soil NOx (TgN), (b) lightning NOx (TgN), (c) isoprene (Tg isoprene), and (d) biomass burning VOC (Tg VOC) emissions over the entire domain. A priori emissions are displayed in light blue and are followed by emissions resulting from inversions (dark blue) based on that bottom-up inventory.
3.3 Evaluation of the results
Here, we present an evaluation of the optimization against the INDAAF NO2 mixing ratios (Sect. 3.3.1), in situ soil NO flux measurements (Sect. 3.3.2), the satellite-based dataset of upper-tropospheric NO2 mixing ratios (Sect. 3.3.3), and isoprene columns of the spaceborne CrIS instrument (Sect. 3.3.4).
3.3.1 INDAAF NO2 surface mixing ratios
Figure 16 displays monthly surface concentrations of NO2 (ppb) measured at the INDAAF sites in 2019 (Fig. 6), the average during 2015–2020, and the modelled concentrations from the a priori, the STD inversion, and three sensitivity tests (SNOX, CAMN, and INDA). The annual averages and the correlation with respect to the 2019 measurements are provided as insets, except for the Agoufou site, for which no data were available in 2019.
The principal sources of near-surface NOx at the INDAAF sites are biomass burning and biogenic soil emissions, since they are all located in rural areas, except for Bambey and Djougou, which have an urban influence. Overall, the base optimization and sensitivity inversions do not depart much from the a priori ones, except for the INDA case, which shows a significant improvement as a result of the use of INDAAF data as additional constraints in the inversion. In this case, the observed and optimized concentrations for 2019 are in very close agreement, i.e. 1.0 and 0.9 ppb on average for all the stations (Fig. 16), and the correlations are the highest among all the simulations.
The highest NO2 levels are observed in the dry savannas of Niger and Mali (Agoufou, Banizoumbou, and Katibougou sites) that also exhibit a marked seasonal cycle with two peaks. The average 2015–2020 data show a large standard deviation in Agoufou, and most of the observed variability can be attributed to NO emissions from soils (Adon et al., 2010). However, the a priori and optimized NO2 surface concentrations (STD, SNOX, and CAMN) show very little monthly variability, and the average mixing ratios are underestimated by factors of 2–3 in comparison to the 2019 measured values in Banizoumbou and Katibougou. In Agoufou, the annual measured surface concentration (1.40 ppb) is 3 times higher than the model and a factor of 6 higher at the June peak (3 and 0.5 ppb). The INDA inversion suggests that soil NO emissions should increase by factors of 3 and 1.5 on average in May–June–July compared to the 2019 measurements at Banizoumbou and Katibougou, respectively. The second maximum in October–November in Banizoumbou and Katibougou, most likely associated with the biomass burning season (Adon et al., 2010; Ossohou et al., 2019), is not captured by the standard optimization, which provides similar all-year-round NO2 levels. By virtue of the extra constraints, the INDA inversion is able to capture more than 80 % of the observed surface NO2 variability at all the sites. Discrepancies stem from the limited representativeness of one grid cell at 0.5° with respect to in situ measurements. Moreover, the large difference between the inversions based solely on satellite columns and the INDA inversion shows that the surface constraints help to better distinguish between soil and lightning NOx emissions. This is partly due to the lower sensitivity of satellite NO2 retrieval to the boundary layer concentrations in comparison to the middle and upper troposphere. A similar model underestimation of NO2 levels over the Agoufou, Banizoumbou, and Katibougou sites in 2005 was reported in the top-down study of Vinken et al. (2014), which was based on OMI NO2 column data and the GEOS-Chem model.
At the wet savanna sites, Lamto and Djougou, the a priori and optimized NO2 levels are in overall good agreement with the observations but with a moderate underestimation at Lamto (40 %) in the standard inversion. Optimized NO2 concentrations from the INDA inversion at Lamto and Djougou agree very well with the observations in terms of both magnitude and correlation. This match is realized by a doubling of the bottom-up soil NO fluxes over the entire year. Note however that the observed NO2 levels reported in Adon et al. (2010) are much higher at both sites. More specifically, the NO2 concentration in Djougou reaches up to 3.5 ppb in the 1999–2007 dry season (Adon et al.,2010), which is more than twice the mean dry season level in 2019 and 2015–2020 (about 1.5 ppb; Fig. 16). This difference might be explained by the high average 1999–2007 fire emission in Northern Hemisphere African savannas (430 TgC) compared to the 270 TgC value in 2019 (van der Werf et al., 2017).
Finally, the Zoetelé and Bomassa forested sites exhibit similar seasonalities with maxima recorded in February–March, corresponding to the biomass burning season (Adon et al., 2010). On average, surface concentrations in the a priori and optimized models are largely underestimated (a factor of 4 in Zoetelé and a factor of 6 in Bomassa). CAMN leads to slightly higher annual averages, in particular during the dry season, compared to the STD and SNOX inversions. According to the INDA results, the soil NO fluxes should be increased by factors of 7 and 9 in Bomassa and Zoetelé, respectively, during the wet season (May–November) in order to match the observed surface NO2 concentrations.
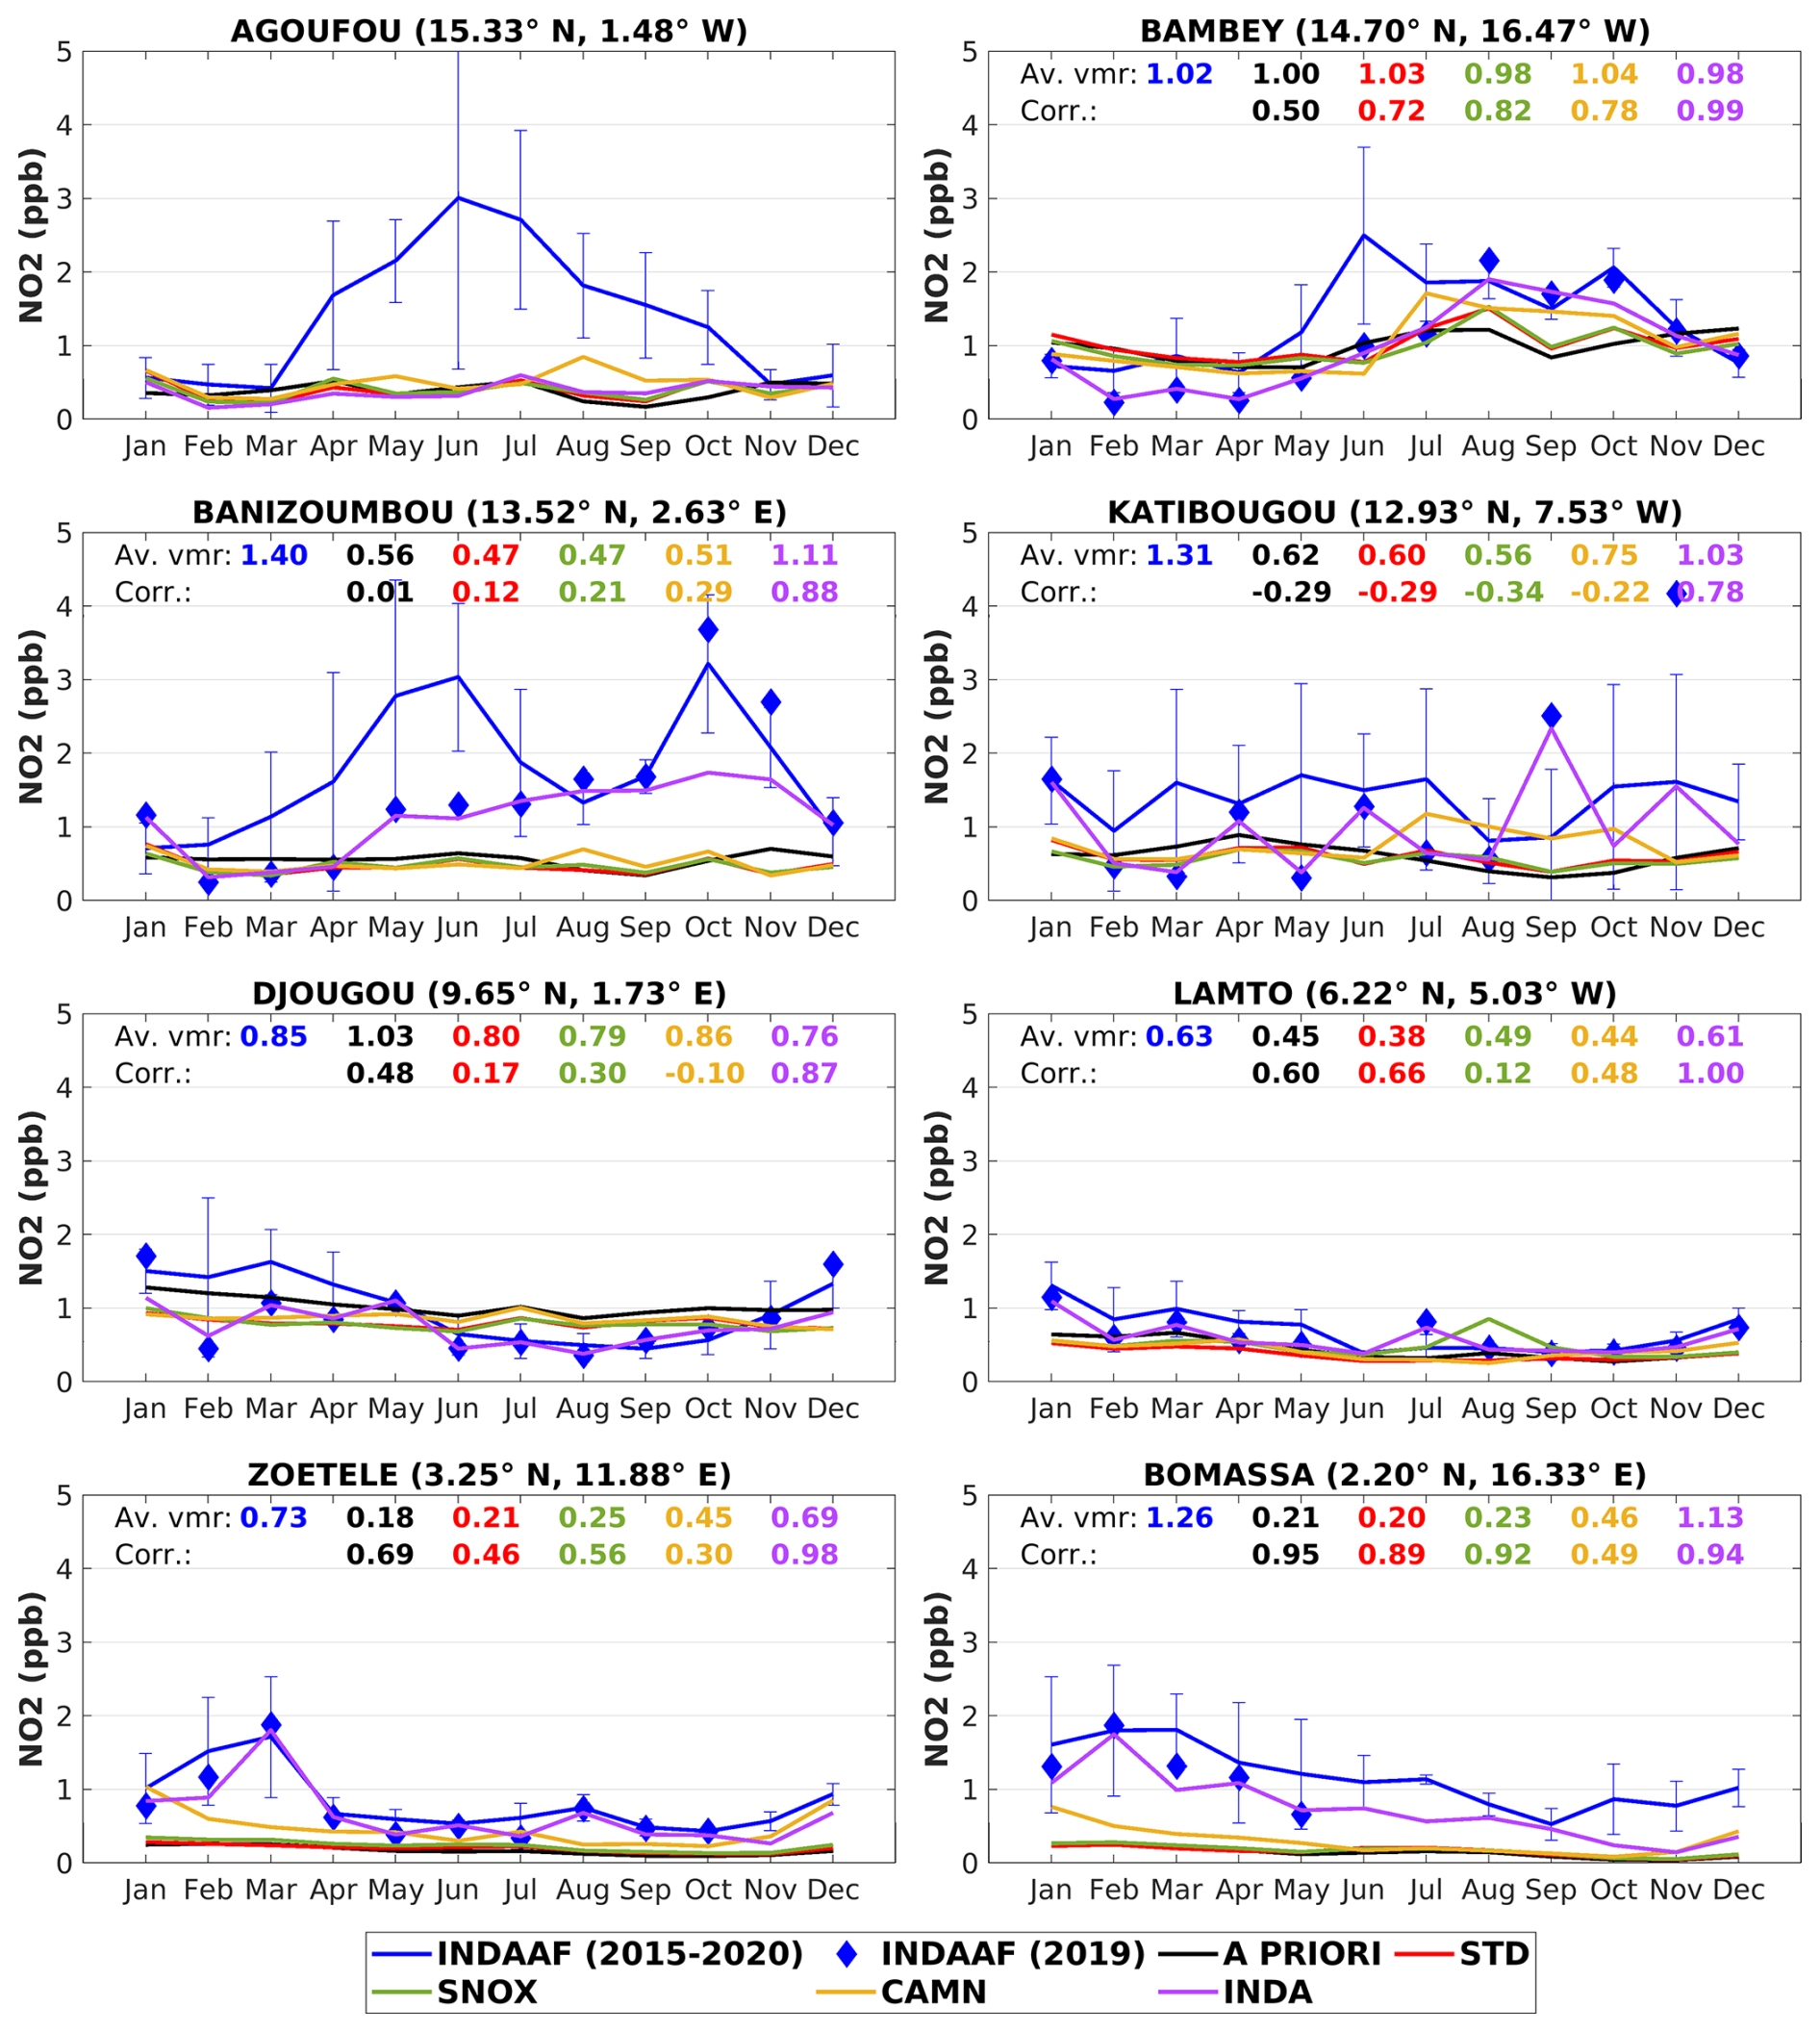
Figure 16Monthly surface volume mixing ratios of NO2 (ppb) for the 2019 measurements (blue diamonds), the average measurement for the 2015–2020 period (blue), and modelled concentrations from the a priori run (black) and the inversions STD, SNOX, CAMN, and INDA. The average volume mixing ratios (avg VMRs; ppb) and correlation are provided as insets and are calculated with respect to the INDAAF 2019 measurements. The vertical bars denote the standard deviation of the 2015–2020 measurements.
3.3.2 In situ flux measurements
Figure 17 shows the average observed soil NO fluxes, the corresponding values from the STD and CAMN a priori runs, and the STD, INDA, and CAMN inversions. The histogram displays fluxes in ascending order of site-averaged measured fluxes obtained with passive samplers at 11 different locations shown in Fig. 6 and reported in Table 3. Values of optimized fluxes for each corresponding measurement are provided in Table S1 in the Supplement. The observations span a wide range of values, from 0.03 × 10¹⁰ molec. cm−2 s−1 on the Teké Plateau in Congo to 4.85 × 10¹⁰ molec. cm−2 s−1 at Marondera in Zimbabwe. High temporal and spatial variability is typical of the soil NO fluxes in the African continent (Serça et al., 1998). The low flux in the Teké Plateau wet savanna, north of Brazzaville, is recorded for a vegetation type (Hyparrhenia) that could inhibit nitrification (Serça et al., 1998). On the other hand, the high fluxes in Zimbabwe from October to December were recorded during the wet season in mixed vegetation including grass, forest, and crops. The average high value can be rationalized by the presence of a pulsing effect and the application of fertilizers (Meixner et al., 1997).
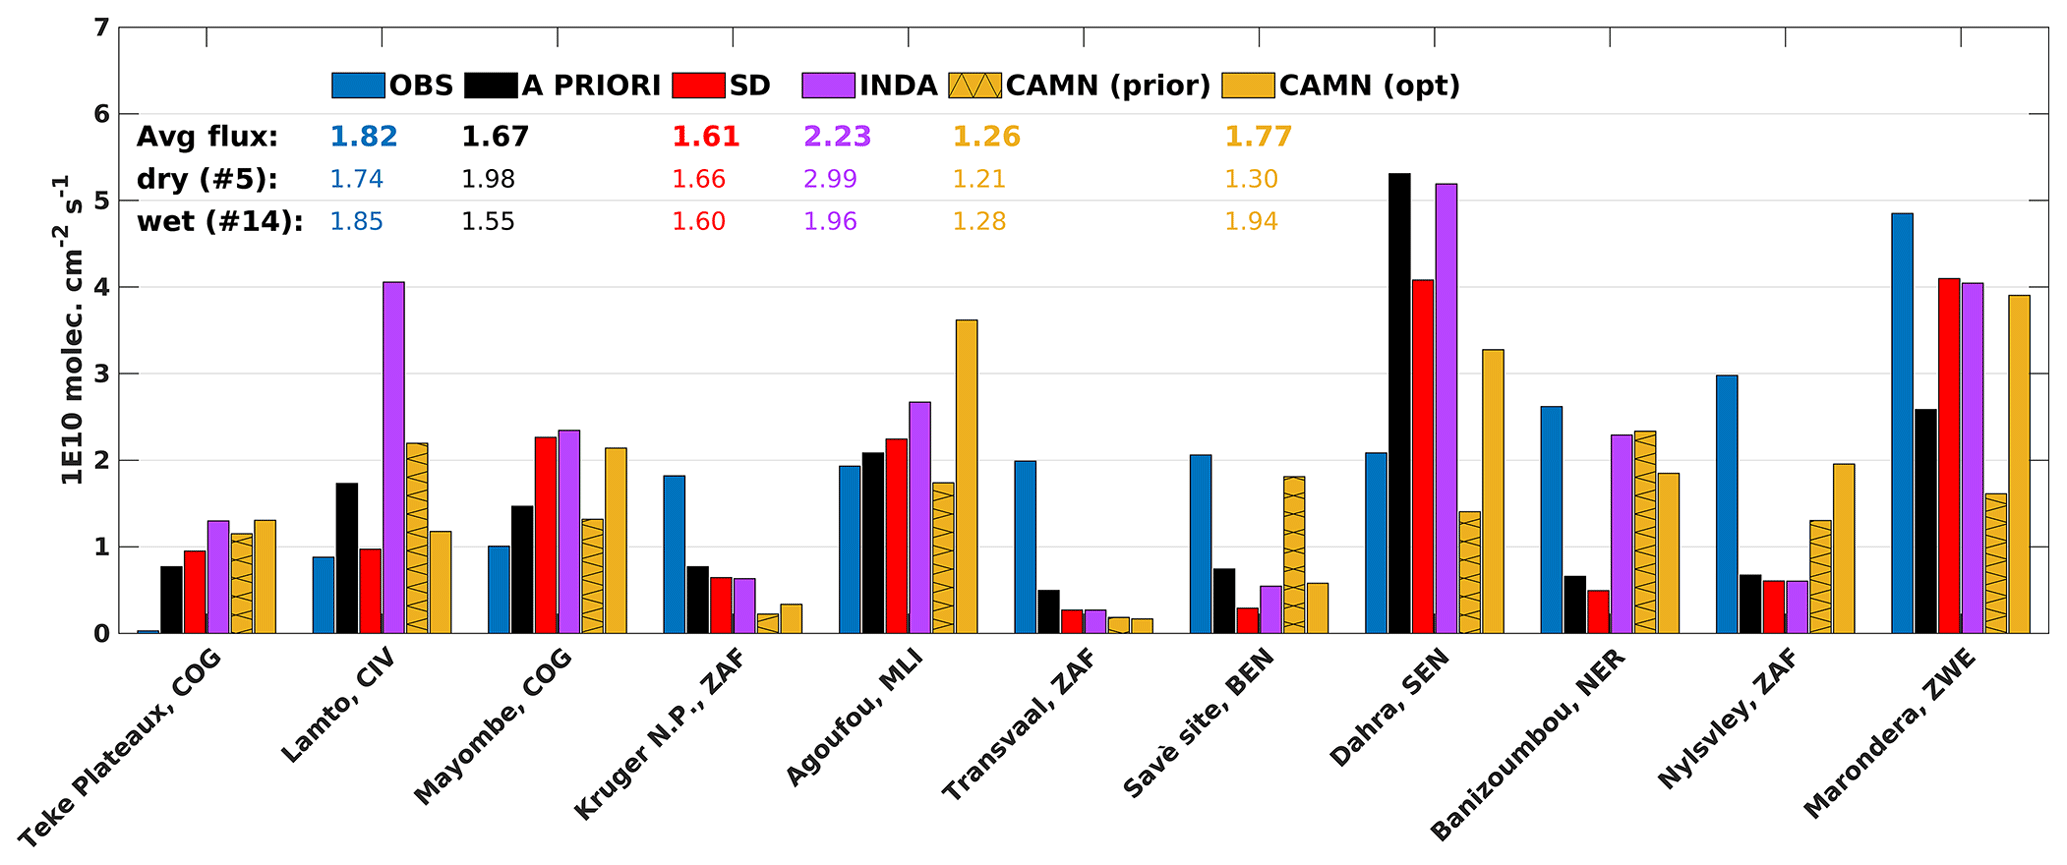
Figure 17Average soil NO flux measurements (1010 molec. cm−2 s−1) from the compilation of Table 3 and Fig. 6. In situ observations are shown in blue, the a priori model in black, and the inversion results in red (STD), magenta (INDA), and orange (CAMN). The a priori CAMN model is shown in hatched orange. The average fluxes (provided inset) are calculated based on the means for all the data over the wet and dry seasons (Table 3). The numbers in parentheses denote the number of available data.
The a priori and optimized soil NO fluxes from the STD inversion show a slight overall underestimation of about 10 % with respect to the observed all-site average of 1.82 × 10¹⁰ molec. cm−2 s−1. Despite the relatively good overall agreement of optimized fluxes with respect to the measurements, we observe that the model tends to overestimate the low observed fluxes (<1 × 10¹⁰ molec. cm−2 s−1) and underestimate the high ones (>2 × 10¹⁰ molec. cm−2 s−1), except at Dahra. Large discrepancies are found at both Congo sites, Teké Plateau and Mayombe, where the inferred soil NO fluxes are strongly overpredicted. On average for all of the sites, the STD inversion yields a satisfactory agreement in both the dry and wet seasons (Table S1), whereas the INDA results overpredict the observations, especially during the dry season (Table S1). All of the inversions, however, underestimate the fluxes at the southern African sites Kruger N.P., Transvaal, and Marondera, independent of the season.
The most recent data of this collection were obtained at the Savè site in Benin during the DACCIWA field campaign in June–July 2016 (Pacifico et al., 2019). The measured fluxes, 2.06 × 10¹⁰ molec. cm−2 s−1 on average over the 2 months, were obtained during the wet season in a mixed ecosystem (bare soil, grassland, crop, and forest), with the bare soil exhibiting the highest emissions. All of the inversions strongly underestimate these fluxes by factors of about 3.5 to 7, depending on the simulation. The best estimate at this site is the bottom-up one used in CAMN, while all of the inversions derive decreased emissions relative to the a priori flux.
The in situ flux sites of Agoufou, Banizoumbou, and Lamto lie in the vicinity of the corresponding INDAAF locations (Fig. 6). Comparisons at Agoufou indicate that the modelled soil NO fluxes in July and August agree well with the in situ soil NO data, in contrast to the large model underestimation of the surface NO2 measurements with respect to the 2015–2018 average, especially during the peak in July–August (factor of 6; Fig. 16). However, the significant variability in the surface NO2 measurements, shown by the large standard deviation in Fig. 16, could partly account for this apparent inconsistency. At the Lamto site, the top-down fluxes provide better agreement with in situ soil NO flux measurements, except for the INDA inversion, which leads to a 5-fold enhancement of NO emissions despite showing the best agreement with INDAAF measurements (Fig. 16). At the Banizoumbou site, on the other hand, the large soil NO increase (by a factor of 2.5) suggested by the INDA inversion is corroborated well by the observed soil NO fluxes in August (Fig. 17 and Table S1).
Several limitations in these comparisons should be acknowledged. First, the top-down estimates of soil NO fluxes are derived for 2019, whereas the in situ data were collected for the 1991–2016 period, which complicates the comparisons because of the high temporal variability of soil NO fluxes. Moreover, the spatial representativeness of the model at 0.5° horizontal resolution with respect to in situ measurements is another issue. An additional limitation lies in the comparison at forested sites because of the canopy uptake of NO2. Indeed, in situ flux measurements are taken at the soil level, whereas top-down inventories provide above-canopy fluxes that are generally lower than the above-soil fluxes. Bottom-up inventories account for this NO2 uptake by applying a canopy reduction factor that is a highly uncertain parameter. Considering those shortcomings, the good performance of the optimized model regarding the average flux for all the sites gives some confidence in the corresponding soil NO fluxes in Africa.
3.3.3 Upper-tropospheric NO2
Figure 18 shows seasonally averaged mixing ratios of upper-tropospheric NO2 mixing ratios between 180 and 450 hPa derived from TROPOMI NO2 data averaged over two of the five layers (320–180 and 450–320 hPa) and for 2018–2022, in comparison with the MAGRITTE a priori run and the STD inversion. According to the cloud-sliced NO2 data, the average UT NO2 mixing ratio throughout the year is about 50 pptv and is relatively constant from season to season with a maximal seasonal spread of 20 %, ranging from 45 to 54 pptv. The inferred STD UT NO2 mixing ratios display a higher seasonal variation (30–45 pptv) with a maximal seasonal difference of 70 %. The optimization strongly reduces the negative model bias with respect to the average values, from more than 70 % in the a priori run to ca. −35 %–−17 % in the STD run, depending on the season.
The best model agreement is found in June–July–August (JJA), when maximum values are attained. Regarding the spatial distribution, the optimized UT NO2 distribution exhibits a stronger west–east gradient than the observations. Within the latitudinal band 15° S–10° N, the negative bias after optimization is significantly lower (<25 %) in the western part than in the eastern part (∼ 50 %). This feature suggests an underestimation of lightning NO emissions in either the eastern part of the Congo Basin or the vicinity of the Horn of Africa and/or long-range transport of NOx from other regions, particularly oceans. Indeed, emissions over oceans are not optimized, and the LIS or OTD climatology used in the lightning parameterization might underestimate the flash rate over oceans (He et al., 2022). The cloud-sliced TROPOMI NO2 shows little interannual variability, and therefore the comparison with the NO2 cloud-sliced dataset for 2019 is not expected to change the evaluation (Horner et al., 2024). The mismatch in the modelled mixing ratios is similar in both layers (Figs. S3 and S4). Finally, using the earlier-generation cloud-sliced UT NO2 product from Marais et al. (2021), we find very similar results over Africa.
Despite the uncertainties and remaining biases, the above comparisons support the large increase in lightning NO emissions suggested by the TROPOMI NO2 data and indicate that an even greater lightning source would be required to match the UT NO2 measurements. In particular, strongly enhanced NOx emissions are suggested towards the eastern part of the continent, particularly over the eastern Congo Basin, where the a priori lightning source is low (Figs. 11 and 12). In situ flux or concentration data in eastern Africa would be needed to better constrain natural emissions of NO in this region.
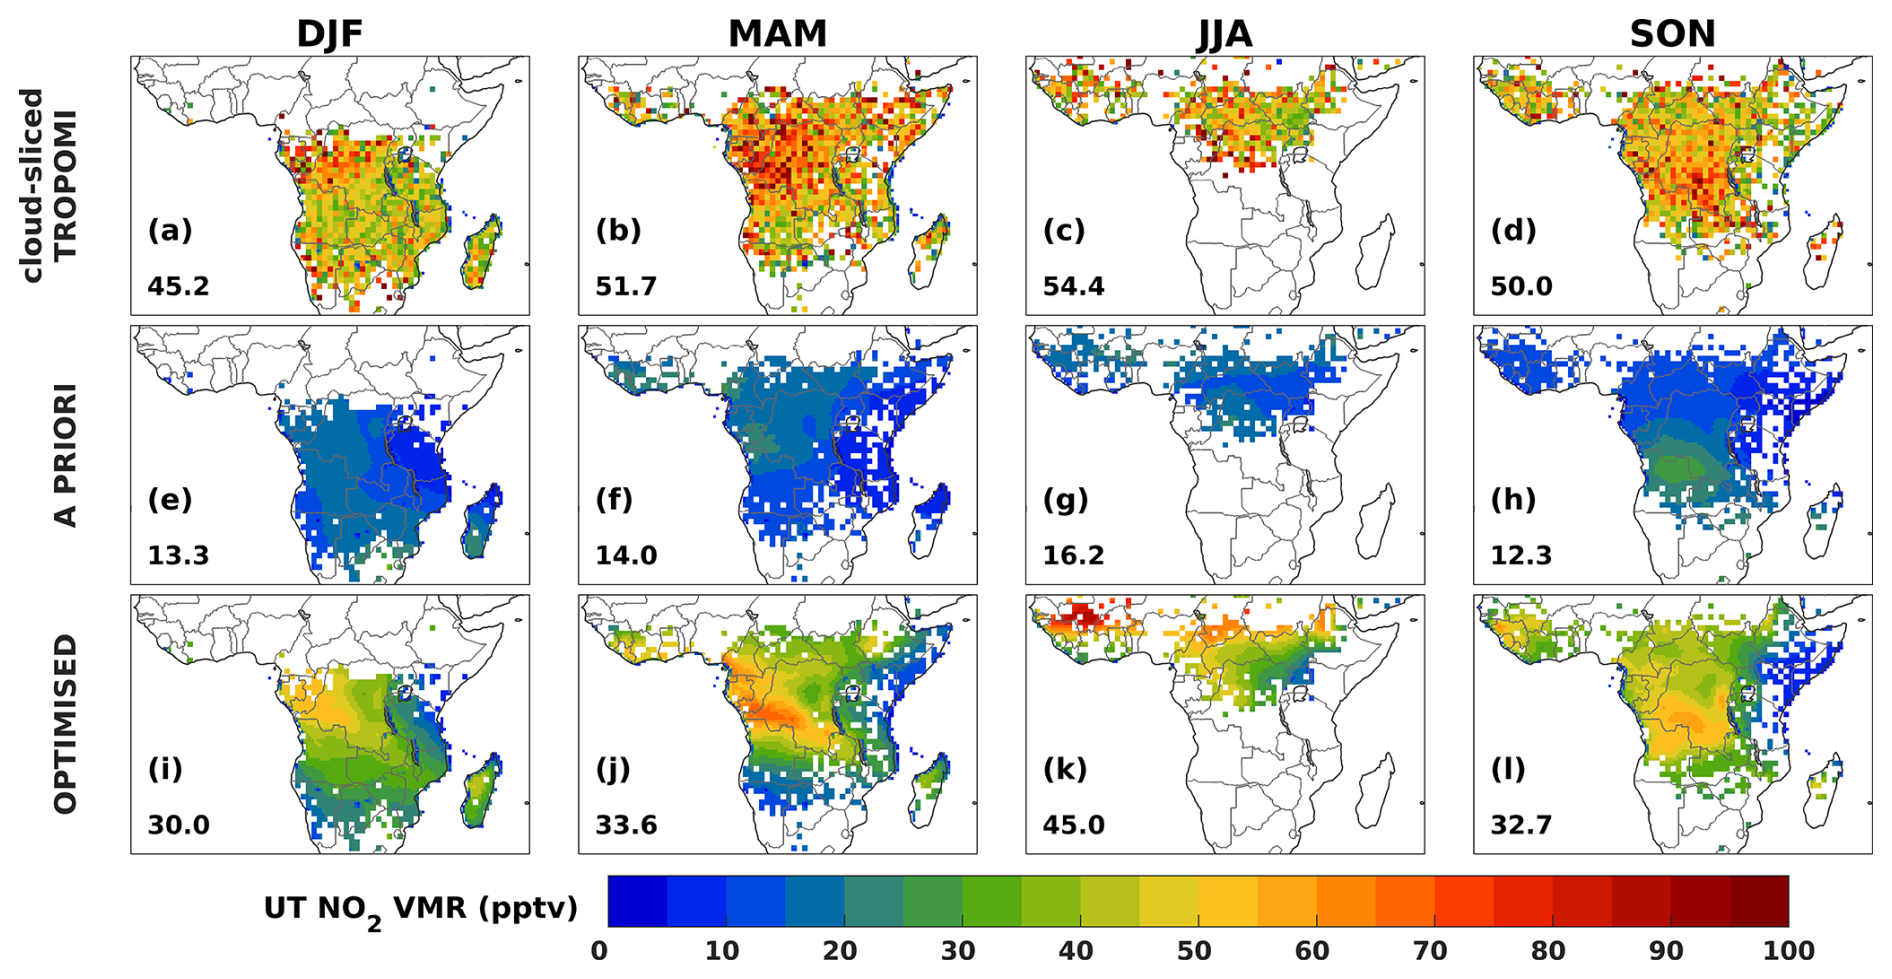
Figure 18Seasonal distributions of upper-tropospheric NO2 volume mixing ratios (pptv) in DJF, MAM, JJA, and SON for cloud-sliced TROPOMI NO2 (Horner et al., 2024) (a–d), the a priori (e–h), and after the STD inversion (i–l). The blanks are grid cells without cloud-sliced retrievals due to a lack of optically thick clouds over regions of subsidence.
3.3.4 CrIS isoprene columns
The annually averaged isoprene columns from CrIS show high values over forested areas in Congo (RDC), in Angola, along the coast of the Gulf of Guinea (5–7 × 10¹⁵ molec. cm−2), and, to a lesser extent, along the Indian Ocean south of the Equator. The retrieved columns show low values over grassland, shrub, and bare-soil regions, like Namibia and the Horn of Africa, but the gradients are relatively weak over vast regions of moderate fluxes such as the Sahel. The spatial patterns of the a priori model are more contrasted, with a strong hotspot centred on the border between the two Congos (>15 × 1015 molec. cm−2) and much lower columns over much of the rest of Africa (<3 × 10¹⁵ molec. cm−2). The optimization based on HCHO and NO2 data (STD) leads to much improved agreement with CrIS, as shown by the bias reduction in annually averaged columns over the entire domain, from −33 % in the a priori to −10 % after inversion, and also in the a posteriori spatial distribution of isoprene columns (Fig. 19). The TROPOMI observations suggest a displacement of the isoprene hotspot towards the south and a strong increase in the overall column levels, in very good agreement with the CrIS data and in accordance with the CrIS-based inversion results reported in Wells et al. (2020). The reduction in the isoprene fluxes over the Central African Republic and the emergence of high isoprene levels over Angola, Zambia, and RDC after inversion are fully corroborated by the CrIS data, lending good confidence to the top-down estimate. The isoprene fluxes derived here from TROPOMI in 2019 and inferred from CrIS in 2013 agree reasonably well with regards to the spatial distribution and scalar increments (Fig. 13; Fig. S13 in Wells et al., 2020) as well as in terms of the isoprene emission flux. Indeed, the CrIS-derived isoprene fluxes for January and April 2013, estimated at 10.9 and 9 TgC, respectively (Wells et al., 2020), are in line with the corresponding TROPOMI-based fluxes from the STD inversion of 12.2 and 12.4 TgC for 2019 (Fig. S5). The higher values obtained from TROPOMI could be partly explained by the natural interannual variability between 2013 and 2019, given that 2019 was among the warmest years for Africa in the last century (World Meteorological Organization, 2020).
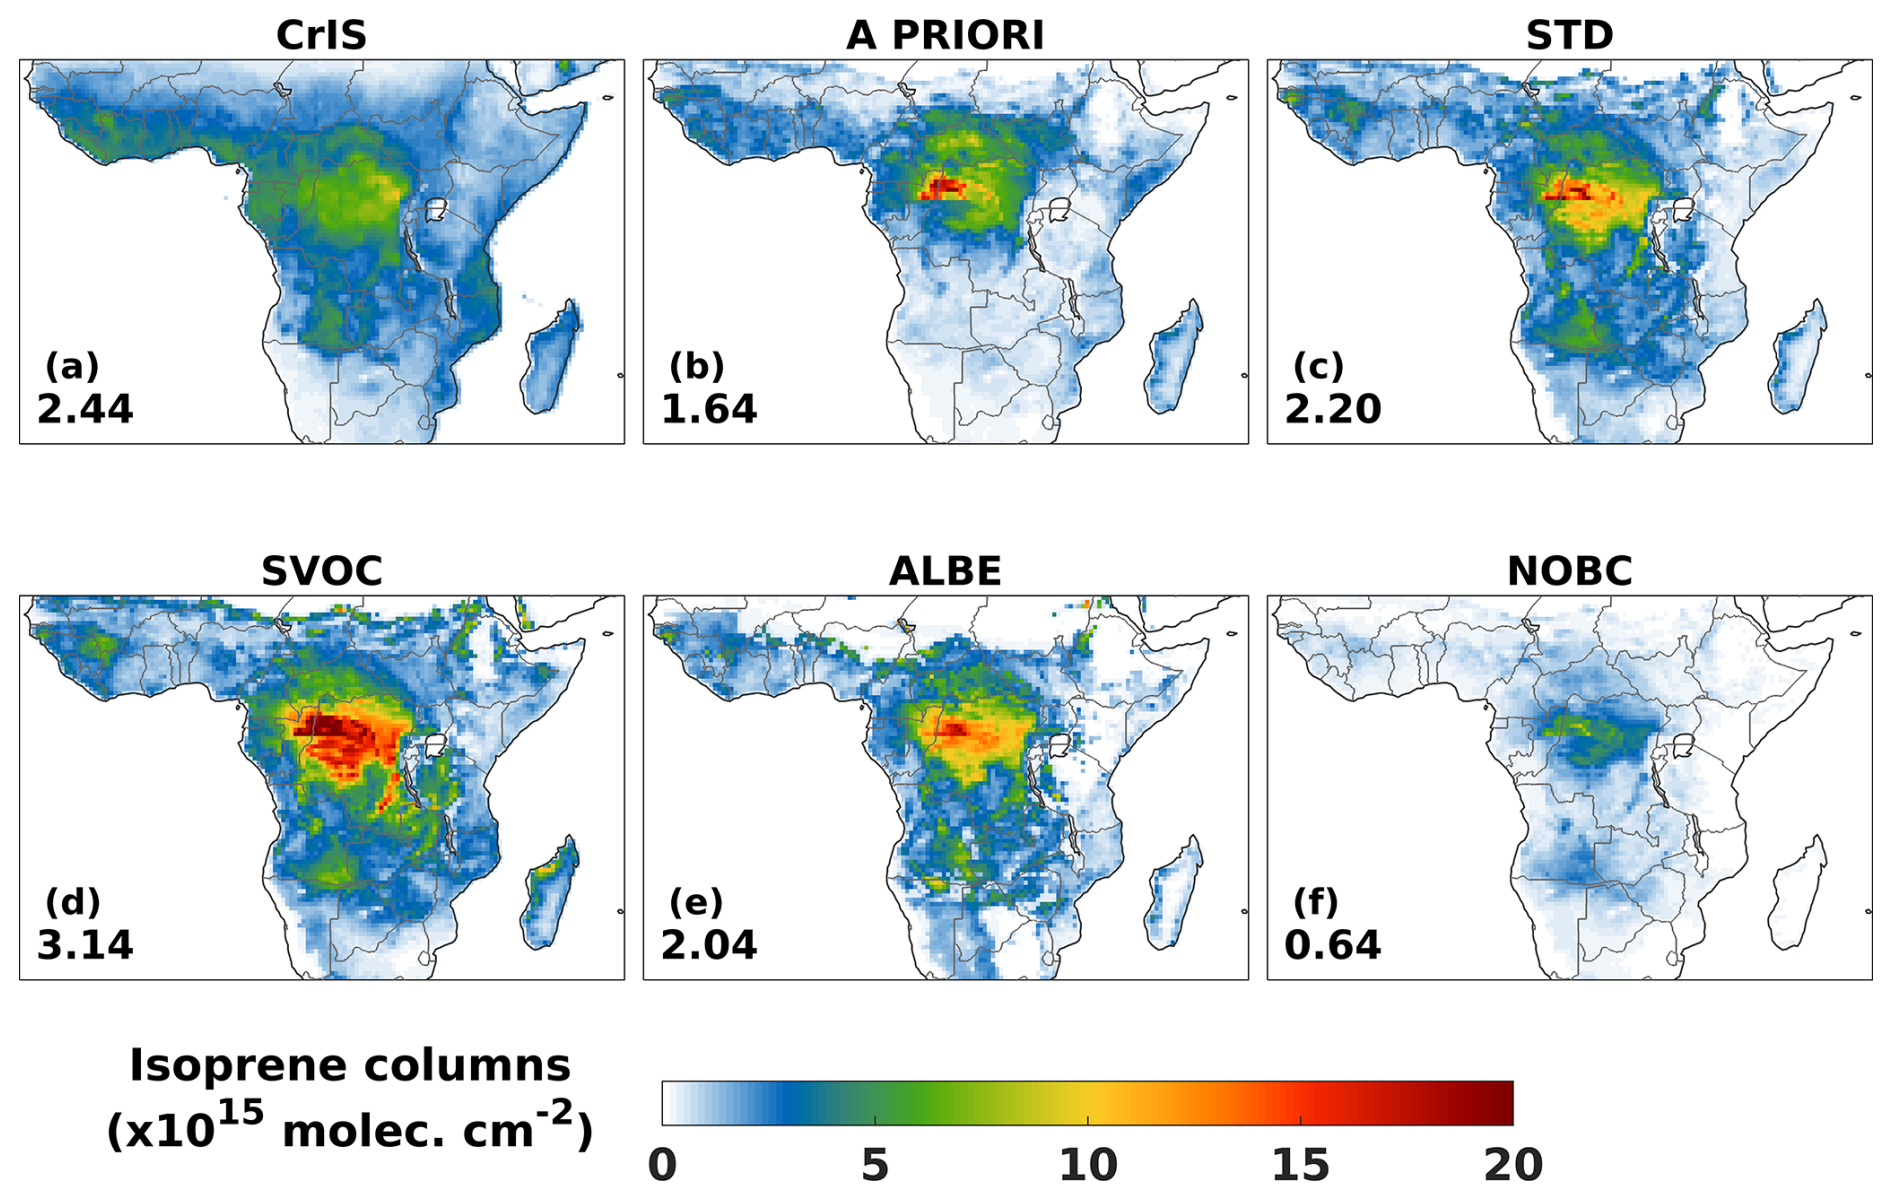
Figure 19Spatial distribution of annual isoprene columns (1015 molec. cm−2) (a) from a CrIS-based product and (b)–(f) modelled in the a priori and inversions (STD, SVOC, ALBE, and NOBC). The average column over the entire continental domain is provided as an inset (1015 molec. cm−2).
The single-compound SVOC inversion, which is only constrained by HCHO data, worsens the agreement with CrIS and results in an increase of 42 % in the domain-wide isoprene columns compared to the STD case (Fig. 19). This is explained by the higher NOx emissions derived in STD compared to the a priori, leading to higher OH levels and therefore shorter isoprene lifetimes. Higher OH concentrations also promote HCHO formation from the oxidation of many precursor VOCs, including methane and isoprene (Marais et al., 2012; Wolfe et al., 2016), thereby leading to overall lower isoprene emissions (Sect. 3.2) and columns. The ALBE inversion yields similar results, but the inferred domain-averaged columns are lower than with STD as a result of the lower top-down isoprene emissions derived from this inversion (135 and 165 Tg in STD). Not applying a bias correction in TROPOMI HCHO columns in the NOBC inversion results in very low isoprene abundances about 4 times lower than the CrIS yearly average over the studied domain, thereby providing strong evidence of the need to account for biases in satellite HCHO data in the inversions. Note that the NOBC results are in line with past studies performed with OMI that found that bottom-up African isoprene emissions (Sect. 3.2) were too high (Bauwens et al., 2016; Marais et al., 2012, 2014), but this is disproved by the CrIS isoprene data and by the strong evidence of biases in OMI and TROPOMI HCHO data. It should be mentioned that the CrIS product does not include averaging kernels, which makes it impossible to account for the scene-specific CrIS vertical sensitivity in our comparisons, possibly leading to errors. The results obtained from the inversions assuming either lower (LERR) or higher (HERR) errors in the a priori emissions are within 4 % of the STD-estimated domain-wide isoprene columns (2.16–2.28 × 10¹⁵ molec. cm−2) and exhibit similar distributions (not shown). The monthly cycle of domain-wide CrIS data indicates weak variability, with a peak-to-trough difference of ca. 2 and two peaks in March–April and October, whereas the observed cycle shows a much higher amplitude over smaller regions, like western, eastern, and Southern Hemisphere Africa (factors of 5–8; Fig. 20). The top-down STD columns overpredict the March–April peak in equatorial Africa (region 3) and fall short of capturing the observed seasonality in regions 1 and 2, leading to negative correlations after inversion. The TROPOMI data suggest a column decrease relative to the a priori in the second half of the year, which is contradicted by the gradual increase in CrIS isoprene columns from June to October and the sudden drop in November and December. The a priori model driven by the MEGAN inventory also fails to reproduce the CrIS seasonality in these two regions. The reasons for this discrepancy are unclear. They could be related to a misrepresentation of OH levels in the model, since OH exerts a major control on isoprene abundance or unaccounted-for seasonal processes. While the LAI may be fairly constant in the tropical forest, the different tree species tend to flush their leaves in different seasons, which means that the fraction of high-emission LAIs can vary and thus cause a seasonal cycle in isoprene emissions (Gomes Alves et al., 2023).
The isoprene peak is not captured by any of the sensitivity inversions. It is worth noting that the interannual variability of CrIS columns in regions 1 and 2 is relatively weak (Fig. S6), except for the year 2019, which exhibited enhanced isoprene levels in October, in particular over eastern Africa (Fig. S6b). The months from October to December 2019 were among the wettest on record in the Sahel and western, central, and eastern Africa (Wainwright et al., 2021; WMO, 2019). These extreme conditions might have led to the low TROPOMI HCHO levels because of the reduced photochemical activity and therefore to lower OH production and higher CrIS levels due to the relatively longer isoprene lifetimes under cloudy conditions.
In equatorial Africa (region 3), the observed maximum in March–April, reaching 5 × 10¹⁵ molec. cm−2, is overpredicted by a factor of 2, but satisfactory agreement between the optimized model and the observations is found for the rest of the year. In Southern Hemisphere Africa (regions 4 and 5), the optimized columns reproduce the observed seasonal cycle well, which exhibits a minimum during the Southern Hemisphere winter (June–August) and a maximum in summertime. Among all of the inversions, the largest model underestimation of the CrIS columns is found in the inversion assuming no bias correction to the TROPOMI HCHO data.
Our results point to a likely underestimation of basal isoprene emissions of the species in southern Africa and tropical western Africa, as also underscored by Marais et al. (2014). The STD inversion uses the MEGAN bottom-up inventory (Sect. 2.1.1 and Fig. 3), which relies on emission capacity maps derived from detailed ecoregion descriptions. These maps integrate information on species composition with species-specific emission factors. However, these maps have uncertainties related to the species composition estimates and the basal emission capacities that stem from several factors, including within-species, diurnal and seasonal variabilities; measurement and analysis errors; and differences between sun- and shade-adapted leaves. Despite these difficulties, a single value of the basal emission capacity is assigned for the entire canopy and the entire year, typically based on measurements in the summer for shade-adapted leaves. Based on the inversion results, the derived average isoprene emission capacity in regions 1 and 2 is relatively close to the a priori (Table S2), whereas the emission capacity for broadleaf forests is increased by about 20 % (from 4100 to 5100 µg m−2 h−1) and the emission capacity of savannas in region 4 is strongly enhanced after optimisation, from 2500 to 6000 µg m−2 h−1. High emission rates in southern African woodlands, notably from Diplorhynchus condylocarpon and the Miombo woodlands, were reported in Otter et al. (2003) for a region encompassing southern Angola and northern Mozambique (eastern Miombo woodlands), in line with our results.
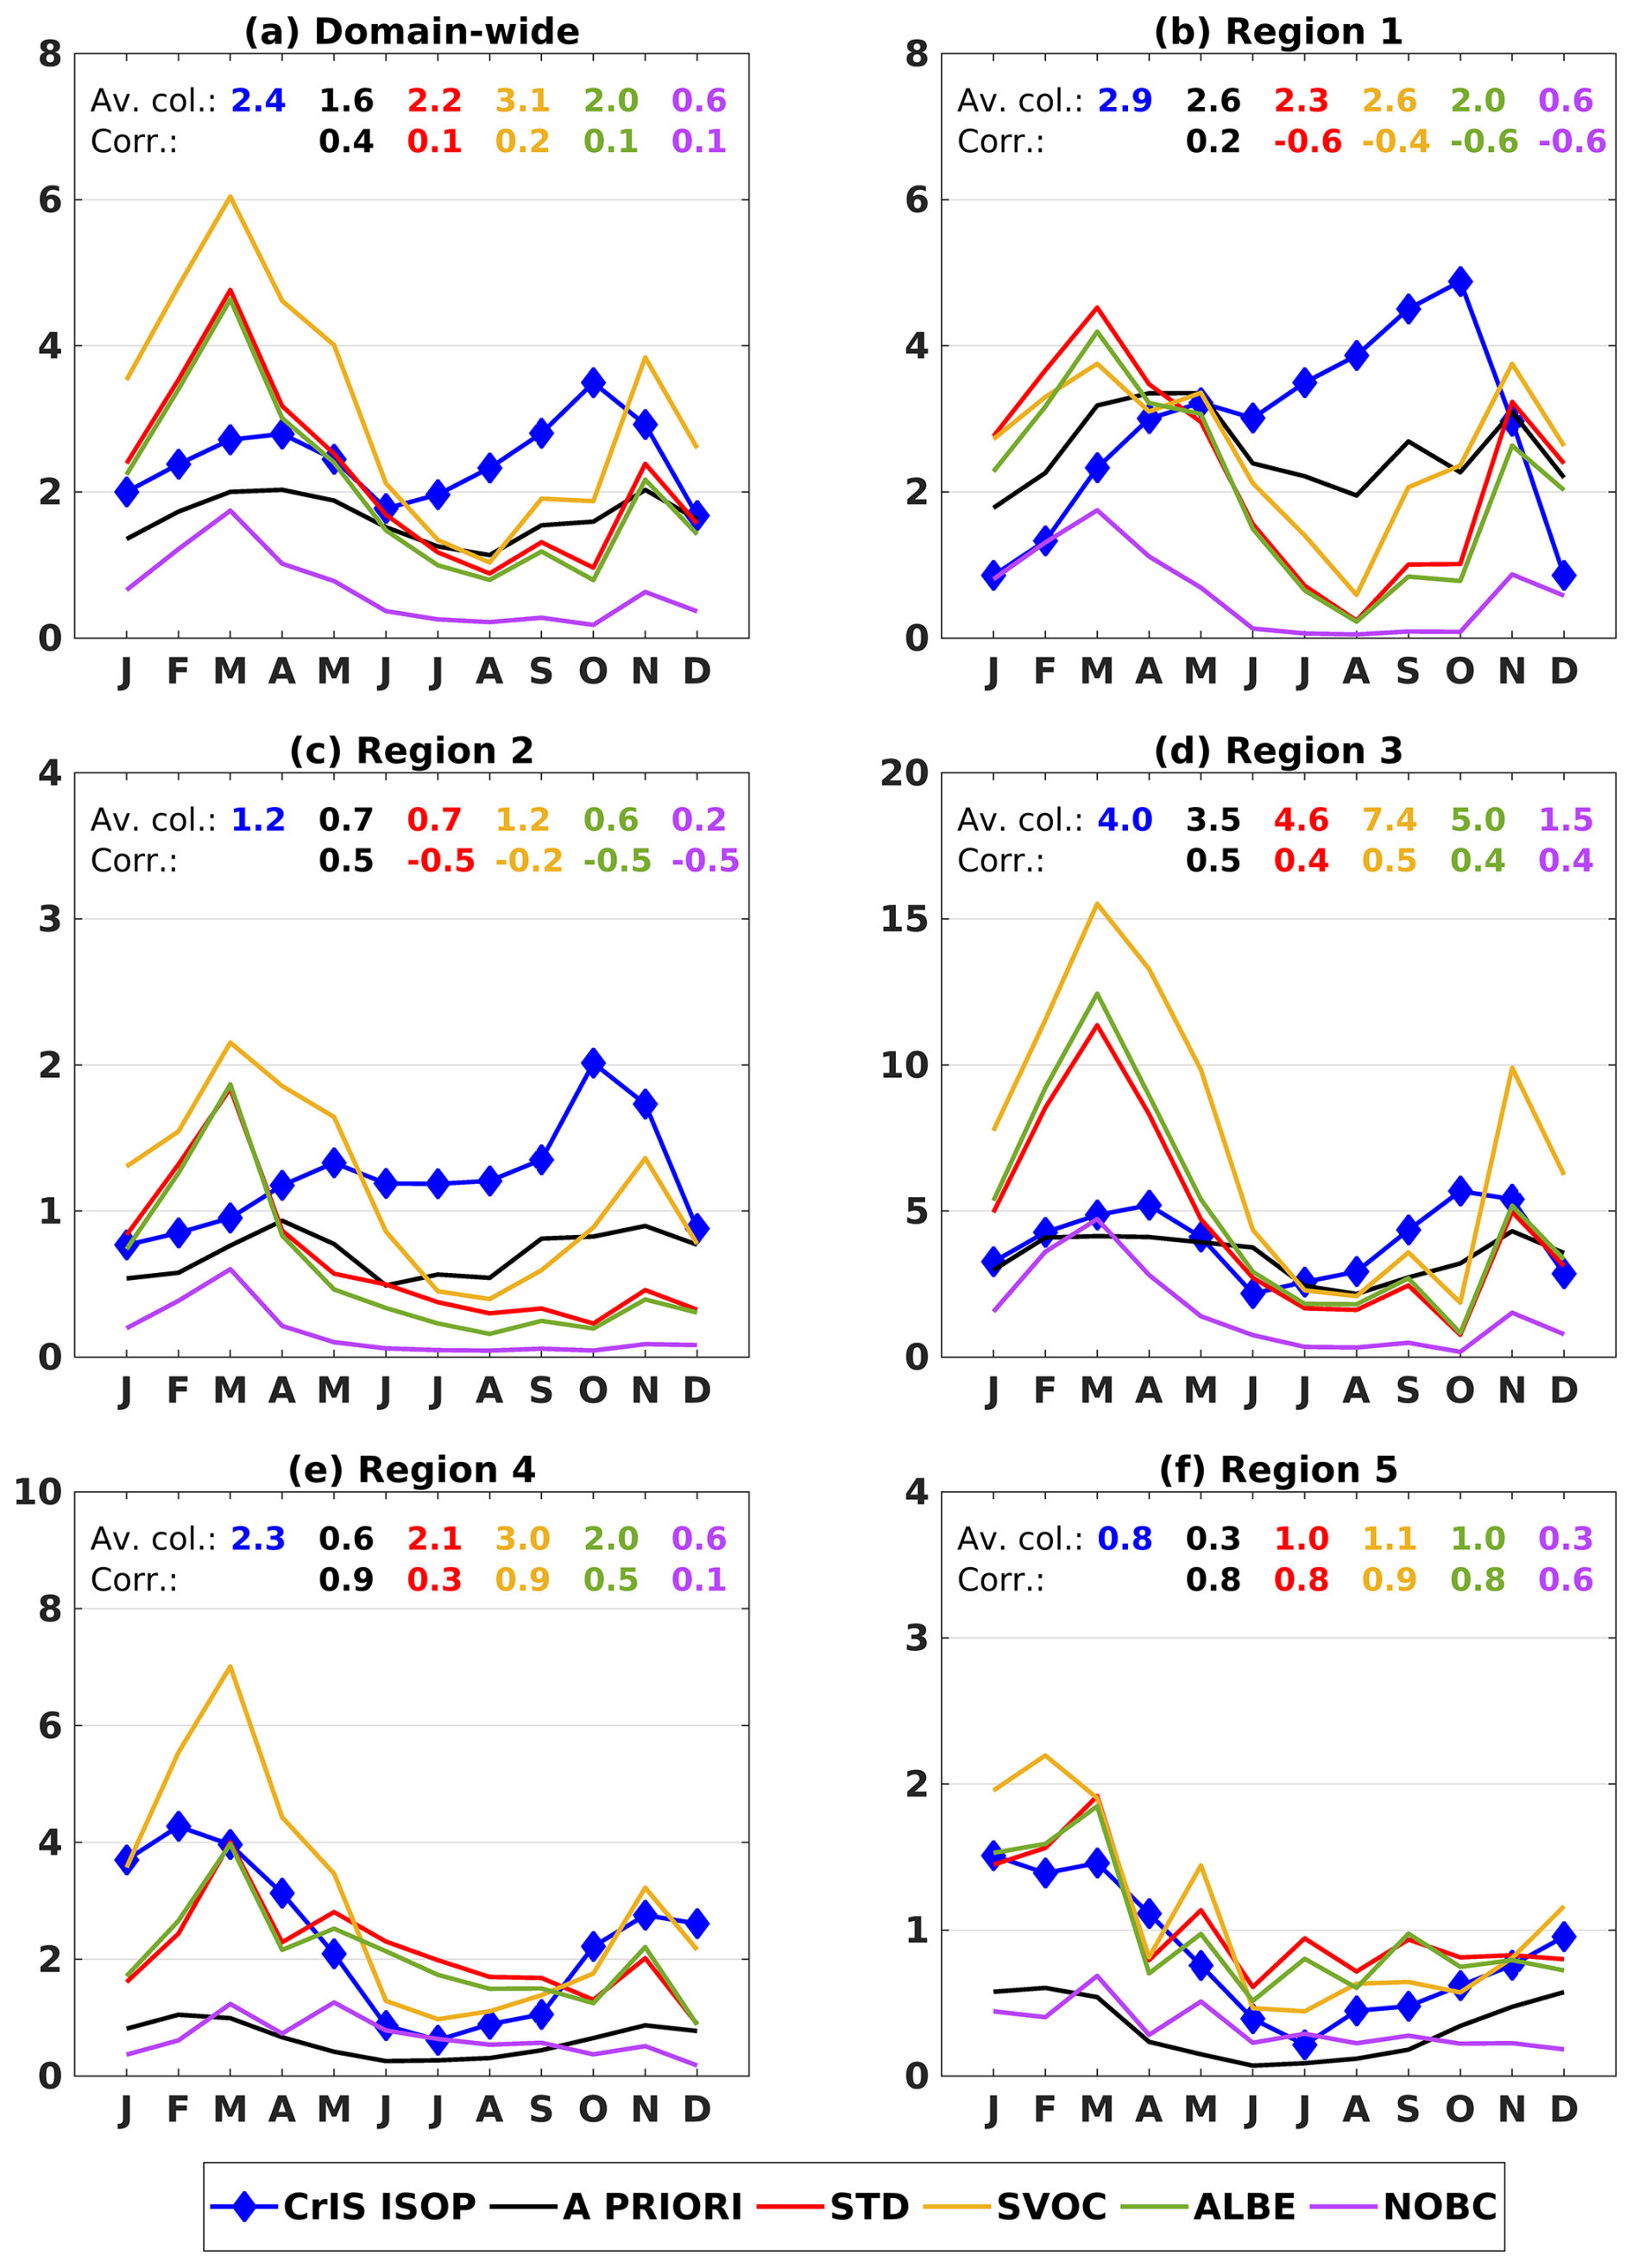
Figure 20Time series of monthly isoprene columns over the entire domain (a) and the five regions shown in Fig. 10. Isoprene columns from CrIS are shown in blue. The a priori, STD, SVOC, ALBE, and NOBC modelled columns are in black, red, orange, green, and magenta, respectively (1015 molec. cm−2).
The present study shows monthly top-down emissions of NOx and VOC at 0.5° resolution over Africa for the year 2019, derived from spaceborne HCHO and NO2 tropospheric column retrievals and an adjoint-based inverse modelling framework built on the chemistry-transport model MAGRITTEv1.1. The main distinctive feature of the proposed joint inversion scheme is the simultaneous optimization of the VOC and NOx sources, taking their chemical interactions into account. The aim of this joint inversion setup is to achieve improved emissions through a better simulation of OH levels and VOC degradation pathways that are relevant to HCHO production and NOx sink processes. Additional simulations were performed to assess the robustness of the results. Overall, our study suggests that the natural emissions of NOx and reactive VOCs (i.e. primarily isoprene) are underestimated by the inventories used a priori in the simulations, although there are large seasonal and geographical variations in the magnitudes of the biases. More precisely, our standard, two-species inversion leads to the following conclusions.
Soil emissions increase by 26 % over the model domain from 1.9 to 2.4 TgN yr−1. The distribution of the soil NO scaling factor displays complex patterns of increases and decreases. Comparisons with in situ flux measurements show that, on average, both the a priori and optimized fluxes slightly underestimate the measurements by about 10 %. Despite this good overall agreement, the model tends to overestimate the low observed fluxes (<1 × 10¹⁰ molec. cm−2 s−1), e.g. at the Congo sites, and to underestimate the high fluxes (>2 × 10¹⁰ molec. cm−2 s−1), e.g. at the southern African sites.
Lightning emissions are enhanced by a factor of almost 4 (+263 %), from 0.54 to 2 TgN yr−1. The increase is relatively ubiquitous and is corroborated by comparisons with cloud-sliced UT NO2. An even greater lightning source would be required to completely remove the low bias of UT NO2 data, particularly towards the eastern part of the continent. A large underestimation (∼ 50 %) of modelled UT NO2 is found in the Horn of Africa, for reasons that are unclear. Lightning emission or long-range transport of NOx from other regions could be too low in the model. In the vicinity of the Horn of Africa, the inversion leads to large changes in soil emissions (up to a factor of 4), but ground measurements are lacking to corroborate this result.
Top-down anthropogenic emissions indicate localised reductions in NOx fluxes in Nigeria and in the Highveld region of South Africa, as well as decreased VOC fluxes (by about 20 %) across Nigeria. Elsewhere, the changes are small or negligible.
Chemical interactions between VOCs (primarily isoprene) and NOx play a significant role in the optimization of isoprene and NOX emissions in Africa, as shown by the disparity between two-species and single-species inversions. The general increase in NOx emissions suggested by TROPOMI NO2 enhances HCHO formation from CH4 and isoprene, resulting in generally lower isoprene top-down emissions in the two-species inversion compared to SVOC, the single-species run. The impact of isoprene emission changes on top-down NOx emissions is more complex because the two main sinks of NOx, the NO2+OH reaction and organic nitrate formation, have opposite responses to isoprene fluxes, as isoprene depletes OH and favours organic nitrates. The net effect of isoprene changes is therefore dependent on the relative contributions of the two sink processes to the total NOx loss.
All of the inversions, except for SVOC – the single-species inversion based on the TROPOMI HCHO – and NOBC – the inversion without bias correction based on the TROPOMI HCHO – indicate that the bottom-up isoprene emissions from MEGAN2.1 should have increased by ∼ 30 % over the whole region from 125 to 165 Tg. The single-species inversion (SVOC) and NOBC lead to different estimates of 188 and 63 Tg, respectively. The lower estimate of the NOBC inversion is a direct consequence of the lower TROPOMI HCHO columns over Africa (∼ 25 %) when correction is not applied. This result is consistent with previous top-down emission estimates over Africa. However, both inversions, SVOC and NOBC, lead to poorer comparisons with the isoprene column data retrieved from CrIS in terms of mean column density and spatial distribution. In particular, the NOBC run leads to a large underestimation of isoprene columns (∼ 70 %) compared to CrIS, whereas SVOC suggests a strong enhancement of isoprene columns over equatorial Africa that is not supported by satellite data. Furthermore, the decrease in isoprene fluxes over the Central African Republic, the large increase in the southern regions, and the emergence of high isoprene levels over Angola, Zambia, and southern Congo after inversion are fully corroborated by the CrIS data, giving good confidence in the top-down estimate. The improved performance of the two-species inversion compared to SVOC supports the need to account for satellite NO2 data through joint NO2–HCHO inversions, especially in tropical regions, where the distribution and strength of NOx sources are quite uncertain. However, we found that the seasonality of the isoprene columns is not reproduced well over northern Africa, for reasons unknown. The comparison is made uncertain by several factors, such as the lack of averaging kernels in the CrIS data, which makes it impossible to account for the scene-specific vertical sensitivity of CrIS in the model comparison.
This study has a number of limitations. A major issue is the relative scarcity of field-based observations (in situ, ground-based, or airborne data) that could provide us with a more comprehensive database for model evaluation and better understanding of ecosystem-scale processes. There is a relatively extensive network of field stations across the African continent focused on the study and monitoring of greenhouse gases (López-Ballesteros, 2018), and further development of this infrastructure is foreseen with the installation of a low-resolution FTIR instrument near the CongoFlux tower (Sibret et al., 2022) in the Yangambi Biosphere Reserve (0°48′52.5′′ N, 24°30′08.8′′ E) (https://icos-be.aeronomie.be/index.php/project, last access: 28 February 2024). In addition, the CongoFlux tower could be an excellent platform to set up a VOC and NOx study in the heart of the tropical rainforest of the Congo Basin. The sites in Kinshasa and Bujumbura equipped with MAX-DOAS instrumentation (Gielen et al., 2017; Yombo Phaka et al., 2023) and the two PGN stations, Potchefstroom and Wakkerstroom in South Africa, are located in urban areas and are less suitable for the study of natural emissions. Furthermore, there is currently a gap in field-based data in eastern Africa, which is among the most sparsely observed regions in the world (Bililign et al., 2024). The limitations of our study are also related to the model. The parameterization of lightning emissions in the model could be improved by exploring new lightning schemes (Luhar et al., 2021; He et al., 2022). Photolysis of particulate nitrate, a recycling path of NOX, should be implemented, as this would increase the NOX lifetime and therefore the NO2 columns (Shah et al., 2024; Ye et al., 2016). In addition, the recent evidence of water vapour absorption in the UV (290 to 350 nm) could have important implications, particularly in tropical environments, due to its potential impact on the retrieval of HCHO columns and on the formaldehyde lifetime and OH levels in chemistry-transport models (Pei et al., 2019; Prather and Zhu, 2024). The benefits of the two-species inversion for deriving improved VOC and NOx fluxes will be investigated further in other regions such as South America, where the reported large underestimation of natural nitrogen oxide emissions (Lee et al., 2024; Wells et al., 2020) might have a substantial impact on the inversion of VOC fluxes.
Building on the work of Marais et al. (2014), future research could focus on deriving a map of emission potential developed for each ecosystem based on top-down isoprene emission estimates. With recent advances in satellite-based isoprene estimates, top-down inventories could be employed to assign MEGAN isoprene emission capacities in landscapes where data on species composition and species-specific emission factors are sparse.
The CAMS-GLOB-ANTv5.3 (https://doi.org/10.24380/D0BN-KX16; Granier et al., 2019) and CAMS-BIO-SOILv2.4 inventories (Simpson et al., 2023; Simpson and Segers, 2024) are available on the Copernicus Atmospheric Data Store website at https://doi.org/10.24380/kz2r-fe18 (Denier van der Gon et al., 2023). The monthly LAI distributions from MODIS15A2H collection 6 are available at https://lpdaac.usgs.gov (last access: 30 June 2024). The Copernicus operational product TROPOMI S5P HCHO columns were downloaded from https://doi.org/10.5270/S5P-tjlxfd2 (Copernicus Sentinel-5P, 2018). The monthly trace gas concentrations of NO2 from INDAAF were downloaded from https://doi.org/10.25326/605 (Akpo et al., 2023), https://doi.org/10.25326/603 (Ouafo-Leumbe et al., 2023), https://doi.org/10.25326/608 (Laouali et al., 2023), https://doi.org/10.25326/610, (Galy-Lacaux et al., 2023a), https://doi.org/10.25326/609 (Galy-Lacaux et al., 2023b), https://doi.org/10.25326/607 (Galy-Lacaux et al., 2023c), https://doi.org/10.25326/606 (Galy-Lacaux et al., 2023d), https://doi.org/10.25326/604 (Galy-Lacaux et al., 2023e), https://doi.org/10.25326/275 (Galy-Lacaux et al., 2023f).
The seasonal mean mixing ratios of the upper-tropospheric NO2 are available at https://doi.org/10.5522/04/25782336 (Horner, and Marais, 2024). The 2012–2020 climatological means of the CrIS isoprene columns are available at https://doi.org/10.13020/5n0j-wx73 (Wells and Millet, 2022), and the 2019 data were provided by Dylan Millet. The monthly TROPOMI-based top-down inventories for the 2019 soil and lightning NOx emissions can be accessed from the BIRA-IASB emission portal at https://emissions.aeronomie.be/tropomi-based/tropomi-soil-emissions (Opacka et al., 2025a) and https://emissions.aeronomie.be/tropomi-based/tropomi-lightning-emissions (Opacka et al., 2025b), and the top-down isoprene emissions are available at https://emissions.aeronomie.be/tropomi-based/tropomi-isoprene-emissions (Opacka et al., 2025c).
The supplement related to this article is available online at https://doi.org/10.5194/acp-25-2863-2025-supplement.
BO carried out the analysis and wrote the manuscript. TS and JFM designed the inversion scheme and performed the optimizations. IDS provided the TROPOMI HCHO retrievals and advice on their use. JvG developed the TROPOMI NO2 product version and provided recommendations for its use. EAM and RPH provided the cloud-sliced NO2 dataset used for model evaluation. DBM and KCW provided the CrIS datasets of the isoprene columns used for model evaluation. ABG provided feedback on the final results and the manuscript. All the co-authors read and commented on the first draft of the manuscript and gave feedback.
The contact author has declared that none of the authors has any competing interests.
Publisher's note: Copernicus Publications remains neutral with regard to jurisdictional claims made in the text, published maps, institutional affiliations, or any other geographical representation in this paper. While Copernicus Publications makes every effort to include appropriate place names, the final responsibility lies with the authors.
This research was carried out as part of the EQUATOR project funded by the Belgian Science Policy Office (BELSPO) through the BRAIN-be 2.0 programme (grant no. B2/202/P1/EQUATOR, 2021–2025). It was also supported by the IMPALA project (grant no. 4000139771/22/I-DT-bgh, 2023–2025) and the European Space Agency's PRODEX TROVA-E2 (2021–2023) and TROVA-3 (2024–2026) projects via BELSPO. Dylan B. Millet and Kelly C. Wells acknowledge support from NASA (grant nos. 80NSSC20K0927 and 80NSSC24M0037).
This research has been supported by the Belgian Science Policy Office (grant no. B2/202/P1/EQUATOR), the European Space Agency (grant nos. 4000139771/22/I-DT-bgh, PRODEX TROVA-E2, and PRODEX TROVA-3), and the National Aeronautics and Space Administration's Earth Sciences Division (grant nos. 80NSSC20K0927 and 80NSSC24M0037).
This paper was edited by Bryan N. Duncan and reviewed by two anonymous referees.
Adon, M., Galy-Lacaux, C., Yoboué, V., Delon, C., Lacaux, J. P., Castera, P., Gardrat, E., Pienaar, J., Al Ourabi, H., Laouali, D., Diop, B., Sigha-Nkamdjou, L., Akpo, A., Tathy, J. P., Lavenu, F., and Mougin, E.: Long term measurements of sulfur dioxide, nitrogen dioxide, ammonia, nitric acid and ozone in Africa using passive samplers, Atmos. Chem. Phys., 10, 7467–7487, https://doi.org/10.5194/acp-10-7467-2010, 2010.
Akpo, A., Galy-Lacaux, C., Delon, C., Gardrat, E., Dias Alves, M., Lenoir, O., Halisson, J., Darakpa, C., and Darakpa, D.: Trace gases, Djougou, Benin, Aeris [data set], https://doi.org/10.25326/605, 2023.
Akpo, A. B., Galy-Lacaux, C., Laouali, D., Delon, C., Liousse, C., Adon, M., Gardrat, E., Mariscal, A., and Darakpa, C.: Precipitation chemistry and wet deposition in a remote wet savanna site in West Africa: Djougou (Benin), Atmos. Environ., 115, 110–123, https://doi.org/10.1016/j.atmosenv.2015.04.064, 2015.
Andreae, M. O.: Emission of trace gases and aerosols from biomass burning – an updated assessment, Atmos. Chem. Phys., 19, 8523–8546, https://doi.org/10.5194/acp-19-8523-2019, 2019.
Atkinson, R.: Atmospheric chemistry of VOCs and NOx, Atmos. Environ., 34, 2063–2101, https://doi.org/10.1016/S1352-2310(99)00460-4, 2000.
Atkinson, R.: Atmospheric chemistry of VOCs and NOx, Atmos. Environ., 34, 2063–2101, https://doi.org/10.1016/S1352-2310(99)00460-4, 2013.
Barkley, M. P., Smedt, I. D., Van Roozendael, M., Kurosu, T. P., Chance, K., Arneth, A., Hagberg, D., Guenther, A., Paulot, F., Marais, E., and Mao, J.: Top-down isoprene emissions over tropical South America inferred from SCIAMACHY and OMI formaldehyde columns, J. Geophys. Res.-Atmos., 118, 6849–6868, https://doi.org/10.1002/jgrd.50552, 2013.
Bauwens, M., Stavrakou, T., Müller, J.-F., De Smedt, I., Van Roozendael, M., van der Werf, G. R., Wiedinmyer, C., Kaiser, J. W., Sindelarova, K., and Guenther, A.: Nine years of global hydrocarbon emissions based on source inversion of OMI formaldehyde observations, Atmos. Chem. Phys., 16, 10133–10158, https://doi.org/10.5194/acp-16-10133-2016, 2016.
Berndt, T., Hyttinen, N., Herrmann, H., and Hansel, A.: First oxidation products from the reaction of hydroxyl radicals with isoprene for pristine environmental conditions, Commun. Chem., 2, 1–10, https://doi.org/10.1038/s42004-019-0120-9, 2019.
Bililign, S., Brown, S. S., Westervelt, D. M., Kumar, R., Tang, W., Flocke, F., Vizuete, W., Ture, K., Pope, F. D., Demoz, B., Asa-Awuku, A., Levelt, P. F., Kalisa, E., Raheja, G., Ndyabakira, A., and Gatari, M. J.: East African Megacity Air Quality: Rationale and Framework for a Measurement and Modeling Program, B. Am. Meteor. Soc., 1, E1584–E1602, https://doi.org/10.1175/BAMS-D-23-0098.1, 2024.
Boersma, K. F., Eskes, H. J., Meijer, E. W., and Kelder, H. M.: Estimates of lightning NOx production from GOME satellite observations, Atmos. Chem. Phys., 5, 2311–2331, https://doi.org/10.5194/acp-5-2311-2005, 2005.
Brauer, M., Amann, M., Burnett, R. T., Cohen, A., Dentener, F., Ezzati, M., Henderson, S. B., Krzyzanowski, M., Martin, R. V., Van Dingenen, R., van Donkelaar, A., and Thurston, G. D.: Exposure assessment for estimation of the global burden of disease attributable to outdoor air pollution, Environ. Sci. Technol., 46, 652–660, https://doi.org/10.1021/es2025752, 2012.
Carlton, A. G., Wiedinmyer, C., and Kroll, J. H.: A review of Secondary Organic Aerosol (SOA) formation from isoprene, Atmos. Chem. Phys., 9, 4987–5005, https://doi.org/10.5194/acp-9-4987-2009, 2009.
Cecil, D. J., Buechler, D. E., and Blakeslee, R. J.: Gridded lightning climatology from TRMM-LIS and OTD: Dataset description, Atmos. Res., 135–136, 404–414, https://doi.org/10.1016/j.atmosres.2012.06.028, 2014.
Chameides, W. L., Fehsenfeld, F., Rodgers, M. O., Cardelino, C., Martinez, J., Parrish, D., Lonneman, W., Lawson, D. R., Rasmussen, R. A., Zimmerman, P., Greenberg, J., Mlddleton, P., and Wang, T.: Ozone precursor relationships in the ambient atmosphere, J. Geophys. Res.-Atmos., 97, 6037–6055, https://doi.org/10.1029/91JD03014, 1992.
Claeys, M., Graham, B., Vas, G., Wang, W., Vermeylen, R., Pashynska, V., Cafmeyer, J., Guyon, P., Andreae, M., Artaxo, P., and Maenhaut, W.: Formation of Secondary Organic Aerosols Through Photooxidation of Isoprene, Science, 303, 1173–1176, https://doi.org/10.1126/science.1092805, 2004.
Compernolle, S.: Quarterly Validation Report of the Sentinel-5 Precursor Operational Data Products #23: April 2018–May 2024, https://mpc-vdaf.tropomi.eu/index.php?option=com_vdaf&view=showReport&format=rawhtml&id=63 (last access: 4 March 2025), 2024.
Copernicus Sentinel-5P (processed by ESA): TROPOMI Level 2 Formaldehyde Total Column products, Version 01, European Space Agency [data set], https://doi.org/10.5270/S5P-tjlxfd2, 2018.
Denier van der Gon, H., Gauss, M., Granier, C., Arellano, S., Benedictow, A., Darras, S., Dellaert, S., Guevara, M., Jalkanen, J.-P., Krueger, K., Kuenen, J., Liaskoni, M., Liousse, C., Markova, J., Prieto Perez, A., Quack, B., Simpson, D., Sindelarova, K., and Soulie, A.: Documentation of CAMS emission inventory products, Copernicus Atmosphere Monitoring Service [data set], https://doi.org/10.24380/Q2SI-TI6I, 2023.
De Smedt, I., Müller, J.-F., Stavrakou, T., van der A, R., Eskes, H., and Van Roozendael, M.: Twelve years of global observations of formaldehyde in the troposphere using GOME and SCIAMACHY sensors, Atmos. Chem. Phys., 8, 4947–4963, https://doi.org/10.5194/acp-8-4947-2008, 2008.
De Smedt, I., Theys, N., Yu, H., Danckaert, T., Lerot, C., Compernolle, S., Van Roozendael, M., Richter, A., Hilboll, A., Peters, E., Pedergnana, M., Loyola, D., Beirle, S., Wagner, T., Eskes, H., van Geffen, J., Boersma, K. F., and Veefkind, P.: Algorithm theoretical baseline for formaldehyde retrievals from S5P TROPOMI and from the QA4ECV project, Atmos. Meas. Tech., 11, 2395–2426, https://doi.org/10.5194/amt-11-2395-2018, 2018.
De Smedt, I., Pinardi, G., Vigouroux, C., Compernolle, S., Bais, A., Benavent, N., Boersma, F., Chan, K.-L., Donner, S., Eichmann, K.-U., Hedelt, P., Hendrick, F., Irie, H., Kumar, V., Lambert, J.-C., Langerock, B., Lerot, C., Liu, C., Loyola, D., Piters, A., Richter, A., Rivera Cárdenas, C., Romahn, F., Ryan, R. G., Sinha, V., Theys, N., Vlietinck, J., Wagner, T., Wang, T., Yu, H., and Van Roozendael, M.: Comparative assessment of TROPOMI and OMI formaldehyde observations and validation against MAX-DOAS network column measurements, Atmos. Chem. Phys., 21, 12561–12593, https://doi.org/10.5194/acp-21-12561-2021, 2021.
Delon, C., Mougin, E., Serça, D., Grippa, M., Hiernaux, P., Diawara, M., Galy-Lacaux, C., and Kergoat, L.: Modelling the effect of soil moisture and organic matter degradation on biogenic NO emissions from soils in Sahel rangeland (Mali), Biogeosciences, 12, 3253–3272, https://doi.org/10.5194/bg-12-3253-2015, 2015.
Delon, C., Galy-Lacaux, C., Serça, D., Loubet, B., Camara, N., Gardrat, E., Saneh, I., Fensholt, R., Tagesson, T., Le Dantec, V., Sambou, B., Diop, C., and Mougin, E.: Soil and vegetation-atmosphere exchange of NO, NH3, and N2O from field measurements in a semi arid grazed ecosystem in Senegal, Atmos. Environ., 156, 36–51, https://doi.org/10.1016/j.atmosenv.2017.02.024, 2017.
Delon, C., Galy-Lacaux, C., Serça, D., Personne, E., Mougin, E., Adon, M., Le Dantec, V., Loubet, B., Fensholt, R., and Tagesson, T.: Modelling land–atmosphere daily exchanges of NO, NH3, and CO2 in a semi-arid grazed ecosystem in Senegal, Biogeosciences, 16, 2049–2077, https://doi.org/10.5194/bg-16-2049-2019, 2019.
Eskes, H. J. and Eichmann, K.-U.: S5P Mission Performance Centre Nitrogen Dioxide [L2_NO2_] Readme, https://sentiwiki.copernicus.eu/web/s5p-products (last access: 4 March 2025), 2023.
Eskes, H. J. and Eichmann, K.-U.: S5P Mission Performance Centre Nitrogen Dioxide Readme, Report S5P-MPC-KNMI-PRF-NO2, ESA, https://sentiwiki.copernicus.eu/web/s5p-products (last access: 4 March 2025), 2024.
Eskes, H. J., Velthoven, P. F. J. V., Valks, P. J. M., and Kelder, H. M.: Assimilation of GOME total-ozone satellite observations in a three-dimensional tracer-transport model, Q. J. Roy. Meteor. Soc., 129, 1663–1681, https://doi.org/10.1256/qj.02.14, 2003.
Eskes, H. J., van Geffen, J., Sneep, M., Veefkind, P., Niemeijer, S., and Zehner, C.: S5P Nitrogen Dioxide v02.03.01 intermediate reprocessing on the S5P-PAL system: Readme file, Issue 1.0, https://www.temis.nl/airpollution/no2col/docs/S5P-KNMI-PRF-PAL_reprocessing_NO2_v02.03.01_20211215.pdf (last access: 4 March 2025), 2021.
Franco, B., Clarisse, L., Stavrakou, T., Müller, J.-F., Van Damme, M., Whitburn, S., Hadji-Lazaro, J., Hurtmans, D., Taraborrelli, D., Clerbaux, C., and Coheur, P.-F.: A General Framework for Global Retrievals of Trace Gases From IASI: Application to Methanol, Formic Acid, and PAN, J. Geophys. Res.-Atmos., 123, 13963–13984, https://doi.org/10.1029/2018JD029633, 2018.
Friedl, M., A. and Sulla-Menashe, D.: MCD12Q1 MODIS/Terra+Aqua Land Cover Type Yearly L3 Global 500m SIN Grid V006. 2019, distributed by NASA EOSDIS Land Processes Distributed Active Archive Center, https://doi.org/10.5067/MODIS/MCD12Q1.006, 2019.
Fuchs, H., Hofzumahaus, A., Rohrer, F., Bohn, B., Brauers, T., Dorn, H.-P., Häseler, R., Holland, F., Kaminski, M., Li, X., Lu, K., Nehr, S., Tillmann, R., Wegener, R., and Wahner, A.: Experimental evidence for efficient hydroxyl radical regeneration in isoprene oxidation, Nat. Geosci., 6, 1023–1026, https://doi.org/10.1038/ngeo1964, 2013.
Galy-Lacaux, C., Mougin, E., Maïga, H., Soumaguel, N., Delon, C., Gardrat, E., Dias Alves, M., Lenoir, O., and Lavenu, F.: Trace gases, Agoufou, Mali, Aeris [data set], https://doi.org/10.25326/610, 2023a.
Galy-Lacaux, C., Dorego, G. S., Gardrat, E., Dias Alves, M., Lenoir, O., Der Ba, S., N'Diaye, G. R., Séné, M., Thiam, A., Féron, A., and Ossohou, M.: Trace gases, Bambey, Senegal, Aeris [data set], https://doi.org/10.25326/609, 2023b.
Galy-Lacaux, C., Tathy, J.-P., Opepa, C. K., Brncic, T., Gardrat, E., Dias Alves, M., and Lenoir, O.: Trace gases, Bomassa, Congo, Aeris [data set], https://doi.org/10.25326/607, 2023c.
Galy-Lacaux, C., N'Diaye, O., Guiro, I., Ba, D., Delon, C., Gardrat, E., Dias Alves, M., Lenoir, O., and Ossohou, M.: Trace gases, Dahra, Senegal, Aeris [data set], https://doi.org/10.25326/606, 2023d.
Galy-Lacaux, C., Diop, B., Orange, D., Sanogo, S., Soumaguel, N., Kanouté, C. O., Gardrat, E., Dias Alves, M., Lenoir, O., Ossohou, M., Adon, M., and Al-Ourabi, H.: Trace gases, Katigoubou, Mali, Aeris [data set], https://doi.org/10.25326/604, 2023e.
Galy-Lacaux, C., Yoboué, V., Ossohou, M., Gardrat, E., Dias Alves, M., Lenoir, O., Konaté, I., Ki, A. F., Ouattara, A., Adon, M., Al-Ourabi, H., and Zouzou, R.: Trace gases, Lamto, Côte d'Ivoire, Aeris [data set], https://doi.org/10.25326/275, 2023f.
Gielen, C., Hendrick, F., Pinardi, G., De Smedt, I., Fayt, C., Hermans, C., Stavrakou, T., Bauwens, M., Müller, J.-F., Ndenzako, E., Nzohabonayo, P., Akimana, R., Niyonzima, S., Van Roozendael, M., and De Mazière, M.: Characterisation of Central-African aerosol and trace-gas emissions based on MAX-DOAS measurements and model simulations over Bujumbura, Burundi, Atmos. Chem. Phys. Discuss. [preprint], https://doi.org/10.5194/acp-2016-1104, in review, 2017.
Gomes Alves, E., Aquino Santana, R., Quaresma Dias-Júnior, C., Botía, S., Taylor, T., Yáñez-Serrano, A. M., Kesselmeier, J., Bourtsoukidis, E., Williams, J., Lembo Silveira de Assis, P. I., Martins, G., de Souza, R., Duvoisin Júnior, S., Guenther, A., Gu, D., Tsokankunku, A., Sörgel, M., Nelson, B., Pinto, D., Komiya, S., Martins Rosa, D., Weber, B., Barbosa, C., Robin, M., Feeley, K. J., Duque, A., Londoño Lemos, V., Contreras, M. P., Idarraga, A., López, N., Husby, C., Jestrow, B., and Cely Toro, I. M.: Intra- and interannual changes in isoprene emission from central Amazonia, Atmos. Chem. Phys., 23, 8149–8168, https://doi.org/10.5194/acp-23-8149-2023, 2023.
Granier, C., Darras, S., Denier van der Gon, H., Doubalova, J., Elguindi, N., Galle, B., Gauss, M., Guevara, M., Jalkanen, J.-P., Kuenen, J., Liousse, C., Quack, B., Simpson, D., and Sindelarova, K.: The Copernicus Atmosphere Monitoring Service global and regional emissions (April 2019 version), Copernic. Atmosphere Monit. Serv. [data set], https://doi.org/10.24380/D0BN-KX16, 2019.
Greenberg, J. P., Guenther, A. B., Madronich, S., Baugh, W., Ginoux, P., Druilhet, A., Delmas, R., and Delon, C.: Biogenic volatile organic compound emissions in central Africa during the Experiment for the Regional Sources and Sinks of Oxidants (EXPRESSO) biomass burning season, J. Geophys. Res., 104, 30659–30671, https://doi.org/10.1029/1999JD900475, 1999.
Guenther, A. B., Jiang, X., Heald, C. L., Sakulyanontvittaya, T., Duhl, T., Emmons, L. K., and Wang, X.: The Model of Emissions of Gases and Aerosols from Nature version 2.1 (MEGAN2.1): an extended and updated framework for modeling biogenic emissions, Geosci. Model Dev., 5, 1471–1492, https://doi.org/10.5194/gmd-5-1471-2012, 2012.
Hansen, M. C., Potapov, P. V., Moore, R., Hancher, M., Turubanova, S. A., Tyukavina, A., Thau, D., Stehman, S. V., Goetz, S. J., Loveland, T. R., Kommareddy, A., Egorov, A., Chini, L., Justice, C. O., and Townshend, J. R. G.: High-Resolution Global Maps of 21st-Century Forest Cover Change, Science, 342, 850–853, https://doi.org/10.1126/science.1244693, 2013.
Hansen, R. F., Lewis, T. R., Graham, L., Whalley, L. K., Seakins, P. W., Heard, D. E., and Blitz, M. A.: OH production from the photolysis of isoprene-derived peroxy radicals: cross-sections, quantum yields and atmospheric implications, Phys. Chem. Chem. Phys., 19, 2332–2345, https://doi.org/10.1039/C6CP06718B, 2017.
He, Y., Hoque, H. M. S., and Sudo, K.: Introducing new lightning schemes into the CHASER (MIROC) chemistry–climate model, Geosci. Model Dev., 15, 5627–5650, https://doi.org/10.5194/gmd-15-5627-2022, 2022.
Hersbach, H., Bell, B., Berrisford, P., Hirahara, S., Horányi, A., Muñoz-Sabater, J., Nicolas, J., Peubey, C., Radu, R., Schepers, D., Simmons, A., Soci, C., Abdalla, S., Abellan, X., Balsamo, G., Bechtold, P., Biavati, G., Bidlot, J., Bonavita, M., De Chiara, G., Dahlgren, P., Dee, D., Diamantakis, M., Dragani, R., Flemming, J., Forbes, R., Fuentes, M., Geer, A., Haimberger, L., Healy, S., Hogan, R. J., Hólm, E., Janisková, M., Keeley, S., Laloyaux, P., Lopez, P., Lupu, C., Radnoti, G., de Rosnay, P., Rozum, I., Vamborg, F., Villaume, S., and Thépaut, J.-N.: The ERA5 global reanalysis, Q. J. Roy. Meteor. Soc., 146, 1999–2049, https://doi.org/10.1002/qj.3803, 2020.
Horner, R. P. and Marais, E. A.: Vertical profiles of global seasonal mean nitrogen dioxide in five distinct layers in the troposphere, University College London [data set], https://doi.org/10.5522/04/25782336, 2024.
Horner, R. P., Marais, E. A., Wei, N., Ryan, R. G., and Shah, V.: Vertical profiles of global tropospheric nitrogen dioxide (NO2) obtained by cloud slicing the TROPOspheric Monitoring Instrument (TROPOMI), Atmos. Chem. Phys., 24, 13047–13064, https://doi.org/10.5194/acp-24-13047-2024, 2024.
Hudman, R. C., Moore, N. E., Mebust, A. K., Martin, R. V., Russell, A. R., Valin, L. C., and Cohen, R. C.: Steps towards a mechanistic model of global soil nitric oxide emissions: implementation and space based-constraints, Atmos. Chem. Phys., 12, 7779–7795, https://doi.org/10.5194/acp-12-7779-2012, 2012.
IPCC: Climate Change 2007 – The Physical Science Basis, Contribution of Working Group I to the Fourth Assessment Report of the Intergovernmental Panel on Climate Change, edited by: Solomon, S., Qin, D., Manning, M., Chen, Z., Marquis, M., Averyt, K. B., Tignor, M., and Miller, H. L., Cambridge, United Kingdom and New York, NY, USA, ISBN 978-0-521-88009-1 hardback, ISBN 978-0-521-70596-7 paperback, 2007.
Jaeglé, L., Martin, R. V., Chance, K., Steinberger, L., Kurosu, T. P., Jacob, D. J., Modi, A. I., Yoboué, V., Sigha-Nkamdjou, L., and Galy-Lacaux, C.: Satellite mapping of rain-induced nitric oxide emissions from soils, J. Geophys. Res.-Atmos., 109, D21310, https://doi.org/10.1029/2004JD004787, 2004.
Jaeglé, L., Steinberger, L., Martin, R. V., and Chance, K.: Global partitioning of NOx sources using satellite observations: Relative roles of fossil fuel combustion, biomass burning and soil emissions, Faraday Discuss., 130, 407–423, https://doi.org/10.1039/B502128F, 2005.
Kaiser, J., Jacob, D. J., Zhu, L., Travis, K. R., Fisher, J. A., González Abad, G., Zhang, L., Zhang, X., Fried, A., Crounse, J. D., St. Clair, J. M., and Wisthaler, A.: High-resolution inversion of OMI formaldehyde columns to quantify isoprene emission on ecosystem-relevant scales: application to the southeast US, Atmos. Chem. Phys., 18, 5483–5497, https://doi.org/10.5194/acp-18-5483-2018, 2018.
Knippertz, P., Fink, A. H., Deroubaix, A., Morris, E., Tocquer, F., Evans, M. J., Flamant, C., Gaetani, M., Lavaysse, C., Mari, C., Marsham, J. H., Meynadier, R., Affo-Dogo, A., Bahaga, T., Brosse, F., Deetz, K., Guebsi, R., Latifou, I., Maranan, M., Rosenberg, P. D., and Schlueter, A.: A meteorological and chemical overview of the DACCIWA field campaign in West Africa in June–July 2016, Atmos. Chem. Phys., 17, 10893–10918, https://doi.org/10.5194/acp-17-10893-2017, 2017.
Koster, R. D., Darmenov, A. S., and da Silva, A. M.: The Quick Fire Emissions Dataset (QFED): Documentation of Versions 2.1, 2.2 and 2.4. Volume 38, Technical Report Series on Global Modeling and Data Assimilation, https://ntrs.nasa.gov/citations/20180005253 (last access: 4 March 2025), 2015.
Kwan, A. J., Chan, A. W. H., Ng, N. L., Kjaergaard, H. G., Seinfeld, J. H., and Wennberg, P. O.: Peroxy radical chemistry and OH radical production during the NO3-initiated oxidation of isoprene, Atmos. Chem. Phys., 12, 7499–7515, https://doi.org/10.5194/acp-12-7499-2012, 2012.
Lamarque, J.-F., Brasseur, G. P., Hess, P. G., and Müller, J.-F.: Three-dimensional study of the relative contributions of the different nitrogen sources in the troposphere, J. Geophys. Res.-Atmos., 101, 22955–22968, https://doi.org/10.1029/96JD02160, 1996.
Laouali, D., Galy-Lacaux, C., Gardrat, E., Dias Alves, M., Lenoir, O., Zakou, A., Ossohou, M., Adon, M., and Al-Ourabi, H.: Trace gases, Banizoumbou, Niger, Aeris [data set], https://doi.org/10.25326/608, 2023.
Lathière, J., Hauglustaine, D. A., Friend, A. D., De Noblet-Ducoudré, N., Viovy, N., and Folberth, G. A.: Impact of climate variability and land use changes on global biogenic volatile organic compound emissions, Atmos. Chem. Phys., 6, 2129–2146, https://doi.org/10.5194/acp-6-2129-2006, 2006.
Le Roux, X., Abbadie, L., Lensi, R., and Serça, D.: Emission of nitrogen monoxide from African tropical ecosystems: Control of emission by soil characteristics in humid and dry savannas of West Africa, J. Geophys. Res., 100, 23133, https://doi.org/10.1029/95JD01923, 1995.
Lebel, T., Parker, D. J., Flamant, C., Höller, H., Polcher, J., Redelsperger, J.-L., Thorncroft, C., Bock, O., Bourles, B., Galle, S., Marticorena, B., Mougin, E., Peugeot, C., Cappelaere, B., Descroix, L., Diedhiou, A., Gaye, A., and Lafore, J.-P.: The AMMA field campaigns: accomplishments and lessons learned, Atmos. Sci. Lett., 12, 123–128, https://doi.org/10.1002/asl.323, 2011.
Lee, B. H., Munger, J. W., Wofsy, S. C., Rizzo, L. V., Yoon, J. Y. S., Turner, A. J., Thornton, J. A., and Swann, A. L. S.: Sensitive Response of Atmospheric Oxidative Capacity to the Uncertainty in the Emissions of Nitric Oxide (NO) From Soils in Amazonia, Geophys. Res. Lett., 51, e2023GL107214, https://doi.org/10.1029/2023GL107214, 2024.
Lelieveld, J., Butler, T., Crowley, J., Dillon, T., Fischer, H., Ganzeveld, L., Harder, H., Lawrence, M., Martinez, M., Taraborrelli, D., and Williams, J.: Atmospheric oxidation capacity sustained by a tropical forest, Nature, 452, 737–740, https://doi.org/10.1038/nature06870, 2008.
Levine, J. S., Winstead, E. L., Parsons, D. A. B., Scholes, M. C., Scholes, R. J., Cofer, W. R., Cahoon, D. R., and Sebacher, D. I.: Biogenic soil emissions of nitric oxide (NO) and nitrous oxide (N2O) from savannas in South Africa: The impact of wetting and burning, J. Geophys. Res.-Atmos., 101, 23689–23697, https://doi.org/10.1029/96JD01661, 1996.
Liu, S., Lin, F., Wu, S., Ji, C., Sun, Y., Jin, Y., Li, S., Li, Z., and Zou, J.: A meta-analysis of fertilizer-induced soil NO and combined NO+N2O emissions, Glob. Change Biol., 23, 2520–2532, https://doi.org/10.1111/gcb.13485, 2017.
López-Ballesteros, A.: Towards a feasible and representative pan-African research infrastructure network for GHG observations, Environ. Res. Lett., 13, 085003, https://doi.org/10.1088/1748-9326/aad66c, 2018.
Luhar, A. K., Galbally, I. E., Woodhouse, M. T., and Abraham, N. L.: Assessing and improving cloud-height-based parameterisations of global lightning flash rate, and their impact on lightning-produced NOx and tropospheric composition in a chemistry–climate model, Atmos. Chem. Phys., 21, 7053–7082, https://doi.org/10.5194/acp-21-7053-2021, 2021.
Marais, E. A., Jacob, D. J., Kurosu, T. P., Chance, K., Murphy, J. G., Reeves, C., Mills, G., Casadio, S., Millet, D. B., Barkley, M. P., Paulot, F., and Mao, J.: Isoprene emissions in Africa inferred from OMI observations of formaldehyde columns, Atmos. Chem. Phys., 12, 6219–6235, https://doi.org/10.5194/acp-12-6219-2012, 2012.
Marais, E. A., Jacob, D. J., Guenther, A., Chance, K., Kurosu, T. P., Murphy, J. G., Reeves, C. E., and Pye, H. O. T.: Improved model of isoprene emissions in Africa using Ozone Monitoring Instrument (OMI) satellite observations of formaldehyde: implications for oxidants and particulate matter, Atmos. Chem. Phys., 14, 7693–7703, https://doi.org/10.5194/acp-14-7693-2014, 2014.
Marais, E. A., Roberts, J. F., Ryan, R. G., Eskes, H., Boersma, K. F., Choi, S., Joiner, J., Abuhassan, N., Redondas, A., Grutter, M., Cede, A., Gomez, L., and Navarro-Comas, M.: New observations of NO2 in the upper troposphere from TROPOMI, Atmos. Meas. Tech., 14, 2389–2408, https://doi.org/10.5194/amt-14-2389-2021, 2021.
Martin, R. V., Jacob, D. J., Chance, K., Kurosu, T. P., Palmer, P. I., and Evans, M. J.: Global inventory of nitrogen oxide emissions constrained by space-based observations of NO2 columns, J. Geophys. Res.-Atmos., 108, 4537, https://doi.org/10.1029/2003JD003453, 2003.
Martin, R. V., Sauvage, B., Folkins, I., Sioris, C. E., Boone, C., Bernath, P., and Ziemke, J.: Space-based constraints on the production of nitric oxide by lightning, J. Geophys. Res.-Atmos., 112, D09309, https://doi.org/10.1029/2006JD007831, 2007.
Matandirotya, N. R. and Burger, R. P.: Spatiotemporal variability of tropospheric NO2 over four megacities in Southern Africa: Implications for transboundary regional air pollution, Environ. Chall., 5, 100271, https://doi.org/10.1016/j.envc.2021.100271, 2021.
Mead, M., Okello, G., Mbandi, A., and Pope, F.: Spotlight on air pollution in Africa, Nat. Geosci., 16, 930–931, https://doi.org/10.1038/s41561-023-01311-2, 2023.
Meixner, F. X., Fickinger, Th., Marufu, L., Serça, D., Nathaus, F. J., Makina, E., Mukurumbira, L., and Andreae, M. O.: Preliminary results on nitric oxide emission from a southern African savanna ecosystem, Nutr. Cycl. Agroecosys., 48, 123–138, https://doi.org/10.1023/A:1009765510538, 1997.
Messina, P., Lathière, J., Sindelarova, K., Vuichard, N., Granier, C., Ghattas, J., Cozic, A., and Hauglustaine, D. A.: Global biogenic volatile organic compound emissions in the ORCHIDEE and MEGAN models and sensitivity to key parameters, Atmos. Chem. Phys., 16, 14169–14202, https://doi.org/10.5194/acp-16-14169-2016, 2016.
Meyer-Arnek, J. and Burrows, J.: A study of the trace gas columns of O3, NO2 and HCHO over Africa in September 1997, The Royal Society of Chemistry, Faraday Discuss., 130, 387–405, https://doi.org/10.1039/B507796F, 2005.
Millet, D. B., Jacob, D. J., Boersma, K. F., Fu, T.-M., Kurosu, T. P., Chance, K., Heald, C. L., and Guenther, A.: Spatial distribution of isoprene emissions from North America derived from formaldehyde column measurements by the OMI satellite sensor, J. Geophys. Res.-Atmos., 113, D02307, https://doi.org/10.1029/2007JD008950, 2008.
Millet, D. B., Guenther, A., Siegel, D. A., Nelson, N. B., Singh, H. B., de Gouw, J. A., Warneke, C., Williams, J., Eerdekens, G., Sinha, V., Karl, T., Flocke, F., Apel, E., Riemer, D. D., Palmer, P. I., and Barkley, M.: Global atmospheric budget of acetaldehyde: 3-D model analysis and constraints from in-situ and satellite observations, Atmos. Chem. Phys., 10, 3405–3425, https://doi.org/10.5194/acp-10-3405-2010, 2010.
Miyazaki, K., Eskes, H. J., and Sudo, K.: Global NOx emission estimates derived from an assimilation of OMI tropospheric NO2 columns, Atmos. Chem. Phys., 12, 2263–2288, https://doi.org/10.5194/acp-12-2263-2012, 2012.
Miyazaki, K., Eskes, H., Sudo, K., Boersma, K. F., Bowman, K., and Kanaya, Y.: Decadal changes in global surface NOx emissions from multi-constituent satellite data assimilation, Atmos. Chem. Phys., 17, 807–837, https://doi.org/10.5194/acp-17-807-2017, 2017.
Miyazaki, K., Bowman, K., Sekiya, T., Eskes, H., Boersma, F., Worden, H., Livesey, N., Payne, V. H., Sudo, K., Kanaya, Y., Takigawa, M., and Ogochi, K.: Updated tropospheric chemistry reanalysis and emission estimates, TCR-2, for 2005–2018, Earth Syst. Sci. Data, 12, 2223–2259, https://doi.org/10.5194/essd-12-2223-2020, 2020.
Müller, J.-F. and Brasseur, G.: IMAGES: A three-dimensional chemical transport model of the global troposphere, J. Geophys. Res.-Atmos., 100, 16445–16490, https://doi.org/10.1029/94JD03254, 1995.
Müller, J.-F. and Stavrakou, T.: Inversion of CO and NOx emissions using the adjoint of the IMAGES model, Atmos. Chem. Phys., 5, 1157–1186, https://doi.org/10.5194/acp-5-1157-2005, 2005.
Müller, J.-F., Stavrakou, T., Wallens, S., De Smedt, I., Van Roozendael, M., Potosnak, M. J., Rinne, J., Munger, B., Goldstein, A., and Guenther, A. B.: Global isoprene emissions estimated using MEGAN, ECMWF analyses and a detailed canopy environment model, Atmos. Chem. Phys., 8, 1329–1341, https://doi.org/10.5194/acp-8-1329-2008, 2008.
Müller, J.-F., Peeters, J., and Stavrakou, T.: Fast photolysis of carbonyl nitrates from isoprene, Atmos. Chem. Phys., 14, 2497–2508, https://doi.org/10.5194/acp-14-2497-2014, 2014.
Müller, J.-F., Stavrakou, T., and Peeters, J.: Chemistry and deposition in the Model of Atmospheric composition at Global and Regional scales using Inversion Techniques for Trace gas Emissions (MAGRITTE v1.1) – Part 1: Chemical mechanism, Geosci. Model Dev., 12, 2307–2356, https://doi.org/10.5194/gmd-12-2307-2019, 2019.
Müller, J.-F., Stavrakou, T., Oomen, G.-M., Opacka, B., De Smedt, I., Guenther, A., Vigouroux, C., Langerock, B., Aquino, C. A. B., Grutter, M., Hannigan, J., Hase, F., Kivi, R., Lutsch, E., Mahieu, E., Makarova, M., Metzger, J.-M., Morino, I., Murata, I., Nagahama, T., Notholt, J., Ortega, I., Palm, M., Röhling, A., Stremme, W., Strong, K., Sussmann, R., Té, Y., and Fried, A.: Bias correction of OMI HCHO columns based on FTIR and aircraft measurements and impact on top-down emission estimates, Atmos. Chem. Phys., 24, 2207–2237, https://doi.org/10.5194/acp-24-2207-2024, 2024.
Murray, L. T.: Lightning NOxand Impacts on Air Quality, Curr. Pollut. Rep., 2, 115–133, https://doi.org/10.1007/s40726-016-0031-7, 2016.
Nguyen, T. B., Crounse, J. D., Teng, A. P., St. Clair, J. M., Paulot, F., Wolfe, G. M., and Wennberg, P. O.: Rapid deposition of oxidized biogenic compounds to a temperate forest, P. Natl. Acad. Sci. USA, 112, E392–E401, https://doi.org/10.1073/pnas.1418702112, 2015.
Oomen, G.-M., Müller, J.-F., Stavrakou, T., De Smedt, I., Blumenstock, T., Kivi, R., Makarova, M., Palm, M., Röhling, A., Té, Y., Vigouroux, C., Friedrich, M. M., Frieß, U., Hendrick, F., Merlaud, A., Piters, A., Richter, A., Van Roozendael, M., and Wagner, T.: Weekly derived top-down volatile-organic-compound fluxes over Europe from TROPOMI HCHO data from 2018 to 2021, Atmos. Chem. Phys., 24, 449–474, https://doi.org/10.5194/acp-24-449-2024, 2024.
Opacka, B., Müller, J.-F., Stavrakou, T., Bauwens, M., Sindelarova, K., Markova, J., and Guenther, A. B.: Global and regional impacts of land cover changes on isoprene emissions derived from spaceborne data and the MEGAN model, Atmos. Chem. Phys., 21, 8413–8436, https://doi.org/10.5194/acp-21-8413-2021, 2021.
Opacka, B., Müiler, J.-F., Stavrakou, T., Miralles, D. G., Koppa, A., Pagan, B. R., Potosnak, M. J., Seco, R., De Smedt, I., and Guenther. A. B.: Impact of drought on isoprene fluxes assessed using field data, satelite-based GLEAM soil moisture and HCHO observations from OMI, Remote Sens., 14, https://doi.org/10.3390/rs14092021, 2022.
Opacka, B., Stavrakou, T., and Müller, J.-F.: Satellite-derived soil NO emission estimates over Africa based on TROPOMI HCHO and NO2 columns, https://emissions.aeronomie.be/tropomi-based/tropomi-soil-emissions (last access: 6 March 2025), 2025a.
Opacka, B., Stavrakou, T., and Müller, J.-F.: Satellite-derived lightning NO emission estimates over Africa based on TROPOMI HCHO and NO2 columns, https://emissions.aeronomie.be/tropomi-based/tropomi-lightning-emissions (last access: 6 March 2025), 2025b.
Opacka, B., Stavrakou, T., and Müller, J.-F.: Satellite-derived isoprene emission estimates over Africa based on TROPOMI HCHO and NO2 columns, https://emissions.aeronomie.be/tropomi-based/tropomi-isoprene-emissions (last access: 6 March 2025), 2025c.
Ossohou, M., Galy-Lacaux, C., Yoboué, V., Hickman, J. E., Gardrat, E., Adon, M., Darras, S., Laouali, D., Akpo, A., Ouafo, M., Diop, B., and Opepa, C.: Trends and seasonal variability of atmospheric NO2 and HNO3 concentrations across three major African biomes inferred from long-term series of ground-based and satellite measurements, Atmos. Environ., 207, 148–166, https://doi.org/10.1016/j.atmosenv.2019.03.027, 2019.
Ossohou, M., Hickman, J. E., Clarisse, L., Coheur, P.-F., Van Damme, M., Adon, M., Yoboué, V., Gardrat, E., Alvès, M. D., and Galy-Lacaux, C.: Trends and seasonal variability in ammonia across major biomes in western and central Africa inferred from long-term series of ground-based and satellite measurements, Atmos. Chem. Phys., 23, 9473–9494, https://doi.org/10.5194/acp-23-9473-2023, 2023.
Otter, L., Guenther, A., Wiedinmyer, C., Fleming, G., Harley, P., and Greenberg, J.: Spatial and temporal variations in biogenic volatile organic compound emissions for Africa south of the equator, J. Geophys. Res.-Atmos., 108, https://doi.org/10.1029/2002JD002609, 2003.
Ouafo-Leumbe, M.-R., Galy-Lacaux, C., Liousse, C., Pont, V., Akpo, A., Doumbia, T., Gardrat, E., Zouiten, C., Sigha-Nkamdjou, L., and Ekodeck, G. E.: Chemical composition and sources of atmospheric aerosols at Djougou (Benin), Meteorol. Atmos. Phys., 130, 591–609, https://doi.org/10.1007/s00703-017-0538-5, 2018.
Ouafo-Leumbe, M.-R., Galy-Lacaux, C., Sigha-Nkamdjou, L., Gardrat, E., Dias Alves, M., Lenoir, O., Meka, M. Z., and Amougou, M.: Trace gases, Zoétélé, Cameroon, Aeris [data set], https://doi.org/10.25326/603, 2023.
Pacifico, F., Delon, C., Jambert, C., Durand, P., Morris, E., Evans, M. J., Lohou, F., Derrien, S., Donnou, V. H. E., Houeto, A. V., Reinares Martínez, I., and Brilouet, P.-E.: Measurements of nitric oxide and ammonia soil fluxes from a wet savanna ecosystem site in West Africa during the DACCIWA field campaign, Atmos. Chem. Phys., 19, 2299–2325, https://doi.org/10.5194/acp-19-2299-2019, 2019.
Palmer, P. I., Jacob, D. J., Fiore, A. M., Martin, R. V., Chance, K., and Kurosu, T. P.: Mapping isoprene emissions over North America using formaldehyde column observations from space, J. Geophys. Res.-Atmos., 108, 4180, https://doi.org/10.1029/2002JD002153, 2003.
Pan, X., Ichoku, C., Chin, M., Bian, H., Darmenov, A., Colarco, P., Ellison, L., Kucsera, T., da Silva, A., Wang, J., Oda, T., and Cui, G.: Six global biomass burning emission datasets: intercomparison and application in one global aerosol model, Atmos. Chem. Phys., 20, 969–994, https://doi.org/10.5194/acp-20-969-2020, 2020.
Parsons, D. A. B., Scholes, M. C., Scholes, R. J., and Levine, J. S.: Biogenic NO emissions from savanna soils as a function of fire regime, soil type, soil nitrogen, and water status, J. Geophys. Res.-Atmos., 101, 23683–23688, https://doi.org/10.1029/95JD02140, 1996.
Paulot, F., Crounse, J. D., Kjaergaard, H. G., Kroll, J. H., Seinfeld, J. H., and Wennberg, P. O.: Isoprene photooxidation: new insights into the production of acids and organic nitrates, Atmos. Chem. Phys., 9, 1479–1501, https://doi.org/10.5194/acp-9-1479-2009, 2009.
Peeters, J., Nguyen, T. L., and Vereecken, L.: HOx radical regeneration in the oxidation of isoprene, Phys. Chem. Chem. Phys., 11, 5935–5939, https://doi.org/10.1039/B908511D, 2009.
Peeters, J., Müller, J.-F., Stavrakou, T., and Nguyen, V. S.: Hydroxyl Radical Recycling in Isoprene Oxidation Driven by Hydrogen Bonding and Hydrogen Tunneling: The Upgraded LIM1 Mechanism, J. Phys. Chem. A, 118, 8625–8643, https://doi.org/10.1021/jp5033146, 2014.
Pei, L., Min, Q., Du, Y., Wang, Z., Yin, B., Yang, K., Disterhoft, P., Pongetti, T., and Zhu, L.: Water Vapor Near-UV Absorption: Laboratory Spectrum, Field Evidence, and Atmospheric Impacts, J. Geophys. Res.-Atmos., 124, 14310–14324, https://doi.org/10.1029/2019JD030724, 2019.
Petkova, E., Jack, D., Volavka-Close, N., and Kinney, P.: Particulate matter pollution in African cities, Air Qual. Atmos. Hlth., 6, https://doi.org/10.1007/s11869-013-0199-6, 2013.
Pickering, K. E., Wang, Y., Tao, W.-K., Price, C., and Müller, J.-F.: Vertical distributions of lightning NOx for use in regional and global chemical transport models, J. Geophys. Res.-Atmos., 103, 31203–31216, https://doi.org/10.1029/98JD02651, 1998.
Possell, M. and Hewitt, C. N.: Isoprene emissions from plants are mediated by atmospheric CO2 concentrations, Glob. Change Biol., 17, 1595–1610, https://doi.org/10.1111/j.1365-2486.2010.02306.x, 2011.
Prather, M. J. and Zhu, L.: Resetting tropospheric OH and CH4 lifetime with ultraviolet H2O absorption, Science, 385, 201–204, https://doi.org/10.1126/science.adn0415, 2024.
Price, C. and Rind, D.: A simple lightning parameterization for calculating global lightning distributions, J. Geophys. Res.-Atmos., 97, 9919–9933, https://doi.org/10.1029/92JD00719, 1992.
Qu, Z., Henze, D. K., Cooper, O. R., and Neu, J. L.: Impacts of global NOx inversions on NO2 and ozone simulations, Atmos. Chem. Phys., 20, 13109–13130, https://doi.org/10.5194/acp-20-13109-2020, 2020.
Redelsperger, J. L., Diedhiou, A., Flamant, C., Janicot, S., Lafore, J. P., Lebel, T., Polcher, J., Bourlès, B., Caniaux, G., Rosnay, P. de, Desbois, M., Eymard, L., Fontaine, B., Geneau, I., Ginoux, K., Hoepffner, M., and Kane, C.: Amma, une étude multidisciplinaire de la mousson ouest-africaine, La Météorologie, 54, 22–32, https://doi.org/10.4267/2042/20098, 2006.
Romer, P. S., Duffey, K. C., Wooldridge, P. J., Allen, H. M., Ayres, B. R., Brown, S. S., Brune, W. H., Crounse, J. D., de Gouw, J., Draper, D. C., Feiner, P. A., Fry, J. L., Goldstein, A. H., Koss, A., Misztal, P. K., Nguyen, T. B., Olson, K., Teng, A. P., Wennberg, P. O., Wild, R. J., Zhang, L., and Cohen, R. C.: The lifetime of nitrogen oxides in an isoprene-dominated forest, Atmos. Chem. Phys., 16, 7623–7637, https://doi.org/10.5194/acp-16-7623-2016, 2016.
Romer Present, P. S., Zare, A., and Cohen, R. C.: The changing role of organic nitrates in the removal and transport of NOx, Atmos. Chem. Phys., 20, 267–279, https://doi.org/10.5194/acp-20-267-2020, 2020.
Schumann, U. and Huntrieser, H.: The global lightning-induced nitrogen oxides source, Atmos. Chem. Phys., 7, 3823–3907, https://doi.org/10.5194/acp-7-3823-2007, 2007.
Serca, D., Delmas, R., Jambert, C., and Labroue, L.: Emissions of nitrogen oxides from equatorial rain forest in central Africa, Tellus B, 46, 243–254, https://doi.org/10.1034/j.1600-0889.1994.t01-3-00001.x, 1994.
Serça, D., Delmas, R., Le Roux, X., Parsons, D. a. B., Scholes, M. C., Abbadie, L., Lensi, R., Ronce, O., and Labroue, L.: Comparison of nitrogen monoxide emissions from several African tropical ecosystems and influence of season and fire, Glob. Biogeochem. Cy., 12, 637–651, https://doi.org/10.1029/98GB02737, 1998.
Shah, V., Keller, C. A., Knowland, K. E., Christiansen, A., Hu, L., Wang, H., Lu, X., Alexander, B., and Jacob, D. J.: Particulate Nitrate Photolysis as a Possible Driver of Rising Tropospheric Ozone, Geophys. Res. Lett., 51, e2023GL107980, https://doi.org/10.1029/2023GL107980, 2024.
Sibret, T., Bauters, M., Bulonza, E., Lefevre, L., Cerutti, P. O., Lokonda, M., Mbifo, J., Michel, B., Verbeeck, H., and Boeckx, P.: CongoFlux – The First Eddy Covariance Flux Tower in the Congo Basin, Front. Soil Sci., 2, 883236, https://doi.org/10.3389/fsoil.2022.883236, 2022.
Simpson, D. and Darras, S.: Global soil NO emissions for Atmospheric Chemical Transport Modelling: CAMS-GLOB-SOIL v2.2, Earth Syst. Sci. Data Discuss. [preprint], https://doi.org/10.5194/essd-2021-221, 2021.
Simpson, D. and Segers, A.: Transboundary particulate matter, photo-oxidants, acidifying and eutrophying components, EMEP Status Report 1/2024, The Norwegian Meteorological Institute, Oslo, Norway, 2024.
Simpson, D., Benedictow, A., and Darras, S.: The CAMS soil emissions: CAMS-GLOB-SOIL, in: CAMS2_61 – Global and European emission inventories., in: Documentation of CAMS emission inventory products, 9, 59–70, 2023.
Sindelarova, K., Markova, J., Simpson, D., Huszar, P., Karlicky, J., Darras, S., and Granier, C.: High-resolution biogenic global emission inventory for the time period 2000–2019 for air quality modelling, Earth Syst. Sci. Data, 14, 251–270, https://doi.org/10.5194/essd-14-251-2022, 2022.
Singh, A., Avis, W. R., and Pope, F. D.: Visibility as a proxy for air quality in East Africa, Environ. Res. Lett., 15, 084002, https://doi.org/10.1088/1748-9326/ab8b12, 2020.
Sofiev, M., Vankevich, R., Ermakova, T., and Hakkarainen, J.: Global mapping of maximum emission heights and resulting vertical profiles of wildfire emissions, Atmos. Chem. Phys., 13, 7039–7052, https://doi.org/10.5194/acp-13-7039-2013, 2013.
Soulie, A., Granier, C., Darras, S., Zilbermann, N., Doumbia, T., Guevara, M., Jalkanen, J.-P., Keita, S., Liousse, C., Crippa, M., Guizzardi, D., Hoesly, R., and Smith, S. J.: Global anthropogenic emissions (CAMS-GLOB-ANT) for the Copernicus Atmosphere Monitoring Service simulations of air quality forecasts and reanalyses, Earth Syst. Sci. Data, 16, 2261–2279, https://doi.org/10.5194/essd-16-2261-2024, 2024.
Souri, A. H., Nowlan, C. R., González Abad, G., Zhu, L., Blake, D. R., Fried, A., Weinheimer, A. J., Wisthaler, A., Woo, J.-H., Zhang, Q., Chan Miller, C. E., Liu, X., and Chance, K.: An inversion of NOx and non-methane volatile organic compound (NMVOC) emissions using satellite observations during the KORUS-AQ campaign and implications for surface ozone over East Asia, Atmos. Chem. Phys., 20, 9837–9854, https://doi.org/10.5194/acp-20-9837-2020, 2020.
Souri, A. H., González Abad, G., Wolfe, G. M., Verhoelst, T., Vigouroux, C., Pinardi, G., Compernolle, S., Langerock, B., Duncan, B. N., and Johnson, M. S.: Feasibility of robust estimates of ozone production rates using a synergy of satellite observations, ground-based remote sensing, and models, Atmos. Chem. Phys., 25, 2061–2086, https://doi.org/10.5194/acp-25-2061-2025, 2025.
Sporre, M. K., Blichner, S. M., Karset, I. H. H., Makkonen, R., and Berntsen, T. K.: BVOC–aerosol–climate feedbacks investigated using NorESM, Atmos. Chem. Phys., 19, 4763–4782, https://doi.org/10.5194/acp-19-4763-2019, 2019.
Stavrakou, T. and Müller, J.-F.: Grid-based versus big region approach for inverting CO emissions using Measurement of Pollution in the Troposphere (MOPITT) data, J. Geophys. Res.-Atmos., 111, D15304, https://doi.org/10.1029/2005JD006896, 2006.
Stavrakou, T., Müller, J.-F., Boersma, K. F., De Smedt, I., and van der A, R. J.: Assessing the distribution and growth rates of NOx emission sources by inverting a 10-year record of NO2 satellite columns, Geophys. Res. Lett., 35, L10801, https://doi.org/10.1029/2008GL033521, 2008.
Stavrakou, T., Müller, J.-F., De Smedt, I., Van Roozendael, M., van der Werf, G. R., Giglio, L., and Guenther, A.: Global emissions of non-methane hydrocarbons deduced from SCIAMACHY formaldehyde columns through 2003–2006, Atmos. Chem. Phys., 9, 3663–3679, https://doi.org/10.5194/acp-9-3663-2009, 2009.
Stavrakou, T., Müller, J.-F., Boersma, K. F., van der A, R. J., Kurokawa, J., Ohara, T., and Zhang, Q.: Key chemical NOx sink uncertainties and how they influence top-down emissions of nitrogen oxides, Atmos. Chem. Phys., 13, 9057–9082, https://doi.org/10.5194/acp-13-9057-2013, 2013.
Stavrakou, T., Müller, J.-F., Bauwens, M., De Smedt, I., Van Roozendael, M., De Mazière, M., Vigouroux, C., Hendrick, F., George, M., Clerbaux, C., Coheur, P.-F., and Guenther, A.: How consistent are top-down hydrocarbon emissions based on formaldehyde observations from GOME-2 and OMI?, Atmos. Chem. Phys., 15, 11861–11884, https://doi.org/10.5194/acp-15-11861-2015, 2015.
Steinkamp, J. and Lawrence, M. G.: Improvement and evaluation of simulated global biogenic soil NO emissions in an AC-GCM, Atmos. Chem. Phys., 11, 6063–6082, https://doi.org/10.5194/acp-11-6063-2011, 2011.
Swap, R., Annegarn, H., Suttles, J., Haywood, J., Helmlinger, M. C., Hély, C., Hobbs, P. V., Holben, B., Ji, J., King, M., Landmann, T., Maenhaut, W., Otter, L., Pak, B., Piketh, S., Platnick, S., Privette, J., Roy, D., Thompson, A., and Yokelson, R.: The Southern African Regional Science Initiative (SAFARI 2000): Overview of the Dry Season Field Campaign, S. Afr. J. Sci., 98, 125–130, 2002.
Trentmann, J., Andreae, M. O., and Graf, H.-F.: Chemical processes in a young biomass-burning plume, J. Geophys. Res.-Atmos., 108, 4705, https://doi.org/10.1029/2003JD003732, 2003.
van Geffen, J., Eskes, H., Compernolle, S., Pinardi, G., Verhoelst, T., Lambert, J.-C., Sneep, M., ter Linden, M., Ludewig, A., Boersma, K. F., and Veefkind, J. P.: Sentinel-5P TROPOMI NO2 retrieval: impact of version v2.2 improvements and comparisons with OMI and ground-based data, Atmos. Meas. Tech., 15, 2037–2060, https://doi.org/10.5194/amt-15-2037-2022, 2022.
van der Werf, G. R., Randerson, J. T., Giglio, L., van Leeuwen, T. T., Chen, Y., Rogers, B. M., Mu, M., van Marle, M. J. E., Morton, D. C., Collatz, G. J., Yokelson, R. J., and Kasibhatla, P. S.: Global fire emissions estimates during 1997–2016, Earth Syst. Sci. Data, 9, 697–720, https://doi.org/10.5194/essd-9-697-2017, 2017.
Verhoelst, T., Compernolle, S., Pinardi, G., Lambert, J.-C., Eskes, H. J., Eichmann, K.-U., Fjæraa, A. M., Granville, J., Niemeijer, S., Cede, A., Tiefengraber, M., Hendrick, F., Pazmiño, A., Bais, A., Bazureau, A., Boersma, K. F., Bognar, K., Dehn, A., Donner, S., Elokhov, A., Gebetsberger, M., Goutail, F., Grutter de la Mora, M., Gruzdev, A., Gratsea, M., Hansen, G. H., Irie, H., Jepsen, N., Kanaya, Y., Karagkiozidis, D., Kivi, R., Kreher, K., Levelt, P. F., Liu, C., Müller, M., Navarro Comas, M., Piters, A. J. M., Pommereau, J.-P., Portafaix, T., Prados-Roman, C., Puentedura, O., Querel, R., Remmers, J., Richter, A., Rimmer, J., Rivera Cárdenas, C., Saavedra de Miguel, L., Sinyakov, V. P., Stremme, W., Strong, K., Van Roozendael, M., Veefkind, J. P., Wagner, T., Wittrock, F., Yela González, M., and Zehner, C.: Ground-based validation of the Copernicus Sentinel-5P TROPOMI NO2 measurements with the NDACC ZSL-DOAS, MAX-DOAS and Pandonia global networks, Atmos. Meas. Tech., 14, 481–510, https://doi.org/10.5194/amt-14-481-2021, 2021.
Vigouroux, C., Langerock, B., Bauer Aquino, C. A., Blumenstock, T., Cheng, Z., De Mazière, M., De Smedt, I., Grutter, M., Hannigan, J. W., Jones, N., Kivi, R., Loyola, D., Lutsch, E., Mahieu, E., Makarova, M., Metzger, J.-M., Morino, I., Murata, I., Nagahama, T., Notholt, J., Ortega, I., Palm, M., Pinardi, G., Röhling, A., Smale, D., Stremme, W., Strong, K., Sussmann, R., Té, Y., van Roozendael, M., Wang, P., and Winkler, H.: TROPOMI–Sentinel-5 Precursor formaldehyde validation using an extensive network of ground-based Fourier-transform infrared stations, Atmos. Meas. Tech., 13, 3751–3767, https://doi.org/10.5194/amt-13-3751-2020, 2020.
Vinken, G. C. M., Boersma, K. F., Maasakkers, J. D., Adon, M., and Martin, R. V.: Worldwide biogenic soil NOx emissions inferred from OMI NO2 observations, Atmos. Chem. Phys., 14, 10363–10381, https://doi.org/10.5194/acp-14-10363-2014, 2014.
Wainwright, C. M., Finney, D. L., Kilavi, M., Black, E., and Marsham, J. H.: Extreme rainfall in East Africa, October 2019–January 2020 and context under future climate change, Weather, 76, 26–31, https://doi.org/10.1002/wea.3824, 2021.
Wells, K. C. and Millet, D. B.: ROCR Isoprene Retrievals from the CrIS Satellite Sensor, Data Repository for the University of Minnesota (DRUM) [data set], https://doi.org/10.13020/5n0j-wx73, 2022.
Wells, K. C., Millet, D. B., Payne, V. H., Deventer, M. J., Bates, K. H., de Gouw, J. A., Graus, M., Warneke, C., Wisthaler, A., and Fuentes, J. D.: Satellite isoprene retrievals constrain emissions and atmospheric oxidation, Nature, 585, 225–233, https://doi.org/10.1038/s41586-020-2664-3, 2020.
Wells, K. C., Millet, D. B., Payne, V. H., Vigouroux, C., Aquino, C. a. B., De Mazière, M., de Gouw, J. A., Graus, M., Kurosu, T., Warneke, C., and Wisthaler, A.: Next-Generation Isoprene Measurements From Space: Detecting Daily Variability at High Resolution, J. Geophys. Res.-Atmos., 127, e2021JD036181, https://doi.org/10.1029/2021JD036181, 2022.
Weng, H., Lin, J., Martin, R., Millet, D. B., Jaeglé, L., Ridley, D., Keller, C., Li, C., Du, M., and Meng, J.: Global high-resolution emissions of soil NO x , sea salt aerosols, and biogenic volatile organic compounds, Sci. Data, 7, 148, https://doi.org/10.1038/s41597-020-0488-5, 2020.
Wennberg, P. O., Bates, K. H., Crounse, J. D., Dodson, L. G., McVay, R. C., Mertens, L. A., Nguyen, T. B., Praske, E., Schwantes, R. H., Smarte, M. D., St Clair, J. M., Teng, A. P., Zhang, X., and Seinfeld, J. H.: Gas-Phase Reactions of Isoprene and Its Major Oxidation Products, Chem. Rev., 118, 3337–3390, https://doi.org/10.1021/acs.chemrev.7b00439, 2018.
Wolfe, G. M., Kaiser, J., Hanisco, T. F., Keutsch, F. N., de Gouw, J. A., Gilman, J. B., Graus, M., Hatch, C. D., Holloway, J., Horowitz, L. W., Lee, B. H., Lerner, B. M., Lopez-Hilifiker, F., Mao, J., Marvin, M. R., Peischl, J., Pollack, I. B., Roberts, J. M., Ryerson, T. B., Thornton, J. A., Veres, P. R., and Warneke, C.: Formaldehyde production from isoprene oxidation across NOx regimes, Atmos. Chem. Phys., 16, 2597–2610, https://doi.org/10.5194/acp-16-2597-2016, 2016.
WMO: State of the Climate in Africa, World Meteorological Organization (WMO), 2019.
World Meteorological Organization: State of the Climate in Africa 2019, Geneva, ISBN/ISSN 9789263112750, 2020.
Yan, X., Ohara, T., and Akimoto, H.: Statistical modeling of global soil NOx emissions, Glob. Biogeochem. Cy., 19, GB3019, https://doi.org/10.1029/2004GB002276, 2005.
Ye, C., Zhou, X., Pu, D., Stutz, J., Festa, J., Spolaor, M., Tsai, C., Cantrell, C., Mauldin, R. L., Campos, T., Weinheimer, A., Hornbrook, R. S., Apel, E. C., Guenther, A., Kaser, L., Yuan, B., Karl, T., Haggerty, J., Hall, S., Ullmann, K., Smith, J. N., Ortega, J., and Knote, C.: Rapid cycling of reactive nitrogen in the marine boundary layer, Nature, 532, 489–491, https://doi.org/10.1038/nature17195, 2016.
Yienger, J. J. and Levy, H.: Empirical model of global soil-biogenic NOx emissions, J. Geophys. Res.-Atmos., 100, 11447–11464, https://doi.org/10.1029/95JD00370, 1995.
Yombo Phaka, R., Merlaud, A., Pinardi, G., Friedrich, M. M., Van Roozendael, M., Müller, J.-F., Stavrakou, T., De Smedt, I., Hendrick, F., Dimitropoulou, E., Bopili Mbotia Lepiba, R., Phuku Phuati, E., Djibi, B. L., Jacobs, L., Fayt, C., Mbungu Tsumbu, J.-P., and Mahieu, E.: Ground-based Multi-AXis Differential Optical Absorption Spectroscopy (MAX-DOAS) observations of NO2 and H2CO at Kinshasa and comparisons with TROPOMI observations, Atmos. Meas. Tech., 16, 5029–5050, https://doi.org/10.5194/amt-16-5029-2023, 2023.
Zhu, L., González Abad, G., Nowlan, C. R., Chan Miller, C., Chance, K., Apel, E. C., DiGangi, J. P., Fried, A., Hanisco, T. F., Hornbrook, R. S., Hu, L., Kaiser, J., Keutsch, F. N., Permar, W., St. Clair, J. M., and Wolfe, G. M.: Validation of satellite formaldehyde (HCHO) retrievals using observations from 12 aircraft campaigns, Atmos. Chem. Phys., 20, 12329–12345, https://doi.org/10.5194/acp-20-12329-2020, 2020.
Ziemke, J. R., Chandra, S., and Bhartia, P. K.: “Cloud slicing”: A new technique to derive upper tropospheric ozone from satellite measurements, J. Geophys. Res.-Atmos., 106, 9853–9867, https://doi.org/10.1029/2000JD900768, 2001.