the Creative Commons Attribution 4.0 License.
the Creative Commons Attribution 4.0 License.
 | 21 Feb 2025
A global dust emission dataset for estimating dust radiative forcings in climate models
Jasper F. Kok
Longlei Li
David M. Lawrence
Natalie M. Mahowald
Simone Tilmes
Erik Kluzek
Sedimentary records indicate that atmospheric dust has increased substantially since preindustrial times. However, state-of-the-art global Earth system models (ESMs) are unable to capture this historical increase, posing challenges in assessing the impacts of desert dust on Earth's climate. To address this issue, we construct a globally gridded dust emission dataset (DustCOMMv1) spanning 1841–2000. We do so by combining 19 sedimentary records of dust deposition with observational and modeling constraints on the modern-day dust cycle. The derived emission dataset contains interdecadal variability of dust emissions as forced by the deposition flux records, which increased by approximately 50 % from 1851–1870 to 1981–2000. We further provide future dust emission datasets for 2000–2100 by assuming three possible scenarios for how future dust emissions will evolve. We evaluate the historical dust emission dataset and illustrate its effectiveness in enforcing a historical dust increase in ESMs by conducting a long-term (1851–2000) dust cycle simulation with the Community Earth System Model (CESM2). The simulated dust depositions are in reasonable agreement with the long-term increase in most sedimentary dust deposition records and with measured long-term trends in dust concentration at sites in Miami and Barbados. This contrasts with the CESM2 simulations using a process-based dust emission scheme and with simulations from the Coupled Model Intercomparison Project (CMIP6), which show little to no secular trends in dust deposition, concentration, and optical depth. The DustCOMM emissions thus enable ESMs to account for the historical radiative forcings (RFs), including due to dust direct interactions with radiation (direct RF). Our CESM2 simulations estimate a 1981–2000 minus 1851–1870 direct RF of −0.10 W m−2 by dust aerosols up to 10 µm in diameter (PM10) at the top of atmosphere (TOA). This global dust emission dataset thus enables models to more accurately account for historical aerosol forcings, thereby improving climate change projections such as those in the Intergovernmental Panel on Climate Change (IPCC) assessment reports.
- Article
(8883 KB) - Full-text XML
-
Supplement
(2287 KB) - BibTeX
- EndNote


Observations indicate that desert dust in the atmosphere has increased by about 50 % since the 1850s (e.g., Mahowald et al., 2010; Hooper and Marx, 2018; Kok et al., 2023). It is crucial that Earth system models (ESMs) and chemical transport models (CTMs) simulate this dust increase to adequately represent its impacts on climate, ocean nutrient cycles, and ecosystems. However, state-of-the-art ESMs struggle to capture this historical increase in desert dust (Kok et al., 2023). While global models can reasonably represent the global spatial distribution of dust in the contemporary climate (e.g., Zhao et al., 2022), they struggle to represent the temporal variability of dust (e.g., Klose et al., 2021; Kok et al., 2023). Many ESM dust simulations can roughly capture the day-to-day variability and seasonality of dust (e.g., Klose et al., 2021; Leung et al., 2024), but they fail to capture the historical interannual to interdecadal variability (e.g., Mahowald et al., 2010; Smith et al., 2017; Evan, 2018; Kok et al., 2023). Most historical runs of the Coupled Model Intercomparison Project phase 6 (CMIP6) ESMs showed flat dust trends across 1850–2000, while sedimentary records showed a dust increase of 55 ± 30 % for the same period (Kok et al., 2023).
The large observed historical dust increase is thought to be mainly due to historical human land use and land cover change (LULCC) and climate change (Stanelle et al., 2014). For example, the global agricultural area increased from ∼ 9 % in the 1850s to ∼ 35 % in the 2000s (Klein Goldewijk et al., 2011). The large-scale conversion of wild lands to agricultural land across many semiarid regions could have resulted in significant desertification and elevated dust emissions across the globe (Ginoux et al., 2012; McConnell et al., 2007; Neff et al., 2008; Webb and Pierre, 2018). Human water use management as well as climate change could also result in the desiccation of inland lakes and the formation of playas, which then emit salted dust (e.g., Niemeyer et al., 1999; Indoitu et al., 2015; Xi and Sokolik, 2016). Furthermore, global biological soil crust (biocrust) cover on land surfaces has been shown to be reduced under human-induced land use and climate changes (e.g., trampling by livestock and vehicles, perturbed temperature and precipitation), further enhancing dust emissions (Ferrenberg et al., 2015; Rodriguez-Caballero et al., 2018, 2022). In addition, climate change could enhance dust emissions via multiple pathways, such as enhanced aridity over arid regions (Held and Soden, 2006; Pu and Ginoux, 2017), increased soil bareness due to increased wildfires (Wagner et al., 2021; Wang et al., 2023; Yu and Ginoux, 2022), and elevated wind speed over some desert regions (Masson-Delmotte et al., 2021; Yu and Ginoux, 2022). Climate change might also reduce dust emissions, such as by enhancing vegetation cover and reducing bareness via CO2 fertilization (e.g., Smith et al., 2000; Mahowald, 2007). Although many ESMs include the processes necessary to represent climate change and LULCC, they are unable to reproduce the secular dust trend. This model–observation discrepancy is likely in part because ESM dust emission schemes are not sufficiently sensitive to the input variables of wind speed, soil moisture, and soil bareness in ESMs (e.g., Kok et al., 2014, 2018). It could also possibly be because the climate change and LULCC over the arid regions in ESMs are not well represented, such as by missing biocrust degradation or other processes. Investigating the main drivers of this dust trend and improving the ESM representation of it are thus necessary to account for the impacts of historical and future dust changes on the Earth system.
The major problem of the ESMs' missing long-term dust trend is that ESMs will not capture the radiative forcing (RF) due to the increased dust and its interactions with radiation, clouds, atmospheric chemistry, snow and ice, and biogeochemistry (Kok et al., 2023). Furthermore, since current estimates of the climate sensitivity (K or K W−1 m2) to greenhouse gas (GHG) warming depend on the historical aerosol RF, missing the dust RF likely causes ESMs to underestimate the overall negative aerosol RF, which could in turn affect models' climate sensitivity (e.g., Andreae et al., 2005; Mahowald et al., 2024). Hence, the inadequate representation of the historical dust increase in ESMs may affect RFs, affect climate sensitivity, and ultimately mislead climate change predictions, such as those reported by the Intergovernmental Panel on Climate Change (IPCC, 2021).
Despite the inability of models to represent the historical increase in desert dust, previous studies have estimated the effects of this increase on Earth's radiation budget and climate (Kok et al., 2023; Mahowald et al., 2010; Stanelle et al., 2014):
where fΔdust represents the fractional change in dust mass loading for 1850–2000. Here, the radiative effect (RE; W m−2) of dust is defined as the change in the Earth's radiation budget due to the presence of dust at a given time (e.g., in the year 1850), and the RF is defined as the change in RE across time (e.g., from 1850 to 2000), which could be due to changes in dust mass and/or other dust properties. The uncertainty in dust RF is thus partially due to uncertainty in the quantification of dust RE, which itself is a sum of REs due to dust interactions with radiation, cloud microphysics, atmospheric chemistry, biogeochemistry, and the cryosphere (Hamilton et al., 2022; Mahowald et al., 2010; Skiles et al., 2018; Storelvmo, 2017). Of these various dust radiative effects, the direct radiative effect (DRE) of dust, due to dust scattering and absorbing radiation, is the best understood, while dust indirect REs are less understood due to the highly complex and uncertain modeled dust interactions with other processes (e.g., Boucher et al., 2013; Storelvmo, 2017; Bellouin et al., 2020). The DRE depends on multiple factors, such as the dust particle size distribution (PSD), dust mineralogy, and the albedo of the underlying land surface (Ke et al., 2022; Kok et al., 2023; Li and Sokolik, 2018). ESMs thus need to prescribe adequate dust microphysical properties and simulate a realistic global dust distribution to estimate the dust DRE. However, current ESMs commonly overestimate fine dust (volume equivalent diameter Dve < 2.5 µm), which cools by scattering shortwave (SW) radiation, and neglect or underestimate super-coarse dust (Dve > 10 µm), which tends to warm by absorbing SW and longwave (LW) radiation (Adebiyi et al., 2023; Di Biagio et al., 2020; Kok et al., 2017). Moreover, models neglect the warming effects of dust scattering of LW radiation (Di Biagio et al., 2020; Dufresne et al., 2002) and are subject to large uncertainties due to poorly constrained dust optical properties (Li et al., 2021a), with a possible bias towards dust that is too absorbing (Adebiyi et al., 2023). Considering all these uncertainties, current best estimates of the dust DRE are within the range of −0.15 ± 0.35 W m−2, reflecting the fact that the sign of the dust DRE is unclear (Kok et al., 2023, and references therein). The dust DRE could thus slightly warm or moderately cool the Earth, depending on prescribed optical properties and the ratio of fine to coarse dust in the ESMs.
In addition to the uncertainty in the dust DRE and other dust REs, the estimation of dust RF is also affected by our limited understanding of the historical dust change (fΔdust). Recent advances in the estimation of historical dust change are informed by sedimentary records of dust deposition (e.g., McConnell et al., 2007; Mulitza et al., 2010; Clifford et al., 2019). There are > 30 such records that resolve the preindustrial to modern time period (Mahowald et al., 2010; Hooper and Marx, 2018; Kok et al., 2023), but only ∼ 20 of these are thought to be moderately representative of long-range-transported dust from the major low-latitude source regions (Hooper and Marx, 2018). Nonetheless, previous studies (e.g., Mahowald et al., 2010; Kok et al., 2023) have used these deposition records to reconstruct the evolution of the global dust cycle since preindustrial times. Kok et al. (2021a, b, 2023) further showed that one could statistically derive historical dust emission changes from the observed dust depositions using ESM-simulated deposition–emission relationships. This could enable ESMs to read in derived dust emissions that encapsulate the observed historical dust trend. Using prescribed emissions can thus force more realistic ESM simulations of the dust cycle and dust RF that match the fΔdust inferred from dust deposition records, which current ESMs cannot reproduce using mechanistic emission schemes.
In this study, we use the existing sedimentary dust records to derive a global dust emission dataset and evaluate its effectiveness in representing the historical dust changes as exhibited by the records. We first combine sedimentary records of dust deposition with modeling and observational constraints to derive a global gridded dust emission dataset for 1841–2000. The emission dataset represents decadal dust trends constrained by the interdecadal variability of 19 dust deposition time series and a gridded spatial dust variability informed by a multimodel ensemble (MME) estimate of the global dust emission spatial distribution and the observationally constrained dust size and optical properties. We then evaluate the derived emission dataset by enabling an ESM (in this study the Community Earth System Model version 2, CESM2) to read in the decadally varying emission dataset and perform a historical simulation for 1851–2000. We compare the simulated dust cycle against available long-term dust observations to evaluate the performance of the ESM using the emission forcing. We finally compute the dust direct REs and RFs across the historical period using the ESM forced by the emission dataset. We show that ESMs employing this emission inventory are able to simulate the decadal variability of multiple dust cycle variables, hence enabling ESMs to predict more realistic dust RF and climatic impacts.
The paper is organized as follows. Section 2 provides a detailed discussion on deriving a globally gridded dust emission dataset for historical and future conditions. Section 3 describes the configuration of the ESM (CESM2) employing the dust emission dataset to conduct historical simulations of the dust cycle. Section 4 introduces the CMIP6 and independent dust particulate matter (PM) concentration data for model–observation comparisons. Section 5 discusses the evaluation of the ESM dust simulations against CMIP6 dust simulations and long-term dust observations. Section 6 provides an estimate of the globally gridded historical dust direct REs and RFs for 1851–2000. Section 7 provides a summary of this study.
In this section, we first describe our methodology for obtaining a globally gridded historical dust emission dataset spanning the years 1841–2000, after which we also extend this dataset until 2100 to support future scenario simulations.
2.1 A historical dust emission dataset
We build on our previous methodology in Kok et al. (2023; hereafter K23), which reconstructed the globally integrated atmospheric dust loading between the years 1841–2000 for each of nine major source regions. K23 did so by combining multiple sedimentary records of dust deposition (see site locations in Fig. 1; McConnell et al., 2007; Mahowald et al., 2010; Mulitza et al., 2010; Hooper and Marx, 2018; Clifford et al., 2019) with constraints on the modern-day dust deposition flux produced by each major source region to each deposition site (Fig. 1). This allowed them to obtain the time evolution of the globally integrated deposition flux (and thus the emission flux) generated by each source region that best explained the 19 measured deposition time series using an inverse analysis. Below, we briefly review the methodology in K23 and then extend it to obtain a globally gridded decadal dust emission dataset.
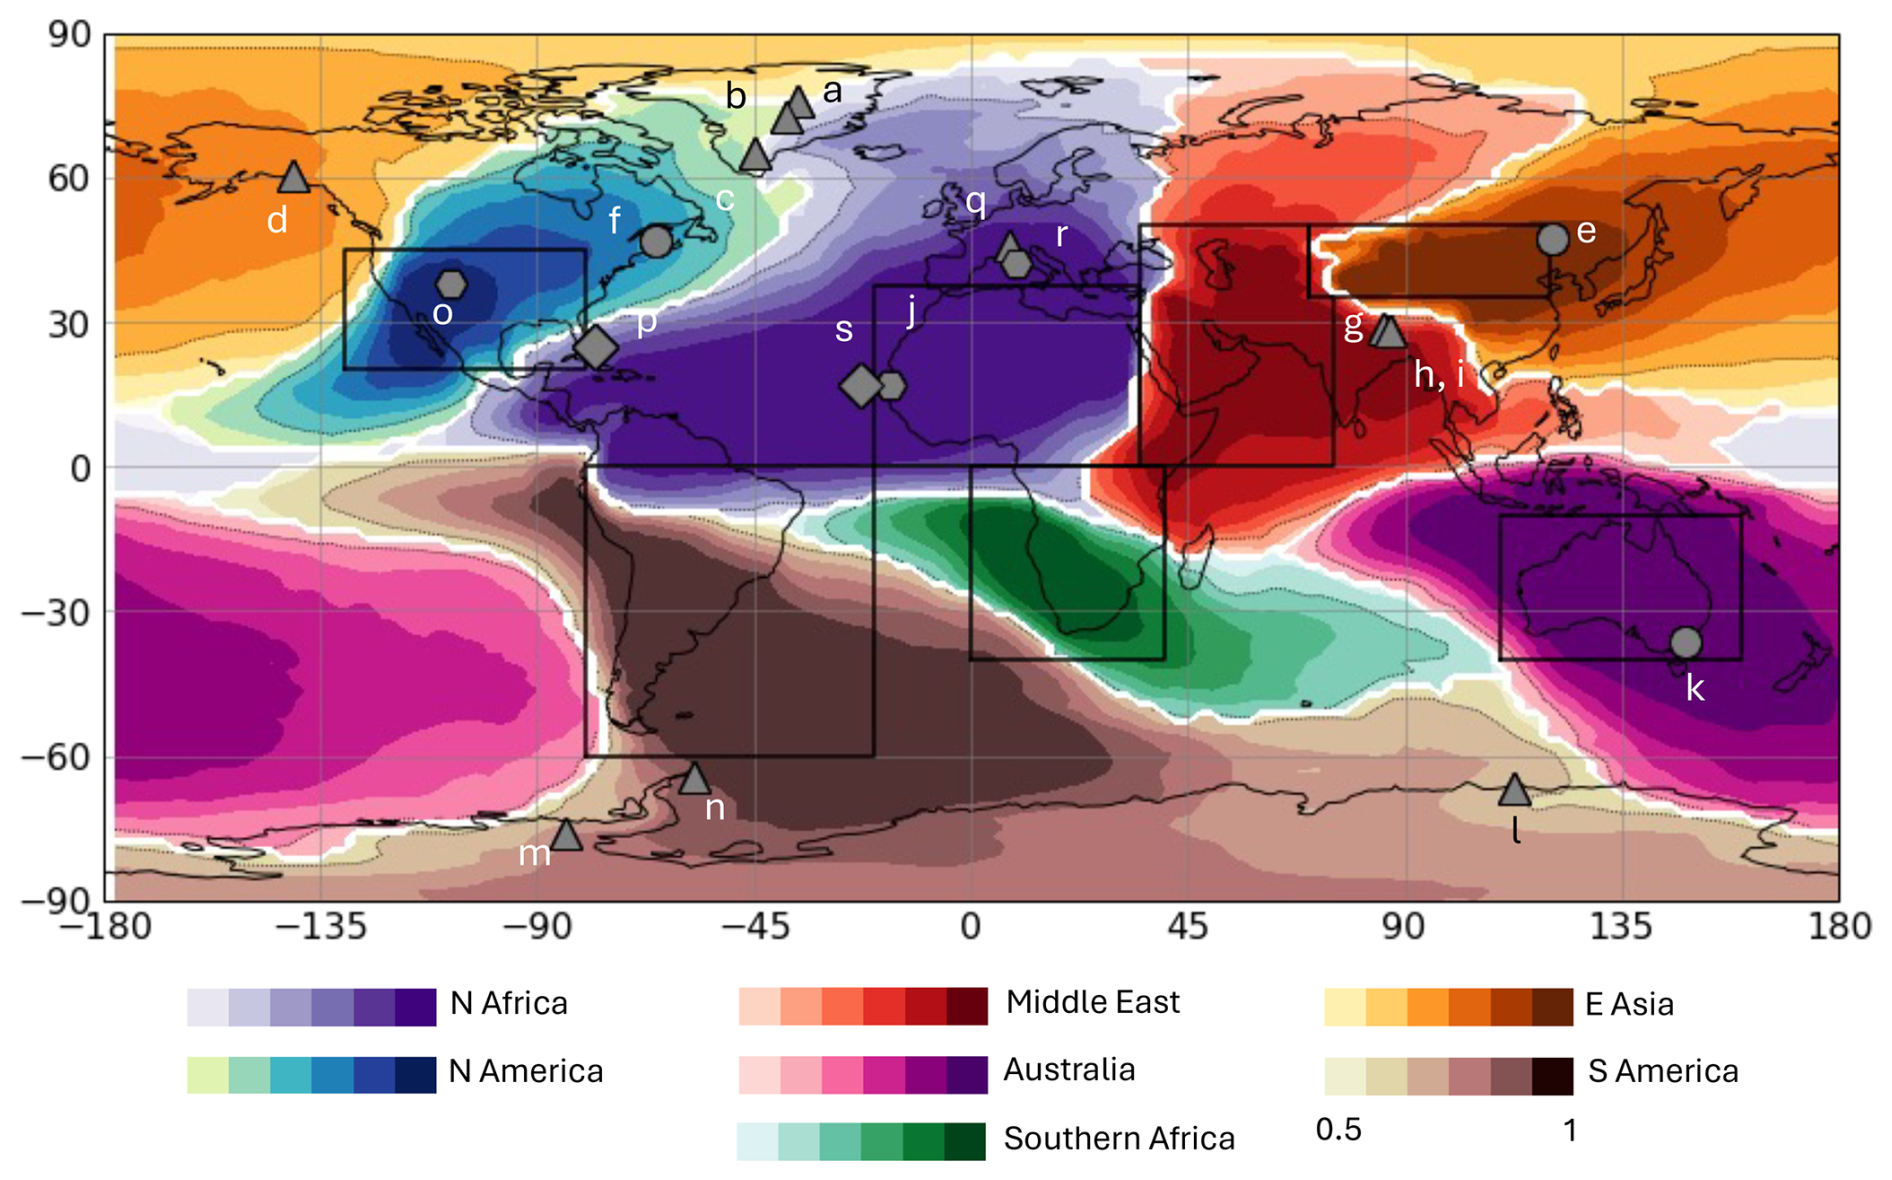
Figure 1Map of deposition record sites and dominant dust source regions. The black boxes denote the seven major source regions (North Africa, the Middle East and central Asia, East Asia, North America, Australia, South America, and southern Africa). The colors indicate which source region contributes the greatest deposition flux in the current climate (cc) at a given grid, with the shading denoting the fractional contribution of that dominant source region. The letters correspond to the panel of the retrieved dust deposition time series in Fig. 4. Gray symbols denote the locations of the 19 dust deposition records used to reconstruct dust loading since preindustrial times, with triangles, circles, diamonds, and hexagons respectively denoting records extracted from ice, marine/lake sediment, coral, and peat cores. The figure is modified after Fig. 8a in Kok et al. (2021b).
The methodology in K23 combined the observed dust deposition time series at 19 sites (Fig. 1) with constraints on the fractional contribution that dust emissions from each source region make to the dust deposition flux at each deposition site (Eq. 2). The time series of the deposition fluxes from the core records were processed and smoothed to truncate noise and interannual variability, yielding decadally varying deposition values. Meanwhile, the constraints on the fractional contribution that dust emissions from each source region make to the dust deposition flux at each deposition site () were obtained from the Dust Constraints from joint Observational–Modelling–Experimental analysis (DustCOMM) dataset (Kok et al., 2021a, b). DustCOMM was produced by integrating an ensemble of six global aerosol model simulations (see Table 1 in Kok et al., 2021a) with observationally informed constraints on the dust size distribution, extinction efficiency, and regional dust aerosol optical depth (DAOD) near dust source regions, providing dust reanalysis up to a particle diameter of 20 µm (dust PM20). The DustCOMM deposition fluxes from each source region include uncertainties, which were obtained through a bootstrap procedure (Wilks, 2019) that propagates uncertainty from the spread in the model simulations, the uncertainty in observed dust abundance and microphysical properties, and the spread in the deposition flux time series.
Using the deposition records and the source-region-resolved dust deposition constraints, K23 obtained the decadal evolution of dust cycle variables (loading, emission, and deposition fluxes) for each of the major dust source regions. They did so by assuming that the globally integrated dust variables generated by a given source region depend linearly on dust emissions from that source region. K23 then found, for each decade, the relative change λi(d) in the dust deposition flux (and thus dust loading and deposition given their linear interdependency) generated by each source region i that minimizes the sum of the squared differences between the deposition flux time series and the reconstructed dust emissions multiplied by the DustCOMM dust deposition-to-emission relationship . That is,
where βj(d) is the measured deposition flux at site j for decade d, normalized by its value in the last decade in the reconstructed period (1991–2000), and λi(d) is the decadal dust emission flux generated by source i in decade d, also normalized by its value in the 1990s. Ndep = 19 is the number of deposition flux time series in the compilation (Fig. 1), and Nsr = 7 is the number of dust emission source regions we defined (rectangular boxes in Fig. 1) for which we obtain reconstructed emissions λ. We note that although DustCOMM in Kok et al. (2021a) defined Nsr = 9 sources, deposition fluxes from the three North African sources (western and eastern North Africa and the Sahel) tend to be correlated. Since there are currently insufficient dust deposition records dominated by dust from the Sahel and eastern North Africa, these three sources cannot be separately inverted robustly. Thus, in this study these three sources were grouped into one bigger region similar to the North Africa source used in Mahowald et al. (2010), yielding a total of Nsr = 7 sources (Fig. 1). Lastly, is the reanalyzed dust deposition-to-emission relationship provided by DustCOMM (from Kok et al., 2021a, b; hereafter K21), the fractional contribution of dust emissions from the ith source to the deposition flux at the jth core site in the current climate (cc) (see colors in Fig. 1). In K21, is jointly determined by both meteorological factors (such as wind circulation and precipitation) and the emission strengths of the different source regions in the current climate. is used to quantify the optimizable deposition flux at the jth site in the dth decade:
such that the cost function in Eq. (2) can also be expressed as . Since was obtained using 2004–2008 ESM simulations and observational constraints (in K21), here we apply the stationarity assumption that is roughly unchanged for 1841–2000. We performed the optimization decade by decade using the 19 deposition time series βj and the fractional contribution to solve for nine λ values for all decades in 1841–2000. The seven sources together account for the vast majority of natural desert dust emissions (Kok et al., 2021a), excluding emissions from high latitudes (∼ 2 %–3 % of global emissions; Bullard et al., 2016) and from anthropogenic activities like agriculture, industrial processes, and vehicular traffic on dirt roads outside of these seven sources (Kok et al., 2021a). Figure 2 shows the solutions to the inverted DustCOMMv1 regional emissions (in Tg yr−1) for 1841–2000 in black. A similar inverse analysis was previously performed in K21 for modern times (2004–2008) but using observationally based regional DAOD values, which could be more accurate than measurements of dust deposition fluxes but are only available for the past 2–3 decades.
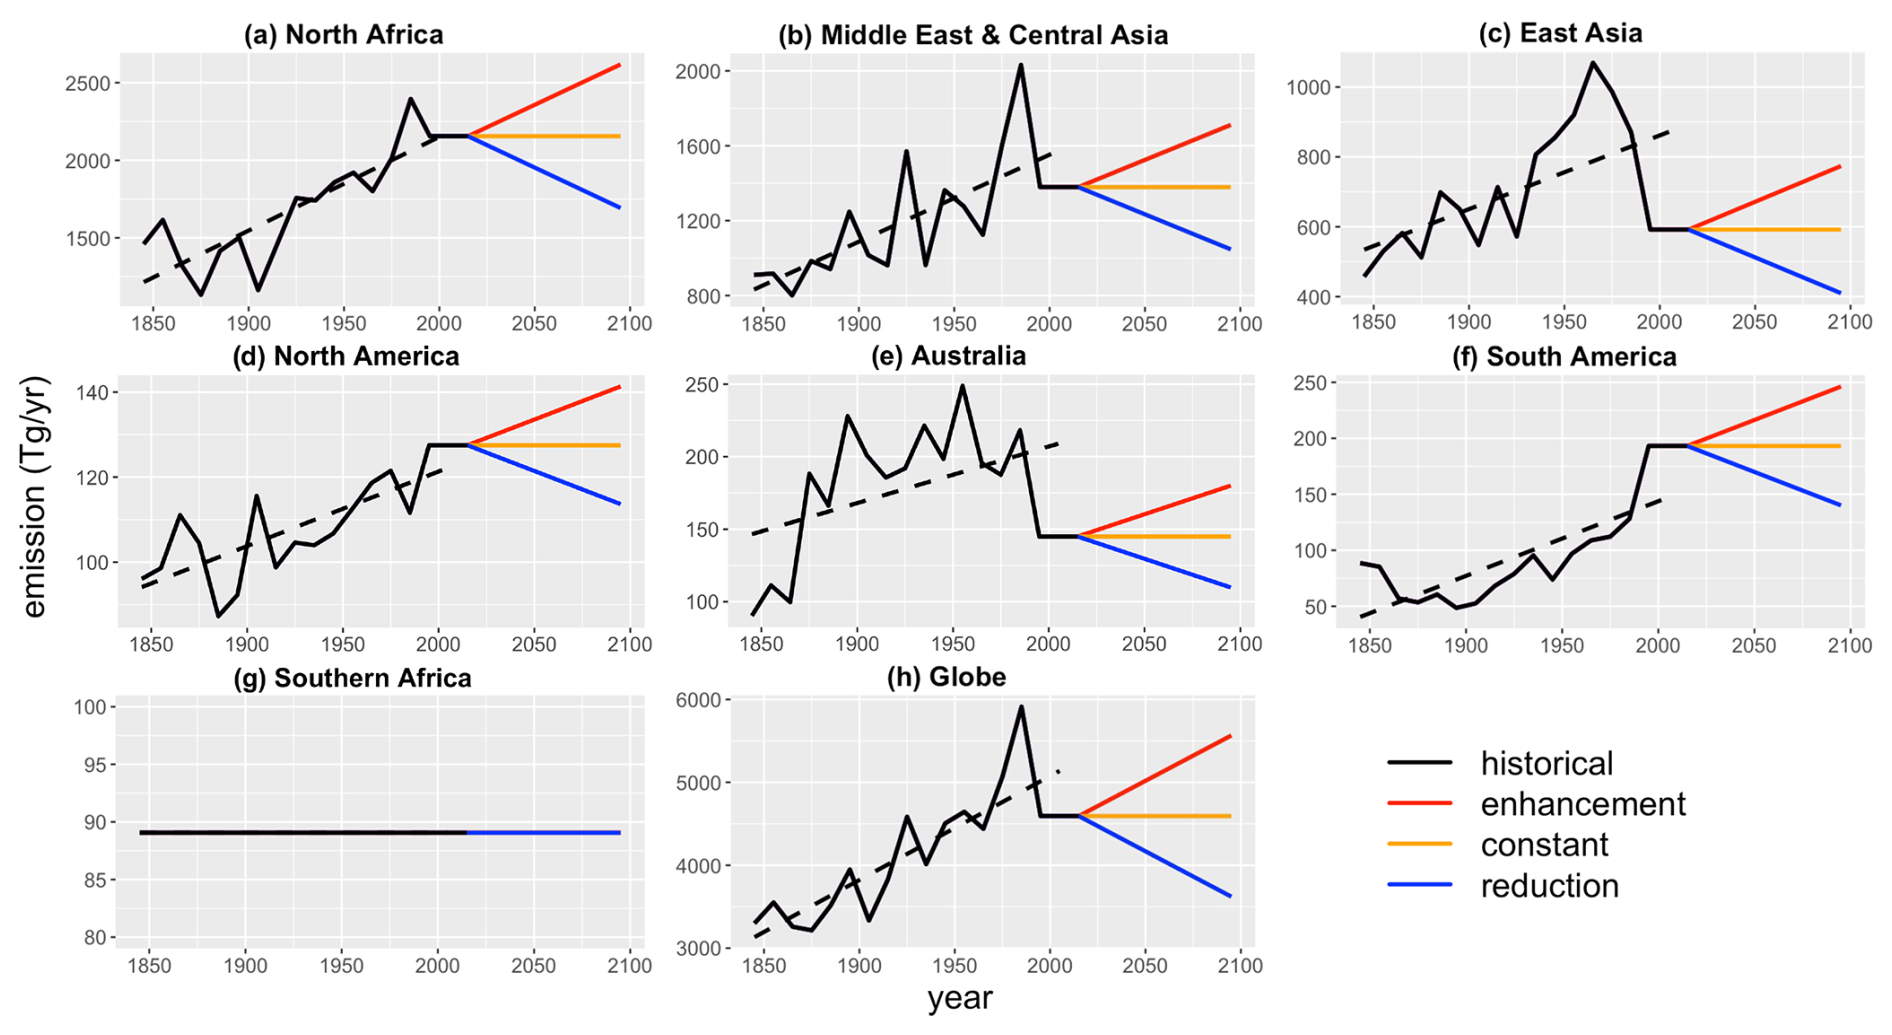
Figure 2Decadal time series of the regional mean and global mean dust emissions (Tg yr−1) for 1841–2100. The black lines show the solutions of the DustCOMM (a–g) inverted emissions for the seven defined source regions in this paper and (h) the globally aggregated emissions for 1841–2000, which are evaluated in this paper. The dashed lines show the linear trend corresponding to the 1841–2000 emissions. Southern African emissions were assumed to have remained constant because there are no deposition core records available to constrain their temporal evolution. The 2001–2020 emissions were set to remain equal to the 1991–2000 emissions, and the 2020–2100 period contains three future dust emission scenarios: enhancement (red; following the same historical trend), constant (green; horizontal line), and reduction (blue; same as the historical trend with a negative sign).
To quantify the uncertainty of the inverted emissions λi, we solve Eq. (3) 500 times using a bootstrap procedure (Chernick, 2007; Efron, 1982) that propagates various uncertainties in the DustCOMM dataset (e.g., uncertainties in dust optics and emitted dust size distribution; see K21a) and which uses a resampling with replacement procedure to propagate uncertainty in the dust deposition records (see details in the Supplement to K23). The DustCOMM historical dust emission dataset used to drive the CESM2 simulations in this study uses the median of the probability distribution obtained from this bootstrap procedure.
Finally, we extend the K23 dust reconstruction by obtaining a globally gridded dust emission dataset or inventory (DustCOMM emissions v1) as
where denotes the 2004–2008 current climate dust emissions (kg m−2 s−1) constrained per source region i by DustCOMM as a function of latitude θ, longitude ϕ, and season s. Fcc,i was obtained as part of the DustCOMM dataset (see Fig. 4a in Kok et al., 2021a) by calibrating emissions simulated by six global aerosol models (all regridded to a horizontal resolution of 1.9° × 2.5°) to observational constraints on DAOD (Ridley et al., 2016). Emissions are nonzero only inside of the source i and are zero elsewhere, informing the grid-by-grid spatial variability of emissions of the ith source. Thus, the nondimensionalized λi(d) here is the weighting or importance of each source i in a given decade d for aggregating a global emission map FEI for any d. As a result, represents our final dust emission product, with a resolution of 1.9° × 2.5° (see Fig. 3 for the reconstructed contemporary emissions), representing the median of the bootstrapping ensemble. We call FEI the DustCOMM emission dataset v1 in this study, and we will evaluate its effectiveness in reproducing the observed dust trend in ESMs by forcing a CESM historical dust cycle simulation (Sect. 5).
We note that FEI is subject to several uncertainties or limitations. First, measurements of deposition fluxes βj and the DustCOMM constraints on both carry substantial uncertainties (Avila et al., 1997; Cakmur et al., 2006; Stanelle et al., 2014; Kok et al., 2021b). We propagated these uncertainties into FEI using a bootstrap procedure, from which we provide 100 ensemble members (or realizations) of the derived emissions. The spread of the ensemble members captures the uncertainties in the measurement errors of the core records βj, as well as model uncertainties in including dust aerosol size distribution, optical properties, and the intermodel uncertainties due to differences in the use of dust emission and deposition schemes, as presented by Kok et al. (2021a, b). Second, Eqs. (1) and (2) use several critical assumptions to obtain FEI (see a full discussion in K23). The most important ones include the stationarity assumptions that (i) the spatial pattern of the dust deposition flux per source region has not changed across time and that (ii) decadal trends in deposition fluxes are caused by changes in emissions instead of transport pathways and deposition processes; there is also a non-local assumption that (iii) dust deposited at the 19 sites originates from representative parts of major sources and not from non-representative local sources. Errors (i) and (ii) were partially assessed by Mahowald et al. (2010), who concluded that each source's simulated transport and deposition patterns changed relatively little over time. Third, the model ensemble representation of contains further internal model uncertainties due to inaccurate parameters and missing mechanisms in the ensemble of global models, which are not characterized by the bootstrapping procedure above. For instance, there are parameter uncertainties in dust aerodynamic and optical properties as well as potentially biased aerosol transport and deposition mechanisms in models (Li et al., 2022, 2024). Also, uncertainties in parameterizing dust's two-way interactions with different Earth system processes (Miller et al., 2004), such as dust feedback on radiation, clouds, snow, ice, and ecosystems (e.g., Hamilton et al., 2020; He et al., 2024; Sagoo and Storelvmo, 2017; Xie et al., 2018a, b), could also impact and dust variability. Fourth, as Kok et al. (2021a) pointed out, while most global models focus on simulating natural and desert dust emissions and neglect anthropogenic (e.g., agricultural and fugitive) dust sources, the core records of dust depositions will not distinguish between the two sources and inherently include both. Therefore, in Eq. (2) all the observed dust variability in βj will be attributed to the source regions defined by the model ensemble, i.e., Fcc,i in Eq. (4), although some model grids (e.g., the Sahel) will contain both deserts and urban areas and farmlands. For estimating dust impacts on climate, the partition between natural and anthropogenic sources does not matter that much as long as both sources produce dust aerosols with similar climate impacts.
2.2 Extending the dust emission dataset into the future
In addition to obtaining an emission dataset for the historical period, we also derive emission datasets of plausible future scenarios of dust emissions. These emission datasets could be used in simulations of future climate to evaluate the effects of different reasonable assumptions about how dust emissions could evolve in the future. Currently, it is unclear whether dust emissions will increase or decrease in the future (e.g., Mahowald and Luo, 2003; Tegen et al., 2004; Achakulwisut et al., 2017; Pu and Ginoux, 2017; Li et al., 2021b; Wu et al., 2022; Liu et al., 2024), both because model projections diverge (Kok et al., 2018; Thornhill et al., 2021) and because we currently have insufficient mechanistic understanding of what caused the historical changes in dust emissions and how those drivers might change in the future (Ginoux et al., 2012; Kok et al., 2023). Factors that could drive an increase in future dust include further land use changes, a decline in biological soil crusts (Rodriguez-Caballero et al., 2022), and increased aridity from increased evaporative demand over land (Cook et al., 2020). Conversely, factors that could drive a decrease in future dust emissions include reforestation (King et al., 2024), increased rainfall in prominent dust sources such as the Sahel (Schewe and Levermann, 2017), greening of semiarid regions from CO2 fertilization (Mahowald and Luo, 2003; Smith et al., 2017), and possible reductions in wind speeds (Yuan et al., 2020; Zha et al., 2021).
Since the future evolution of dust emissions is still unclear, we provide three future emission scenarios for post-2020 that span a range of plausible possibilities. The enhancement scenario assumes that the historical dust trend will continue; the constant scenario assumes that dust emissions will remain at present-day levels; and the reduction scenario assumes that the trend in dust emissions will be reversed, decreasing post-2020 at the same rate it increased over the historical period. All scenarios assume that dust emissions stayed constant for 2001–2020, which is largely consistent with what satellite data imply (Liu et al., 2024; Logothetis et al., 2021).
We calculate the emissions for each decade after 2020 as follows:
where df is the number of decades past the 2010s (e.g., df = 7 for the 2080s), and fs is a scenario-dependent constant that equals 1, 0, and −1 for the three scenarios with enhanced, constant, and reduced future dust, respectively. Finally, ηi is the change per decade in dust emissions emitted by source region i, normalized by the modern-day (1981–2000) dust emissions from that source region. We obtained ηi from a linear fit to the reconstructed 1841–2000 dust emissions, which yields 0.027, 0.030, 0.038, 0.030, 0.014, 0.038, and 0, for the North Africa, Middle East and central Asia, East Asia, North America, Australia, South America, and southern Africa source regions, respectively. Note that the southern African source region was assumed to have remained constant over 1841–2000 due to a lack of deposition data to constrain it (see Fig. 1 and Kok et al., 2023). Figure 2 shows the regionally aggregated dust emission variability for 1841–2100 from the DustCOMMv1 dataset, comprising plots for all three future scenarios. Note that we focus here only on evaluating the historical FEI. Exploring dust impacts on future climate using the future FEI scenarios, as well as developing future scenarios that better suit CMIP's Shared Socioeconomic Pathways (SSPs) for future scenarios, will be warranted as topics of future work.
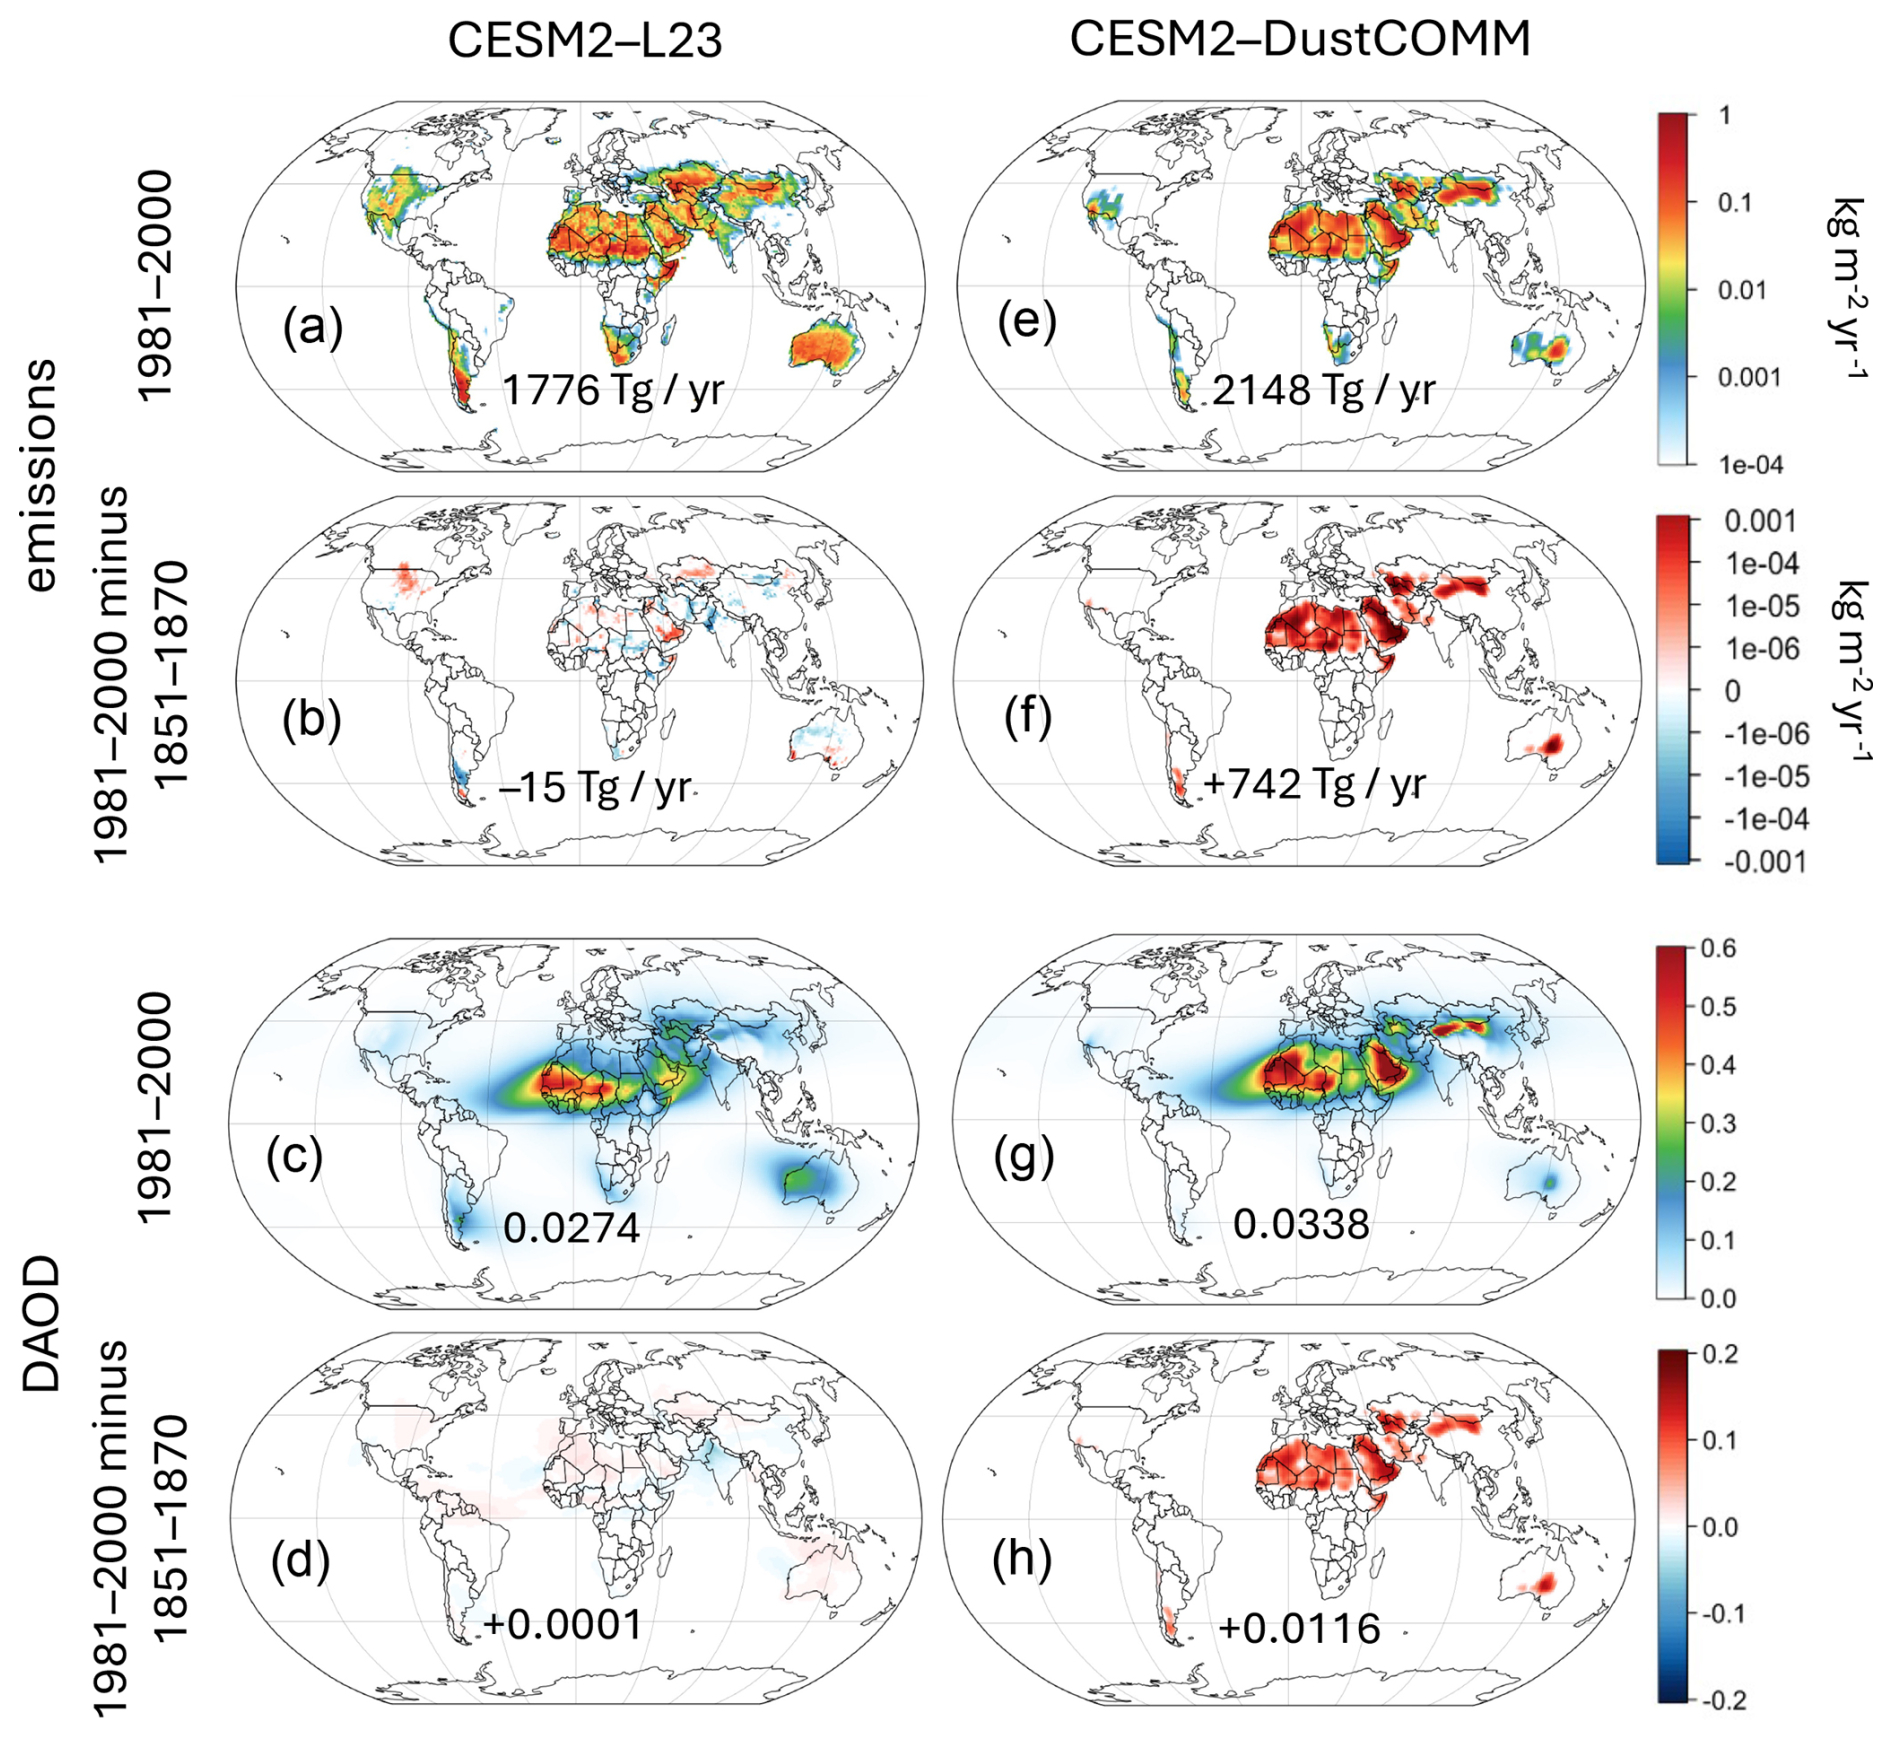
Figure 3The CESM2 dust cycle simulation using the Leung et al. (2023; L23) dust emission scheme and the DustCOMM globally gridded emission dataset v1 derived in this study. (a–d) The CESM2–L23-simulated maps averaged across 1981–2000, as well as the difference between the 1981–2000 and 1851–1870 periods, for both (a, b) dust emissions and (c, d) dust AOD. (e–h) Same maps showing the historical dust increase, but for the CESM2–DustCOMM run. The 1851–1870 dust emission and DAOD maps are also shown in Fig. S1.
3.1 Coupled model configuration
We use CESM version 2.2 (hereafter CESM2; Danabasoglu et al., 2020), a coupled ESM with multiple Earth system components including atmosphere, land, ocean, and sea ice. We use a model configuration (FHIST) of CESM2 that couples the land model to the atmospheric model, while other components (e.g., ocean, sea ice, glacier/land ice) use prescribed data (AMIP configuration). The sea surface temperature (SST) and sea ice dataset is from the reconstructed historical dataset derived by the Met Office Hadley Centre (HadISST; Rayner et al., 2003). Anthropogenic and natural emissions of chemical tracers and aerosols (except dust) as well as land use changes evolve with time following the CMIP6 standard forcings based on the descriptions in Emmons et al. (2020; their Sect. 5) and Lawrence et al. (2019; their Sect. 2.3.1). Our configuration uses a horizontal resolution of 0.9° × 1.25°, 32 vertical levels, and a time step of 30 min, and we ran the simulation for the period 1851–2000.
3.2 Land model configuration
The Community Land Model (CLM5) is the land model component of CESM2. It represents multiple land processes, including surface energy fluxes, surface hydrology, and land biogeochemical cycles. We use the satellite phenology (SP) mode in CLM5, which means that vegetation state (leaf area index, canopy height, vegetation type) is prescribed . The annual LULCC in CLM5 follows the Land Use Harmonization 2 (LUH2) dataset (Hurtt et al., 2020). CLM5 contains a mechanistic dust emission module that estimates dust emission flux (kg m−2 s−1) as a function of meteorological and land surface variables (Leung et al., 2023, 2024). Dust emission fluxes are then passed to the atmospheric model for simulating dust transport and radiative effects.
In this study, we will compare the differences in dust cycle simulations using both the mechanistic dust emission scheme and the derived emission inventory. Instead of the default CLM5 dust emission scheme (Zender et al., 2003), we use an updated scheme based on our prior work (Leung et al., 2023; hereafter the CESM2–L23 run). The L23 scheme adds or improves upon several components of dust emission physics on top of the physically based Kok et al. (2014) scheme. We showed in Leung et al. (2024) that L23 outperforms both the Kok et al. (2014) scheme and the default dust emission scheme in CLM5 (the DEAD scheme; Zender et al., 2003) in capturing the spatial and day-to-day temporal variability of atmospheric dust, but the long-term (interdecadal) temporal variability of dust was not assessed. In addition, we also performed a historical simulation using the prescribed DustCOMMv1 emissions to force an observationally constrained dust trend (hereafter the CESM2–DustCOMM run). CLM5 regridded the emission data to the model resolution in both space and time. The processed emissions were then passed on to the Community Atmosphere Model (CAM6) for atmospheric dust aerosol simulations.
3.3 Atmospheric model configuration
The Community Atmosphere Model (CAM6) takes the emission fluxes from the land model and simulates the transport, deposition, optical properties, and radiative effects of dust aerosols using a four-mode aerosol model (MAM4). The four aerosol modes in MAM4 include the Aitken mode (0.01–0.1 µm), the accumulation mode (0.1–1 µm), the coarse mode (1–10 µm), and the primary carbon mode (Liu et al., 2016). Dust is in all modes except the primary carbon mode. The emitted dust size distribution is based on brittle fragmentation theory (BFT; Kok, 2011), with respective contributions of 0.1 %, 1.0 %, and 98.9 % for the Aitken, accumulation, and coarse modes. The coarse mode in CAM6 includes dust up to a diameter of ∼ 10 µm and therefore misses the super-coarse dust ranging between 10 and 62.5 µm, which produces radiative effects in both the shortwave and longwave spectra (Adebiyi et al., 2023).
CAM6 uses a tracer advection scheme to transport dust aerosols (Neale et al., 2012). Aerosols in each mode are transported as an internal mixture of the different aerosol species present, with their physical properties (e.g., optical properties and density) predicted based upon the volume fraction of each species, while aerosol species from different modes are externally mixed. CAM6 simulates the removal of aerosols via dry deposition and wet deposition. Dry deposition includes turbulent and gravitational settling (Zhang et al., 2001), and wet deposition of aerosols includes in-cloud and below-cloud scavenging (Neale et al., 2012) for both stratiform and convective clouds (Shan et al., 2021). Dust aerosols have two-way couplings and interactions with different Earth system components and processes, such as radiation (Iacono et al., 2008), clouds (Gettelman et al., 2023), and biogeochemistry (Hamilton et al., 2020).
The CAM6 radiative fluxes are computed by the Rapid Radiative Transfer Method for General Circulation Models (RRTMG; Iacono et al., 2008). RRTMG computes the net radiative flux based on the radiation diagnosed at 14 SW and 16 LW spectral bands. We note that RRTMG only accounts for absorption (and not scattering) for the LW bands, while it accounts for both scattering and absorption for the SW bands (Dusfresne et al., 2002; Di Biagio et al., 2020). The dust DRE is determined by calculating the difference of the net radiative flux with and without dust at the top of the atmosphere (via a double radiation call). Dust optical properties (i.e., single-scattering albedo, mass extinction efficiency, and asymmetry factor) are functions of the complex refractive index (CRI). The optical properties of the internally mixed aerosols in a mode are based upon the CRI of that mixture, calculated as the volume-weighted CRI of the aerosol species as well as water (Ghan and Zaveri, 2007).
In this study, we calculate dust optical properties using the dataset of CRI in the SW spectrum from Di Biagio et al. (2019). This dataset contains the real (scattering) and imaginary (absorption) refractive indices in the SW bands (300–1100 nm) from multiple dust samples collected across the globe. We take the mean CRIs (see Table 4 in Di Biagio et al., 2019) to replace the existing CAM6 dust CRIs, which are originally based on the Optical Properties of Aerosols and Clouds package (OPAC; Hess et al., 1998) and the Aerosol Robotic Network (AERONET; Dubovik et al., 2000) retrieved optical properties for the SW bands, while holding the LW CRIs unchanged (i.e., still CAM6 dust optics), since previous studies found that ESM-prescribed and AERONET optical properties are generally too absorbing (e.g., Di Biagio et al., 2019; Adebiyi et al., 2023). The CAM6 and Di Biagio CRIs are summarized in Table S2 in the Supplement. Both have a similar real refractive index (n = 1.56 for CAM6 and n = 1.52 for Di Biagio for the whole visible band), but the imaginary part (k) is smaller in the Di Biagio optics than in CAM6 (e.g., for 300 nm, k = −0.0052 for CAM6 and k = −0.0026 for Di Biagio), implying that the Di Biagio optics will yield less absorption and thus less warming by dust aerosols. We will use the Di Biagio optics for simulations and results in Sect. 5.
Atmospheric dust simulations are usually tuned to match an observational constraint, such as the global mean DAOD, since there are no a priori physical principles that confine the order of magnitude of the simulated dust budget from the dust emission schemes (Leung et al., 2024). Process-based dust emission schemes can thus only simulate the spatiotemporal dust variability and then multiply the emissions by a global tuning factor to scale the emissions to a global magnitude consistent with satellite and ground-based observations. In this study, we scale our simulations to have global mean DAOD values averaged across 1981–2000 of 0.03 ± 0.01 (95 % confidence interval), consistent with current global constraints used by CMIP6 ESMs and other previous studies (e.g., Ito et al., 2021; Klose et al., 2021; Li et al., 2022; Zhao et al., 2022).
4.1 Dust PM concentration records over Barbados and Miami from the 1960s to 2000s
We use different datasets to evaluate the derived DustCOMM emissions in this study. Apart from the deposition fluxes from the core records, there are two long-term measurements of dust mass concentrations for Miami (Zuidema et al., 2019) and Barbados (Prospero et al., 2021) from the 1960s to the 2000s, which we use to evaluate the CESM dust PM simulations using the DustCOMM emissions for part of the covered time period. Aerosol samples were collected daily over both sites with high-volume filter samplers. The contribution from local sources was minimized by only sampling when there were easterly winds of > 1 m s−1 from the ocean.
4.2 CMIP6 dust data for evaluation
We also compare our dust simulations with those from multiple ESMs within the Coupled Model Intercomparison Project phase 6 (CMIP6) experiments (https://esgf-node.llnl.gov/search/cmip6/, last access: 3 December 2023; see Table S1 in the Supplement for model information). We have included both the historical runs and the amip-hist runs from the CMIP6 experiment. In CMIP6, “historical” refers to runs with active atmosphere–ocean coupling, while “amip-hist” refers to runs with inactive ocean components forced with HadISST. Note that not all CMIP6 models provided the same dust cycle variables, which means that the figures in Sect. 5 that evaluate different dust variables show different models for each comparison. Most ESMs provided DAOD fields, but only a few models provided dust PM or dust deposition fields.
5.1 Simulated dust emission and DAOD using L23 and DustCOMM emissions in CESM2
We first compare how the simulated dust cycle evolves with time in CESM2. Figure 3 shows the simulated dust emissions and DAOD in the CESM–L23 and CESM2–DustCOMM runs averaged across 1981–2000 and their changes over the historical period (1981–2000 minus 1851–1870). The dust maps for the 1851–1870 periods are also shown in Fig. S1. CESM2–L23 dust emissions show a realistic global emission pattern mostly focused on Africa, the Middle East, Asia, Australia, and the Americas (Fig. 3a). In L23, total emissions changed little over the historical period (Fig. 3b), hovering around a global emission rate of ∼ 1800 Tg yr−1, although there are some regional changes in emissions. DAOD also remained almost the same, staying at a global mean of ∼ 0.028 (Fig. 3c). Figure 3d shows the change in DAOD, indicating a slight decrease in Asia and a small increase in the Sahara. The simulated historic dust cycle trends in CESM2–L23 are small, possibly because of the insignificant historical trends of the simulated meteorological drivers (e.g., wind speed, soil moisture, and leaf area index) or the insufficient simulated dust sensitivity to these drivers, as suggested by Kok et al. (2014, 2018). This insignificant change in the simulated dust cycle is consistent with previous studies (e.g., Mahowald et al., 2010; Kok et al., 2023) showing that current ESM dust simulations are generally unable to capture the long-term increase in dust that is evident from sedimentary records of dust deposition (Fig. 4).
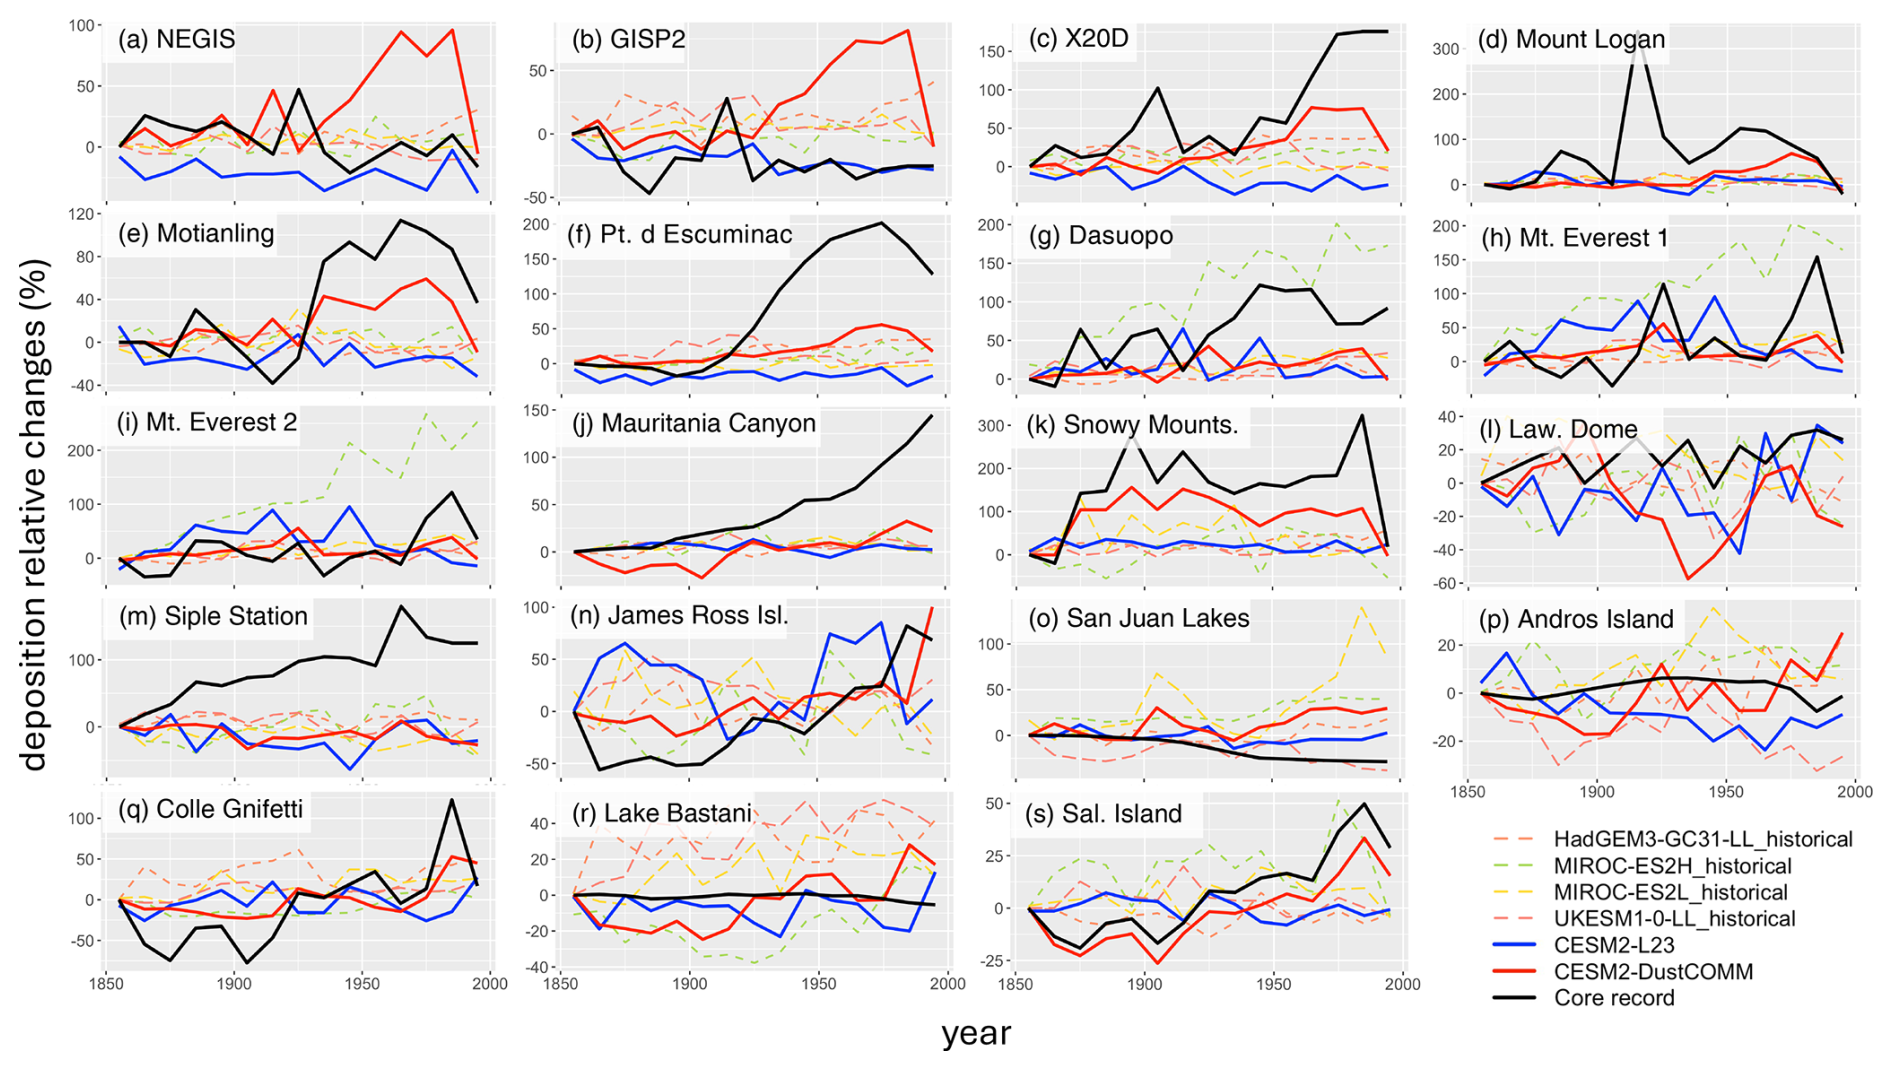
Figure 4Comparisons between ESM simulations and measured deposition flux time series from sedimentary cores. The panel letters correspond to the letters of the 19 individual sedimentary site locations as shown in Fig. 1. The black lines show the deposition flux time series, the blue lines show our CESM2 run using a mechanistic dust emission scheme (Leung et al., 2023; CESM2–L23), and the red lines show our CESM2 run forced by the new DustCOMM emission inventory (CESM2–DustCOMM). Dashed colored lines show the CMIP6-ESM-simulated dust deposition fluxes. For ESM deposition fluxes, we perform the comparison using the deposition time series from the grids that contain the core site locations.
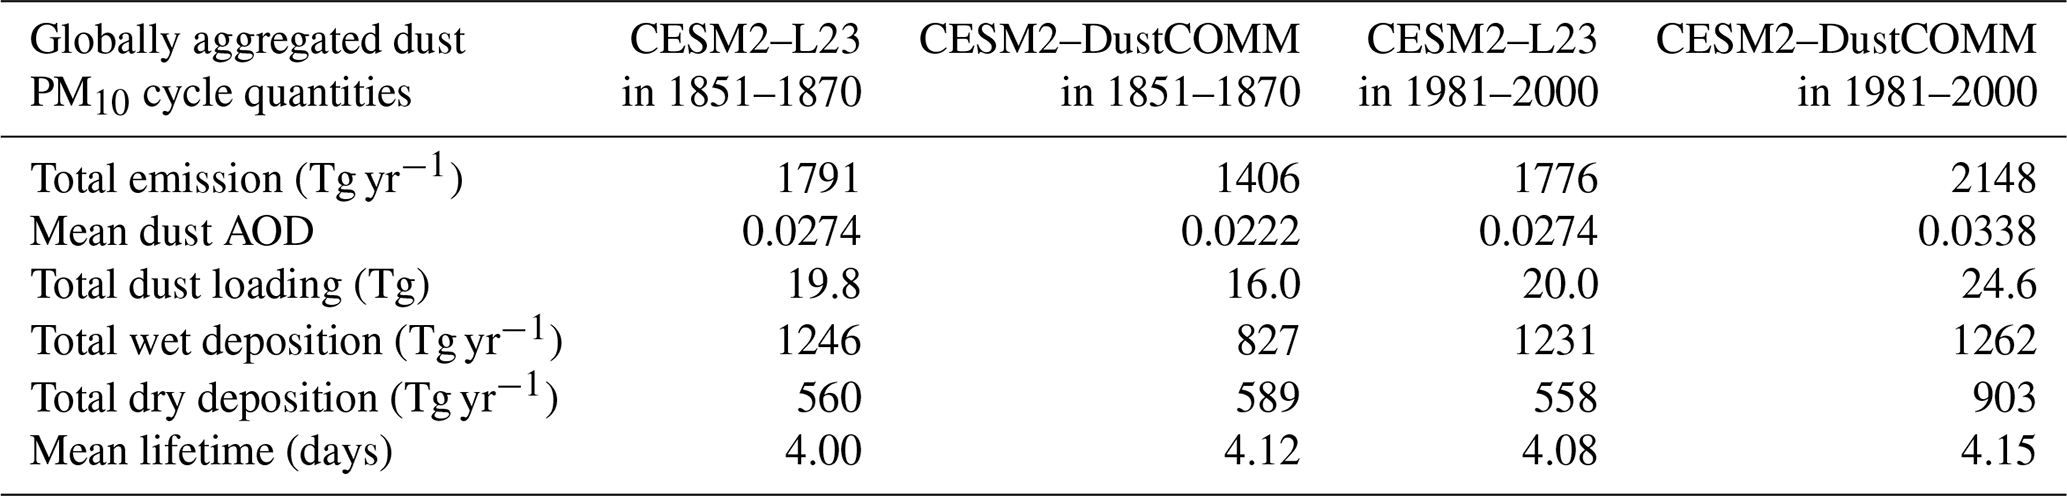
For the CESM2–DustCOMM run (Fig. 3e–h), Fig. 3e shows the dust emissions averaged over 1981–2000, which is essentially identical to the DustCOMM emissions read in by CLM5. The largest emissions occur over China and the Middle East (∼ 1 kg m−2 yr−1 or more), whereas some parts of the Sahel have relatively low emissions (∼ 0.1 kg m−2 yr−1 or less). Overall, there are fewer emissions from semiarid regions than the L23 emissions. The 1981–2000 mean DAOD (Fig. 3g) also shows that areas with the highest DAOD are the Taklamakan Desert in China, the Rub' al Khali Desert over the Arabian Peninsula, and the western Sahara. The emissions increased ∼ 50 % globally relative to the 1851–1870 period (see Fig. S1), yielding a global total of 2140 Tg yr−1. Emissions increased over most of the globe (Fig. 3f), but the most significant increase in magnitude is over the Arabian Peninsula. Global DAOD (Fig. 3h) also increased by ∼ 52 % from 0.022 (Fig. S1d) in 1851–1870 to 0.034 in 1981–2000 (Fig. 3h). We thus successfully generated ∼ 50 % more dust in CESM2 throughout the historical period using the DustCOMM emissions. We summarize the dust budgets of different dust cycle variables for both the CESM2–L23 and the CESM2–DustCOMM runs (averaged across 1851–1870 and 1981–2000, respectively) in Table 1.
Table 1Simulated dust cycle budgets for the CESM2–L23 run and the CESM2–DustCOMM run in the preindustrial era (1851–1870) and contemporary times (1981–2000). Fluxes are rounded to the nearest integers, while other quantities are rounded to three significant figures.
5.2 Model–observation comparison of dust deposition flux
Next, we examine our simulated CESM2 dust cycle as well as those from the CMIP6 dust simulations to assess whether ESM simulations capture the historical interdecadal dust variability as exhibited in the sedimentary records. To do this, we extract the 1851–2000 dust deposition fluxes over the 19 grid cells containing the core sites from all ESM simulations, including the CESM2–L23 run, the CESM2–DustCOMM run, and several CMIP6 ESMs that reported dust deposition fluxes as an output. To focus on the variability instead of the magnitude, we take the decadal median values from the annual mean deposition time series and normalize all median time series by their respective values for the period 1851–1860. All time series in Fig. 4 thus have a value of zero during the 1850s. Table S3 summarizes the temporal correlation coefficients of deposition fluxes between the core records and our two CESM2 runs for 1851–2000 over the 19 site locations.
We first discuss the historical temporal variability of the measured dust deposition fluxes (black lines) in Fig. 4. Most observed deposition fluxes (black lines) exhibit a rising trend (e.g., in Fig. 4e–j), with many showing increases of more than 100 % across 1850–2000 (e.g., Fig. 4c–f). Some observed deposition flux time series exhibit strong interdecadal variability but no secular trends (Fig. 4a–b, l). Those locations are typically near the margins of control between several sources, as shown by the color contours in Fig. 1. For instance, NEGIS and GISP2 (Fig. 4a–b) are located near the margins of control between North America, North Africa, and East Asia (see Fig. 1), and their interdecadal variability might have been jointly or alternately controlled by the three sources across time. Meanwhile, some deposition fluxes exhibit different variability despite being dominated by the same source region or even being adjacent to each other (e.g., the Lake Bastani deposition flux in Fig. 4r shows little variability, while the Colle Gnifetti time series in Fig. 4q shows a strong trend). This indicates that deposition fluxes are affected by large experimental errors (e.g., Avila et al., 1997) and/or have large spatial variability on the length scale of a model grid box, inducing representation errors when used to inform climate model simulations (Schutgens et al., 2017).
We then examine how well different ESMs can reproduce the interdecadal variability of the measured dust deposition fluxes. In Fig. 4, the CESM2–L23 run (blue solid lines) and the historical CMIP6 runs (colored dashed lines), which use mechanistic emission schemes, generally cannot replicate the dust trend over most of the sites. Our CESM2–L23 run shows distinct dust variability from the CESM2–DustCOMM run (red solid lines) despite using the same land and atmosphere model configurations. CMIP6 simulations also mostly have insignificant correlations with the observed deposition fluxes. This shows that ESMs cannot dynamically simulate the historically strengthening dust cycle.
The CESM2–DustCOMM run generally replicates the decadal deposition variability best out of all ESM simulations in Fig. 4, showing increasing deposition fluxes at most cores. However, not all simulated deposition fluxes match the measured deposition time series well. Although the measured dust increases are matched well over some sites (e.g., Fig. 4n and s) that are typically closer to the defined source regions, the increasing rates are underestimated over sites (e.g., Fig. 4c, e, f, j) further away from the sources, likely because different core sites contain different dust trends although they are dominated by the same source. Thus, each source's optimized interdecadal dust emission (and hence dust deposition) trend will be intermediate between those of the relevant sites, resulting in a relatively more benign dust trend than sites with stronger rising trends. Furthermore, ESMs all have different values than the DustCOMM-derived , likely augmenting the discrepancies. Overall, for sites that give clear increasing deposition trends (Fig. 4c, j, q, and s), the CESM2–DustCOMM run yields high correlations (r = 0.7–0.9) with the observed deposition fluxes. For certain sites without long-term trends but with substantial interdecadal variability (Fig. 4h–i, k), the CESM2–DustCOMM run also successfully captures their variability, although sometimes the magnitude could be less pronounced (e.g., Snowy Mountain in Fig. 4k).
The CESM2–DustCOMM run does fail to capture the measured deposition variability at some sites (e.g., Fig. 4a–b, d, l), which are usually co-determined by two or more source regions (Fig. 1) such that ESMs might not be able to simulate the same fi,j as reality. In addition, these marginal sites may contain some dust from high-latitude sources (Bory et al., 2003; Groot Zwaaftink et al., 2016), which is not accounted for by the prescribed emissions. For example, observed dust in NEGIS and GISP2 (Fig. 4a–b) in Greenland exhibit only pronounced interdecadal variability, which differs from the increasing trend predicted by the CESM2–DustCOMM run.
The CESM2–DustCOMM run also could not match the observed deposition flux from sites with little or no variability (e.g., Fig. 4o, p, r), although these sites are well within the source regions. For instance, Andros Island (Fig. 4p) and Lake Bastani (Fig. 4r) show different dust variability from other neighboring sites affected by North African dust, which is surprising since Lake Bastani is adjacent to Colle Gnifetti (Fig. 4q) with strong dust variability. Also, dust at San Juan Lakes (Fig. 4o) unexpectedly exhibits little influence from the Dust Bowl during the 1930s. Since sites with little observed deposition variability have smaller influences on the inversion process, the derived emissions can hardly replicate the observed dust variability over those sites, resulting in the correlations between simulated and measured dust ranging from −0.2 to −0.5.
We summarize the correlations between simulated and measured deposition fluxes over the 19 sites in Fig. 5 and Table S3 as box plots. The CESM2–DustCOMM run yields a median correlation of 0.55, which is substantially higher than that of other simulations. The CESM2–L23 run and other ESM simulations have averaged correlations close to zero, although the CMIP6 multimodel ensemble run (median 0.18) performs better than the individual CMIP6 ESMs. Figure 5 shows that model simulations have large ranges in the correlation coefficients, meaning that a simulation could replicate interdecadal dust variability well over certain locations but not others. This is possibly because (1) certain site locations contain dust from several source regions, (2) CESM's sensitivity fi,j could change over time and be different from DustCOMM's (from Kok et al., 2021a, b), and (3) there are large representation errors for comparing grid-box-level ESM-simulated dust deposition fluxes against site-level dust depositions from core sites (Brasseur and Jacob, 2017). However, the CESM2–DustCOMM run clearly agrees best with measured dust deposition time series.
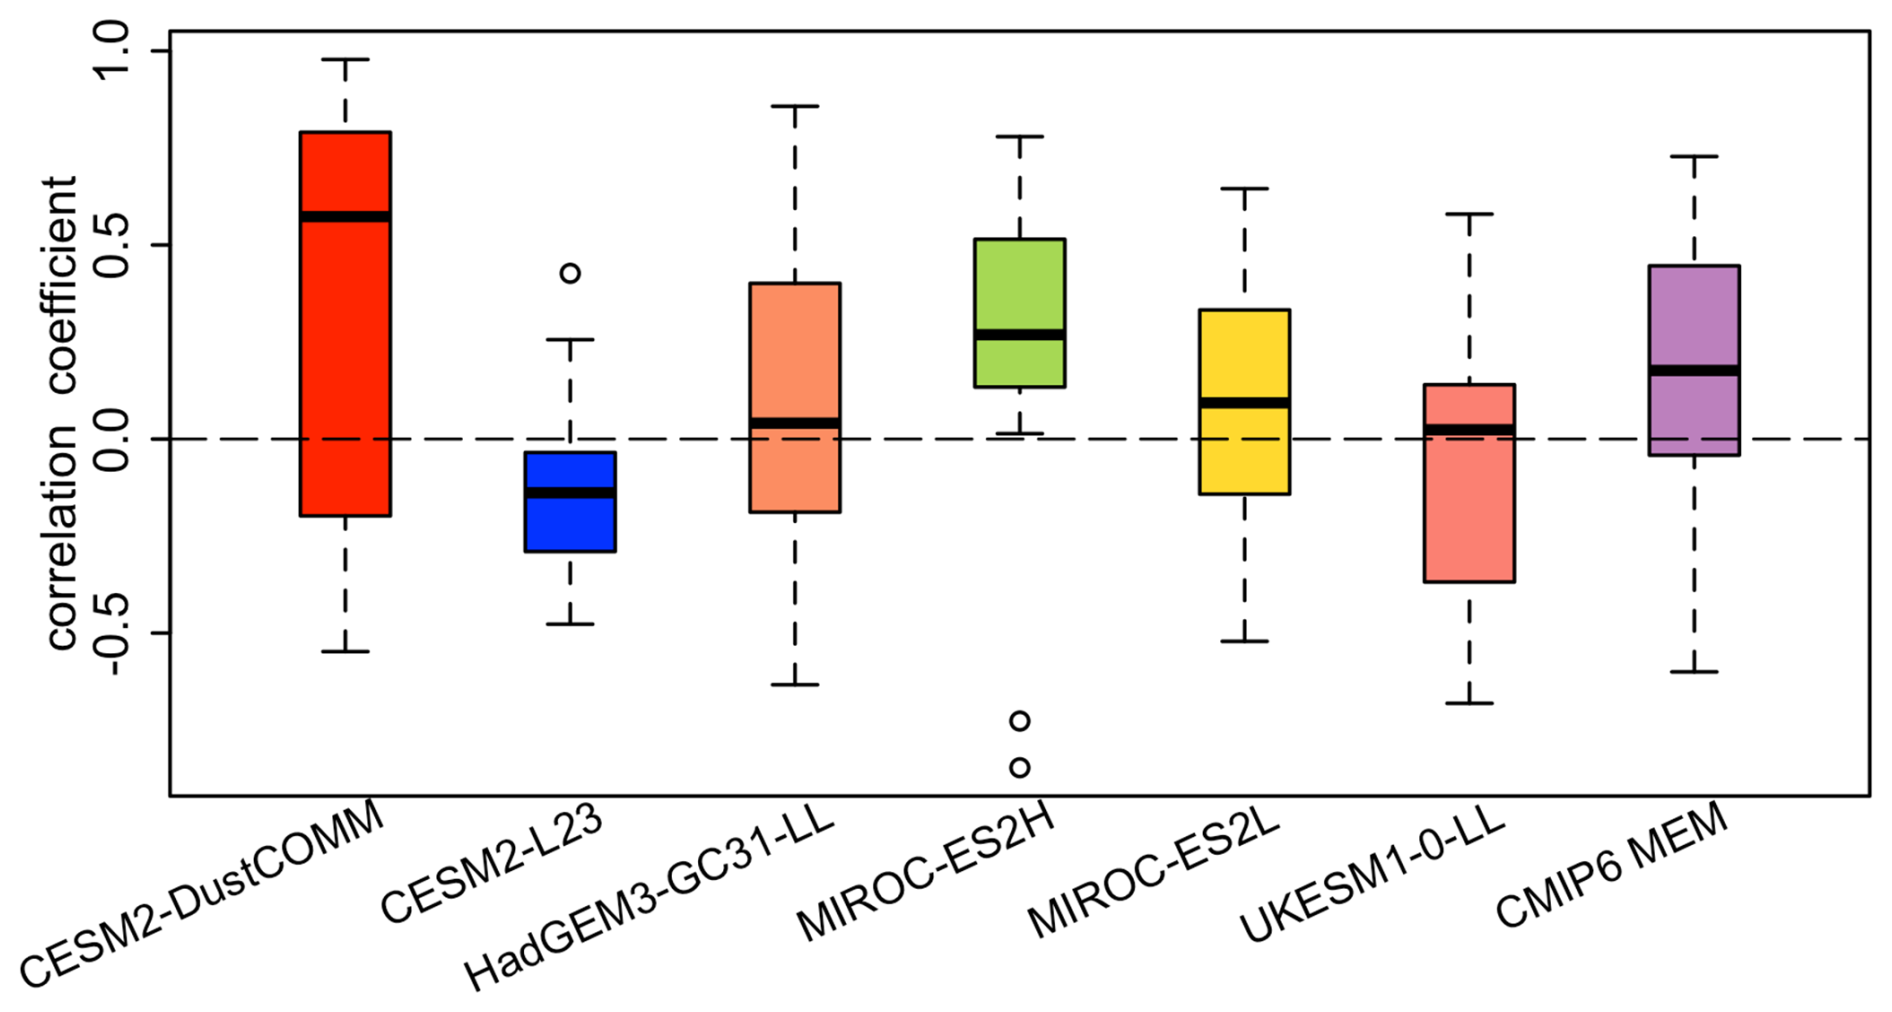
Figure 5A box-plot summary of the correlations between the measured deposition flux time series and the deposition flux time series simulated by our runs and the CMIP6 historical runs. The box plot for each model summarizes the 19 correlation coefficients between the core records of measured dust depositions (black lines) and the ESM-modeled dust depositions (colored lines) in Fig. 4, depicting the medium, interquartile range, and range of the 19 correlation coefficients. The CMIP6 multimodel ensemble (MME) gives the mean of the four CMIP6 models that provided dust deposition fields.
5.3 Model–observation comparison of dust PM concentration
In another evaluation of the DustCOMM emission dataset, we compare in Fig. 6 the decadal variability of the simulated surface dust PM concentrations (µg m−3) against long-term measurements of dust concentration at the Miami and Barbados sites (Zuidema et al., 2019; Prospero et al., 2021; see Sect. 4.2). For comparison of these records against ESM simulations, we use the simulated dust concentration at the grid boxes that contain the site location. Because we again focus on the interdecadal variability, we assess measured and modeled relative changes in decadally averaged values.
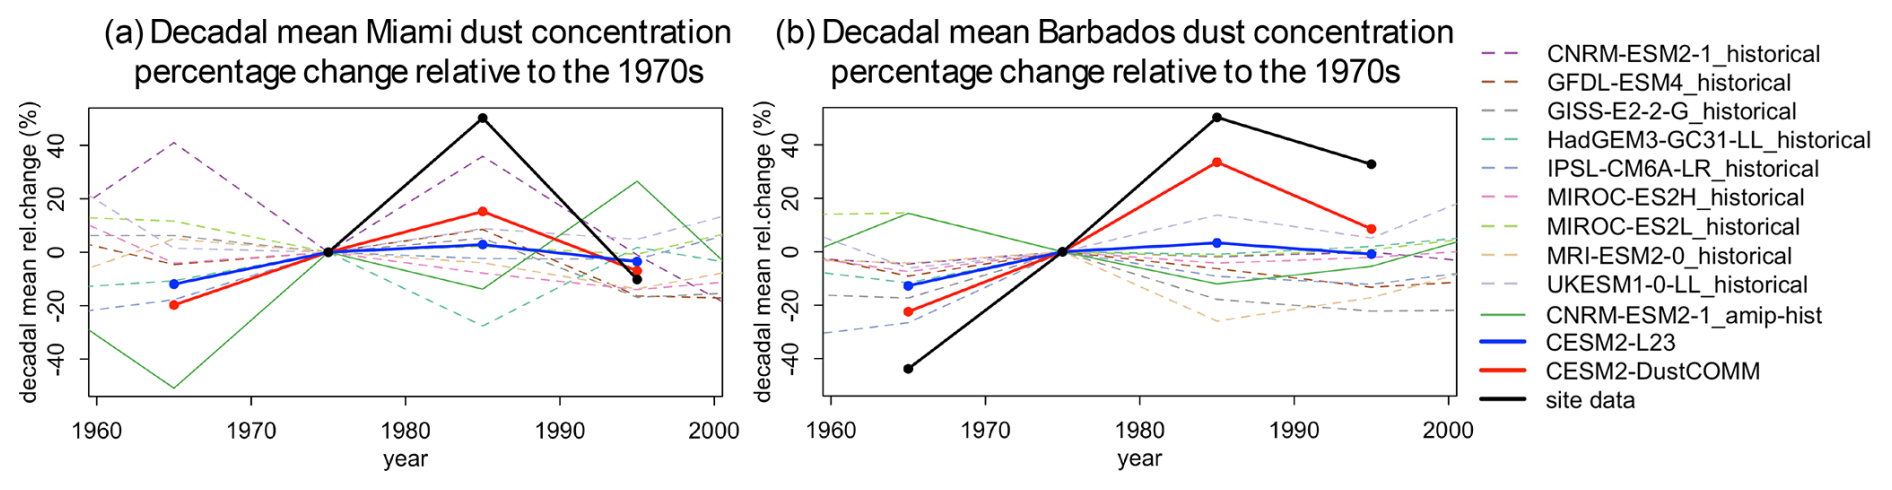
Figure 6Measured and simulated dust PM concentrations over (a) Miami and (b) Barbados. The thick black lines show the measured dust concentrations over the two locations (Zuidema et al., 2019; Prospero et al., 2021), and the thick blue and red lines show our CESM2 simulations. The thin dashed lines are fully coupled historical simulations performed by CMIP6 ESMs. The thin solid lines show amip-hist ESM simulations with prescribed historical SST. All time series are normalized by dividing their values by their 1971–1980 mean values.
The dust concentration time series at the Miami site (Fig. 6a) and the Barbados site (Fig. 6b) show that dust concentrations (black lines) peaked during the 1981–1990 decade, consistent with the 1980s dust peak shown by the dust reconstruction in K23 (see the black line in Fig. 7). However, the CESM2–L23 concentration time series (blue lines) shows little decadal variability. Similarly, both the CMIP6 coupled historical runs and amip-hist runs are unable to reproduce the variability of long-term dust concentration measurements. This shows that the current generation of ESMs that employ mechanistic dust emission schemes cannot simulate the historical interdecadal variability of dust. In contrast, the CESM2–DustCOMM dust concentration (red lines) increased from the 1960s to the 1980s, peaked in the 1980s, and dropped during the 1990s, showing more consistency with the measurements. Figure 6 thus further indicates that ESMs using the DustCOMM emissions can better simulate the temporal dust variability than using mechanistic emission schemes.
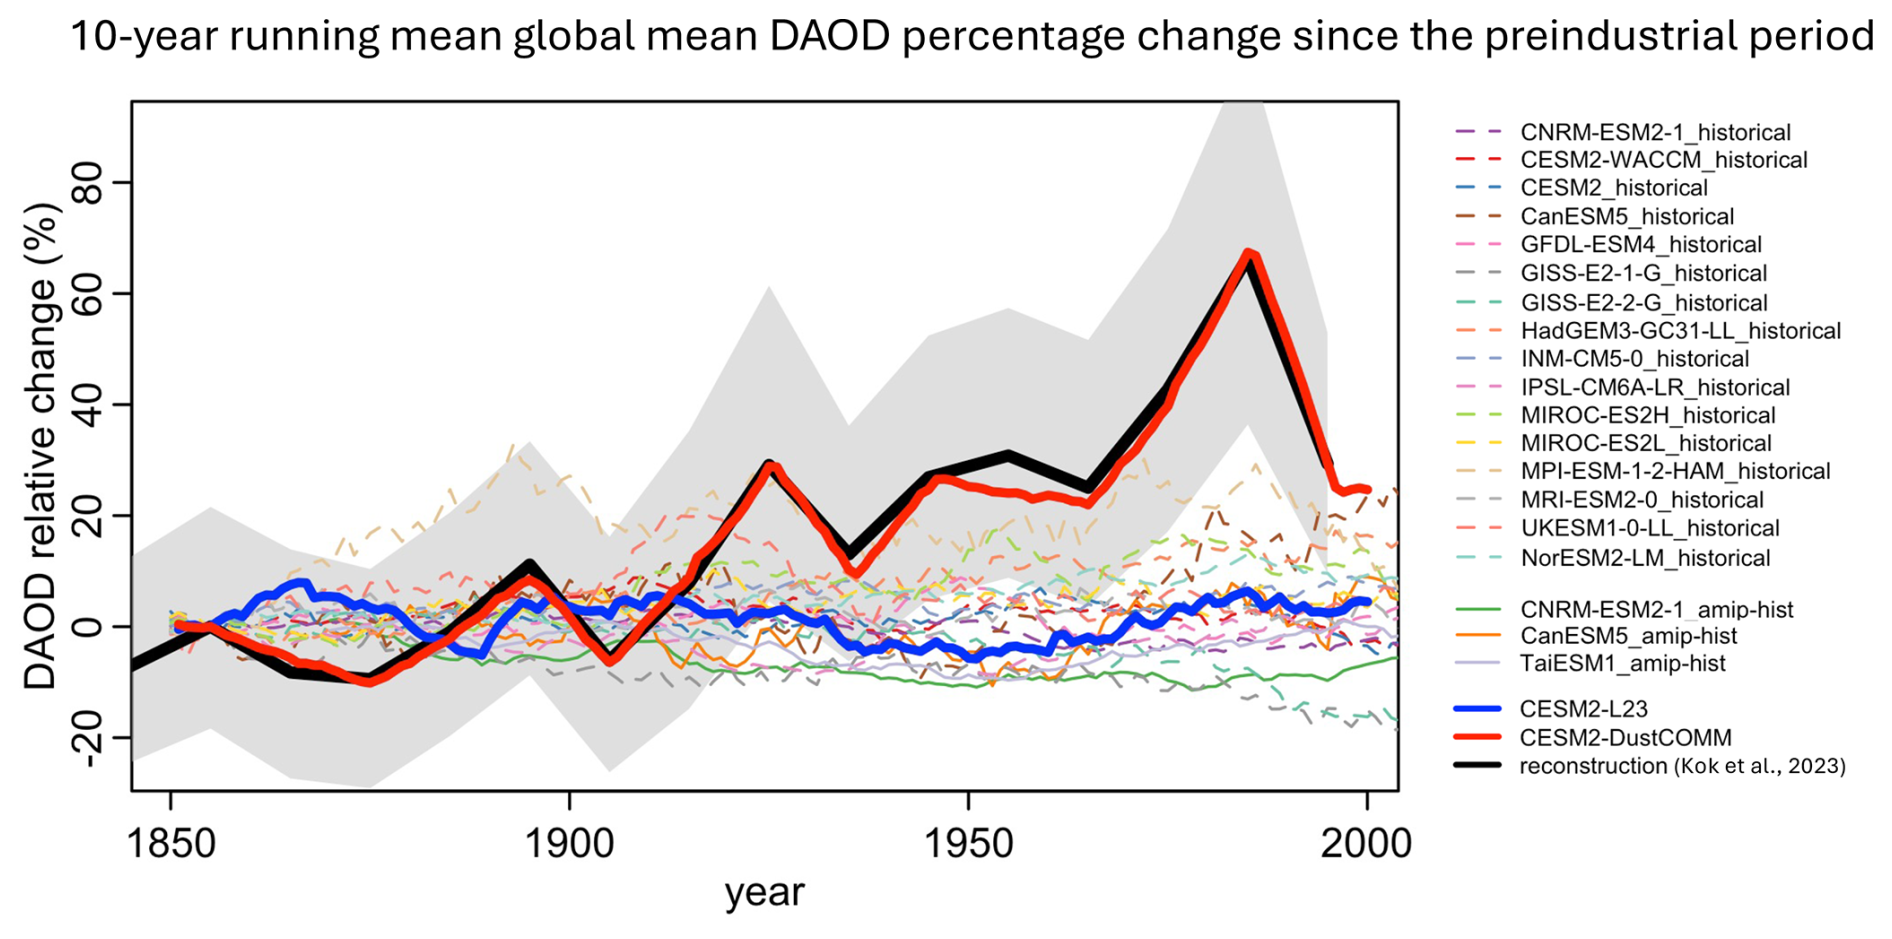
Figure 7Changes in global dust aerosol optical depth (DAOD) relative to the 1850s and 1870s. The thick solid blue and red lines show our CESM2 simulations using the Leung et al. (2023; L23) emission scheme and using the derived DustCOMM emission dataset, respectively. The thin dashed and solid lines show the CMIP6 fully coupled historical run and amip-hist runs using simulated and reconstructed historical SSTs, respectively. All the model time series are the 10-year running means from the original annual time series. The time series from the CMIP6 historical runs and our CESM runs are centered at their 1850s mean values; the DAOD time series from the amip-hist runs are centered at their 1870s means since amip-hist runs start from 1870. The solid black line shows the reconstructed DAOD time series centered at its 1850s value, and the gray shading denotes the 1 standard error (68 % confidence) range of the reconstruction.
5.4 Model–observation comparison of global DAOD
Finally, we examine the historical evolution of simulated DAOD in Fig. 7. Here we compute the 10-year running mean for all dust time series. Furthermore, we focus on the variability of dust instead of its absolute magnitude, since the global mean of dust could always be tuned and rescaled with a global tuning factor to match the observed dust budgets (Zender et al., 2003; Mahowald et al., 2010; Li et al., 2021a; Leung et al., 2023). We subtract the DAOD time series by their own decadal 1851–1860 averages, then divide the time series by the same reference values. Figure 7 shows the relative changes of the 10-year running mean DAOD for our simulations and the CMIP6 simulations. The dashed lines show the CMIP6 models with historical simulations, whereas the solid lines show ESMs driven by the prescribed SST. Most CMIP6 models show moderate interdecadal variability, but there are no significant increasing dust trends for historical or amip-hist runs, meaning that the observed dust trends cannot be reproduced with current models using either simulated or reconstructed historical SSTs. The CESM2–L23 dust time series (solid blue) also has no significant increasing trend and only contains modest interdecadal variability. Only the CESM2–DustCOMM run generates a historical increasing dust trend highly consistent with the sedimentary records. This is reasonable since both the dust reconstruction from Kok et al. (2023) and our analysis made use of the same sedimentary records of βj and from the same model ensemble (Sect. 2.1). The main difference is that we expanded Kok's inverse analysis to the regional level to obtain λi. The decadal variability in the CESM2–DustCOMM time series is consistent with that in the dust reconstruction, with a ∼ 50 % increase in dust from 1851–1870 to 1981–2000, peaking in the 1980s. Using the prescribed emission dataset is thus likely more accurate for simulating the historical RFs of dust than using mechanistic emission schemes, provided that the spatial variability and microphysics (size distribution and optical properties) of dust are sufficiently accurate in ESMs.
The above results show that ESMs using the derived historical emissions can produce dust cycle simulations that are more consistent with trends shown in sedimentary records of dust deposition. We then use CESM2 to simulate the radiative effects and forcings of dust. Figure 8 shows the simulated DREs and DRFs of dust PM10 at the top of atmosphere (TOA) for the two runs. We first discuss the simulated DREs at TOA for the CESM2–L23 run, in which dust remained approximately constant over time (Fig. 7). The 1851–1870 dust DRE (Fig. 8a) is large over areas where the DAOD is high (in Fig. S1b), as expected. Most of the globe exhibits negative DRE values, primarily because of dust scattering SW radiation back to space. Dust also absorbs LW radiation, but the overall warming effect is relatively weak. The only areas with positive DRE values are the most prominent dust sources (e.g., the Bodélé Depression, El Djouf, and the Rub' al Khali Desert) as they already have very high land surface albedo for reflecting SW radiation, mitigating the SW cooling of dust aloft (e.g., Liao and Seinfeld, 1998). The late 20th century dust DRE (Fig. 8b) shows a very similar pattern as in the preindustrial period, as we would expect due to the lack of a clear dust emissions trends.
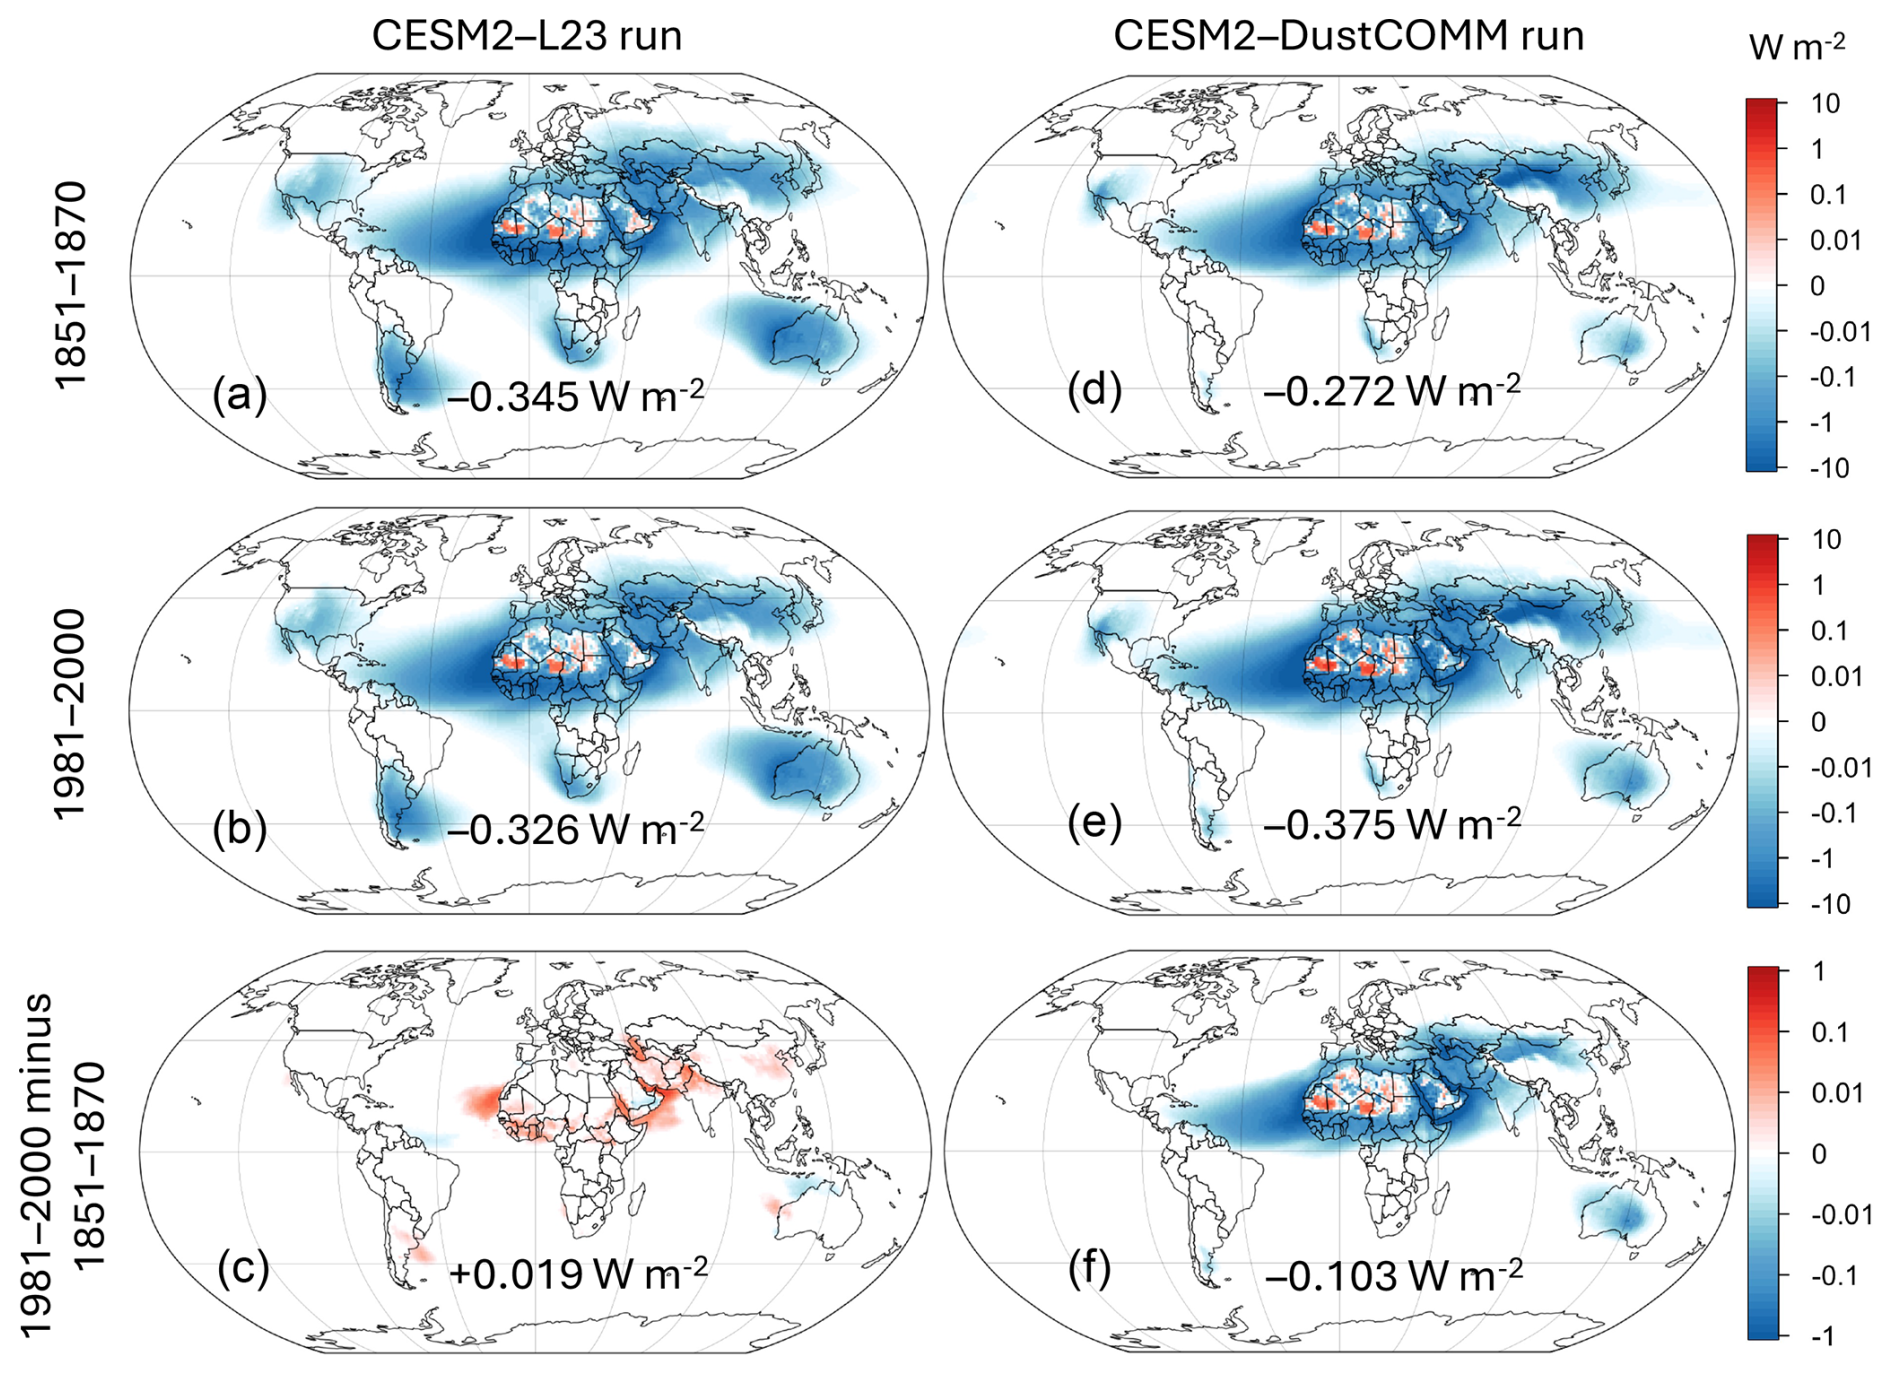
Figure 8Dust direct radiative effects (DREs) and forcings (DRFs) simulated using the Leung et al. (2023; L23) emission scheme (left columns) and the new DustCOMM emission dataset (right columns). (a–c) CESM-simulated dust DREs using the L23 emission scheme averaged across (a) 1851–1870 and (b) 1981–2000, as well as (c) the 1981–2000 DRE minus 1851–1870 DRE, which equals the dust DRF for the historical period. (d–f) As for panels (a–c) but for the CESM simulation using the DustCOMM emissions. The values on the maps indicate global means for radiation in W m−2.
For the CESM2–L23 run, dust in the mid-19th century produced an overall global cooling effect of ∼ −0.35 W m−2 when summing both the SW and the LW DREs. In the 1990s, the global mean dust DRE was −0.33 W m−2, slightly smaller than the global mean dust DRE for 1851–1870. This cooling effect is in agreement with other previous CESM studies using the original CAM dust optics (e.g., Ke et al., 2022; Li et al., 2021a) and overall consistent with other modeling studies (e.g., Tegen and Lacis, 1996; Sokolik and Toon, 1996; Mahowald et al., 2010; Kok et al., 2023). The number is more negative than the −0.15 ± 0.35 W m−2 estimated by Kok et al. (2023) for the present-day dust DRE, likely because they accounted for super-coarse dust (which net warms; Adebiyi and Kok, 2020) and for the warming due to LW scattering. The small change in the DRE throughout 1851–2000 is also consistent with the small decrease in the simulated historical DAOD change in Fig. 3.
When dust emissions were prescribed (the CESM2–DustCOMM run), the magnitude of the dust DRE at TOA increased substantially across 1851–2000 (Fig. 8d–e). The DRE spatial distributions are overall similar to those of the L23 run. The dust cooling effect still dominates, giving a global mean DRE of −0.27 W m−2 for 1851–1870. Given the ∼ 55 % increase in the historical dust, the global DRE increases to −0.38 W m−2 for 1981–2000, giving a 41 % increase in cooling. The DRE does not necessarily need to also increase by 55 %, since DAOD increases over different geographical locations with different surface albedo values, causing warming and cooling across different regions. Furthermore, DRE is not directly proportional to AOD due to multiple scattering (e.g., Di Biagio et al., 2020). Figure S2 shows the SW and LW TOA radiative effects for the CESM2–DustCOMM run.
We finally discuss the simulated historical direct RF (Fig. 8c and f), which is equal to the 1981–2000 DRE minus 1851–1870 DRE for both runs. For the CESM2–L23 run (Fig. 8c), since the global DAOD slightly changed by < 1 % from 1851–1870 to 1981–2000 (Fig. 3), the dust DRF is also small (+0.019 W m−2). The spatial pattern of the dust DRF in Fig. 8c is consistent with that of the map of DAOD changes in Fig. 3d but opposite in sign. For the CESM2–DustCOMM run (Fig. 8f), its spatial pattern is very similar to its two DRE patterns (Fig. 7b and d). The global mean historical DRF is −0.103 W m−2, within the range of values predicted by previous studies. For instance, Mahowald et al. (2010) predicted a 1905–1999 historical dust DRF of −0.07 W m−2, Stanelle et al. (2014) predicted an 1885–2010 historical forcing of −0.14 W m−2 (clear-sky condition), and Kok et al. (2023) estimated an 1841–2000 DRF of −0.08 W m−2. Our value could be more accurate than previous work for PM10 dust since we use observationally based refractive indices from Di Biagio et al. (2019) and because the prescribed DustCOMM emissions could more accurately account for regional historical dust changes. We show the SW and LW.
Although we have successfully used the dust reconstruction to more realistically estimate the DRF due to the historical dust increase, this estimation is subject to several uncertainties and limitations. First, the estimated DRF is sensitive to the assumed emitted dust PSD, which is based on the brittle fragmentation theory in CESM2 (BFT; Kok, 2011; Li et al., 2022). Although BFT produces a dust PSD that is in good agreement with measurements for fine and coarse dust (Dve < 10 µm), CESM itself does not simulate super-coarse dust, limiting the realistic representation of the dust PSD in CESM2. Previous studies indicated that super-coarse dust accounts for 38 (±15 %) of total atmospheric dust mass (Kok et al., 2021a; Adebiyi et al., 2023). Because super-coarse dust tends to warm by absorbing SW radiation and both scattering and absorbing LW radiation (Adebiyi and Kok, 2020), neglecting super-coarse dust might overestimate dust radiative cooling by ∼ 0.05–0.10 W m−2 (Adebiyi et al., 2023). Thus, improving the emitted dust PSD in ESMs by including dust up to ∼ 50 µm in size is preferred for adequately representing the dust DRE and DRF. Second, although we used global dust refractive indices based on recent laboratory measurements (from Di Biagio et al., 2019), the amount of absorption, and thus warming, produced by dust in the SW spectrum is uncertain (Li et al., 2021a; Adebiyi et al., 2023). Moreover, dust CRI could change based on dust source region (Di Biagio et al., 2019), which indicates spatially varying optical properties of dust aerosols (e.g., Journet et al., 2014; Green et al., 2020; Li et al., 2021a). The use of spatially varying dust optics in ESMs, or optics as a function of mineral dust species, can thus further improve DRE and DRF predictions. Third, as mentioned above, the RRTMG in ESM simulations, including ours, does not include LW scattering by aerosols, which accounts for approximately half of the warming from dust interactions with LW radiation (Di Biagio et al., 2020; Dufresne et al., 2002). This could possibly be overcome by employing newer radiative transfer models in CESM2 in the future (e.g., RTE+RRTMGP; Pincus et al., 2019).
To better evaluate the historical dust RFs and climate impacts due to historical dust changes, we recently initiated a new dust modeling intercomparison project, namely “dust radiative forcing from reconstructed dust changes since preindustrial times” (DURF), as part of the AeroCom phase III experiments. Employing multiple ESMs, dust modelers will use the DustCOMMv1 emission dataset obtained here to estimate more realistic historical dust REs and RFs.
In this study, we have derived a gridded 1841–2000 dust emission dataset FEI (DustCOMM emissions v1) using an inverse analysis for driving historical dust cycle simulations in ESMs. We did so by combining 19 sedimentary records of dust depositions βj for 1841–2000 across the globe with reanalyzed model constraints on the present-day dust cycle to infer the changes in dust emissions for each of seven major source regions (Sect. 2). This DustCOMM emission dataset contains decadal variability of historical dust as inferred from the dust sedimentary records. It is important to note that the DustCOMM emissions required important assumptions to derive (see Sect. 2) and that they could be subject to systematic errors, and the deposition fluxes from core records also contain large uncertainties. Therefore, more dust deposition time series that resolve the preindustrial to modern time period are urgently needed to better constrain the historical evolution of the global dust cycle. We provided 100 realizations of the historical dust emissions to characterize the uncertainties of the DustCOMMv1 emissions. We further made three scenarios of future dust emissions for 2000–2100. Future versions of DustCOMM emissions will be developed mainly focusing on reducing uncertainties in both and βj, using satellite retrievals to improve 2000–2020 emissions, and using DustCOMM emissions to inform process-based dust model developments, such as a better representation of historical dust changes in ESMs and partitioning contributions from natural and anthropogenic dust sources.
To evaluate the derived DustCOMMv1 emissions, we used the derived emissions to drive an 1851–2000 historical dust cycle simulation in CESM2. The simulation results revealed that the simulated dust cycle captured the historical increasing dust trend. The simulated trends in dust deposition matched the sedimentary records moderately well, and the simulated dust PM concentrations were in reasonable agreement with long-term measurements of dust concentration over Miami and Barbados. In contrast, CESM2 and other ESMs employing process-based dust emission schemes showed little or no long-term increase in dust across 1851–2000. A modeling development study on enabling process-based models to capture the historical dust trend will be the topic of a future paper.
Here we showed that ESMs using our derived DustCOMM emissions as a forcing dataset can reproduce the observed historical dust increase and can thus better estimate the radiative forcing (RF) due to this dust increase. Because CMIP6 ESMs are unable to reproduce the observed historical dust trend, it could be greatly beneficial for ESMs to improve the simulated aerosol radiative forcings and the resulting climate impacts by (1) directly prescribing the DustCOMM emissions FEI in the simulations or (2) using the regional emission constraints λi to scale dust every decade. Indeed, prescribing DustCOMM emissions in CESM2 yielded a much more significant 1851–2000 dust direct RF of −0.10 W m−2 (cooling), primarily due to the scattering of shortwave radiation back to space, which is especially strong over the oceans. This value is consistent with the calculations in previous studies (e.g., Mahowald et al., 2010; Stanelle et al., 2014; Kok et al., 2023). These results suggest that historical dust changes have likely partially counteracted the historical global warming caused by the anthropogenic increase in greenhouse gases.
The DustCOMM emission v1 dataset, the ensemble members of the DustCOMMv1 emissions, and the processed sedimentary and ice core data on dust deposition fluxes are available at https://doi.org/10.5281/zenodo.14597684 (Leung et al., 2025).
The supplement related to this article is available online at https://doi.org/10.5194/acp-25-2311-2025-supplement.
JFK and DMLe conceptualized the study. DMLe performed the model development, conducted the simulations, analyzed the simulation results, and conducted the evaluations. DMLe wrote the original manuscript and plotted all figures under JFK's supervision. LL, ST, DMLa, NMM, and EK assisted with the conceptualization and model development. All authors contributed to the manuscript preparation, discussion, and writing.
At least one of the (co-)authors is a member of the editorial board of Atmospheric Chemistry and Physics. The peer-review process was guided by an independent editor, and the authors also have no other competing interests to declare.
Publisher's note: Copernicus Publications remains neutral with regard to jurisdictional claims made in the text, published maps, institutional affiliations, or any other geographical representation in this paper. While Copernicus Publications makes every effort to include appropriate place names, the final responsibility lies with the authors.
This material is based upon work supported by the NSF National Center for Atmospheric Research (NCAR), which is a major facility sponsored by the US National Science Foundation under cooperative agreement no. 1852977. Computing and data storage resources, including the Cheyenne supercomputer (https://doi.org/10.5065/D6RX99HX, Hart, 2021), were provided by the Computational and Information Systems Laboratory (CISL) at the NSF NCAR. Danny M. Leung thanks Charles G. Bardeen and Francis V. Fitt for the valuable discussions on the CESM2 radiation scheme. Figure 1 in this paper was plotted after Fig. 8a in Kok et al. (2021b), which was originally created by Ron L. Miller.
Danny M. Leung and Jasper F. Kok are funded by the National Science Foundation (NSF) Directorate for Geosciences under grants 1856389 and 2151093. Danny M. Leung completed this work while holding the NSF NCAR Advanced Study Program (ASP) Postdoctoral Fellowship. Longlei Li and Natalie M. Mahowald acknowledge support from the Department of Energy (DOE) under grant DE-SC0021302 and the Earth Surface Mineral Dust Source Investigation (EMIT), a NASA Earth Venture-Instrument (EVI-4) mission.
This research has been supported by the National Science Foundation's Directorate for Geosciences (grant nos. 1856389 and 2151093).
This paper was edited by Stephanie Fiedler and reviewed by Isidro Pérez and one anonymous referee.
Achakulwisut, P., Shen, L., and Mickley, L. J.: What Controls Springtime Fine Dust Variability in the Western United States? Investigating the 2002–2015 Increase in Fine Dust in the U.S. Southwest, J. Geophys. Res.-Atmos., 122, 12449–12467, https://doi.org/10.1002/2017JD027208, 2017.
Adebiyi, A., Kok, J. F., Murray, B. J., Ryder, C. L., Stuut, J.-B. W., Kahn, R. A., Knippertz, P., Formenti, P., Mahowald, N. M., Pérez García-Pando, C., Klose, M., Ansmann, A., Samset, B. H., Ito, A., Balkanski, Y., Di Biagio, C., Romanias, M. N., Huang, Y., and Meng, J.: A review of coarse mineral dust in the Earth system, Aeolian Res., 60, 100849, https://doi.org/10.1016/j.aeolia.2022.100849, 2023.
Adebiyi, A. A. and Kok, J. F.: Climate models miss most of the coarse dust in the atmosphere, Sci. Adv., 6, eaaz9507, https://doi.org/10.1126/sciadv.aaz9507, 2020.
Andreae, M. O., Jones, C. D., and Cox, P. M.: Strong present-day aerosol cooling implies a hot future, Nature, 435, 1187–1190, https://doi.org/10.1038/nature03671, 2005.
Avila, A., Queralt-Mitjans, I., and Alarcón, M.: Mineralogical composition of African dust delivered by red rains over northeastern Spain, J. Geophys. Res.-Atmos., 102, 21977–21996, https://doi.org/10.1029/97JD00485, 1997.
Bellouin, N., Quaas, J., Gryspeerdt, E., Kinne, S., Stier, P., Watson-Parris, D., Boucher, O., Carslaw, K. S., Christensen, M., Daniau, A.-L., Dufresne, J.-L., Feingold, G., Fiedler, S., Forster, P., Gettelman, A., Haywood, J. M., Lohmann, U., Malavelle, F., Mauritsen, T., McCoy, D. T., Myhre, G., Mülmenstädt, J., Neubauer, D., Possner, A., Rugenstein, M., Sato, Y., Schulz, M., Schwartz, S. E., Sourdeval, O., Storelvmo, T., Toll, V., Winker, D., and Stevens, B.: Bounding Global Aerosol Radiative Forcing of Climate Change, Rev. Geophys., 58, e2019RG000660, https://doi.org/10.1029/2019RG000660, 2020.
Bory, A. J.-M., Biscaye, P. E., Piotrowski, A. M., and Steffensen, J. P.: Regional variability of ice core dust composition and provenance in Greenland, Geochem. Geophy. Geosy., 4, https://doi.org/10.1029/2003GC000627, 2003.
Boucher, O., Randall, D., Artaxo, P., Bretherton, C., Feingold, G., Forster, P., Kerminen, V., Kondo, Y., Liao, H., and Lohmann, U.: Climate change 2013: the physical science basis. Contribution of Working Group I to the Fifth Assessment Report of the Intergovernmental Panel on Climate Change, edited by: Stocker, T. F., Qin, D., Plattner, G.-K., Tignor, M., Allen, S. K., Boschung, J., Nauels, A., Xia, Y., Bex, V., and Midgley, P. M., Cambridge University Press, Cambridge, UK, https://doi.org/10.1017/CBO9781107415324, 2013.
Brasseur, G. P. and Jacob, D. J.: Modeling of Atmospheric Chemistry, Cambridge University Press, Cambridge, https://doi.org/10.1017/9781316544754, 2017.
Bullard, J. E., Baddock, M., Bradwell, T., Crusius, J., Darlington, E., Gaiero, D., Gassó, S., Gisladottir, G., Hodgkins, R., McCulloch, R., McKenna-Neuman, C., Mockford, T., Stewart, H., and Thorsteinsson, T.: High-latitude dust in the Earth system, Rev. Geophys., 54, 447–485, https://doi.org/10.1002/2016RG000518, 2016.
Cakmur, R. V., Miller, R. L., Perlwitz, J., Geogdzhayev, I. V., Ginoux, P., Koch, D., Kohfeld, K. E., Tegen, I., and Zender, C. S.: Constraining the magnitude of the global dust cycle by minimizing the difference between a model and observations, J. Geophys. Res.-Atmos., 111, https://doi.org/10.1029/2005JD005791, 2006.
Chernick, M. R.: Bootstrap Methods: A Guide for Practitioners and Researchers, John Wiley & Sons, ISBN 9781118211595, 1118211596, 2007.
Clifford, H. M., Spaulding, N. E., Kurbatov, A. V., More, A., Korotkikh, E. V., Sneed, S. B., Handley, M., Maasch, K. A., Loveluck, C. P., Chaplin, J., McCormick, M., and Mayewski, P. A.: A 2000 Year Saharan Dust Event Proxy Record from an Ice Core in the European Alps, J. Geophys. Res.-Atmos., 124, 12882–12900, https://doi.org/10.1029/2019JD030725, 2019.
Cook, B. I., Mankin, J. S., Marvel, K., Williams, A. P., Smerdon, J. E., and Anchukaitis, K. J.: Twenty-First Century Drought Projections in the CMIP6 Forcing Scenarios, Earths Future, 8, e2019EF001461, https://doi.org/10.1029/2019EF001461, 2020.
Danabasoglu, G., Lamarque, J.-F., Bacmeister, J., Bailey, D. A., DuVivier, A. K., Edwards, J., Emmons, L. K., Fasullo, J., Garcia, R., Gettelman, A., Hannay, C., Holland, M. M., Large, W. G., Lauritzen, P. H., Lawrence, D. M., Lenaerts, J. T. M., Lindsay, K., Lipscomb, W. H., Mills, M. J., Neale, R., Oleson, K. W., Otto-Bliesner, B., Phillips, A. S., Sacks, W., Tilmes, S., van Kampenhout, L., Vertenstein, M., Bertini, A., Dennis, J., Deser, C., Fischer, C., Fox-Kemper, B., Kay, J. E., Kinnison, D., Kushner, P. J., Larson, V. E., Long, M. C., Mickelson, S., Moore, J. K., Nienhouse, E., Polvani, L., Rasch, P. J., and Strand, W. G.: The Community Earth System Model Version 2 (CESM2), J. Adv. Model. Earth Sy., 12, e2019MS001916, https://doi.org/10.1029/2019MS001916, 2020.
Di Biagio, C., Formenti, P., Balkanski, Y., Caponi, L., Cazaunau, M., Pangui, E., Journet, E., Nowak, S., Andreae, M. O., Kandler, K., Saeed, T., Piketh, S., Seibert, D., Williams, E., and Doussin, J.-F.: Complex refractive indices and single-scattering albedo of global dust aerosols in the shortwave spectrum and relationship to size and iron content, Atmos. Chem. Phys., 19, 15503–15531, https://doi.org/10.5194/acp-19-15503-2019, 2019.
Di Biagio, C., Balkanski, Y., Albani, S., Boucher, O., and Formenti, P.: Direct Radiative Effect by Mineral Dust Aerosols Constrained by New Microphysical and Spectral Optical Data, Geophys. Res. Lett., 47, e2019GL086186, https://doi.org/10.1029/2019GL086186, 2020.
Dubovik, O., Smirnov, A., Holben, B. N., King, M. D., Kaufman, Y. J., Eck, T. F., and Slutsker, I.: Accuracy assessments of aerosol optical properties retrieved from Aerosol Robotic Network (AERONET) Sun and sky radiance measurements, J. Geophys. Res.-Atmos., 105, 9791–9806, https://doi.org/10.1029/2000JD900040, 2000.
Dufresne, J.-L., Gautier, C., Ricchiazzi, P., and Fouquart, Y.: Longwave Scattering Effects of Mineral Aerosols, J. Atmos. Sci., 59, 1959–1966, https://doi.org/10.1175/1520-0469(2002)059<1959:LSEOMA>2.0.CO;2, 2002.
Efron, B.: The jackknife, the bootstrap, and other resampling plans, Society for Industrial and Applied Mathematics (SIAM), Philadelphia, Pa., 1 online resource, vii, 92 pp., https://doi.org/10.1137/1.9781611970319, 1982.
Emmons, L. K., Schwantes, R. H., Orlando, J. J., Tyndall, G., Kinnison, D., Lamarque, J.-F., Marsh, D., Mills, M. J., Tilmes, S., Bardeen, C., Buchholz, R. R., Conley, A., Gettelman, A., Garcia, R., Simpson, I., Blake, D. R., Meinardi, S., and Pétron, G.: The Chemistry Mechanism in the Community Earth System Model Version 2 (CESM2), J. Adv. Model. Earth Sy., 12, e2019MS001882, https://doi.org/10.1029/2019MS001882, 2020.
Evan, A. T.: Surface Winds and Dust Biases in Climate Models, Geophys. Res. Lett., 45, 1079–1085, https://doi.org/10.1002/2017GL076353, 2018.
Ferrenberg, S., Reed, S. C., and Belnap, J.: Climate change and physical disturbance cause similar community shifts in biological soil crusts, P. Natl. Acad. Sci. USA, 112, 12116–12121, https://doi.org/10.1073/pnas.1509150112, 2015.
Gettelman, A., Morrison, H., Eidhammer, T., Thayer-Calder, K., Sun, J., Forbes, R., McGraw, Z., Zhu, J., Storelvmo, T., and Dennis, J.: Importance of ice nucleation and precipitation on climate with the Parameterization of Unified Microphysics Across Scales version 1 (PUMASv1), Geosci. Model Dev., 16, 1735–1754, https://doi.org/10.5194/gmd-16-1735-2023, 2023.
Ghan, S. J. and Zaveri, R. A.: Parameterization of optical properties for hydrated internally mixed aerosol, J. Geophys. Res.-Atmos., 112, https://doi.org/10.1029/2006JD007927, 2007.
Ginoux, P., Prospero, J. M., Gill, T. E., Hsu, N. C., and Zhao, M.: Global-scale attribution of anthropogenic and natural dust sources and their emission rates based on MODIS Deep Blue aerosol products, Rev. Geophys., 50, https://doi.org/10.1029/2012RG000388, 2012.
Green, R. O., Mahowald, N., Ung, C., Thompson, D. R., Bator, L., Bennet, M., Bernas, M., Blackway, N., Bradley, C., Cha, J., Clark, P., Clark, R., Cloud, D., Diaz, E., Ben Dor, E., Duren, R., Eastwood, M., Ehlmann, B. L., Fuentes, L., Ginoux, P., Gross, J., He, Y., Kalashnikova, O., Kert, W., Keymeulen, D., Klimesh, M., Ku, D., Kwong-Fu, H., Liggett, E., Li, L., Lundeen, S., Makowski, M. D., Mazer, A., Miller, R., Mouroulis, P., Oaida, B., Okin, G. S., Ortega, A., Oyake, A., Nguyen, H., Pace, T., Painter, T. H., Pempejian, J., Garcia-Pando, C. P., Pham, T., Phillips, B., Pollock, R., Purcell, R., Realmuto, V., Schoolcraft, J., Sen, A., Shin, S., Shaw, L., Soriano, M., Swayze, G., Thingvold, E., Vaid, A., and Zan, J.: The Earth Surface Mineral Dust Source Investigation: An Earth Science Imaging Spectroscopy Mission, in: 2020 IEEE Aerospace Conference, 2020 IEEE Aerospace Conference, Big Sky, MT, USA, 7–14 March 2020, 1–15, https://doi.org/10.1109/AERO47225.2020.9172731, 2020.
Groot Zwaaftink, C. D., Grythe, H., Skov, H., and Stohl, A.: Substantial contribution of northern high-latitude sources to mineral dust in the Arctic, J. Geophys. Res.-Atmos., 121, 13678–13697, https://doi.org/10.1002/2016JD025482, 2016.
Hamilton, D. S., Moore, J. K., Arneth, A., Bond, T. C., Carslaw, K. S., Hantson, S., Ito, A., Kaplan, J. O., Lindsay, K., Nieradzik, L., Rathod, S. D., Scanza, R. A., and Mahowald, N. M.: Impact of Changes to the Atmospheric Soluble Iron Deposition Flux on Ocean Biogeochemical Cycles in the Anthropocene, Global Biogeochem. Cy., 34, e2019GB006448, https://doi.org/10.1029/2019GB006448, 2020.
Hamilton, D. S., Perron, M. M. G., Bond, T. C., Bowie, A. R., Buchholz, R. R., Guieu, C., Ito, A., Maenhaut, W., Myriokefalitakis, S., Olgun, N., Rathod, S. D., Schepanski, K., Tagliabue, A., Wagner, R., and Mahowald, N. M.: Earth, Wind, Fire, and Pollution: Aerosol Nutrient Sources and Impacts on Ocean Biogeochemistry, Annu. Rev. Mar. Sci., 14, 303–330, https://doi.org/10.1146/annurev-marine-031921-013612, 2022.
Hart, D.: Cheyenne supercomputer, NCAR CISL, https://doi.org/10.5065/D6RX99HX, 2021.
He, C., Flanner, M., Lawrence, D. M., and Gu, Y.: New Features and Enhancements in Community Land Model (CLM5) Snow Albedo Modeling: Description, Sensitivity, and Evaluation, J. Adv. Model. Earth Sy., 16, e2023MS003861, https://doi.org/10.1029/2023MS003861, 2024.
Held, I. M. and Soden, B. J.: Robust Responses of the Hydrological Cycle to Global Warming, J. Climate, 19, 5686–5699, https://doi.org/10.1175/JCLI3990.1, 2006.
Hess, M., Koepke, P., and Schult, I.: Optical Properties of Aerosols and Clouds: The Software Package OPAC, B. Am. Meteorol. Soc., 79, 831–844, https://doi.org/10.1175/1520-0477(1998)079<0831:OPOAAC>2.0.CO;2, 1998.
Hooper, J. and Marx, S.: A global doubling of dust emissions during the Anthropocene?, Global Planet. Change, 169, 70–91, https://doi.org/10.1016/j.gloplacha.2018.07.003, 2018.
Hurtt, G. C., Chini, L., Sahajpal, R., Frolking, S., Bodirsky, B. L., Calvin, K., Doelman, J. C., Fisk, J., Fujimori, S., Klein Goldewijk, K., Hasegawa, T., Havlik, P., Heinimann, A., Humpenöder, F., Jungclaus, J., Kaplan, J. O., Kennedy, J., Krisztin, T., Lawrence, D., Lawrence, P., Ma, L., Mertz, O., Pongratz, J., Popp, A., Poulter, B., Riahi, K., Shevliakova, E., Stehfest, E., Thornton, P., Tubiello, F. N., van Vuuren, D. P., and Zhang, X.: Harmonization of global land use change and management for the period 850–2100 (LUH2) for CMIP6, Geosci. Model Dev., 13, 5425–5464, https://doi.org/10.5194/gmd-13-5425-2020, 2020.
Iacono, M. J., Delamere, J. S., Mlawer, E. J., Shephard, M. W., Clough, S. A., and Collins, W. D.: Radiative forcing by long-lived greenhouse gases: Calculations with the AER radiative transfer models, J. Geophys. Res.-Atmos., 113, https://doi.org/10.1029/2008JD009944, 2008.
Indoitu, R., Kozhoridze, G., Batyrbaeva, M., Vitkovskaya, I., Orlovsky, N., Blumberg, D., and Orlovsky, L.: Dust emission and environmental changes in the dried bottom of the Aral Sea, Aeolian Res., 17, 101–115, https://doi.org/10.1016/j.aeolia.2015.02.004, 2015.
IPCC: Climate Change 2021: The Physical Science Basis. Contribution of Working Group I to the Sixth Assessment Report of the Intergovernmental Panel on Climate Change, edited by: Masson-Delmotte, V., Zhai, P., Pirani, A., Connors, S. L., Péan, C., Berger, S., Caud, N., Chen, Y., Goldfarb, L., Gomis, M. I., Huang, M., Leitzell, K., Lonnoy, E., Matthews, J. B. R., Maycock, T. K., Waterfield, T., Yelekçi, O., Yu, R., and Zhou, B., Cambridge University Press, Cambridge, UK, https://doi.org/10.1017/9781009157896, 2021.
Ito, A., Adebiyi, A. A., Huang, Y., and Kok, J. F.: Less atmospheric radiative heating by dust due to the synergy of coarser size and aspherical shape, Atmos. Chem. Phys., 21, 16869–16891, https://doi.org/10.5194/acp-21-16869-2021, 2021.
Journet, E., Balkanski, Y., and Harrison, S. P.: A new data set of soil mineralogy for dust-cycle modeling, Atmos. Chem. Phys., 14, 3801–3816, https://doi.org/10.5194/acp-14-3801-2014, 2014.
Ke, Z., Liu, X., Wu, M., Shan, Y., and Shi, Y.: Improved Dust Representation and Impacts on Dust Transport and Radiative Effect in CAM5, J. Adv. Model. Earth Sy., 14, e2021MS002845, https://doi.org/10.1029/2021MS002845, 2022.
King, J. A., Weber, J., Lawrence, P., Roe, S., Swann, A. L. S., and Val Martin, M.: Global and regional hydrological impacts of global forest expansion, Biogeosciences, 21, 3883–3902, https://doi.org/10.5194/bg-21-3883-2024, 2024.
Klein Goldewijk, K., Beusen, A., van Drecht, G., and de Vos, M.: The HYDE 3.1 spatially explicit database of human-induced global land-use change over the past 12,000 years, Global Ecol. Biogeogr., 20, 73–86, https://doi.org/10.1111/j.1466-8238.2010.00587.x, 2011.
Klose, M., Jorba, O., Gonçalves Ageitos, M., Escribano, J., Dawson, M. L., Obiso, V., Di Tomaso, E., Basart, S., Montané Pinto, G., Macchia, F., Ginoux, P., Guerschman, J., Prigent, C., Huang, Y., Kok, J. F., Miller, R. L., and Pérez García-Pando, C.: Mineral dust cycle in the Multiscale Online Nonhydrostatic AtmospheRe CHemistry model (MONARCH) Version 2.0, Geosci. Model Dev., 14, 6403–6444, https://doi.org/10.5194/gmd-14-6403-2021, 2021.
Kok, J. F.: A scaling theory for the size distribution of emitted dust aerosols suggests climate models underestimate the size of the global dust cycle, P. Natl. Acad. Sci. USA, 108, 1016–1021, https://doi.org/10.1073/pnas.1014798108, 2011.
Kok, J. F., Mahowald, N. M., Fratini, G., Gillies, J. A., Ishizuka, M., Leys, J. F., Mikami, M., Park, M.-S., Park, S.-U., Van Pelt, R. S., and Zobeck, T. M.: An improved dust emission model – Part 1: Model description and comparison against measurements, Atmos. Chem. Phys., 14, 13023–13041, https://doi.org/10.5194/acp-14-13023-2014, 2014.
Kok, J. F., Ridley, D. A., Zhou, Q., Miller, R. L., Zhao, C., Heald, C. L., Ward, D. S., Albani, S., and Haustein, K.: Smaller desert dust cooling effect estimated from analysis of dust size and abundance, Nat. Geosci., 10, 274–278, https://doi.org/10.1038/ngeo2912, 2017.
Kok, J. F., Ward, D. S., Mahowald, N. M., and Evan, A. T.: Global and regional importance of the direct dust-climate feedback, Nat. Commun., 9, 241, https://doi.org/10.1038/s41467-017-02620-y, 2018.
Kok, J. F., Adebiyi, A. A., Albani, S., Balkanski, Y., Checa-Garcia, R., Chin, M., Colarco, P. R., Hamilton, D. S., Huang, Y., Ito, A., Klose, M., Leung, D. M., Li, L., Mahowald, N. M., Miller, R. L., Obiso, V., Pérez García-Pando, C., Rocha-Lima, A., Wan, J. S., and Whicker, C. A.: Improved representation of the global dust cycle using observational constraints on dust properties and abundance, Atmos. Chem. Phys., 21, 8127–8167, https://doi.org/10.5194/acp-21-8127-2021, 2021a.
Kok, J. F., Adebiyi, A. A., Albani, S., Balkanski, Y., Checa-Garcia, R., Chin, M., Colarco, P. R., Hamilton, D. S., Huang, Y., Ito, A., Klose, M., Li, L., Mahowald, N. M., Miller, R. L., Obiso, V., Pérez García-Pando, C., Rocha-Lima, A., and Wan, J. S.: Contribution of the world's main dust source regions to the global cycle of desert dust, Atmos. Chem. Phys., 21, 8169–8193, https://doi.org/10.5194/acp-21-8169-2021, 2021b.
Kok, J. F., Storelvmo, T., Karydis, V. A., Adebiyi, A. A., Mahowald, N. M., Evan, A. T., He, C., and Leung, D. M.: Mineral dust aerosol impacts on global climate and climate change, Nat. Rev. Earth Environ., 4, 71–86, https://doi.org/10.1038/s43017-022-00379-5, 2023.
Lawrence, D. M., Fisher, R. A., Koven, C. D., Oleson, K. W., Swenson, S. C., Bonan, G., Collier, N., Ghimire, B., van Kampenhout, L., Kennedy, D., Kluzek, E., Lawrence, P. J., Li, F., Li, H., Lombardozzi, D., Riley, W. J., Sacks, W. J., Shi, M., Vertenstein, M., Wieder, W. R., Xu, C., Ali, A. A., Badger, A. M., Bisht, G., van den Broeke, M., Brunke, M. A., Burns, S. P., Buzan, J., Clark, M., Craig, A., Dahlin, K., Drewniak, B., Fisher, J. B., Flanner, M., Fox, A. M., Gentine, P., Hoffman, F., Keppel-Aleks, G., Knox, R., Kumar, S., Lenaerts, J., Leung, L. R., Lipscomb, W. H., Lu, Y., Pandey, A., Pelletier, J. D., Perket, J., Randerson, J. T., Ricciuto, D. M., Sanderson, B. M., Slater, A., Subin, Z. M., Tang, J., Thomas, R. Q., Val Martin, M., and Zeng, X.: The Community Land Model Version 5: Description of New Features, Benchmarking, and Impact of Forcing Uncertainty, J. Adv. Model. Earth Sy., 11, 4245–4287, https://doi.org/10.1029/2018MS001583, 2019.
Leung, D. M., Kok, J. F., Li, L., Okin, G. S., Prigent, C., Klose, M., Pérez García-Pando, C., Menut, L., Mahowald, N. M., Lawrence, D. M., and Chamecki, M.: A new process-based and scale-aware desert dust emission scheme for global climate models – Part I: Description and evaluation against inverse modeling emissions, Atmos. Chem. Phys., 23, 6487–6523, https://doi.org/10.5194/acp-23-6487-2023, 2023.
Leung, D. M., Kok, J. F., Li, L., Mahowald, N. M., Lawrence, D. M., Tilmes, S., Kluzek, E., Klose, M., and Pérez García-Pando, C.: A new process-based and scale-aware desert dust emission scheme for global climate models – Part II: Evaluation in the Community Earth System Model version 2 (CESM2), Atmos. Chem. Phys., 24, 2287–2318, https://doi.org/10.5194/acp-24-2287-2024, 2024.
Leung, D. M., Kok, J., Li, L., Lawrence, D., Mahowald, N., Tilmes, S., and Kluzek, E.: Data and source code for “A global dust emission dataset for estimating dust radiative forcings in climate models”, Zenodo [data set], https://doi.org/10.5281/zenodo.14597684, 2025.
Li, L. and Sokolik, I. N.: The Dust Direct Radiative Impact and Its Sensitivity to the Land Surface State and Key Minerals in the WRF-Chem-DuMo Model: A Case Study of Dust Storms in Central Asia, J. Geophys. Res.-Atmos., 123, 4564–4582, https://doi.org/10.1029/2017JD027667, 2018.
Li, L., Mahowald, N. M., Miller, R. L., Pérez García-Pando, C., Klose, M., Hamilton, D. S., Gonçalves Ageitos, M., Ginoux, P., Balkanski, Y., Green, R. O., Kalashnikova, O., Kok, J. F., Obiso, V., Paynter, D., and Thompson, D. R.: Quantifying the range of the dust direct radiative effect due to source mineralogy uncertainty, Atmos. Chem. Phys., 21, 3973–4005, https://doi.org/10.5194/acp-21-3973-2021, 2021a.
Li, L., Mahowald, N. M., Kok, J. F., Liu, X., Wu, M., Leung, D. M., Hamilton, D. S., Emmons, L. K., Huang, Y., Sexton, N., Meng, J., and Wan, J.: Importance of different parameterization changes for the updated dust cycle modeling in the Community Atmosphere Model (version 6.1), Geosci. Model Dev., 15, 8181–8219, https://doi.org/10.5194/gmd-15-8181-2022, 2022.
Li, L., Mahowald, N. M., Gonçalves Ageitos, M., Obiso, V., Miller, R. L., Pérez García-Pando, C., Di Biagio, C., Formenti, P., Brodrick, P. G., Clark, R. N., Green, R. O., Kokaly, R., Swayze, G., and Thompson, D. R.: Improved constraints on hematite refractive index for estimating climatic effects of dust aerosols, Commun. Earth Environ., 5, 1–12, https://doi.org/10.1038/s43247-024-01441-4, 2024.
Li, Y., Mickley, L. J., and Kaplan, J. O.: Response of dust emissions in southwestern North America to 21st century trends in climate, CO2 fertilization, and land use: implications for air quality, Atmos. Chem. Phys., 21, 57–68, https://doi.org/10.5194/acp-21-57-2021, 2021b.
Liao, H. and Seinfeld, J. H.: Radiative forcing by mineral dust aerosols: Sensitivity to key variables, J. Geophys. Res.-Atmos., 103, 31637–31645, https://doi.org/10.1029/1998JD200036, 1998.
Liu, J., Wang, X., Wu, D., Wei, H., Li, Y., and Ji, M.: Historical footprints and future projections of global dust burden from bias-corrected CMIP6 models, npj Clim. Atmos. Sci., 7, 1–12, https://doi.org/10.1038/s41612-023-00550-9, 2024.
Liu, X., Ma, P.-L., Wang, H., Tilmes, S., Singh, B., Easter, R. C., Ghan, S. J., and Rasch, P. J.: Description and evaluation of a new four-mode version of the Modal Aerosol Module (MAM4) within version 5.3 of the Community Atmosphere Model, Geosci. Model Dev., 9, 505–522, https://doi.org/10.5194/gmd-9-505-2016, 2016.
Logothetis, S.-A., Salamalikis, V., Gkikas, A., Kazadzis, S., Amiridis, V., and Kazantzidis, A.: 15-year variability of desert dust optical depth on global and regional scales, Atmos. Chem. Phys., 21, 16499–16529, https://doi.org/10.5194/acp-21-16499-2021, 2021.
Mahowald, N. M.: Anthropocene changes in desert area: Sensitivity to climate model predictions, Geophys. Res. Lett., 34, https://doi.org/10.1029/2007GL030472, 2007.
Mahowald, N. M. and Luo, C.: A less dusty future?, Geophys. Res. Lett., 30, https://doi.org/10.1029/2003GL017880, 2003.
Mahowald, N. M., Kloster, S., Engelstaedter, S., Moore, J. K., Mukhopadhyay, S., McConnell, J. R., Albani, S., Doney, S. C., Bhattacharya, A., Curran, M. A. J., Flanner, M. G., Hoffman, F. M., Lawrence, D. M., Lindsay, K., Mayewski, P. A., Neff, J., Rothenberg, D., Thomas, E., Thornton, P. E., and Zender, C. S.: Observed 20th century desert dust variability: impact on climate and biogeochemistry, Atmos. Chem. Phys., 10, 10875–10893, https://doi.org/10.5194/acp-10-10875-2010, 2010.
Mahowald, N. M., Li, L., Albani, S., Hamilton, D. S., and Kok, J. F.: Opinion: The importance of historical and paleoclimate aerosol radiative effects, Atmos. Chem. Phys., 24, 533–551, https://doi.org/10.5194/acp-24-533-2024, 2024.
McConnell, J. R., Aristarain, A. J., Banta, J. R., Edwards, P. R., and Simões, J. C.: 20th-Century doubling in dust archived in an Antarctic Peninsula ice core parallels climate change and desertification in South America, P. Natl. Acad. Sci. USA, 104, 5743–5748, https://doi.org/10.1073/pnas.0607657104, 2007.
Miller, R. L., Perlwitz, J., and Tegen, I.: Feedback upon dust emission by dust radiative forcing through the planetary boundary layer, J. Geophys. Res.-Atmos., 109, https://doi.org/10.1029/2004JD004912, 2004.
Mulitza, S., Heslop, D., Pittauerova, D., Fischer, H. W., Meyer, I., Stuut, J.-B., Zabel, M., Mollenhauer, G., Collins, J. A., Kuhnert, H., and Schulz, M.: Increase in African dust flux at the onset of commercial agriculture in the Sahel region, Nature, 466, 226–228, https://doi.org/10.1038/nature09213, 2010.
Neale, R. B., Gettelman, A., Park, S., Chen, C.-C., Lauritzen, P. H., Williamson, D. L., Conley, A. J., Kinnison, D., Marsh, D., Smith, A. K., Vitt, F., Garcia, R., Lamarque, J.-F., Mills, M., Tilmes, S., Morrison, H., Cameron-Smith, P., Collins, W. D., Iacono, M. J., Easter, R. C., Liu, X., Ghan, S. J., Rasch, P. J., and Taylor, M. A.: Description of the NCAR Community Atmosphere Model (CAM 5.0), 289, https://doi.org/10.5065/wgtk-4g06, 2012.
Neff, J. C., Ballantyne, A. P., Farmer, G. L., Mahowald, N. M., Conroy, J. L., Landry, C. C., Overpeck, J. T., Painter, T. H., Lawrence, C. R., and Reynolds, R. L.: Increasing eolian dust deposition in the western United States linked to human activity, Nat. Geosci., 1, 189–195, https://doi.org/10.1038/ngeo133, 2008.
Niemeyer, T. C., Gillette, D. A., DeLuisi, J. J., Kim, Y. J., Niemeyer, W. F., Ley, T., Gill, T. E., and Ono, D.: Optical depth, size distribution and flux of dust from Owens Lake, California, Earth Surf. Proc. Land., 24, 463–479, https://doi.org/10.1002/(SICI)1096-9837(199905)24:5<463::AID-ESP2>3.0.CO;2-R, 1999.
Pincus, R., Mlawer, E. J., and Delamere, J. S.: Balancing Accuracy, Efficiency, and Flexibility in Radiation Calculations for Dynamical Models, J. Adv. Model. Earth Sy., 11, 3074–3089, https://doi.org/10.1029/2019MS001621, 2019.
Prospero, J. M., Delany, A. C., Delany, A. C., and Carlson, T. N.: The Discovery of African Dust Transport to the Western Hemisphere and the Saharan Air Layer: A History, B. Am. Meteorol. Soc., 102, E1239–E1260, https://doi.org/10.1175/BAMS-D-19-0309.1, 2021.
Pu, B. and Ginoux, P.: Projection of American dustiness in the late 21st century due to climate change, Sci. Rep., 7, 5553, https://doi.org/10.1038/s41598-017-05431-9, 2017.
Rayner, N. A., Parker, D. E., Horton, E. B., Folland, C. K., Alexander, L. V., Rowell, D. P., Kent, E. C., and Kaplan, A.: Global analyses of sea surface temperature, sea ice, and night marine air temperature since the late nineteenth century, J. Geophys. Res.-Atmos., 108, https://doi.org/10.1029/2002JD002670, 2003.
Ridley, D. A., Heald, C. L., Kok, J. F., and Zhao, C.: An observationally constrained estimate of global dust aerosol optical depth, Atmos. Chem. Phys., 16, 15097–15117, https://doi.org/10.5194/acp-16-15097-2016, 2016.
Rodriguez-Caballero, E., Belnap, J., Büdel, B., Crutzen, P. J., Andreae, M. O., Pöschl, U., and Weber, B.: Dryland photoautotrophic soil surface communities endangered by global change, Nat. Geosci., 11, 185–189, https://doi.org/10.1038/s41561-018-0072-1, 2018.
Rodriguez-Caballero, E., Stanelle, T., Egerer, S., Cheng, Y., Su, H., Canton, Y., Belnap, J., Andreae, M. O., Tegen, I., Reick, C. H., Pöschl, U., and Weber, B.: Global cycling and climate effects of aeolian dust controlled by biological soil crusts, Nat. Geosci., 15, 458–463, https://doi.org/10.1038/s41561-022-00942-1, 2022.
Sagoo, N. and Storelvmo, T.: Testing the sensitivity of past climates to the indirect effects of dust, Geophys. Res. Lett., 44, 5807–5817, https://doi.org/10.1002/2017GL072584, 2017.
Schewe, J. and Levermann, A.: Non-linear intensification of Sahel rainfall as a possible dynamic response to future warming, Earth Syst. Dynam., 8, 495–505, https://doi.org/10.5194/esd-8-495-2017, 2017.
Schutgens, N., Tsyro, S., Gryspeerdt, E., Goto, D., Weigum, N., Schulz, M., and Stier, P.: On the spatio-temporal representativeness of observations, Atmos. Chem. Phys., 17, 9761–9780, https://doi.org/10.5194/acp-17-9761-2017, 2017.
Shan, Y., Liu, X., Lin, L., Ke, Z., and Lu, Z.: An Improved Representation of Aerosol Wet Removal by Deep Convection and Impacts on Simulated Aerosol Vertical Profiles, J. Geophys. Res.-Atmos., 126, e2020JD034173, https://doi.org/10.1029/2020JD034173, 2021.
Skiles, S. M., Flanner, M., Cook, J. M., Dumont, M., and Painter, T. H.: Radiative forcing by light-absorbing particles in snow, Nat. Clim. Change, 8, 964–971, https://doi.org/10.1038/s41558-018-0296-5, 2018.
Smith, M. B., Mahowald, N. M., Albani, S., Perry, A., Losno, R., Qu, Z., Marticorena, B., Ridley, D. A., and Heald, C. L.: Sensitivity of the interannual variability of mineral aerosol simulations to meteorological forcing dataset, Atmos. Chem. Phys., 17, 3253–3278, https://doi.org/10.5194/acp-17-3253-2017, 2017.
Smith, S. D., Huxman, T. E., Zitzer, S. F., Charlet, T. N., Housman, D. C., Coleman, J. S., Fenstermaker, L. K., Seemann, J. R., and Nowak, R. S.: Elevated CO2 increases productivity and invasive species success in an arid ecosystem, Nature, 408, 79–82, https://doi.org/10.1038/35040544, 2000.
Sokolik, I. N. and Toon, O. B.: Direct radiative forcing by anthropogenic airborne mineral aerosols, Nature, 381, 681–683, https://doi.org/10.1038/381681a0, 1996.
Stanelle, T., Bey, I., Raddatz, T., Reick, C., and Tegen, I.: Anthropogenically induced changes in twentieth century mineral dust burden and the associated impact on radiative forcing, J. Geophys. Res.-Atmos., 119, 13526–13546, https://doi.org/10.1002/2014JD022062, 2014.
Storelvmo, T.: Aerosol Effects on Climate via Mixed-Phase and Ice Clouds, Annu. Rev. Earth Pl. Sc., 45, 199–222, https://doi.org/10.1146/annurev-earth-060115-012240, 2017.
Tegen, I. and Lacis, A. A.: Modeling of particle size distribution and its influence on the radiative properties of mineral dust aerosol, J. Geophys. Res.-Atmos., 101, 19237–19244, https://doi.org/10.1029/95JD03610, 1996.
Tegen, I., Werner, M., Harrison, S. P., and Kohfeld, K. E.: Relative importance of climate and land use in determining present and future global soil dust emission, Geophys. Res. Lett., 31, https://doi.org/10.1029/2003GL019216, 2004.
Thornhill, G., Collins, W., Olivié, D., Skeie, R. B., Archibald, A., Bauer, S., Checa-Garcia, R., Fiedler, S., Folberth, G., Gjermundsen, A., Horowitz, L., Lamarque, J.-F., Michou, M., Mulcahy, J., Nabat, P., Naik, V., O'Connor, F. M., Paulot, F., Schulz, M., Scott, C. E., Séférian, R., Smith, C., Takemura, T., Tilmes, S., Tsigaridis, K., and Weber, J.: Climate-driven chemistry and aerosol feedbacks in CMIP6 Earth system models, Atmos. Chem. Phys., 21, 1105–1126, https://doi.org/10.5194/acp-21-1105-2021, 2021.
Wagner, R., Schepanski, K., and Klose, M.: The Dust Emission Potential of Agricultural-Like Fires – Theoretical Estimates From Two Conceptually Different Dust Emission Parameterizations, J. Geophys. Res.-Atmos., 126, e2020JD034355, https://doi.org/10.1029/2020JD034355, 2021.
Wang, S. S.-C., Leung, L. R., and Qian, Y.: Projection of Future Fire Emissions Over the Contiguous US Using Explainable Artificial Intelligence and CMIP6 Models, J. Geophys. Res.-Atmos., 128, e2023JD039154, https://doi.org/10.1029/2023JD039154, 2023.
Webb, N. P. and Pierre, C.: Quantifying Anthropogenic Dust Emissions, Earths Future, 6, 286–295, https://doi.org/10.1002/2017EF000766, 2018.
Wilks, D. S.: Statistical Methods in the Atmospheric Sciences, Elsevier, ISBN 9780128165270, 2019.
Wu, C., Lin, Z., Shao, Y., Liu, X., and Li, Y.: Drivers of recent decline in dust activity over East Asia, Nat. Commun., 13, 7105, https://doi.org/10.1038/s41467-022-34823-3, 2022.
Xi, X. and Sokolik, I. N.: Quantifying the anthropogenic dust emission from agricultural land use and desiccation of the Aral Sea in Central Asia, J. Geophys. Res.-Atmos., 121, 12270–12281, https://doi.org/10.1002/2016JD025556, 2016.
Xie, X., Liu, X., Che, H., Xie, X., Wang, H., Li, J., Shi, Z., and Liu, Y.: Modeling East Asian Dust and Its Radiative Feedbacks in CAM4-BAM, J. Geophys. Res.-Atmos., 123, 1079–1096, https://doi.org/10.1002/2017JD027343, 2018a.
Xie, X., Liu, X., Che, H., Xie, X., Li, X., Shi, Z., Wang, H., Zhao, T., and Liu, Y.: Radiative feedbacks of dust in snow over eastern Asia in CAM4-BAM, Atmos. Chem. Phys., 18, 12683–12698, https://doi.org/10.5194/acp-18-12683-2018, 2018b.
Yu, Y. and Ginoux, P.: Enhanced dust emission following large wildfires due to vegetation disturbance, Nat. Geosci., 15, 878–884, https://doi.org/10.1038/s41561-022-01046-6, 2022.
Yuan, T., Yu, H., Chin, M., Remer, L. A., McGee, D., and Evan, A.: Anthropogenic Decline of African Dust: Insights From the Holocene Records and Beyond, Geophys. Res. Lett., 47, e2020GL089711, https://doi.org/10.1029/2020GL089711, 2020.
Zender, C. S., Bian, H., and Newman, D.: Mineral Dust Entrainment and Deposition (DEAD) model: Description and 1990s dust climatology, J. Geophys. Res.-Atmos., 108, https://doi.org/10.1029/2002JD002775, 2003.
Zha, J., Shen, C., Li, Z., Wu, J., Zhao, D., Fan, W., Sun, M., Azorin-Molina, C., and Deng, K.: Projected changes in global terrestrial near-surface wind speed in 1.5 °C–4.0 °C global warming levels, Environ. Res. Lett., 16, 114016, https://doi.org/10.1088/1748-9326/ac2fdd, 2021.
Zhang, L., Gong, S., Padro, J., and Barrie, L.: A size-segregated particle dry deposition scheme for an atmospheric aerosol module, Atmos. Environ., 35, 549–560, https://doi.org/10.1016/S1352-2310(00)00326-5, 2001.
Zhao, A., Ryder, C. L., and Wilcox, L. J.: How well do the CMIP6 models simulate dust aerosols?, Atmos. Chem. Phys., 22, 2095–2119, https://doi.org/10.5194/acp-22-2095-2022, 2022.
Zuidema, P., Alvarez, C., Kramer, S. J., Custals, L., Izaguirre, M., Sealy, P., Prospero, J. M., and Blades, E.: Is Summer African Dust Arriving Earlier to Barbados? The Updated Long-Term In Situ Dust Mass Concentration Time Series from Ragged Point, Barbados, and Miami, Florida, B. Am. Meteorol. Soc., 100, 1981–1986, https://doi.org/10.1175/BAMS-D-18-0083.1, 2019.
- Abstract
- Introduction
- Deriving a decadally varying global gridded dust emission dataset
- Using CESM to evaluate the impact of historical DustCOMMv1 emissions
- Datasets used for evaluating CESM simulations using the DustCOMM emission dataset
- Evaluating the new dust emission dataset in CESM2
- Dust historical direct radiative effects and forcings in CESM2 runs
- Conclusions
- Code and data availability
- Author contributions
- Competing interests
- Disclaimer
- Acknowledgements
- Financial support
- Review statement
- References
- Supplement