the Creative Commons Attribution 4.0 License.
the Creative Commons Attribution 4.0 License.
 | 20 Feb 2025
Assessing the relative impacts of satellite ozone and its precursor observations to improve global tropospheric ozone analysis using multiple chemical reanalysis systems
Emanuele Emili
Kazuyuki Miyazaki
Antje Inness
R. Bradley Pierce
Dylan Jones
Helen Worden
William Y. Y. Cheng
Vincent Huijnen
Gerbrand Koren
Chemical reanalysis products have been produced by integrating various satellite observational data to provide comprehensive information on atmospheric composition. Five global chemical reanalysis datasets were used to evaluate the relative impacts of assimilating satellite ozone and its precursor measurements on surface and free-tropospheric ozone analyses for the year 2010. Observing system experiments (OSEs) were conducted with multiple reanalysis systems under similar settings to evaluate the impacts of reanalysis system selection on the quantification of observing system values. Without data assimilation, large discrepancies remained among the control runs owing to model biases. Data assimilation improved the consistency among the systems, reducing the standard deviation by 72 %–88 % in the lower troposphere through the lower stratosphere, while improving agreement with independent ozonesonde observations. The OSEs suggested the importance of precursor measurements, especially from tropospheric NO2 columns, for improving ozone analysis in the lower troposphere, with varying influences among the systems (increases in global lower-tropospheric ozone by 0.1 % in GEOS-Chem and 7 % in Tropospheric Chemistry Reanalysis version 2 (TCR-2), with only NO2 assimilation). Adjustments made by direct ozone assimilation showed similar vertical patterns between the TCR-2 and IASI-r systems, with increases of 6 %–22 % and decreases of 2 %–21 % in the middle and upper troposphere, respectively, reflecting the biases of the forecast models. These results suggest the importance of considering the effects of the forecast model performance and data assimilation configurations when assessing the observing system impacts to provide unbiased evaluations of satellite systems and to guide the design of future observing systems.
- Article
(16065 KB) - Full-text XML
-
Supplement
(593 KB) - BibTeX
- EndNote


Tropospheric ozone plays a key role in climate systems as a short-lived climate forcer and in tropospheric photochemistry as a determinant of oxidizing capacity and methane lifetime (Szopa et al., 2021). It is also a hazardous air pollutant that adversely affects the human health, crop productivity, and ecosystems (Fleming et al., 2018; Mills et al., 2018). Tropospheric ozone is chemically produced from precursor gases, including nitrogen oxides (NOx ≈ NO + NO2), carbon monoxide (CO), and volatile organic compounds (VOCs), and it is destroyed through the chemical reaction of O(1D) with water vapor. Stratosphere–troposphere ozone exchange and dry deposition at the surface are also important ozone sources and sinks, respectively.
The global tropospheric ozone distribution and its trends have been monitored in recent decades using various observation networks, including surface in situ networks, ozonesondes, ground-based remote sensing, aircraft, and satellites (e.g., Schultz et al., 2017b; Gaudel et al., 2018; Tarasick et al., 2019). In particular, a global picture of tropospheric ozone and its precursor gases has been provided from satellite observations, such as the Global Ozone Monitoring Experiment (GOME) (Burrows et al., 1999), Measurements of Pollution in the Troposphere (MOPITT) (Drummond et al., 2010), SCanning Imaging Absorption spectroMeter for Atmospheric CHartographY (SCIAMACHY) (Callies et al., 2000), Ozone Monitoring Instrument (OMI) (Levelt et al., 2006), Tropospheric Emission Spectrometer (TES) (Beer, 2006), Microwave Limb Sounder (MLS) (Waters et al., 2006), GOME-2 (Callies et al., 2000), Infrared Atmospheric Sounding Interferometer (IASI) (August et al., 2012), and TROPOspheric Monitoring Instrument (TROPOMI) (Veefkind et al., 2012). A recent study indicated the complex impacts of various precursors on tropospheric ozone variability at regional to global scales (Elshorbany et al., 2024). Satellite HCHO and NO2 retrievals were used to diagnose ozone chemical regimes and relate them to recent ozone increasing trends over China (Lee et al., 2022; Ren et al., 2022) and reversal ozone weekend effects in US cities (Jin et al., 2020). The combined use of satellite observations of tropospheric ozone and its precursors remains a quantitative challenge because of the non-linear transport and chemistry processes that impact tropospheric ozone.
Several chemical reanalysis products have been developed by integrating various observational datasets with chemical transport models (CTMs) using data assimilation techniques. These reanalysis products provide physically and chemically consistent long-term records of atmospheric composition, including tropospheric ozone. Chemical reanalysis products have been produced using multi-species satellite observations, such as the Copernicus Atmosphere Monitoring Service (CAMS) reanalysis (CAMSRA) (Inness et al., 2019a), the Tropospheric Chemistry Reanalysis version 2 (TCR-2) (Miyazaki et al., 2020a), and the Real-time Air Quality Modeling System (RAQMS) (Pierce et al., 2009). For CAMSRA and TCR-2, analyses of tropospheric ozone and related species have been validated using independent observations (Huijnen et al., 2020; Park et al., 2020; Ryu and Min, 2021). In an experimental reanalysis, a smaller number of measurements are assimilated, such as tropospheric ozone in the IASI-r (Emili and El Aabaribaoune, 2021) and tropospheric NO2 in the GEOS-Chem adjoint systems (Qu et al., 2020a).
The International Global Atmospheric Chemistry (IGAC) Tropospheric Ozone Assessment Report Phase II (TOAR-II) Chemical Reanalysis Focus Working Group (WG) summarizes the current status of chemical reanalysis to understand its capacity in various scientific applications. One of the important questions to be addressed is the relative impacts of individual satellite observations of stratospheric and tropospheric ozone and its precursors on surface and free-tropospheric ozone analyses. Resolving this question is essential for formulating future satellite missions and comprehending our understanding of the atmospheric chemistry and climate systems. Observing system experiments (OSEs) that separately assimilate individual measurements have been widely used in meteorological studies to optimize the data assimilation frameworks, and they have contributed to the observing system development. In atmospheric composition research, the individual impacts of satellite observations of tropospheric ozone and its precursor gases (e.g., NO2 and CO) have been evaluated using data assimilation and chemical reanalysis frameworks (e.g., Barré et al., 2015; Miyazaki et al., 2019a; Zhang et al., 2019; Emili and El Aabaribaoune, 2021; Inness et al., 2022; Naus et al., 2022; Sekiya et al., 2022).
Nevertheless, the implications of OSE results can be strongly affected by the forecast model performance because of the perfect model assumption, which assumes that the forecast step within the data assimilation does not add systematic errors through model processes (Lahoz et al., 2010). Hence, reanalyses inherit underlying model biases to an extent, and that depends on the frequency and sparseness of observations. They are also influenced by the data assimilation configurations, such as the data assimilation technique and choice of data version or satellite product level. Model-independent implications can be obtained using multi-model approaches in a common OSE framework. In a pioneering study of a multi-model chemical data assimilation, Miyazaki et al. (2020b) assessed the combined impacts of assimilating multi-constituent observations into multiple models using the Multi-mOdel Multi-cOnstituent Chemical data assimilation (MOMO-Chem) framework and showed strong model dependence on emission estimates and model response to the posteriori emissions. Similarly, OSEs using a variety of chemical reanalysis systems allow for observational impact assessments that are less dependent on the characteristics of individual forecast models and data assimilation systems. Such OSE results can support the developments of chemical reanalysis and future satellite missions.
Therefore, based on the work of the IGAC TOAR-II Chemical Reanalysis WG activity, this study utilized five global chemical reanalysis systems, namely CAMSRA, TCR-2, IASI-r, GEOS-Chem, and RAQMS, to evaluate the combined and individual impacts of assimilating multiple satellite observations on tropospheric ozone analysis. Although the assimilated measurements varied between the reanalysis systems, we performed additional OSEs in closer settings across the systems to examine the relative impacts of satellite ozone and precursor measurements and their dependence on reanalysis systems.
The remainder of this paper is organized as follows. Section 2 describes the considered chemical reanalysis data and independent observational data for the validation. Section 3 compares the five chemical reanalysis products and validates them using independent observations. Section 4 presents the assessment results on the impacts of assimilating individual observations on tropospheric ozone analysis. Section 5 discusses future chemical reanalysis developments and satellite constellation designs. Section 6 summarizes this study.
2.1 Reanalysis systems
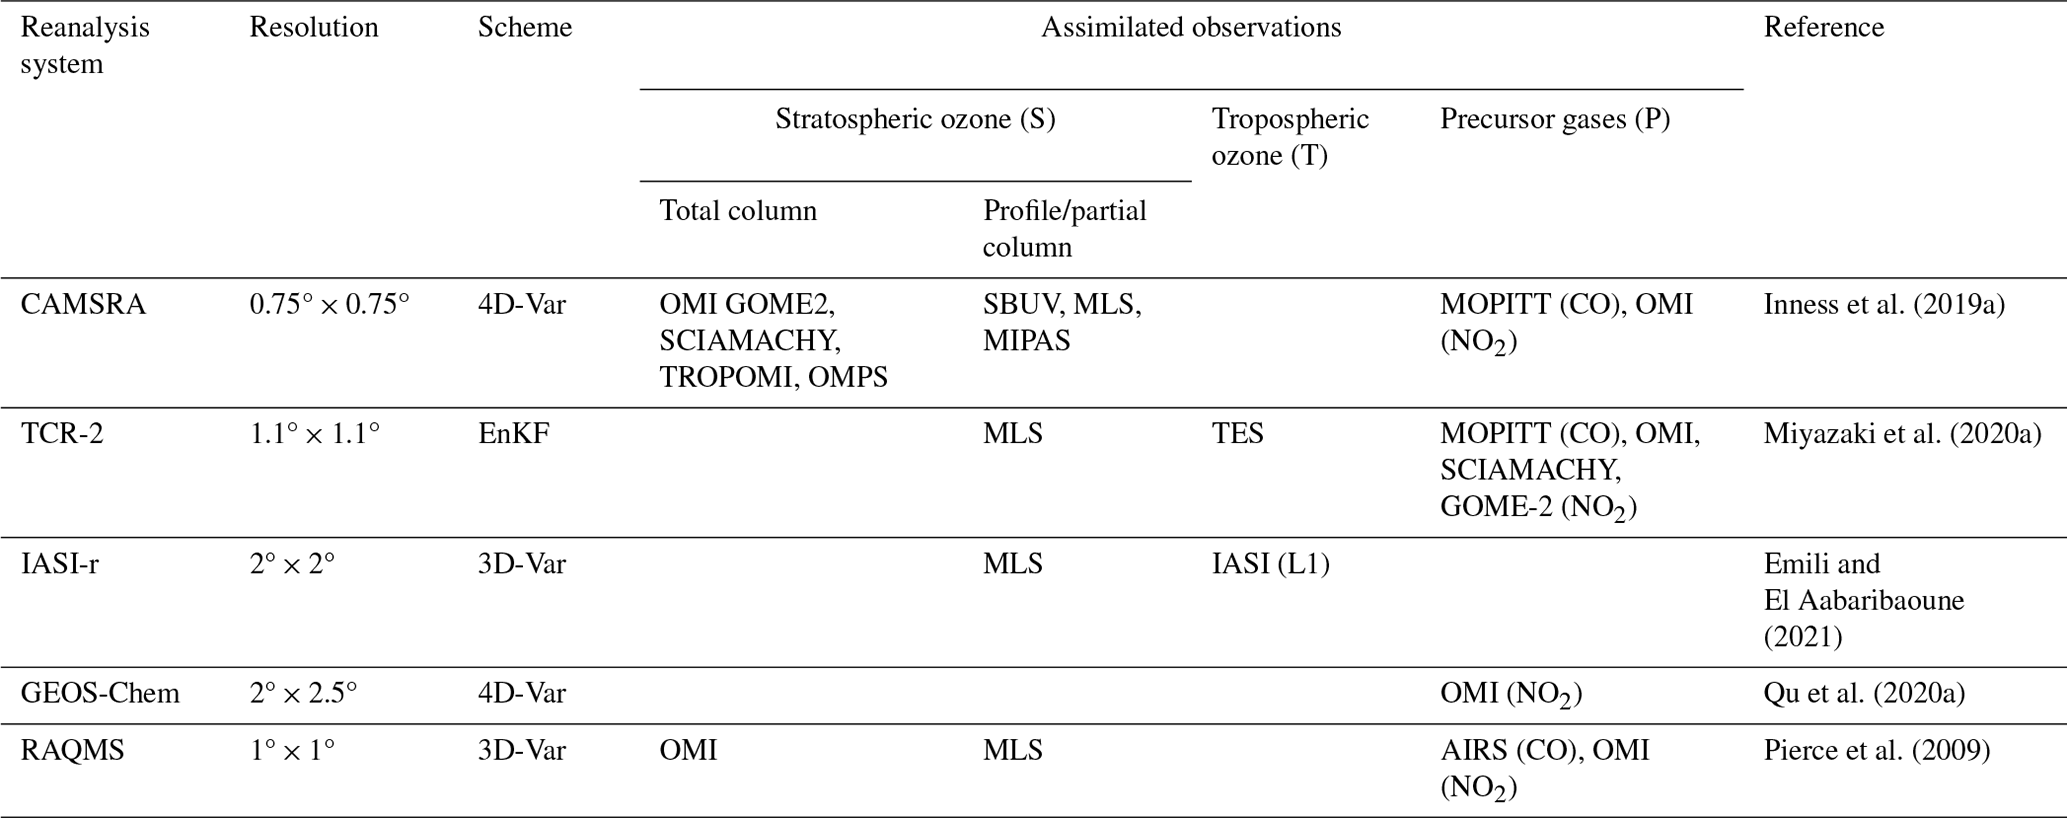
Table 1 summarizes the chemical reanalysis products used in this study. Data assimilation calculations and validations were conducted for 2010 because a greater number of satellite observations were available when compared with other years. Brief descriptions of these systems are provided below.
Inness et al. (2019a)Miyazaki et al. (2020a)Emili and El Aabaribaoune (2021)Qu et al. (2020a)Pierce et al. (2009)Table 1List of chemical reanalysis systems used in this study.
2.1.1 CAMS reanalysis (CAMSRA)
CAMS (Peuch et al., 2022), operated by the European Centre for Medium-Range Weather Forecasts (ECMWF) on behalf of the European Commission, provides daily analyses and 5 d forecasts of atmospheric composition in near-real time, as well as a reanalysis of atmospheric composition going back to 2003, known as the CAMSRA (Inness et al., 2019a). CAMSRA consists of three-dimensional time-consistent atmospheric composition fields, including aerosols and chemical species. It builds on the experience gained during the production of the earlier Monitoring Atmospheric Composition and Climate (MACC) reanalysis (Inness et al., 2013) and CAMS interim reanalysis (Flemming et al., 2017). Offline or reprocessed retrievals were used until 2016, and near-real-time retrievals were used from 2017 onwards. More details can be found in Inness et al. (2019a) and in the reanalysis validation reports available at https://atmosphere.copernicus.eu/eqa-reports-global-services (last access: 1 August 2024).
Satellite retrievals of the total column CO, tropospheric column NO2, aerosol optical depth, and ozone (O3) were assimilated for CAMSRA with the ECMWF's Integrated Forecasting System. The O3 and the retrievals of its precursors assimilated in CAMSRA were total column fields from SCIAMACHY, OMI, GOME-2, and TROPOMI; ozone layers from SBUV/2; stratospheric ozone profiles from MIPAS and MLS; total column CO from MOPITT; and tropospheric column NO2 from OMI.
CAMSRA has a horizontal resolution of about 80 km and provides 3-hourly 3D analysis fields and forecast fields, 3-hourly forecast fields, and hourly surface forecast fields. It was produced with the ECMWF’s incremental 4-dimensional variational (4D-Var) data assimilation system (Courtier et al., 1994), with 12 h assimilation windows from 09:00 to 21:00 UTC and 21:00 to 09:00 UTC and two minimizations at spectral truncations, namely T95 (∼ 210 km) and T159 (∼ 110 km). Several atmospheric composition fields (i.e., O3, CO, NO2, and total aerosol mass mixing ratio) were included in the control vector and minimized together with the meteorological control variables by adjusting the initial conditions. Emissions were not optimized. The background errors for O3 were calculated with the National Meteorological Center (NMC) method (Parrish and Derber, 1992) and are univariate; i.e., the error covariance matrix between ozone and the other chemical and dynamical fields is diagonal.
The descriptions of the CTM applied in CAMSRA are given by Flemming et al. (2015). The chemical mechanism of the IFS used in CAMSRA was a modified and extended version of the CB05 (Yarwood et al., 2005) chemical mechanism for the troposphere, as implemented in the CTM TM5 (Huijnen et al., 2010). CB05 describes the tropospheric chemistry with 55 species and 126 reactions. Stratospheric ozone chemistry was parameterized by a Cariolle scheme (Cariolle and Déqué, 1986; Cariolle and Teyssèdre, 2007). Ozone and aerosol fields were used interactively in the numerical weather prediction (NWP) radiation scheme of CAMSRA.
The a priori anthropogenic emissions used in CAMSRA came from the MACCity inventory (Granier et al., 2011), with modifications to increase wintertime road traffic emissions over North America and Europe following the correction of Stein et al. (2014). Biomass-burning emissions were taken from the Global Fire Assimilation System (GFAS v1.2; Kaiser et al., 2012). Monthly mean biogenic emissions simulated by the MEGAN2.1 model, following Sindelarova et al. (2014), were used for the period 2003–2017, and in the later years, a monthly mean climatology derived from the 2003–2017 simulations was applied.
The validation in Inness et al. (2019a) showed that CAMSRA has smaller biases compared with observations than the previous two reanalyses (MACC and CAMS interim) and is more consistent in time, especially compared to the MACC reanalysis (e.g., Inness et al., 2019a; Wagner et al., 2021). Evaluation of more recent years can be found in the validation reports at https://atmosphere.copernicus.eu/eqa-reports-global-services (last access: 1 August 2024). In addition to CAMSRA, CAMS also produced a control run, which used the same meteorology as CAMSRA but did not assimilate any atmospheric composition data.
2.1.2 TCR-2
Tropospheric Chemistry Reanalysis version 2 (TCR-2) provides the emissions and atmospheric abundance of various chemical species from the assimilation of multi-constituent measurements from multiple satellite instruments during 2005–2021 (Miyazaki et al., 2020a). These reanalyses products were developed under the Multi-mOdel Multi-cOnstituent Chemical data assimilation (MOMO-Chem) framework (Miyazaki et al., 2020b).
The TCR-2 products were obtained from the assimilation of the OMI, SCIAMACHY, and GOME-2 (NO2 QA4ECV v1.1) products (Boersma et al., 2017a, b, c); the TES V6 ozone profile; the MLS v4.2 ozone and HNO3 (Livesey et al., 2018); the MOPITT CO v7 TIR/NIR product (Deeter et al., 2017); and the OMI planetary boundary layer (PBL) SO2 product (Li et al., 2013).
TCR-2 has a horizontal resolution of T106 (∼ 1.1° × 1.1°), with 32 vertical layers up to an altitude of 40 km. The TCR-2 reanalysis system employs the local ensemble transform Kalman filter (LETKF) technique (Hunt et al., 2007). The state vector includes the surface emissions of NOx, CO, SO2, and lightning NOx sources, as well as the concentrations of 35 chemical species. Surface and lightning emissions were estimated based on a state argumentation method (e.g., Evensen, 2009), which used the relationship between emissions and concentrations in the background error covariance matrix generated based on ensemble model simulations. In the analysis step, the standard deviation of the emission ensembles was inflated to a predefined minimum value obtained through sensitivity calculations (i.e., 56 % of the a priori emissions) to prevent covariance underestimation.
The CTM used in TCR-2 was MIROC-Chem (Sekiya et al., 2018), which calculates tracer transport, emissions, deposition, and chemical processes, including the ozone–HOx–NOx–CO–VOC system (92 chemical species and 262 chemical reactions). The meteorological fields calculated in the dynamical and physical modules of MIROC-Chem were nudged to the 6-hourly ERA-Interim reanalysis (Dee et al., 2011) and used in the chemical module at every model time step (4–8 min).
A priori emissions were obtained from the HTAP v2.2 inventory for the anthropogenic sources (Janssens-Maenhout et al., 2015) and the GFED v4.1 inventory for the biomass burning (Randerson et al., 2018), while those from soil NOx were based on the GEIA inventory (Graedel et al., 1993).
A control model simulation without any data assimilation, which was evaluated by Miyazaki et al. (2020a), was used as the baseline in this study.
2.1.3 IASI-r
IASI-r (Emili and El Aabaribaoune, 2021) is a year-long reanalysis experiment conceived to demonstrate the added value of assimilating ozone sensitive infrared measurements from the Infrared Atmospheric Sounding Interferometer (August et al., 2012). It was prepared based on previous experience in assimilating IASI Level 2 ozone retrievals (Emili et al., 2014; Peiro et al., 2018) and Level 1 radiances (Emili et al., 2019; El Aabaribaoune et al., 2021) for 2010.
IASI-r assimilates both ozone-sensitive radiances (Level 1) from IASI (980–1100 cm−1) and stratospheric Level 2 profiles from the Microwave Limb Sounder (MLS).
IASI-r has a 2° × 2° global grid with 60 vertical levels up to 0.1 hPa. The reanalysis was conducted using a 3-dimensional variational (3D-Var) data assimilation algorithm and hourly windows. Background and observation error covariances were either diagnosed (El Aabaribaoune et al., 2021) or specified as a function of the vertical layer, tropopause height, and local ozone concentration (Emili and El Aabaribaoune, 2021). With the given setup, only ozone concentrations can be corrected by the data assimilation. Due to the limited vertical sensitivity of the assimilated observations and the simplified model configuration, little information is provided by IASI-r on ground-level ozone. Hence, the main target of IASI-r is ozone in the free and upper troposphere.
The CTM being used was MOCAGE (Josse et al., 2004), and it was using the meteorological forcing from ERA-interim (Dee et al., 2011). The IASI-r configuration employs a linearized ozone chemistry thorough the entire atmosphere (Cariolle and Teyssèdre, 2007), with the ozone in the middle and lower troposphere being relaxed to a static zonal climatology. This relatively light model configuration is meant to run long-term ozone reanalyses (Peiro et al., 2018), with assimilated observations providing the main spatiotemporal constraint on tropospheric ozone distribution.
2.1.4 GEOS-Chem
We used the GEOS-Chem adjoint model (Henze et al., 2007) v35k at the 2° × 2.5° resolution to assimilate tropospheric NO2 observations from OMI and simulate global ozone concentrations using the a posteriori NOx emissions for 2005–2016.
The OMI Level 2 NO2 retrieval from the NASA product OMNO2 version 3 (Krotkov et al., 2017) was used for the assimilation. We screened all OMI NO2 retrievals using data quality flags and the criteria of the positive tropospheric column, cloud fraction of < 0.2, solar zenith angle < 75°, and viewing zenith angle of < 65°. All retrievals that are affected by row anomalies were excluded. GEOS-Chem NO2 vertical column densities (VCDs) were converted to slant column densities (SCDs) using scattering weight from the OMI retrievals and were then compared the GEOS-Chem SCDs with the SCDs retrieved from OMI.
The OMI NO2 retrievals were assimilated using the hybrid 4D-Var/mass balance inversion of NOx emissions described in Qu et al. (2017). A cost function was defined as the observation-error-weighted differences between the simulated and retrieved NO2 SCDs plus the prior-emission-error-weighted departure of the emission scaling factors from the prior estimates. The GEOS-Chem adjoint model minimizes the cost function using the quasi-Newton L-BFGS-B gradient-based optimization technique (Byrd et al., 1995; Zhu et al., 1994) in which the gradient of the cost function with respect to the control parameter is calculated using the adjoint method. Details of the assimilation of NO2 SCDs, how vertical sensitivities of satellite retrievals are accounted for, and the hybrid 4D-Var/mass balance inversion of NOx emissions are described in Qu et al. (2017).
The GEOS-Chem model is used as a CTM, which is driven by the Modern-Era Retrospective analysis for Research and Applications, Version 2 (MERRA-2), meteorological fields from the NASA Global Modeling and Assimilation Office (GMAO).
A priori anthropogenic emissions of NOx, SO2, NH3, CO, NMVOCs (non-methane volatile organic compounds), and primary aerosols were obtained from the HTAP 2010 inventory, version 2 (Janssens-Maenhout et al., 2015). We also obtained 3-hourly wildfire emissions from GFED4 (Giglio et al., 2013). The other emissions and setups follow those of Qu et al. (2017, 2019a, b, 2020a).
2.1.5 RAQMS
The Real-time Air Quality Modeling System (RAQMS) chemical reanalysis (Pierce et al., 2009; Bruckner et al., 2024) uses satellite trace gas and aerosol retrievals from the NASA satellites (Terra, Aqua, and Aura) covering 2006 through 2016.
The assimilated retrievals were obtained from the Aura Ozone Monitoring Instrument (OMI) cloud-cleared total column ozone (McPeters et al., 2008), Microwave Limb Sounder (MLS) (Froidevaux et al., 2008) stratospheric ozone profiles, OMI tropospheric column NO2 (Boersma et al., 2007), Terra and Aqua Moderate Resolution Imaging Spectrometer (MODIS) aerosol optical depth (AOD) (Remer et al., 2005), and Atmospheric Infrared Sounder (AIRS) carbon monoxide (Yurganov et al., 2008).
RAQMS chemical reanalysis has a horizontal resolution of 1 ° × 1° and uses the operational grid point statistical interpolation (GSI) 3-D variational analysis system (Wu et al., 2002) at 3 h intervals for the assimilation. Analysis increments from the OMI tropospheric column NO2 assimilation were used for offline adjustment, following an offline mass balance approach similar to East et al. (2022).
The CTM used in the reanalysis was RAQMS. The dynamical core of RAQMS is the UW hybrid model (Schaack et al., 2004). RAQMS-Aura meteorological predictions were initialized at 6 h intervals with archived analyses from the National Centers for Environmental Prediction (NCEP) Global Data Assimilation System (GDAS) (Kleist et al., 2009).
The a priori emissions were taken from the 2010 Hemispheric Transport of Air Pollution (HTAP, 2010) anthropogenic emission inventories. RAQMS biomass-burning emissions used Terra and Aqua MODIS fire detections, following Soja et al. (2004).
2.2 Observing system experiments (OSEs)
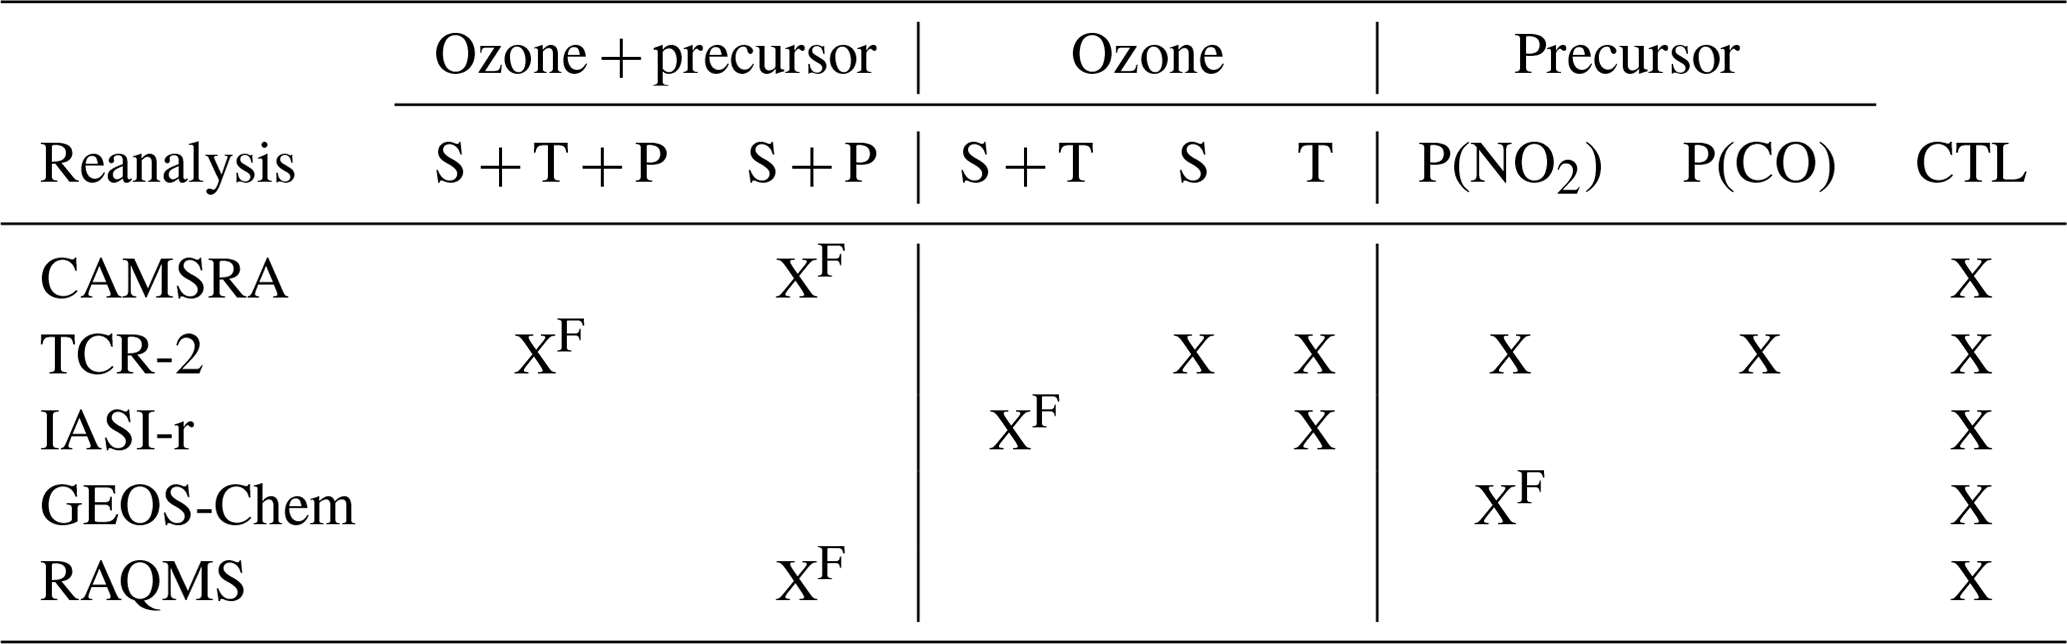
The assimilated measurements were largely different among the systems, which increased the difficulty of implementing common OSE settings. The categorization of the assimilated measurements can be simplified into three groups: stratospheric ozone (S), including total ozone column retrievals derived from backscatter ultraviolet (UV) instruments and ozone profile retrievals using microwave instruments; tropospheric ozone (T), consisting of ozone profiles obtained from infrared (IR) instruments; and ozone precursors (P), including tropospheric NO2 column retrievals from UV/visible sensors and total CO column and profile retrievals derived from infrared (IR) instruments. As summarized in Table 2, five chemical reanalysis datasets and additional OSEs were divided into the following three types: (1) simultaneous assimilation of ozone and its precursors (S + T + P and S + P), (2) direct ozone assimilation (S + T, S, and T), and (3) assimilation of ozone precursor gases such as NO2 and CO (P). We also performed OSEs using the TCR-2 and IASI-r chemical reanalysis systems, including four TCR-2 OSEs that assimilated MLS stratospheric ozone and HNO3 profiles (hereinafter TCR-2-S; type 2), namely TES tropospheric ozone profile (TCR-2-T; type 2), OMI, SCIAMACHY, GOME-2 NO2 (TCR-2-P_NO2; type 3), and MOPITT CO (TCR-2-P_CO, type 3), as well as an IASI-r OSE for the IASI L1 radiance sensitive to tropospheric ozone profile (IASI-r-T; type 2).
Table 2List of experiments used in this study. S, T, and P represent the assimilation of satellite observations of stratospheric and tropospheric ozone and its precursors, respectively. CTL represents the control simulations without any data assimilation. XF denotes the assimilation of full set of observations for each system.
2.3 Validation data
2.3.1 OMI–MLS satellite observations
For the validation, we used global distributions of the tropospheric ozone column (TOC) derived from OMI–MLS (Ziemke et al., 2006), which is a relatively independent data product that was not used in three of the chemical reanalysis systems (although both the OMI total ozone column and MLS ozone profiles were assimilated in CAMSRA and RAQMS) and covers the period when all the reanalysis datasets and control simulations were available. The TOC from OMI–MLS was produced using the tropospheric ozone residual method, which subtracted the MLS stratospheric ozone column from the OMI total ozone column. The OMI–MLS TOC was derived using tropopause pressure determined from NCEP analyses with the 2 K km−1 vertical temperature gradient criterion of the World Meteorological Organization (WMO). The 1σ precision for the monthly mean TOC was estimated to be approximately 1.3 DU (Ziemke et al., 2019). For comparison with the OMI–MLS TOC, the same tropopause data from NCEP analyses were applied to the chemical reanalysis products.
2.3.2 Ozonesonde observations
The vertical profiles of the ozone analyses were validated against independent ozonesonde observations obtained from the World Ozone and Ultraviolet Radiation Data Centre (WOUDC; http://www.woudc.org, last access: 22 March 2024). The measurement precision was better than 5 %, and the accuracy was within 5 %–10 % (Smit et al., 2007). We used 261 profiles for the northern high latitudes (60–90° N), 1284 profiles for the northern mid-latitudes (30–60° N), 349 profiles for the tropics (30° N–30° s), 123 profiles for the southern mid-latitudes (30–60° S), and 196 profiles for the southern high latitudes (60–90° S) from 2010. The observed and analyzed vertical profiles were compared at ozonesonde locations in the 29 vertical pressure bins from 1013.25 to 70 hPa. The validation was conducted against ozonesonde observations collected for five latitude bands to evaluate the global reanalysis performance in a manner that reflects regional characteristics. This approach was chosen instead of evaluating reanalysis performance at individual observation sites, which can be influenced by sparse temporal sampling, limited spatial coverage, and the influence of local processes. Aggregating individual ozonesonde sites with similar characteristics provides a more representative view of larger regions, as demonstrated by Tilmes et al. (2012). However, we acknowledge that the number of observations within each latitudinal band may not always be sufficient to fully capture regionally representative model performance (Miyazaki and Bowman, 2017) or to accurately evaluate long-term trends (Chang et al., 2024).
2.3.3 Surface in situ observations
The TOAR global surface ozone database (Schultz et al., 2017a, b) for 2010 was used to evaluate the surface ozone analyses. A globally consistent TOAR database was constructed by combining almost 10 000 sites, characterizing the measurement sites, and applying consistent quality control. The total uncertainty in modern ozone measurements (1990–2014) at a mean level of 30 nmol mol−1 was estimated at < 2 nmol mol−1 (Tarasick et al., 2019). The TOAR database provides annual, seasonal, and monthly statistics for urban and rural sites. All the reanalysis systems have relatively coarse horizontal resolutions; therefore, they cannot resolve ozone variability in urban areas. Thus, we used 2° × 2° monthly mean ozone concentrations at the rural sites in 2010. For comparison, ozone analysis fields in CAMSRA and TCR-2 were regridded from their original model grid points onto a 2° × 2° grid using inverse-distance weighting, while those in GEOS-Chem and RAQMS were regridded using bilinear interpolation.
3.1 Data assimilation impacts
Figure 1 presents the vertical and latitudinal distributions of annual mean ozone concentrations obtained from the chemical reanalysis products, control runs, and their differences for 2010. Large discrepancies in ozone concentrations between different models were found in the lower stratosphere and troposphere, with the standard deviations of 27 % in the global mean in the upper troposphere and lower stratosphere (UTLS; 70–250 hPa), 8 % in the middle troposphere (400–600 hPa), and 9 % in the lower troposphere (below 800 hPa).
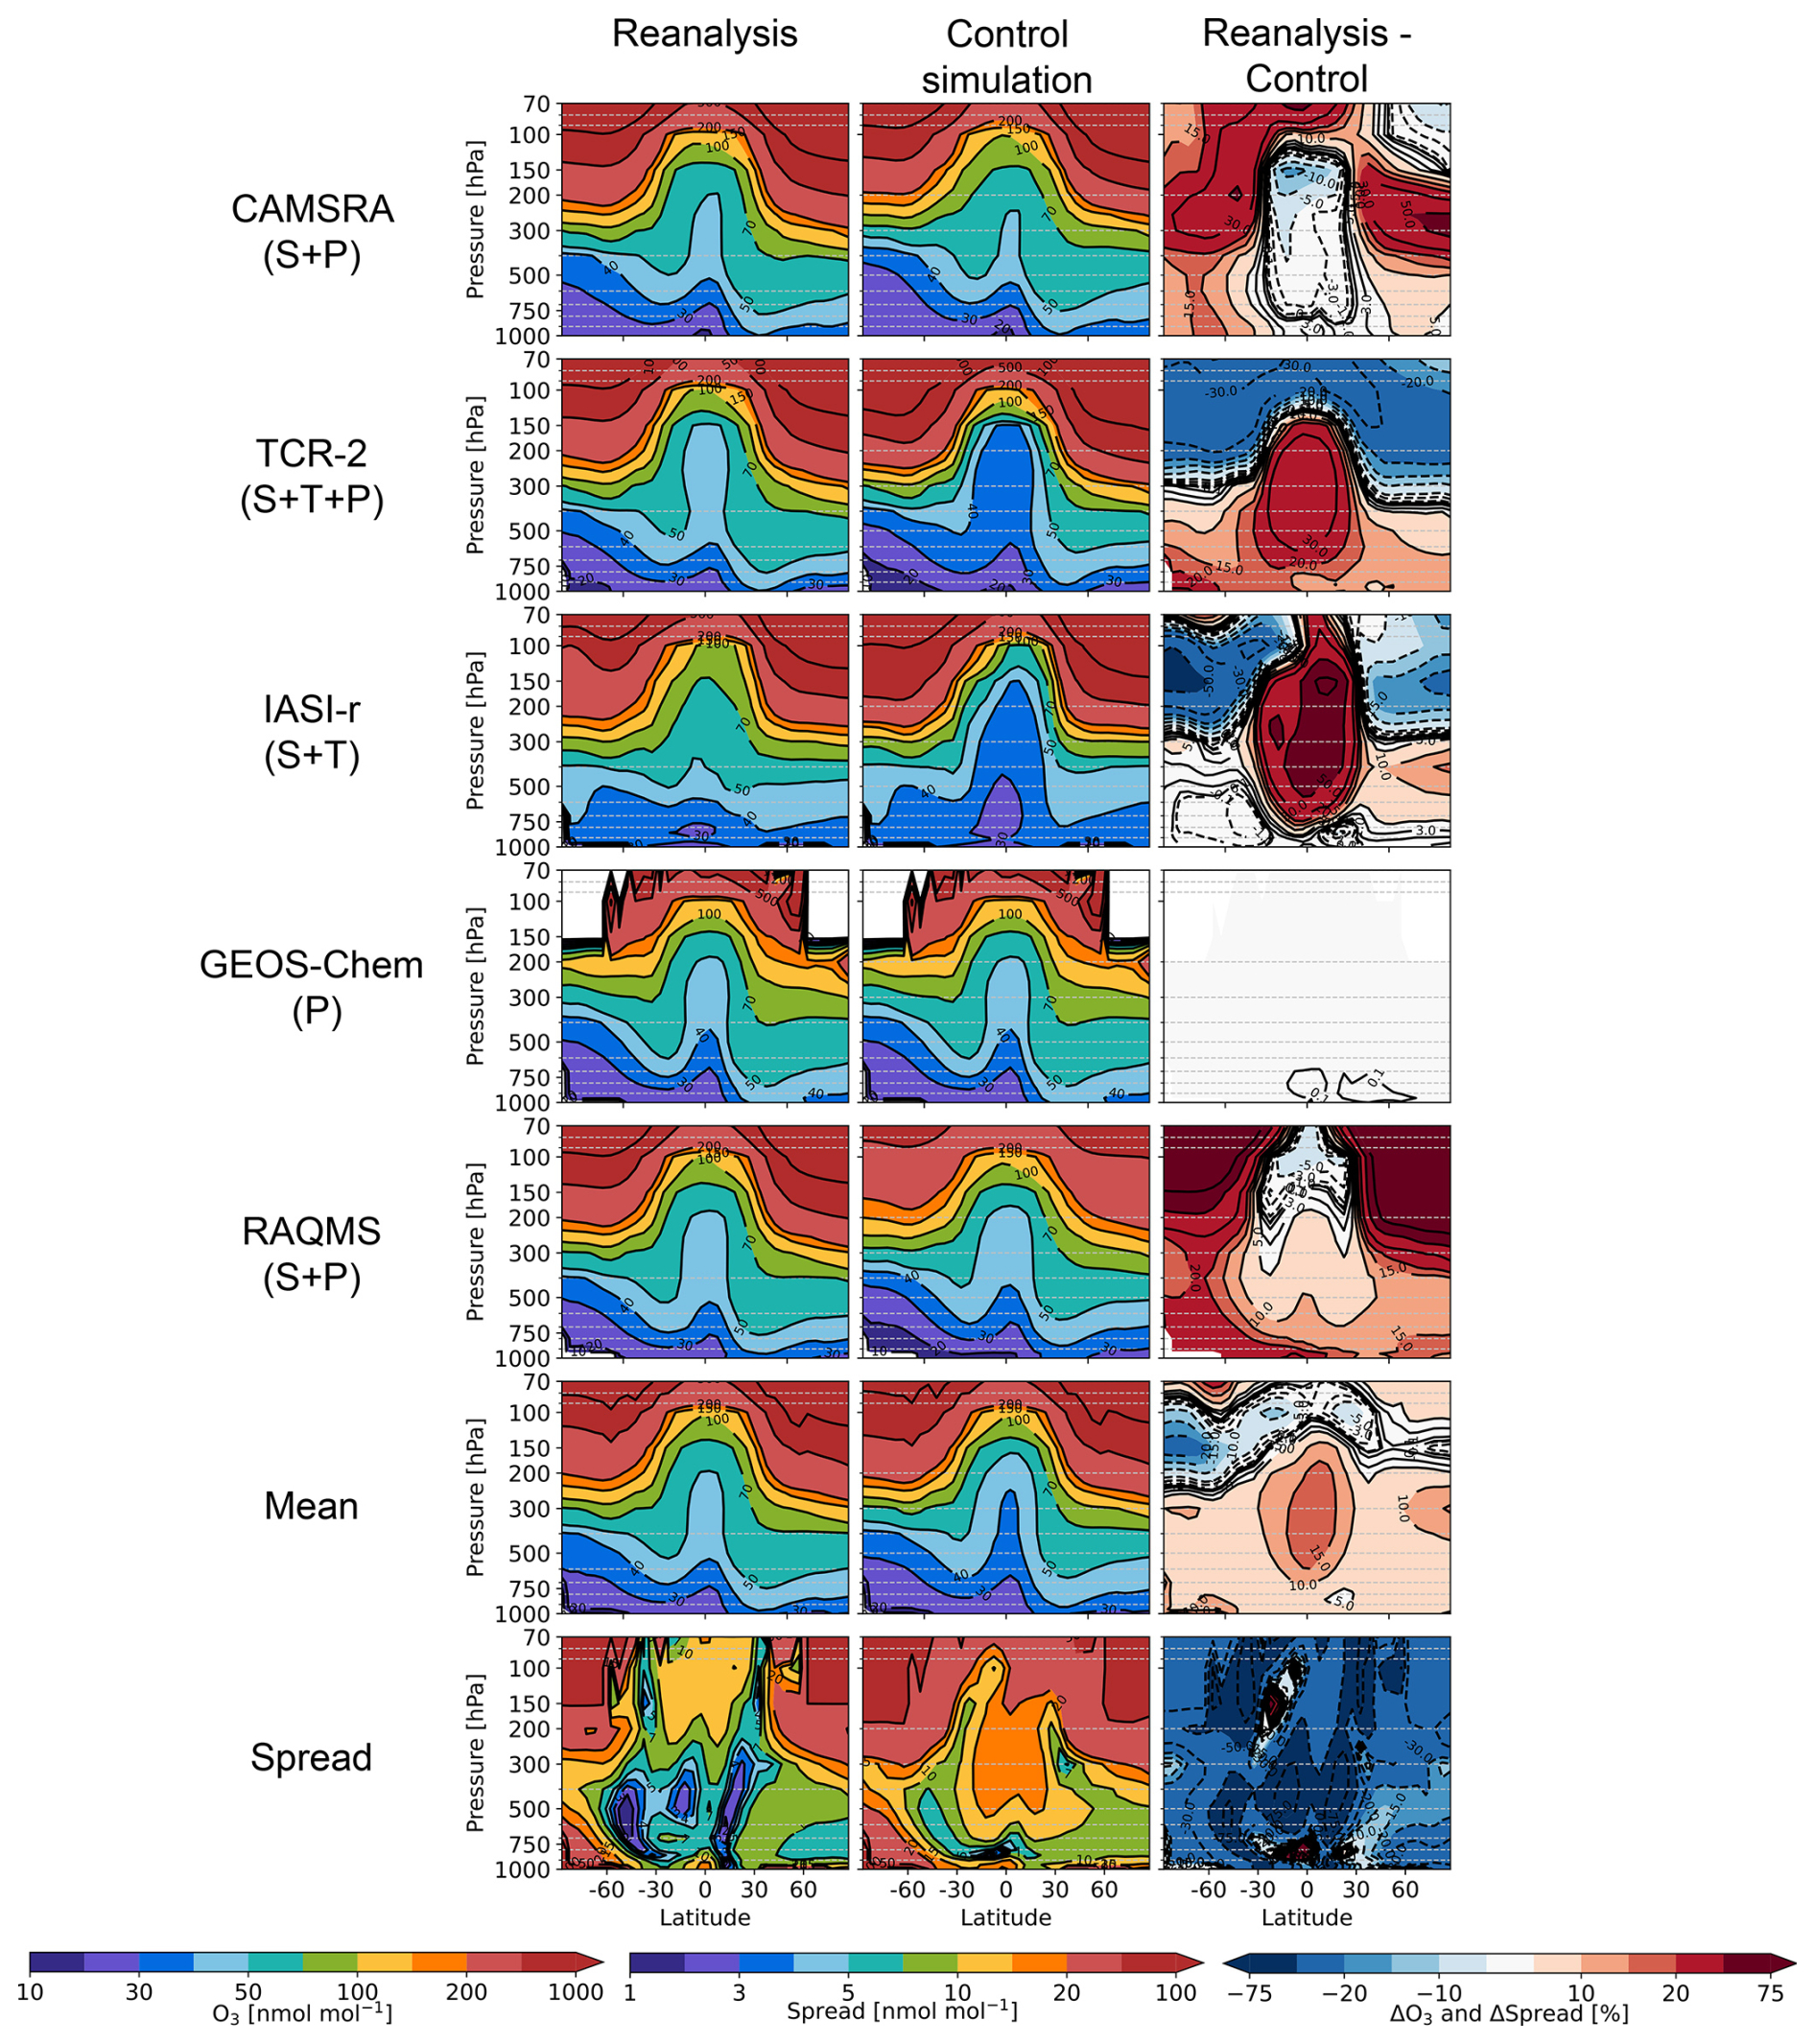
Figure 1Latitude-pressure-level cross sections of annual mean tropospheric ozone concentrations obtained from reanalysis products (left), control simulations (middle), and their differences (right) in 2010. The first through fifth rows present data from CAMSRA, TCR-2, IASI-r (MOCAGE), GEOS-Chem adjoint, and RAQMS Aura reanalysis, while the sixth and seventh rows present multi-system average and spread normalized by the mean system average data, respectively. The difference in the multi-system spread is defined as (SD(reanalysis) – SD(control))/SD(control) × 100, where SD represents the standard deviation. The units of ozone concentrations and the differences between reanalysis products and control simulations are the mole fraction in air (nmol mol−1) and percentage (%), respectively. The unit of the multi-system spread is also percentage (%).
Data assimilation increased the annual mean ozone concentrations in the UTLS in 2010 by 10 %–40 % in CAMSRA and by more than 100 % in RAQMS, except in the tropics, and it decreased the concentrations by 5 %–30 % in TCR-2 and IASI-r. In the middle troposphere, data assimilation increased the global mean ozone in all the reanalysis products in most cases, with larger increases in TCR-2, IASI-r, and RAQMS (by 15 %–50 %) than in CAMSRA (by up to 5 %). This discrepancy reflects the large inter-system differences in assimilation increments over the tropics. In the lower troposphere, data assimilation increased the ozone concentration by 5 %–30 % in CAMSRA, TCR-2, and RAQMS, whereas it only had minor impacts (< 5 %) in IASI-r. Data assimilation in GEOS-Chem adjoint has a minimal impact on free-tropospheric ozone compared to the other systems. Data assimilation also improved the consistency in ozone concentrations among the multiple systems, with the standard deviation of the global mean ozone between different reanalysis systems reduced to 3.2 % in the UTLS, 1.7 % in the middle troposphere, and 2.5 % in the lower troposphere.
Similar reductions in the multi-model spread were observed for near-surface ozone (Fig. 2). The standard deviations of the control runs were 22 %, 11 %, and 14 % for the southern extratropics (25–90° S), the tropics (25° N–25° S), and the northern extratropics (25–90° N), respectively. Data assimilation increased the near-surface annual mean ozone by 2–8 nmol mol−1 in CAMSRA, TCR-2, and RAQMS. The impact of assimilation on surface ozone was small in the IASI-r and GEOS-Chem. Data assimilation reduced the standard deviation of ozone analyses between the reanalysis systems to 14 %, 6 %, and 11 % over the southern extratropics, tropics, and northern extratropics, respectively.
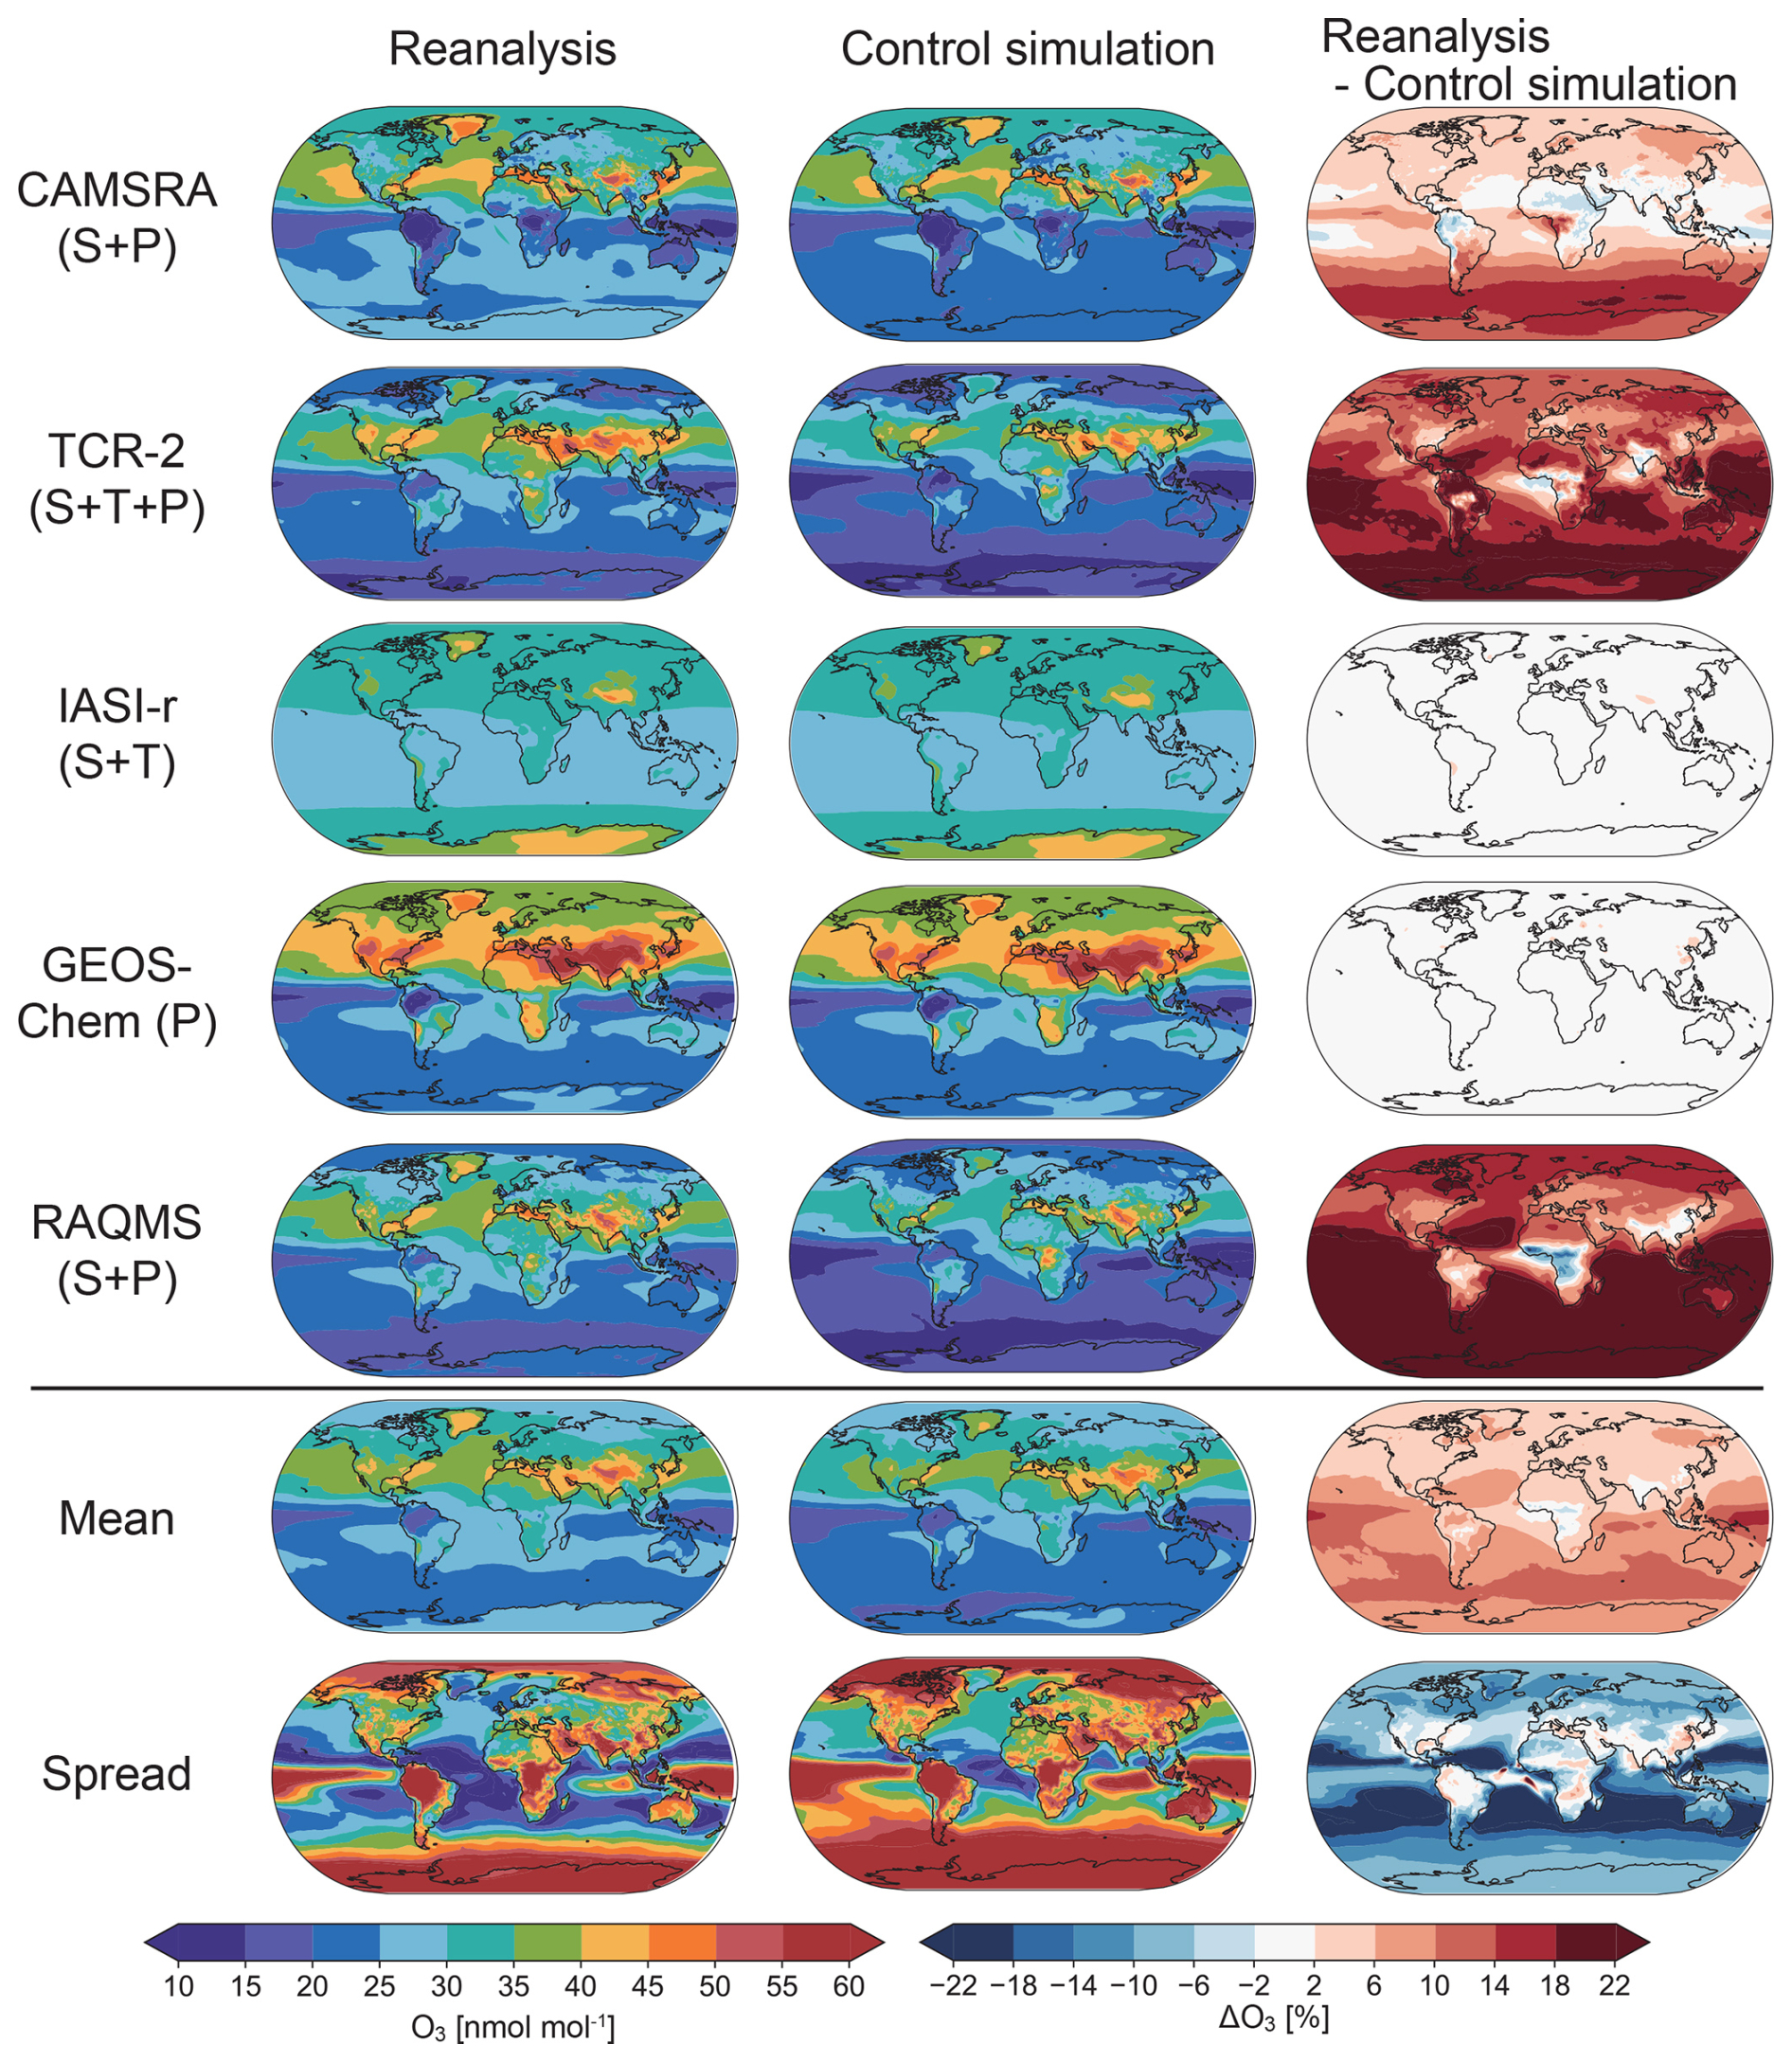
Figure 2Global distribution of annual mean surface ozone concentrations obtained from the reanalysis products (left), control simulations (middle), and their differences (right) in 2010. The first through fifth rows represent data from CAMSRA, TCR-2, IASI-r, GEOS-Chem adjoint, and RAQMS Aura reanalysis, while the sixth and seventh columns present multi-system average and spread normalized by the mean system average data, respectively. The difference in the multi-system spread is defined as (SD(reanalysis) – SD(control))/SD(control) × 100, where SD represents the standard deviation. The units of ozone concentrations and the differences between reanalysis products and control simulations are the mole fraction in air (nmol mol−1) and percentage (%), respectively. The unit of multi-system spread is also percentage (%).
3.2 Validation using independent observations
3.2.1 OMI–MLS satellite observations
Figure 3 compares the TOC between the chemical reanalysis products and control runs with OMI–MLS TOC observations. All the control runs captured the observed general features. However, the CAMSRA and GEOS-Chem control runs underestimated the TOC near 60° N and 60° S by up to 10 DU and overestimated the TOC from the tropics to the subtropics in both hemispheres by 5–10 DU. In contrast, the TCR-2 control run overestimated the TOC over the northern mid-latitudes by approximately 5 DU, and the IASI-r control run overestimated the TOC over the southern mid-latitudes by 2–4 DU, whereas both models underestimated the TOC over the tropics and subtropics by 5–15 DU. The RAQMS control run overestimated the TOC over the tropical land areas and the Atlantic by approximately 5 DU and underestimated the TOC over the Pacific and the Southern oceans by up to 10 DU. The spatial correlation coefficients of the observed vs. simulated TOC ranged from 0.69 to 0.89.
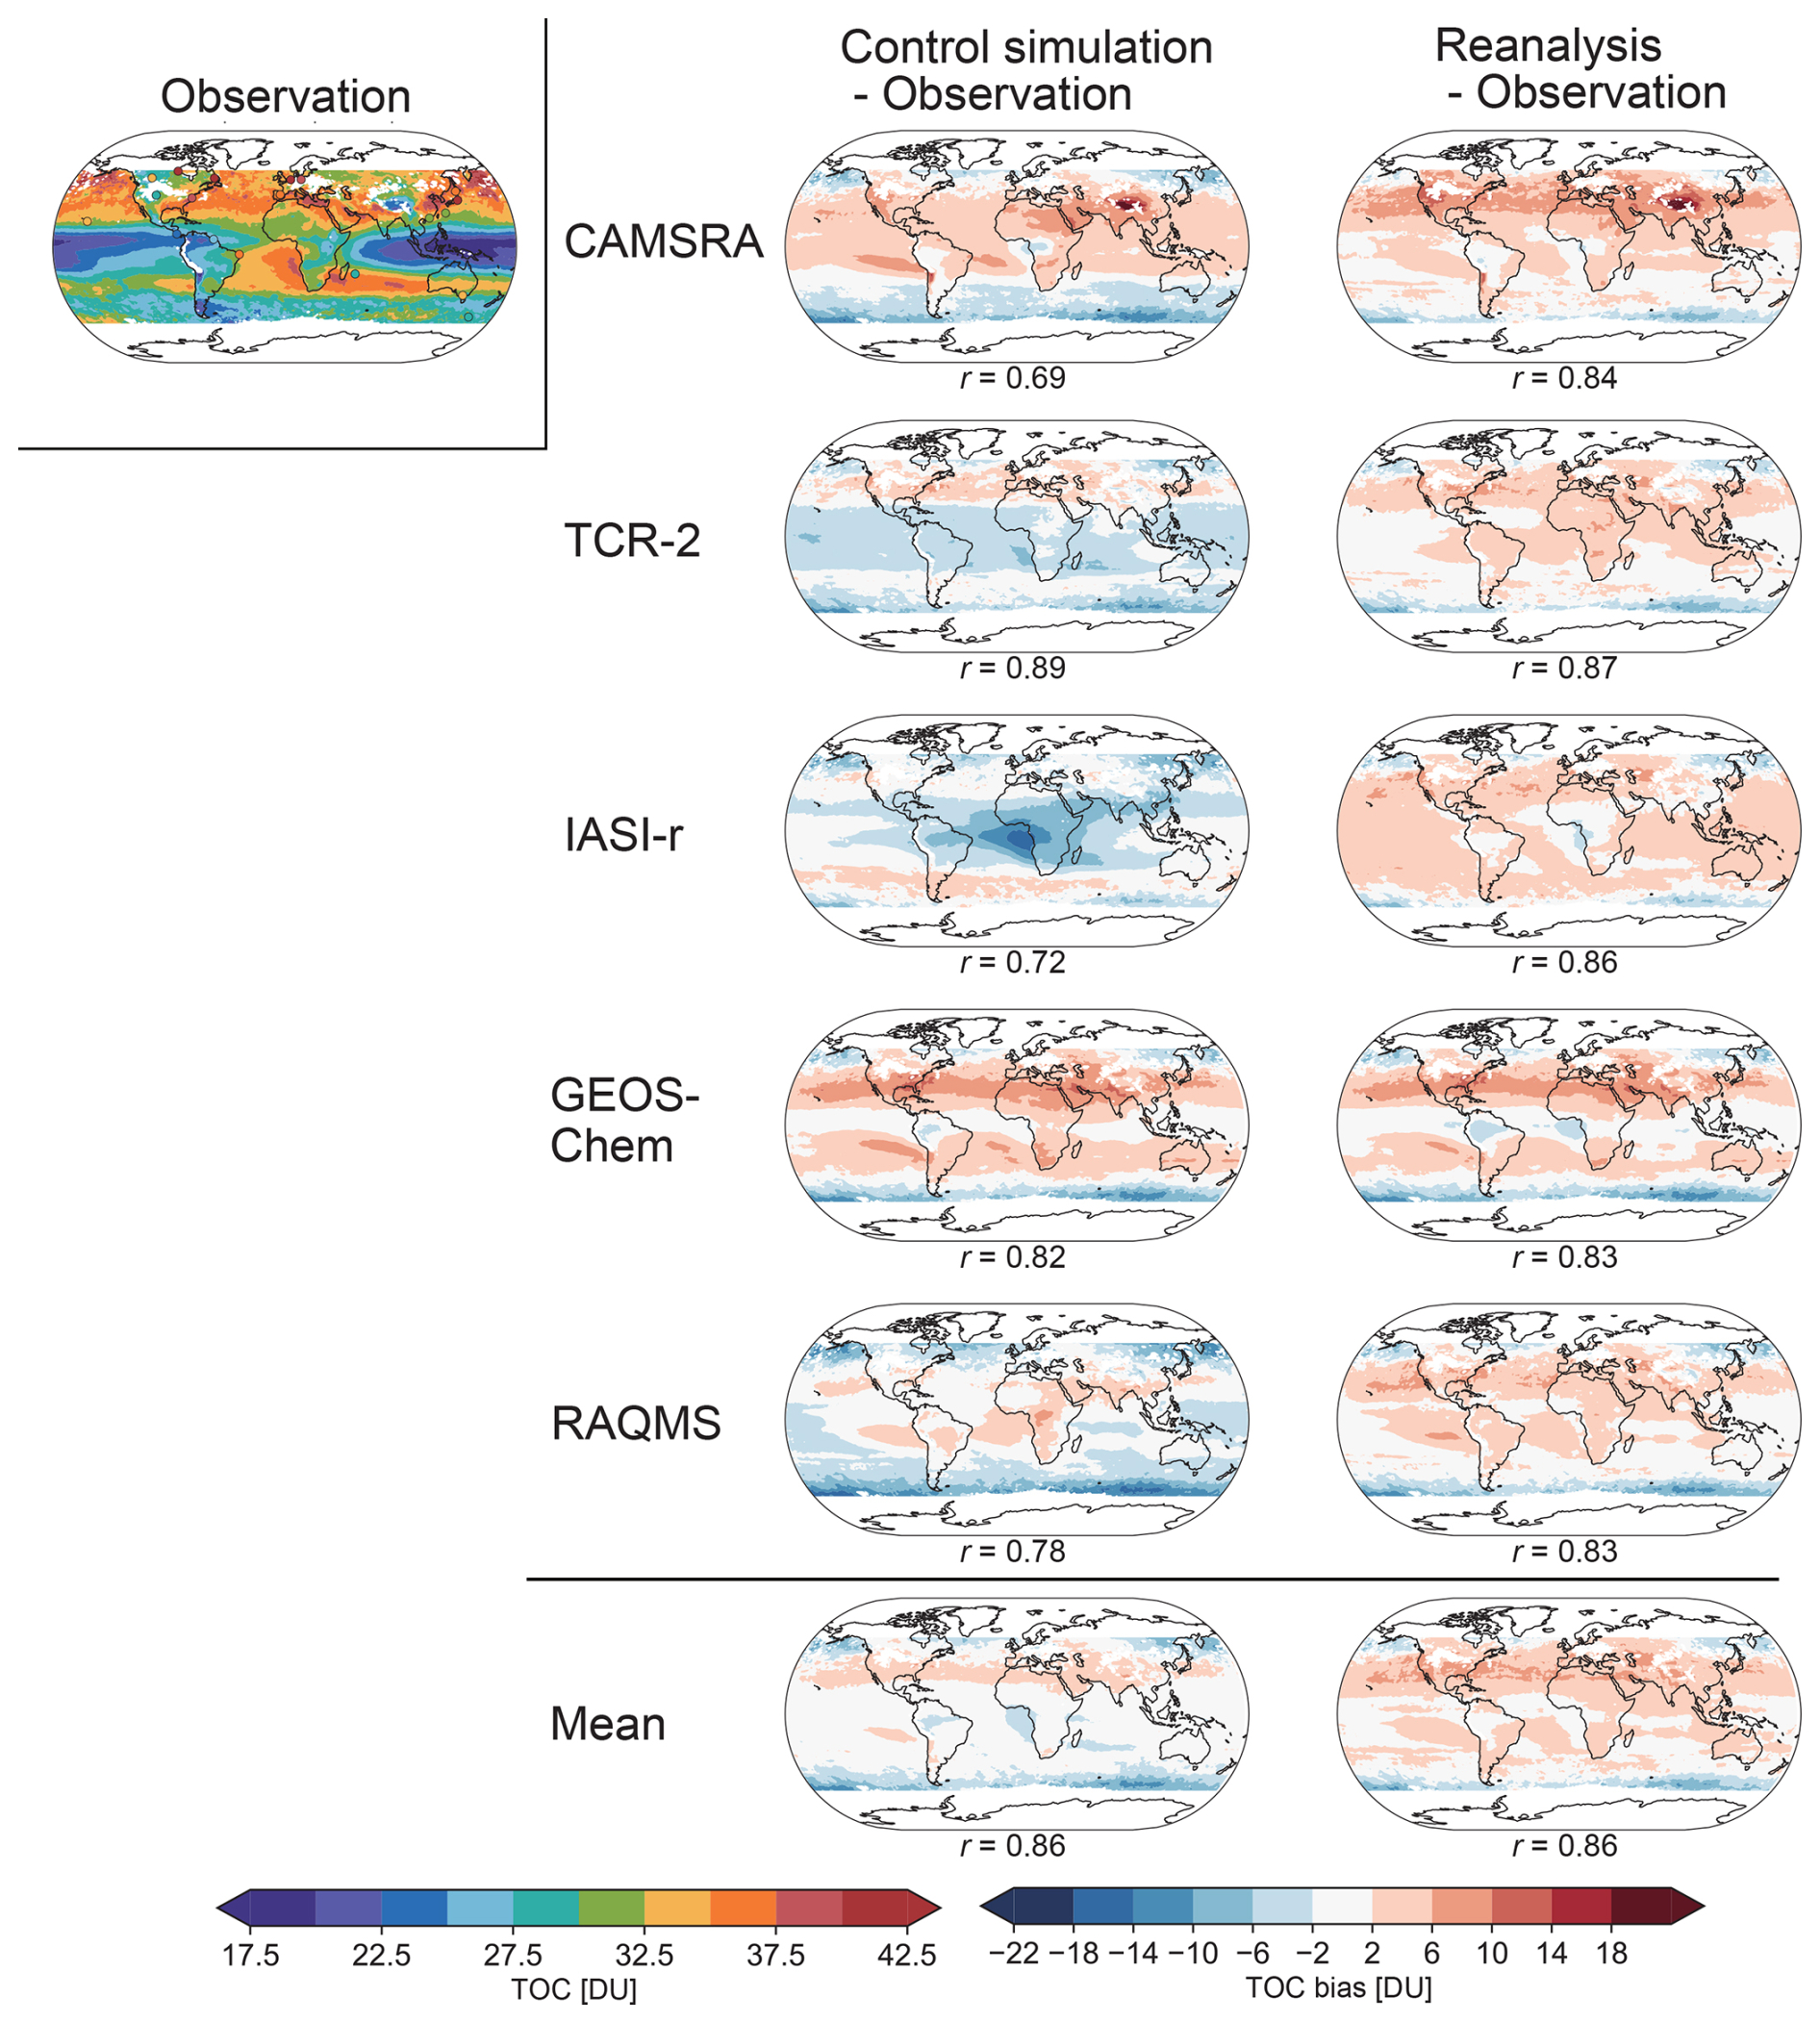
Figure 3Global distributions of tropospheric ozone column (TOC) derived from the OMI–MLS observations with ozonesonde measurements (first column) and mean bias of the CAMSRA (first row), TCR-2 (second row), IASI-r (third row), the GEOS-Chem adjoint (fourth row), the RAQMS Aura reanalysis (fifth row), and the multi-system mean bias (sixth row) relative to OMI–MLS. Second and third columns are the control simulations and reanalysis products, respectively. We used ozonesonde measurements at the sites with a more-than-once-per-month sampling frequency. The unit is the Dobson unit (DU). The spatial correlation coefficient (r) between OMI–MLS and the reanalysis/control simulation is also shown below the map.
After data assimilation, all chemical reanalysis products consistently revealed positive biases of 5–10 DU relative to OMI–MLS from the tropics to the mid-latitudes of both hemispheres. However, this result is inconsistent with the reanalysis comparison results against ozonesonde measurements (see Sect. 3.2.2). Considering ozonesonde measurements as ground truth, part of the positive bias relative to OMI–MLS can be attributed to smaller TOC in the OMI–MLS data (by 3.7 DU on average) compared to ozonesonde observations, as confirmed in Fig. 3 and reported by Gaudel et al. (2024). Data assimilation improved the spatial correlation coefficients to > 0.83 for all systems, demonstrating the usefulness of the reanalysis products and the value of the OMI–MLS data for the evaluation of TOC spatial distributions. The remaining discrepancies underscore the challenges in improving tropospheric ozone analyses through the assimilation of precursors, stratospheric profiles, or column ozone measurements. This could be related to model errors near the surface (e.g., excessive chemical production of ozone from precursors) and positive biases in the assimilated tropospheric ozone retrievals (Boxe et al., 2010) in the TCR-2 in which tropospheric ozone profiles were assimilated. Vertical resolution of the compared data differed largely around the tropopause (i.e., MLS resolution of 2–3 km and model resolution of ≤ 1 km), which can affect the computation of TOC when a sharp ozone gradient occurs and may lead to discrepancy in the comparison (Schoeberl et al., 2007).
3.2.2 Ozonesondes
Figure 4 presents the vertical distributions of mean biases and root mean square errors (RMSEs) for the reanalysis products and control runs relative to ozonesonde observations over five latitude bands in 2010. As summarized in Table 3, in the UTLS (70–250 hPa), large positive and negative ozone biases in the control runs varied among the models over all the latitude bands. As shown in Figs. 5 and S1 in the Supplement, over the northern mid- and high latitudes, RAQMS showed larger seasonal amplitudes in model bias, with a maximum in boreal spring, compared with the other forecast models. Over the southern mid- and high latitudes, CAMS and RAQMS showed larger negative biases in austral summer and fall compared to other models, while TCR-2 and IASI-r exhibited maximum positive biases in austral spring. The multi-model average RMSE against ozonesonde observations was 55 ± 17 % globally (44 %–61 % for the five latitude bands).
Table 3Mean bias (MB) ranges between different systems and the root mean square error (RMSE) multi-system mean and spread for the reanalysis [control simulation in the square brackets] against ozonesonde observations in the upper troposphere (UTLS), middle troposphere (MT), and lower troposphere (LT) over five latitude bands. The unit is percentage (%).
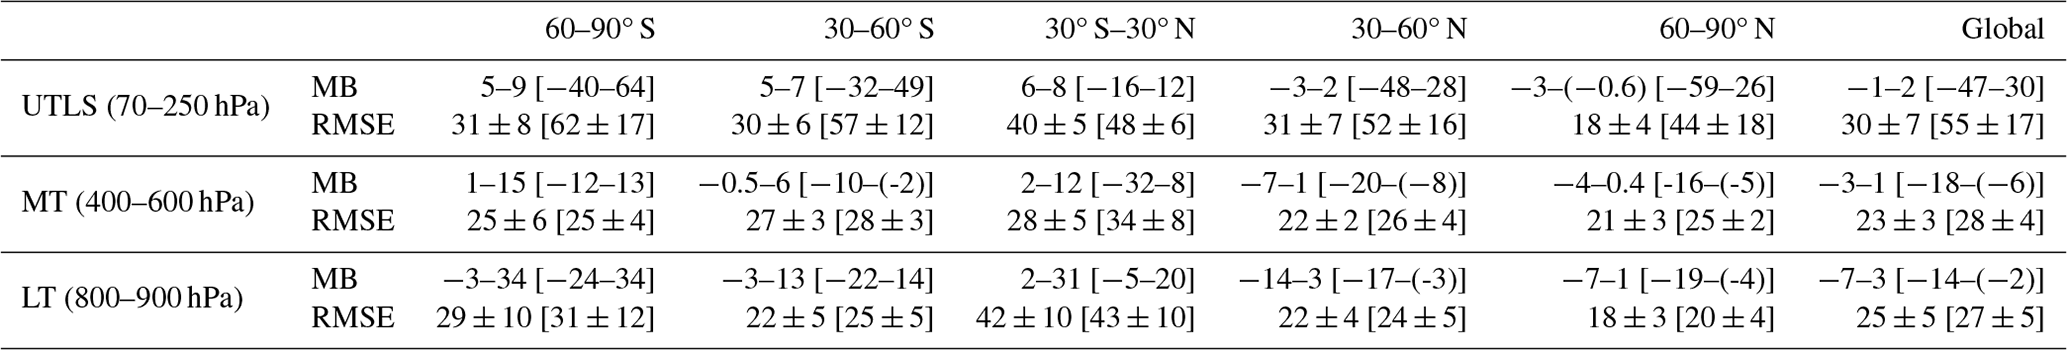
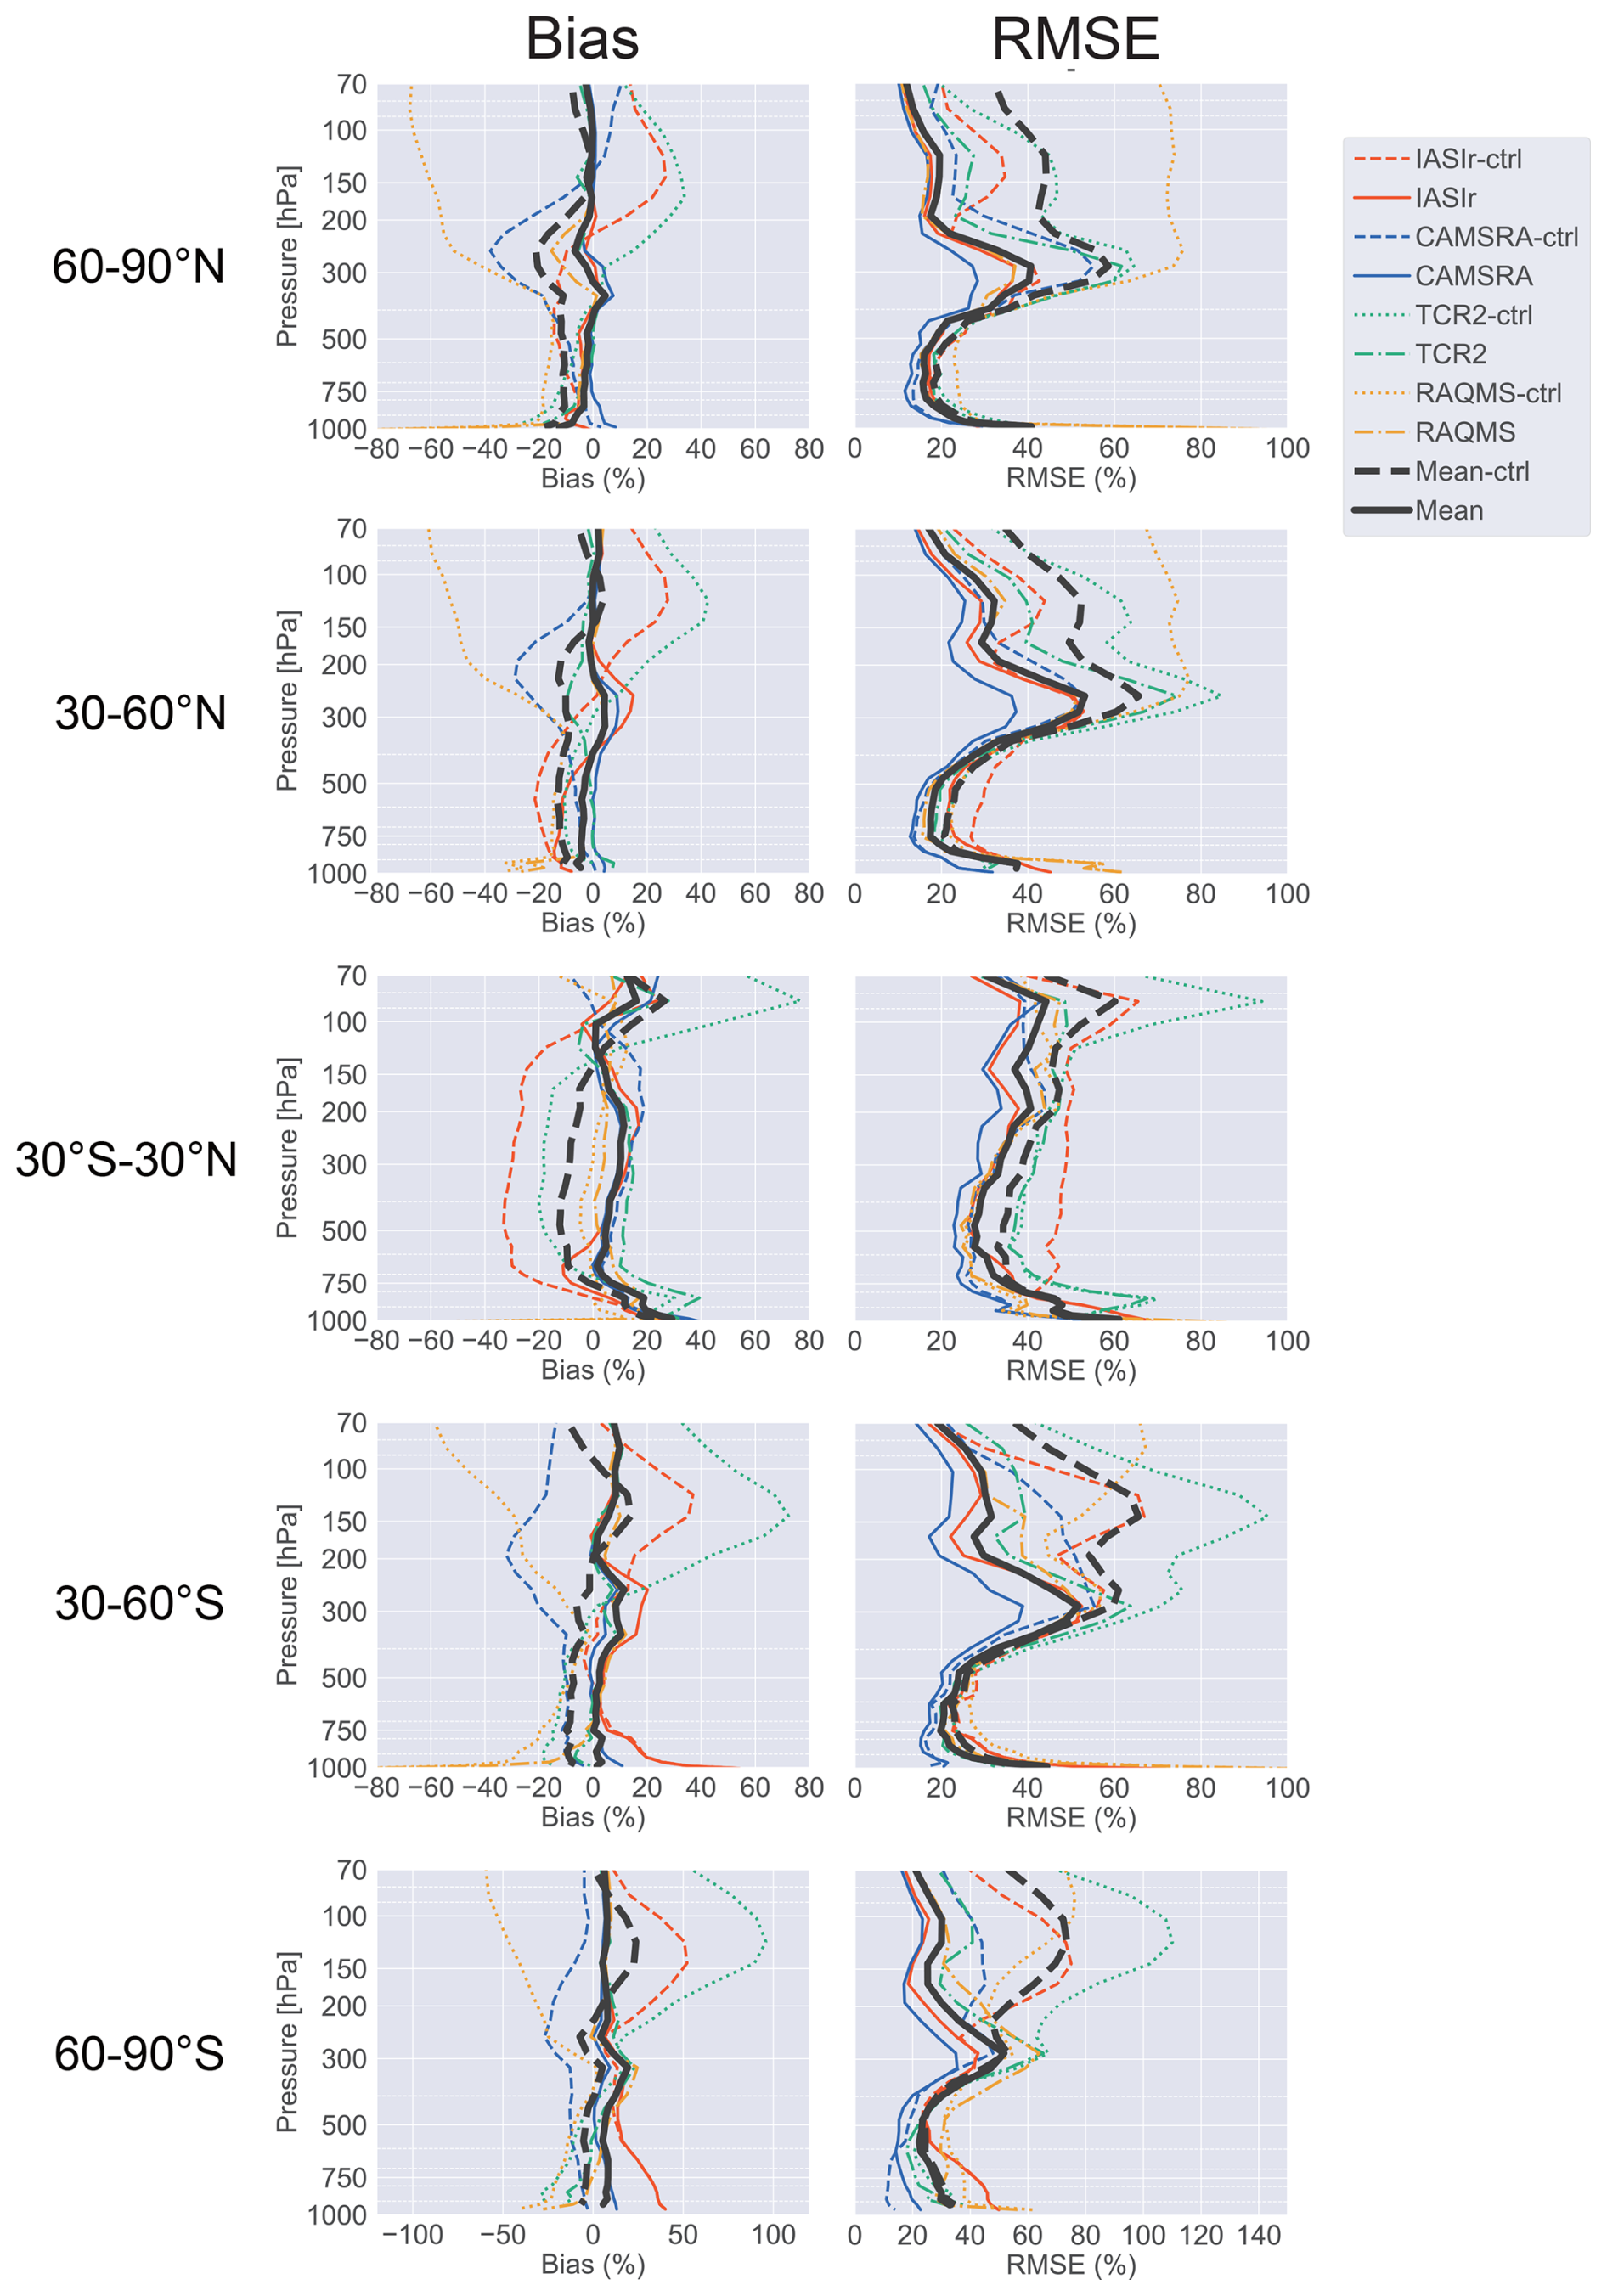
Figure 4Vertical profiles of bias (left) and RMSE (right) for the reanalysis products and the control simulations compared to ozonesonde observations in 2010. The first through fifth rows present the northern high latitudes (60–90° N), the northern mid-latitudes (30–60° N), the tropics (30° N–30° S), the southern mid-latitudes (30–60° S), and the southern high latitudes (60–90° S). The blue line indicates CAMSRA, the red line indicates IASI-r, the green line indicates TCR-2, the orange line indicates the RAQMS Aura reanalysis, and the black line indicates multi-system averages. The solid and dashed–dotted lines indicate the reanalysis products, while the dashed and dotted lines indicate the control simulations. The unit is percentage (%).
Figure 5Monthly time series of bias for the reanalysis products and the control simulations compared to ozonesonde observations in 2010. The first through fifth rows present the northern high latitudes (60–90° N), the northern mid-latitudes (30–60° N), the tropics (30° N–30° S), the southern mid-latitudes (30–60° S), and the southern high latitudes (60–90° S) The first through third columns are the upper troposphere and lower stratosphere (70–250 hPa), middle troposphere (400–600 hPa), and lower troposphere (800–900 hPa), respectively. The blue line indicates CAMSRA, red line indicates IASI-r, green line indicates TCR-2, orange line indicates the RAQMS Aura reanalysis, and black line indicates multi-system averages. The solid and dashed-dotted lines indicate the reanalysis products, while the dashed and dotted lines indicate the control simulations. The unit is percentage (%).
In the middle troposphere (400–600 hPa), the model biases in the control runs were negative over the southern mid-latitudes and the northern mid-latitudes and high latitudes, whereas the biases varied among the models over the southern high latitudes and the tropics. The seasonal variations in model biases were approximately 20 % larger in IASI-r compared to the other models. IASI-r showed maximum negative biases over the northern mid-latitudes and maximum positive biases over the southern high latitudes during summer. Moreover, the multi-model average RMSE was 28 ± 4 % (25 %–34 % between the different latitude bands).
In the lower troposphere (800–900 hPa), model biases in the control runs differed between models over the southern mid-latitudes, high latitudes, and tropics, whereas the model biases were commonly negative over the northern mid-latitudes and high latitudes. IASI-r exhibited larger biases compared to the other models over the mid- and high latitudes in summer in both hemispheres, whereas RAQMS and TCR-2 showed larger negative biases over the mid- and high latitudes in winter in both hemispheres. The RMSE for ozone obtained from the multiple forecast models was 27 ± 5 % (20 %–43 % over the five latitude bands).
Data assimilation reduced the mean biases in the UTLS from −3 % to 9 % over all the latitude bands relative to the control runs. Over the tropics, the mean bias in TCR-2 was increased by 3 %, owing to data assimilation. Nevertheless, large positive and negative biases above and below 150 hPa were largely reduced by data assimilation compared to the control runs in TCR-2. Seasonally dependent biases were also improved by data assimilation over all the latitude bands. Data assimilation decreased the RMSEs of the multi-system mean and spread obtained from the reanalysis systems to 30 ± 7 % relative to the global ozonesonde observations in the UTLS (18 %–40 % over the five latitude bands).
In the middle troposphere, data assimilation increased the mean biases to 5 %–15 % in TCR-2, IASI-r, and RAQMS over the southern high latitudes relative to the control runs, although it decreased the mean biases in CAMSRA to less than 2 %. Data assimilation also reduced the mean biases over the southern mid-latitudes (except for IASI-r), the tropics, and the northern mid-latitudes and high latitudes. The seasonal variations in model biases were also reduced. However, multi-system mean biases in winter remained over the high latitudes in both hemispheres, likely due to the limited number of assimilated observations in these regions during winter. The multi-system mean and spread of the RMSE were also decreased by data assimilation to 23 ± 3 % compared to the control runs over the globe (21 %–28 % over all the latitude bands).
In the lower troposphere, in contrast to the middle troposphere, the mean biases in TCR-2, IASI-r, and RAQMS were reduced by up to 88 % over the southern high latitudes compared to the control runs, while the mean bias in CAMSRA was increased. Over the tropics, data assimilation increased the mean biases by 54 % in TCR-2 and a factor of 4.4 in RAQMS. Over the southern mid-latitudes and northern mid-latitudes and high latitudes, data assimilation decreased the mean biases in all the reanalysis systems. In these regions, the seasonal dependency of model biases was not improved by data assimilation. The multi-system RMSE mean and spread were also reduced to 25 ± 5 % compared to global ozonesonde observations (18 %–42 % over all the latitudes bands).
3.2.3 Surface in situ networks
Figure 6 shows the model biases of the annual mean surface ozone against the TOAR database (Schultz et al., 2017a, b) over the United States, western Europe, and northeastern Asia for 2010. Over the United States, the control runs showed positive biases relative to the TOAR database, ranging from 2.4 to 16.2 nmol mol−1. The spatial correlation coefficients and RMSEs in the control runs were 0.13–0.54 and 5.3–16.7 nmol mol−1 compared to the TOAR database, respectively. After data assimilation, the positive model biases were increased by up to a factor of 2.5. The spatial correlation coefficients were decreased by 0.01–0.05, except for TCR-2, whereas the RMSEs were increased by up to 31 %.
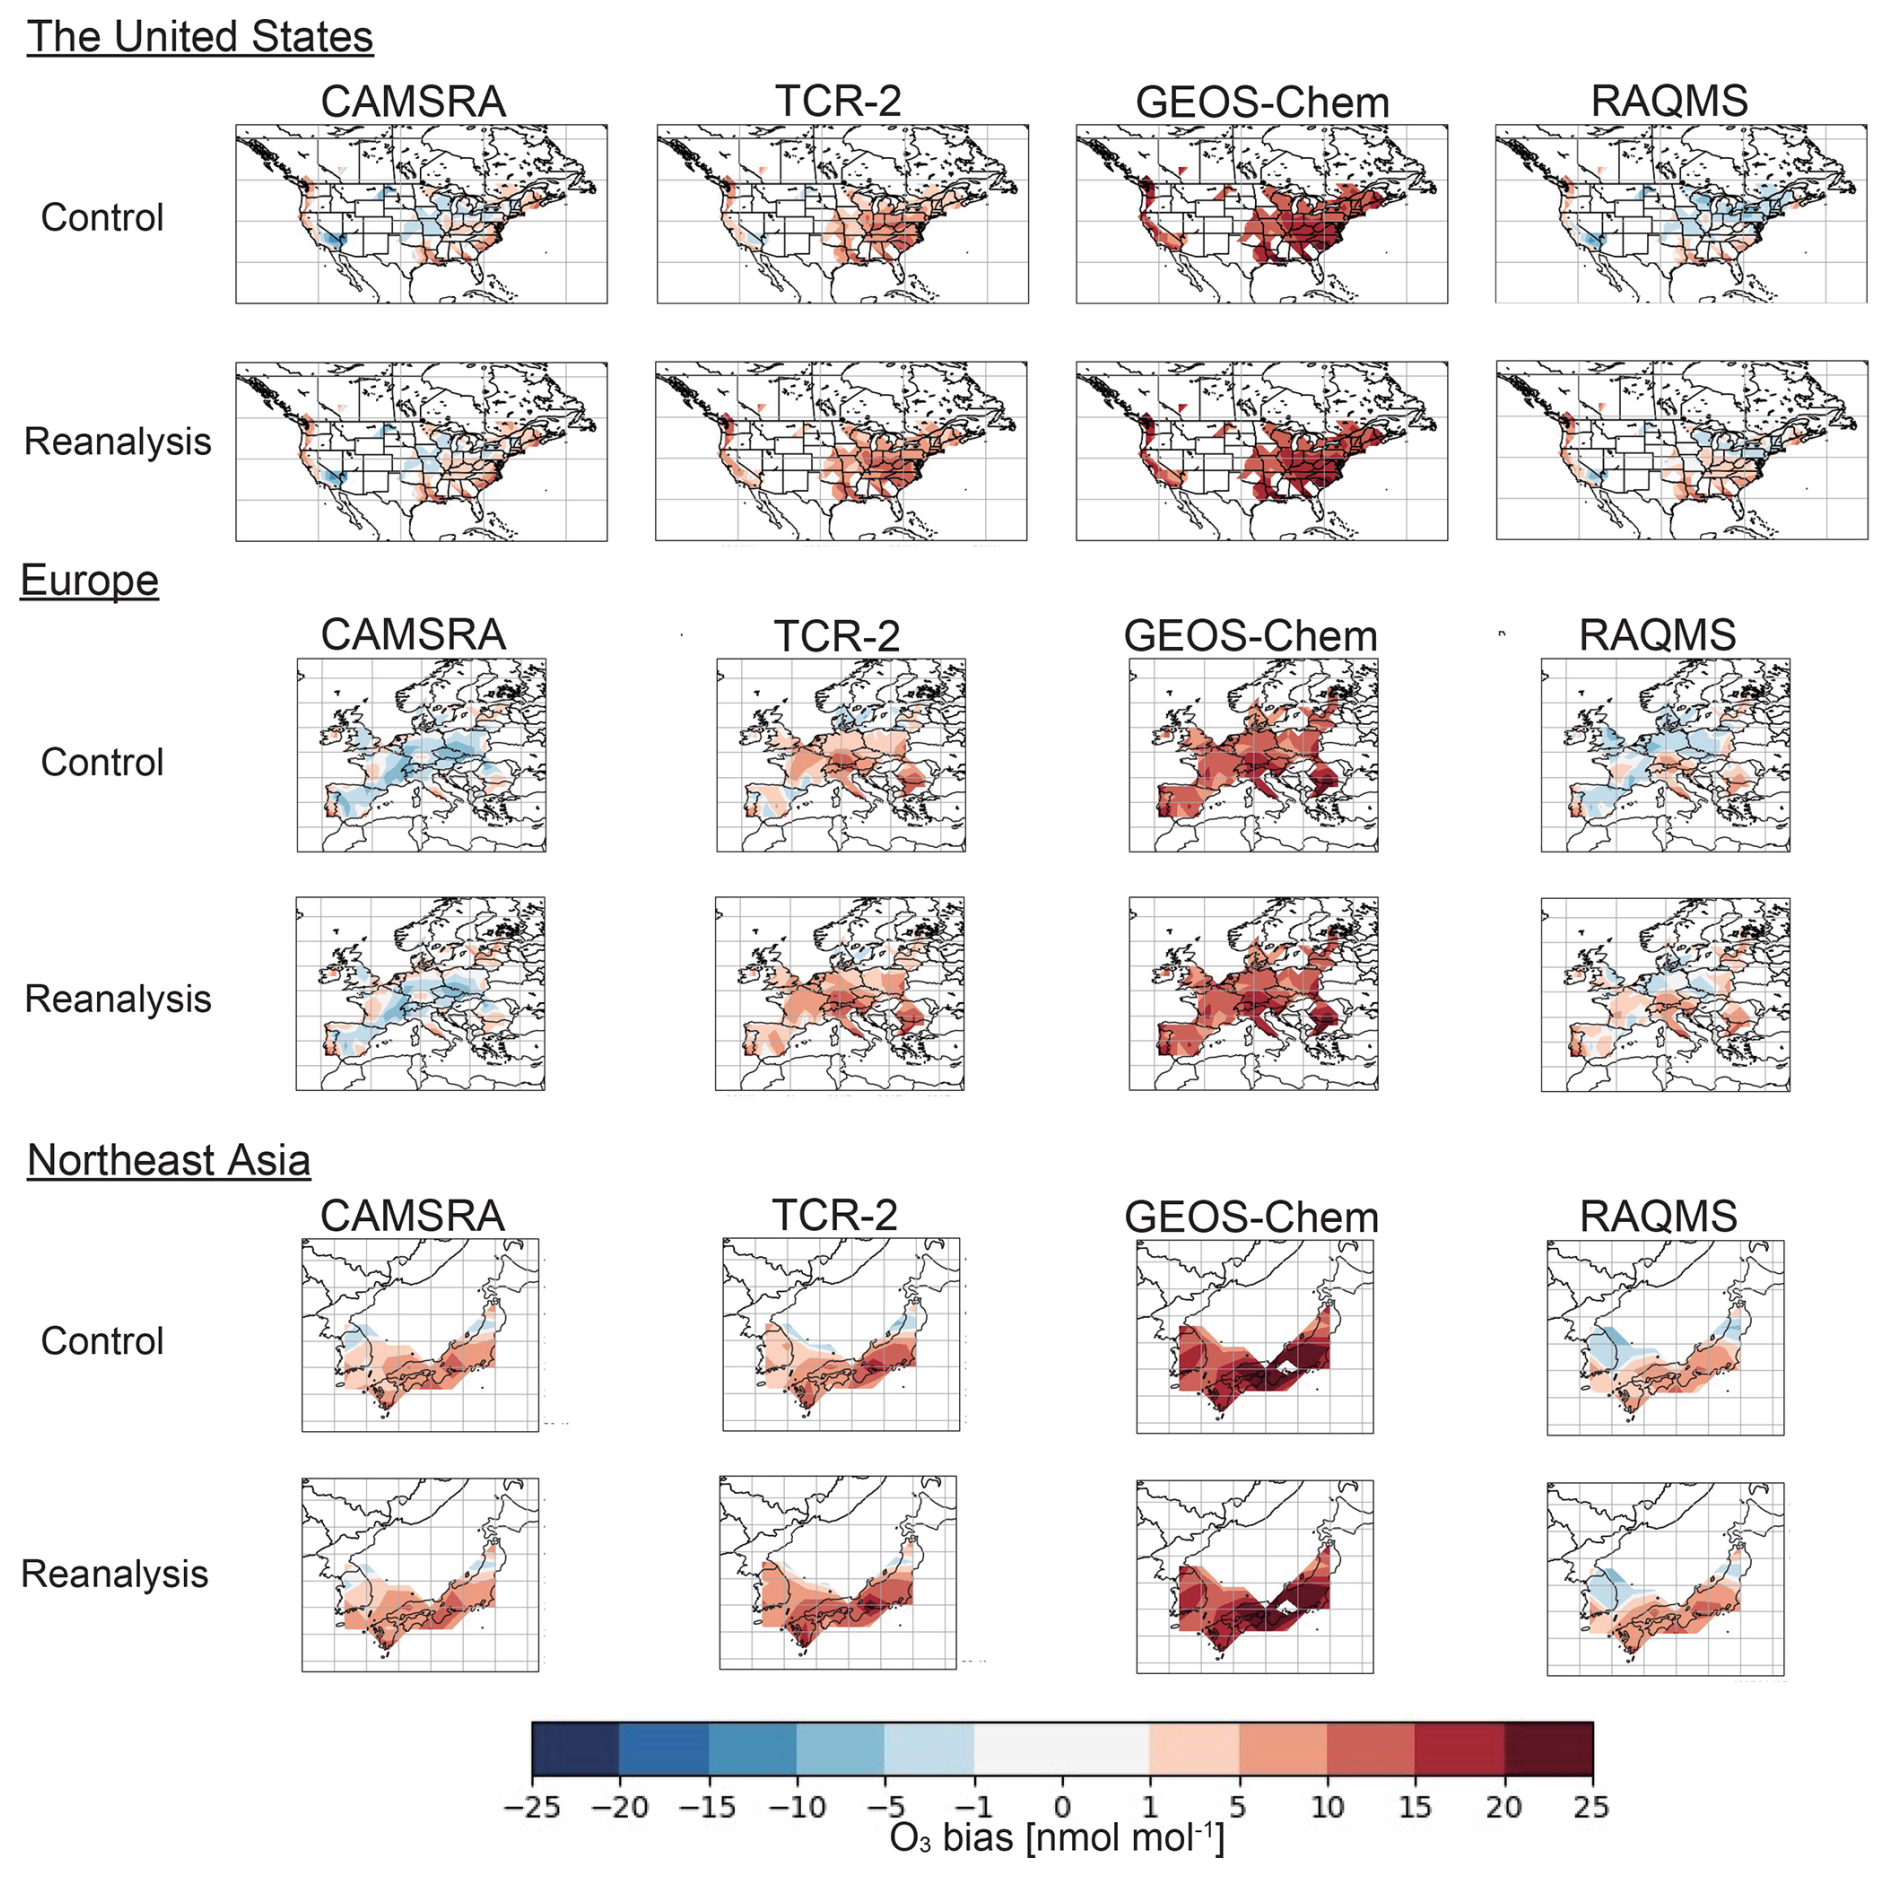
Figure 6Bias of annual mean surface ozone relative to the TOAR database (nmol mol−1) in CAMSRA (first column), TCR-2 (second column), GEOS-Chem adjoint (third column), and the RAQMS Aura reanalysis (fourth column) in 2010. The first, third, and fifth rows are the control simulations without data assimilation, while the second, fourth, and sixth rows are the reanalysis products. The “rural_mean” aggregated data were used for comparison. The model and reanalysis output was mapped onto the 2° × 2° grid.
Over western Europe, surface ozone model biases in the control runs were 2.5–15.1 nmol mol−1 relative to the TOAR database. The spatial correlation coefficients and RMSEs were 0.37–0.55 and 5.7–15.8 nmol mol−1 compared to the TOAR database, respectively. Data assimilation increased the positive model biases by a factor of up to 2. The spatial correlation coefficients were slightly decreased by 0.005–0.01 in CAMSRA and GEOS-Chem, whereas the spatial correlation coefficients were increased by 0.02–0.06 in TCR-2 and RAQMS. The RMSEs were increased by 1 %–35 %.
Over northeastern Asia, surface ozone model biases in the control runs were positive (4.2–17.8 nmol mol−1) compared to the TOAR database. The spatial correlation coefficients ranged from 0.01 to 0.5 among the models. The RMSEs against the TOAR database were 7.6–18.8 nmol mol−1. Through data assimilation, the model biases were increased by up to 42 % in all the systems. The spatial correlation coefficients were decreased by 0.03 in RAQMS but improved by 0.02–0.07 in CAMSRA, TCR-2, and GEOS-Chem. The RMSEs were increased by up to 23 % for all the systems.
Overall, the positive model bias of surface ozone against all available observations (0.3–12.8 nmol mol−1) was increased by data assimilation by up to a factor of 4. The spatial correlation coefficients were slightly decreased by data assimilation from 0.11–0.59 to 0.08–0.58, except for TCR-2. The RMSEs were increased by up to 18 % for all the reanalysis products. Satellite data assimilation reduced negative model biases in the free troposphere, whereas propagation of the ozone increments to the surface increased surface ozone biases. These results indicate a misrepresentation of physical and chemical model processes near the surface in the current global forecast models (Parrington et al., 2009; Travis et al., 2016) and highlight the need to incorporate surface observations into the current global chemical reanalysis data (Hanea et al., 2004; Huang et al., 2013).
4.1 OSE results
OSEs were used to evaluate the relative impacts of individual assimilated measurements, as summarized in Table 2. In particular, we focused on three groups: (1) simultaneous assimilation of ozone and its precursors (S + T + P or S + P), (2) direct assimilation of stratospheric and tropospheric ozone (S + T, S, or T), and (3) assimilation of ozone precursors including NOx and CO on ozone analysis (P(NO2) or P(CO)). As shown in Figs. 1, 2, 7, and 8, the effects of assimilation varied from system to system. Nevertheless, similarities in the general patterns were observed. System-dependent differences in ozone increments can be attributed to differences in model biases, data assimilation configurations (e.g., concentration and/or emission optimization), and assimilated measurements.
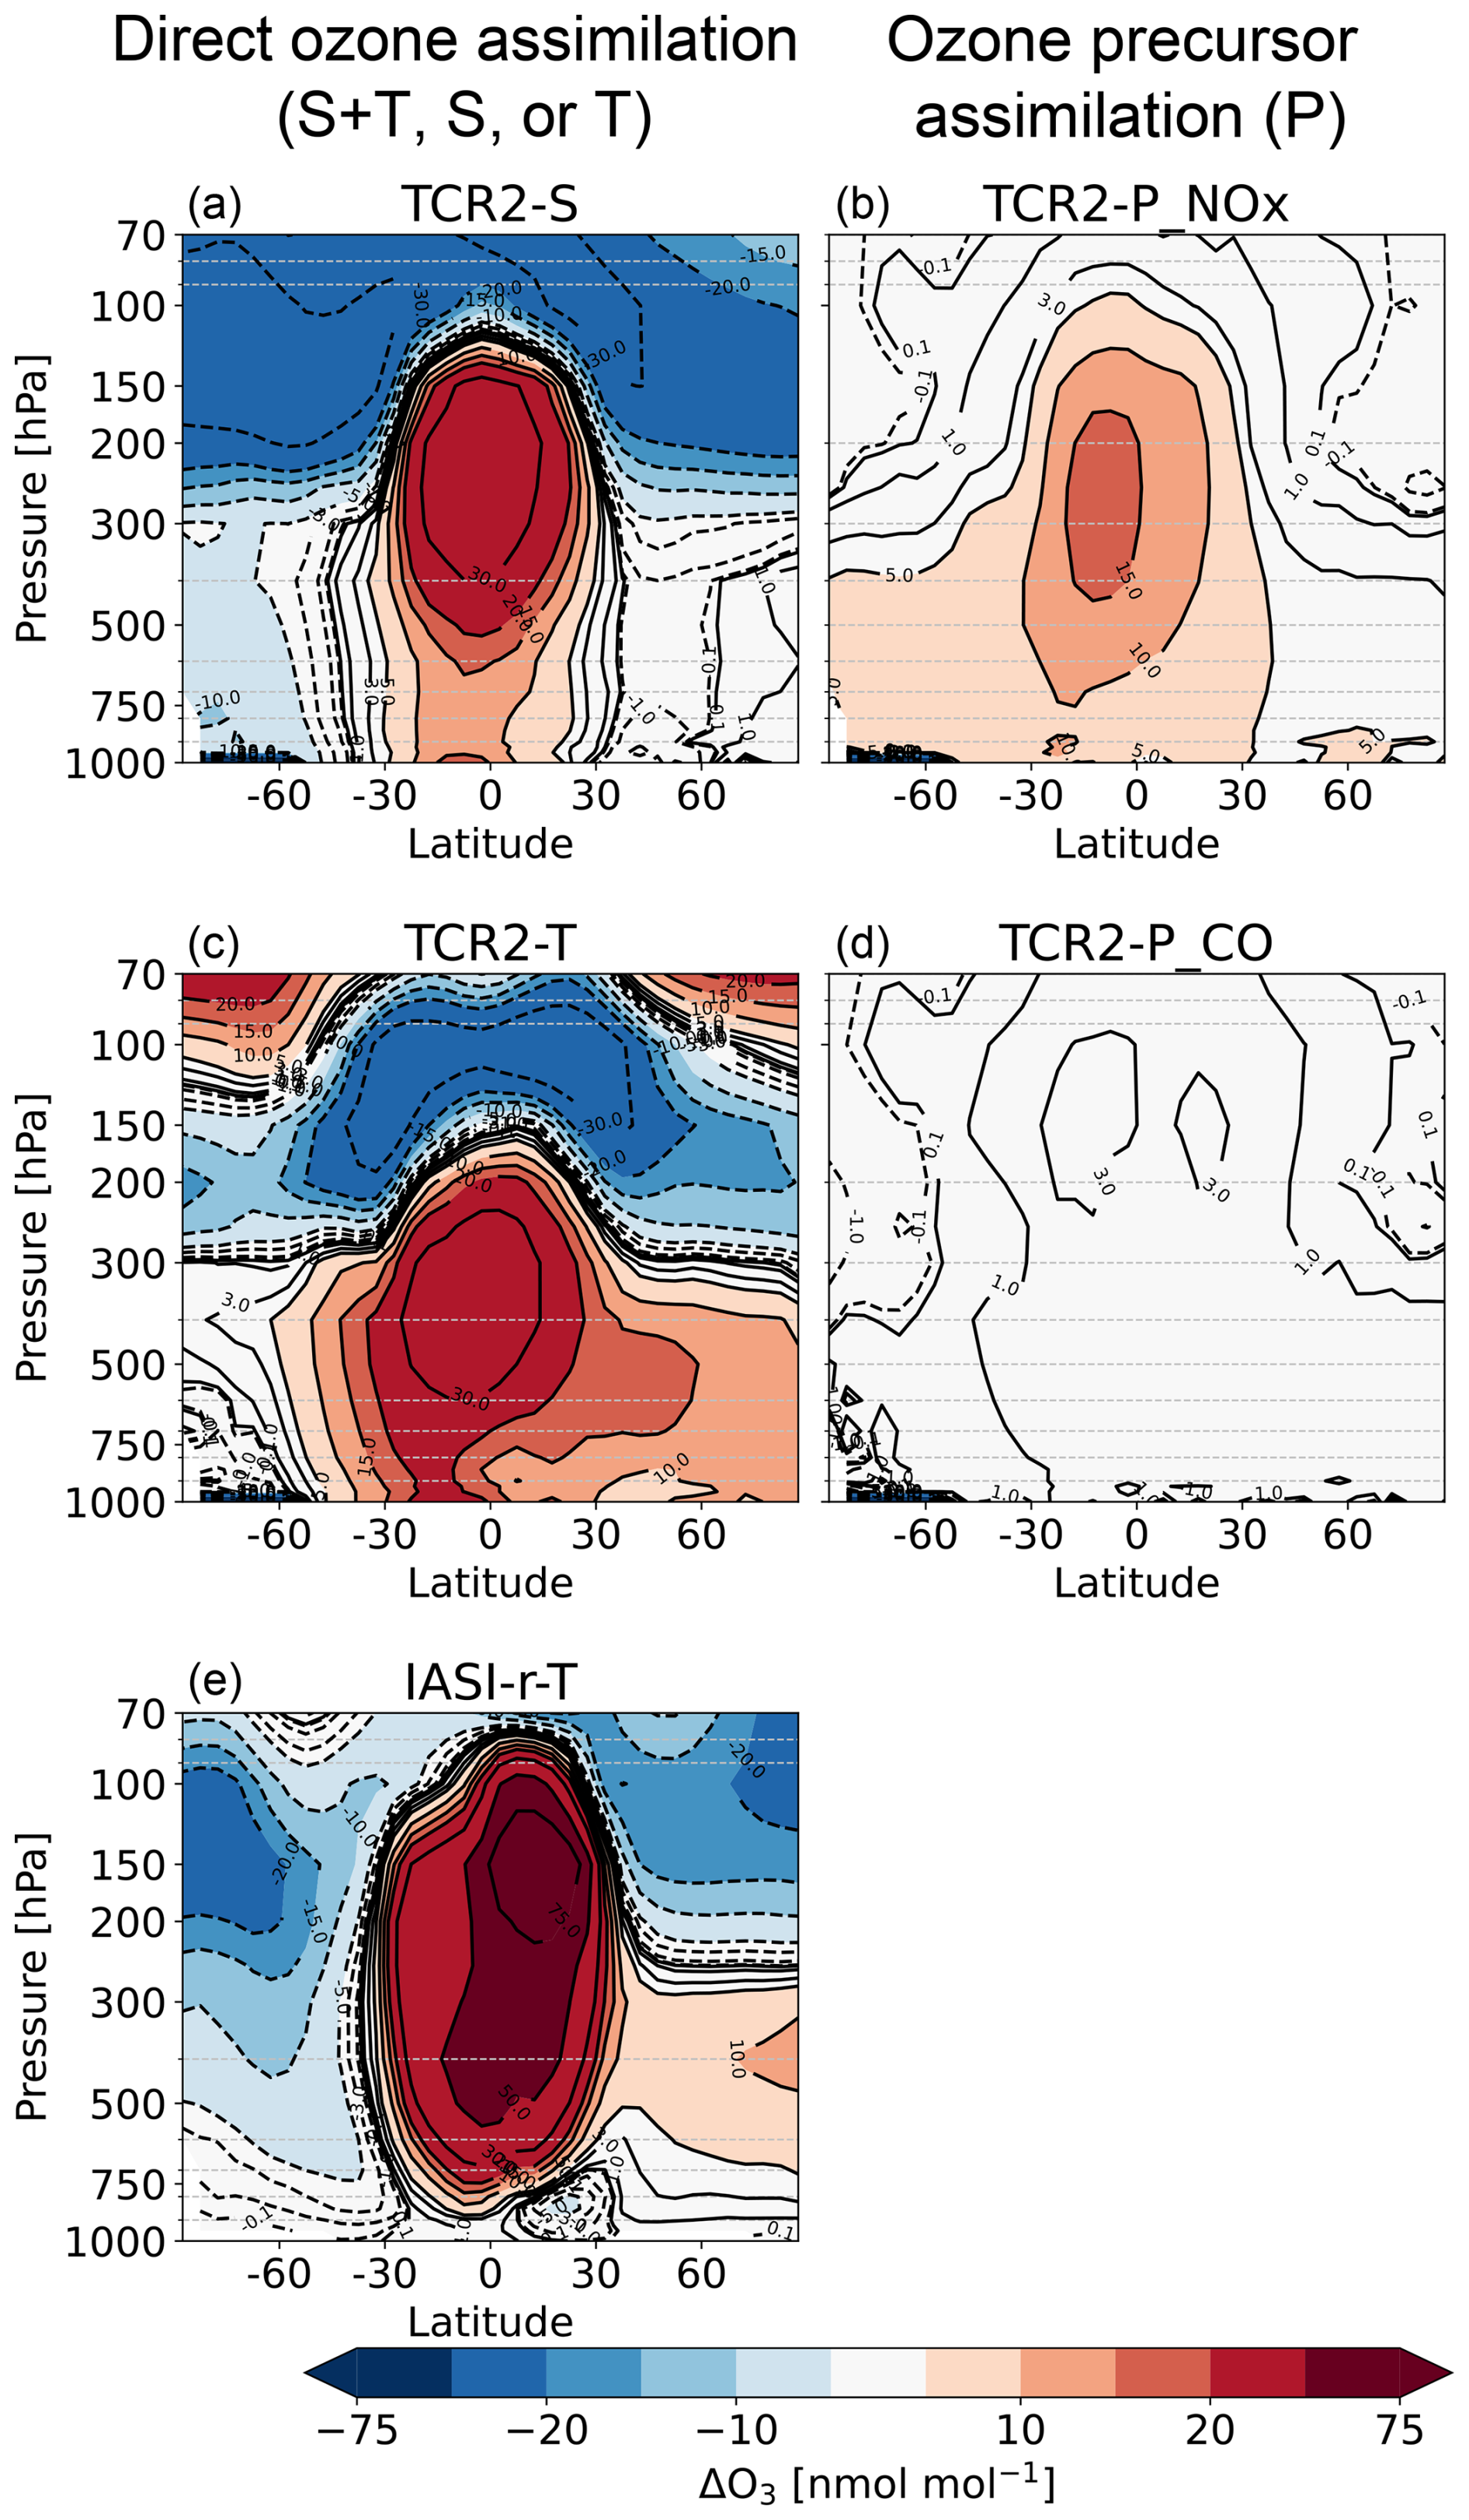
Figure 7Latitude-pressure-level cross sections of changes in annual mean ozone concentrations owing to the data assimilation obtained from the OSEs in 2010. Panels (a) TCR-2-S, (c) TCR-2-T, and (e) IASI-r-T present the direct ozone assimilation (S and T). Panels (b) TCR-2-P_NOx and (d) TCR-2-P_CO present the assimilation of ozone precursors (P). The units are percentage (%).
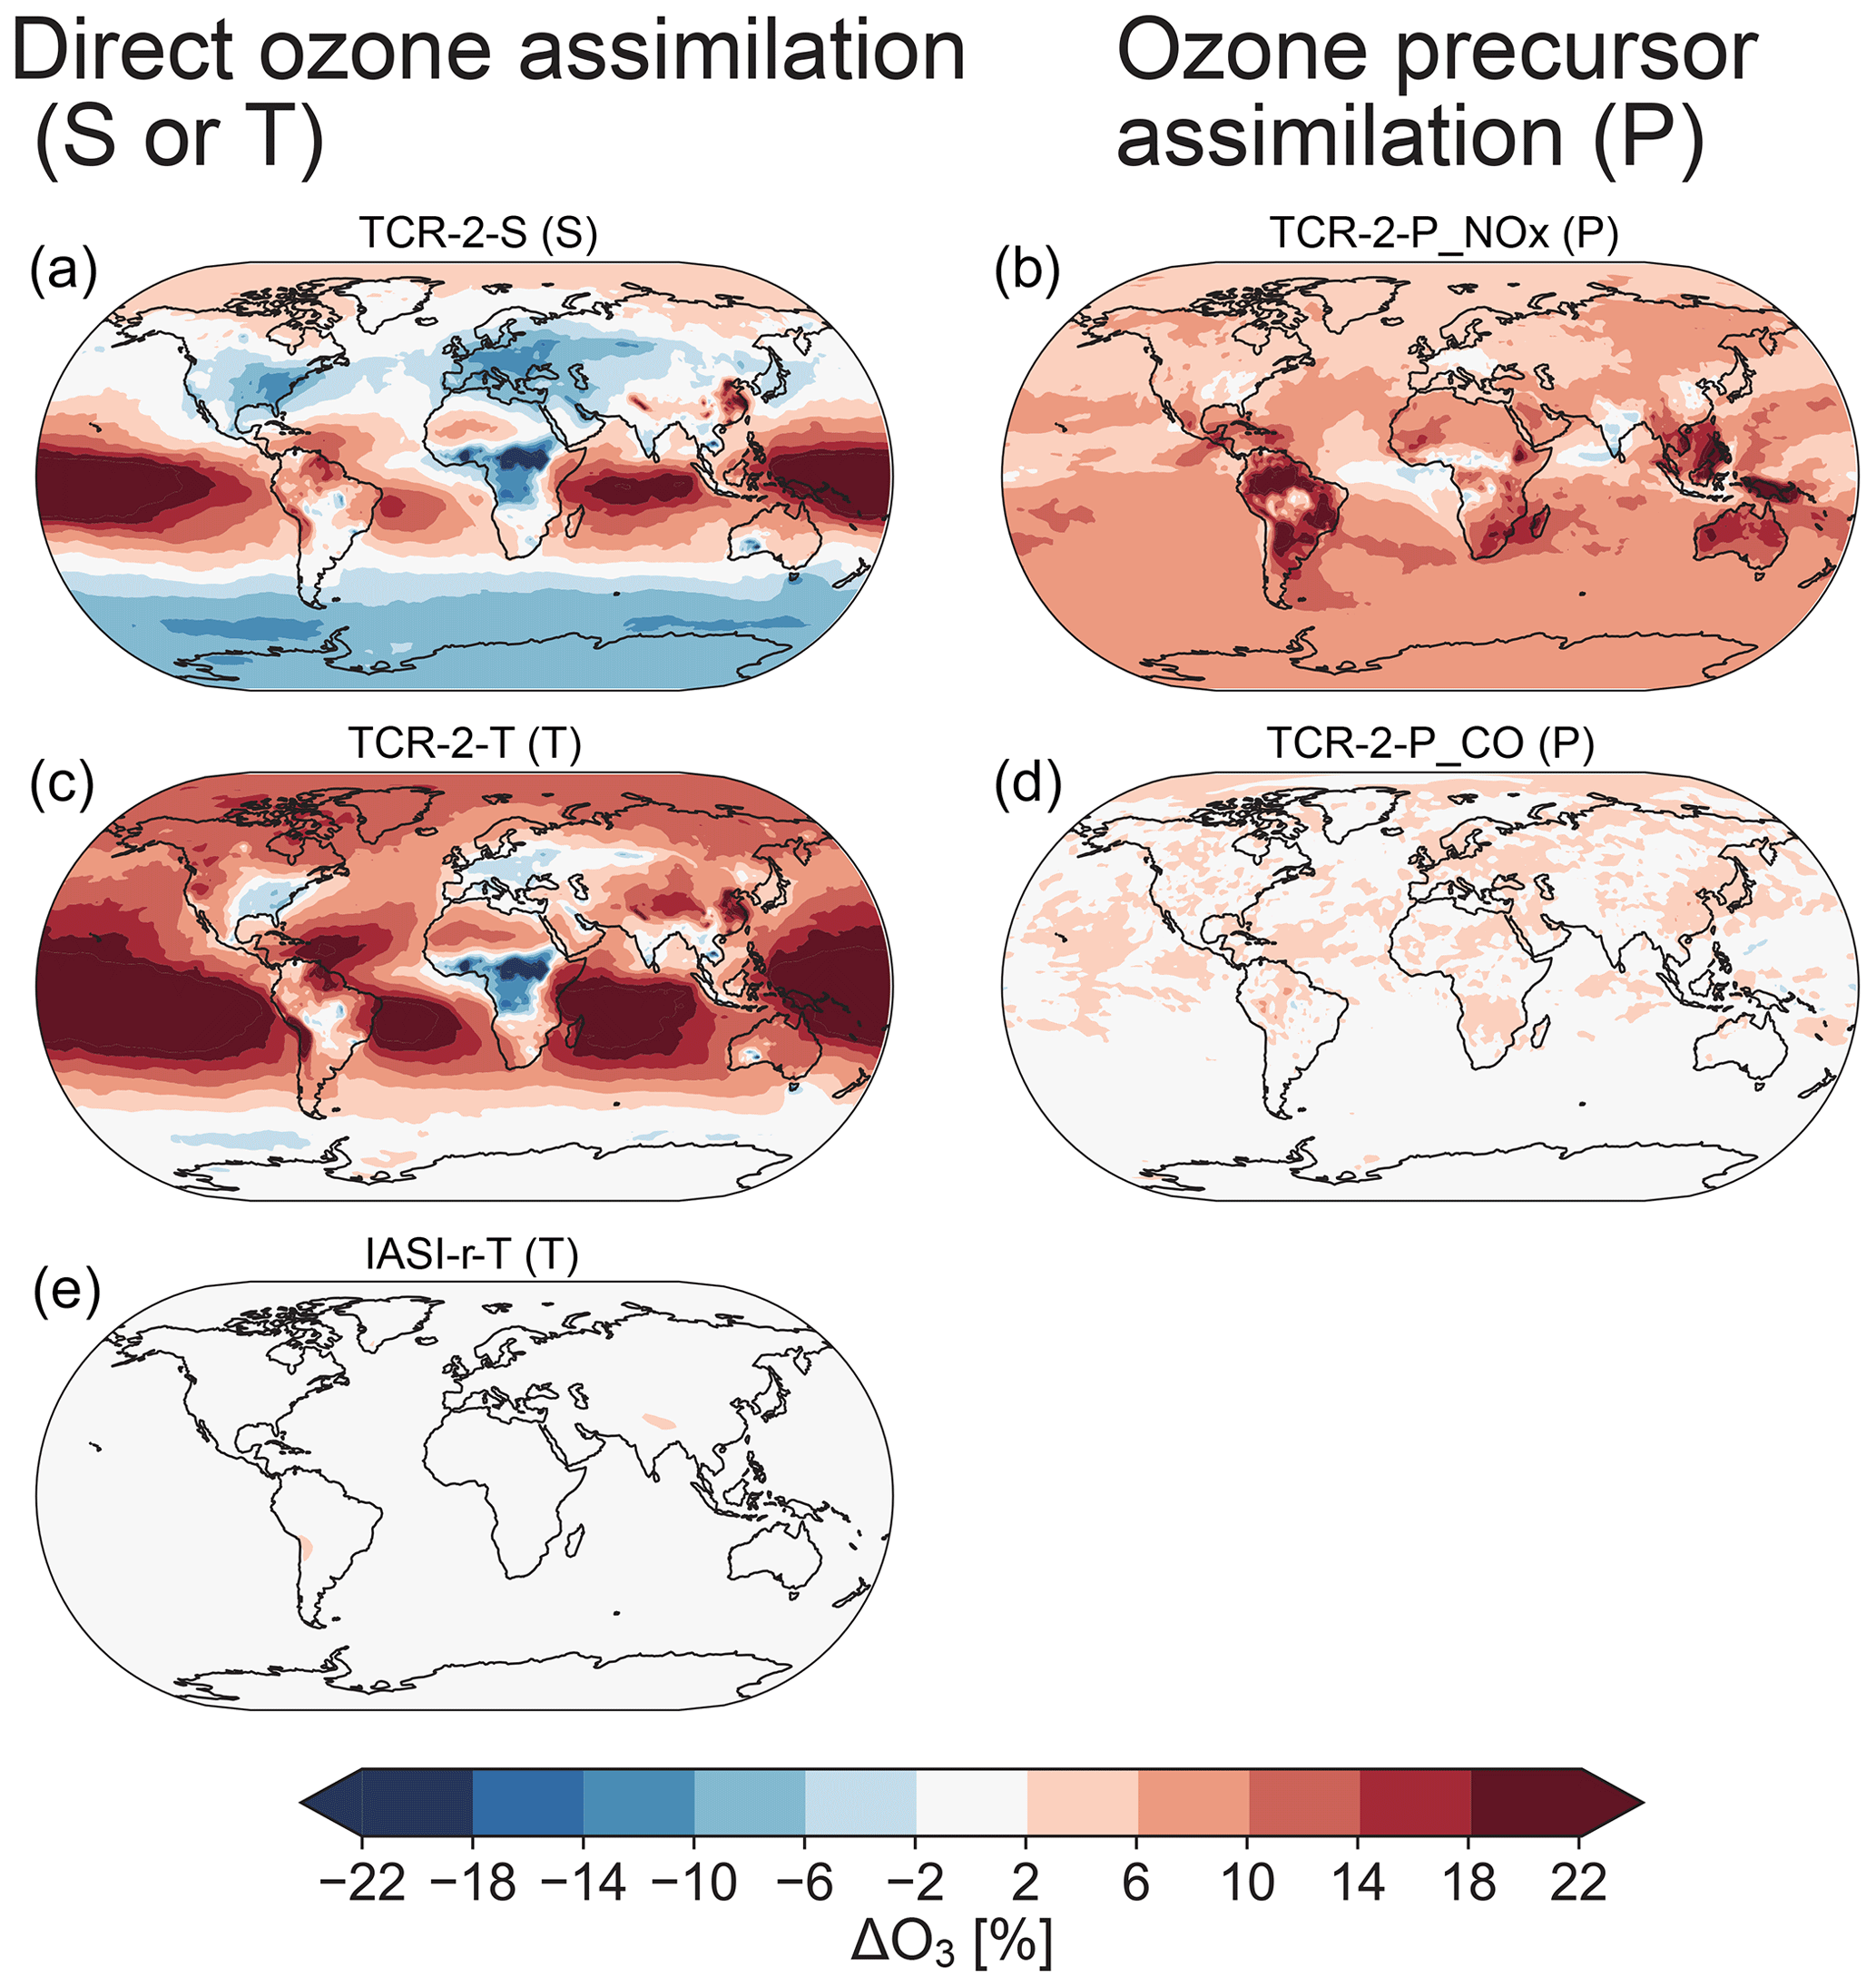
Figure 8Global distribution of changes in annual mean surface ozone concentrations owing to data assimilation obtained from OSEs in 2010. Panels (a) TCR-2-S, (c) TCR-2-T, and (e) IASI-r-T present the direct ozone assimilation (S and T). Panels (b) TCR-2-P_NOx and (d) TCR-2-P_CO present the assimilation of ozone precursors (P). The unit is percentage (%).
For the simultaneous assimilation cases (S + T + P or S + P), in the UTLS, the global mean ozone concentrations increased in CAMSRA (S + P) and RAQMS (S + P) by 18 %–61 % but decreased in TCR-2 (S + T + P) by 21 %. The discrepancy in the increments reflects opposite model biases (see Sect. 3.2.2). In the middle and lower troposphere, ozone concentrations commonly increased over the extratropics but varied in magnitudes, ranging from 3 % (CAMSRA) to 20 % (TCR-2). Increases in ozone near the surface were also common, with larger increases over remote areas than over the polluted and biomass-burning areas. The increases in ozone concentrations obtained from the systems with emission optimization (by 11 %–27 % in TCR-2 and RAQMS) tended to be larger than those without optimization (by 4 %–11 % in CAMSRA).
The direct ozone assimilation cases (S + T, S, or T) showed similar latitudinal and vertical patterns in the effects of data assimilation on the middle to upper troposphere (Fig. 7), reflecting similar model biases in the MIROC-Chem and MOCAGE models. The maximum changes in the tropical middle and lower troposphere were more than 40 %. TCR-2-S (S), TCR-2-T (T), IASI-r (S + T), and IASI-r-T (T) increased the ozone concentration in the middle troposphere (by 6 %–22 %) and decreased it in the UTLS (by 2 %–21 %). Decreases in UTLS ozone in the assimilation of stratospheric ozone profiles (TCR-2-S (S) and IASI-r (S + T)) were commonly larger than those in the assimilation of tropospheric ozone only (TCR-2-T (T) and IASI-r-T (T)). The effects on the tropical lower stratosphere and lower troposphere differed between TCR-2 and IASI-r. These different patterns may reflect differences in assimilated observations (TES vs. IASI), as well as model biases. Near the surface, direct ozone assimilation in TCR-2 showed large data assimilation impacts of up to 7 %, 13 %, and 8 % in the southern extratropics, tropics, and northern extratropics, respectively (Fig. 8). The surface ozone change was smaller in IASI-r than TCR-2, partly because the prescribed background error covariance in IASI-r (10 %) was lower than the typical background error in TCR-2 (15 %–17 %) in the lower troposphere. In TCR-2, the background error covariance was dynamically estimated through ensemble model simulations at each location and time, which is expected to provide more accurate estimates of the background error. Other reasons for significant differences near the surface could be related to the altitude-dependent sensitivities of the assimilated observations (i.e., averaging kernels).
The assimilation of ozone precursor gases (P(NO2) or P(CO)) increased the ozone concentrations in the lower and middle troposphere in the OSEs using TCR-2 and GEOS-Chem. The TCR-2 OSE results indicated a larger impact on the surface and lower-tropospheric ozone from the assimilation of NO2 (by +7 %) than from the assimilation of CO (by +1.5 %). The impacts of tropospheric NO2 assimilation varied among the systems, ranging from 0.1 % (GEOS-Chem) to 7 % (TCR-2). This discrepancy may be related to the smaller increments in NOx emissions in the GEOS-Chem adjoint calculation when assimilating the OMNO2 NASA standard product than those when assimilating the DOMINO and QA4ECV products (Qu et al., 2020a). This discrepancy can also be caused by the different sensitivities of ozone to changing NOx emissions between GEOS-Chem and MIROC-Chem (Miyazaki et al., 2020b) and the simultaneous corrections of NOx emissions and concentrations in TCR-2 (Miyazaki et al., 2012b). Meanwhile, the positive responses of ozone to MOPITT CO assimilation were consistently reported by Gaubert et al. (2016).
4.2 Validation against ozonesonde observations
As shown in Figs. 9 and 10, the chemical reanalysis products and OSEs were validated using ozonesonde observations. In the extratropical UTLS, model biases were largely reduced by more than 67 % by the simultaneous assimilation in CAMSRA (S + P), TCR-2 (S + T + P), and RAQMS (S + P). Over the tropics, model biases were also reduced by up to 74 % in the lower stratosphere (70–150 hPa) and 44 % in the upper troposphere (150–250 hPa), respectively (Fig. 10). The OSEs suggested the importance of the direct assimilation of stratospheric ozone profiles in IASI-r (S + T) and TCR-2-S (S), with bias reductions of 73 %–95 % over the extratropics. Although the mean bias in the tropical UTLS (70–250 hPa) was increased in TCR-2-S, the positive and negative biases were improved by 60 % in the lower stratosphere and by 86 % in the upper troposphere.
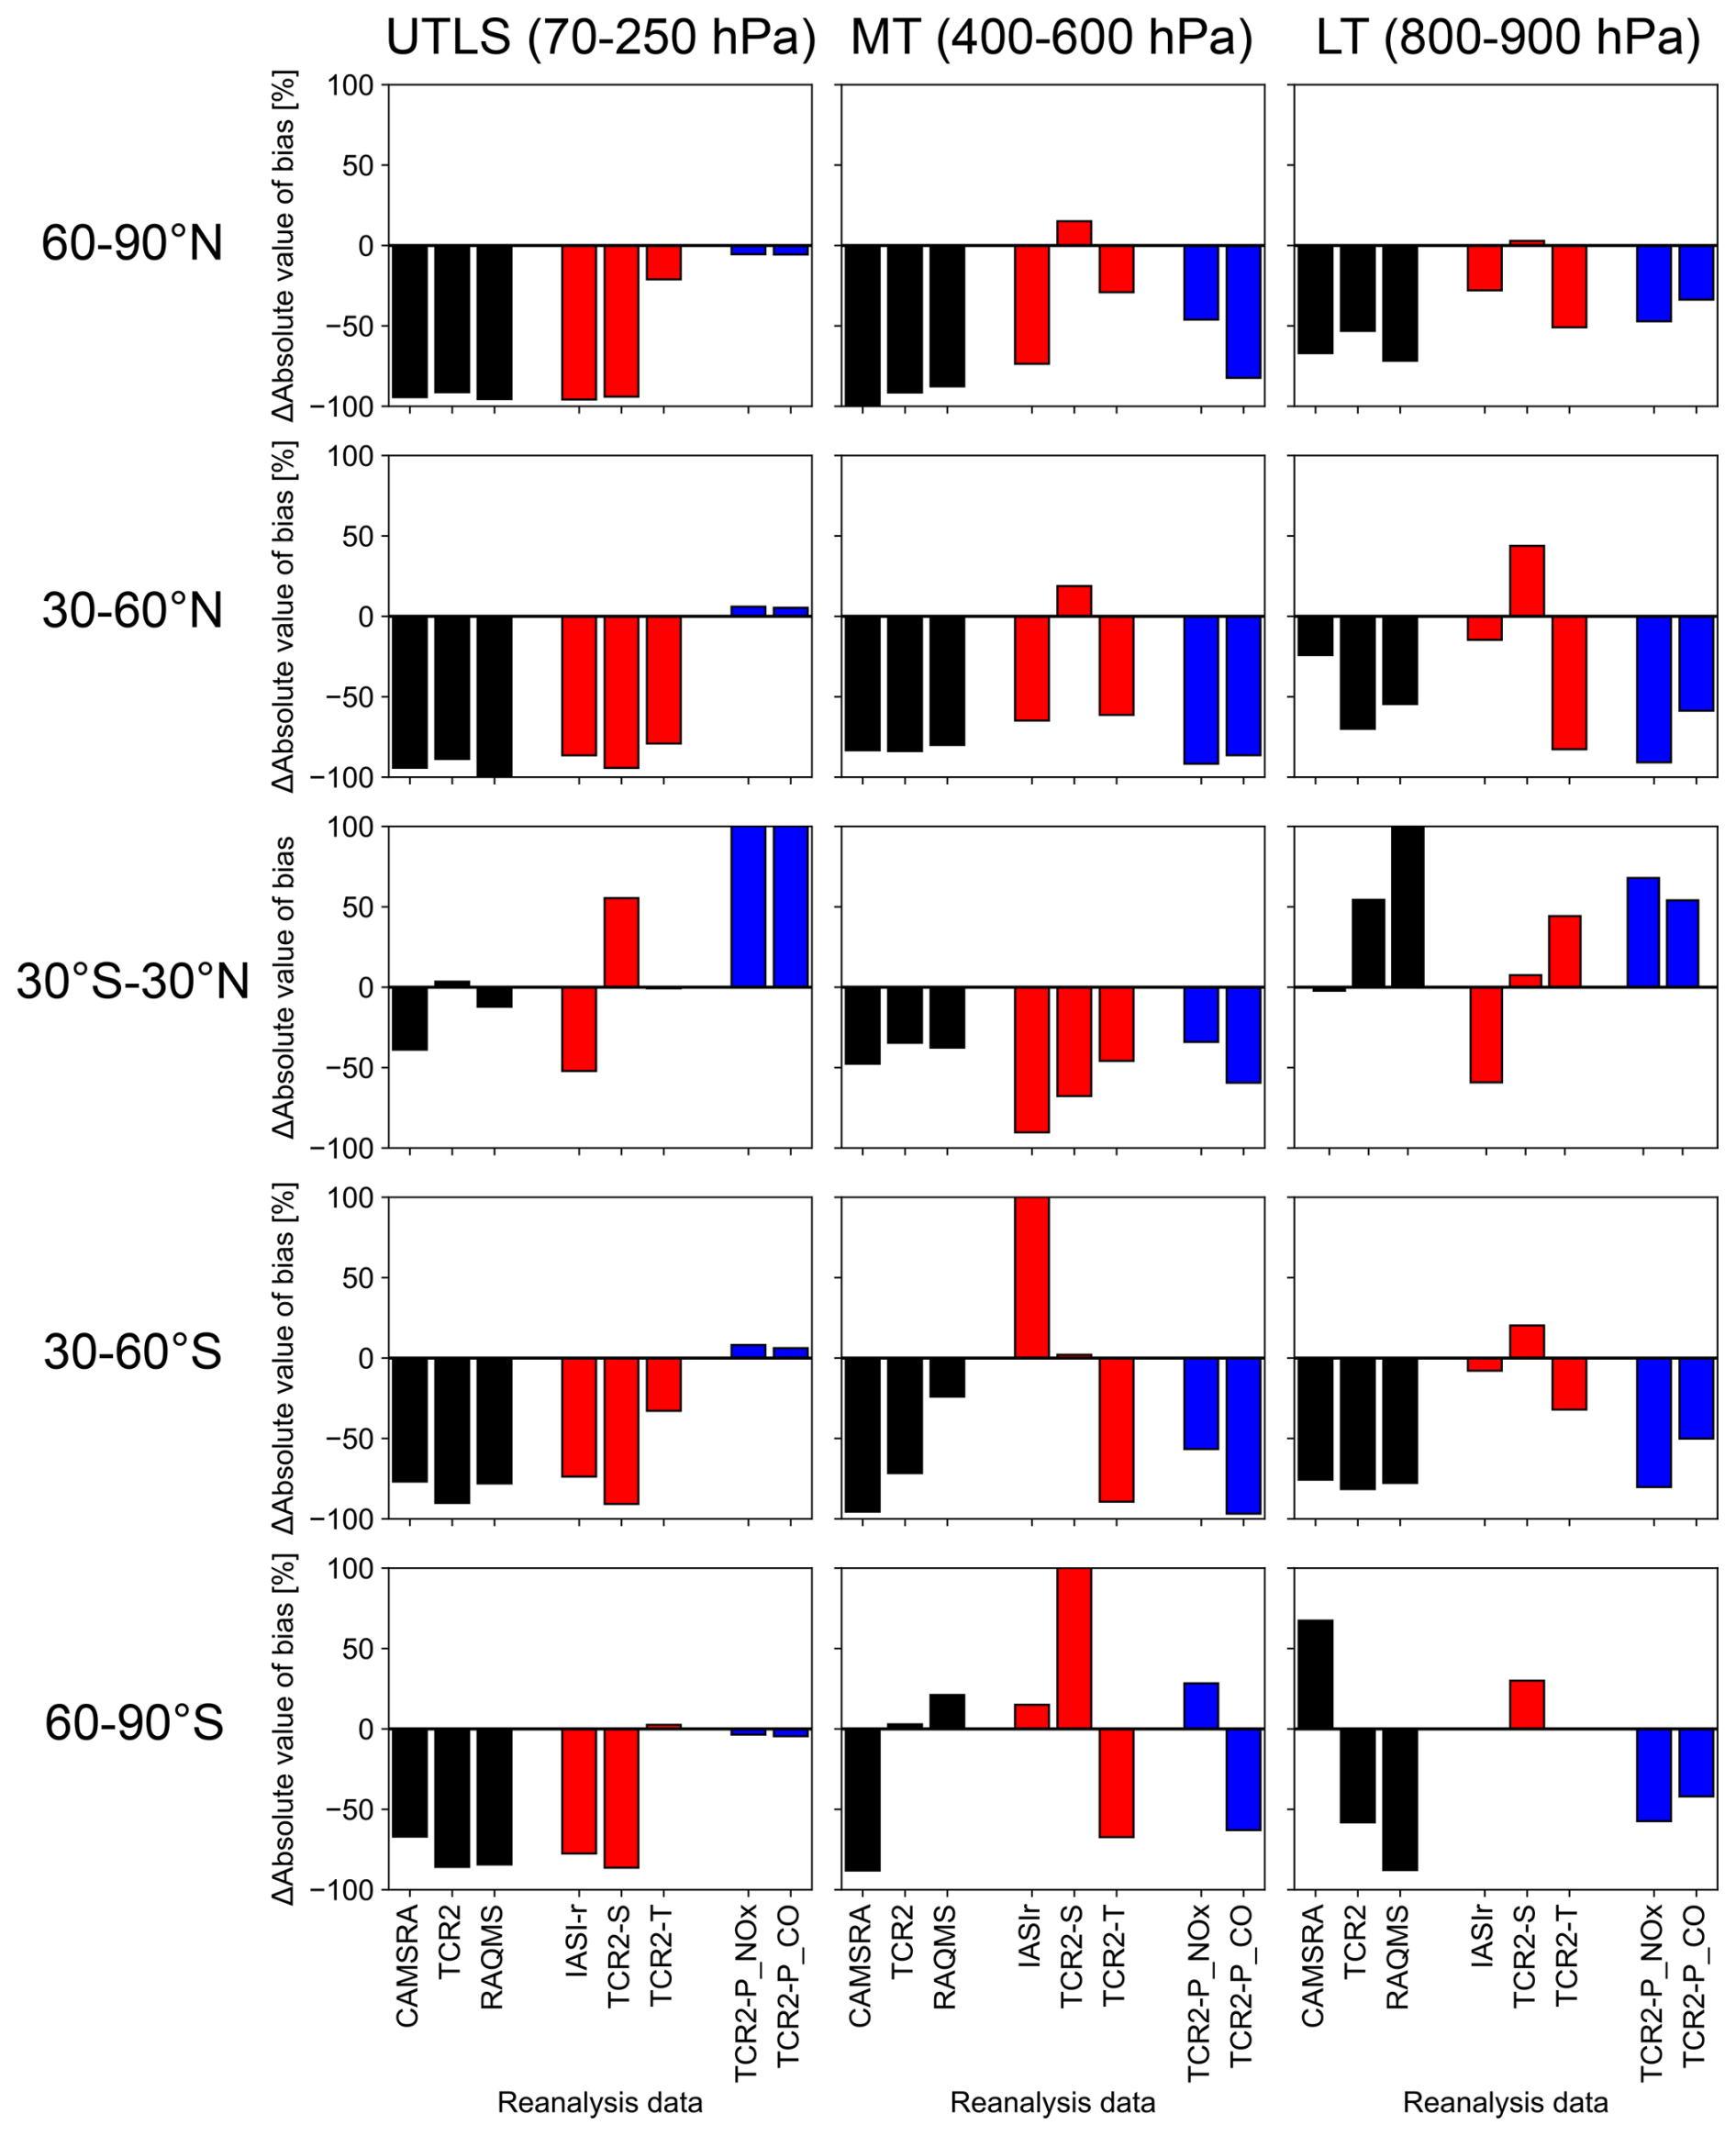
Figure 9Relative changes in the absolute value of the mean bias (%) due to data assimilation in the reanalysis products and OSEs. These changes are calculated as follows: (|MBDA| − |MB × 100, where MB is the mean bias. The left column is the upper troposphere and lower stratosphere (UTLS; 70–250 hPa), the middle column is the middle troposphere (MT; 400–600 hPa), and the right column is the lower troposphere (LT; 800–900 hPa) in 2010. The first through fifth rows present the northern high latitudes (60–90° N), the northern mid-latitudes (30–60° N), the tropics (30° N–30° S), the southern mid-latitudes (30–60° S), and the southern high latitudes (60–90° S). The black bars indicate the simultaneous assimilation of ozone and its precursors (S + T + P and S + P), namely CAMSRA, TCR-2, and the RAQMS Aura reanalysis. The red bars indicate the direct ozone assimilation (S + T, S, and T), namely IASI-r, TCR-2-S, and TCR-2-T. The blue bars indicate the assimilation of ozone precursors (P), namely TCR-2-P_NOx and TCR-2-P_CO.
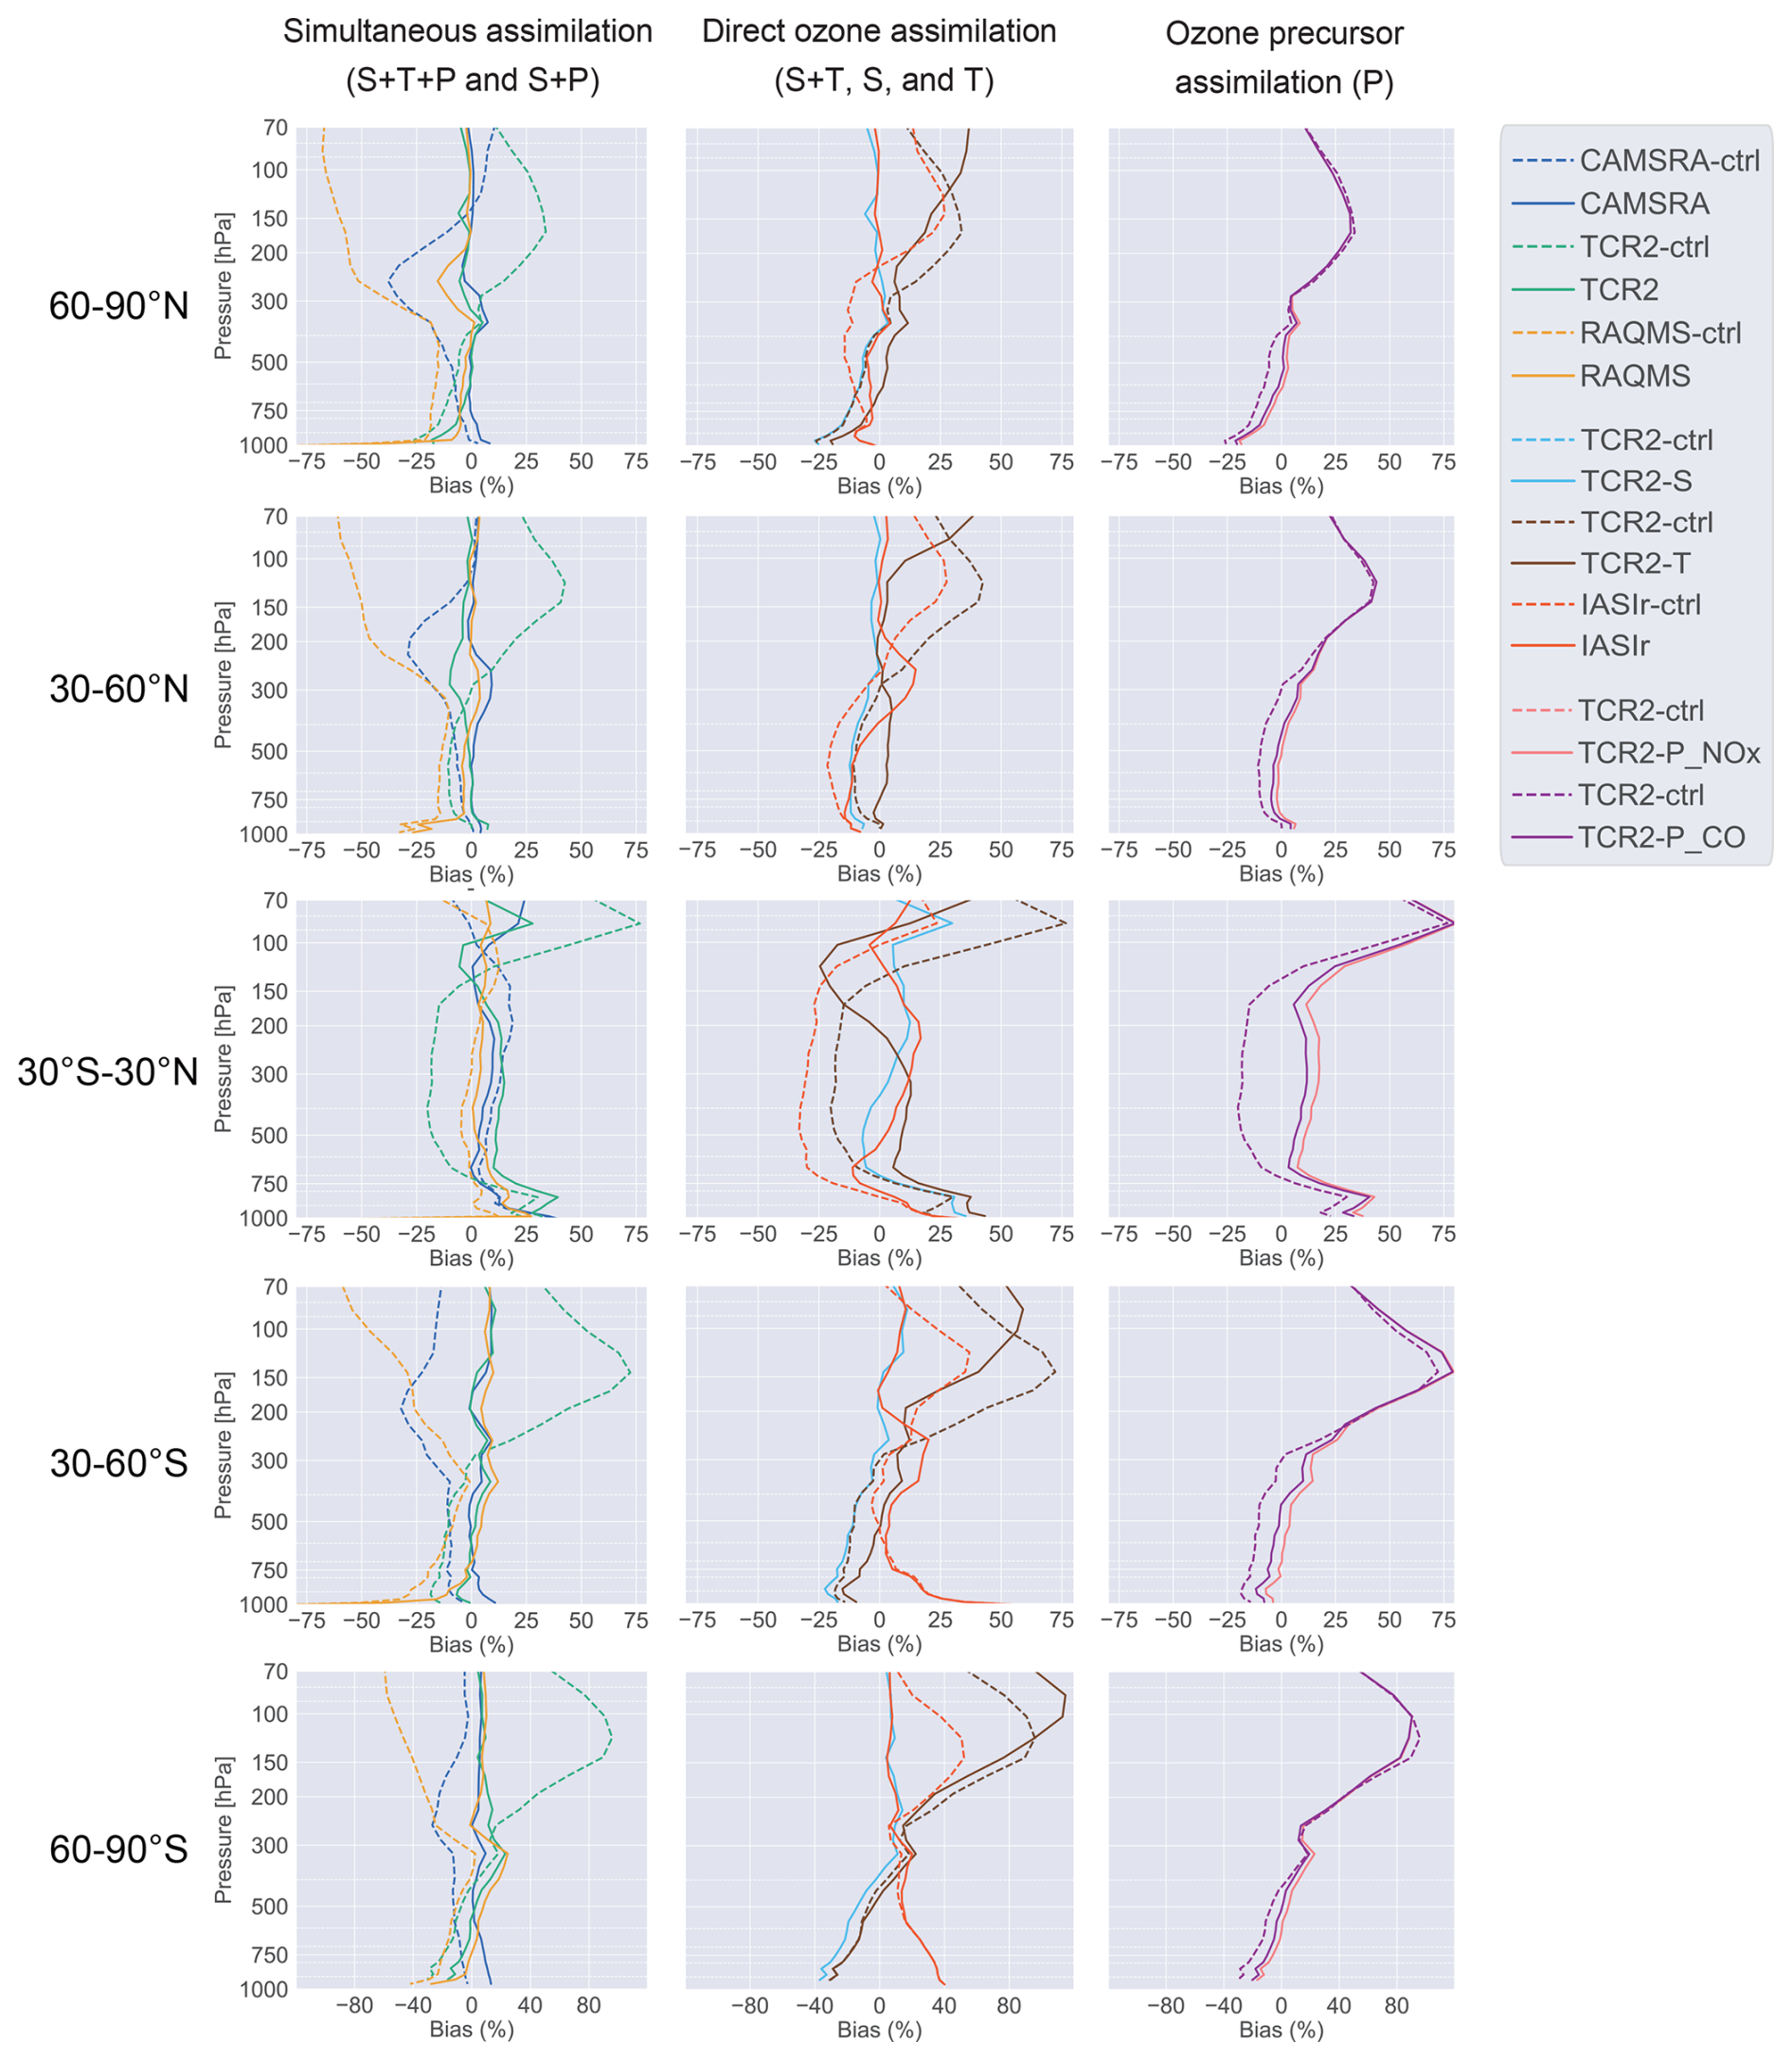
Figure 10Vertical profiles of the bias for the data assimilation (solid lines) and the control simulations (dashed lines) relative to ozonesonde observations in 2010. The left panels are the simultaneous assimilation (S + T + P and S + P), the middle panels are the direct ozone assimilation (S + T, S, and T), and the right panels are the ozone precursors assimilation (P). The first through fifth rows present the northern high latitudes (60–90° N), the northern mid-latitudes (30–60° N), the tropics (30° N–30° S), the southern mid-latitudes (30–60° S), and the southern high latitudes (60–90° S). The blue line indicates CAMSRA, the green line indicates TCR-2, the orange line indicates the RAQMS Aura reanalysis, the red line indicates IASI-r, the sky-blue line indicates TCR-2-S, the brown line is TCR-2-T, the pink line is TCR-2-P_NOx, and the purple line indicates TCR-2-P_CO. The unit is percentage (%).
In the middle troposphere, the model bias was reduced by 88 % in CAMSRA (S + P) over the southern high latitudes, whereas it was increased by 3 %–21 % in TCR-2 (S + T + P) and RAQMS (S + P). Over the other four latitude bands, the simultaneous assimilation (S + T + P or S + P) improved the model biases compared to ozonesonde by 24 %–99 %. The direct ozone assimilation of TES tropospheric ozone profile in TCR-2-T (T) showed bias reductions of 67 % and 89 % over the southern mid- and high latitudes, respectively. In contrast, model biases were increased by the IASI tropospheric ozone assimilation in IASI-r (S + T). Over the tropics, the model biases were reduced by 45 %–73 % in TCR-2-T (T) and IASI-r (S + T) in the northern mid-latitudes and high latitudes. The assimilation of ozone precursor measurements in TCR-2-P_NOx and TCR-2-P_CO (P) reduced the model biases by 34 %–97 % over all the latitude bands, with the exception of TCR-2-P_CO over the southern high latitudes.
In the lower troposphere, the simultaneous assimilation reduced the model biases over the southern high latitudes by up to 88 % in TCR-2 (S + T + P) and RAQMS (S + P), except for CAMSRA (S + P). Over the tropics, the CAMSRA remained essentially unchanged (by 2 %), whereas the other simultaneous assimilations increased model biases. Over the southern mid-latitudes and northern mid-latitudes and high latitudes, all of the simultaneous assimilation (S + T + P and S + P) reduced the negative model biases by 24 %–81 %. Over the extratropics, the direct tropospheric ozone assimilation (S + T and T) reduced the model biases by up to 82 %. Compared with these improvements, the assimilation of precursor measurements (P) showed comparable or larger bias reductions of 33 %–90 % over the extratropics. Over the tropics, however, improvements in model biases were not found for the direct ozone assimilation or precursor assimilation (S + T, T, and P), except for IASI-r (by 59 %). These results could partly be affected by biases in the assimilated measurements (Boxe et al., 2010), a lack of observational constraints on biogenic VOCs (De Smedt et al., 2018; Wells et al., 2022), and missing model processes, such as tropospheric halogen chemistry (Sherwen et al., 2016; Sekiya et al., 2020).
The results obtained from multi-system OSEs have two important implications for the development of a future satellite constellations, as follows.
-
Integrating measurements of ozone and its precursors is an effective way to improve the entire profile of ozone in the troposphere and lower stratosphere, as consistently suggested by previous single-system OSE studies (e.g., Miyazaki et al., 2019a). This finding highlights the great value of the current satellite constellation.
-
The spread obtained for data assimilation impacts across multiple systems, including notable differences in certain areas, provides key insights for determining the influence of reanalysis system choices on the observing system impact assessments.
The absolute values of DA increments largely varied, ranging 0 %–21 %, 0 %–22 %, and 0.1 %–19 % in the UTLS and middle and lower troposphere, respectively. However, the remaining biases of reanalyses against ozonesonde observations were within ±2.5 %, ±3.5 %, and ±7.0 % in the UTLS and middle and lower troposphere, respectively, except for GEOS-Chem adjoint. These differences could be related to a variety of factors, including different retrieval algorithms; data assimilation settings, which are applied to fully exploit observational information (e.g., assumption of background error covariance); and different model performance. These findings should lead to more robust assessments of the observing system impacts. The impact of assimilating OMI tropospheric NO2 on lower-tropospheric ozone varied from +0.1 % to +7 %. These results indicate that the assessment of the observing system impacts is sensitive to the choice of the data assimilation system. This difference may reflect the different a priori surface NOx emissions between TCR-2 (46.48 Tg N yr−1) and GEOS-Chem (52.20 Tg N yr−1) (Table S1), as well as differing model resolutions (Sekiya et al., 2021). Additionally, systematic biases among the assimilated products derived from different retrieval algorithms may contribute to these differences (Qu et al., 2020a). GEOS-Chem adjoint shows larger data assimilation impacts on ozone when assimilating the DOMINO product than when assimilating the NASA standard product (Fig. S2).
However, even with improved observing systems, the impact of data assimilation will be limited because of the different complexities of chemical mechanisms (Huijnen et al., 2019; Miyazaki et al., 2020b), deposition processes (Hardacre et al., 2015; Young et al., 2018), and model physics, such as cloud formation and convective transport. Furthermore, VOCs such as formaldehyde (De Smedt et al., 2018) and isoprene (Wells et al., 2022) have not commonly been assimilated in the current chemical reanalysis systems. The lack of observations on important factors that determine chemical ozone formation underscores the need to fully exploit available observational information and causes underestimates of the value of the current observational system in the reanalysis framework.
Current chemical reanalysis systems employ various data assimilation techniques, including 3D-Var, 4D-Var, and the ensemble Kalman filter (EnKF). These approaches differ in their assumptions and concepts and therefore in their performance (Lorenc and Rawlins, 2005; Kalnay et al., 2007). 4D-Var and EnKF exhibit comparable performances for meteorological (Miyoshi et al., 2010) and chemical data assimilation (Wu et al., 2008; Skachko et al., 2014). A specific challenge in chemical data assimilation that differs from NWP is that chemical systems are stiff, non-chaotic, and highly dependent on input parameters such as emissions and kinetic parameters (Carmichael et al., 2008; Miyazaki et al., 2012a). Therefore, the optimization of precursor emissions is considered an essential component of ozone analysis and OSE to provide a more meaningful evaluation of the current observing system. The feasibility and performance of emission optimization using satellite observations which have limited sensitivity to the lower troposphere depend on data assimilation approaches. Nevertheless, optimizing precursor emissions using either online (i.e., simultaneous optimization of concentrations and emissions of various species) or offline (e.g., independent mass balance of a single species) approaches is important for improving the performance of OSE and reanalysis.
The OSEs presented in this study have important implications for improving the integration of future observations, including geostationary orbit (GEO) satellites and surface observations, in addition to low-Earth orbit (LEO) satellites. The current satellite-observing system provides unique and essential information that is essential for improving ozone analysis throughout the troposphere and stratosphere, as demonstrated in this study. However, the termination or retirement of current instruments such as OMI, MLS, MOPITT, and IASI in the near future may impact the ability to constrain whole troposphere ozone profiles effectively. More recent and future satellite measurements, such as TROPOMI, the Cross-track Infrared Sounder (CrIS), and IASI-New Generation (NG) offer the potential to maintain or even improve constraints on tropospheric ozone and its precursors. For instance, advances in TROPOMI NO2 assimilation compared to OMI NO2 assimilation, as demonstrated by Sekiya et al. (2022), highlight these capabilities. For UTLS ozone analysis, several measurements, such as the Ozone Mapping and Profiler Suite (OMPS) and SAGE III, continue to provide valuable profile measurements. Nevertheless, the uniqueness of MLS to observe through clouds and aerosols and a wide range of trace gases remains powerful in constraining the tropospheric ozone profiles and chemistry system. The development of follow-on missions, such as the Atmospheric Limb Tracker for Investigation of the Upcoming Stratosphere (ALTIUS) (Fussen et al., 2019) and the Stratosphere Troposphere Response using Infrared Vertically-Resolved Light Explorer (STRIVE), to fill the gaps is highly desirable for maintaining high-quality tropospheric ozone analysis. Assessing the observational impacts of these instruments through data assimilation is expected to provide critical information for optimizing the observation system. The multi-system analysis suggested that the model bias at the surface is hardly reduced by the assimilation of any satellites. This highlights the importance of the data assimilation in surface observations (Kong et al., 2021) and machine learning (ML)-based bias corrections (He et al., 2022). However, obtaining sufficient global coverage for a surface observing system remains a challenge. The simultaneous assimilation of LEO and GEO satellites, such as GEMS, TEMPO, and Sentinel-4, is expected to improve our understanding of non-linear ozone chemistry and its diurnal cycles at the urban scale across different regions. Moreover, such an assimilation will allow us to estimate uncertain model parameters, such as diurnal emission profiles, kinetic reactions, and photolysis rates (Zoogman et al., 2014; Timmermans et al., 2019; Quesada-Ruiz et al., 2020; Shu et al., 2023). Advanced data assimilation techniques such as 4D-Var and EnKF are required to simultaneously and effectively assimilate observations from different platforms.
The IGAC TOAR-II Chemical Reanalysis WG activities summarize the capabilities of current chemical reanalysis products for various scientific applications. In this study, we evaluated the relative impacts of assimilating satellite measurements of ozone and its precursors on surface and free-tropospheric ozone analysis using five global chemical reanalysis systems, namely CAMSRA, TCR-2, IASI-r, GEOS-Chem, and RAQMS, for 2010. The use of multiple reanalysis systems allows for observing system impact assessments that are less dependent on the performance of individual forecast models and the configurations of individual data assimilation systems. Without data assimilation, large standard deviations in the ozone concentrations between the different models were found in the control runs. For example, the standard deviations were 27 %, 8 %, and 9 % for UTLS, middle troposphere, and lower troposphere, respectively. Data assimilation improved the inter-system agreement and reduced the standard deviation to 3.2 %, 1.7 %, and 2.5 % for UTLS and the middle and lower troposphere, respectively. In most cases, the consistency with independent ozonesonde observations was also improved by data assimilation. After data assimilation, the RMSEs against global ozonesonde observations were reduced from 56 % to 30 % in the UTLS, from 28 % to 23 % in the middle troposphere, and from 27 % to 24 % in the lower troposphere. However, biases against surface in situ observations showed limited improvements after data assimilation in all of the reanalysis systems. This finding is likely related to the limited sensitivity of satellite observations in directly constraining surface ozone. This suggests that reanalysis surface ozone biases may be largely influenced by biases in the forecast models, such as the widely recognized positive bias over major polluted regions reported in various CTM and chemistry–climate model (CCM) simulations (Travis et al., 2016; Young et al., 2018; Turnock et al., 2020). Similar to CTMs and CCMs, the forecast models used in chemical reanalyses incorporate varying degrees of complexity in their chemical mechanisms. The maturity of these forecast models, including the effective optimization specifically applied for surface ozone, may have contributed to the smaller surface ozone biases observed in CAMSRA and RAQMS.
Although the assimilated observations varied among the reanalysis systems, we examined the relative impacts of satellite ozone and precursor measurements and their dependence on reanalysis systems with additional OSEs in similar settings across some of the systems. These OSEs suggested the importance of including precursor measurements, especially for NOx, to improve ozone analysis in the middle and lower troposphere over the northern mid-latitudes, which led to reductions of 58 %–92 % in the model ozone biases relative to ozonesonde observations. In addition, the impact of these measurements varied widely between the systems, ranging from +0.1 % (GEOS-Chem) to +7 % (TCR-2), reflecting model settings and assimilated satellite products. The impacts of direct ozone assimilation showed qualitatively similar latitudinal and vertical patterns between IASI-r and TCR-2, with increases by 6 %–22 % and decreases by 2 %–21 % in the middle troposphere and UTLS, respectively. The consistency with the ozonesonde observations was improved by the assimilation of ozone and its precursors, with bias reductions of up to 68 % over the tropical middle troposphere and up to 89 % over the middle troposphere over the northern mid-latitudes, respectively. The impacts of direct ozone assimilation were dominant for the UTLS, with bias reductions of up to 91 ± 9 % over the northern mid-latitudes.
In conclusion, the simultaneous assimilation of satellite measurements of stratospheric and tropospheric ozone and its precursors has proven to be an effective approach for improving the entire tropospheric ozone analysis. Despite variations in the forecast model performance, assimilated observations, and data assimilation settings across the reanalysis systems used in the intercomparison, data assimilation greatly improved the consistency among reanalysis products, as well as with independent observations. The overall good agreement suggests that the highly accurate reanalysis datasets are valuable for advancing our understanding of atmospheric composition variations and can also inform discussions on the development of observing systems. Meanwhile, multi-system OSEs qualitatively demonstrated that ozone analyses from the middle troposphere to the lower stratosphere are improved through the assimilation of satellite ozone observations, while analyses from the lower to middle troposphere benefit from the assimilation of ozone precursors. However, the impacts of ozone assimilation from satellite observations on ozone analysis vary widely across the reanalysis systems, suggesting that individual results may introduce biases when evaluating the value of specific observing systems. This underscores the importance of employing multiple systems to ensure robustness in assessing individual observing systems. Furthermore, these findings highlight the need to account for the forecast model performance and data assimilation configurations when conducting OSEs or Observing System Simulation Experiments (OSSEs). Such considerations, which have been lacking in previous observing system impact assessments, are essential to provide unbiased insights for designing future observing systems. Meanwhile, to draw more robust conclusions about the system dependence of observing system impact assessments, further studies involving intercomparisons of OSEs conducted with a more consistent and improved protocol compared to the present study are needed.
CAMS data are freely available from https://ads.atmosphere.copernicus.eu/datasets/cams-global-reanalysis-eac4?tab=overview (Inness et al., 2019b). TCR-2 data can publicly be accessed at https://doi.org/10.25966/9qgv-fe81 (Miyazaki et al., 2019b). RAQMS chemical reanalysis data are archived at the University of Wisconsin–Madison Space Science and Engineering Center (SSEC) and can be made available upon request to R. Bradley Pierce (rbpierce@wisc.edu). IASI-r data can be publicly accessed at https://b2share.cerfacs.fr/records/e3493962fb0e4e6b918d846b070de9d9 (Emili, 2021). GEOS-Chem adjoint top-down NOx emission data are available at https://doi.org/10.7910/DVN/HVT1FO (Qu et al., 2020).
The supplement related to this article is available online at https://doi.org/10.5194/acp-25-2243-2025-supplement.
KM, DJ, and HW designed the research. TS, EE, and WC performed the analysis. EE, KM, AI, ZQ, and RBP provided chemical reanalysis products and OSE results. All the authors wrote and edited the paper.
The contact author has declared that none of the authors has any competing interests.
Publisher’s note: Copernicus Publications remains neutral with regard to jurisdictional claims made in the text, published maps, institutional affiliations, or any other geographical representation in this paper. While Copernicus Publications makes every effort to include appropriate place names, the final responsibility lies with the authors.
This article is part of the special issue “Tropospheric Ozone Assessment Report Phase II (TOAR-II) Community Special Issue (ACP/AMT/BG/GMD inter-journal SI)”. It is a result of the Tropospheric Ozone Assessment Report, Phase II (TOAR-II, 2020–2024).
The Copernicus Atmosphere Monitoring Service is operated by the European Centre for Medium-Range Weather Forecasts (ECMWF) on behalf of the European Commission as part of the Copernicus Programme (http://copernicus.eu, last access: 1 August 2024). The TCR-2 product was generated by calculations using the Earth Simulator with the support of the Japan Agency for Marine-Earth Science and Technology. Part of this work was conducted at the Jet Propulsion Laboratory, California Institute of Technology, under contract with NASA. The RAQMS chemical reanalysis was supported by funding from the NASA Aura and Health and Air Quality (HAQ) science teams.
This research has been supported by the National Aeronautics and Space Administration (grant nos. 19-AURAST19-0044, 22-ACMAP22-0013, and 22-EUSPI22-0005), the Environmental Restoration and Conservation Agency (grant no. JPMEERF20222001), and the Japan Society for the Promotion of Science (grant nos. 22K12353 and 23H04971).
This paper was edited by Andreas Hofzumahaus and reviewed by two anonymous referees.
August, T., Klaes, D., Schlüssel, P., Hultberg, T., Crapeau, M., Arriaga, A., O'Carroll, A., Coppens, D., Munro, R., and Calbet, X.: IASI on Metop-A: Operational Level 2 retrievals after five years in orbit, J. Quant. Spectrosc. Ra., 113, 1340–1371, https://doi.org/10.1016/j.jqsrt.2012.02.028, 2012. a, b
Barré, J., Gaubert, B., Arellano, A. F. J., Worden, H. M., Edwards, D. P., Deeter, M. N., Anderson, J. L., Raeder, K., Collins, N., Tilmes, S., Francis, G., Clerbaux, C., Emmons, L. K., Pfister, G. G., Coheur, P.-F., and Hurtmans, D.: Assessing the impacts of assimilating IASI and MOPITT CO retrievals using CESM-CAM-chem and DART, J. Geophys. Res., 120, 10501–10529, https://doi.org/10.1002/2015JD023467, 2015. a
Beer, R.: TES on the aura mission: scientific objectives, measurements, and analysis overview, IEEE T. Geosci. Remote, 44, 1102–1105, https://doi.org/10.1109/TGRS.2005.863716, 2006. a
Boersma, K. F., Eskes, H. J., Veefkind, J. P., Brinksma, E. J., van der A, R. J., Sneep, M., van den Oord, G. H. J., Levelt, P. F., Stammes, P., Gleason, J. F., and Bucsela, E. J.: Near-real time retrieval of tropospheric NO2 from OMI, Atmos. Chem. Phys., 7, 2103–2118, https://doi.org/10.5194/acp-7-2103-2007, 2007. a
Boersma, K. F., Eskes, H., Richter, A., De Smedt, I., Lorente, A., Beirle, S., Van Geffen, J., Peters, E., Van Roozendael, M., and Wagner, T.: QA4ECV NO2 tropospheric and stratospheric vertical column data from OMI (Version 1.1), Royal Netherlands Meteorological Institute (KNMI) [data set], https://doi.org/10.21944/qa4ecv-no2-omi-v1.1, 2017a. a
Boersma, K. F., Eskes, H., Richter, A., De Smedt, I., Lorente, A., Beirle, S., Van Geffen, J., Peters, E., Van Roozendael, M., and Wagner, T.: QA4ECV NO2 tropospheric and stratospheric vertical column data from GOME-2A (Version 1.1), Royal Netherlands Meteorological Institute (KNMI) [data set], https://doi.org/10.21944/qa4ecv-no2-gome2a-v1.1, 2017b. a
Boersma, K. F., Eskes, H., Richter, A., De Smedt, I., Lorente, A., Beirle, S., Van Geffen, J., Peters, E., Van Roozendael, M., and Wagner, T.: QA4ECV NO2 tropospheric and stratospheric vertical column data from SCIAMACHY (Version 1.1), Royal Netherlands Meteorological Institute (KNMI) [data set], https://doi.org/10.21944/qa4ecv-no2-scia-v1.1, 2017c. a
Boxe, C. S., Worden, J. R., Bowman, K. W., Kulawik, S. S., Neu, J. L., Ford, W. C., Osterman, G. B., Herman, R. L., Eldering, A., Tarasick, D. W., Thompson, A. M., Doughty, D. C., Hoffmann, M. R., and Oltmans, S. J.: Validation of northern latitude Tropospheric Emission Spectrometer stare ozone profiles with ARC-IONS sondes during ARCTAS: sensitivity, bias and error analysis, Atmos. Chem. Phys., 10, 9901–9914, https://doi.org/10.5194/acp-10-9901-2010, 2010. a, b
Bruckner, M., Pierce, R. B., and Lenzen, A.: Examining ENSO-related variability in tropical tropospheric ozone in the RAQMS-Aura chemical reanalysis, Atmos. Chem. Phys., 24, 10921–10945, https://doi.org/10.5194/acp-24-10921-2024, 2024. a
Burrows, J. P., Weber, M., Buchwitz, M., Rozanov, V., Ladstätter-Weißenmayer, A., Richter, A., DeBeek, R., Hoogen, R., Bramstedt, K., Eichmann, K.-U., Eisinger, M., and Perner, D.: The Global Ozone Monitoring Experiment (GOME): Mission Concept and First Scientific Results, J. Atmos. Sci., 56, 151–175, https://doi.org/10.1175/1520-0469(1999)056<0151:TGOMEG>2.0.CO;2, 1999. a
Byrd, R. H., Lu, P., Nocedal, J., and Zhu, C.: A Limited Memory Algorithm for Bound Constrained Optimization, SIAM J. Sci. Comput., 16, 1190–1208, https://doi.org/10.1137/0916069, 1995. a
Callies, J., Corpaccioli, E., Eisinger, M., Hahne, A., and Lefebvre, A.: GOME-2- MetOp's second-generation sensor for operational ozone monitoring, ESA Bull., 102, 28–36, 2000. a, b
Cariolle, D. and Déqué, M.: Southern hemisphere medium-scale waves and total ozone disturbances in a spectral general circulation model, J. Geophys. Res., 91, 10825–10846, https://doi.org/10.1029/JD091iD10p10825, 1986. a
Cariolle, D. and Teyssèdre, H.: A revised linear ozone photochemistry parameterization for use in transport and general circulation models: multi-annual simulations, Atmos. Chem. Phys., 7, 2183–2196, https://doi.org/10.5194/acp-7-2183-2007, 2007. a, b
Carmichael, G. R., Sandu, A., Chai, T., Daescu, D. N., Constantinescu, E. M., and Tang, Y.: Predicting air quality: Improvements through advanced methods to integrate models and measurements, J. Comput. Phys., 227, 3540–3571, https://doi.org/10.1016/j.jcp.2007.02.024, 2008. a
Chang, K.-L., Cooper, O. R., Gaudel, A., Petropavlovskikh, I., Effertz, P., Morris, G., and McDonald, B. C.: Technical note: Challenges in detecting free tropospheric ozone trends in a sparsely sampled environment, Atmos. Chem. Phys., 24, 6197–6218, https://doi.org/10.5194/acp-24-6197-2024, 2024. a
Courtier, P., Thépaut, J.-N., and Hollingsworth, A.: A strategy for operational implementation of 4D-Var, using an incremental approach, Q. J. Roy. Meteor. Soc., 120, 1367–1387, https://doi.org/10.1002/qj.49712051912, 1994. a
De Smedt, I., Theys, N., Yu, H., Danckaert, T., Lerot, C., Compernolle, S., Van Roozendael, M., Richter, A., Hilboll, A., Peters, E., Pedergnana, M., Loyola, D., Beirle, S., Wagner, T., Eskes, H., van Geffen, J., Boersma, K. F., and Veefkind, P.: Algorithm theoretical baseline for formaldehyde retrievals from S5P TROPOMI and from the QA4ECV project, Atmos. Meas. Tech., 11, 2395–2426, https://doi.org/10.5194/amt-11-2395-2018, 2018. a, b
Dee, D. P., Uppala, S. M., Simmons, A. J., Berrisford, P., Poli, P., Kobayashi, S., Andrae, U., Balmaseda, M. A., Balsamo, G., Bauer, P., Bechtold, P., Beljaars, A. C. M., van de Berg, L., Bidlot, J., Bormann, N., Delsol, C., Dragani, R., Fuentes, M., Geer, A. J., Haimberger, L., Healy, S. B., Hersbach, H., Hólm, E. V., Isaksen, L., Kållberg, P., Köhler, M., Matricardi, M., McNally, A. P., Monge-Sanz, B. M., Morcrette, J.-J., Park, B.-K., Peubey, C., de Rosnay, P., Tavolato, C., Thépaut, J.-N., and Vitart, F.: The ERA-Interim reanalysis: configuration and performance of the data assimilation system, Q. J. Roy. Meteor. Soc., 137, 553–597, https://doi.org/10.1002/qj.828, 2011. a, b
Deeter, M. N., Edwards, D. P., Francis, G. L., Gille, J. C., Martínez-Alonso, S., Worden, H. M., and Sweeney, C.: A climate-scale satellite record for carbon monoxide: the MOPITT Version 7 product, Atmos. Meas. Tech., 10, 2533–2555, https://doi.org/10.5194/amt-10-2533-2017, 2017. a
Drummond, J. R., Zou, J., Nichitiu, F., Kar, J., Deschambaut, R., and Hackett, J.: A review of 9-year performance and operation of the MOPITT instrument, Adv. Space Res., 45, 760–774, https://doi.org/10.1016/j.asr.2009.11.019, 2010. a
East, J. D., Henderson, B. H., Napelenok, S. L., Koplitz, S. N., Sarwar, G., Gilliam, R., Lenzen, A., Tong, D. Q., Pierce, R. B., and Garcia-Menendez, F.: Inferring and evaluating satellite-based constraints on NOx emissions estimates in air quality simulations, Atmos. Chem. Phys., 22, 15981–16001, https://doi.org/10.5194/acp-22-15981-2022, 2022. a
El Aabaribaoune, M., Emili, E., and Guidard, V.: Estimation of the error covariance matrix for IASI radiances and its impact on the assimilation of ozone in a chemistry transport model, Atmos. Meas. Tech., 14, 2841–2856, https://doi.org/10.5194/amt-14-2841-2021, 2021. a, b
Elshorbany, Y., Ziemke, J. R., Strode, S., Petetin, H., Miyazaki, K., De Smedt, I., Pickering, K., Seguel, R. J., Worden, H., Emmerichs, T., Taraborrelli, D., Cazorla, M., Fadnavis, S., Buchholz, R. R., Gaubert, B., Rojas, N. Y., Nogueira, T., Salameh, T., and Huang, M.: Tropospheric ozone precursors: global and regional distributions, trends, and variability, Atmos. Chem. Phys., 24, 12225–12257, https://doi.org/10.5194/acp-24-12225-2024, 2024. a
Emili, E.: Input and output files for the numerical experiments discussed in GMD-2020-315, EUDAT Collaborative Data Infrastructure [data set], https://b2share.cerfacs.fr/records/e3493962fb0e4e6b918d846b070de9d9 (last access: 1 August 2024), 2021.
Emili, E. and El Aabaribaoune, M.: Impact of Infrared Atmospheric Sounding Interferometer (IASI) thermal infrared measurements on global ozone reanalyses, Geosci. Model Dev., 14, 6291–6308, https://doi.org/10.5194/gmd-14-6291-2021, 2021. a, b, c, d, e
Emili, E., Barret, B., Massart, S., Le Flochmoen, E., Piacentini, A., El Amraoui, L., Pannekoucke, O., and Cariolle, D.: Combined assimilation of IASI and MLS observations to constrain tropospheric and stratospheric ozone in a global chemical transport model, Atmos. Chem. Phys., 14, 177–198, https://doi.org/10.5194/acp-14-177-2014, 2014. a
Emili, E., Barret, B., Le Flochmoën, E., and Cariolle, D.: Comparison between the assimilation of IASI Level 2 ozone retrievals and Level 1 radiances in a chemical transport model, Atmos. Meas. Tech., 12, 3963–3984, https://doi.org/10.5194/amt-12-3963-2019, 2019. a
Evensen, G.: The ensemble Kalman filter for combined state and parameter estimation, IEEE Contr. Syst. Mag., 29, 83–104, 2009. a
Fleming, Z. L., Doherty, R. M., von Schneidemesser, E., Malley, C. S., Cooper, O. R., Pinto, J. P., Colette, A., Xu, X., Simpson, D., Schultz, M. G., Lefohn, A. S., Hamad, S., Moolla, R., Solberg, S., and Feng, Z.: Tropospheric Ozone Assessment Report: Present-day ozone distribution and trends relevant to human health, Elementa: Science of the Anthropocene, 6, 12, https://doi.org/10.1525/elementa.273, 2018. a
Flemming, J., Huijnen, V., Arteta, J., Bechtold, P., Beljaars, A., Blechschmidt, A.-M., Diamantakis, M., Engelen, R. J., Gaudel, A., Inness, A., Jones, L., Josse, B., Katragkou, E., Marecal, V., Peuch, V.-H., Richter, A., Schultz, M. G., Stein, O., and Tsikerdekis, A.: Tropospheric chemistry in the Integrated Forecasting System of ECMWF, Geosci. Model Dev., 8, 975–1003, https://doi.org/10.5194/gmd-8-975-2015, 2015. a
Flemming, J., Benedetti, A., Inness, A., Engelen, R. J., Jones, L., Huijnen, V., Remy, S., Parrington, M., Suttie, M., Bozzo, A., Peuch, V.-H., Akritidis, D., and Katragkou, E.: The CAMS interim Reanalysis of Carbon Monoxide, Ozone and Aerosol for 2003–2015, Atmos. Chem. Phys., 17, 1945–1983, https://doi.org/10.5194/acp-17-1945-2017, 2017. a
Froidevaux, L., Jiang, Y. B., Lambert, A., Livesey, N. J., Read, W. G., Waters, J. W., Browell, E. V., and coauthors: Validation of Aura Microwave Limb Sounder Stratospheric Ozone Measurements, J. Geophys. Res., 113, D15S20, https://doi.org/10.1029/2007JD008771, 2008. a
Fussen, D., Baker, N., Debosscher, J., Dekemper, E., Demoulin, P., Errera, Q., Franssens, G., Mateshvili, N., Pereira, N., Pieroux, D., and Vanhellemont, F.: The ALTIUS atmospheric limb sounder, J. Quant. Spectrosc. Ra., 238, 106542, https://doi.org/10.1016/j.jqsrt.2019.06.021, 2019. a
Gaubert, B., Arellano Jr., A. F., Barré, J., Worden, H. M., Emmons, L. K., Tilmes, S., Buchholz, R. R., Vitt, F., Raeder, K., Collins, N., Anderson, J. L., Wiedinmyer, C., Martinez Alonso, S., Edwards, D. P., Andreae, M. O., Hannigan, J. W., Petri, C., Strong, K., and Jones, N.: Toward a chemical reanalysis in a coupled chemistry-climate model: An evaluation of MOPITT CO assimilation and its impact on tropospheric composition, J. Geophys. Res., 121, 7310–7343, https://doi.org/10.1002/2016JD024863, 2016. a
Gaudel, A., Cooper, O. R., Ancellet, G., Barret, B., Boynard, A., Burrows, J. P., Clerbaux, C., Coheur, P.-F., Cuesta, J., Cuevas, E., Doniki, S., Dufour, G., Ebojie, F., Foret, G., Garcia, O., Granados-Muñoz, M. J., Hannigan, J. W., Hase, F., Hassler, B., Huang, G., Hurtmans, D., Jaffe, D., Jones, N., Kalabokas, P., Kerridge, B., Kulawik, S., Latter, B., Leblanc, T., Le Flochmoën, E., Lin, W., Liu, J., Liu, X., Mahieu, E., McClure-Begley, A., Neu, J. L., Osman, M., Palm, M., Petetin, H., Petropavlovskikh, I., Querel, R., Rahpoe, N., Rozanov, A., Schultz, M. G., Schwab, J., Siddans, R., Smale, D., Steinbacher, M., Tanimoto, H., Tarasick, D. W., Thouret, V., Thompson, A. M., Trickl, T., Weatherhead, E., Wespes, C., Worden, H. M., Vigouroux, C., Xu, X., Zeng, G., and Ziemke, J.: Tropospheric Ozone Assessment Report: Present-day distribution and trends of tropospheric ozone relevant to climate and global atmospheric chemistry model evaluation, Elementa: Science of the Anthropocene, 6, 39, https://doi.org/10.1525/elementa.291, 2018. a
Gaudel, A., Bourgeois, I., Li, M., Chang, K.-L., Ziemke, J., Sauvage, B., Stauffer, R. M., Thompson, A. M., Kollonige, D. E., Smith, N., Hubert, D., Keppens, A., Cuesta, J., Heue, K.-P., Veefkind, P., Aikin, K., Peischl, J., Thompson, C. R., Ryerson, T. B., Frost, G. J., McDonald, B. C., and Cooper, O. R.: Tropical tropospheric ozone distribution and trends from in situ and satellite data, Atmos. Chem. Phys., 24, 9975–10000, https://doi.org/10.5194/acp-24-9975-2024, 2024. a
Giglio, L., Randerson, J. T., and van der Werf, G. R.: Analysis of daily, monthly, and annual burned area using the fourth-generation global fire emissions database (GFED4), J. Geophys. Res., 118, 317–328, https://doi.org/10.1002/jgrg.20042, 2013. a
Graedel, T. E., Bates, T. S., Bouwman, A. F., Cunnold, D., Dignon, J., Fung, I., Jacob, D. J., Lamb, B. K., Logan, J. A., Marland, G., Middleton, P., Pacyna, J. M., Placet, M., and Veldt, C.: A compilation of inventories of emissions to the atmosphere, Global Biogeochem. Cy., 7, 1–26, https://doi.org/10.1029/92GB02793, 1993. a
Granier, C., Bessagnet, B., Bond, T., D'Angiola, A., Denier van der Gon, H., Frost, G. J., Heil, A., Kaiser, J. W., Kinne, S., Klimont, Z., Kloster, S., Lamarque, J.-F., Liousse, C., Masui, T., Meleux, F., Mieville, A., Ohara, T., Raut, J.-C., Riahi, K., Schultz, M. G., Smith, S. J., Thompson, A., van Aardenne, J., van der Werf, G. R., and van Vuuren, D. P.: Evolution of anthropogenic and biomass burning emissions of air pollutants at global and regional scales during the 1980–2010 period, Climatic Change, 109, 163, https://doi.org/10.1007/s10584-011-0154-1, 2011. a
Hanea, R. G., Velders, G. J. M., and Heemink, A.: Data assimilation of ground-level ozone in Europe with a Kalman filter and chemistry transport model, J. Geophys. Res., 109, D10302, https://doi.org/10.1029/2003JD004283, 2004. a
Hardacre, C., Wild, O., and Emberson, L.: An evaluation of ozone dry deposition in global scale chemistry climate models, Atmos. Chem. Phys., 15, 6419–6436, https://doi.org/10.5194/acp-15-6419-2015, 2015. a
He, T.-L., Jones, D. B. A., Miyazaki, K., Huang, B., Liu, Y., Jiang, Z., White, E. C., Worden, H. M., and Worden, J. R.: Deep Learning to Evaluate US NOx Emissions Using Surface Ozone Predictions, J. Geophys. Res., 127, e2021JD035597, https://doi.org/10.1029/2021JD035597, 2022. a
Henze, D. K., Hakami, A., and Seinfeld, J. H.: Development of the adjoint of GEOS-Chem, Atmos. Chem. Phys., 7, 2413–2433, https://doi.org/10.5194/acp-7-2413-2007, 2007. a
Huang, M., Carmichael, G. R., Chai, T., Pierce, R. B., Oltmans, S. J., Jaffe, D. A., Bowman, K. W., Kaduwela, A., Cai, C., Spak, S. N., Weinheimer, A. J., Huey, L. G., and Diskin, G. S.: Impacts of transported background pollutants on summertime western US air quality: model evaluation, sensitivity analysis and data assimilation, Atmos. Chem. Phys., 13, 359–391, https://doi.org/10.5194/acp-13-359-2013, 2013. a
Huijnen, V., Williams, J., van Weele, M., van Noije, T., Krol, M., Dentener, F., Segers, A., Houweling, S., Peters, W., de Laat, J., Boersma, F., Bergamaschi, P., van Velthoven, P., Le Sager, P., Eskes, H., Alkemade, F., Scheele, R., Nédélec, P., and Pätz, H.-W.: The global chemistry transport model TM5: description and evaluation of the tropospheric chemistry version 3.0, Geosci. Model Dev., 3, 445–473, https://doi.org/10.5194/gmd-3-445-2010, 2010. a
Huijnen, V., Pozzer, A., Arteta, J., Brasseur, G., Bouarar, I., Chabrillat, S., Christophe, Y., Doumbia, T., Flemming, J., Guth, J., Josse, B., Karydis, V. A., Marécal, V., and Pelletier, S.: Quantifying uncertainties due to chemistry modelling – evaluation of tropospheric composition simulations in the CAMS model (cycle 43R1), Geosci. Model Dev., 12, 1725–1752, https://doi.org/10.5194/gmd-12-1725-2019, 2019. a
Huijnen, V., Miyazaki, K., Flemming, J., Inness, A., Sekiya, T., and Schultz, M. G.: An intercomparison of tropospheric ozone reanalysis products from CAMS, CAMS interim, TCR-1, and TCR-2, Geosci. Model Dev., 13, 1513–1544, https://doi.org/10.5194/gmd-13-1513-2020, 2020. a
Hunt, B. R., Kostelich, E. J., and Szunyogh, I.: Efficient data assimilation for spatiotemporal chaos: A local ensemble transform Kalman filter, Physica D, 230, 112–126, https://doi.org/10.1016/j.physd.2006.11.008, 2007. a
Inness, A., Baier, F., Benedetti, A., Bouarar, I., Chabrillat, S., Clark, H., Clerbaux, C., Coheur, P., Engelen, R. J., Errera, Q., Flemming, J., George, M., Granier, C., Hadji-Lazaro, J., Huijnen, V., Hurtmans, D., Jones, L., Kaiser, J. W., Kapsomenakis, J., Lefever, K., Leitão, J., Razinger, M., Richter, A., Schultz, M. G., Simmons, A. J., Suttie, M., Stein, O., Thépaut, J.-N., Thouret, V., Vrekoussis, M., Zerefos, C., and the MACC team: The MACC reanalysis: an 8 yr data set of atmospheric composition, Atmos. Chem. Phys., 13, 4073–4109, https://doi.org/10.5194/acp-13-4073-2013, 2013. a
Inness, A., Ades, M., Agustí-Panareda, A., Barré, J., Benedictow, A., Blechschmidt, A.-M., Dominguez, J. J., Engelen, R., Eskes, H., Flemming, J., Huijnen, V., Jones, L., Kipling, Z., Massart, S., Parrington, M., Peuch, V.-H., Razinger, M., Remy, S., Schulz, M., and Suttie, M.: The CAMS reanalysis of atmospheric composition, Atmos. Chem. Phys., 19, 3515–3556, https://doi.org/10.5194/acp-19-3515-2019, 2019a. a, b, c, d, e, f
Inness, A., Ades, M., Agustí-Panareda, A., Barré, J., Benedictow, A., Blechschmidt, A., Dominguez, J., Engelen, R., Eskes, H., Flemming, J., Huijnen, V., Jones, L., Kipling, Z., Massart, S., Parrington, M., Peuch, V.-H., Razinger M., Remy, S., Schulz, M. and Suttie, M.: CAMS global reanalysis (EAC4), Copernicus Atmosphere Monitoring Service (CAMS) Atmosphere Data Store (ADS) [data set], https://ads.atmosphere.copernicus.eu/datasets/cams-global-reanalysis-eac4?tab=overview (last access: 1 August 2024), 2019b.
Inness, A., Aben, I., Ades, M., Borsdorff, T., Flemming, J., Jones, L., Landgraf, J., Langerock, B., Nedelec, P., Parrington, M., and Ribas, R.: Assimilation of S5P/TROPOMI carbon monoxide data with the global CAMS near-real-time system, Atmos. Chem. Phys., 22, 14355–14376, https://doi.org/10.5194/acp-22-14355-2022, 2022. a
Janssens-Maenhout, G., Crippa, M., Guizzardi, D., Dentener, F., Muntean, M., Pouliot, G., Keating, T., Zhang, Q., Kurokawa, J., Wankmüller, R., Denier van der Gon, H., Kuenen, J. J. P., Klimont, Z., Frost, G., Darras, S., Koffi, B., and Li, M.: HTAP_v2.2: a mosaic of regional and global emission grid maps for 2008 and 2010 to study hemispheric transport of air pollution, Atmos. Chem. Phys., 15, 11411–11432, https://doi.org/10.5194/acp-15-11411-2015, 2015. a, b
Jin, X., Fiore, A., Boersma, K. F., Smedt, I. D., and Valin, L.: Inferring Changes in Summertime Surface Ozone–NOx–VOC Chemistry over U.S. Urban Areas from Two Decades of Satellite and Ground-Based Observations, Environ. Sci. Technol., 54, 6518–6529, https://doi.org/10.1021/acs.est.9b07785, 2020. a
Josse, B., Simon, P., and Peuch, V.: Radon global simulations with the multiscale chemistry and transport model MOCAGE, Tellus B, 56, 339–356, https://doi.org/10.1111/j.1600-0889.2004.00112.x, 2004. a
Kaiser, J. W., Heil, A., Andreae, M. O., Benedetti, A., Chubarova, N., Jones, L., Morcrette, J.-J., Razinger, M., Schultz, M. G., Suttie, M., and van der Werf, G. R.: Biomass burning emissions estimated with a global fire assimilation system based on observed fire radiative power, Biogeosciences, 9, 527–554, https://doi.org/10.5194/bg-9-527-2012, 2012. a
Kalnay, E., Li, H., Miyoshi, T., Yang, S.-C., and Ballabrera-Poy, J.: 4-D-Var or ensemble Kalman filter?, Tellus A, 59, 758–773, https://doi.org/10.1111/j.1600-0870.2007.00261.x, 2007. a
Kleist, D. T., Parrish, D. F., Derber, J. C., Treadon, R., Wu, W.-S., and Lord, S.: Introduction of the GSI into the NCEP Global Data Assimilation System, Weather Forecast., 24, 1691–1705, https://doi.org/10.1175/2009WAF2222201.1, 2009. a
Kong, L., Tang, X., Zhu, J., Wang, Z., Li, J., Wu, H., Wu, Q., Chen, H., Zhu, L., Wang, W., Liu, B., Wang, Q., Chen, D., Pan, Y., Song, T., Li, F., Zheng, H., Jia, G., Lu, M., Wu, L., and Carmichael, G. R.: A 6-year-long (2013–2018) high-resolution air quality reanalysis dataset in China based on the assimilation of surface observations from CNEMC, Earth Syst. Sci. Data, 13, 529–570, https://doi.org/10.5194/essd-13-529-2021, 2021. a
Krotkov, N. A., Lamsal, L. N., Celarier, E. A., Swartz, W. H., Marchenko, S. V., Bucsela, E. J., Chan, K. L., Wenig, M., and Zara, M.: The version 3 OMI NO2 standard product, Atmos. Meas. Tech., 10, 3133–3149, https://doi.org/10.5194/amt-10-3133-2017, 2017. a
Lahoz, W., Khattatov, B., and Menard, R.: Data Assimilation: Making Sense of Observations, Springer Berlin Heidelberg, ISBN 9783540747024, 2010. a
Lee, H.-J., Chang, L.-S., Jaffe, D. A., Bak, J., Liu, X., Abad, G. G., Jo, H.-Y., Jo, Y.-J., Lee, J.-B., Yang, G.-H., Kim, J.-M., and Kim, C.-H.: Satellite-Based Diagnosis and Numerical Verification of Ozone Formation Regimes over Nine Megacities in East Asia, Remote Sens., 14, 1285, https://doi.org/10.3390/rs14051285, 2022. a
Levelt, P., van den Oord, G., Dobber, M., Malkki, A., Visser, H., de Vries, J., Stammes, P., Lundell, J., and Saari, H.: The ozone monitoring instrument, IEEE T. Geosci. Remote, 44, 1093–1101, https://doi.org/10.1109/TGRS.2006.872333, 2006. a
Li, C., Joiner, J., Krotkov, N. A., and Bhartia, P. K.: A fast and sensitive new satellite SO2 retrieval algorithm based on principal component analysis: Application to the ozone monitoring instrument, Geophys. Res. Lett., 40, 6314–6318, https://doi.org/10.1002/2013GL058134, 2013. a
Livesey, N. J., Read, W. G., Wagner, P. A., Froidevaux, L., Lambert, A., Manney, G. L., Millán Valle, L. F., Pumphrey, H. C., Santee, M. L., Schwartz, M. J., Wang, S., Fuller, R. A., Jarnot, R. F., Knosp, B. W., Martinez, E., and Lay, R. R.: Aura Microwave Limb Sounder (MLS) Version 4.2x Level2 data quality and description document, Tech. rep., Jet Propul. Lab., Pasadena, CA, tech. Rep. JPL D33509 Rev. D, https://mls.jpl.nasa.gov/data/v4-2_data_quality_document.pdf (last access: 1 August 2024), 2018. a
Lorenc, A. C. and Rawlins, F.: Why does 4D-Var beat 3D-Var?, Q. J. Roy. Meteor. Soc., 131, 3247–3257, https://doi.org/10.1256/qj.05.85, 2005. a
McPeters, R., Kroon, M., Labow, G., Brinksma, E., Balis, D., Petropavlovskikh, I., Veefkind, J. P., Bhartia, P. K., and Levelt, P. F.: Validation of the Aura Ozone Monitoring Instrument Total Column Ozone Product, J. Geophys. Res., 113, D15S14, https://doi.org/10.1029/2007JD008802, 2008. a
Mills, G., Pleijel, H., Malley, C. S., Sinha, B., Cooper, O. R., Schultz, M. G., Neufeld, H. S., Simpson, D., Sharps, K., Feng, Z., Gerosa, G., Harmens, H., Kobayashi, K., Saxena, P., Paoletti, E., Sinha, V., and Xu, X.: Tropospheric Ozone Assessment Report: Present-day tropospheric ozone distribution and trends relevant to vegetation, Elementa: Science of the Anthropocene, 6, 47, https://doi.org/10.1525/elementa.302, 2018. a
Miyazaki, K. and Bowman, K.: Evaluation of ACCMIP ozone simulations and ozonesonde sampling biases using a satellite-based multi-constituent chemical reanalysis, Atmos. Chem. Phys., 17, 8285–8312, https://doi.org/10.5194/acp-17-8285-2017, 2017. a
Miyazaki, K., Eskes, H. J., and Sudo, K.: Global NOx emission estimates derived from an assimilation of OMI tropospheric NO2 columns, Atmos. Chem. Phys., 12, 2263–2288, https://doi.org/10.5194/acp-12-2263-2012, 2012a. a
Miyazaki, K., Eskes, H. J., Sudo, K., Takigawa, M., van Weele, M., and Boersma, K. F.: Simultaneous assimilation of satellite NO2, O3, CO, and HNO3 data for the analysis of tropospheric chemical composition and emissions, Atmos. Chem. Phys., 12, 9545–9579, https://doi.org/10.5194/acp-12-9545-2012, 2012b. a
Miyazaki, K., Sekiya, T., Fu, D., Bowman, K. W., Kulawik, S. S., Sudo, K., Walker, T., Kanaya, Y., Takigawa, M., Ogochi, K., Eskes, H., Boersma, K. F., Thompson, A. M., Gaubert, B., Barre, J., and Emmons, L. K.: Balance of Emission and Dynamical Controls on Ozone During the Korea-United States Air Quality Campaign From Multiconstituent Satellite Data Assimilation, J. Geophys. Res., 124, 387–413, https://doi.org/10.1029/2018JD028912, 2019a. a, b
Miyazaki, K., Bowman, K., Sekiya, T., Eskes, H., Boersma, F., Worden, H., Livesey, N., Payne, V. H., Sudo, K., Kanaya, Y., Takigawa, M., and Ogochi, K.: Chemical Reanalysis Products, Jet Propulsion Laboratory [data set], https://doi.org/10.25966/9qgv-fe81, 2019b.
Miyazaki, K., Bowman, K., Sekiya, T., Eskes, H., Boersma, F., Worden, H., Livesey, N., Payne, V. H., Sudo, K., Kanaya, Y., Takigawa, M., and Ogochi, K.: Updated tropospheric chemistry reanalysis and emission estimates, TCR-2, for 2005–2018, Earth Syst. Sci. Data, 12, 2223–2259, https://doi.org/10.5194/essd-12-2223-2020, 2020a. a, b, c, d
Miyazaki, K., Bowman, K. W., Yumimoto, K., Walker, T., and Sudo, K.: Evaluation of a multi-model, multi-constituent assimilation framework for tropospheric chemical reanalysis, Atmos. Chem. Phys., 20, 931–967, https://doi.org/10.5194/acp-20-931-2020, 2020b. a, b, c, d
Miyoshi, T., Sato, Y., and Kadowaki, T.: Ensemble Kalman Filter and 4D-Var Intercomparison with the Japanese Operational Global Analysis and Prediction System, Mon. Weather Rev., 138, 2846–2866, https://doi.org/10.1175/2010MWR3209.1, 2010. a
Naus, S., Domingues, L. G., Krol, M., Luijkx, I. T., Gatti, L. V., Miller, J. B., Gloor, E., Basu, S., Correia, C., Koren, G., Worden, H. M., Flemming, J., Pétron, G., and Peters, W.: Sixteen years of MOPITT satellite data strongly constrain Amazon CO fire emissions, Atmos. Chem. Phys., 22, 14735–14750, https://doi.org/10.5194/acp-22-14735-2022, 2022. a
Park, S., Son, S.-W., Jung, M.-I., Park, J., and Park, S. S.: Evaluation of tropospheric ozone reanalyses with independent ozonesonde observations in East Asia, Geosci. Lett., 7, 12, https://doi.org/10.1186/s40562-020-00161-9, 2020. a
Parrington, M., Jones, D. B. A., Bowman, K. W., Thompson, A. M., Tarasick, D. W., Merrill, J., Oltmans, S. J., Leblanc, T., Witte, J. C., and Millet, D. B.: Impact of the assimilation of ozone from the Tropospheric Emission Spectrometer on surface ozone across North America, Geophys. Res. Lett., 36, L04802, https://doi.org/10.1029/2008GL036935, 2009. a
Parrish, D. F. and Derber, J. C.: The National Meteorological Center's Spectral Statistical-Interpolation Analysis System, Mon. Weather Rev., 120, 1747–1763, https://doi.org/10.1175/1520-0493(1992)120<1747:TNMCSS>2.0.CO;2, 1992. a
Peiro, H., Emili, E., Cariolle, D., Barret, B., and Le Flochmoën, E.: Multi-year assimilation of IASI and MLS ozone retrievals: variability of tropospheric ozone over the tropics in response to ENSO, Atmos. Chem. Phys., 18, 6939–6958, https://doi.org/10.5194/acp-18-6939-2018, 2018. a, b
Peuch, V.-H., Engelen, R., Rixen, M., Dee, D., Flemming, J., Suttie, M., Ades, M., Agustí-Panareda, A., Ananasso, C., Andersson, E., Armstrong, D., Barré, J., Bousserez, N., Dominguez, J. J., Garrigues, S., Inness, A., Jones, L., Kipling, Z., Letertre-Danczak, J., Parrington, M., Razinger, M., Ribas, R., Vermoote, S., Yang, X., Simmons, A., de Marcilla, J. G., and Thépaut, J.-N.: The Copernicus Atmosphere Monitoring Service: From Research to Operations, B. Am. Meteorol. Soc., 103, E2650–E2668, https://doi.org/10.1175/BAMS-D-21-0314.1, 2022. a
Pierce, R. B., Al-Saadi, J., Kittaka, C., Schaack, T., Lenzen, A., Bowman, K., Szykman, J., Soja, A., Ryerson, T., Thompson, A. M., Bhartia, P., and Morris, G. A.: Impacts of background ozone production on Houston and Dallas, Texas, air quality during the Second Texas Air Quality Study field mission, J. Geophys. Res., 114, D00F09, https://doi.org/10.1029/2008JD011337, 2009. a, b, c
Qu, Z., Henze, D. K., Capps, S. L., Wang, Y., Xu, X., Wang, J., and Keller, M.: Monthly top-down NOx emissions for China (2005–2012): A hybrid inversion method and trend analysis, J. Geophys. Res., 122, 4600–4625, https://doi.org/10.1002/2016JD025852, 2017. a, b, c
Qu, Z., Henze, D. K., Li, C., Theys, N., Wang, Y., Wang, J., Wang, W., Han, J., Shim, C., Dickerson, R. R., and Ren, X.: SO2 Emission Estimates Using OMI SO2 Retrievals for 2005–2017, J. Geophys. Res., 124, 8336–8359, https://doi.org/10.1029/2019JD030243, 2019a. a
Qu, Z., Henze, D. K., Theys, N., Wang, J., and Wang, W.: Hybrid Mass Balance/4D-Var Joint Inversion of NOx and SO2 Emissions in East Asia, J. Geophys. Res., 124, 8203–8224, https://doi.org/10.1029/2018JD030240, 2019b. a
Qu, Z., Henze, D. K., Cooper, O. R., and Neu, J. L.: Impacts of global NOx inversions on NO2 and ozone simulations, Atmos. Chem. Phys., 20, 13109–13130, https://doi.org/10.5194/acp-20-13109-2020, 2020a. a, b, c, d, e
Qu, Z., Henze, D. K., Cooper, O. R., and Neu, J. L.: Global (2° × 2.5°) top-down NOx emissions from OMI NASA product (2005–2016), Harvard Dataverse [data set], https://doi.org/10.7910/DVN/HVT1FO, 2020b.
Quesada-Ruiz, S., Attié, J.-L., Lahoz, W. A., Abida, R., Ricaud, P., El Amraoui, L., Zbinden, R., Piacentini, A., Joly, M., Eskes, H., Segers, A., Curier, L., de Haan, J., Kujanpää, J., Oude Nijhuis, A. C. P., Tamminen, J., Timmermans, R., and Veefkind, P.: Benefit of ozone observations from Sentinel-5P and future Sentinel-4 missions on tropospheric composition, Atmos. Meas. Tech., 13, 131–152, https://doi.org/10.5194/amt-13-131-2020, 2020. a
Randerson, J., van der Werf, G., Giglio, L., Collatz, G., and Kasibhatla, P.: Global Fire Emissions Database, ORNL DAAC [data set], https://doi.org/10.3334/ORNLDAAC/1293, 2018. a
Remer, L. A., Kaufman, Y. J., Tanré, D., Mattoo, S., Chu, D. A., Martins, J. V., Li, R. R., and coauthors: The MODIS Aerosol Algorithm, Products, and Validation, J. Atmos. Sci., 62, 947–973, https://doi.org/10.1175/JAS3385.1, 2005. a
Ren, J., Guo, F., and Xie, S.: Diagnosing ozone–NOx–VOC sensitivity and revealing causes of ozone increases in China based on 2013–2021 satellite retrievals, Atmos. Chem. Phys., 22, 15035–15047, https://doi.org/10.5194/acp-22-15035-2022, 2022. a
Ryu, Y.-H. and Min, S.-K.: Long-term evaluation of atmospheric composition reanalyses from CAMS, TCR-2, and MERRA-2 over South Korea: Insights into applications, implications, and limitations, Atmos. Environ., 246, 118062, https://doi.org/10.1016/j.atmosenv.2020.118062, 2021. a
Schaack, T. K., Zapotocny, T. H., Lenzen, A. J., and Johnson, D. R.: Global Climate Simulation with the University of Wisconsin Global Hybrid Isentropic Coordinate Model, J. Climate, 17, 2998–3016, https://doi.org/10.1175/1520-0442(2004)017<2998:GCSWTU>2.0.CO;2, 2004. a
Schoeberl, M. R., Ziemke, J. R., Bojkov, B., Livesey, N., Duncan, B., Strahan, S., Froidevaux, L., Kulawik, S., Bhartia, P. K., Chandra, S., Levelt, P. F., Witte, J. C., Thompson, A. M., Cuevas, E., Redondas, A., Tarasick, D. W., Davies, J., Bodeker, G., Hansen, G., Johnson, B. J., Oltmans, S. J., Vömel, H., Allaart, M., Kelder, H., Newchurch, M., Godin-Beekmann, S., Ancellet, G., Claude, H., Andersen, S. B., Kyrö, E., Parrondos, M., Yela, M., Zablocki, G., Moore, D., Dier, H., von der Gathen, P., Viatte, P., Stübi, R., Calpini, B., Skrivankova, P., Dorokhov, V., de Backer, H., Schmidlin, F. J., Coetzee, G., Fujiwara, M., Thouret, V., Posny, F., Morris, G., Merrill, J., Leong, C. P., Koenig-Langlo, G., and Joseph, E.: A trajectory-based estimate of the tropospheric ozone column using the residual method, J. Geophys. Res., 112, D24S49, https://doi.org/10.1029/2007JD008773, 2007. a
Schultz, M. G., Schröder, S., Lyapina, O., Cooper, O. R., Galbally, I., Petropavlovskikh, I., von Schneidemesser, E., Tanimoto, H., Elshorbany, Y., Naja, M., Seguel, R. J., Dauert, U., Eckhardt, P., Feigenspan, S., Fiebig, M., Hjellbrekke, A.-G., Hong, Y.-D., Kjeld, P. C., Koide, H., Lear, G., Tarasick, D., Ueno, M., Wallasch, M., Baumgardner, D., Chuang, M.-T., Gillett, R., Lee, M., Molloy, S., Moolla, R., Wang, T., Sharps, K., Adame, J. A., Ancellet, G., Apadula, F., Artaxo, P., Barlasina, M. E., Bogucka, M., Bonasoni, P., Chang, L., Colomb, A., Cuevas-Agulló, E., Cupeiro, M., Degorska, A., Ding, A., Fröhlich, M., Frolova, M., Gadhavi, H., Gheusi, F., Gilge, S., Gonzalez, M. Y., Gros, V., Hamad, S. H., Helmig, D., Henriques, D., Hermansen, O., Holla, R., Hueber, J., Im, U., Jaffe, D. A., Komala, N., Kubistin, D., Lam, K.-S., Laurila, T., Lee, H., Levy, I., Mazzoleni, C., Mazzoleni, L. R., McClure-Begley, A., Mohamad, M., Murovec, M., Navarro-Comas, M., Nicodim, F., Parrish, D., Read, K. A., Reid, N., Ries, L., Saxena, P., Schwab, J. J., Scorgie, Y., Senik, I., Simmonds, P., Sinha, V., Skorokhod, A. I., Spain, G., Spangl, W., Spoor, R., Springston, S. R., Steer, K., Steinbacher, M., Suharguniyawan, E., Torre, P., Trickl, T., Weili, L., Weller, R., Xu, X., Xue, L., and Ma, Z.: Tropospheric Ozone Assessment Report, links to Global surface ozone datasets, PANGAEA [data set], https://doi.org/10.1594/PANGAEA.876108, 2017a. a, b
Schultz, M. G., Schröder, S., Lyapina, O., Cooper, O. R., Galbally, I., Petropavlovskikh, I., von Schneidemesser, E., Tanimoto, H., Elshorbany, Y., Naja, M., Seguel, R. J., Dauert, U., Eckhardt, P., Feigenspan, S., Fiebig, M., Hjellbrekke, A.-G., Hong, Y.-D., Kjeld, P. C., Koide, H., Lear, G., Tarasick, D., Ueno, M., Wallasch, M., Baumgardner, D., Chuang, M.-T., Gillett, R., Lee, M., Molloy, S., Moolla, R., Wang, T., Sharps, K., Adame, J. A., Ancellet, G., Apadula, F., Artaxo, P., Barlasina, M. E., Bogucka, M., Bonasoni, P., Chang, L., Colomb, A., Cuevas-Agulló, E., Cupeiro, M., Degorska, A., Ding, A., Fröhlich, M., Frolova, M., Gadhavi, H., Gheusi, F., Gilge, S., Gonzalez, M. Y., Gros, V., Hamad, S. H., Helmig, D., Henriques, D., Hermansen, O., Holla, R., Hueber, J., Im, U., Jaffe, D. A., Komala, N., Kubistin, D., Lam, K.-S., Laurila, T., Lee, H., Levy, I., Mazzoleni, C., Mazzoleni, L. R., McClure-Begley, A., Mohamad, M., Murovec, M., Navarro-Comas, M., Nicodim, F., Parrish, D., Read, K. A., Reid, N., Ries, L., Saxena, P., Schwab, J. J., Scorgie, Y., Senik, I., Simmonds, P., Sinha, V., Skorokhod, A. I., Spain, G., Spangl, W., Spoor, R., Springston, S. R., Steer, K., Steinbacher, M., Suharguniyawan, E., Torre, P., Trickl, T., Weili, L., Weller, R., Xiaobin, X., Xue, L., and Zhiqiang, M.: Tropospheric Ozone Assessment Report: Database and metrics data of global surface ozone observations, Elementa: Science of the Anthropocene, 5, 58, https://doi.org/10.1525/elementa.244, 2017b. a, b, c
Sekiya, T., Miyazaki, K., Ogochi, K., Sudo, K., and Takigawa, M.: Global high-resolution simulations of tropospheric nitrogen dioxide using CHASER V4.0, Geosci. Model Dev., 11, 959–988, https://doi.org/10.5194/gmd-11-959-2018, 2018. a
Sekiya, T., Kanaya, Y., Sudo, K., Taketani, F., Iwamoto, Y., Aita, M. N., Yamamoto, A., and Kawamoto, K.: Global Bromine- and Iodine-Mediated Tropospheric Ozone Loss Estimated Using the CHASER Chemical Transport Model, SOLA, 16, 220–227, https://doi.org/10.2151/sola.2020-037, 2020. a
Sekiya, T., Miyazaki, K., Ogochi, K., Sudo, K., Takigawa, M., Eskes, H., and Boersma, K. F.: Impacts of Horizontal Resolution on Global Data Assimilation of Satellite Measurements for Tropospheric Chemistry Analysis, J. Adv. Model. Earth Sy., 13, e2020MS002180, https://doi.org/10.1029/2020MS002180, 2021. a
Sekiya, T., Miyazaki, K., Eskes, H., Sudo, K., Takigawa, M., and Kanaya, Y.: A comparison of the impact of TROPOMI and OMI tropospheric NO2 on global chemical data assimilation, Atmos. Meas. Tech., 15, 1703–1728, https://doi.org/10.5194/amt-15-1703-2022, 2022. a, b
Sherwen, T., Schmidt, J. A., Evans, M. J., Carpenter, L. J., Großmann, K., Eastham, S. D., Jacob, D. J., Dix, B., Koenig, T. K., Sinreich, R., Ortega, I., Volkamer, R., Saiz-Lopez, A., Prados-Roman, C., Mahajan, A. S., and Ordóñez, C.: Global impacts of tropospheric halogens (Cl, Br, I) on oxidants and composition in GEOS-Chem, Atmos. Chem. Phys., 16, 12239–12271, https://doi.org/10.5194/acp-16-12239-2016, 2016. a
Shu, L., Zhu, L., Bak, J., Zoogman, P., Han, H., Liu, S., Li, X., Sun, S., Li, J., Chen, Y., Pu, D., Zuo, X., Fu, W., Yang, X., and Fu, T.-M.: Improving ozone simulations in Asia via multisource data assimilation: results from an observing system simulation experiment with GEMS geostationary satellite observations, Atmos. Chem. Phys., 23, 3731–3748, https://doi.org/10.5194/acp-23-3731-2023, 2023. a
Sindelarova, K., Granier, C., Bouarar, I., Guenther, A., Tilmes, S., Stavrakou, T., Müller, J.-F., Kuhn, U., Stefani, P., and Knorr, W.: Global data set of biogenic VOC emissions calculated by the MEGAN model over the last 30 years, Atmos. Chem. Phys., 14, 9317–9341, https://doi.org/10.5194/acp-14-9317-2014, 2014. a
Skachko, S., Errera, Q., Ménard, R., Christophe, Y., and Chabrillat, S.: Comparison of the ensemble Kalman filter and 4D-Var assimilation methods using a stratospheric tracer transport model, Geosci. Model Dev., 7, 1451–1465, https://doi.org/10.5194/gmd-7-1451-2014, 2014. a
Smit, H. G. J., Straeter, W., Johnson, B. J., Oltmans, S. J., Davies, J., Tarasick, D. W., Hoegger, B., Stubi, R., Schmidlin, F. J., Northam, T., Thompson, A. M., Witte, J. C., Boyd, I., and Posny, F.: Assessment of the performance of ECC-ozonesondes under quasi-flight conditions in the environmental simulation chamber: Insights from the Juelich Ozone Sonde Intercomparison Experiment (JOSIE), J. Geophys. Res., 112, D19306, https://doi.org/10.1029/2006JD007308, 2007. a
Soja, A. J., Cofer, W. R., Shugart, H. H., Sukhinin, A. I., Stackhouse Jr., P. W., McRae, D. J., and Conard, S. G.: Estimating fire emissions and disparities in boreal Siberia (1998–2002), J. Geophys. Res, 109, D14S06, https://doi.org/10.1029/2004JD004570, 2004. a
Stein, O., Schultz, M. G., Bouarar, I., Clark, H., Huijnen, V., Gaudel, A., George, M., and Clerbaux, C.: On the wintertime low bias of Northern Hemisphere carbon monoxide found in global model simulations, Atmos. Chem. Phys., 14, 9295–9316, https://doi.org/10.5194/acp-14-9295-2014, 2014. a
Szopa, S., Naik, V., Adhikary, B., Artaxo, P., Berntsen, T., Collins, W., Fuzzi, S., Gallardo, L., Kiendler-Scharr, A., Klimont, Z., Liao, H., Unger, N., and Zanis, P.: Short-Lived Climate Forcers, in: Climate Change 2021: The Physical Science Basis, edited by: Masson-Delmotte, V., Zhai, P., Pirani, A., Connors, S., C. Péan, S. B., Caud, N., Chen, Y., Goldfarb, L., Gomis, M., Huang, M., Leitzell, K., Lonnoy, E., Matthews, J., Maycock, T., Waterfield, T., Yelekçi, O., Yu, R., and Zhou, B., Cambridge University Press, Cambridge, United Kingdom and New York, NY, USA, 817–922, https://doi.org/10.1017/9781009157896.008, 2021. a
Tarasick, D., Galbally, I. E., Cooper, O. R., Schultz, M. G., Ancellet, G., Leblanc, T., Wallington, T. J., Ziemke, J., Liu, X., Steinbacher, M., Staehelin, J., Vigouroux, C., Hannigan, J. W., García, O., Foret, G., Zanis, P., Weatherhead, E., Petropavlovskikh, I., Worden, H., Osman, M., Liu, J., Chang, K.-L., Gaudel, A., Lin, M., Granados-Muñoz, M., Thompson, A. M., Oltmans, S. J., Cuesta, J., Dufour, G., Thouret, V., Hassler, B., Trickl, T., and Neu, J. L.: Tropospheric Ozone Assessment Report: Tropospheric ozone from 1877 to 2016, observed levels, trends and uncertainties, Elementa: Science of the Anthropocene, 7, 39, https://doi.org/10.1525/elementa.376, 2019. a, b
Tilmes, S., Lamarque, J.-F., Emmons, L. K., Conley, A., Schultz, M. G., Saunois, M., Thouret, V., Thompson, A. M., Oltmans, S. J., Johnson, B., and Tarasick, D.: Technical Note: Ozonesonde climatology between 1995 and 2011: description, evaluation and applications, Atmos. Chem. Phys., 12, 7475–7497, https://doi.org/10.5194/acp-12-7475-2012, 2012. a
Timmermans, R., Segers, A., Curier, L., Abida, R., Attié, J.-L., El Amraoui, L., Eskes, H., de Haan, J., Kujanpää, J., Lahoz, W., Oude Nijhuis, A., Quesada-Ruiz, S., Ricaud, P., Veefkind, P., and Schaap, M.: Impact of synthetic space-borne NO2 observations from the Sentinel-4 and Sentinel-5P missions on tropospheric NO2 analyses, Atmos. Chem. Phys., 19, 12811–12833, https://doi.org/10.5194/acp-19-12811-2019, 2019. a
Travis, K. R., Jacob, D. J., Fisher, J. A., Kim, P. S., Marais, E. A., Zhu, L., Yu, K., Miller, C. C., Yantosca, R. M., Sulprizio, M. P., Thompson, A. M., Wennberg, P. O., Crounse, J. D., St. Clair, J. M., Cohen, R. C., Laughner, J. L., Dibb, J. E., Hall, S. R., Ullmann, K., Wolfe, G. M., Pollack, I. B., Peischl, J., Neuman, J. A., and Zhou, X.: Why do models overestimate surface ozone in the Southeast United States?, Atmos. Chem. Phys., 16, 13561–13577, https://doi.org/10.5194/acp-16-13561-2016, 2016. a, b
Turnock, S. T., Allen, R. J., Andrews, M., Bauer, S. E., Deushi, M., Emmons, L., Good, P., Horowitz, L., John, J. G., Michou, M., Nabat, P., Naik, V., Neubauer, D., O'Connor, F. M., Olivié, D., Oshima, N., Schulz, M., Sellar, A., Shim, S., Takemura, T., Tilmes, S., Tsigaridis, K., Wu, T., and Zhang, J.: Historical and future changes in air pollutants from CMIP6 models, Atmos. Chem. Phys., 20, 14547–14579, https://doi.org/10.5194/acp-20-14547-2020, 2020. a
Veefkind, J., Aben, I., McMullan, K., Förster, H., de Vries, J., Otter, G., Claas, J., Eskes, H., de Haan, J., Kleipool, Q., van Weele, M., Hasekamp, O., Hoogeveen, R., Landgraf, J., Snel, R., Tol, P., Ingmann, P., Voors, R., Kruizinga, B., Vink, R., Visser, H., and Levelt, P.: TROPOMI on the ESA Sentinel-5 Precursor: A GMES mission for global observations of the atmospheric composition for climate, air quality and ozone layer applications, Remote Sens. Environ., 120, 70–83, https://doi.org/10.1016/j.rse.2011.09.027, 2012. a
Wagner, A., Bennouna, Y., Blechschmidt, A.-M., Brasseur, G., Chabrillat, S., Christophe, Y., Errera, Q., Eskes, H., Flemming, J., Hansen, K. M., Inness, A., Kapsomenakis, J., Langerock, B., Richter, A., Sudarchikova, N., Thouret, V., and Zerefos, C.: Comprehensive evaluation of the Copernicus Atmosphere Monitoring Service (CAMS) reanalysis against independent observations: Reactive gases, Elementa: Science of the Anthropocene, 9, 00171, https://doi.org/10.1525/elementa.2020.00171, 2021. a
Waters, J., Froidevaux, L., Harwood, R., Jarnot, R., Pickett, H., Read, W., Siegel, P., Cofield, R., Filipiak, M., Flower, D., Holden, J., Lau, G., Livesey, N., Manney, G., Pumphrey, H., Santee, M., Wu, D., Cuddy, D., Lay, R., Loo, M., Perun, V., Schwartz, M., Stek, P., Thurstans, R., Boyles, M., Chandra, K., Chavez, M., Chen, G.-S., Chudasama, B., Dodge, R., Fuller, R., Girard, M., Jiang, J., Jiang, Y., Knosp, B., LaBelle, R., Lam, J., Lee, K., Miller, D., Oswald, J., Patel, N., Pukala, D., Quintero, O., Scaff, D., Van Snyder, W., Tope, M., Wagner, P., and Walch, M.: The Earth observing system microwave limb sounder (EOS MLS) on the aura Satellite, IEEE T. Geosci. Remote, 44, 1075–1092, https://doi.org/10.1109/TGRS.2006.873771, 2006. a
Wells, K. C., Millet, D. B., Payne, V. H., Vigouroux, C., Aquino, C. A. B., De Mazière, M., de Gouw, J. A., Graus, M., Kurosu, T., Warneke, C., and Wisthaler, A.: Next-Generation Isoprene Measurements From Space: Detecting Daily Variability at High Resolution, J. Geophys. Res., 127, e2021JD036181, https://doi.org/10.1029/2021JD036181, 2022. a, b
Wu, L., Mallet, V., Bocquet, M., and Sportisse, B.: A comparison study of data assimilation algorithms for ozone forecasts, J. Geophys. Res., 113, D20310, https://doi.org/10.1029/2008JD009991, 2008. a
Wu, W.-S., Purser, R., and Parrish, D.: Three-Dimensional Variational Analysis with Spatially Inhomogeneous Covariances, Mon. Weather Rev., 130, 2905–2916, https://doi.org/10.1175/1520-0493(2002)130<2905:TDVAWS>2.0.CO;2, 2002. a
Yarwood, G., Rao, S., Yocke, M., and Whitten, G.: Updates to the carbon bond chemical mechanism: CB05, Final report to the US EPA, RT-0400675, 8, 246 pp., https://www.camx.com/Files/CB05_Final_Report_120805.pdf (last access: 10 February 2025), 2005. a
Young, P. J., Naik, V., Fiore, A. M., Gaudel, A., Guo, J., Lin, M. Y., Neu, J. L., Parrish, D. D., Rieder, H. E., Schnell, J. L., Tilmes, S., Wild, O., Zhang, L., Ziemke, J., Brandt, J., Delcloo, A., Doherty, R. M., Geels, C., Hegglin, M. I., Hu, L., Im, U., Kumar, R., Luhar, A., Murray, L., Plummer, D., Rodriguez, J., Saiz-Lopez, A., Schultz, M. G., Woodhouse, M. T., and Zeng, G.: Tropospheric Ozone Assessment Report: Assessment of global-scale model performance for global and regional ozone distributions, variability, and trends, Elementa: Science of the Anthropocene, 6, 10, https://doi.org/10.1525/elementa.265, 2018. a, b
Yurganov, L. N., McMillan, W. W., Dzhola, A. V., Grechko, E. I., Jones, N. B., and van der Werf, G. R.: Global AIRS and MOPITT CO Measurements: Validation, Comparison, and Links to Biomass Burning Variations and Carbon Cycle, J. Geophys. Res, 113, D09301, https://doi.org/10.1029/2007JD009229, 2008. a
Zhang, X., Jones, D. B. A., Keller, M., Walker, T. W., Jiang, Z., Henze, D. K., Worden, H. M., Bourassa, A. E., Degenstein, D. A., and Rochon, Y. J.: Quantifying Emissions of CO and NOx Using Observations From MOPITT, OMI, TES, and OSIRIS, J. Geophys. Res., 124, 1170–1193, https://doi.org/10.1029/2018JD028670, 2019. a
Zhu, C., Byrd, R. H., Lu, P., and Nocedal, J.: L‐BFGS‐B: A limited memory FORTRAN code for solving bound constrained optimization problems, Tech. Rep. Tech. Rep. No. NAM‐11, EECS Dept., Northwestern Univ., Evanston, Ill, http://users.iems.northwestern.edu/~nocedal/PDFfiles/lbfgsb.pdf (last access: 2 November 2020), 1994. a
Ziemke, J. R., Chandra, S., Duncan, B. N., Froidevaux, L., Bhartia, P. K., Levelt, P. F., and Waters, J. W.: Tropospheric ozone determined from Aura OMI and MLS: Evaluation of measurements and comparison with the Global Modeling Initiative's Chemical Transport Model, J. Geophys. Res., 111, D19303, https://doi.org/10.1029/2006JD007089, 2006. a
Ziemke, J. R., Oman, L. D., Strode, S. A., Douglass, A. R., Olsen, M. A., McPeters, R. D., Bhartia, P. K., Froidevaux, L., Labow, G. J., Witte, J. C., Thompson, A. M., Haffner, D. P., Kramarova, N. A., Frith, S. M., Huang, L.-K., Jaross, G. R., Seftor, C. J., Deland, M. T., and Taylor, S. L.: Trends in global tropospheric ozone inferred from a composite record of TOMS/OMI/MLS/OMPS satellite measurements and the MERRA-2 GMI simulation , Atmos. Chem. Phys., 19, 3257–3269, https://doi.org/10.5194/acp-19-3257-2019, 2019. a
Zoogman, P., Jacob, D. J., Chance, K., Liu, X., Lin, M., Fiore, A., and Travis, K.: Monitoring high-ozone events in the US Intermountain West using TEMPO geostationary satellite observations, Atmos. Chem. Phys., 14, 6261–6271, https://doi.org/10.5194/acp-14-6261-2014, 2014. a
- Abstract
- Introduction
- Data
- Comparison of multiple chemical reanalysis products
- Relative impacts of satellite ozone and its precursor observations
- Discussion
- Summary and conclusion
- Data availability
- Author contributions
- Competing interests
- Disclaimer
- Special issue statement
- Acknowledgements
- Financial support
- Review statement
- References
- Supplement