the Creative Commons Attribution 4.0 License.
the Creative Commons Attribution 4.0 License.
 | 19 Feb 2025
Spatial and temporal evolution of future atmospheric reactive nitrogen deposition in China under different climate change mitigation strategies
Mingrui Ma
Jiachen Cao
Dan Tong
Yu Zhao
Atmospheric reactive nitrogen (Nr) deposition plays a crucial role in linking air pollution to ecosystem risks. Previous modeling studies have indicated that climate change and pollution controls jointly result in significant changes in Nr deposition in China. However, it remains unclear how future emission reductions will influence Nr deposition under different climate pathways. Here, we investigated the spatiotemporal evolution and driving factors of future Nr deposition under various national clean air and climate policies. We applied WRF-CMAQ and assessed the historical (2010s, 2010–2014) pattern and future changes of Nr deposition till the 2060s (2060–2064) in China, by combining two Shared Socioeconomic Pathway (SSP) and Representative Concentration Pathway (RCP) global climate pathways and three national emission control scenarios. The results show that the implementation of clean air and carbon neutrality policies would greatly reduce oxidized nitrogen (OXN) deposition, mitigate the adverse perturbations of climate change, and reduce the outflow from Eastern China (EC; 20–45° N, 110–125° E) to the western Pacific. In Northern China (NC; 30–45° N, 110–125° E), the weakened atmospheric oxidation capacity (AOC) would elevate the response of OXN deposition to a 20 % abatement of emissions (expressed as the ratio of percentage change of deposition to emissions) from 82.6 % in the 2010s to nearly 100 % in the 2060s. In contrast, the response of reduced nitrogen (RDN) deposition to NH3 emissions would decline, likely attributable to a more NH3-rich condition. The outcomes of this work broaden scientific understanding on how anthropogenic actions of air quality improvement and carbon emission reduction would reshape future Nr deposition and support effective policymaking to reduce associated ecological damage.
- Article
(10601 KB) - Full-text XML
-
Supplement
(962 KB) - BibTeX
- EndNote


With vigorous development of industrial and agricultural activities worldwide since the industrial revolution, the emissions of reactive nitrogen (Nr; including oxidized and reduced nitrogen species, OXN and RDN, respectively) have increased explosively (Kanakidou et al., 2016), elevating the Nr levels in both atmosphere and deposition. Enriched ambient Nr has led to a series of regional haze and ozone (O3) pollution issues through participation in atmospheric aerosol formation and photochemical reactions (Chen et al., 2021). Furthermore, excessive atmospheric Nr deposits onto land and water bodies through both dry and wet forms, directly hurting the stability and productivity of the entire ecosystem (Flower et al., 2013). Substantial Nr deposition can result in diverse adverse ecological effects, such as water eutrophication (Zheng et al., 2020), soil acidification (Raza et al., 2020), and biodiversity loss (Liu et al., 2017).
Influenced by multiple human activities, severe Nr deposition and its subsequent ecological risks in China have attracted growing attention in recent years (Gu et al., 2012; Liu and Du, 2020). China has undergone rapid industrialization and urbanization, accompanied with explosive growth in the consumption of fossil fuels and fertilizers over the past few decades, triggering significant emissions of NOx and NH3 (Zhao et al., 2013; Kang et al., 2016). Enhanced Nr emissions have made the country one of the hotspots that receives the largest Nr deposition worldwide (Liu et al., 2013; Vet et al., 2014). Observations of background sites from the China Nationwide Nitrogen Deposition Monitoring Network (NNDMN) during 2011–2018 revealed that the annual averaged Nr deposition fluxes reached 23.6 kg N ha−1 yr−1, vastly surpassing the monitoring results in the United States (8.1 kg N ha−1 yr−1), Europe (8.7 kg N ha−1 yr−1), and Japan (11.0 kg N ha−1 yr−1) (Wen et al., 2020).
Due to the fast change and heterogeneous distribution of emissions and the typically short atmospheric lifetime of most Nr species, there exist challenges in estimating the spatial pattern and long-term trend of Nr deposition across big countries like China, based on observations at individual sites. Atmospheric chemistry transport models (CTMs) or advanced statistical models support analyses of the interannual variations of Nr deposition at multiple spatial scales (Liu et al., 2024; Wen et al., 2024). A series of modeling studies have analyzed the magnitude and spatiotemporal pattern of Nr deposition in China. Yu et al. (2019) applied Kriging interpolation combined with empirical remote sensing models and estimated that China's annual Nr deposition had increased nearly 60 % from the 1980s to 2010s. By developing a random forest algorithm, Zhou et al. (2023) quantified the considerable growth of Nr deposition from 2005 to 2012 in Eastern China. Gao et al. (2023) revealed the shifting of deposition forms from dominated by wet to more balanced contributions from dry and wet deposition. The national air pollution control actions over the past decade have resulted in a fast decline in emissions of acidic gaseous pollutants (mainly NOx and SO2) but relatively stable NH3 (Zheng et al., 2018). The imbalance in emission reductions for different species has altered the composition of Nr deposition, i.e., a growth in the proportion of RDN (Liu et al., 2020). Zhao et al. (2022) developed the generalized additive model (GAM) and found that the decline in OXN deposition has lagged behind NOx reductions in recent years, attributed partly to the increased precipitation and the strengthening transport of pollution. More importantly, the O3 formation in Eastern China has been primarily under the NOx-saturated condition, and the reduction in NOx emissions, combined with persistently high volatile organic compound (VOC) emissions, has enhanced the O3 concentration and thereby the capacity of atmospheric oxidation. This has, in turn, facilitated the conversion of NOx to nitrate (NO) and thus weakened the response of OXN deposition to NOx emission abatement, preventing effective reduction in Nr deposition. One-unit abatement of NOx emissions resulted in less than 80 % abatement of OXN deposition, emphasizing the crucial role of active O3–VOC–NOx photochemistry in modulating the Nr deposition (Liu et al., 2022).
Atmospheric Nr deposition is mainly influenced by rainfall, precursor emissions, and long-distance transport (Ellis et al., 2013; Kim et al., 2012; Ma et al., 2023; Zhu et al., 2022). Future climate change may strengthen the local turbulence and precipitation intensity, which will alter the dry and wet deposition rate, respectively (Toyota et al., 2016; Xia et al., 2024). Meanwhile, the anticipated substantial reduction in Nr emissions through pollution controls will reduce the Nr deposition and change its dominant components. The changing deposition will further exert multiple impacts on the biodiversity, carbon sequestration, and greenhouse emissions of various ecosystems and thus influence the climate and ecological environment profoundly (Zhu et al., 2020). There are only a few studies addressing future Nr deposition in China. They commonly employed coupled climate–chemistry global models to conduct simulations under different predefined greenhouse gas (GHG) emission scenarios. For example, a pioneering study by Galloway et al. (2004) predicted significant growth in Nr deposition in east Asia, exceeding 50 kg N ha−1 yr−1 by 2050, based on the Intergovernmental Panel on Climate Change IS92a (IPCC92a) emission scenario. The Atmospheric Chemistry and Climate Model Intercomparison Project (ACCMIP) presented a multi-model global dataset of Nr deposition from 1850 to 2100 (Lamarque et al., 2013a), with the future emissions obtained from the IPCC Representative Concentration Pathways (RCPs) based on the radiative forcing in 2100 (van Vuuren et al., 2011). The Nr deposition in east Asia was estimated to increase 27 % and 39 % in the 2030s under RCP2.6 and RCP8.5, respectively (Lamarque et al., 2013b). Based on ACCMIP datasets, Zhang et al. (2019) reported that the OXN deposition fluxes under both RCP4.5 and RCP8.5 were projected to increase in the 2030s but decrease by the end of the century, driven primarily by the Nr emission trends. More recently, Sun et al. (2022) examined the possible future changes in RDN deposition by combining ACCMIP datasets and extra CMAQ simulations. The proportion of RDN in total deposition in Eastern China was projected to rise from 38 % in 2000 to 56 % in 2100 under RCP8.5, suggesting a transition in the dominant form from oxidized to reduced.
While previous studies have provided valuable information on the future evolution of Nr deposition in China, they have insufficiently considered the impact of the potentially profound emission reduction resulting from implementation of climate and pollution control policies. In 2020, China announced the plan to achieve carbon neutrality by 2060, and the effects of a wide range of sharp emission reductions on future environment have become a major research focus (Dong et al., 2021). Researchers have integrated national strategies of emission reduction to assess future air pollution and associated health risks in China under various climate change pathways (Cheng et al., 2021a, 2023; Shi et al., 2021). For example, the IPCC Sixth Assessment Report (AR6) introduced a scientifically combined set of pathways known as Shared Socioeconomic Pathways (SSPs) and RCPs, denoted as SSP-RCP (Masson-Delmotte et al., 2021). New pathways integrate the impact of socioeconomic development into the framework for the evolution of GHG levels, offering more reliable projections of possible outcomes of climate change (Cook et al., 2020; O'Neill et al., 2016; Xin et al., 2020). However, there is a noticeable gap in the assessment of China's atmospheric deposition under the SSP-RCP framework. The roles of future emission and climate changes in deposition remain unclear across diverse climate pathways. Moreover, the diverse trajectories of emission for various species and regions will change the atmospheric oxidizing capacity and regional transport of pollution, respectively, which will in turn change the response of Nr deposition to the changing precursor emissions. It is essential to evaluate these anticipated changes for a comprehensive understanding of the ecological and environmental impacts of Nr deposition, for a long-term period with continuous air pollution controls and global warming prevention.
In this study, we applied an air quality model (WRF-CMAQ; see details in methods) and assessed the future changes of Nr deposition in China, by combining the SSP-RCP global climate change pathways and the national emission control scenarios. The historical period was chosen as 2010–2014, representing the years with the highest Nr emissions in China, and the future simulation period was determined as 2060–2064. Firstly, we evaluated the model performance of meteorology and Nr deposition for the historical period based on available ground observations. We then quantified the spatial and temporal changes of future Nr deposition and identified the main driving factors under two IPCC pathways, SSP2-4.5 and SSP5-8.5). The SSP5-8.5 represents high GHG emissions characterized by continued reliance on fossil fuels, often viewed as a pessimistic outlook for future climate change (Alexandrov et al., 2021; Meinshausen et al., 2020). Conversely, SSP2-4.5 envisions moderate GHG emissions, achieved through the consideration of environmental policies and technological advancements (O'Neill et al., 2020; Su et al., 2021). We further assessed the effects of various emissions abatement scenarios on Nr deposition. Finally, we analyzed the future response of deposition to emission perturbation under different scenarios. The study enhances scientific understanding on the interactions between anthropogenic activities and atmospheric chemistry along with a changing climate and in turn supports the development of effective environmental policies to alleviate the adverse effects of Nr pollution on ecosystems and human health.
2.1 Model description and driving data
2.1.1 CMAQ model
The Community Multiscale Air Quality (CMAQ) model version 5.2 (available at https://epa.gov/cmaq/access-cmaq-source-code, last access: 6 May 2023; USEPA, 2017; Wyat Appel et al., 2018) was adopted to conduct atmospheric Nr deposition simulations over mainland China for both historical (2010–2014) and future periods (2060–2064). As a three-dimensional Eulerian model developed by the United States Environmental Protection Agency (USEPA), CMAQ comprehensively considers the complex atmospheric physical and chemical processes among various air pollutants, primarily including advection, vertical mixing, chemistry of gas and aerosol phase, and cloud chemistry, as well as dry and wet deposition (Benish et al., 2022; Fahey et al., 2017). The model incorporates the temporal and spatial variations of chemical mechanisms, emissions, and meteorology, thus effectively accounting for nonlinearity and regional transport (Liu et al., 2010). It has been demonstrated to possess extensive practicality and sophistication in simulating regional air quality and acid deposition (Chang et al., 2020; Cheng et al., 2021). A single domain covering mainland China (186×156 grid cells) was adopted for the simulations with a horizontal resolution at 27×27 km per grid (Fig. S1 in the Supplement). Lambert conformal conic projection was applied for the domain centered at 37° N, 102° E with two true latitudes, 40 and 25° N. In the vertical direction, 30 eta levels with the pressure of 50 hPa at the top level were used. For chemical configuration, the Carbon Bond 05 (CB05) gas-phase chemical scheme and the AERO6 aerosol scheme were adopted (Sarwar et al., 2008; Pye et al., 2017; Murphy et al., 2017). The boundary condition of trace gases used in this study was background concentration (default setup in CMAQ model). To avoid the model errors associated with individual years, full-year simulations were conducted for every year of the two 5-year intervals, and the 5-year averages were used for further analyses. Simulation of each year included a 1-month spin-up time (i.e., 1–31 December of the previous year) to reduce the impact of the initial conditions on the simulations. A series of simulation cases were designed by combining individual climate pathways and national emission scenarios to separate the roles of multiple factors in future deposition (see details in Sect. 2.2).
2.1.2 Emissions input
The Multi-resolution Emission Inventory for China version 1.3 developed by Tsinghua University (MEICv1.3; available at http://www.meicmodel.org/?page_id=560, last access: 10 June 2023; Tsinghua University, 2021a; Li et al., 2017a; Zheng et al., 2018) provided historical anthropogenic emission data within China in our simulations. Information on future emissions was obtained from the Dynamic Projection model for Emissions in China version 1.1 developed by Tsinghua University (DPECv1.1; available at http://meicmodel.org.cn/?page_id=1917, last access: 12 June 2023; Tsinghua University, 2021b; Cheng et al., 2021b; Zheng et al., 2018). DPEC links global climate mitigation pathways to local clean air policies and fully incorporates China's strict air pollution control progress since the implementation of the “Action Plan of Air Pollution Prevention and Control” in 2013. It thus better depicts the emission trends of China compared to the results in the sixth Coupled Model Intercomparison Project (CMIP6) scenarios (Cheng et al., 2021b; Tong et al., 2020). Three emission scenarios, named “Baseline”, “Current-goal”, and “Neutral-goal”, were used in this work (see the simulation case design in Sect. 2.2). Baseline depicts a high-emission scenario in the absence of climate and pollution control policies, equivalent to the SSP5-8.5 climate pathway. The Current-goal scenario is a combination that takes into account the SSP2-4.5 climate pathway along with existing pollution control policies in China. The Neutral-goal scenario integrates China's 2060 carbon neutrality goal with the most stringent pollution control policies. Details of the scenarios were described in Cheng et al. (2021b).
Anthropogenic emissions outside of China were taken from the Asian anthropogenic emission inventory, named MIX, developed by the Model Inter-Comparison Study for Asia (MICS-Asia) project (available at http://meicmodel.org.cn/?page_id=1770, last access: 11 June 2023; Tsinghua University, 2021c; Li et al., 2017b). Biogenic emissions were calculated by the Model Emissions of Gases and Aerosols from Nature developed under the Monitoring Atmospheric Composition and Climate project version 2.1 (MEGANv2.1; Guenther et al., 2012). The initial horizontal resolutions of both emission inventories were 0.25° × 0.25°, and they were interpolated into our simulation domain with a resolution of 27 km.
2.1.3 Meteorological driving field
The Weather Research and Forecasting (WRF) model version 3.9.1 (available at https://www2.mmm.ucar.edu/wrf/users/wrf_files/wrfv3.9/updates-3.9.1.html, last access: 24 February 2023; NCAR and NOAA, 2017; Skamarock and Klemp, 2008a; Skamarock et al., 2008b) was applied to provide meteorological fields for CMAQ. Developed and maintained collaboratively by the National Center for Atmospheric Research (NCAR) and the National Oceanic and Atmospheric Administration (NOAA), the WRF model has been recognized as a state-of-the-art regional weather model and widely utilized in short-term weather forecasting and regional meteorological research (Huang et al., 2020; Wang et al., 2021). For our historical meteorological simulation, the fifth generation of European Centre for Medium-Range Weather Forecasts (ECMWF) reanalysis dataset, ERA5 (available at https://cds.climate.copernicus.eu/cdsapp#!/dataset/reanalysis-era5-single-levels?tab=form, last access: 20 April 2023; ECMWF, 2018), was adopted as the initial and boundary field (Hersbach et al., 2020). The temporal and spatial resolution was 6 h and 0.25° × 0.25°, respectively. For simulation of the future period, it is common practice to employ climate forecast results from global climate models (GCMs) as the initial and boundary conditions. In this study, a global bias-corrected multi-model (BCMM) climatological dataset with a horizontal resolution of 1.25° × 1.25° at 6 h intervals (available at https://www.scidb.cn/en/detail?dataSetId=791587189614968832#p2, last access: 7 May 2023; CNSDB, 2021) was adopted to drive the WRF model for 2060–2064. The BCMM dataset was reconstructed from 18 GCMs of CMIP6, with corrections for climatological mean and interannual variance biases based on ERA5 data from 1979–2014, providing more reliable projections of long-term nonlinear trends of multiple climate variables compared with original CMIP6 model outputs. Details of the BCMM product were described in Xu et al. (2021). We employed the pseudo-global warming (PGW) method (Kawase et al., 2013; Liu et al., 2021; Lauer et al., 2013; Taniguchi and Tajima, 2020) for dynamical downscaling. Specifically, future driving fields were forced with the ERA5 data from reference period (2010–2014) and a climate perturbation (difference between the years 2060–2064 and 2010–2014) calculated from BCMM results, as shown in Eqs. (1) and (2):
where ΔBCMMssp is the CMIP6 multimodel ensemble mean change signal for 2060–2064 relative to 2010–2014 under SSP2-4.5 or SSP5-8.5 and and represent the 5-year meteorological averages of BCMM dataset in the future and reference periods, respectively. Nine physical variables were perturbed in this study including zonal wind, meridional wind, air temperature, sea surface temperature, soil temperature, specific humidity, the surface pressure, sea-level pressure, and geopotential height. The bilinear interpolation was applied to interpolate BCMM data to the ERA5 grid.
The land-use and land-cover (LULC) data were taken from global data of the U.S. Geological Survey (USGS) (De Meij and Vinuesa, 2014; Pineda et al., 2004). The physical parameterization schemes used in all simulations are summarized in Table S1 in the Supplement.
2.1.4 Deposition mechanisms
The dry deposition (DDEP) of each atmospheric chemical species (i) was calculated as the product of surface concentration (Csurface) and dry deposition velocity (Vd) at the lowest model layer, as shown in Eq. (3):
According to the classical resistance cascade model (Venkatram and Pleim, 1999; Wesely, 2007), the parameters of Vd are calculated as in Eq. (4):
where Ra is the aerodynamic resistance to the transfer from lowest layer to the roughness height, calculated as a function of surface layer turbulence parameters including friction velocity and the Monin–Obukhov length; Rb is the boundary layer resistance to transfer between the roughness height and surface; and Rc is the resistance to surface uptake, which can be further divided into several series and parallel components, representing the resistance to the lower vegetation canopy or ground.
The algorithm module for wet deposition (WDEP) is derived from the regional acid deposition model (RADM; Chang et al., 1987) and depends on the precipitation rate (Pr) and cloud water concentration (Ccloud) of specific chemical components:
The wet scavenging is considered in two pathways, depending upon whether the pollutant participates in the cloud water chemistry and in the liquid water content. Details on how CMAQ removes pollutants through wet deposition can be found in the official CMAQ Science Documentation (available at https://www.cmascenter.org/cmaq/science_documentation/pdf/ch11.pdf, last access: 10 March 2023). In this study, OXN included NO, NO2, HNO3, N2O5, HONO, and particulates as NO, and RDN included NH3 and particulates as ammonium (NH).
2.2 Numerical simulation experiment design
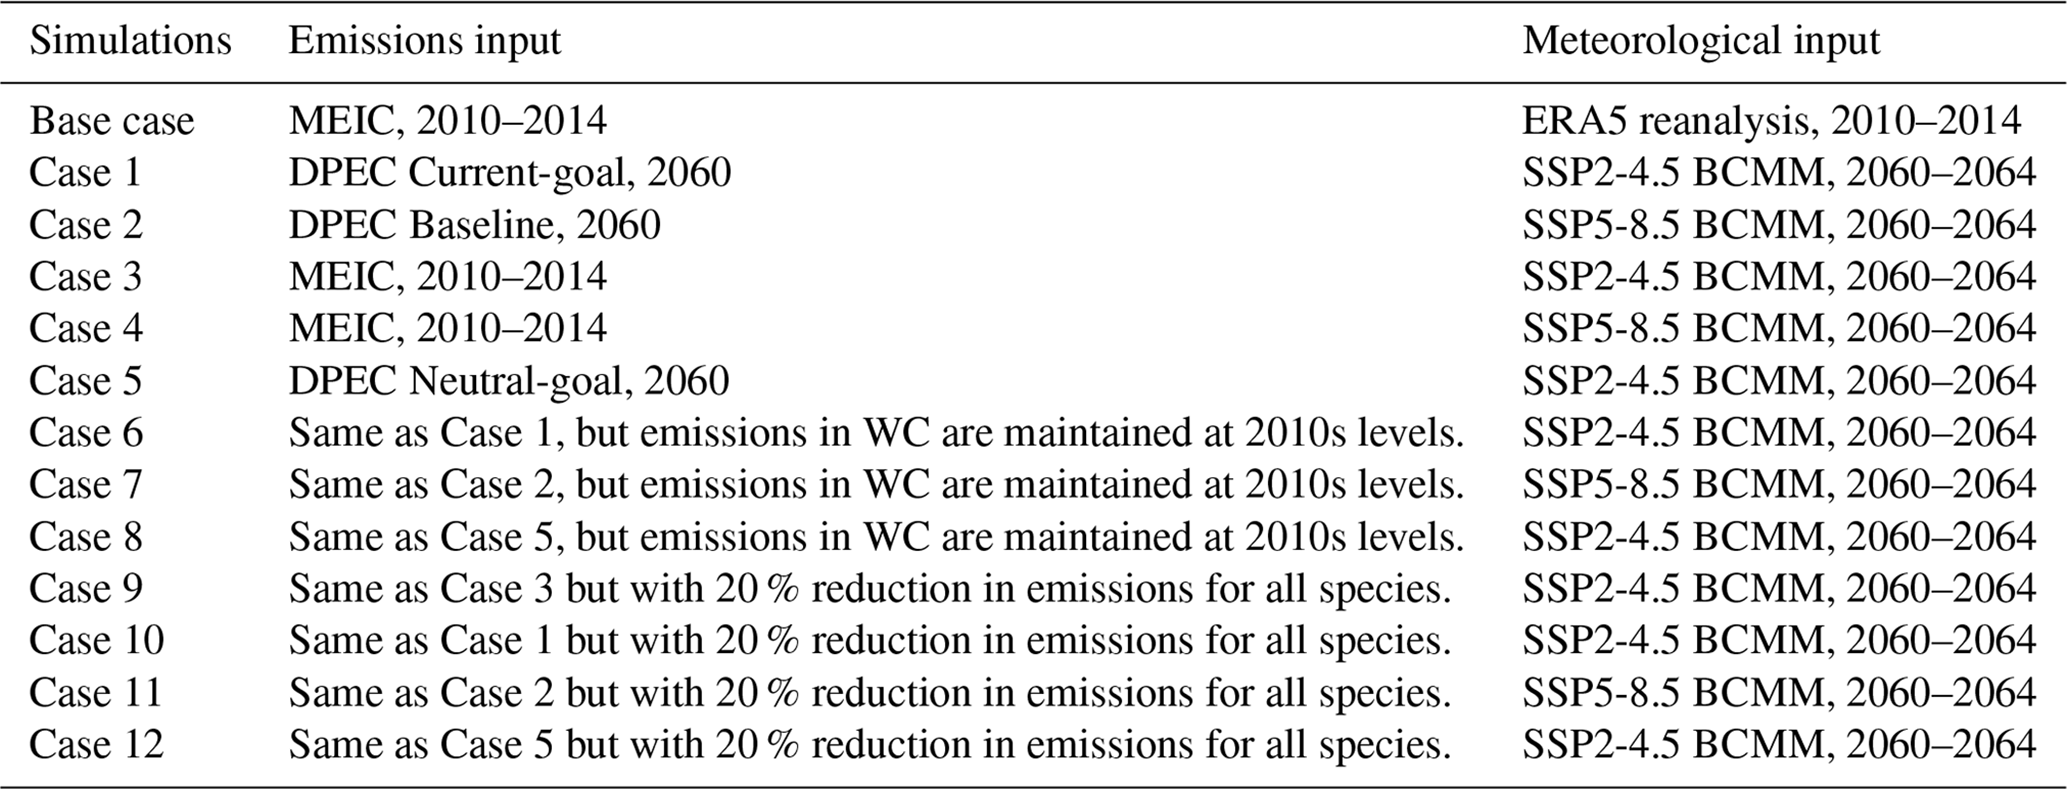
To evaluate future changes in the spatiotemporal pattern of atmospheric Nr deposition under different SSP-RCP climate pathways and emission control scenarios, we performed parallel numerical simulation experiments with WRF-CMAQ, as summarized in Table 1. The base case simulated the real situation in historical period (2010–2014). Case 1 and Case 2 were designed to predict the atmospheric Nr deposition in the 2060s, following SSP2-4.5 climate pathway with the Current-goal emission scenario in DPEC and SSP5-8.5 climate pathway with the Baseline emission scenario, respectively. The difference between Case 1 and the base case and that between Case 2 and the base case revealed the changing Nr deposition from the 2010s to 2060s in SSP2-4.5 and SSP5-8.5, respectively.
Cases 3 and 4 applied future climate pathways (SSP2-4.5 and SSP5-8.5, respectively) but historical emissions, and the difference between each of them and the base case revealed how climate change would influence Nr deposition under corresponding climate pathways. Meanwhile, the effect of emission change on future Nr deposition was examined by comparing Case 3 and Case 1 for the Current-goal scenario in DPEC and by comparing Case 4 and Case 2 for the Baseline scenario. Case 5 applied the SSP2-4.5 climate pathway and the Neutral-goal emission scenario in DPEC. Comparison between Case 5 and Case 3 revealed the benefit of national emission controls under China's carbon neutrality policy on Nr deposition.
Cases 6–8 were designed based on Cases 1, 2, and 5, respectively. In these cases, emissions in Eastern China (EC; 20–45° N, 110–125° E) were set at the 2060s level, while those in Western China (WC; 20–45° N, 75–110° E) were maintained at the 2010s level. The aim was to explore the effect of diverse emission control progresses for different regions on future Nr deposition. WC and EC were divided by longitude 110° east in this study, as shown in Fig. S1. In Cases 9–12, the emissions of all species were reduced by 20 % from those in Cases 3, 1, 2, and 5, respectively, to explore the response of deposition to emission perturbation at different atmospheric conditions caused by varying pollution control levels. The 20 % emissions reduction was regarded as a reasonable perturbation to achieve a significant change (Galmarini et al., 2017).
2.3 Observations and model evaluation
WRF-CMAQ model performance was evaluated against available observation of meteorological variables and Nr deposition at monthly or annual level. Daily near-surface observations of four meteorological parameters including temperature at the height of 2 m (T2), relative humidity (RH), wind speed at the height of 10 m (WS10), and accumulated precipitation (PREC) were derived from the National Meteorological Data Center of China Meteorological Administration (CMA, http://data.cma.cn/data/detail/dataCode/A.0012.0001.html, last access: 6 February 2024; CMA, 2023). The 839 meteorological surface stations, with continuous 5-year observations from 2010 to 2014, were selected, as shown in Fig. 1. Meanwhile, the monthly observations of Nr deposition fluxes were taken from the Nationwide Nitrogen Deposition Monitoring Network (NNDMN; Xu et al., 2018, 2019). We selected 28 sites for dry deposition fluxes and 53 sites for wet deposition fluxes, for which at least 2-year continuous measurement data were available, to evaluate model performance. Details of monitoring stations can be found in our previous study (Ma et al., 2023). As shown in Eqs. (S1) and (S2) in the Supplement, the mean bias (MB), and mean error (ME) were used to evaluate the deviation level of meteorological parameter simulations. Statistical indicators for Nr deposition were calculated with Eqs. (6)–(9), including normalized mean bias (NMB), normalized mean error (NME), and the correlation coefficient (R) at temporal and spatial scales (Baker et al., 2004; Ma et al., 2023):
where S and O are the monthly meteorological variables or annual Nr deposition from model simulation and observation, respectively; and are the monthly mean meteorological variables or annual deposition from model simulation and observation, respectively; i means the individual month or year; and j means the individual site.
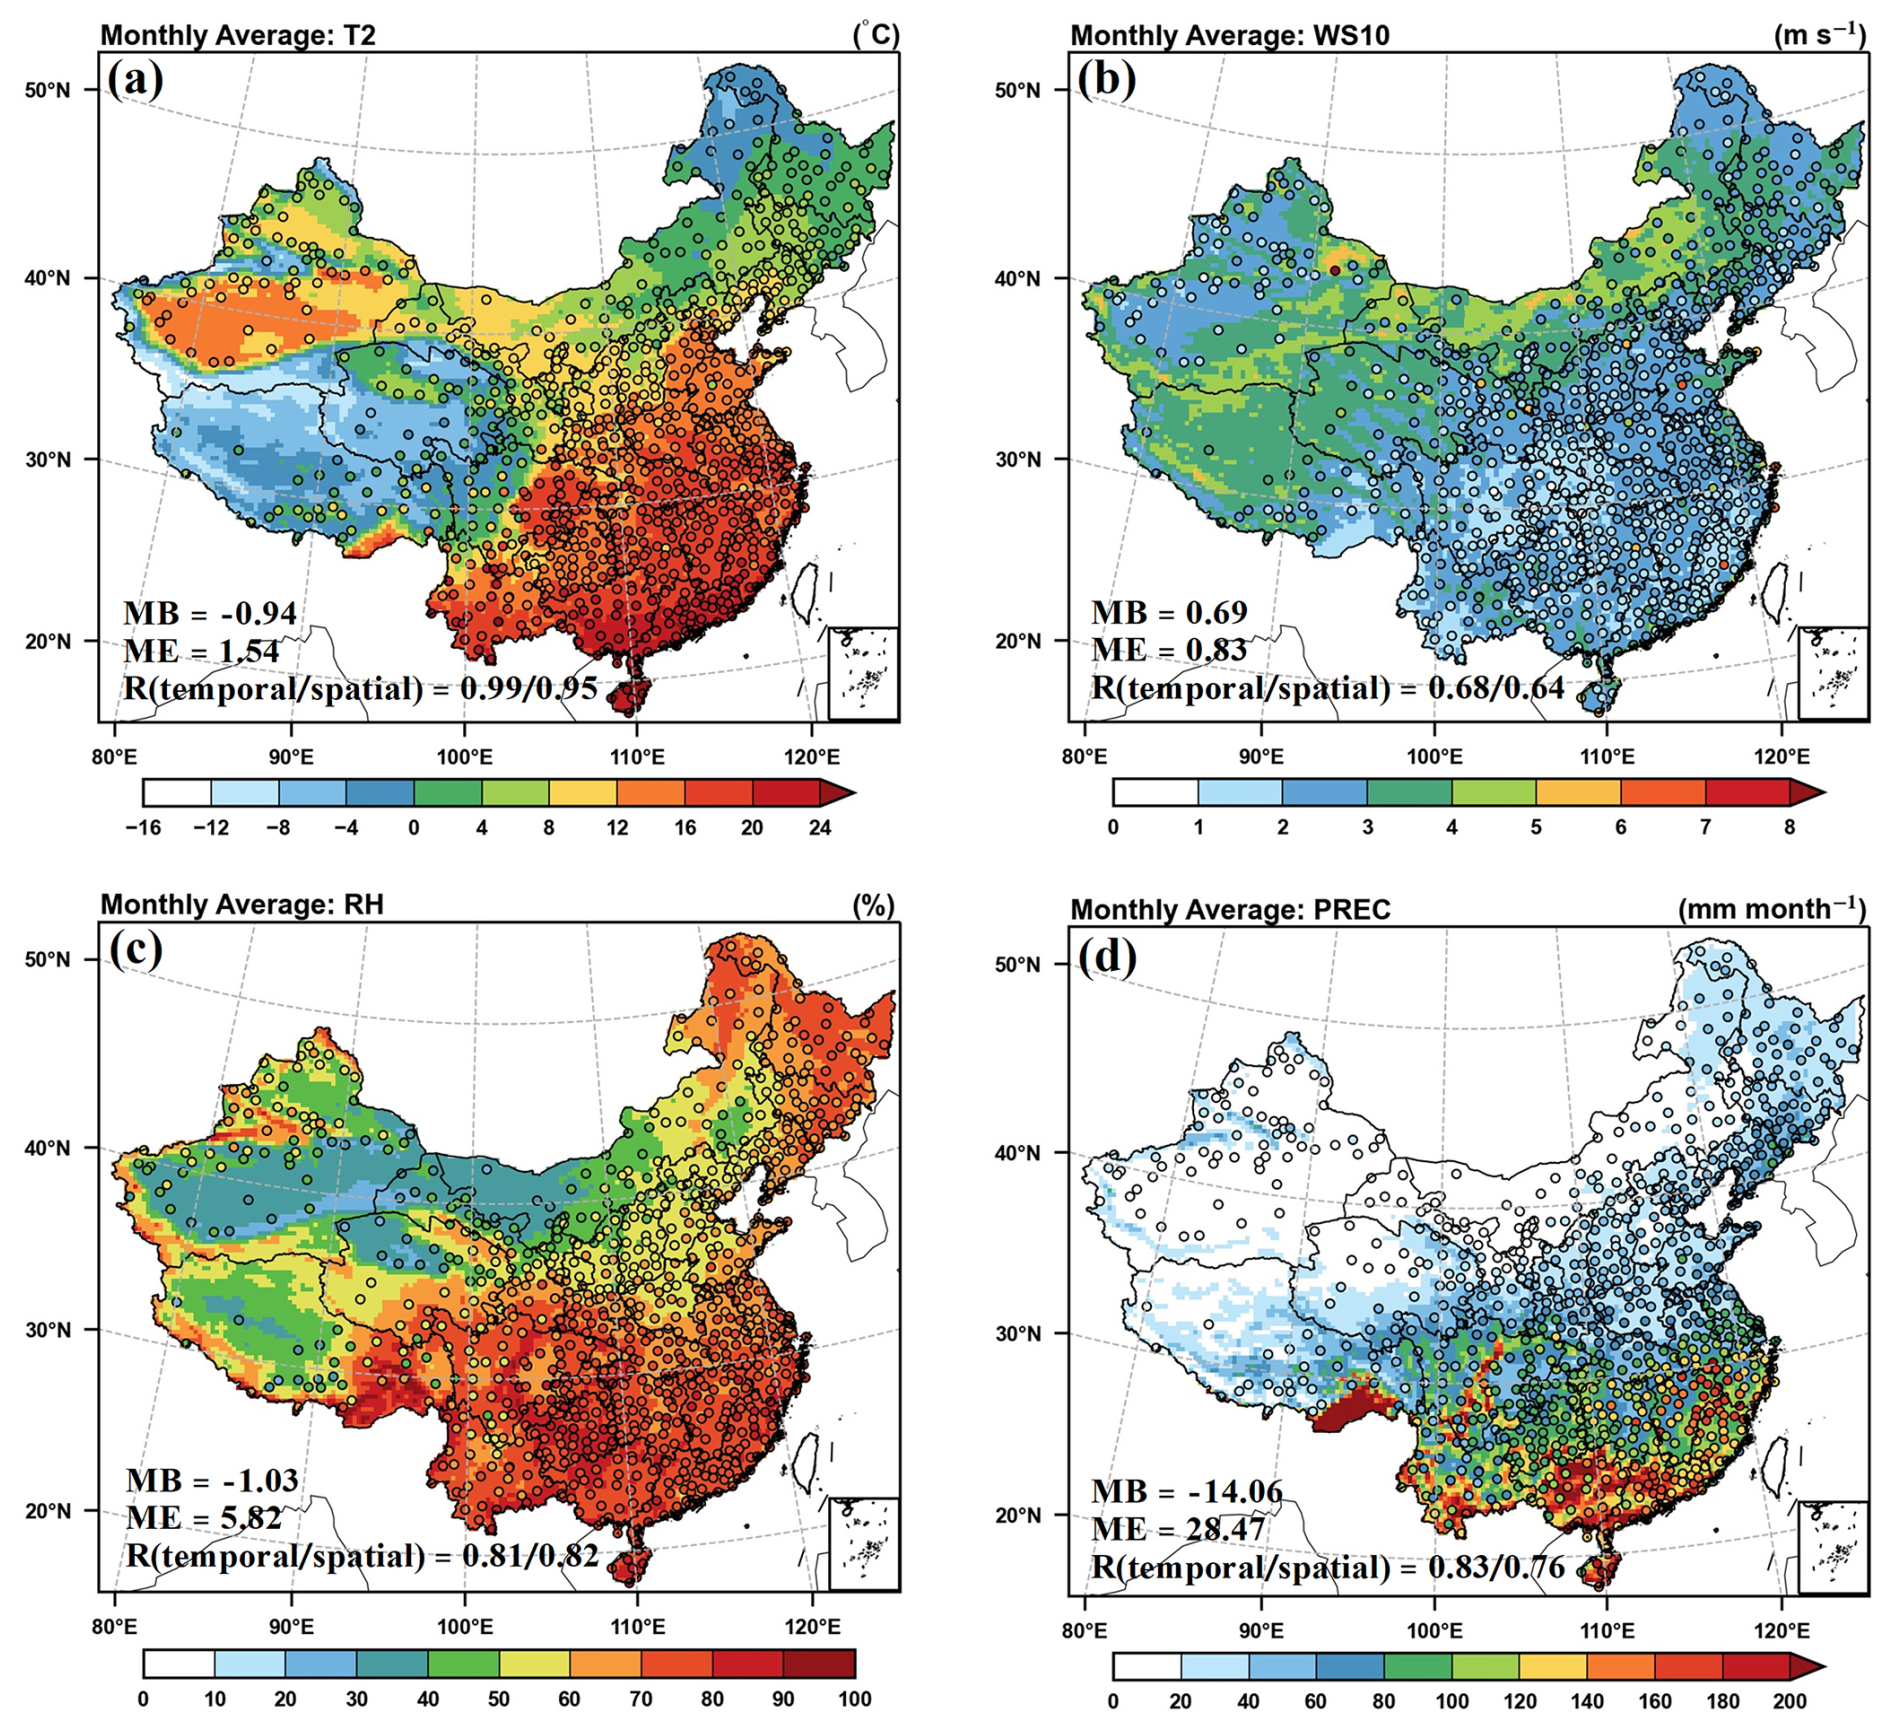
Figure 1Evaluations of simulated monthly average temperature at the height of 2 m (T2, a), wind speed at the height of 10 m (WS10, b), relative humidity (RH, c), and accumulated precipitation (PREC, d) in mainland China. The dots represent the site-level observations. The normalized mean bias (NMB), normalized mean error (NME), root mean squared error (RMSE), and the correlation coefficient (R) for the comparisons are shown in the lower left corner of each panel.
3.1 Evaluation of model performance
We compared the simulated near-surface temperature, wind speed, relative humidity, and accumulated precipitation with observations at the monthly level, as shown in Fig. 1. The model reasonably reproduced the spatial pattern of near-surface temperature, with the spatial R reaching 0.95 (Fig. 1a). Overestimation was found in the southeast and northwest of the country while underestimation over the Tibetan Plateau. At the national scale, T2 was generally underestimated, with the MB and ME calculated to be −0.94 and 1.54°, respectively. In addition, the temporal R reached 0.99, indicating the simulation was in good agreement with observation at the monthly level. Unlike T2, due to the modeling biases in the topographic effects and the underestimation of urban land use in USGS (Carvalho et al., 2012; Liao et al., 2015), WS10 was overestimated, with MB calculated to be 0.69 m s−1 at the national scale (Fig. 1b). Such overestimation was also reported in other studies (Liu and Wang, 2020; Shen et al., 2021; Zhu et al., 2022). RH is slightly underestimated, with MB and ME calculated to be −1.03 % and 5.82 %, respectively, while both spatial and temporal R were greater than 0.8 (Fig. 1c). PREC was generally underestimated, with MB and ME at −14.06 and 28.47 mm, respectively. A clear gradient from northwest to southeast China was well captured, and the temporal and spatial R were 0.83 and 0.76, respectively (Fig. 1d).
The comparison between the simulated and observed annual Nr deposition averaged over 2010–2014 at the site level are provided by form (dry and wet) and species (OXN and RDN) in Table 2. Nr deposition was underestimated for all cases. The NMB and NME for the dry deposition of OXN (OXN_DDEP) were calculated at −9.07 % and 34.76 %, respectively, and the analogous numbers for RDN (RDN_DDEP) were at −15.12 % and 43.24 %. The uncertainty in NH3 emission inventories was frequently recognized as an important factor contributing to the underestimation (Ma et al., 2023; Chang et al., 2020; Shen et al., 2023). The limited development of intensive livestock breeding and farming in China poses a considerable challenge in acquiring sufficient activity data and accurate emission factors, leading to underestimation of emissions with the “bottom-up” approach. Utilizing satellite constraints, Zhang et al. (2018) estimated that the total NH3 emissions in China may be underestimated by nearly 40 %. Due to lack of direct observation, additionally, the dry deposition at NNDMN sites was calculated by multiplying the observed surface concentrations with Vd simulated from GEOS-Chem (Bey et al., 2001; Xu et al., 2019). Difference in the parameterization schemes for calculating Vd of given trace gases or aerosols between CTMs could also introduce modest uncertainty for assessment of OXN deposition (Wu et al., 2018; Chang et al., 2020). The wet deposition of OXN and RDN (OXN_WDEP and RDN_WDEP) were also underestimated compared to observations, with the NMBs calculated at −28.76 % and −17.86 %, respectively. Part of the reason may be underestimation of precipitation (Fig. 1d), given the closely linear relationship between wet deposition and precipitation on an annual accumulation basis (Sahu et al., 2010; Zhang et al., 2019). More importantly, most of wet deposition measured at NNDMN sites was actually “bulk deposition”, which included both wet deposition and a small fraction of dry deposition (Xu et al., 2015). Therefore, the bias from observation also contributed to the inconsistency.
Table 2The normalized mean bias (NMB), normalized mean error (NME), and the correlation coefficient (R) between the simulated and observed annual Nr deposition. Dry and wet Nr deposition fluxes of oxidized nitrogen (OXN) and reduced nitrogen (RDN) averaged over 2010–2014 were evaluated separately.
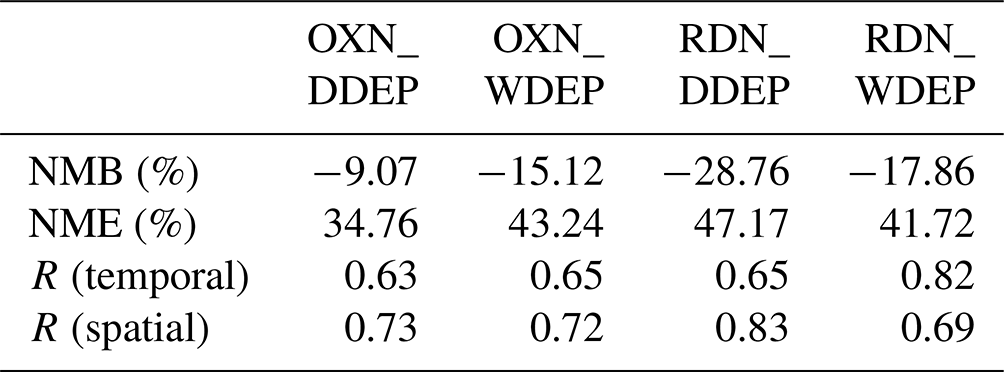
Note that OXN_DDEP and OXN_WDEP indicate the dry and wet deposition of oxidized nitrogen, respectively. RDN_DDEP and RDN_WDEP indicate the dry and wet deposition of reduced nitrogen, respectively.
Project of the Model Inter-Comparison Study for Asia (MICS-Asia) phase III reported the performances of Nr deposition simulation with multiple models over China, with the overall NMBs and NMEs ranged −47 %–67 % and 48 %–82 % for OXN, and −70 %–−29 % and 44 %–72 % for RDN, respectively (Ge et al., 2020). The model performance in our study was comparable to previous studies. In addition, both spatial and temporal R were greater than 0.6 for each deposition form and species. This indicates that our 5-year simulations effectively capture the interannual variability. Overall, our simulations reasonably reproduced the observed Nr deposition in both magnitude and spatiotemporal patterns.
3.2 Evolution of Nr deposition and the roles of climate and emission changes
Table 3 summarizes the simulated atmospheric Nr deposition over historical (base case) and future periods under SSP2-4.5 (Case 1) and SSP5-8.5 (Case 2). The annual averaged Nr deposition for 2010–2014 was simulated at 14.7 kg N ha−1 yr−1 for mainland China (base case). The contribution of RDN to total deposition reached 52 %, which was in good agreement with the multiple-model ensemble mean value in the MICS-Asia phase III project (Ge et al., 2020). The ratio of wet deposition to total deposition was 0.54 in our simulation, also close to other CTM and nationwide observation results (Ge et al., 2020; Xu et al., 2015; Zhao et al., 2017).
Table 3Simulated atmospheric Nr deposition fluxes (kg N ha−1 yr−1) in China averaged over 2010–2014 and 2060–2064 under different SSP-RCP pathways.
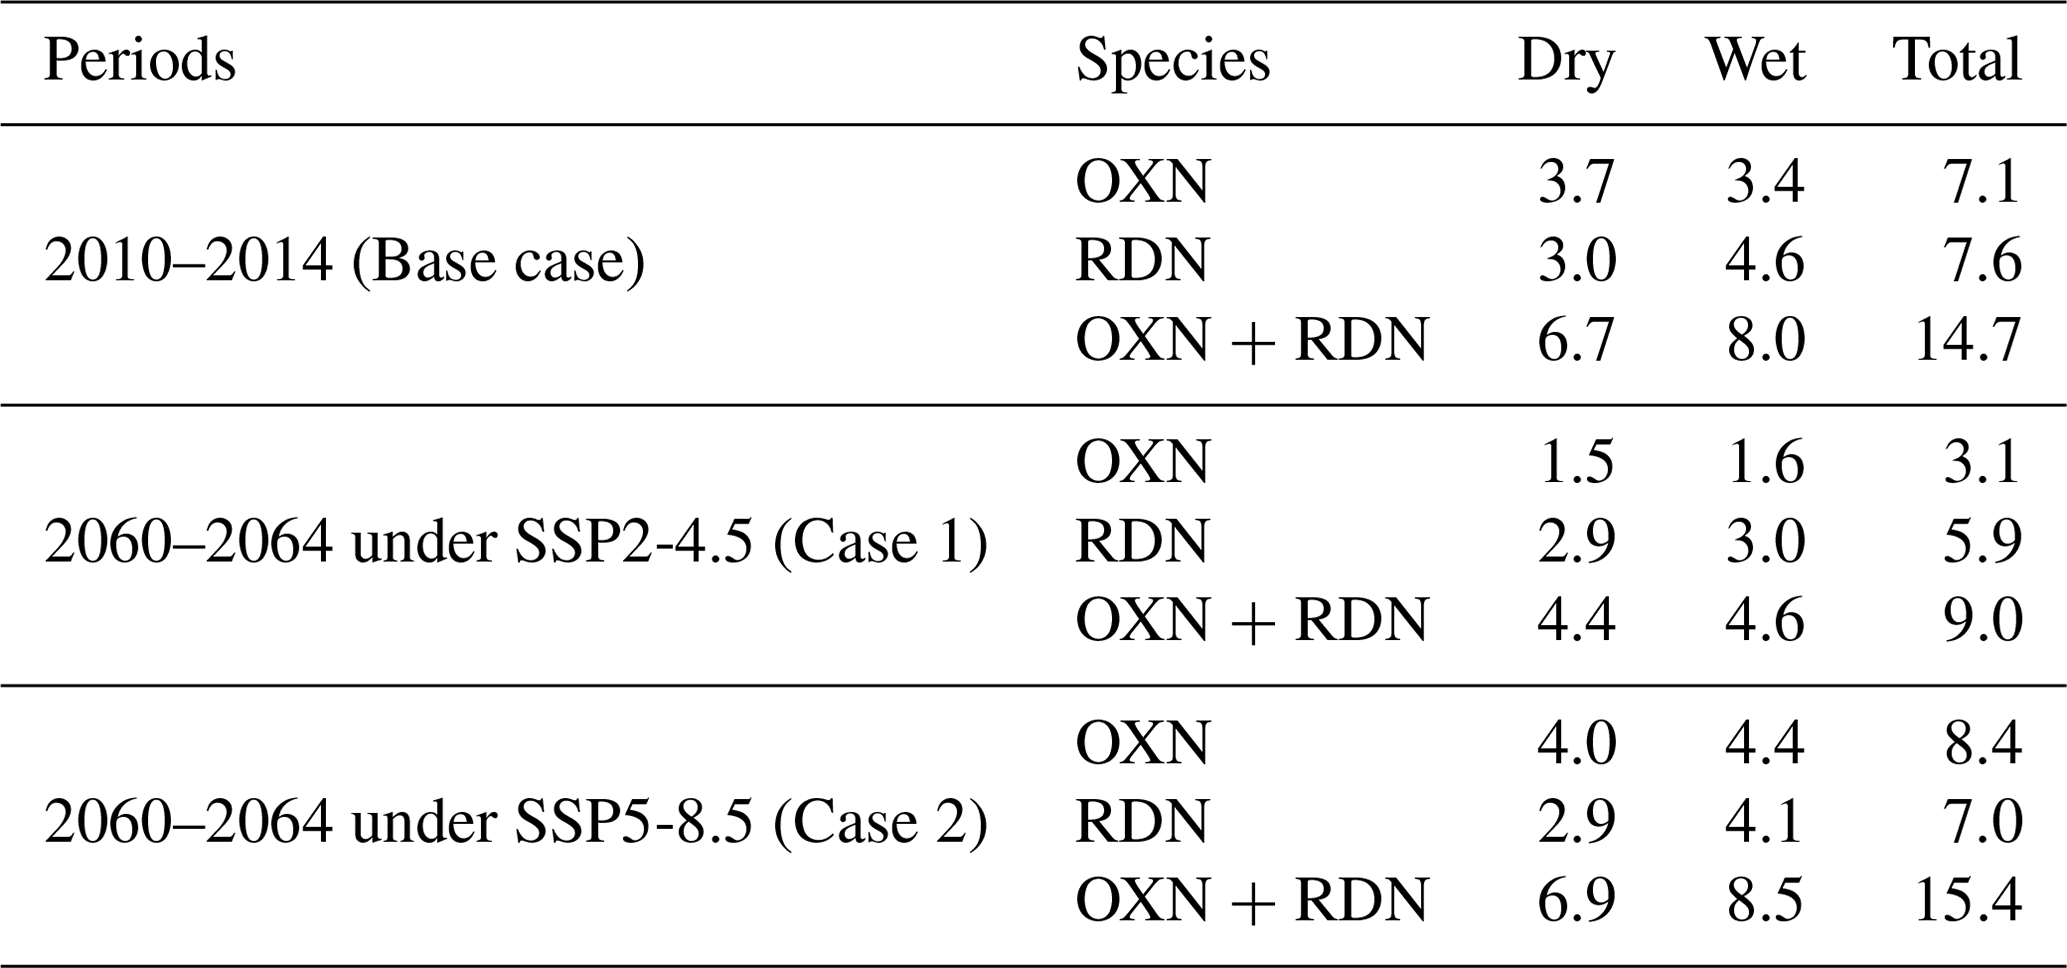
Figure 2 shows the changes of NOx and NH3 emissions in 2060 relative to the historical period (2010–2014) in various scenarios, and Fig. S2 provides the annual emissions by sector. Large emission changes would occur mainly in the east of China. By 2060s, the national NOx emissions would decline 55 % (−15.1 Mt) and 89 % (−24.5 Mt) under the Current-goal and Neutral-goal emission scenario (Fig. 2b–c). Such reductions would come mainly from power, industry and transportation sectors, driven by the predicted transition of energy structure (Fig. S3a–b). Due to less improvement in agriculture management, the NH3 emissions would decline much more slowly by 28 % (−2.9 Mt) and 47 % (−4.9 Mt) in the two scenarios. Under SSP2-4.5, the total Nr deposition would decrease to 9.0 kg N ha−1 yr−1 during 2060–2064, primarily attributed to a sharp decline in OXN deposition (Case 1). Accompanied with an active energy transition and effective control of fossil fuel consumption, the substantial reduction in anthropogenic NOx emissions led to a 56 % decline in OXN deposition compared to the reference period. Meanwhile, RDN deposition would be reduced by only 22 %, resulting from a modest abatement of NH3 emissions. Under SSP5-8.5, the global economy would maintain rapid growth without sufficient considerations for climate change. A high dependence on fossil fuels (especially coal) for energy consumption would result in a nationwide growth of annual NOx emissions by 24 % (6.5 Mt) from the 2010s to 2060s (Baseline scenario in DPEC, Fig. 2a), and thereby elevate the total Nr deposition to 15.4 kg N ha−1 yr−1 (Case 2). The proportions of OXN and RDN in future Nr deposition were anticipated to vary across different SSP-RCP pathways. Under SSP2-4.5, RDN was predicted to be the dominant species of Nr deposition in the 2060s, with a proportion to the total estimated at 66 %. Under SSP5-8.5, the proportion of OXN to total deposition was expected to expand from 48 % in the 2010s to 55 % in the 2060s. In addition, we further investigated the interannual variability in Nr deposition for historical (base case) and future periods under SSP2-4.5 (Case 1) and SSP5-8.5 (Case 2), as shown in Fig. S3. With the combined influence of emissions and meteorological factors, the standard deviation (SD) of Nr deposition during 2010–2014 was 0.78 kg N ha−1 yr−1. For 2060–2064, the emissions in Case 1 and Case 2 were held constant from year to year, and the interannual variability in Nr deposition resulted solely from meteorological fluctuations, with the SDs estimated at 0.27 and 0.45 kg N ha−1 yr−1, respectively.
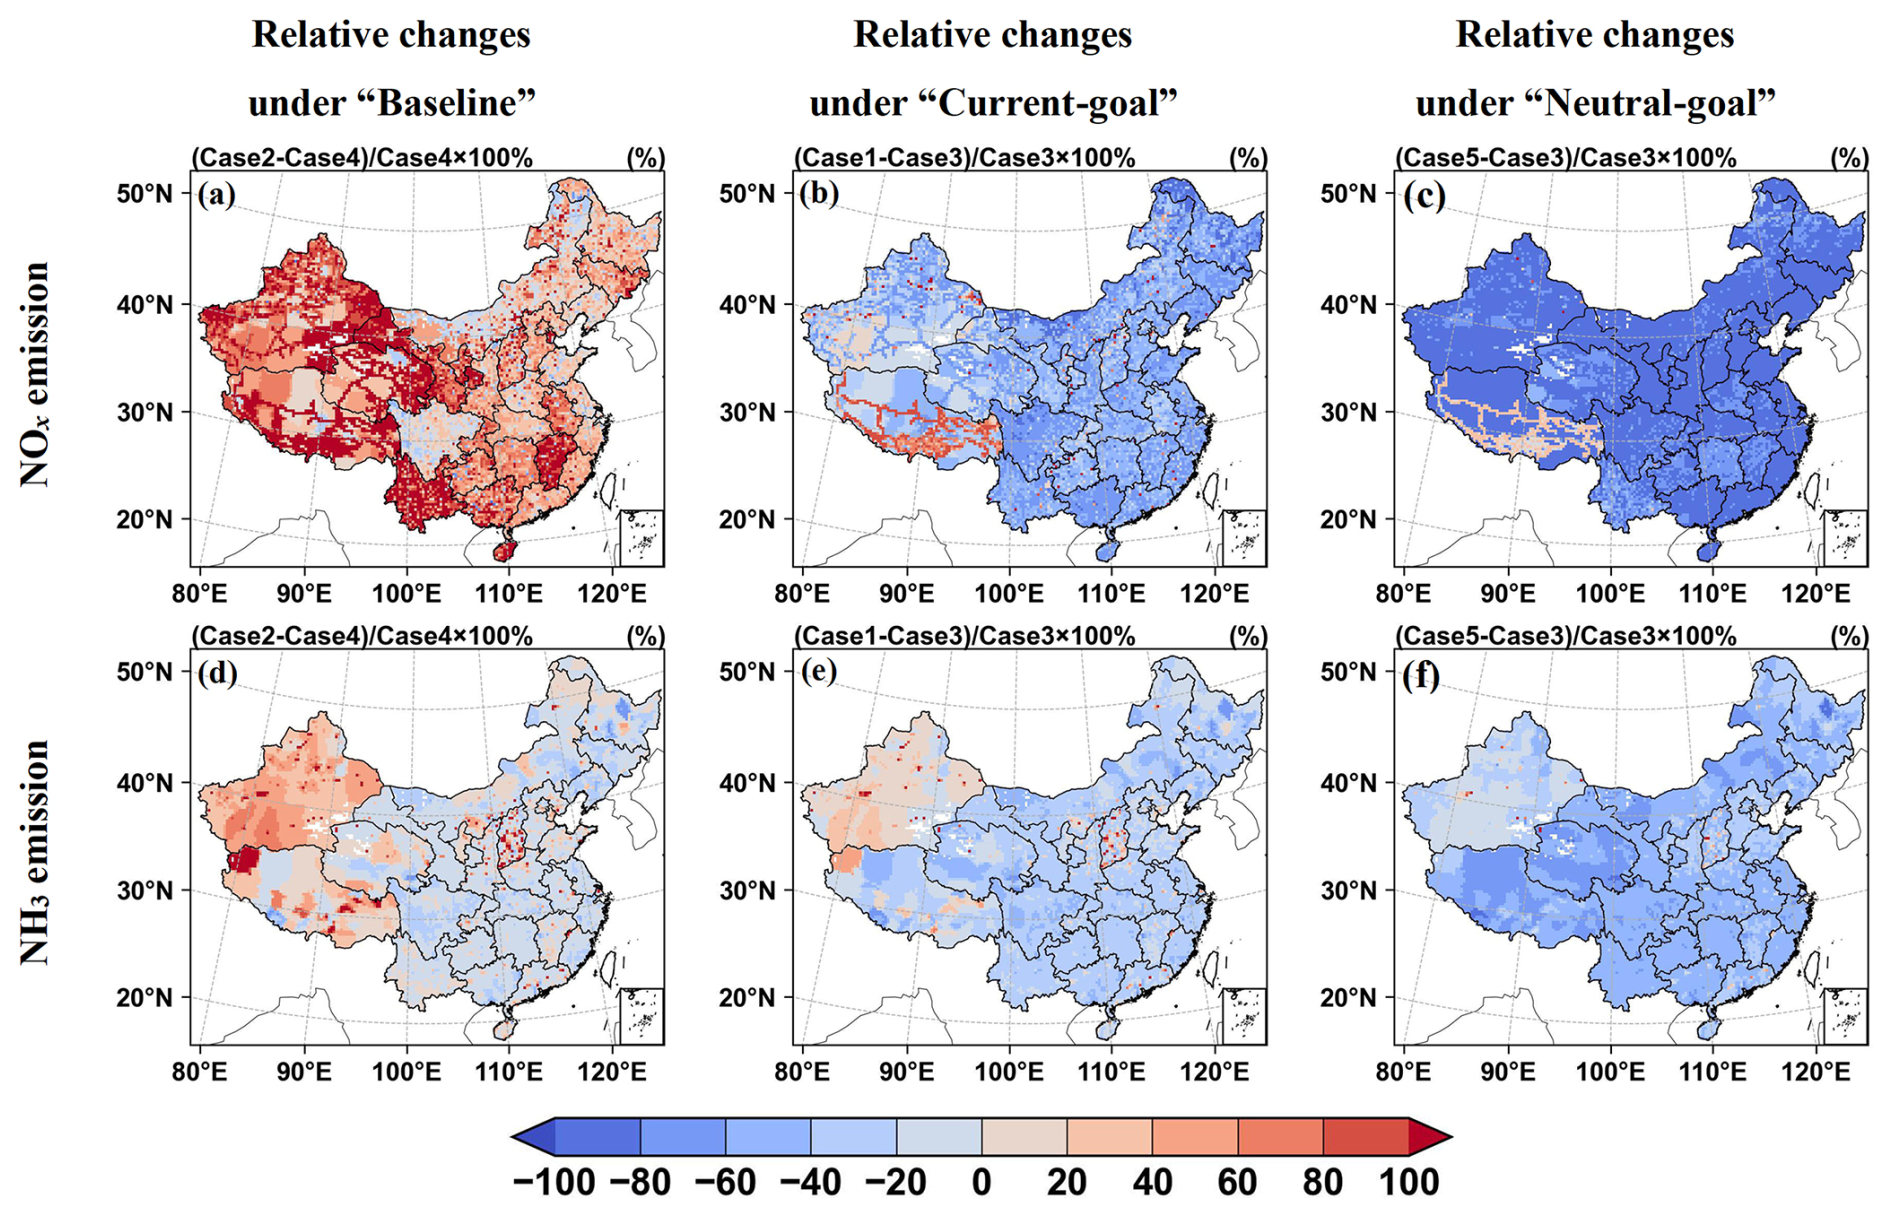
Figure 2Spatial distribution of relative changes (%) of NOx (a–c) and NH3 emissions (d–f) from the 2010s (2010–2014) to 2060s (2060–2064) for Baseline, Current-goal, and Neutral-goal emission scenarios. Relative changes are calculated by comparing 2060s emission levels to 2010s emission levels and then dividing the difference by the 2010s emission levels.
In terms of spatial pattern, our simulations present clearly larger regional difference in China compared to the global results of ACCMIP, owing to finer simulation resolution and more detailed regional emission information. Figure 3 illustrates the spatial distribution of Nr deposition in historical period and the future changes under different SSP-RCP pathways. For 2010–2014, a clear gradient from west to east was found for all deposition forms and species (Fig. 3a–d), driven mainly by the spatial distributions of NH3 and NOx emissions. Dry deposition of OXN (OXN_DDEP) appeared mainly in Eastern China, especially in the Beijing–Tianjin–Hebei (BTH), Yangtze River Delta (YRD), and Pearl River Delta (PRD) regions (see Fig. S1 for the locations of these regions), resulting mainly from the large NOx emissions caused by active industrialization and urbanization. Hotspots of RDN dry deposition (RDN_DDEP) appeared mainly in the North China Plain and the Sichuan Basin (SCB) with intensive agricultural activities. Further influenced by precipitation patterns, the southern areas experienced greater wet deposition compared to the north, consistent with previous studies (Han et al., 2017; Zhao et al., 2017). Influenced jointly by the substantial rainfall and local Nr emissions, in particular, SCB was of the largest wet deposition for both OXN and RDN (OXN_WDEP and RDN_WDEP).
Future OXN deposition would exhibit contrasting trends between SSP2-4.5 and SSP5-8.5. Compared to historical periods, both dry and wet forms were predicted to decrease in the 2060s under SSP2-4.5, with national average reductions of 2.2 and 1.8 kg N ha−1 yr−1, respectively. Relative large declines would be found in their respective hotspots (Case 1 − base case, Fig. 3e–f). In contrast, a growth of OXN deposition would appear under SSP5-8.5, contributed mainly by wet deposition. The changes of dry deposition would be limited within 1 kg N ha−1 yr−1 at the national level (Case 2 – base case, Fig. 3i–j). For RDN deposition, there would be a nationwide decline in the 2060s under SSP2-4.5 (Case 1 – base case, Fig. 3g–h). A large decline would be found for wet deposition in the SCB and the surrounding area, with the maximum exceeding 10 kg N ha−1 yr−1. The changes under SSP5-8.5 would be small, with the national average reduced by 0.1 and 0.5 kg N ha−1 yr−1 for dry and wet deposition, respectively (Case 2-base case, Fig. 3k–l).
With Cases 3 and 4 included in the analyses, we further estimated the impacts of climate and emission change on future total Nr deposition and compared them with the joint impact (Fig. 4). Under SSP2-4.5, the national average difference in Nr deposition due to changing emissions alone (−5.48 kg N ha−1 yr−1, Fig. 4b) was closer to that from joint impacts (−5.77 kg N ha−1 yr−1, Fig. 4c), while the difference caused by climate change alone was small (−0.29 kg N ha−1 yr−1, Fig. 4a). Additionally, the spatial correlation (R) between the difference in deposition due to emission change alone and that due to both factors would be 0.97 (Fig. 4b), while it would be clearly smaller at 0.66 between those due to climate change alone and both factors (Fig. 4a). This indicates that future long-term Nr deposition would be primarily dominated by emission change. Under SSP5-8.5, the total amount of Nr deposition change at the national level would also be dominated by the varying emissions. The emission change alone would lead to a growth of nationwide deposition at 0.83 kg N ha−1 yr−1 (Fig. 4e), 90 % of the total growth (0.92 kg N ha−1 yr−1, Fig. 4f). However, the spatial pattern of deposition would be largely modulated by climate change, with the spatial R between the deposition differences due to climate change alone and both factors reaching 0.84 (Fig. 4d). The value would only be 0.55 between differences due to emission change alone and both factors (Fig. 4e). In the southern BTH, for example, future climate change would elevate the deposition by over 4 kg N ha−1 yr−1. By comparing the roles of emission and climate changes in Nr deposition under different SSP-RCP pathways, our study emphasizes that the rigorous implementation of emission controls in the future can effectively mitigate the adverse perturbations of climate change.
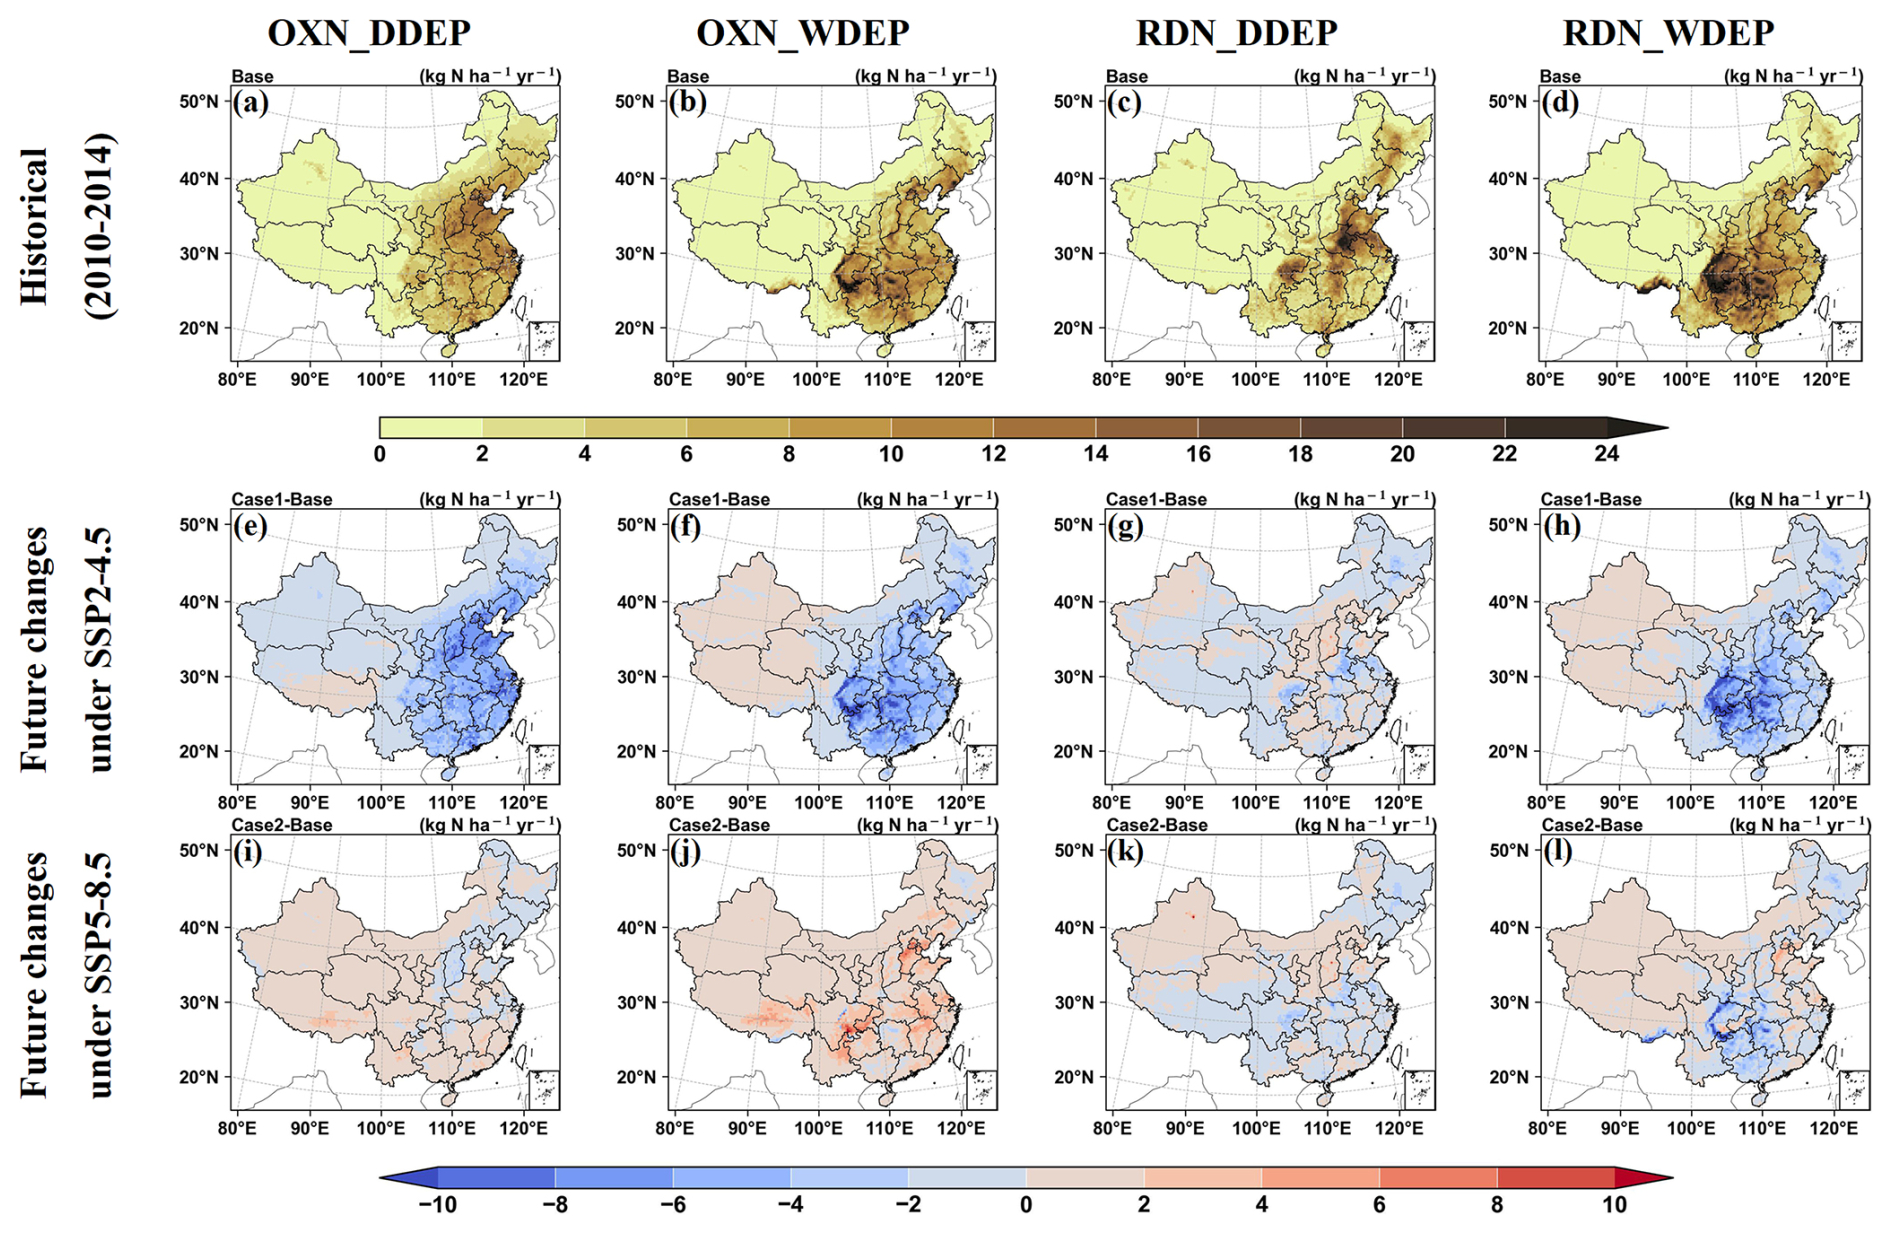
Figure 3Spatial distribution of annual averaged Nr deposition fluxes (kg N ha−1 yr−1) for different forms and species in the 2010s and the changes between the 2010s and 2060s. Panels (a) to (d) represent the results of 2010s (base case). Panels (e) to (h) represent future deposition changes under SSP2-4.5 (Case 1 − base case). Panels (i) to (l) represent the changes under SSP5-8.5 (Case 2 − base case).
3.3 Varying effects of different emission changing patterns on Nr deposition
We further quantified the effects of emission controls on the deposition of different Nr components (OXN and RDN) and compared them under various future emission scenarios (Baseline, Current-goal, and Neutral-goal). As illustrated in Fig. 5, with an exception of OXN deposition in the Baseline scenario which would increase 24 % (1.42 kg N ha−1 yr−1) from the 2010s to 2060s, the national Nr deposition would commonly decline for other cases, ranging from 5 % to 85 % (0.27–4.93 kg N ha−1 yr−1). In the Neutral-goal scenario, in particular, the national average OXN deposition was predicted to decline to 0.98 kg N ha−1 yr−1 by 2060s (Fig. S4), accounting for only 17 % of the total Nr deposition. This implies that the continuous and substantial reduction in NOx emissions, implemented as part of the national strategy to address climate change and to improve air quality, would make RDN become the dominant contributor to future Nr deposition. The spatial correlation between future emission change and the resulting deposition change was estimated and is summarized in Table S2 for different emission scenarios. Compared with OXN, the spatial change in RDN deposition would be more consistent with that of precursor emissions, indicated by a much higher R for RDN (0.67–0.72) than OXN (0.24–0.35). The discrepancy could result from the stronger regional transport of NOx, which comes largely from high-stack sources (Ma et al., 2020).
Figure 6 compares the relative changes in future Nr deposition and precursor emissions for WC and EC in different emission scenarios. Under the Baseline scenario (Fig. 6a), the OXN deposition in WC was predicted to increase 47 % from the 2010s to 2060s. This growth would be notably smaller than that of NOx emissions (81 %), suggesting that a larger amount of OXN in WC would deposit to the east through atmospheric transport. However, the transport might be weakened from WC to EC in the Current-goal (Fig. 6b) and Neutral-goal scenarios (Fig. 6c), in which the OXN deposition in WC would decline (46 % and 85 %, respectively) greater than that of NOx emissions (41 % and 77 %, respectively). Additional experiments were conducted to quantify the impact of changing transport from WC on deposition in EC, by keeping the emissions in WC at the 2010s levels (Cases 6–8). The fluxes crossing 110° E from west to east were calculated within the altitude from the surface to 50 hPa and latitude from 20 to 50° N. Compared to the cases where emissions in WC were maintained at the 2010 levels, the outflow fluxes of OXN would change by 17.57 (Case 2–Case 7), −20.10 (Case 1–Case 6), and −37.12 kg N s−1 (Case 5–Case 8) for Baseline, Current-goal, and Neutral-goal scenarios, respectively (Table S3). Consequently, the OXN deposition in EC would change by 0.30 (2 %), −0.28 (−5 %), and −0.51 kg N ha−1 yr−1 (−27 %) from the 2010s to 2060s due to the emission variation in WC for different scenarios (Table 4). We further calculated the ratio of changes in OXN outflow to changes in NOx emissions () by combining the sensitivity simulation cases with fixed WC emissions as the 2010s. As shown in Fig. 6a, is greater than 1 in WC under the baseline emission scenario, indicating that “efficacy” of eastward transport of OXN would be enhanced. This resulted in a growing OXN deposition that would greatly lag behind the growth of emissions. The meteorological conditions of high wind speeds and low humidity in WC would hinder the conversion of aerosol NO, resulting in a high proportion of NO2 in total OXN. Gaseous NO2 usually has stronger long-distance transport capability, thus contributing to the high transport efficacy of OXN. Under the two emission reduction scenarios, the efficacy of eastward transport of OXN would decrease (), resulting in a larger decline in deposition compared to that in emissions (Fig. 6b and c).
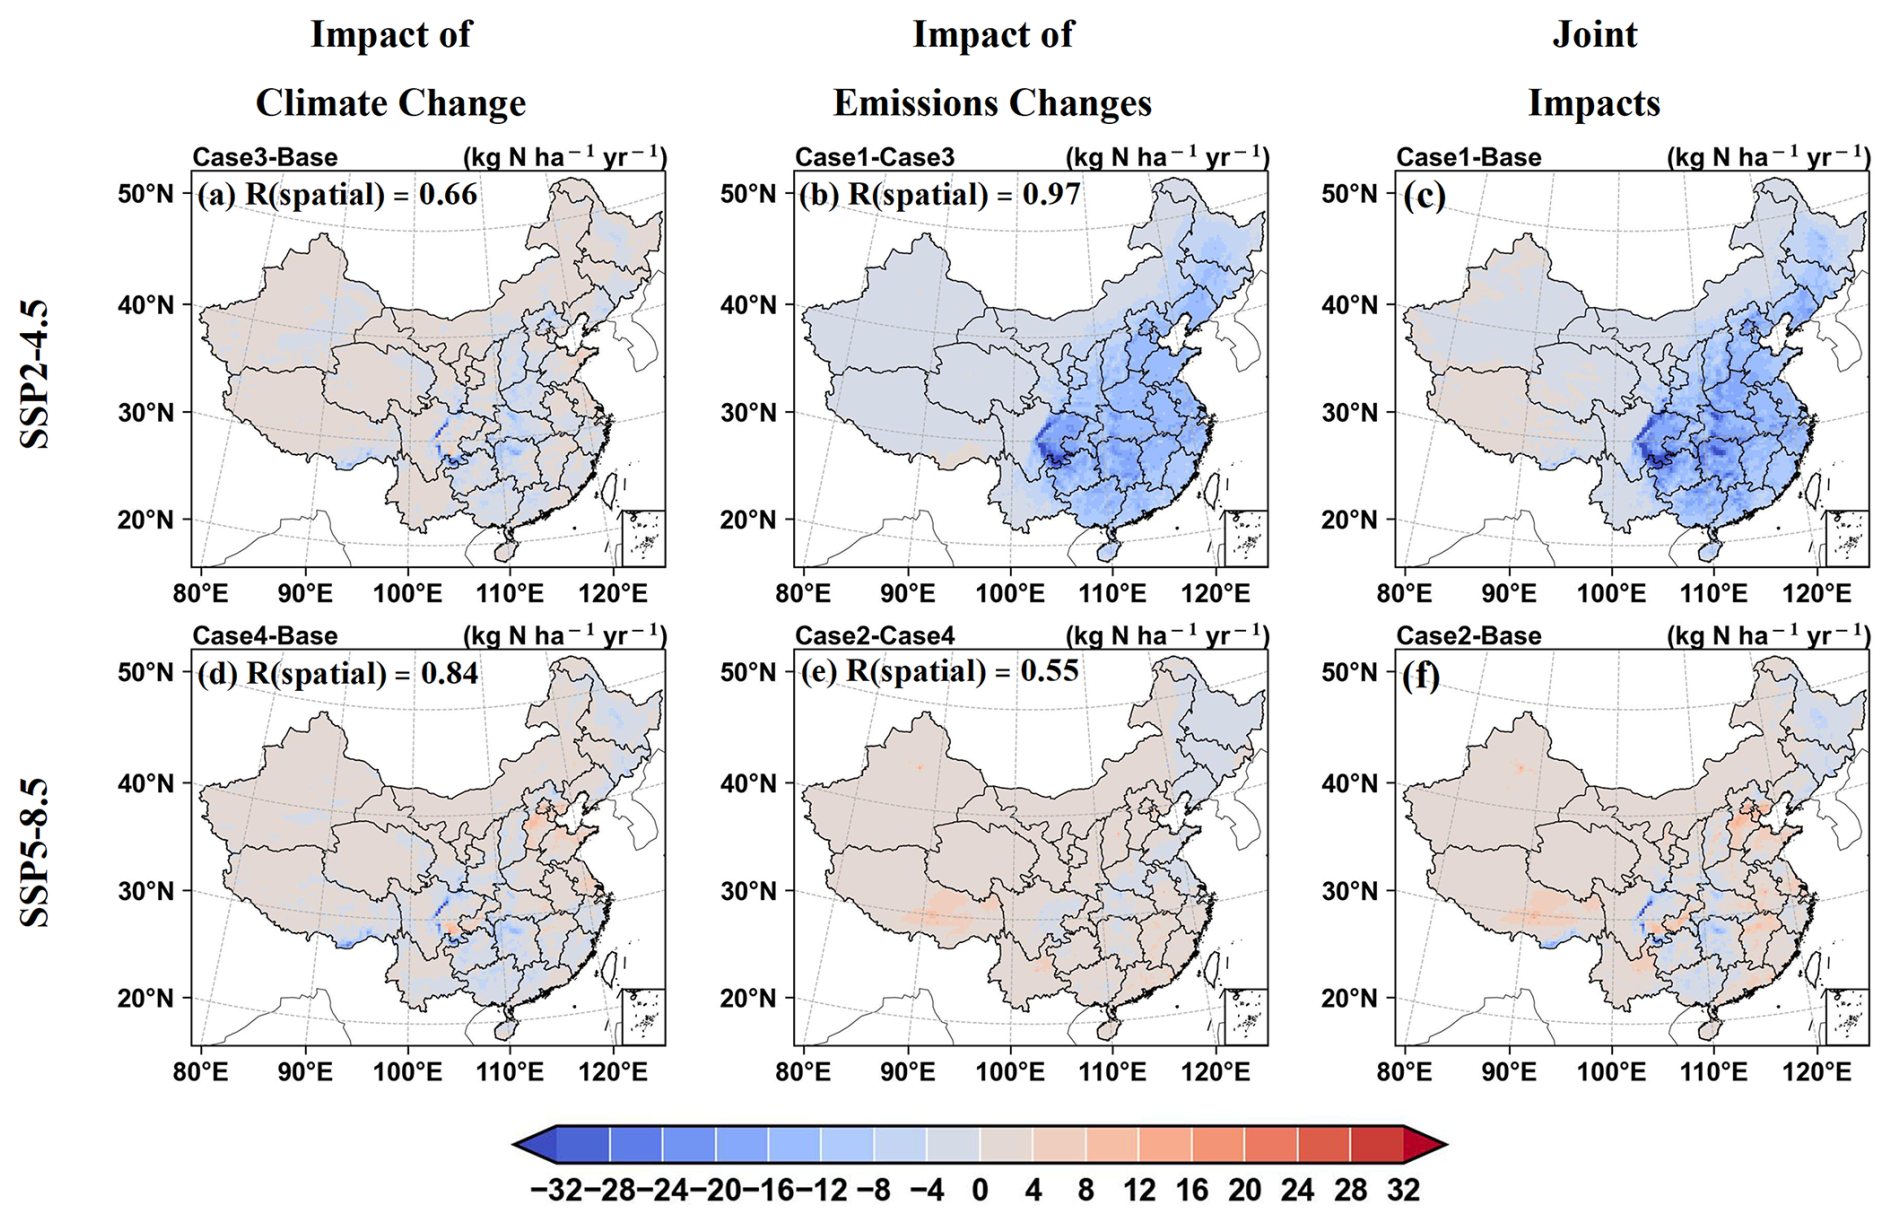
Figure 4Changes in annual total Nr deposition fluxes (kg N ha−1 yr−1) from the 2010s to 2060s attributed to climate change (a, d), emission change (b, e), and both (c, f). Panels (a)–(c) represent the changes under SSP2-4.5, respectively, and panels (d)–(f) represent the changes under SSP5-8.5. Domain-averaged spatial correlation (R) between the impact of climate or emission change and both is presented in panels (a) and (d) or (b) and (e).
The OXN deposition in EC was predicted to increase 13 %, despite a 17 % growth in NOx emissions under the Baseline scenario (Fig. 6a). The additional deposition loss may have been exported off-land through long-distance transport processes. Zhao et al. (2017) demonstrated that 30 % of China's Nr emissions from 2008–2010 were transported to the China Sea area of the northwest Pacific. We calculated the outflow fluxes of OXN from EC crossing 123° E within the altitude from the surface to 50 hPa and latitude from 20 to 50° N (Table S4). Under the Baseline scenario, the outflow fluxes from EC in the 2060s would increase by 19 % compared to the case with the emissions maintained at the 2010s level. In contrast, the outflow fluxes under the Current-goal and Neutral-goal scenarios would respectively decline by 49 % and 89 %, attributable to the emission abatement in EC. The result implies that effective implementation of China's clean air and carbon neutrality policies would definitely weaken its role of exporting pollution to west Pacific. More importantly, compared to the declining transport efficacy of OXN from WC to EC, with around 0.8, the in EC is closer to 1, indicating more similar changes in NOx emissions and OXN deposition. The disparity in transport intensity between WC and EC leads to uneven changes in deposition and emissions, highlighting the important role of inter-regional transport in the evolution of pollutant source-sink relationships.
For RDN deposition, the relative change in emissions and deposition would be essentially the same under the Baseline scenario (Fig. 6a). However, the change in RDN deposition would be smaller than that of NH3 emissions for both EC and WC in the remaining two scenarios (Fig. 6b and c). Given its short atmospheric lifetime (generally a few hours) and thereby limited long-distance transport capability (Hertel et al., 2006), the lag in RDN deposition reduction could primarily result from chemical transformation processes. As a crucial reduced gas in the atmosphere, NH3 exhibits high capability of neutralizing acid gases, thereby slowing down the formation of acid rain and actively participating in the production of sulfates (SO) and NO. With the substantial reduction in acidic pollutants, the secondary formation of ammonium sulfate and ammonium nitrate aerosols would decline, leading to an enhanced proportion of gaseous NH3 in RDN. Given much larger Vd of gaseous NH3 than that of particulate NH, the enhanced NH3 would result in a growth in dry deposition of RDN, thus slowing the decline in total RDN deposition.
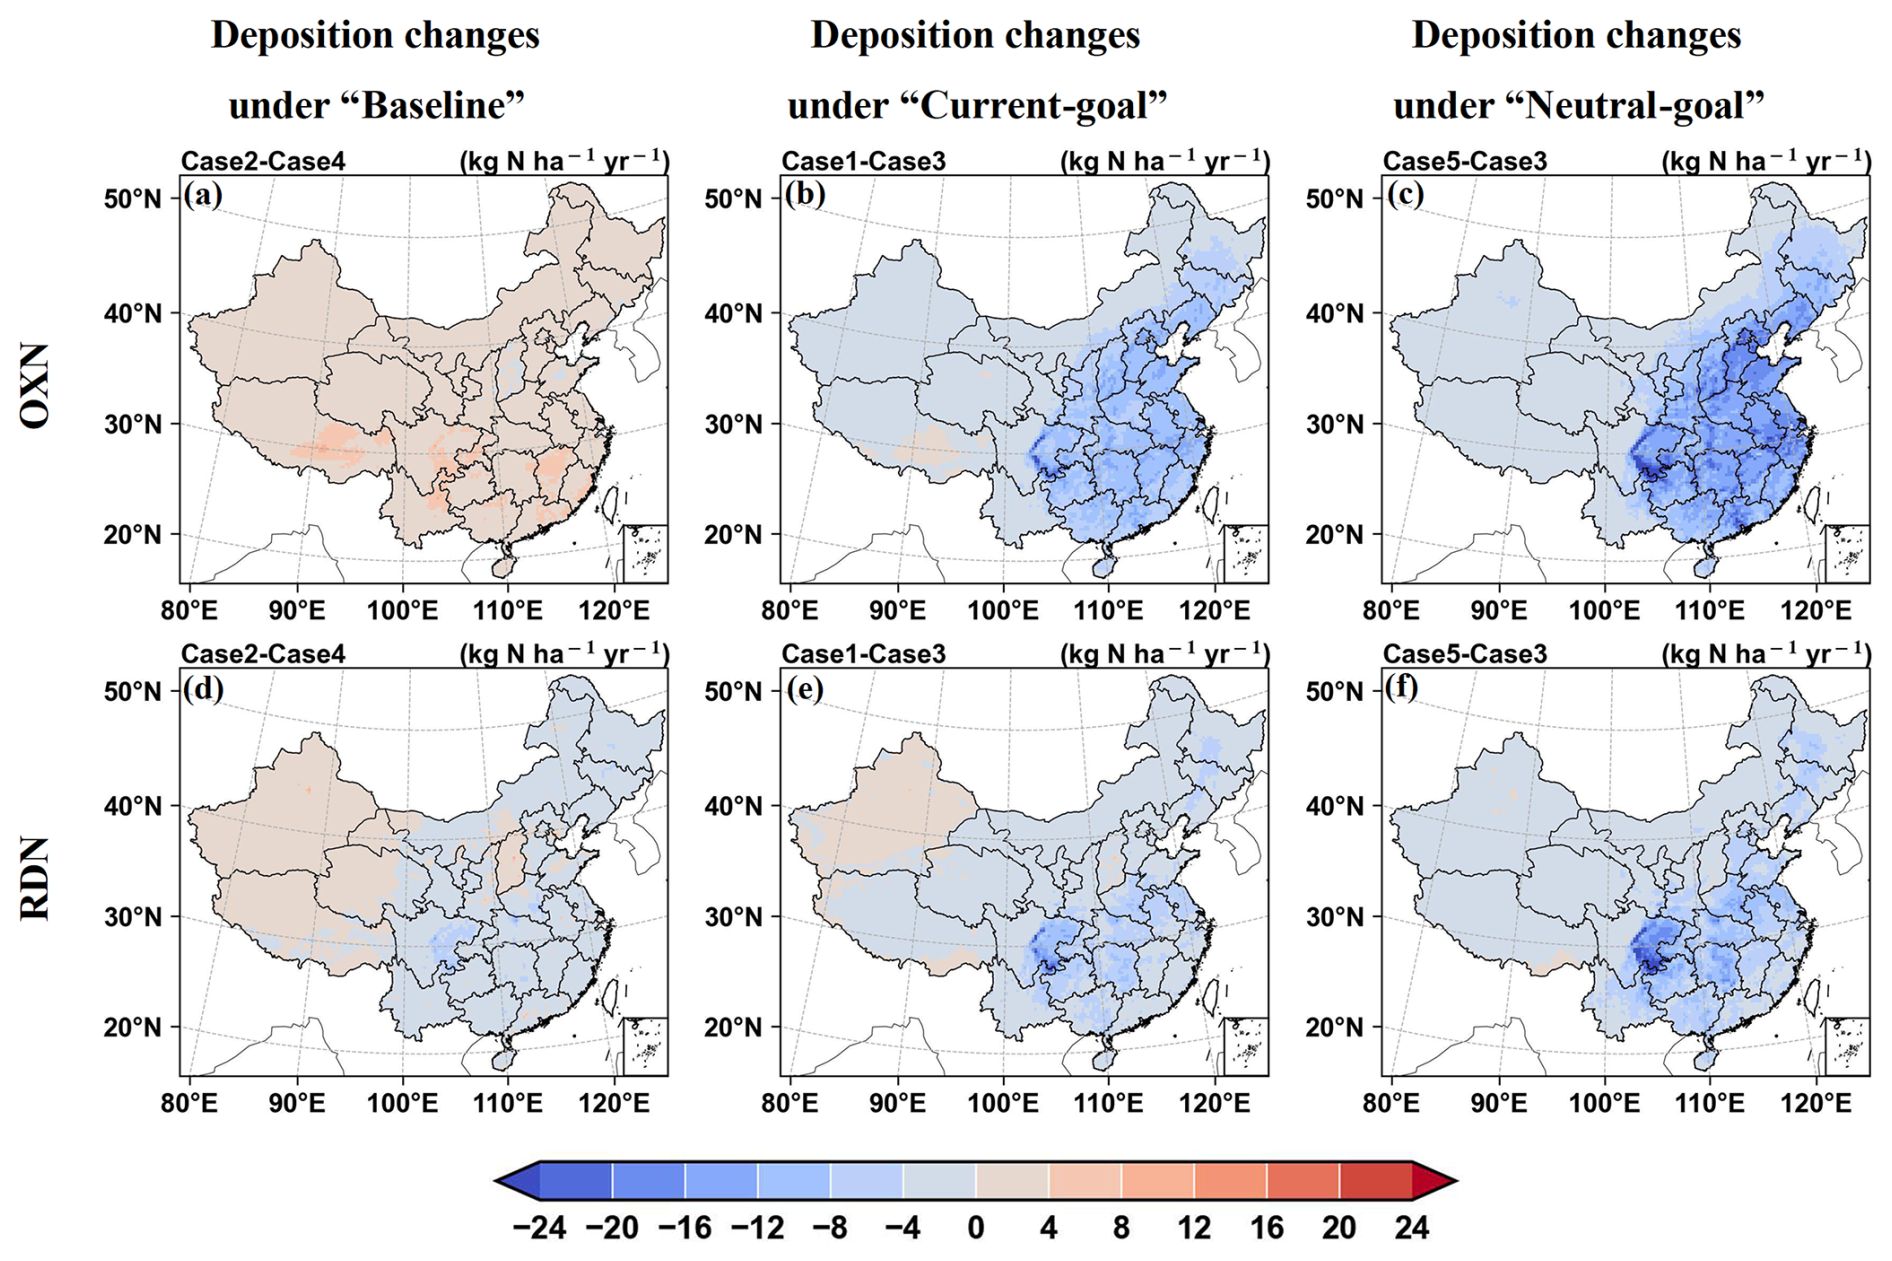
Figure 5Changes in OXN (a–c) and RDN deposition (d–f) from the 2010s to 2060s, attributed to emission variation in Baseline, Current-goal, and Neutral-goal scenarios.

Figure 6Relative changes in Nr emissions and deposition as well as the ratio of changes in OXN outflow to changes in NOx emissions () in WC and EC from the 2010s to 2060s under different emission scenarios.
Table 4Simulated domain-averaged OXN deposition fluxes (kg N ha−1 yr−1) over EC for cases where emissions change to 2060s levels in all regions as well as cases where emissions in WC are maintained at 2010s levels. Relative changes (%) are calculated by comparing cases with 2060s emission levels in all regions to cases with 2010s emission levels in WC and then dividing the difference by the 2010s emission levels in WC.

3.4 Responses of future Nr deposition to emission perturbation
Figure 7 shows the predicted response of Nr deposition to a 20 % emission reduction for the 2010s and 2060s under different emission scenarios. The response was obtained by calculating the ratio of the percent change in deposition to that in emissions. For OXN, the nationwide average response of OXN deposition to NOx emissions was 83 % for the 2010s (Fig. 7a). There was a clear north–south difference in the response over EC. We defined Northern China (NC; 30–45° N, 110–125° E) and Southern China (SC; 20–30° N, 110–125° E, Fig. S1) and calculated the response of OXN deposition to NOx emission change at 83 % and 96 %, respectively (Table 5). As a comparison, Liu et al. (2022) reported the response of OXN deposition to NOx emissions ranging 55 %–76 % in the North China Plain and neighboring areas during the 2010s. A high ratio of NOx to VOC emissions in NC resulted in the NOx-saturated regime for O3 formation, and reduced NOx emissions enhanced the atmospheric oxidation capacity (AOC) and in turn promoted the production of atmospheric HNO3. Additionally, there was insufficient ambient free NH3 to completely neutralize the gaseous HNO3, an important component of OXN_DDEP (Liu et al., 2018; Zhai et al., 2021). The relatively large proportion of HNO3 in OXN restrained a fast decline in OXN_DDEP, given the larger Vd of HNO3 compared to that of NO2. Overall, the enhanced AOC, coupled with relatively NH3-poor condition, resulted in a weak response of OXN deposition to emissions reduction. In our simulations, emissions were controlled for all species including VOCs. Compared to Liu et al. (2022) with NOx emission reduction only, the extra VOC emissions reduction might lower AOC due to their great contribution to the formation of O3 and OH radicals in the atmosphere (McDonald et al., 2018). Thus, the moderately large response in our simulation resulted from the simultaneous reduction in VOC and NOx emissions, which would partially offset the AOC enhancement induced by NOx emission control alone, and thereby restrain the OXN deposition to some extent.
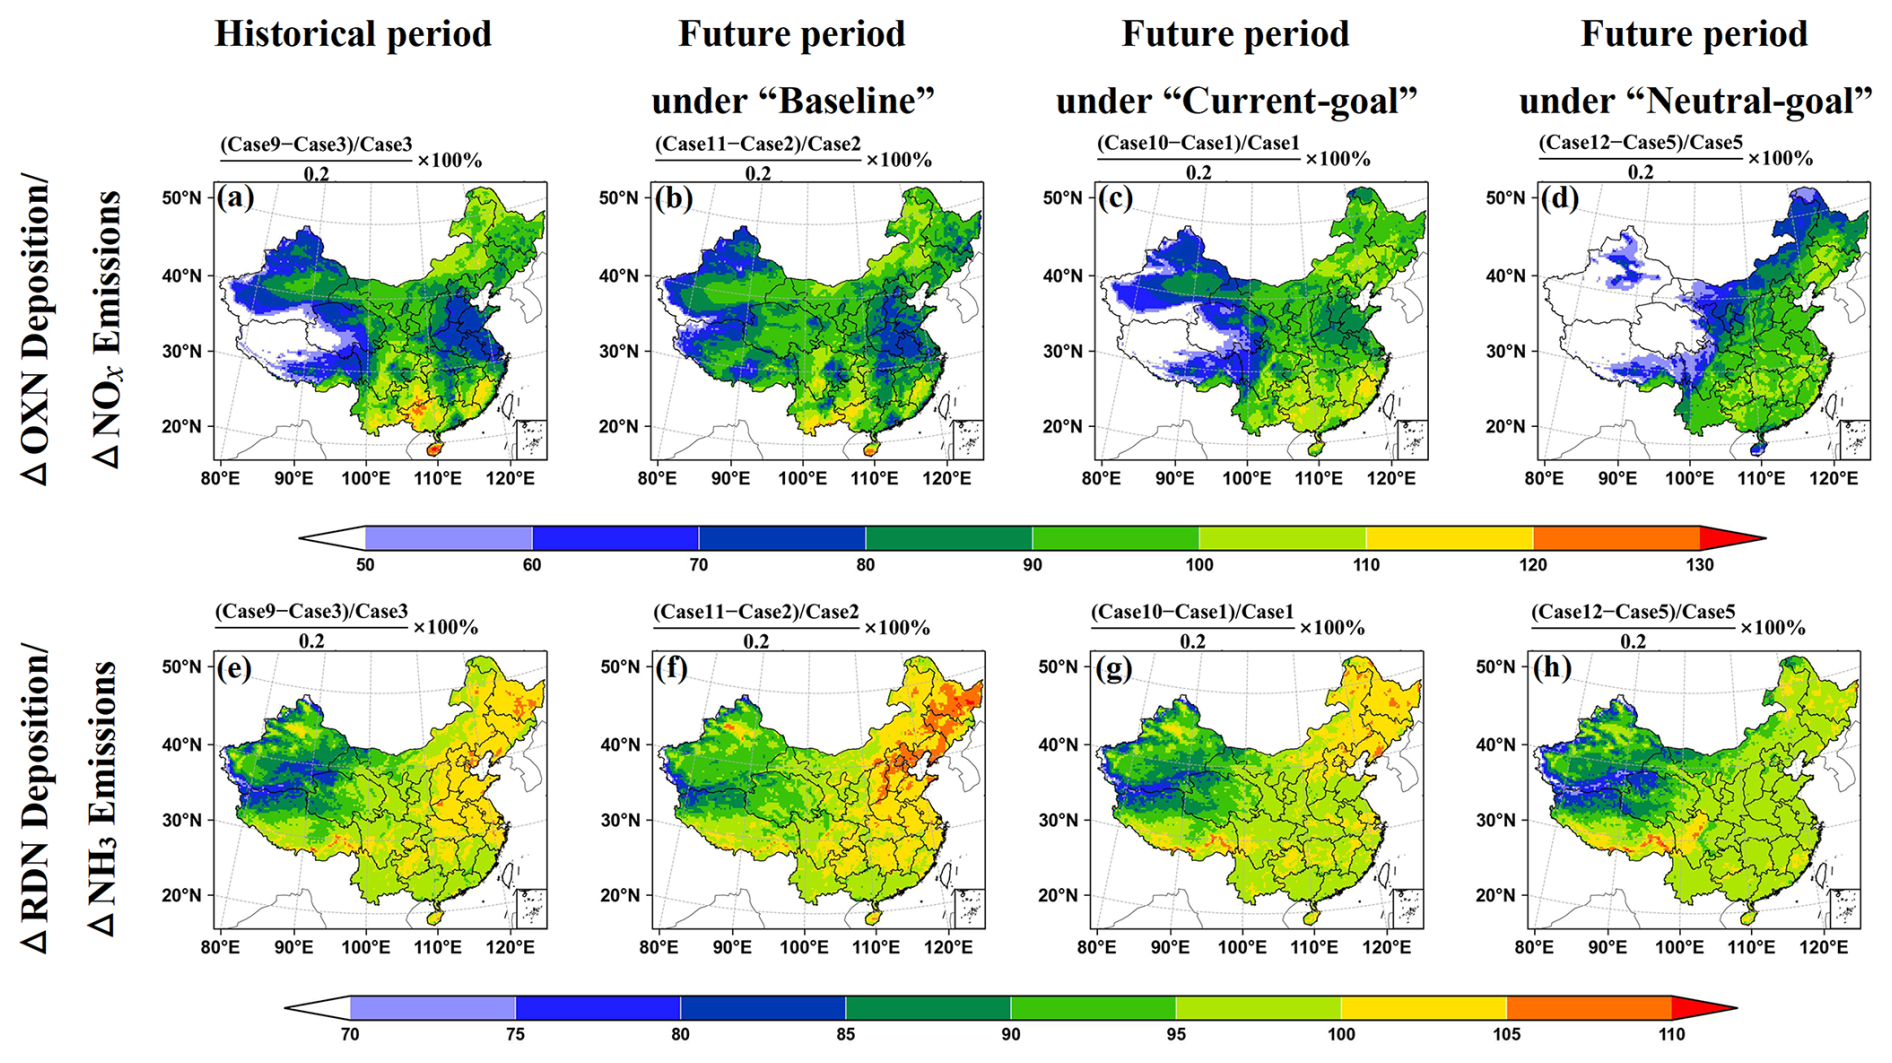
Figure 7Predicted response (%) of OXN (a–d) and RDN deposition (e–h) to a 20 % perturbation of emissions in the 2010s and 2060s for different emission scenarios. The response is obtained by calculating the ratio of the percent change in deposition to that in emission.
Table 5Regional average responses (%) of OXN or RDN deposition to a 20 % emission reduction in the 2010s and 2060s under different emission scenarios over NC and SC and the whole of mainland China.
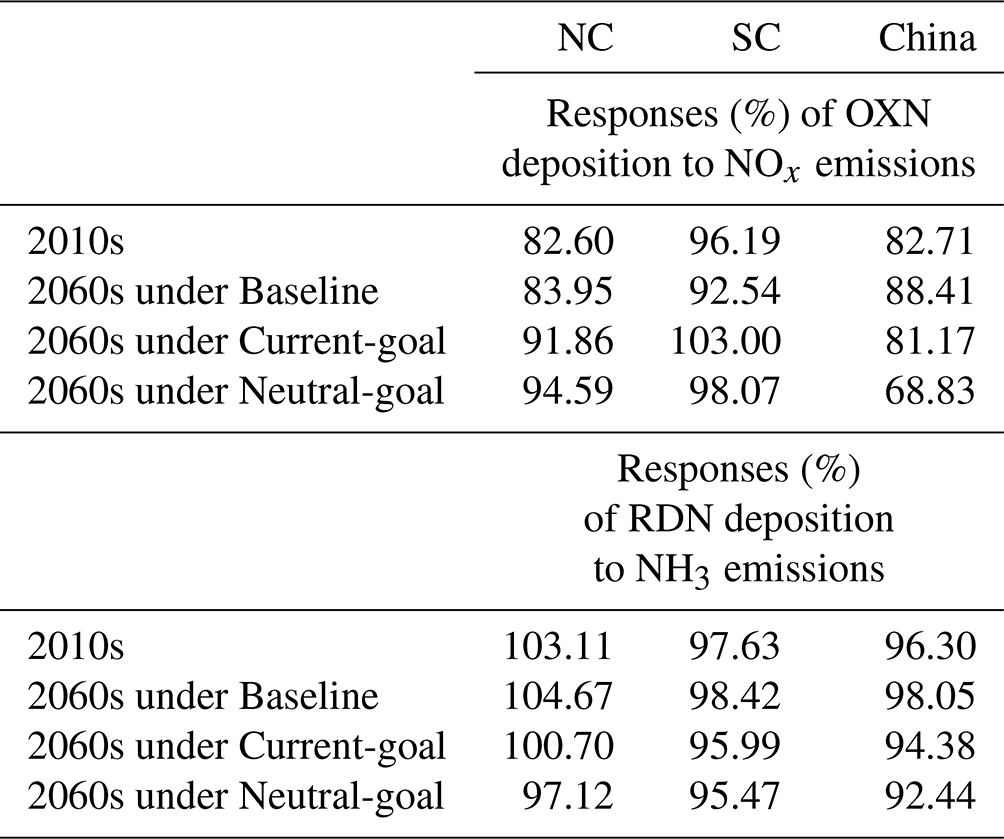
Similar to the 2010s, the response of OXN deposition to a 20 % emission reduction in the 2060s would be 84 % over NC under the Baseline scenario, in which VOC and NOx emissions would remain at high levels (Table 5). A 20 % reduction in emissions would lead to a 17 % decline in near-surface annual mean NO2 concentrations (Fig. S5a) but a 3.2 % growth in O3 concentration in NC (Fig. S5b). In contrast, under the scenarios of Current-goal and Neutral-goal, a 20 % emission reduction would result in 0.82 % and 2.7 % decline in near-surface O3 concentration, respectively (Fig. S5b), indicating a weakening nonlinear mechanism between emission reduction and AOC enhancement with long-term control of air pollution. Meanwhile, the annual mean HNO3 concentrations would decrease by 14 % and 19 % (Fig. S5c), and OXN_DDEP would decrease by 18 % and 19 % (Fig. S5d) in Current-goal and Neutral-goal scenarios, respectively. The reductions would be greater than those for the historical period and the future Baseline scenario (10 % and 11 % for HNO3 concentration and 14 % and 14 % for OXN_DDEP, respectively). Consequently, the response of total OXN deposition to emission controls would reach 92 % and 95 %, respectively. Compared to NC, greater effectiveness of emission abatement on decreasing OXN deposition was found in SC for both 2010s and all the future scenarios in the 2060s. The response was estimated to range 93 %–103.00 % (Table 5), similar to the results of 80 %–120 % in the United States (Tan et al., 2020).
The response of RDN deposition to a 20 % reduction in emissions was estimated at 96 % in the 2010s, clearly larger than that in the United States (60 %–80 %, Tan et al., 2020). The value would decline to 94 % and 92 % for Current-goal and Neutral-goal scenarios in the 2060s, respectively, implying that the national air quality and carbon neutrality policies would enhance the nonlinear response of RDN deposition to precursor emission change, towards current US conditions. As mentioned previously, part of the reason could be the transition to a more NH3-rich condition in the future, resulting from more stringent emission controls of SO2 and NOx than NH3. The proportion of gaseous NH3 (with larger Vd than particulate NH) to total RDN would be enhanced, which would in turn delay the reducing RDN deposition. In addition, our simulations did not account for the bidirectional feedback between atmospheric NH3 and soil. Soil volatilization could weaken the sensitivity of dry deposition of RDN to changing NH3 emissions.
Combining two global SSP-RCP climate change pathways and three Chinese emission control scenarios, we assessed the spatiotemporal evolution of future atmospheric Nr deposition in China, its main driving factors, and the changing response of Nr deposition to precursor emission controls. Under SSP5-8.5, the total Nr deposition would increase from 14.7 in the 2010s to 15.4 kg N ha−1 yr−1 in the 2060s, and the spatial pattern of deposition would largely be modulated by climate change. In contrast, under SSP2-4.5, Nr deposition is predicted to decrease to 9.0 kg N ha−1 yr−1 by the 2060s, strongly driven by emissions changes. Our predictions of future total Nr deposition were generally lower than those from previous global-scale studies, particularly the results of Galloway et al. (2004). They found that Nr deposition flux in most of east Asia would exceed 50 kg N ha−1 yr−1 by 2050 under the old emission scenario of IPCC92a. The results from ACCMIP datasets that relied on RCPs framework are more comparable to our study. Specifically, Lamarque et al. (2013b) reported that the region-averaged Nr deposition in east Asia would reach 6.9–10.2 kg N ha−1 yr−1 by 2100, which is roughly in line with our results (9.0–15.4 kg N ha−1 yr−1) in the 2060s. Such difference arises from the different assumptions on the changing air pollutant emissions in China across studies. By considering China's near-term strict clean air actions and the anticipated long-term emissions controls, the air pollutant emission levels in DPEC (used in this study) are lower than those in any existing CMIP emission scenarios and the earlier IPCC92a scenario (Cheng et al., 2021a). This would result in predictions with lower air pollutant concentrations and deposition. Implementation of stricter clean air and carbon neutrality policies would make RDN become the dominant contributor to future Nr deposition. In the Neutral-goal scenario, in particular, the national average OXN deposition was predicted to decrease to 0.98 kg N ha−1 yr−1 by the 2060s, accounting for only 17 % of the total Nr deposition. Previous studies at the global scale have also indicated the increasing role of RDN deposition in the future, but the growth of RDN share was commonly predicted to be slower, due to insufficient knowledge on China's actions on NOx emission controls. For example, ACCMIP, as reported by Sun et al. (2020), expected that the ratio of RDN to total Nr deposition in Eastern China will increase to only 56 % by the end of the century.
Through experiments with fixed WC emissions, we further revealed that the OXN deposition from WC to EC in the 2060s would increase by 0.30 kg N ha−1 yr−1 (2 %) compared to the 2010s under Baseline but decline by 0.28 kg N ha−1 yr−1 (6 %) and 0.51 kg N ha−1 yr−1 (27 %) under the Current-goal and Neutral-goal scenarios, respectively. Similarly, the outflow OXN fluxes from EC in the 2060s would decline 94.45 kg N s−1 (49 %) and 172.86 kg N s−1 (89 %) in the latter two scenarios in the 2060s, respectively. The response of OXN deposition to a 20 % abatement of emissions in NC was estimated at 84 % under the Baseline scenario, while it would approach 100 % in the Current-goal and Neutral-goal scenarios with the declining share of gaseous HNO3 in OXN due to weakened AOC. In contrast, the response of RDN deposition to a 20 % abatement of emissions would decline in the latter two scenarios, attributed partly to a more NH3-rich condition and thereby a growing share of gaseous NH3 in the 2060s.
Our study suggests that future rigorous implementation of clean air and carbon neutrality policies can mitigate the adverse effects of climate change on Nr deposition and weaken the transport of air pollution to the western Pacific. It highlights the potential changes in the source–sink relationship for China and supports scientific analyses on sources and mitigation of Nr pollution, not only for China but also for downwind areas. More attention needs to be paid to NH3 emission controls due to its increasing importance on Nr deposition. The sharp decline in future Nr deposition driven by profound emission abatement may substantially reduce the ecological damage like acidification and eutrophication. Meanwhile, it might potentially weaken the carbon sink capacity of terrestrial ecosystems. A comprehensive consideration of the balance between Nr control and terrestrial carbon sinks is essential for the future.
Our findings are subject to some limitations. Firstly, given the computationally intensive of numerical simulation, the Nr deposition was simulated with a single model (CMAQ) in this work. As suggested by the MICS-Asia III project, there existed clear difference in Nr deposition simulation among multiple CTMs, and in particular the consistency of dry deposition of OXN was relatively poor, with the coefficient of variation (CV) ranging 0.4–0.5 throughout most of China (Ge et al., 2020). A multi-model ensemble methodology is thus recommended in future work to reduce the bias of single-model simulation. Secondly, the role of climate change in future Nr deposition might be underestimated. Climate-driven effects on emissions were not considered in this study, such as the increase in NH3 volatilization due to global warming (Ren et al., 2023). In addition, we mainly addressed the future evolution of Nr deposition under the mean state of climate but neglected the potential impact of extreme climatic events. For example, the changing frequency of heavy precipitation has been reported as a key factor influencing the variation of Nr deposition (Chen et al., 2023; Ummenhofer and Meehl, 2017). Therefore, more analyses should be conducted on the connection between the changing extreme climate events and atmospheric deposition.
The source code of the CMAQ model version 5.2 was obtained from the United States Environmental Protection Agency (https://doi.org/10.5281/zenodo.1167892, USEPA, 2017). The source code of the WRF model version 3.9.1 was obtained from the National Center for Atmospheric Research and the National Oceanic and Atmospheric Administration (https://github.com/wrf-model/WRF/releases?page=3, NCAR and NOAA, 2017). The Multi-resolution Emission Inventory for China version 1.3 (MEICv1.3) was obtained from http://meicmodel.org.cn/?page_id=560 (Tsinghua University, 2021a). The Dynamic Projection model for Emissions in China version 1.1 (DPECv1.1) was obtained from http://meicmodel.org.cn/?page_id=1917 (Tsinghua University, 2021b). The Asian anthropogenic emission inventory (MIX) was obtained from http://meicmodel.org.cn/?page_id=1770 (Tsinghua University, 2021c). The ERA5 reanalyses were obtained from https://cds.climate.copernicus.eu/cdsapp#!/dataset/reanalysis-era5-single-levels?tab=form (ECMWF, 2018). The global bias-corrected multi-model (BCMM) climatological dataset was retrieved from the China National Science Data Bank (https://www.scidb.cn/en/detail?dataSetId=791587189614968832#p2, CNSDB, 2021). The observed meteorological data were obtained from the National Meteorological Information Center of the China Meteorological Administration (http://data.cma.cn/data/detail/dataCode/A.0012.0001.html, CMA, 2023).
The supplement related to this article is available online at https://doi.org/10.5194/acp-25-2147-2025-supplement.
MM developed the strategy and methodology of the work and wrote the draft. YZ improved the methodology and revised the manuscript. JC provided useful comments on the paper. BZ provided the historical emission inventory. DT provided the future emission inventory.
The contact author has declared that none of the authors has any competing interests.
Publisher’s note: Copernicus Publications remains neutral with regard to jurisdictional claims made in the text, published maps, institutional affiliations, or any other geographical representation in this paper. While Copernicus Publicationsx makes every effort to include appropriate place names, the final responsibility lies with the authors. Regarding the maps used in this paper, please note that Figs. 1–5 and 7 contain disputed territories.
This work was sponsored by the National Key Research and Development Program of China (2023YFC3709802) and the National Natural Science Foundation of China (42177080). We are grateful to the High Performance Computing Center (HPCC) of Nanjing University for numerical simulation. We also thank the European Centre for Medium-Range Weather Forecasts (ECMWF) for the free download of meteorological reanalysis data (ERA5) and Zhongfeng Xu from the Institute of Atmospheric Physics, Chinese Academy of Sciences, for providing free access to the BCMM dataset.
This research has been supported by the National Key Research and Development Program of China (grant no. 2023YFC3709802) and the National Natural Science Foundation of China (grant no. 42177080).
This paper was edited by Amos Tai and reviewed by two anonymous referees.
Alexandrov, G. A., Ginzburg, V. A., Insarov, G. E., and Romanovskaya, A. A.: CMIP6 model projections leave no room for permafrost to persist in Western Siberia under the SSP5-8.5 scenario, Clim. Change, 169, 42, https://doi.org/10.1007/s10584-021-03292-w, 2021.
Benish, S. E., Bash, J. O., Foley, K. M., Appel, K. W., Hogrefe, C., Gilliam, R., and Pouliot, G.: Long-term regional trends of nitrogen and sulfur deposition in the United States from 2002 to 2017, Atmos. Chem. Phys., 22, 12749–12767, https://doi.org/10.5194/acp-22-12749-2022, 2022.
Bey, I., Jacob, D. J., Yantosca, R. M., Logan, J. A., Field, B. D., Fiore, A. M., Li, Q., Liu, H. Y., Mickley, L. J., and Schultz, M. G.: Global modeling of tropospheric chemistry with assimilated meteorology: Model description and evaluation, J. Geophys. Res.-Atmos., 106, 23073–23095, https://doi.org/10.1029/2001JD000807, 2001.
Carvalho, D., Rocha, A., Gómez-Gesteira, M., and Santos, C.: A sensitivity study of the WRF model in wind simulation for an area of high wind energy, Environ. Modell. Softw., 33, 23–34, https://doi.org/10.1016/j.envsoft.2012.01.019, 2012.
Chang, J. S., Brost, R. A., Isaksen, I. S. A., Madronich, S., Middleton, P., Stockwell, W. R., and Walcek, C. J.: A three-dimensional Eulerian acid deposition model: Physical concepts and formulation, J. Geophys. Res.-Atmos., 92, 14681–14700, https://doi.org/10.1029/JD092iD12p14681, 1987.
Chang, M., Cao, J., Ma, M., Liu, Y., Liu, Y., Chen, W., Fan, Q., Liao, W., Jia, S., and Wang, X.: Dry deposition of reactive nitrogen to different ecosystems across eastern China: A comparison of three community models, Sci. Total Environ., 720, 137548, https://doi.org/10.1016/j.scitotenv.2020.137548, 2020.
Chang, Y., Huang, R. J., Ge, X., Huang, X., Hu, J., Duan, Y., Zou, Z., Liu, X., and Lehmann, M. F.: Puzzling haze events in China during the coronavirus (COVID-19) shutdown, Geophys. Res. Lett., 47, e2020GL088533, https://doi.org/10.1029/2020GL088533, 2020.
Chen, C., Xiao, W., and Chen, H. Y.: Mapping global soil acidification under N deposition, Glob. Change Biol., 29, 4652–4661, https://doi.org/10.1111/gcb.16813, 2023.
Chen, Y., Zhang, L., Henze, D. K., Zhao, Y., Lu, X., Winiwarter, W., Guo, Y., Liu, X., Wen, Z., and Song, Y.: Interannual variation of reactive nitrogen emissions and their impacts on PM2.5 air pollution in China during 2005–2015, Environ. Res. Lett., 16, 125004, https://doi.org/10.1088/1748-9326/ac3695, 2021.
Cheng, F. Y., Feng, C. Y., Yang, Z. M., Hsu, C. H., Chan, K. W., Lee, C. Y., and Chang, S. C.: Evaluation of real-time PM2.5 forecasts with the WRF-CMAQ modeling system and weather-pattern-dependent bias-adjusted PM2.5 forecasts in Taiwan, Atmos. Environ., 244, 117909, https://doi.org/10.1016/j.atmosenv.2020.117909, 2021.
Cheng, J., Tong, D., Liu, Y., Yu, S., Yan, L., Zheng, B., Geng, G., He, K., and Zhang, Q.: Comparison of current and future PM2.5 air quality in China under CMIP6 and DPEC emission scenarios, Geophys. Res. Lett., 48, e2021GL093197, https://doi.org/10.1029/2021GL093197, 2021a.
Cheng, J., Tong, D., Zhang, Q., Liu, Y., Lei, Y., Yan, G., Yan, L., Yu, S., Cui, R. Y., Clarke, L., Geng, G, N., Zheng, B., Zhang, X, Y., Davis, J. S., and He, K. B.: Pathways of China's PM2.5 air quality 2015–2060 in the context of carbon neutrality, Natl. Sci. Rev., 8, nwab078, https://doi.org/10.1093/nsr/nwab078, 2021b.
Cheng, J., Tong, D., Liu, Y., Geng, G., Davis, S. J., He, K., and Zhang, Q.: A synergistic approach to air pollution control and carbon neutrality in China can avoid millions of premature deaths annually by 2060, One Earth, 6, 978–989, https://doi.org/10.1016/j.oneear.2023.07.007, 2023.
Chen, W., Jia, S., Wang, X., Shao, M., Liao, W., Guenther, A., Flechard, C., Yu, P., Zhong, B., Chang, M., Wang, W., Mao, J., Liu, X., Yu, G., and Carmichael, G.: Precipitation trend increases the contribution of dry reduced nitrogen deposition, Clim. Atmos. Sci., 6, 62, https://doi.org/10.1038/s41612-023-00390-7, 2023.
CMA: Basic ground meteorological observation data, Meteorological Data Centre [data set], http://data.cma.cn/data/detail/dataCode/A.0012.0001.html (last access: 6 February 2024), 2023 (in Chinese).
CNSDB: The global bias-corrected multi-model (BCMM) climatological dataset, Science Data Bank [data set], https://www.scidb.cn/en/detail?dataSetId=791587189614968832#p2 (last access: 7 May 2023), 2021 (in Chinese).
Cook, B. I., Mankin, J. S., Marvel, K., Williams, A. P., Smerdon, J. E., and Anchukaitis, K. J.: Twenty-first century drought projections in the CMIP6 forcing scenarios, Earth Future, 8, e2019EF001461, https://doi.org/10.1029/2019EF001461, 2020.
De Meij, A. and Vinuesa, J. F.: Impact of SRTM and Corine Land Cover data on meteorological parameters using WRF, Atmos. Res., 143, 351–370, https://doi.org/10.1016/j.atmosres.2014.03.004, 2014.
Dong, L., Miao, G., and Wen, W.: China's carbon neutrality policy: Objectives, impacts and paths, East Asian Policy, 13, 5–18, https://doi.org/10.1142/S1793930521000015, 2021.
ECMWF: The ERA5 reanalyses, ECMWF [data set], https://cds.climate.copernicus.eu/cdsapp#!/dataset/reanalysis-era5-single-levels?tab=form (last access: 20 April 2023), 2018.
Ellis, R. A., Jacob, D. J., Sulprizio, M. P., Zhang, L., Holmes, C. D., Schichtel, B. A., Blett, T., Porter, E., Pardo, L. H., and Lynch, J. A.: Present and future nitrogen deposition to national parks in the United States: critical load exceedances, Atmos. Chem. Phys., 13, 9083–9095, https://doi.org/10.5194/acp-13-9083-2013, 2013.
Fahey, K. M., Carlton, A. G., Pye, H. O. T., Baek, J., Hutzell, W. T., Stanier, C. O., Baker, K. R., Appel, K. W., Jaoui, M., and Offenberg, J. H.: A framework for expanding aqueous chemistry in the Community Multiscale Air Quality (CMAQ) model version 5.1, Geosci. Model Dev., 10, 1587–1605, https://doi.org/10.5194/gmd-10-1587-2017, 2017.
Fowler, D., Coyle, M., Skiba, U., Sutton, M. A., Cape, J. N., Reis, S., Sheppard, L. J., Jenkins, A., Grizzetti, B., Galloway, J. N. Vitousek, P., Leach, A., Bouwman, A. F., Butterbach-Bahl, K., Dentener, F., Stevenson, D., Amann, M., and Voss, M.: The global nitrogen cycle in the twenty-first century, Philos. Trans. R. Soc. B, 368, 20130164, https://doi.org/10.1098/rstb.2013.0164, 2013.
Galloway, J. N., Dentener, F. J., Capone, D. G., Boyer, E. W., Howarth, R. W., Seitzinger, S. P., Asner, G. P., Cleveland, C. C., Green, P. A., Holland, E. A., Karl, D. M., Michaels, A. F., Porter, J. H., Townsend, A. R., and Vöosmarty, C. J.: Nitrogen cycles: past, present, and future, Biogeochemistry, 70, 153–226, https://doi.org/10.1007/s10533-004-0370-0, 2004.
Galmarini, S., Koffi, B., Solazzo, E., Keating, T., Hogrefe, C., Schulz, M., Benedictow, A., Griesfeller, J. J., Janssens-Maenhout, G., Carmichael, G., Fu, J., and Dentener, F.: Technical note: Coordination and harmonization of the multi-scale, multi-model activities HTAP2, AQMEII3, and MICS-Asia3: simulations, emission inventories, boundary conditions, and model output formats, Atmos. Chem. Phys., 17, 1543–1555, https://doi.org/10.5194/acp-17-1543-2017, 2017.
Gao, Q., Zhang, X., Liu, L., Lu, X., and Wang, Y.: A database of atmospheric inorganic nitrogen deposition fluxes in China from satellite monitoring, Sci. Data, 10, 698, https://doi.org/10.1038/s41597-023-02607-z, 2023.
Ge, B., Itahashi, S., Sato, K., Xu, D., Wang, J., Fan, F., Tan, Q., Fu, J. S., Wang, X., Yamaji, K., Nagashima, T., Li, J., Kajino, M., Liao, H., Zhang, M., Wang, Z., Li, M., Woo, J.-H., Kurokawa, J., Pan, Y., Wu, Q., Liu, X., and Wang, Z.: Model Inter-Comparison Study for Asia (MICS-Asia) phase III: multimodel comparison of reactive nitrogen deposition over China, Atmos. Chem. Phys., 20, 10587–10610, https://doi.org/10.5194/acp-20-10587-2020, 2020.
Gu, B., Ge, Y., Ren, Y., Xu, B., Luo, W., Jiang, H, Gu, B., and Chang, J.: Atmospheric reactive nitrogen in China: sources, recent trends, and damage costs, Environ. Sci. Technol., 46, 9420–9427, https://doi.org/10.1021/es301446g, 2012.
Guenther, A. B., Jiang, X., Heald, C. L., Sakulyanontvittaya, T., Duhl, T., Emmons, L. K., and Wang, X.: The Model of Emissions of Gases and Aerosols from Nature version 2.1 (MEGAN2.1): an extended and updated framework for modeling biogenic emissions, Geosci. Model Dev., 5, 1471–1492, https://doi.org/10.5194/gmd-5-1471-2012, 2012.
Han, X., Zhang, M., Skorokhod, A., and Kou, X.: Modeling dry deposition of reactive nitrogen in China with RAMS-CMAQ, Atmos. Environ., 166, 47–61, https://doi.org/10.1016/j.atmosenv.2017.07.015, 2017.
Hertel, O., Skjøth, C. A., Løfstrøm, P., Geels, C., Frohn, L. M., Ellermann, T., and Madsen, P. V.: Modelling Nitrogen Deposition on a Local Scale – A Review of the Current State of the Art, Environ. Chem., 3, 317, https://doi.org/10.1071/EN06038, 2006.
Hersbach, H., Bell, B., Berrisford, P., Hirahara, S., Horányi, A., Muñoz-Sabater, J., Nicolas, J., Peubey, C., Radu, R., Schepers, D., Simmons, A., Soci, C., Abdalla, S., Abellan, X., Balsamo, G., Bechtold, P., Biavati, G., Bidlot, J., Bonavita, M., De Chiara, G., Dahlgren, P., Dee, D., Diamantakis, M., Dragani, R., Flemming, J., Forbes, R., Fuentes, M., Geer, A., Haimberger, L., Healy, S., Hogan, R. J., Hólm, E., Janisková, M., Keeley, S., Laloyaux, P., Lopez, P., Lupu, C., Radnoti, G., de Rosnay, P., Rozum, I., Vamborg, F., Villaume, S., and Thépaut, J. N.: The ERA5 global reanalysis, Q. J. Roy. Meteorol. Soc., 146, 1999–2049, https://doi.org/10.1002/qj.3803, 2020.
Huang, X., Swain, D. L., and Hall, A. D.: Future precipitation increase from very high resolution ensemble downscaling of extreme atmospheric river storms in California, Sci. Adv., 6, eaba1323, https://doi.org/10.1126/sciadv.aba1323, 2020.
Masson-Delmotte, V., Zhai, P., Pirani, A., Connors, S. L., Péan, C., Berger, S., Caud, N., Chen, Y., Goldfarb, L., Gomis, M. I., Huang, M., Leitzell, K., Lonnoy, E., Matthews, J. B. R., Maycock, T. K., Waterfield, T., Yelekçi, O., Yu, R., and Zhou, B.: Climate Change 2021: The Physical Science Basis. Contribution of Working Group I to the Sixth Assessment Report of the Intergovernmental Panel on Climate Change, Cambridge University Press, UK, https://doi.org/10.1017/9781009157896, 2021.
Kanakidou, M., Myriokefalitakis, S., Daskalakis, N., Fanourgakis, G., Nenes, A., Baker, A. R., Tsigaridis, K., and Mihalopoulos, N.: Past, Present, and Future Atmospheric Nitrogen Deposition, J. Atmos. Sci., 73, 2039–2047, https://doi.org/10.1175/JAS-D-15-0278.1, 2016.
Kawase, H., Hara, M., Yoshikane, T., Ishizaki, N. N., Uno, F., Hatsushika, H., and Kimura, F.: Altitude dependency of future snow cover changes over Central Japan evaluated by a regional climate model, J. Geophys. Res.-Atmos., 118, 12444–12457, https://doi.org/10.1002/2013JD020429, 2013.
Kang, Y., Liu, M., Song, Y., Huang, X., Yao, H., Cai, X., Zhang, H., Kang, L., Liu, X., Yan, X., He, H., Zhang, Q., Shao, M., and Zhu, T.: High-resolution ammonia emissions inventories in China from 1980 to 2012, Atmos. Chem. Phys., 16, 2043–2058, https://doi.org/10.5194/acp-16-2043-2016, 2016.
Kim, J. E., Han, Y. J., Kim, P. R., and Holsen, T. M.: Factors influencing atmospheric wet deposition of trace elements in rural Korea, Atmos. Res., 116, 185–194, https://doi.org/10.1016/j.atmosres.2012.04.013, 2012.
Koetse, M. J. and Rietveld, P.: The impact of climate change and weather on transport: An overview of empirical findings, Transport. Res. Part D, 14, 205–221, https://doi.org/10.1016/j.trd.2008.12.004, 2009.
Lamarque, J.-F., Shindell, D. T., Josse, B., Young, P. J., Cionni, I., Eyring, V., Bergmann, D., Cameron-Smith, P., Collins, W. J., Doherty, R., Dalsoren, S., Faluvegi, G., Folberth, G., Ghan, S. J., Horowitz, L. W., Lee, Y. H., MacKenzie, I. A., Nagashima, T., Naik, V., Plummer, D., Righi, M., Rumbold, S. T., Schulz, M., Skeie, R. B., Stevenson, D. S., Strode, S., Sudo, K., Szopa, S., Voulgarakis, A., and Zeng, G.: The Atmospheric Chemistry and Climate Model Intercomparison Project (ACCMIP): overview and description of models, simulations and climate diagnostics, Geosci. Model Dev., 6, 179–206, https://doi.org/10.5194/gmd-6-179-2013, 2013a.
Lamarque, J.-F., Dentener, F., McConnell, J., Ro, C.-U., Shaw, M., Vet, R., Bergmann, D., Cameron-Smith, P., Dalsoren, S., Doherty, R., Faluvegi, G., Ghan, S. J., Josse, B., Lee, Y. H., MacKenzie, I. A., Plummer, D., Shindell, D. T., Skeie, R. B., Stevenson, D. S., Strode, S., Zeng, G., Curran, M., Dahl-Jensen, D., Das, S., Fritzsche, D., and Nolan, M.: Multi-model mean nitrogen and sulfur deposition from the Atmospheric Chemistry and Climate Model Intercomparison Project (ACCMIP): evaluation of historical and projected future changes, Atmos. Chem. Phys., 13, 7997–8018, https://doi.org/10.5194/acp-13-7997-2013, 2013b.
Lauer, A., Zhang, C., Elison-Timm, O., Wang, Y., and Hamilton, K.: Downscaling of climate change in the Hawaii region using CMIP5 results: On the choice of the forcing fields, J. Climate, 26, 10006–10030, https://doi.org/10.1175/JCLI-D-13-00126.1, 2013.
Li, M., Liu, H., Geng, G., Hong, C., Liu, F., Song, Y., Tong, D., Zheng, B., Cui, H., Man, H., Zhang, Q., and He, K.: Anthropogenic emission inventories in China: a review, Natl. Sci. Rev., 4, 834–866, https://doi.org/10.1093/nsr/nwx150, 2017a.
Li, M., Zhang, Q., Kurokawa, J.-I., Woo, J.-H., He, K., Lu, Z., Ohara, T., Song, Y., Streets, D. G., Carmichael, G. R., Cheng, Y., Hong, C., Huo, H., Jiang, X., Kang, S., Liu, F., Su, H., and Zheng, B.: MIX: a mosaic Asian anthropogenic emission inventory under the international collaboration framework of the MICS-Asia and HTAP, Atmos. Chem. Phys., 17, 935–963, https://doi.org/10.5194/acp-17-935-2017, 2017b.
Liao, J., Wang, T., Jiang, Z., Zhuang, B., Xie, M., Yin, C., Wang, X., Zhu, J., Fu, Y., and Zhang, Y.: WRF/Chem modeling of the impacts of urban expansion on regional climate and air pollutants in Yangtze River Delta, China, Atmos. Environ., 106, 204–214, https://doi.org/10.1016/j.atmosenv.2015.01.059, 2015.
Liu, L., Zhang, X., Xu, W., Liu, X., Zhang, Y., Li, Y., Wei, J., Lu, X., Wang, S., Zhang, W., Zhao, L., Wang, Z., and Wu, X.: Fall of oxidized while rise of reduced reactive nitrogen deposition in China, J. Clean Prod., 272, 122875, https://doi.org/10.1016/j.jclepro.2020.122875, 2020.
Liu, L., Wen, Z., Liu, S., Zhang, X., and Liu, X.: Decline in atmospheric nitrogen deposition in China between 2010 and 2020, Nat. Geosci. 17, 733–736, https://doi.org/10.1038/s41561-024-01484-4, 2024.
Liu, M., Huang, X., Song, Y., Xu, T., Wang, S., Wu, Z., Hu, M., Zhang, L., Zhang, Q., Pan, Y., Liu, X., and Zhu, T.: Rapid SO2 emission reductions significantly increase tropospheric ammonia concentrations over the North China Plain, Atmos. Chem. Phys., 18, 17933–17943, https://doi.org/10.5194/acp-18-17933-2018, 2018.
Liu, M., Shang, F., Lu, X., Huang, X., Song, Y., Liu, B., Zhang, Q., Liu X., Cao, J., Xu, T., Wang T., Xu, Z., Xu, W., Liao W., Kang L., Cai, X., Zhang, H, Dai, Y., and Liu, X.: Unexpected response of nitrogen deposition to nitrogen oxide controls and implications for land carbon sink, Nat. Commun., 13, 3126, https://doi.org/10.1038/s41467-022-30854-y, 2022.
Liu, S., Xing, J., Wang, S., Ding, D., Cui, Y., and Hao, J.: Health benefits of emission reduction under 1.5 °C pathways far outweigh climate-related variations in China, Environ. Sci. Technol., 55, 10957–10966, https://doi.org/10.1021/acs.est.1c01583, 2021.
Liu, X. and Du, E. (Eds.): An overview of atmospheric reactive nitrogen in China from a global perspective, Springer, Singapore, https://doi.org/10.1007/978-981-13-8514-8_1, 2020.
Liu, X., Zhang, Y., Han, W., Tang, A., Shen, J., Cui, Z., Vitousek, P., Erisman, J. W., Goulding, K., Christie, P., Fangmeier, A., and Zhang, F.: Enhanced nitrogen deposition over China, Nature, 494, 459–462, https://doi.org/10.1038/nature11917, 2013.
Liu, X., Xu, W., Duan, L., Du, E., Pan, Y., Lu, X., Zhang, L., Wu, Z., Wang, X., Zhang, Y., Shen, J., Song, L., Feng, Z., Liu, X., Song, W., Tang, A., Zhang, Y., Zhang, X., and Collett, J. L.: Atmospheric nitrogen emission, deposition, and air quality impacts in China: an overview, Curr. Pollut. Rep., 3, 65–77, https://doi.org/10.1007/s40726-017-0053-9, 2017.
Liu, X. H., Zhang, Y., Cheng, S. H, Xing, J., Zhang, Q., Streets, D. G., Yang, C., Wang, W. X., and Hao, J. M.: Understanding of regional air pollution over China using CMAQ, part I performance evaluation and seasonal variation, Atmos. Environ., 44, 2415–2426, https://doi.org/10.1016/j.atmosenv.2010.03.035, 2010.
Liu, Y. and Wang, T.: Worsening urban ozone pollution in China from 2013 to 2017 – Part 1: The complex and varying roles of meteorology, Atmos. Chem. Phys., 20, 6305–6321, https://doi.org/10.5194/acp-20-6305-2020, 2020.
Ma, M., Zheng, B., Xu, W., Cao, J., Zhou, K., and Zhao, Y.: Trend and Interannual Variations of Reactive Nitrogen Deposition in China During 2008–2017 and the Roles of Anthropogenic Emissions and Meteorological Conditions, J. Geophys. Res.-Atmos., 128, e2022JD037489, https://doi.org/10.1029/2022JD037489, 2023.
McDonald, B., De Gouw, J., Gilman, J., Jathar, S., Akherati, A., Cappa, C., Jinenez, J., Le-Taylor, J., Hayes, P., Mckeen, S., Cui, Y., Kim, S., Gentner, D., Isaacman-Vanwertz, G., Goldstein, A., Harley, R., Frost, G., Roberts, J., Ryerson, T., and Trainer, M.: Volatile chemical products emerging as largest petrochemical source of urban organic emissions, Science, 359, 760–764, https://doi.org/10.1126/science.aaq0524, 2018.
Meinshausen, M., Nicholls, Z. R. J., Lewis, J., Gidden, M. J., Vogel, E., Freund, M., Beyerle, U., Gessner, C., Nauels, A., Bauer, N., Canadell, J. G., Daniel, J. S., John, A., Krummel, P. B., Luderer, G., Meinshausen, N., Montzka, S. A., Rayner, P. J., Reimann, S., Smith, S. J., van den Berg, M., Velders, G. J. M., Vollmer, M. K., and Wang, R. H. J.: The shared socio-economic pathway (SSP) greenhouse gas concentrations and their extensions to 2500, Geosci. Model Dev., 13, 3571–3605, https://doi.org/10.5194/gmd-13-3571-2020, 2020.
Murphy, B. N., Woody, M. C., Jimenez, J. L., Carlton, A. M. G., Hayes, P. L., Liu, S., Ng, N. L., Russell, L. M., Setyan, A., Xu, L., Young, J., Zaveri, R. A., Zhang, Q., and Pye, H. O. T.: Semivolatile POA and parameterized total combustion SOA in CMAQv5.2: impacts on source strength and partitioning, Atmos. Chem. Phys., 17, 11107–11133, https://doi.org/10.5194/acp-17-11107-2017, 2017.
NCAR and NOAA: The source code of WRF version 3.9.1, Github [code], https://github.com/wrf-model/WRF/releases?page=3 (last access: 24 February 2023), 2017.
O'Neill, B. C., Carter, T. R., Ebi, K., Harrison, P. A., Kemp-Benedict, E., Kok, K., Kriegler, E., Preston, B. L., Riahi, K., Sillmann, J., van Ruijven, B. J., van Vuuren, D., Carlisle, D., Conde, C., Fuglestvedt, J., Green, C., Hasegawa, T., Leininger, J., Monteith, S., and Pichs-Madruga, R.: Achievements and needs for the climate change scenario framework, Nat. Clim. Chang., 10, 1074–1084, https://doi.org/10.1038/s41558-020-00952-0, 2020.
O'Neill, B. C., Tebaldi, C., van Vuuren, D. P., Eyring, V., Friedlingstein, P., Hurtt, G., Knutti, R., Kriegler, E., Lamarque, J.-F., Lowe, J., Meehl, G. A., Moss, R., Riahi, K., and Sanderson, B. M.: The Scenario Model Intercomparison Project (ScenarioMIP) for CMIP6, Geosci. Model Dev., 9, 3461–3482, https://doi.org/10.5194/gmd-9-3461-2016, 2016.
Pineda, N., Jorba, O., Jorge, J., and Baldasano, J. M.: Using NOAA AVHRR and SPOT VGT data to estimate surface parameters: application to a mesoscale meteorological model, Int. J. Remote Sens., 25, 129–143, https://doi.org/10.1080/0143116031000115201, 2004.
Pye, H. O. T., Murphy, B. N., Xu, L., Ng, N. L., Carlton, A. G., Guo, H., Weber, R., Vasilakos, P., Appel, K. W., Budisulistiorini, S. H., Surratt, J. D., Nenes, A., Hu, W., Jimenez, J. L., Isaacman-VanWertz, G., Misztal, P. K., and Goldstein, A. H.: On the implications of aerosol liquid water and phase separation for organic aerosol mass, Atmos. Chem. Phys., 17, 343–369, https://doi.org/10.5194/acp-17-343-2017, 2017.
Raza, S., Miao, N., Wang, P., Ju, X., Chen, Z., Zhou, J., and Kuzyakov, Y.: Dramatic loss of inorganic carbon by nitrogen-induced soil acidification in Chinese croplands, Glob. Change Biol., 26, 3738–3751, https://doi.org/10.1111/gcb.15101, 2020.
Sahu, S. K., Gelfand, A. E., and Holland, D. M.: Fusing point and areal level space–time data with application to wet deposition, J. R. Stat. Soc. Ser. C-Appl. Stat., 59, 77–103, https://doi.org/10.1111/j.1467-9876.2009.00685.x, 2010.
Sarwar, G., Luecken, D. J., Yarwood, G., Whitten, G. D., and Carter, W. P.: Impact of an updated carbon bond mechanism on predictions from the CMAQ modeling system: preliminary assessment, J. Appl. Meteorol. Climatol., 47, 3–14, https://doi.org/10.1175/2007JAMC1393.1, 2008.
Shen, A., Liu, Y., Lu, X., Xu, Y., Jin, Y., Wang, H., Zhang, J., Wang, X., Chang, M., and Fan, Q.: Modeling regional nitrogen cycle in the atmosphere: Present situation and its response to the future emissions control strategy, Sci. Total Environ., 891, 164379, https://doi.org/10.1016/j.scitotenv.2023.164379, 2023.
Shen, Y., Jiang, F., Feng, S., Zheng, Y., Cai, Z., and Lyu, X.: Impact of weather and emission changes on NO2 concentrations in China during 2014–2019, Environ. Pollut., 269, 116163, https://doi.org/10.1016/j.envpol.2020.116163, 2021.
Shi, X., Zheng, Y., Lei, Y., Xue, W., Yan, G., Liu, X., Cai, B., Tong, D., and Wang, J.: Air quality benefits of achieving carbon neutrality in China, Sci. Total Environ., 795, 148784, https://doi.org/10.1016/j.scitotenv.2021.148784, 2021.
Skamarock, W. C. and Klemp. J. B.: A time-split nonhydrostatic atmospheric model for weather research and forecasting applications, J. Comput. Phys., 227, 3465–3485, https://doi.org/10.1016/j.jcp.2007.01.037, 2008a.
Skamarock, W. C., Klemp, J. B., Dudhia, J., Gill, D. O., Barker, D., Duda, M. G., Huang, X. Y., Wang, W., and Powers, J. G.: A Description of the Advanced Research WRF Version 3, National Center for Atmospheric Research NCAR/TN–475+STR, https://doi.org/10.5065/D68S4MVH, 2008b.
Su, B., Huang, J., Mondal, S. K., Zhai, J., Wang, Y., Wen, S., Gao, M., Lv, Y., Jiang, S., Jiang, T., and Li, A.: Insight from CMIP6 SSP-RCP scenarios for future drought characteristics in China, Atmos. Res., 250, 105375, https://doi.org/10.1016/j.atmosres.2020.105375, 2021.
Sun, K., Gao, Y., Guo, X., Zhang, J., Zeng, X., Ma, M., Chen, Y., Luo, K., Yao, X., and Gao, H.: The enhanced role of atmospheric reduced nitrogen deposition in future over East Asia–Northwest Pacific, Sci. Total Environ., 833, 155146, https://doi.org/10.1016/j.scitotenv.2022.155146, 2022.
Tan, J., Fu, J. S., and Seinfeld, J. H.: Ammonia emission abatement does not fully control reduced forms of nitrogen deposition, P. Natl. Acad. Sci. USA, 117, 9771–9775, https://doi.org/10.1073/pnas.1920068117, 2020.
Taniguchi, K. and Tajima, Y.: Variations in extreme wave events near a South Pacific Island under global warming: case study of Tropical Cyclone Tomas, Prog. Earth Planet. Sci., 7, 1–16, https://doi.org/10.1186/s40645-020-0321-y, 2020.
Tong, D., Cheng, J., Liu, Y., Yu, S., Yan, L., Hong, C., Qin, Y., Zhao, H., Zheng, Y., Geng, G., Li, M., Liu, F., Zhang, Y., Zheng, B., Clarke, L., and Zhang, Q.: Dynamic projection of anthropogenic emissions in China: methodology and 2015–2050 emission pathways under a range of socio-economic, climate policy, and pollution control scenarios, Atmos. Chem. Phys., 20, 5729–5757, https://doi.org/10.5194/acp-20-5729-2020, 2020.
Toyota, K., Dastoor, A. P., and Ryzhkov, A.: Parameterization of gaseous dry deposition in atmospheric chemistry models: Sensitivity to aerodynamic resistance formulations under statically stable conditions, Atmos. Environ., 147, 409–422, https://doi.org/10.1016/j.atmosenv.2016.09.055, 2017.
Tsinghua University: The Multi-resolution Emission Inventory for China version 1.3 (MEICv1.3), Tsinghua University [data set], http://meicmodel.org.cn/?page_id=560 (last access: 10 June 2023), 2021a.
Tsinghua University: The Dynamic Projection model for Emissions in China version 1.1 (DPECv1.1), Tsinghua University [data set], http://meicmodel.org.cn/?page_id=1917 (last access: 12 June 2023), 2021b.
Tsinghua University: The Asian anthropogenic emission inventory (MIX), Tsinghua University [data set], http://meicmodel.org.cn/?page_id=1770 (last access: 11 June 2023), 2021c.
Ummenhofer, C. C. and Meehl, G. A.: Extreme weather and climate events with ecological relevance: a review, Philos. Trans. R. Soc. B-Biol. Sci., 372, 20160135, https://doi.org/10.1098/rstb.2016.0135, 2017.
USEPA: The source code of CMAQ version 5.2, Zenodo [code], https://doi.org/10.5281/zenodo.1167892 (last access: 6 May 2023), 2017.
Van Vuuren, D. P., Edmonds, J., Kainuma, M., Riahi, K., Thomson, A., Hibbard, K., Hurtt. G. C., Kram, T., Krey, V., Lamarque, J. F., Masui, T., Meinshausen, M., Nakicenovoc, N., Smith, S. J., and Rose, S. K.: The representative concentration pathways: an overview, Clim. Change, 109, 5–31, https://doi.org/10.1007/s10584-011-0148-z, 2011.
Vet, R., Artz, R. S., Carou, S., Shaw, M., Ro, C. U., Aas, W., Baker, A., Bowersox, V. C., Dentener, F., Galy-Lacaux, C., Hou, A., Pienaar, J. J., Gillett, R., Forti, M. C., Gromov, S., Hara, H., Khodzher, T., Mahowald, N. M., Nickovic, S., Rao, P. S. P., and Reid, N. W.: A global assessment of precipitation chemistry and deposition of sulfur, nitrogen, sea salt, base cations, organic acids, acidity and pH, and phosphorus, Atmos. Environ., 93, 3–100, https://doi.org/10.1016/j.atmosenv.2013.10.060, 2014.
Venkatram, A. and Pleim, J.: The electrical analogy does not apply to modeling dry deposition of particles, Atmos. Environ., 33, 3075–3076, https://doi.org/10.1016/S1352-2310(99)00094-1, 1999.
Wang, X., Tolksdorf, V., Otto, M., and Scherer, D.: WRF-based dynamical downscaling of ERA5 reanalysis data for High Mountain Asia: Towards a new version of the High Asia Refined analysis, Int. J. Climatol., 41, 743–762, https://doi.org/10.1002/joc.6686, 2021.
Wen, Z., Ma, X., Xu, W., Si, R., Liu, L., Ma, M., Zhao, Y., Tang, A., Zhang, Y., Wang, K., Zhang, Y., Shen, J., Zhang, L., Zhao, Y., Zhang, F., Goulding, K., and Liu, X.: Combined short-term and long-term emission controls improve air quality sustainably in China, Nat. Commun., 15, 5169, https://doi.org/10.1038/s41467-024-49539-9, 2024.
Wen, Z., Xu, W., Li, Q., Han, M., Tang, A., Zhang, Y., Luo, X., Shen, J., Wang, W., Li, K., Pan, Y., Zhang, L., Li, W., Collett Jr, J. L., Zhong, B., Wang, X., Goulding, K., Zhang, F., and Liu, X.: Changes of nitrogen deposition in China from 1980 to 2018, Environ. Int., 144, 106022, https://doi.org/10.1016/j.envint.2020.106022, 2020.
Wesely, M. L.: Parameterization of surface resistances to gaseous dry deposition in regional-scale numerical models, Atmos. Environ., 41, 52–63, https://doi.org/10.1016/j.atmosenv.2007.10.058, 2007.
Wu, Z., Schwede, D. B., Vet, R., Walkr, J. T., Shaw, Mike., Staebler, R., and Zhang, L.: Evaluation and Intercomparison of Five North American Dry Deposition Algorithms at a Mixed Forest Site, J. Adv. Model. Earth Syst., 10, 1571–1586, https://doi.org/10.1029/2017MS001231, 2018.
Wyat Appel, K., Napelenok, S., Hogrefe, C., Pouliot, G., Foley, K., Roselle, S., Pleim, J., Bash, J., Pye, H., Heath, N., Murphy, B., and Mathur, R.: Overview and Evaluation of the Community Multiscale Air Quality (CMAQ) Modeling System Version 5.2, in: Air Pollution Modeling and its Application XXV, edited by: Mensink, C. and Kallos, G., Springer Proceedings in Complexity, Springer, 69–73, https://doi.org/10.1007/978-3-319-57645-9_11, 2018.
Xia, W., Wang, Y., Zhang, G. J., and Wang, B.: Light Precipitation rather than Total Precipitation Determines Aerosol Wet Removal, Environ. Sci. Technol., 58, 19222–19230, https://doi.org/10.1021/acs.est.4c07684, 2024.
Xin, X., Wu, T., Zhang, J., Yao, J., and Fang, Y.: Comparison of CMIP6 and CMIP5 simulations of precipitation in China and the East Asian summer monsoon, Int. J. Climatol., 40, 6423–6440, https://doi.org/10.1002/joc.6590, 2020.
Xu, W., Luo, X. S., Pan, Y. P., Zhang, L., Tang, A. H., Shen, J. L., Zhang, Y., Li, K. H., Wu, Q. H., Yang, D. W., Zhang, Y. Y., Xue, J., Li, W. Q., Li, Q. Q., Tang, L., Lu, S. H., Liang, T., Tong, Y. A., Liu, P., Zhang, Q., Xiong, Z. Q., Shi, X. J., Wu, L. H., Shi, W. Q., Tian, K., Zhong, X. H., Shi, K., Tang, Q. Y., Zhang, L. J., Huang, J. L., He, C. E., Kuang, F. H., Zhu, B., Liu, H., Jin, X., Xin, Y. J., Shi, X. K., Du, E. Z., Dore, A. J., Tang, S., Collett Jr., J. L., Goulding, K., Sun, Y. X., Ren, J., Zhang, F. S., and Liu, X. J.: Quantifying atmospheric nitrogen deposition through a nationwide monitoring network across China, Atmos. Chem. Phys., 15, 12345–12360, https://doi.org/10.5194/acp-15-12345-2015, 2015.
Xu, W., Liu, L., Cheng, M., Zhao, Y., Zhang, L., Pan, Y., Zhang, X., Gu, B., Li, Y., Zhang, X., Shen, J., Lu, L., Luo, X., Zhao, Y., Feng, Z., Collett Jr., J. L., Zhang, F., and Liu, X.: Spatial–temporal patterns of inorganic nitrogen air concentrations and deposition in eastern China, Atmos. Chem. Phys., 18, 10931–10954, https://doi.org/10.5194/acp-18-10931-2018, 2018.
Xu, W., Zhang, L., and Liu, X.: A database of atmospheric nitrogen concentration and deposition from the nationwide monitoring network in China, Sci. Data, 6, 51, https://doi.org/10.1038/s41597-019-0061-2, 2019.
Xu, Z., Han, Y., Tam, C. Y., Yang, Z. L., and Fu, C.: Bias-corrected CMIP6 global dataset for dynamical downscaling of the historical and future climate (1979–2100), Sci. Data, 8, 293, https://doi.org/10.1038/s41597-021-01079-3, 2021.
Yu, G., Jia, Y., He, N., Zhu, J., Chen, Z., Wang, Q., Piao, S., Liu, X., He, H., Guo, X., Wen, Z., Li, P., Ding, G., and Goulding, K.: Stabilization of atmospheric nitrogen deposition in China over the past decade, Nat. Geosci., 12, 424–429, https://doi.org/10.1038/s41561-019-0352-4, 2019.
Zhai, S., Jacob, D. J., Wang, X., Liu, Z., Wen, T., Shah, V., Li, K., Moch, J. M., Bates, K. H., Song, S., Shen, L., Zhang, Y., Luo, G., Yu, F., Sun, Y., Wang, L., Qi, M., Tao, J., Gui, K., Xu, H., Zhang, Q., Zhao, T., Wang, Y., Lee, H. C., Choi, H., and Liao, H.: Control of particulate nitrate air pollution in China, Nat. Geosci., 14, 389–395, https://doi.org/10.1038/s41561-021-00726-z, 2021.
Zhang, J., Gao, Y., Leung, L. R., Luo, K., Liu, H., Lamarque, J.-F., Fan, J., Yao, X., Gao, H., and Nagashima, T.: Impacts of climate change and emissions on atmospheric oxidized nitrogen deposition over East Asia, Atmos. Chem. Phys., 19, 887–900, https://doi.org/10.5194/acp-19-887-2019, 2019.
Zhang, L., Chen, Y., Zhao, Y., Henze, D. K., Zhu, L., Song, Y., Paulot, F., Liu, X., Pan, Y., Lin, Y., and Huang, B.: Agricultural ammonia emissions in China: reconciling bottom-up and top-down estimates, Atmos. Chem. Phys., 18, 339–355, https://doi.org/10.5194/acp-18-339-2018, 2018.
Zhang, Y., Foley, K. M., Schwede, D. B., Bash, J. O., Pinto, J. P., and Dennis, R. L.: A Measurement-Model Fusion Approach for Improved Wet Deposition Maps and Trends, J. Geophys. Res.-Atmos., 124, 4237–4251, https://doi.org/10.1029/2018JD029051, 2019.
Zhao, B., Wang, S. X., Liu, H., Xu, J. Y., Fu, K., Klimont, Z., Hao, J. M., He, K. B., Cofala, J., and Amann, M.: NOx emissions in China: historical trends and future perspectives, Atmos. Chem. Phys., 13, 9869–9897, https://doi.org/10.5194/acp-13-9869-2013, 2013.
Zhao, Y., Zhang, L., Chen, Y., Liu, X., Xu, W., Pan, Y., and Duan, L.: Atmospheric nitrogen deposition to China: A model analysis on nitrogen budget and critical load exceedance, Atmos. Environ., 153, 32–40, https://doi.org/10.1016/j.atmosenv.2017.01.018, 2017.
Zhao, Y., Xi, M., Zhang, Q., Dong, Z., Ma, M., Zhou, K., Xu, W., Xing, J., Zheng, B., Wen, Z., Liu, X., Nielsen, C. P., Liu, Y., Pan, Y., and Zhang, L.: Decline in bulk deposition of air pollutants in China lags behind reductions in emissions, Nat. Geosci., 15, 190–195, https://doi.org/10.1038/s41561-022-00899-1, 2022.
Zheng, B., Tong, D., Li, M., Liu, F., Hong, C., Geng, G., Li, H., Li, X., Peng, L., Qi, J., Yan, L., Zhang, Y., Zhao, H., Zheng, Y., He, K., and Zhang, Q.: Trends in China's anthropogenic emissions since 2010 as the consequence of clean air actions, Atmos. Chem. Phys., 18, 14095–14111, https://doi.org/10.5194/acp-18-14095-2018, 2018.
Zheng, L., Zhai, W., Wang, L., and Huang, T.: Improving the understanding of central Bohai Sea eutrophication based on wintertime dissolved inorganic nutrient budgets: Roles of north Yellow Sea water intrusion and atmospheric nitrogen deposition, Environ. Pollut., 267, 115626, https://doi.org/10.1016/j.envpol.2020.115626, 2020.
Zhou, K., Xu, W., Zhang, L., Ma, M., Liu, X., and Zhao, Y.: Estimating nitrogen and sulfur deposition across China during 2005 to 2020 based on multiple statistical models, Atmos. Chem. Phys., 23, 8531–8551, https://doi.org/10.5194/acp-23-8531-2023, 2023.
Zhu, H., Chen, Y., Zhao, Y., Zhang, L., Zhang, X., Zheng, B., Liu, L., Pan Y., Xu, W., and Liu, X.: The Response of Nitrogen Deposition in China to Recent and Future Changes in Anthropogenic Emissions, J. Geophys. Res.-Atmos., 127, e2022JD037437, https://doi.org/10.1029/2022JD037437, 2022.
Zhu, J., Chen, Z., Wang, Q., Xu, L., He, N., Jia, Y., Zhang, Q., and Yu, G.: Potential transition in the effects of atmospheric nitrogen deposition in China, Environ. Pollut., 258, 113739, https://doi.org/10.1016/j.envpol.2019.113739, 2020.
Zhu, J., Tai, A. P. K., and Hung Lam Yim, S.: Effects of ozone–vegetation interactions on meteorology and air quality in China using a two-way coupled land–atmosphere model, Atmos. Chem. Phys., 22, 765–782, https://doi.org/10.5194/acp-22-765-2022, 2022.