the Creative Commons Attribution 4.0 License.
the Creative Commons Attribution 4.0 License.
 | 19 Feb 2025
Tropospheric aerosols over the western North Atlantic Ocean during the winter and summer deployments of ACTIVATE 2020: life cycle, transport, and distribution
Bo Zhang
Richard H. Moore
Luke D. Ziemba
Richard A. Ferrare
Hyundeok Choi
Armin Sorooshian
David Painemal
Hailong Wang
Michael A. Shook
Amy Jo Scarino
Johnathan W. Hair
Ewan C. Crosbie
Marta A. Fenn
Taylor J. Shingler
Chris A. Hostetler
Gao Chen
Mary M. Kleb
Fangqun Yu
Mark A. Vaughan
Yongxiang Hu
Glenn S. Diskin
John B. Nowak
Joshua P. DiGangi
Yonghoon Choi
Christoph A. Keller
Matthew S. Johnson
The Aerosol Cloud meTeorology Interactions oVer the western ATlantic Experiment (ACTIVATE) is a NASA mission to characterize aerosol–cloud interactions over the western North Atlantic Ocean (WNAO). Such characterization requires understanding of life cycle, composition, transport pathways, and distribution of aerosols over the WNAO. This study uses the GEOS-Chem model to simulate aerosol distributions and properties that are evaluated against aircraft, ground-based, and satellite observations during the winter and summer field deployments in 2020 of ACTIVATE. Transport in the boundary layer (BL) behind cold fronts was a major mechanism for the North American continental outflow of pollution to the WNAO in winter. Turbulent mixing was the main driver for the upward transport of sea salt within and ventilation out of BL in winter. The BL aerosol composition was dominated by sea salt, which increased in the summer, followed by organics and sulfate. Aircraft in situ aerosol measurements provided useful constraints on wet scavenging in GEOS-Chem. The model generally captured observed features such as continental outflow, land–ocean gradient, and mixing of anthropogenic aerosols with sea salt. Model sensitivity experiments with elevated smoke injection heights to the mid-troposphere (versus within BL) better reproduced observations of smoke aerosols from the western US wildfires over the WNAO in the summer. Model analysis suggests strong hygroscopic growth of sea salt particles and their seeding of marine BL clouds over the WNAO (< 35° N). Future modeling efforts should focus on improving parameterizations for aerosol wet scavenging, implementing realistic smoke injection heights, and applying high-resolution models that better resolve vertical transport.
- Article
(17743 KB) - Full-text XML
-
Supplement
(3475 KB) - BibTeX
- EndNote


Aerosol particles scatter and absorb radiation in the atmosphere, directly or semi-directly affecting radiation budget and balance and thus climate (Charlson and Pilat, 1969; Hansen et al., 1997). Aerosols act as cloud condensation nuclei (CCN) or ice nuclei (IN), indirectly affecting radiation via the formation of clouds and precipitation (Twomey, 1974, 1977; Burrows et al., 2022). They also affect tropospheric photolysis and photochemistry by modifying solar radiation, and they affect heterogeneous chemistry by providing surfaces for gas–particle interaction (Dickerson et al., 1997; Jacob, 2000; Martin et al., 2003). While the interaction of aerosols with clouds remains the largest uncertainty in the estimates of the Earth's changing energy budget, a full understanding requires knowledge of aerosol transport, sources, sinks, composition, and distribution, which still have large gaps (Boucher et al., 2013; Bellouin et al., 2020; Li et al., 2022a). Continental outflow regions represent a mixture of various aerosol sources and types and are impacted by large-scale and synoptic weather systems (Sorooshian et al., 2020), offering a place for testing the current understanding of tropospheric aerosol processes. Among these regions, the western North Atlantic Ocean (WNAO) presents “a complex atmospheric system with many unknowns” (Sorooshian et al., 2020; Painemal et al., 2021). ACTIVATE is a 6-year (2019–2024) NASA Earth Venture Suborbital-3 (EVS-3) mission to investigate aerosol–cloud–meteorology interactions over the WNAO during winter and summer seasons, with a focus on the marine boundary layer (MBL) clouds (Sorooshian et al., 2019, 2023). The six field deployments took place during February–March and August–September 2020, January–April and May–June 2021, November 2021–March 2022, and May–June 2022, respectively. In this paper, we characterize the aerosol life cycle, transport, composition, and distribution over the WNAO, defined as the oceanic domain bounded by 25–50° N and 60–85° W, and North America's east coast, during the winter (February–March) and summer (August–September) deployments of ACTIVATE 2020 using the GEOS-Chem chemical transport model. The model analysis of aerosols for the deployments of ACTIVATE 2021 and 2022 will be reported separately.
Climatological circulation patterns largely determine the transport pathways and spatial distribution of trace gases and aerosols over the WNAO (Sorooshian et al., 2020; Corral et al., 2021). The atmospheric circulation over the North Atlantic Ocean basin is characterized by two semipermanent features: the Bermuda or Azores High (subtropical anticyclone) and the Icelandic Low (subpolar low pressure) (Davis et al., 1997; Tucker and Barry, 1984). In summer, the Bermuda High reaches its maximum spatial extent over the WNAO and extends westward, with southwesterly winds over the western part of the domain north of 30° N and easterly trade winds in the subtropics (Painemal et al., 2021). In winter, its expansion is limited by the development of the Icelandic Low north of 45° N. While the prevalent westerly winds in winter/spring favor transport of pollution from North America to the Atlantic Ocean and toward Europe, the trade winds south of the Bermuda High in summer facilitate transport of aerosols from the eastern Atlantic and North Africa to the WNAO (e.g., Chen and Duce, 1983).
On synoptic scales, the North American outflow of trace gases and aerosols to the WNAO is dominantly driven by midlatitude cyclones (Cooper et al., 2002; Li et al., 2005; Luan and Jaeglé, 2013). Major transport mechanisms for North American pollution outflow over the WNAO include horizontal advection within the boundary layer (BL) behind the cold front, frontal lifting by the warm conveyor belt (ahead of the cold front), and convective lifting followed by westerly transport in the free troposphere (Creilson et al., 2003; Li et al., 2002). For instance, Fast et al. (2016) identified key processes responsible for the aerosol layers observed over Cape Cod, Massachusetts, and over the North Atlantic Ocean during the Two-Column Aerosol Project (TCAP) conducted during July 2012. The aerosol layers observed in the free troposphere resulted from mean vertical motions associated with synoptic-scale convergence ahead of a cold front, which lifted aerosols from the BL. Recent aircraft observations from the North Atlantic Aerosols and Marine Ecosystems Study (NAAMES) during 2015–2017 showed layers of sulfate, black carbon, and organic aerosol enhancements in the free troposphere, suggesting long-range transport of continental anthropogenic pollution and biomass burning (BB) emissions to the remote marine atmosphere (Croft et al., 2021). Over the North Atlantic Ocean, North American pollution generally follows two transport pathways: one reaches Europe in 4–5 d while the other is entrained in the Bermuda High anticyclone (Luan and Jaeglé, 2013).
Tropospheric aerosols over the WNAO represent a mix of mainly anthropogenic, BB, biogenic, dust, and marine emissions (see a comprehensive review by Sorooshian et al., 2020). The major aerosol types over the WNAO include sulfate–nitrate–ammonium (SNA), black carbon (BC), organic aerosol (OA), dust, and sea salt. SNA aerosols are mainly formed in the atmosphere through oxidation and neutralization of precursor gases sulfur dioxide (SO2), nitrogen oxides (NOx), and ammonia (NH3). They are water-soluble and subject to wet scavenging. Due to air pollution regulatory policies in continental North America, anthropogenic SO2 and NOx emissions have been significantly reduced over the past couple of decades (Feng et al., 2020; Streets et al., 2006), resulting in a decreasing trend in fine particulate matter mass concentrations and aerosol optical depth (AOD), as well as tremendous improvements in air quality in the eastern US and eastern Canada (van Donkelaar et al., 2019; Collaud Coen et al., 2020; Provençal et al., 2017; Jongeward et al., 2016; Yang et al., 2018; Corral et al., 2021).
Sources of light-absorbing BC aerosols are both anthropogenic and natural (e.g., wildfires) in nature. OA is either directly emitted (primary OA or POA) or formed in the atmosphere (secondary OA or SOA). SOA includes an anthropogenic component from oxidation of aromatic hydrocarbons and a biogenic component from oxidation of biogenic volatile organic compounds (VOCs) such as terpenes. The southeast US is known as a region for large biogenic SOA production with its significance amplified by anthropogenic emissions (Zheng et al., 2023; Zhang et al., 2018). The SOA from this region is expected to contribute to the continental outflow of aerosols to the WNAO (Ford and Heald, 2013). Many studies have characterized the impact of BB sources in Alaska, western/Central Canada, and the western US on the extended WNAO region, especially during the ICARTT and TCAP field campaigns (Neuman et al., 2006; Berg et al., 2016). It has been shown that BB emission injection heights involve large uncertainties (e.g., Pfister et al., 2006). Smoke plume heights derived from MISR/Terra observations over North America ranged from a few hundred meters up to 5 km above the ground (Val Martin et al., 2010), and a relatively high percentage of total BB emissions is injected above the BL in the North American boreal regions (Zhu et al., 2018). Recently, Mardi et al. (2021) characterized BB aerosol events over the US east coast and Bermuda over the WNAO between 2005–2018 using ground-based and satellite observations in conjunction with MERRA-2 reanalysis data. More frequent BB events are found to occur in June–August over the northern part of the east coast with sources from western North America, while more events are identified in March–May over the southeast US and Bermuda with sources from southern Mexico, Yucatan, Central America, and the southeast US. That study and others (Edwards et al., 2021) point to cloud–BB aerosol interactions over the east coast and the WNAO. Long-range-transported North American wildfire aerosols, e.g., those from the Canadian wildfires in August 2017 with the extreme injection height of ∼ 12 km, can be observed in the marine BL of eastern North Atlantic after descending in the dry intrusion behind midlatitude cyclones (Zheng et al., 2020). The August Complex “gigafire” took place in mid-August 2020, and the California Creek Fire occurred in early September 2020, ranked among the top five in California wildfire history (Zhuang et al., 2021). These fires are expected to have important impacts on trace gases and aerosols, especially carbonaceous aerosols, over the east coast and the WNAO during the summer deployment of ACTIVATE 2020.
Dust over the WNAO can be transported from North Africa, North America, and Asia. Dust over the northeast US is mainly transported in the lower and middle troposphere (2–6 km; Zhang et al., 2019), and long-range transport of Asian dust in spring can reach the eastern US (Jaffe et al., 2003; DeBell et al., 2004). North African dust is transported to the eastern US and the WNAO in summer (June–August maximum; Aldhaif et al., 2020), and the trajectories are typically at ∼ 1 km altitude (Savoie and Prospero, 1977; Perry et al., 1997). Contribution of North American dust to the outflow to the WNAO is typically small (Corral et al., 2021). Modeling and observational studies have found that an understanding of the dust loading and spatial (especially vertical) distribution over the WNAO is still lacking (Colarco et al., 2003; Peyridieu et al., 2010; Generoso et al., 2008; Kim et al., 2014). Sea spray aerosols are primarily generated by air bubbles bursting at the ocean surface resulting from wind stress and are composed of inorganic sea salt and organic matter (de Leeuw et al., 2011; Quinn and Bates, 2014). Sea salt aerosols (SS) are a major source of CCN, including giant CCN, over the WNAO (Gonzalez et al., 2022), and thus have indirect effects on cloud, precipitation, and climate. As represented in MERRA-2, sea salt and sulfate contribute most to total AOD over the WNAO (Corral et al., 2021). MERRA-2 sea salt AOD over the WNAO is typically highest in winter months and lowest in summer (Dadashazar et al., 2021; Aldhaif et al., 2021), consistent with sea salt mass concentrations observed at IMPROVE sites along the US east coast (Corral et al., 2021). While sea salt is typically the largest contributor to aerosol mass and extinction over the remote ocean, signatures of long-range transport of anthropogenic, BB, and dust emissions are often present, as shown by Silva et al. (2020) in a model analysis of sun photometer observations of AOD from two island sites over the North Atlantic.
The ACTIVATE mission deployed two aircraft (HU-25 Falcon and King Air) flying in coordination, with the Falcon making in situ measurements in the lower troposphere and the King Air providing remote sensing measurements of aerosols and clouds in the same vertical column from an altitude of 8–10 km while also launching dropsondes. Flight hours totaled ∼ 73 and ∼ 60 for Falcon (∼ 59 and ∼ 67 for King Air) during the winter (14 February–12 March 2020) and summer (13 August–30 September 2020) deployments of ACTIVATE's first year of flights, respectively. These intensive aircraft in situ and remote sensing observations of aerosols provide an opportunity to test the current understanding of tropospheric aerosol sources and distribution as well as associated processes as represented by state-of-the-art global models. In this paper, we evaluate the GEOS-Chem CTM driven by the MERRA-2 assimilated meteorology (with marine POA emissions) against ACTIVATE aircraft measurements as well as ground and satellite observations for the periods of the winter and summer deployments of ACTIVATE 2020. We determine the sources, transport, and distribution of tropospheric aerosols over the WNAO. The analysis also serves as a description of aerosol conditions in the region during the two deployments. We plan to address the following science questions. (1) What are the major outflow pathways and transport mechanisms for the export of North American anthropogenic pollution to the WNAO in winter and summer? (2) Can a state-of-the-art chemical transport model reproduce the distribution and variability of tropospheric aerosols over the WNAO as observed during ACTIVATE? (3) What are the sources of tropospheric aerosols as well as the relative contributions of terrestrial versus oceanic sources to the aerosol mass, AOD, and their variability over the WNAO in winter and summer? (4) How is the summer compared to the winter with respect to the sources, transport, and distribution of aerosols over the WNAO?
This paper is structured as follows. Section 2 introduces the GEOS-Chem model (with bulk aerosol), observational data sets, and model simulations including output sampling approaches. Section 3 delineates the meteorological setting and transport pathways for pollution over the WNAO. Section 4 presents the model-simulated aerosol composition and distribution over the WNAO (Sect. 4.1) and model evaluations with aircraft in situ measurements of CO, sulfate, nitrate, ammonium, and OA concentrations (Sect. 4.2); AERONET AOD measurements (Sect. 4.3); and aerosol extinction profiles from aircraft HSRL-2 lidar and CALIOP/CALIPSO satellite retrievals (Sect. 4.4, which includes case studies of aerosol transport and mixing). Section 5 quantifies model source attributions of AODs over the WNAO during winter/summer 2020, followed by summary and conclusions in Sect. 6.
2.1 Model description
We use the GEOS-Chem global chemical transport model (http://www.geos-chem.org, last access: 30 June 2022) version 11-01 (http://wiki.seas.harvard.edu/geos-chem/index.php/GEOS-Chem_v11-01, last access: 30 June 2022) to simulate the sources, transport, and distribution of tropospheric aerosols over the WNAO. The model is driven by the MERRA-2 assimilated meteorology (at a horizontal resolution of 2° × 2.5° with 72 levels) from the NASA Global Modeling Assimilation Office. It includes a detailed description of stratospheric and tropospheric chemistry fully coupled through the unified tropospheric–stratospheric chemistry extension (UCX; Eastham et al., 2014). Gas-phase tropospheric oxidant chemistry was originally described by Bey et al. (2001), and its coupling with the SNA aerosol thermodynamics was developed by Park et al. (2004). SNA thermodynamics are computed with the ISORROPIA thermodynamic module (Fountoukis and Nenes, 2007). BC follows Wang et al. (2014), OA is after Pye et al. (2010) and Pye and Seinfeld (2010), and marine primary OA (MPOA) uses the scheme of Gantt et al. (2015) based on monthly mean MODIS chlorophyll-a concentrations. SOA follows the simplified volatility basis set (VBS) scheme of Pye et al. (2010). Sea salt aerosol emissions use the empirical source function of Jaeglé et al. (2011) with a dependency on surface wind speed and sea surface temperature. The model assumes two dry sea salt size bins: one for accumulation mode (radius 0.01–0.5 µm) and the other for coarse mode (radius 0.5–8 µ m). Dust emissions in GEOS-Chem were described by Fairlie et al. (2007), and we use here the Dust Entrainment and Deposition (DEAD) scheme (Zender et al., 2003) with the size distributions updated by Zhang et al. (2013). Aerosol optical depth is calculated for each aerosol type using local relative humidity and prescribed optical properties (Martin et al., 2003; Drury et al., 2010; Ridley et al., 2012; Kim et al., 2015). External mixing of aerosols is assumed. The input meteorological archives have 3 h temporal resolution for 3-D fields and 1 h resolution for 2-D fields. The model time steps (10 min for transport and 20 min for chemistry) are chosen to optimize both simulation accuracy and computational speed (Philip et al., 2016).
The model uses the TPCORE advection algorithm (Lin and Rood, 1996), computes convective transport from the MERRA-2 convective mass fluxes (Wu et al., 2007), and uses the non-local scheme for BL mixing (Lin and McElroy, 2010). The aerosol wet deposition scheme is described by Liu et al. (2001) and includes first-order rainout and washout due to stratiform precipitation and scavenging in the convective updrafts. Scavenging of aerosol by snow and cold/mixed precipitation is described by Wang et al. (2011, 2014). For stratiform precipitation scavenging, we use MERRA-2's spatiotemporally varying cloud condensed water content (CWC), following the revised scheme of Luo et al. (2019, 2020), in the standard simulations in this study. For comparison, simulations prescribed with a fixed CWC of 1.0 × 10⁻³ kg m−3 comparable to observed upper limits (Del Genio et al., 1996; Wang et al., 2011) are also presented. On the other hand, MERRA-2 cloud cover and precipitation over the US east coast and WNAO are biased low relative to satellite observations (Wu et al., 2022; Bosilovich et al., 2015, 2017) and thus introduce uncertainty in the model scavenging processes. Aerosol dry deposition uses the resistance-in-series scheme of Wesely (1989), with deposition to snow/ice surfaces from Fisher et al. (2011). Gravitational settling is as described by Fairlie et al. (2007) for dust and Alexander et al. (2005) for coarse sea salt.
Anthropogenic, biogenic, marine DMS, and lightning NOx emissions are described in the Supplement (Sect. S1). BB emissions are from the Quick Fire Emissions Dataset (QFED v2.5r1; Darmenov and da Silva, 2015), which is based on the location and fire radiative power (FRP) obtained from the Moderate Resolution Imaging Spectroradiometer (MODIS) Level 2 fire products and the MODIS geolocation products. QFED provides daily mean emissions of trace gases and aerosols at 0.1° × 0.1° horizontal resolution. BB emissions are injected within the depth of the planetary boundary layer (PBL) in our standard simulations. In a separate set of simulations, they are also injected to the 0–5.5 km or 2–10 km altitude range to investigate the sensitivity of model results to BB emission injection heights. The choice of these higher injection heights is based on the following previous studies. A substantial fraction of North American fire emissions is injected to the free troposphere (e.g., Val Martin et al., 2010). A total of 35 % of the QFED BB emissions are also distributed between 3.5–5.5 km in the NASA GEOS-CF model (Keller et al., 2021; Fischer et al., 2014). An explosive pyrocumulonimbus (pyroCb) cloud from the Californian Creek Fire on 9 September 2020 was reported, with the plume height peaking above 10 km (Carr et al., 2020).
2.2 Observational data sets
-
ACTIVATE aircraft data. During ACTIVATE, the HU-25 Falcon aircraft made in situ measurements of carbon monoxide (CO) mixing ratios and aerosol concentrations during each flight (duration of ∼ 3.5 daytime hours). CO measurements were made with a Picarro G2401 gas concentration analyzer (DiGangi et al., 2021). Submicron non-refractory aerosol composition was measured by the High-Resolution Time-of-Flight Aerosol Mass Spectrometer (HR-ToF-AMS; Aerodyne) (DeCarlo et al., 2008; Hilario et al., 2021), operated in 1 Hz fast-MS mode and averaged to 30 s time resolution. AMS data were collected downstream of an isokinetic double diffuser inlet (BMI, Inc.) and also sampled downstream of a counterflow virtual impactor (CVI) inlet (BMI, Inc.) when in cloud (Dadashazar et al., 2022; Shingler et al., 2012); only the former is used in this study. AMS measurements are reported at the standard temperature (273.15 K) and pressure (1013.25 hPa). One-minute merged Falcon data are used in this study. We also use the King Air's nadir-viewing High Spectral Resolution Lidar 2 (HSRL-2) retrievals of vertically resolved aerosol extinction coefficient at 532 nm (Ferrare et al., 2023). The HSRL-2 instrument has been used in previous aircraft missions, and readers are referred to Burton et al. (2018) for further information about its operational details. The FLEXPART model (Stohl et al., 1998) is used to identify the origin of air masses associated with high HSRL-2 aerosol extinction during an event of the long-range transport of a western US fire plume. ACTIVATE aircraft data and FLEXPART model output are described in detail by Sorooshian et al. (2023) and available at https://doi.org/10.5067/SUBORBITAL/ACTIVATE/DATA001 (ACTIVATE Science Team, 2020).
-
AERONET. We use AOD measurements from the Aerosol Robotic Network (AERONET, http://aeronet.gsfc.nasa.gov, last access: 13 October 2023; Holben et al., 1998), a ground-based aerosol remote sensing network. Level 2.0 daily data used are based on the version 3 algorithm and are cloud-screened and quality-assured (Giles et al., 2019; Smirnov et al., 2000). AERONET AOD data were obtained for three sites during February–March and August–September 2020: NASA LaRC (37.10° N, 76.38° W); NASA GSFC (38.99° N, 76.84° W); and Tudor Hill, Bermuda (32.26° N, 64.88° W). For comparison with GEOS-Chem AODs at 550 nm, AERONET AOD values at 440 nm were converted to 550 nm using the AERONET 440–675 nm Ångström exponent. Estimated uncertainties in AERONET AODs are on the order of ∼ 0.01–0.02 (Eck et al., 1999; Dubovik et al., 2000).
-
CALIPSO. The Cloud-Aerosol Lidar with Orthogonal Polarization (CALIOP), on board the Cloud-Aerosol Lidar and Infrared Pathfinder Satellite Observations (CALIPSO) platform, has been providing aerosol vertical profile measurements of the Earth's atmosphere on a global scale since June 2006 (Winker et al., 2010). We use the version 4.51 CALIOP Level 2 Aerosol Profile products with a vertical resolution of 60 m and horizontal resolution of 5 km over an altitude range of 30 to −0.5 km, and only quality-screened extinction samples are used in the analysis. Specifically, aerosol layers with cloud aerosol discrimination (CAD) scores less than −100 or greater than −20 are rejected to avoid low-confidence aerosol classifications (Liu et al., 2019). Also, aerosol layers with the extinction quality control (QC) flag not equal to 0, 1, 16, and 18 are rejected to remove low-confidence extinction retrievals, while aerosol extinction samples with the extinction uncertainty equal to 99.99 km−1 as well as those at lower altitudes below these samples are rejected to remove unreliable extinction values (Yu et al., 2010; Winker et al., 2013; Kim et al., 2018; Tackett et al., 2018). In addition, we apply the same data-averaging approach that was used to generate the CALIPSO version 4 Level 3 aerosol products (Tackett et al., 2018). The quality-screening and data-selection techniques are briefly described in the Supplement (Sect. S2). CALIOP aerosol extinction coefficients at 532 nm were horizontally and vertically regridded onto the GEOS-Chem grids by averaging all quality-screened extinction values within each grid box. CALIOP data are available at https://subset.larc.nasa.gov/calipso (last access: 31 January 2024).
We also use surface aerosol concentration observations from the Interagency Monitoring of Protected Visual Environments (IMPROVE) and the Chemical Speciation Network (CSN) networks (Solomon et al., 2014; Malm et al., 1994), aerosol deposition flux measurements from the National Trends Network (NTN) of the US National Atmospheric Deposition Program (NADP, https://nadp.slh.wisc.edu/, last access: 1 November 2023), and AOD retrievals from MODIS on Aqua satellite (Sayer et al., 2014; Levy et al., 2013; Hubanks et al., 2019). These data sets are described in the Supplement (Sect. S2).
2.3 Model simulations and output sampling
We perform GEOS-Chem simulations for the periods of 1 December 2019–31 March 2020 and 1 June–30 September 2020 with the first 2 months treated as the model spin-up period. Model sensitivity experiments are also conducted to investigate the impacts of using fixed CWC in model scavenging, sensitivity to BB emission injection height, and impacts of various emission types (anthropogenic, BB, biogenic, marine, and dust). The impacts are quantified by the difference in simulation results from the standard model and the sensitivity experiments. Table 1 lists all model experiments.
Table 1GEOS-Chem model simulations for February–March and August–September 2020.
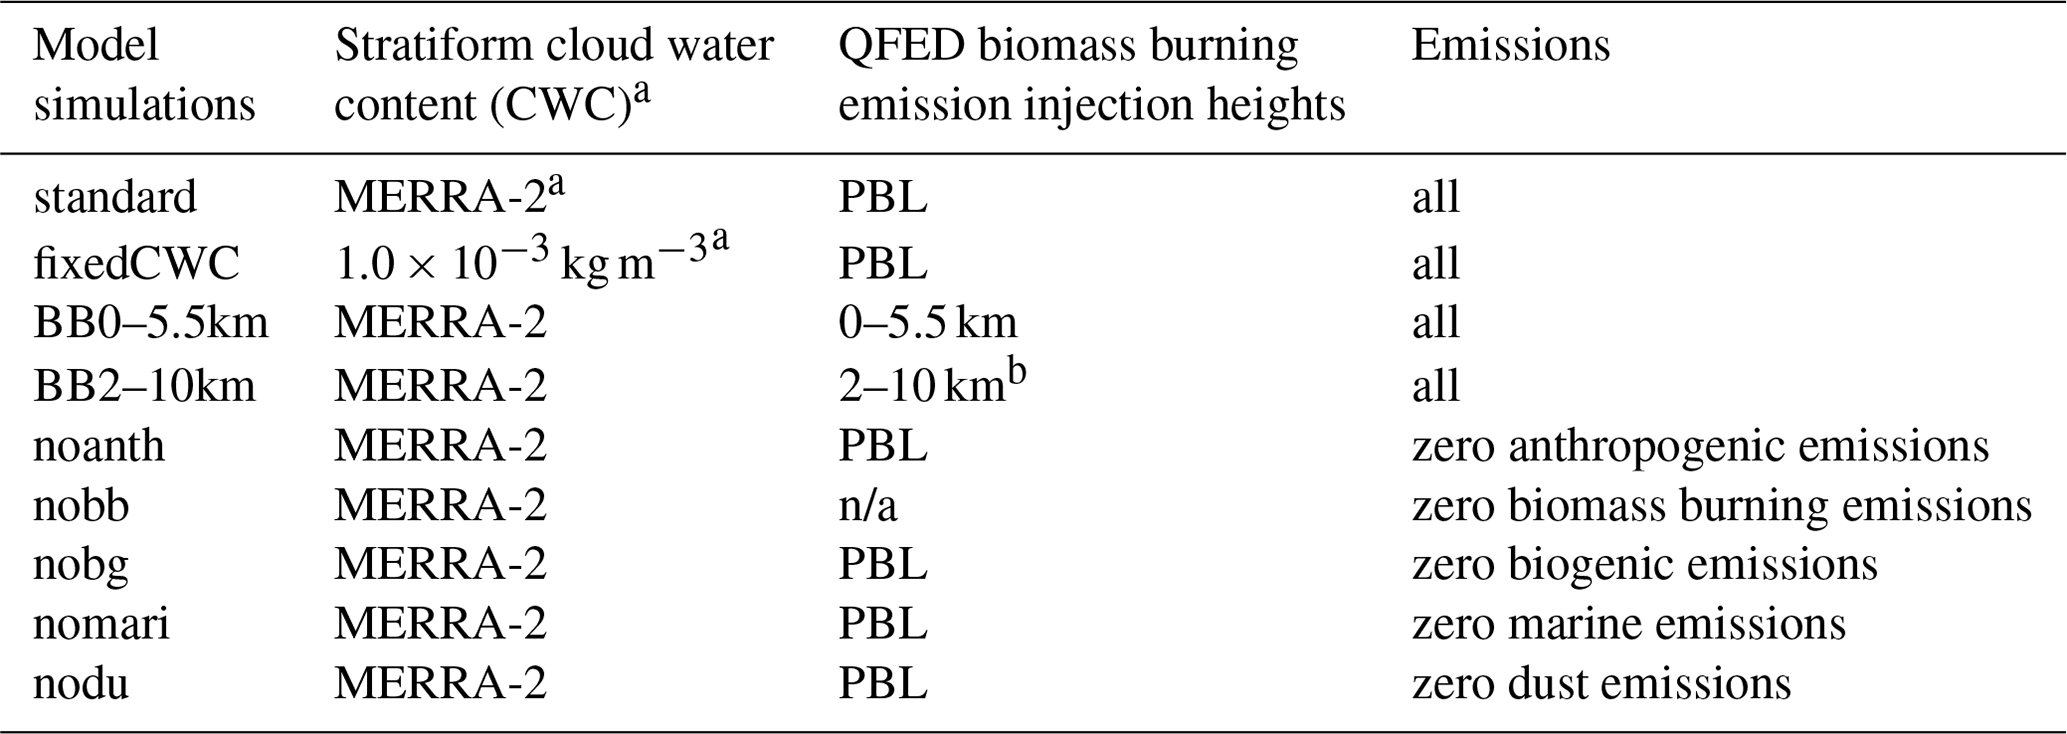
a CWC is used in the model parameterization for aerosol scavenging due to stratiform precipitation. Its value is either taken from MERRA-2 (Luo et al., 2019, 2020) or assumed a fixed constant of 1.0 × 10⁻³ kg m−3 (Del Genio et al., 1996; Wang et al., 2011).
b This simulation is for August–September 2020 only.
Hourly, daily, and deployment-average model outputs are saved for analysis. For comparison with aircraft in situ and HSRL-2 lidar measurements, hourly model output is sampled at the time and location of the aircraft. For comparison with daily AOD measurements at the three AERONET sites, daily model output is sampled at the location of each site. When comparing with CALIPSO data, model output averaged over 01:00–02:00 and 13:00–14:00 LT is sampled at the date and location of nighttime and daytime CALIOP measurements (i.e., CALIPSO orbit tracks), respectively.
In this section we describe the mean states of meteorological settings, BL outflow, and vertical transport of pollution during February–March and August–September ACTIVATE 2020, as represented by the MERRA-2 reanalysis and GEOS-Chem model simulation. They will facilitate the interpretation of model results as well as comparisons with observational data in Sect. 4. Figure 1 shows the tracks of 22 HU-25 (Falcon) flights during February–March ACTIVATE 2020 and 18 flights during August–September ACTIVATE 2020, with flights typically transiting via waypoints of ZIBUT (36.93° N, 72.67° W) and OXANA (34.36° N, 73.75° W) to avoid military restricted air space. The aircraft sampling domain is divided at 36° N into two box regions: the north (“N”; 36–39° N, 69–75° W) and the south (“S”; 32.5–36° N, 71–75.5° W) for this analysis.

Figure 1Falcon (HU-25) flight tracks during the winter (14 February–12 March) and summer (13 August–30 September) deployments of ACTIVATE 2020. Almost all flights are based out of NASA Langley Research Center (LaRC), with a few in the winter deployment based out of the nearby Newport News/Williamsburg International Airport. The aircraft sampling domain is divided at 36° N into two box regions, the north (“N”; 36–39° N, 69–75° W) and the south (“S”; 32.5–36° N, 71–75.5° W), for data analysis.
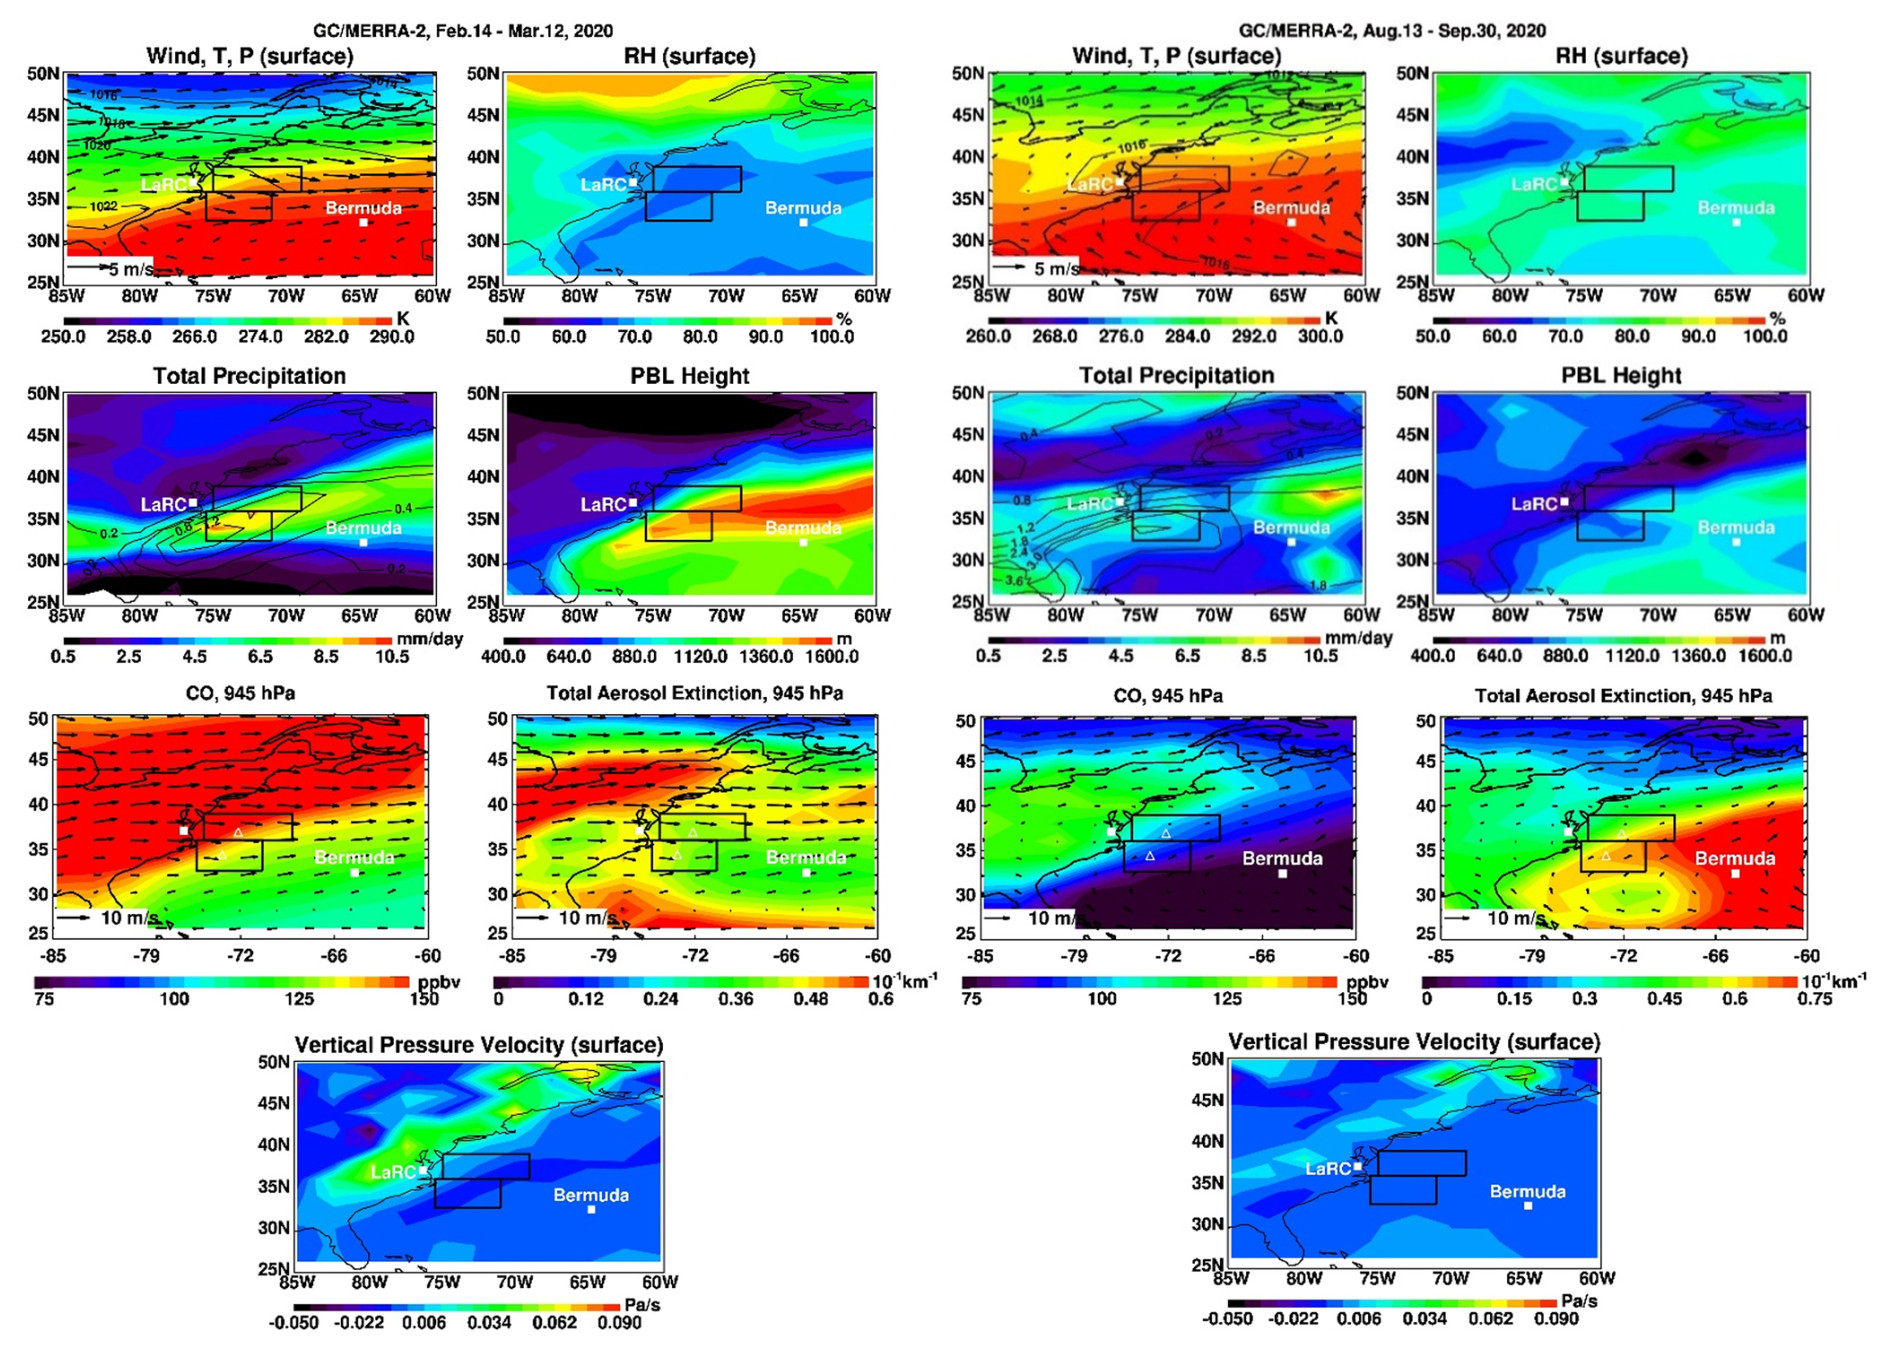
Figure 2Mean meteorological conditions from MERRA-2 and near-surface (945 hPa) CO concentrations (ppbv) and aerosol extinctions at 550 nm (km−1) in GEOS-Chem during February–March 2020 (left) and August–September 2020 (right). Meteorological variables are horizontal wind (m s−1, vectors), temperature (K, colors) at the model bottom layer, sea level pressure (hPa, contours), relative humidity (RH, %), total precipitation (mm d−1, colors), convective precipitation (mm d−1, contours), PBL height (m), and vertical pressure velocity (ω, Pa s−1). Arrows are horizontal wind vectors. The two rectangular boxes denote major flight areas (see N and S in Fig. 1). The locations of LaRC and Bermuda are marked by white squares. Note the different color bars for temperature or total aerosol extinction panels.
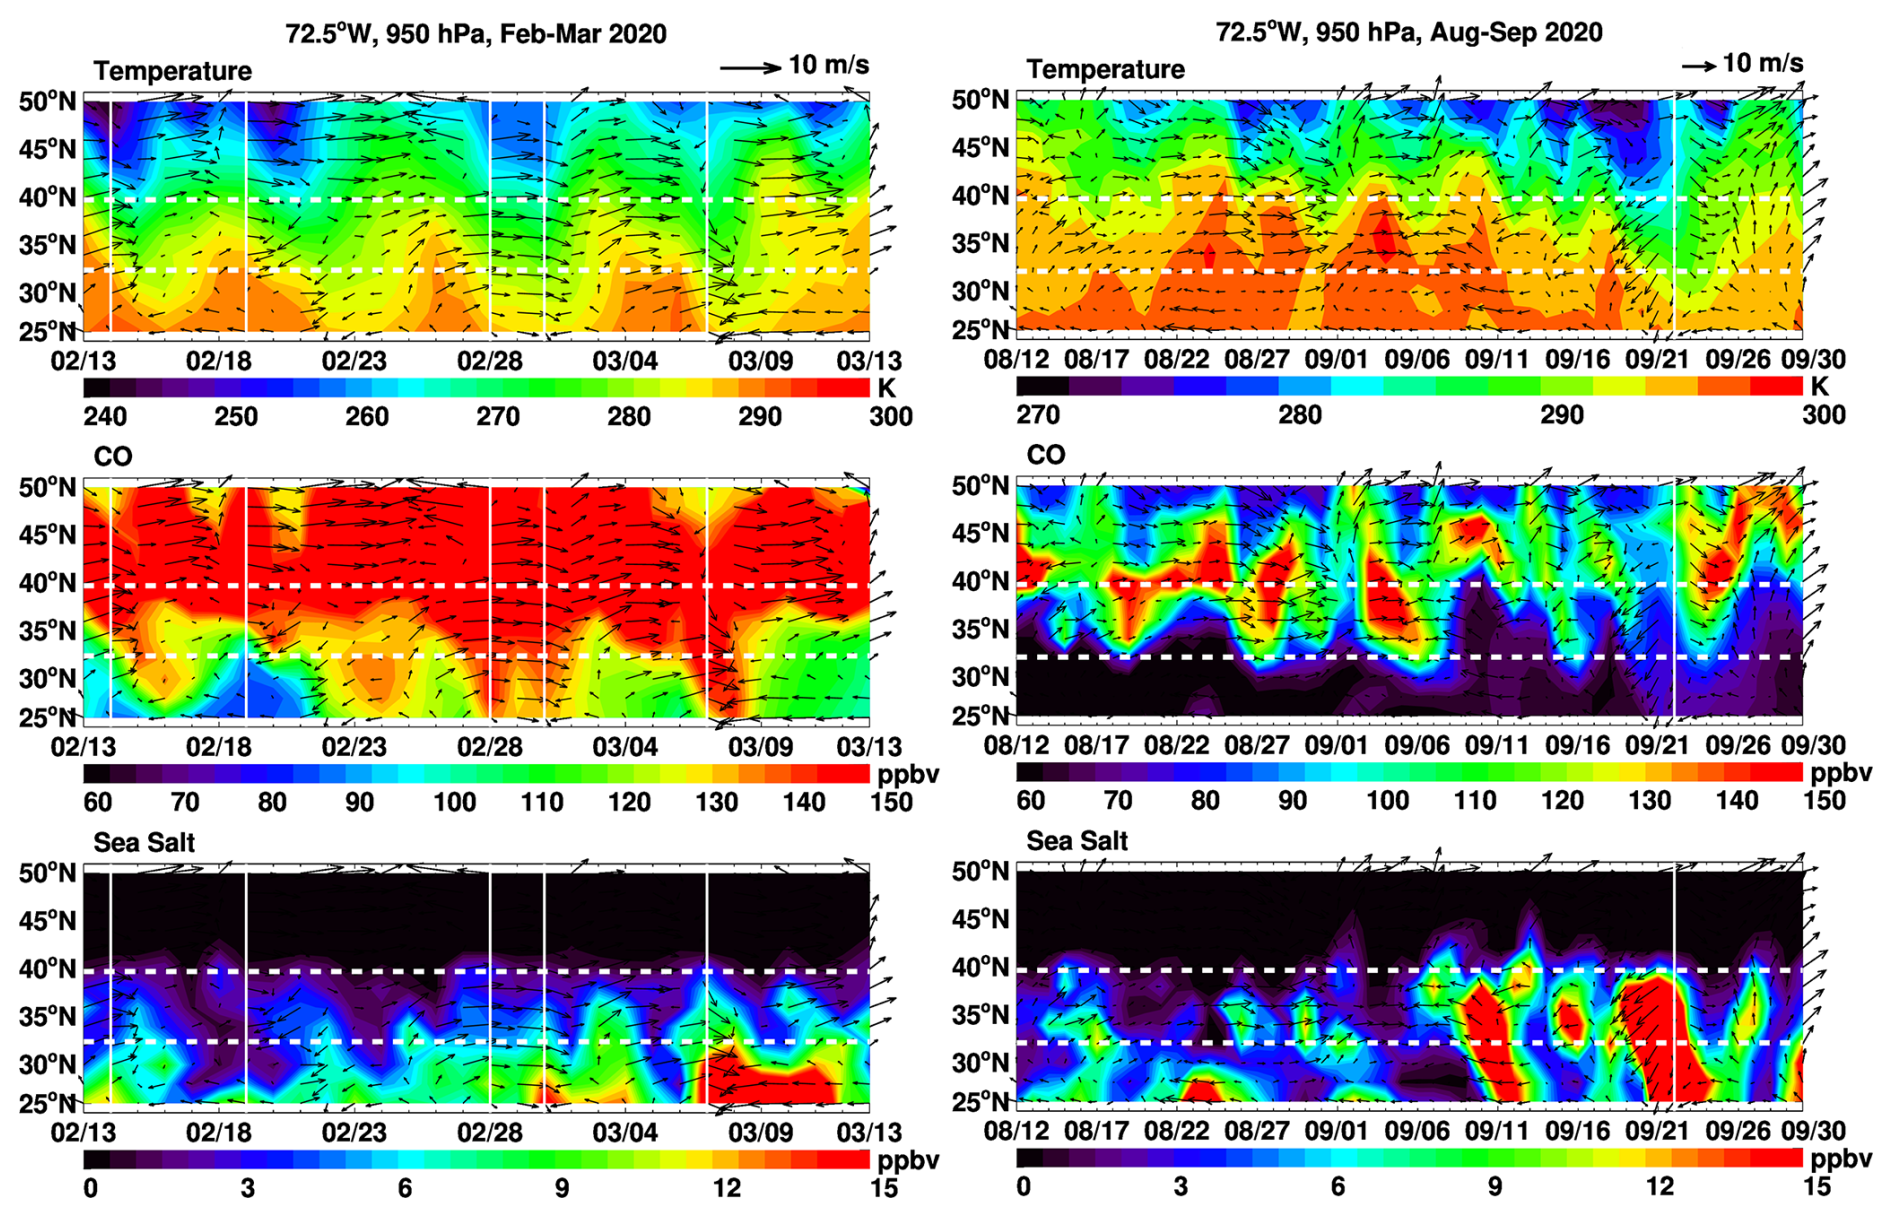
Figure 3Spatiotemporal evolution of boundary layer outflow to the WNAO. The plots show Hovmöller diagrams of GEOS-Chem daily mean air temperature (K), horizontal winds (m s−1), CO (ppbv), and sea salt mixing ratios (ppbv) at 950 hPa along 72.5° W over the WNAO during February–March and August–September 2020. Arrows are wind vectors. Two horizontal dotted white lines indicate the latitude range (32.4–39.8° N) of aircraft measurements. Vertical white lines represent the days of cold front passages as visually identified by cold air intrusion from north of ∼ 40° N.
-
Meteorological settings. The winter and summer deployment periods feature contrasting atmospheric circulation patterns and meteorological conditions. Figure 2 shows MERRA-2 near-surface air temperature, surface level pressure, relative humidity, vertical pressure velocity (ω), total and convective precipitation, and PBL heights (based on the total eddy diffusion coefficient of heat with a threshold value of 2 m2 s−1; McGrath-Spangler and Molod, 2014) over the WNAO averaged over 14 February–12 March and 13 August–30 September, respectively. Also shown in the figures are the model-simulated CO concentrations and aerosol extinction coefficients (at 550 nm) at 945 hPa. In winter, the lower troposphere of the WNAO region was dominated by westerly wind and air masses from continental North America in the north and anticyclonic winds in the southeast. The latter was associated with the Bermuda High located to the east of the domain. A strong NW–SE horizontal gradient in surface temperature extended from the SE US coast towards NE/E, consistent with frequent passages of cold fronts driven by the Northern Hemisphere midlatitude cyclones and the warm Gulf Stream sea surface temperatures in February–March (e.g., Seethala et al., 2021). The ACTIVATE flights in the two box regions sampled this continental outflow extensively. Flights to the north often occurred during post-frontal conditions, reflecting one of the mission objectives to sample and study MBL clouds, especially during cold air outbreaks in winter that have been the subject of recent work (Tornow et al., 2022; Seethala et al., 2021; Corral et al., 2022; Li et al., 2022b; Chen et al., 2022). In addition to lower temperature, the post-frontal air was characterized by subsiding motion with lower relative humidity and precipitation (dry air) as well as lower BL height. In particular, the S box region experienced stronger uplifting and precipitation (predominantly stratiform) ahead of the cold fronts. It suggests stronger aerosol scavenging associated with the southern cluster of flights. The generally higher marine BL height over the WNAO in winter (than summer) is mainly due to a larger temperature contrast between the relatively warm ocean surface and the colder air above, leading to increased lower-tropospheric instability and turbulent mixing and thus a higher BL height (Chien et al., 2019; Gallo et al., 2023; Wang et al., 2021). Model BL CO concentrations showed large land-to-sea gradients over the WNAO, resulting from the fact that North American pollution outflow was much stronger in the N box region (westerly winds) than in the S box region, which was often intruded by low-latitude marine air (southwesterly winds), during February–March 2020. The more inhomogeneous distribution of aerosol extinction coefficients (compared to CO) generally reflects the shorter aerosol lifetime, as well as more complex processes and their interactions involved in speciated aerosol emissions, transport, heterogeneous chemistry, photochemistry, and wet scavenging.
In summer, while midlatitude cyclones and westerlies moved northward, the Bermuda High strengthened and extended westward with southwesterly offshore winds along the US SE coast (∼ 32–36° N) and easterly trade winds in the subtropics (< 30° N; Fig. 2). Compared to the wintertime, the horizontal gradients in surface temperature, RH, vertical pressure velocity, precipitation, and PBL height were much weaker in the N and S box regions. However, convective precipitation was much stronger in summer and accounted for ∼ 50 %–80 % of the total precipitation in the flight domain. Despite a large land-to-sea gradient, model-simulated BL CO concentrations were much lower due to CO oxidation by higher OH in summer. In contrast to the wintertime, BL aerosol extinction over the WNAO during summer exhibited large enhancements compared to those over land, suggesting major aerosol sources of marine origin.
-
Boundary layer outflow of pollution. Transport in the BL behind cold fronts is a major mechanism for the North American pollution outflow to the WNAO. It exerts large impacts on the BL trace gases and aerosol composition as well as their spatiotemporal evolution in the ACTIVATE flight domain. Figure 3 shows Hovmöller diagrams of model daily mean air temperature, CO, and sea salt concentrations at 950 hPa along 72.5° W (near the longitude of waypoint ZIBUT) over the WNAO during 14 February–13 March and 13 August–30 September. During February–March 2020 (left column, Fig. 3), there were about four major periods with cold fronts passing through the study area, as indicated by the wavy pattern of near-surface temperature day-to-day variations. During frontal passages, CO pollution was swept in the BL behind the cold fronts southeastward to the ACTIVATE flight latitudes (32.4–39.8° N). On 15–16 February, 28 February, 1 March, and 7 March, the BL outflow of CO reached as far as south of 32° N. On the other hand, advection of warm marine air from low latitudes resulted in low CO concentrations across the flight domain. Enhanced sea salt aerosols were often associated with strong wind and warm air from the south (bottom-left panel, Fig. 3). A remarkable sea salt event occurred because of strong surface wind speed on 7 March during a cold air outbreak. During August–September 2020 (right column, Fig. 3), cold air intrusion deep into the flight domain did not take place until late September since midlatitude cyclones were shifted northward in summer. High-CO events within the ACTIVATE flight latitude ranges appeared associated with transport of anthropogenic or wildfire emissions that occurred between 35–45° N. Two strong events of high sea salt concentrations occurred on 10–12 and 19–22 September. The former was due to high surface winds associated with a westward-moving low-pressure system. The latter resulted from the strong winds during a cold air outbreak that lasted for several days when cold air swept along a NE-to-SW corridor off the east coast over the whole flight domain. It lasted until a new cold front moved into the domain on 23 September, resulting in enhanced CO during 23–25 September. In addition, prevalent westerly flows, particularly during winter and spring, are a significant mechanism for transporting pollution from the North American continent to the WNAO (Sorooshian et al., 2020). However, effective transport of these pollutants to the WNAO typically requires the westerly flow to be coupled with midlatitude cyclones. These cyclones facilitate the outflow of pollution in the BL and the lifting of BL air from the North American continent into the free troposphere over the WNAO (Creilson et al., 2003).
-
Vertical transport. Major pathways for vertical transport of trace gases and aerosols over the North American continental outflow region include uplifting ahead of cold fronts, convective transport, and BL turbulent mixing. We analyzed model-resolved large-scale vertical fluxes, convective fluxes, and PBL turbulent mixing fluxes of CO and sea salt at 1 km and 2 km, respectively, averaged over the periods of 14 February–12 March and 13 August–30 September 2020, respectively (Fig. 4 and Fig. S1 in the Supplement). During February–March 2020, large-scale vertical transport ahead of cold fronts apparently played a dominant role in lifting CO out of the BL over the US east coast and two flight box regions, followed by rapid eastward transport in the free troposphere. Convection was also important in this role, especially in the S box region. It became even more important in summer during August–September 2020 when convective fluxes of CO were comparable to large-scale vertical fluxes (Fig. S1a, b). For sea salt, by contrast, BL turbulent mixing was found to be the dominant process responsible for the upward transport of sea salt within and ventilation out of the BL over the flight domain in winter, while both convection and turbulent mixing were important in uplifting sea salt to the free troposphere in summer (Figs. 4 and S1c). Entrainment (i.e., turbulent mixing of air from the free troposphere into the BL) was previously shown to be the major source of the MBL aerosol population in the eastern North Atlantic (Zheng et al., 2018). Recently, Tornow et al. (2022) emphasized the important role of entraining free-tropospheric clean air in diluting MBL CCN under cold air outbreak conditions during the ACTIVATE field campaign. Our model-calculated PBL mixing flux of CO in the upper BL (∼ 1.0 km) is negative (downward) in the S box region, suggesting entrainment plays a role there (Fig. S1a).
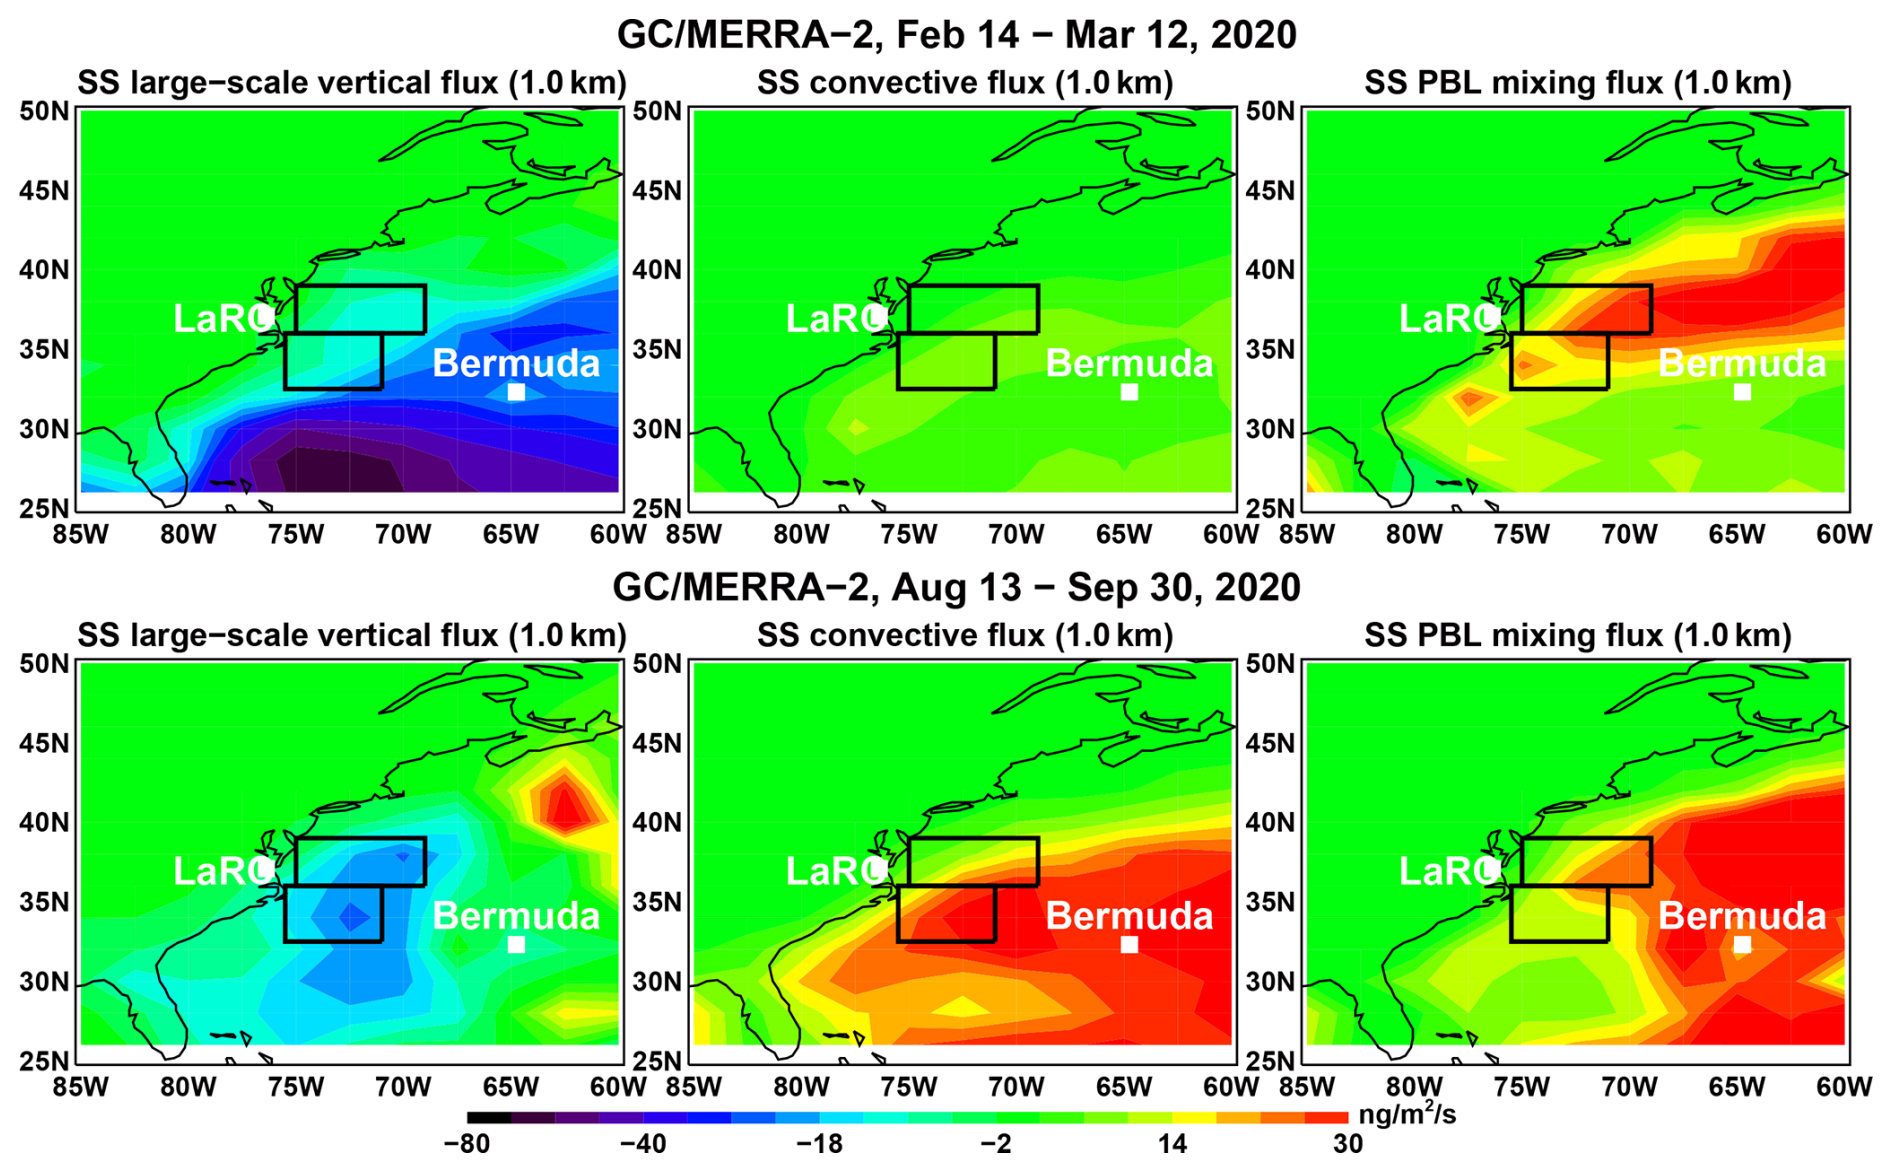
Figure 4Model-simulated large-scale (resolved) vertical fluxes, convective fluxes, and PBL turbulent mixing fluxes of sea salt at the altitude of 1.0 km, averaged over the periods of 14 February–12 March 2020 (upper row) and 13 August–30 September 2020 (lower row), respectively. The two rectangular boxes denote major flight areas (see N and S in Fig. 1). The locations of LaRC and Bermuda are marked by white squares.
4.1 Simulated aerosol composition, distribution, and loading over the WNAO
In this section, we describe the horizontal, vertical distributions, and mass loadings of aerosol species over the WNAO during February–March and August–September 2020, as simulated by GEOS-Chem. Figure 5 shows the 929 hPa maps of model-simulated mass concentrations of sulfate–nitrate–ammonium (SNA), black carbon (BC), primary organic aerosol (POA), secondary organic aerosol (SOA), sea salt, and dust averaged over the period of 14 February–12 March 2020. Also shown are longitude–altitude cross-sections of each aerosol species averaged over 33–39° N. The distribution patterns of SNA, BC, POA, and SOA resemble those of CO (Fig. 2), reflecting the frequent North American continental outflow of traces gases and aerosols in the BL behind cold fronts to the WNAO. Among aerosol species of North American origin, POA shows the highest mass in the study domain, while POA and nitrate exhibit strong gradients with mass concentrations sharply decreasing eastward. As will be discussed in Sect. 4.2, POA in the study domain is attributed to North American anthropogenic and southeast US BB emissions. Sulfate mass concentration shows a weaker gradient because DMS from the ocean is also a source of SO2 and sulfate. Sea salt has the largest aerosol mass over the WNAO, with maximum in the easterly trade wind region and to the east of the north flight domain. Abundances of BC, SOA, and dust across the flight domain are relatively small. Dust to the southeast of Bermuda is a result of long-range transport from Africa. As shown in the vertical cross-section plots, aerosol masses are mostly restricted in the lower troposphere (< 2–3 km).
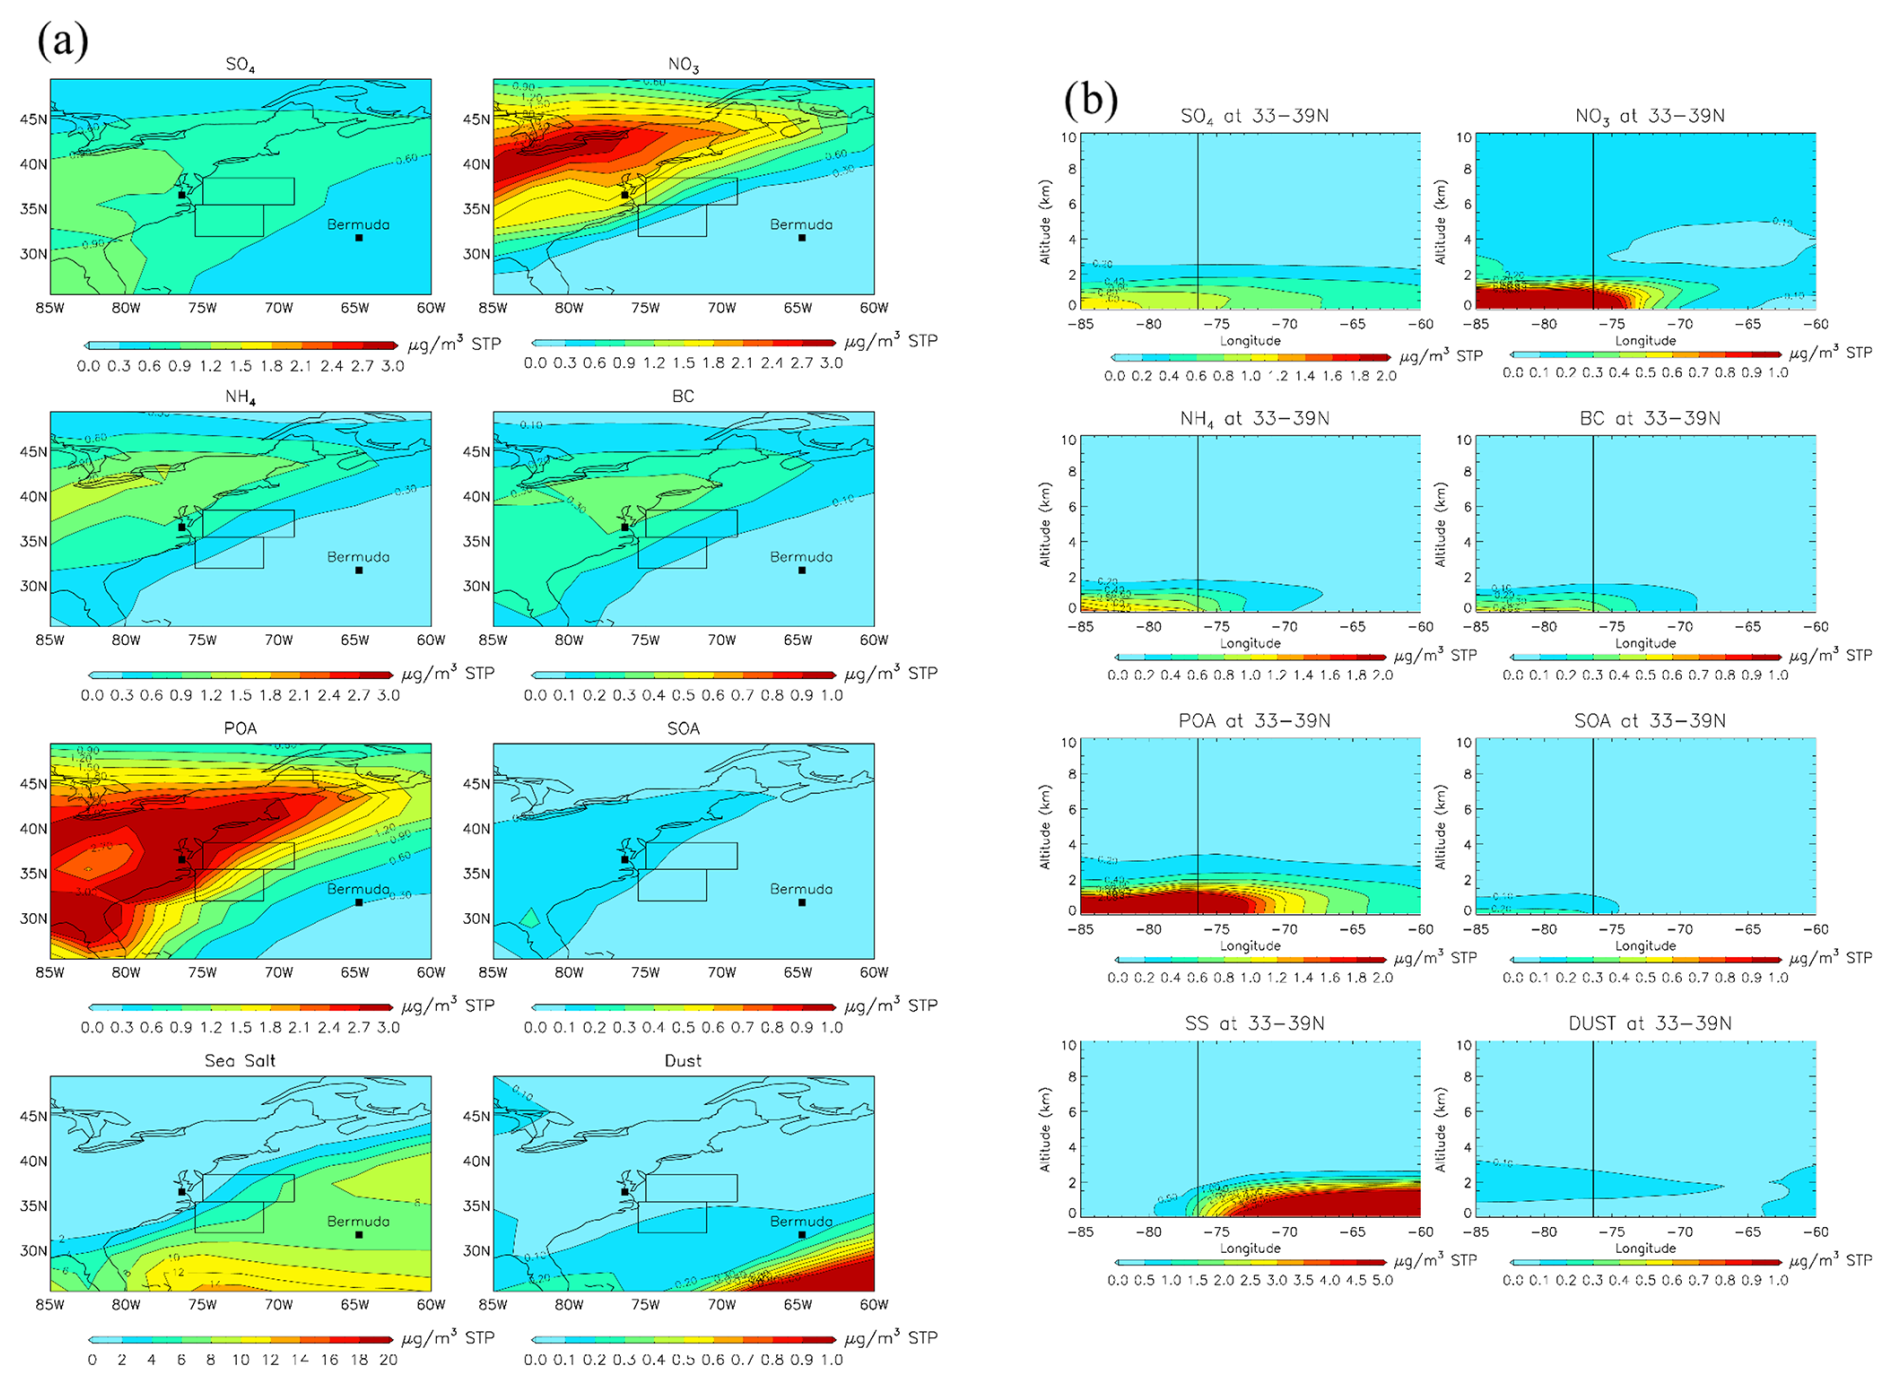
Figure 5Model-simulated concentrations of sulfate–nitrate–ammonium (SNA), black carbon (BC), primary organic aerosol (POA), secondary organic aerosol (SOA), sea salt, and dust averaged over the period of 14 February–12 March 2020. (a) Map plots at 929 hPa; (b) longitude–altitude cross-sections averaged over 33–39° N. Note different color scales among panels. Rectangles are the main areas sampled by aircraft during ACTIVATE 2020. The locations of LaRC and Bermuda are marked by black squares. The vertical lines in panel (b) indicate the longitude (76.4° W) of LaRC.
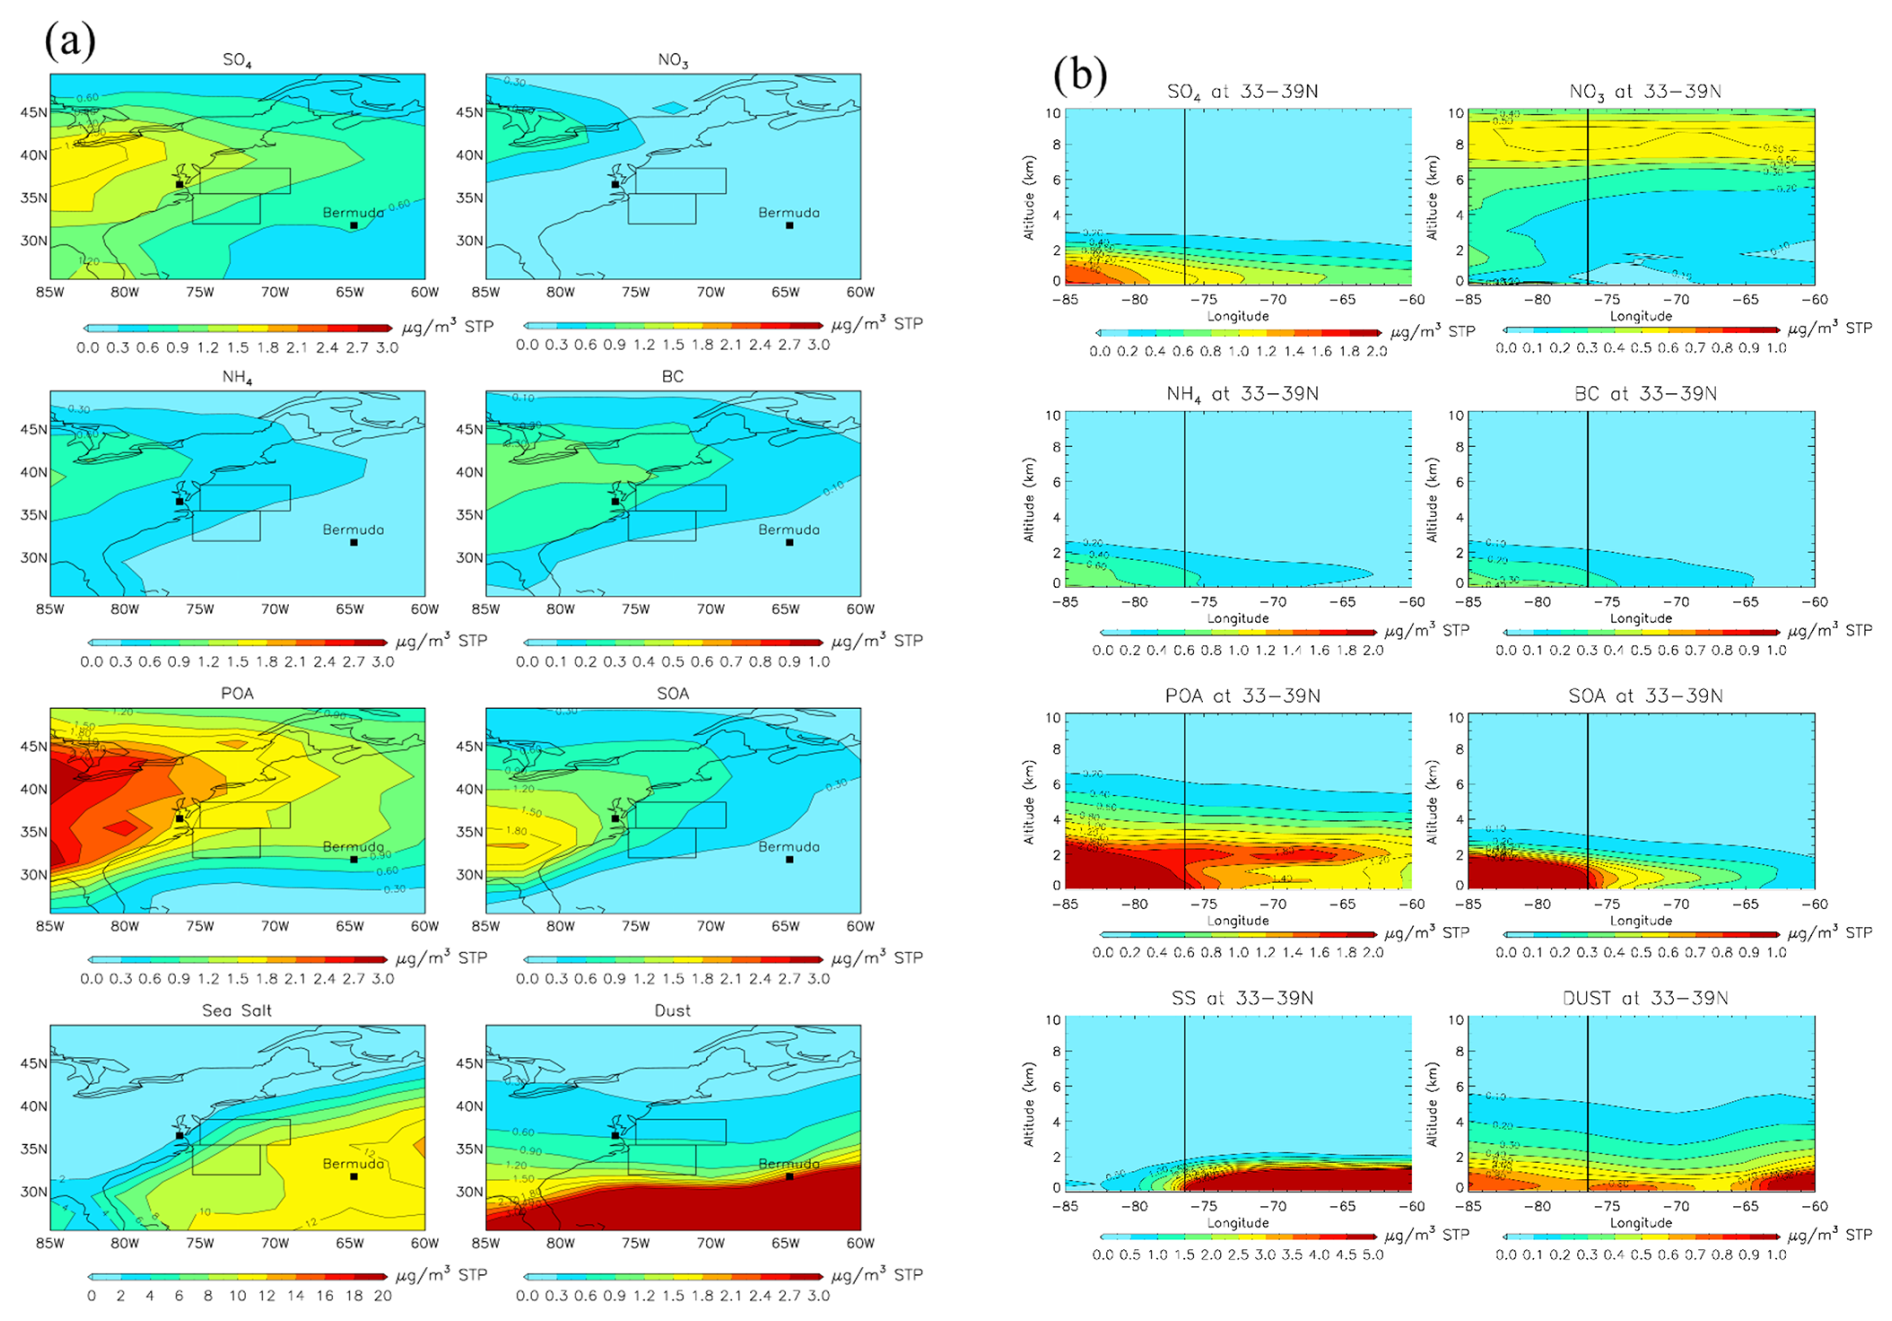
Figure 6Same as Fig. 5 but for 13 August–30 September 2020.
Figure 6 shows the same plots as in Fig. 5 but for 13 August–30 September 2020. Sulfate concentrations in the BL increased significantly relative to winter because of stronger production of sulfate from oxidation of SO2 in summer. The stronger west-to-east gradient in sulfate concentrations was mainly due to the southwesterly winds along the shore associated with the Bermuda High as well as the lack of cold front passages as midlatitude cyclones shift to higher latitudes in summer. Nitrate concentrations in the BL decreased substantially due to higher temperatures that limit particle-phase ammonium nitrate (a major chemical form of nitrate associations) as well as the competition for ammonium by more sulfate. The simulated high nitrate concentrations in the upper troposphere between 33–39° N are presumably from lightning NOx emissions. The spatial pattern of BC concentrations over land is consistent with a major source from the western US BB in summer (versus primarily from anthropogenic emissions in winter). However, BC remains a small contribution to the outflow of aerosols. POA concentrations are high in the BL, albeit lower than in winter, with a peak in the lower free troposphere (at ∼ 2 km altitude) over the WNAO. Its primary sources are North American BB and anthropogenic emissions. Much higher SOA concentrations reflect the larger production from strong oxidation of biogenic VOCs from the southeast US in summer. The vertical extent of the major North American continental outflow aerosols was significantly higher than that in winter, reflecting the impact of summertime convective lifting. BL sea salt concentrations increased in summer over the WNAO, especially from the ACTIVATE flight areas to Bermuda, because of stronger winds during two weather events (Sect. 3). Dust amounts also significantly increased because of long-range transport of dust emissions from North Africa. It is noted that African dust can be transported to the Gulf of Mexico and then northward to the eastern US, as shown by enhanced dust concentrations in the BL between 80–85° W (dust vertical cross-section, Fig. 6).
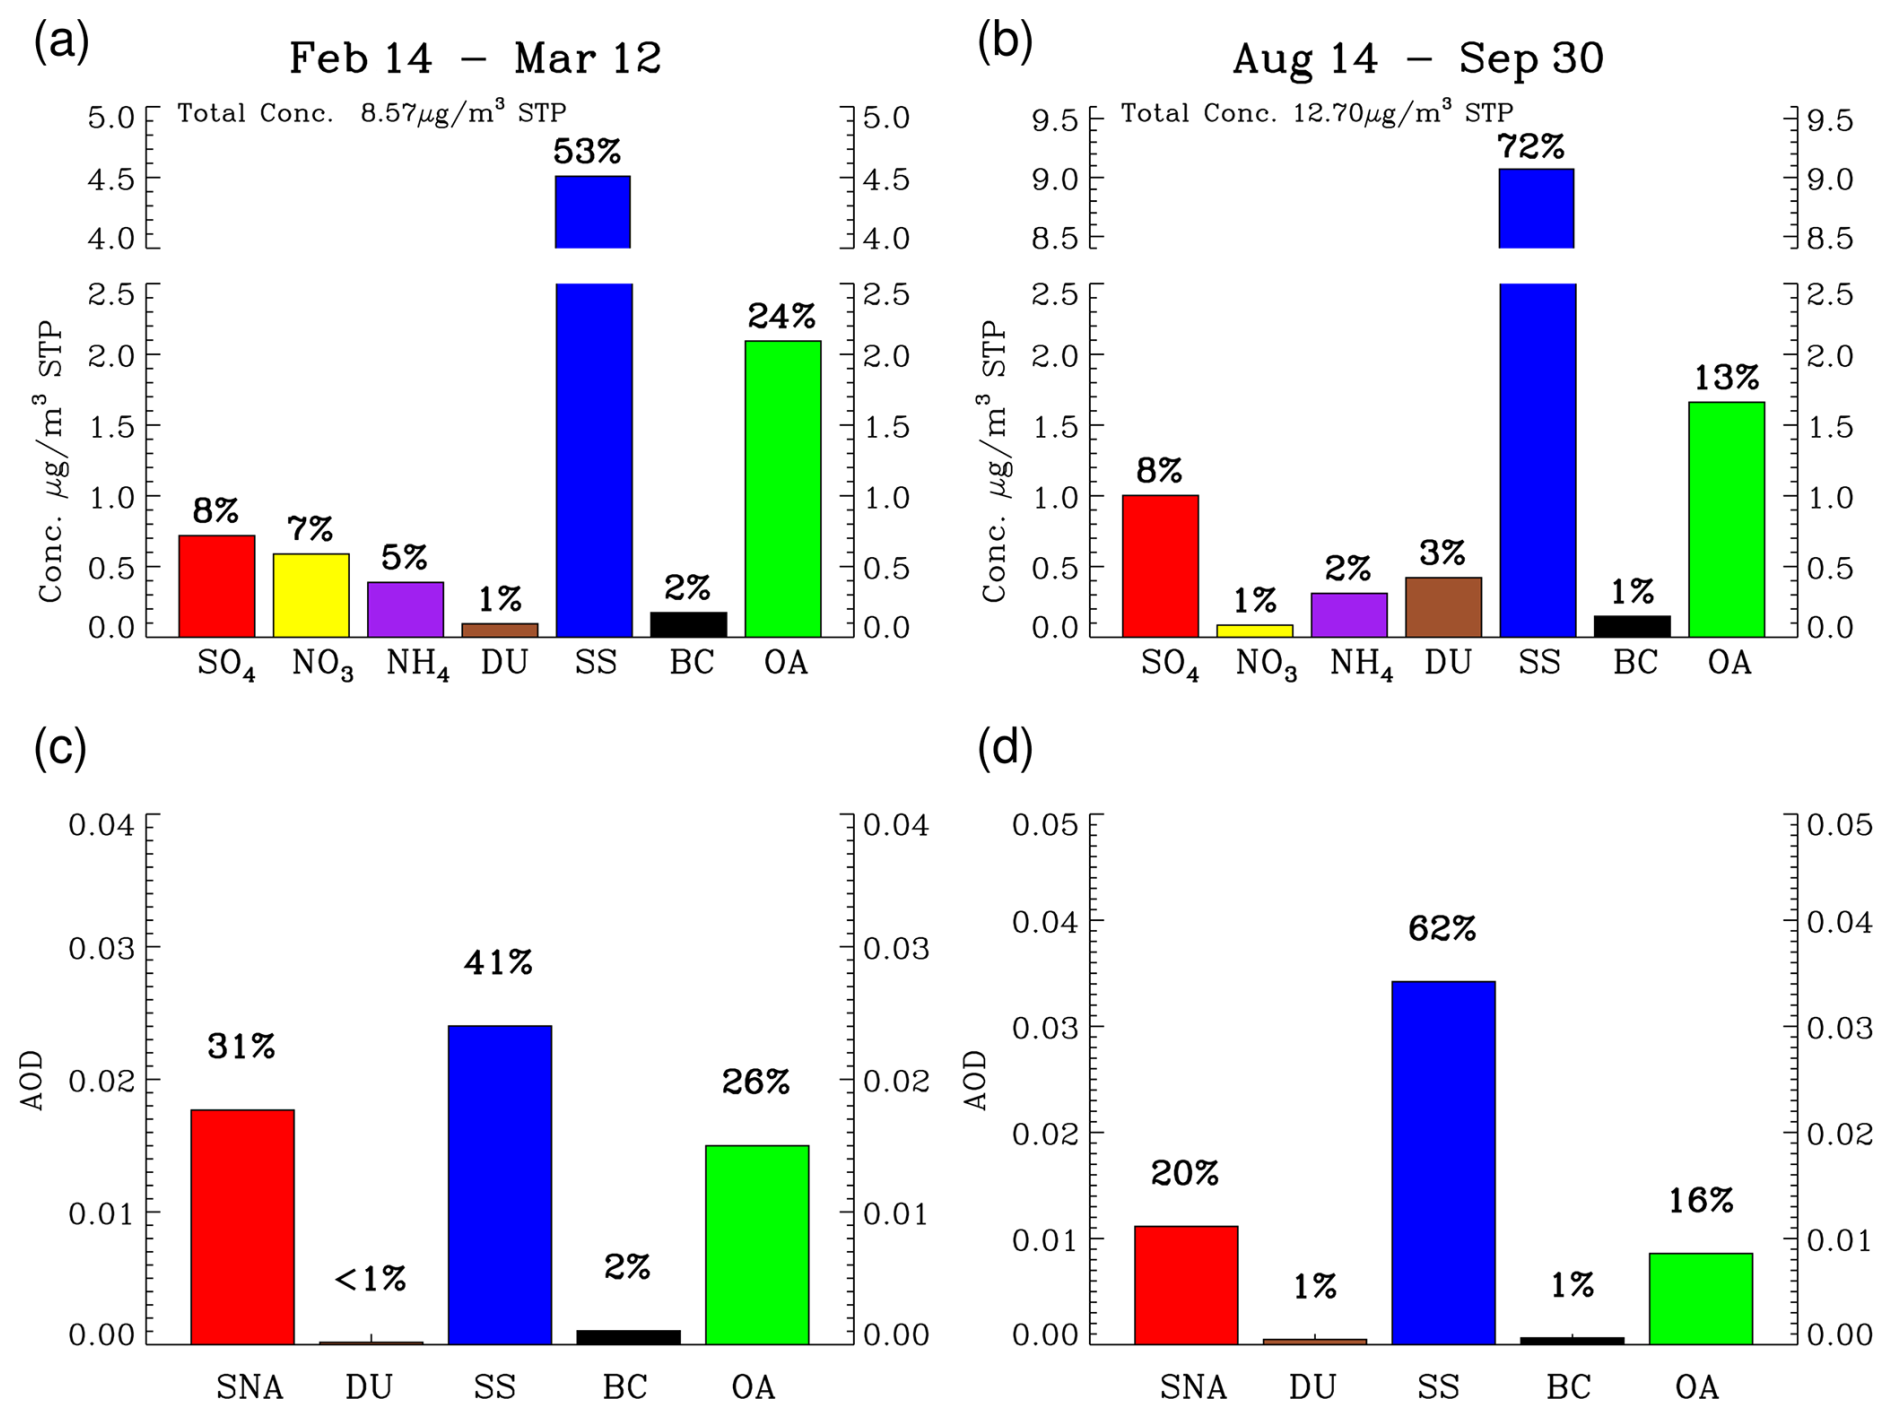
Figure 7Model-simulated mass concentrations (µg m−3 STP; a, b) and speciated (sulfate, nitrate, ammonium, dust, sea salt, black carbon, and organics) AOD in the boundary layer (c, d) averaged over the flight areas (i.e., N and S in Fig. 1) during 14 February–12 March 2020 (a, c) and 13 August–30 September 2020 (b, d), respectively. Percentages denote the fractions of aerosol species to the total aerosol mass or AOD. Note that the model only calculates a combined AOD for sulfate, nitrate, and ammonium (SNA).
As a summary of model-simulated aerosols, Fig. 7 shows model-simulated mean concentrations (µg m−3 STP) or AODs of each aerosol species (bar graph) and their fractions of the total aerosol mass or AODs (pie charts) for the flight areas (N and S in Fig. 1) over the periods of 14 February–12 March and 13 August–30 September 2020, respectively, during ACTIVATE 2020. Sea salt is a dominant fraction of total aerosol mass in the BL in both winter (53 %) and summer (72 %), followed by organics with 24 % in winter and 13 % in summer. The higher sea salt mass concentration is also the main reason for higher total aerosol mass in summer. The former is ascribed to two events of strong surface winds and high sea salt emissions during 10–12 and 19–22 September (Sect. 3; Fig. 3), despite the lower average surface wind speed over the domain of 32–40° N, 62–76° W, during the summer (1.2 m s−1) vs. winter (3.7 m s−1) deployment. SNA is about 20 % of the total aerosol mass in winter and 11 % in summer. Dust accounts for 1 % in winter and 3 % in summer, with the latter season's increase reflecting more efficient transport from the eastern Atlantic and North Africa by the subtropical trade winds. Sea salt, SNA, and OA are the main contributors to the mean total AOD in the flight areas, with the following percentage contributions: SS, 41 % (winter) and 62 % (summer); OA, 26 % (winter) and 16 % (summer); and SNA, 31 % (winter) and 20 % (summer). The much larger fraction of AOD (versus aerosol mass) from SNA is ascribed to the strong hygroscopic growth of those fine aerosols, similar to OA.
4.2 Model evaluation with aircraft in situ measurements and source analysis
In this section we evaluate model simulations of CO and aerosols with ACTIVATE aircraft in situ measurements. A series of GEOS-Chem experiments with different configurations were performed to investigate the impacts of key aerosol-related processes in the model, including emission sources (anthropogenic, BB, and marine), BB emission injection height, and cloud water content (fixed value vs. MERRA-2, Table 1). Figures 8 and 9 compare model-simulated vertical profiles of CO, SNA, and OA mixing ratios with Falcon aircraft Picarro and AMS measurements during February–March and August–September 2020, respectively. It is noted that the observed profiles above 3 km are probably biased because Falcon aircraft flew below 3 km most of the time. Also shown in the figures are model results from simulations (Table 1) with (1) a fixed value for cloud water content used in aerosol scavenging (fixedCWC), (2) BB emissions injected to the 0-5.5 km altitudes (for August–September 2020 only), (3) anthropogenic (fossil fuel and biofuel) emissions turned off, (4) BB emissions turned off, or (5) marine emissions turned off, respectively. Values (500 m binned) are medians over all flights.
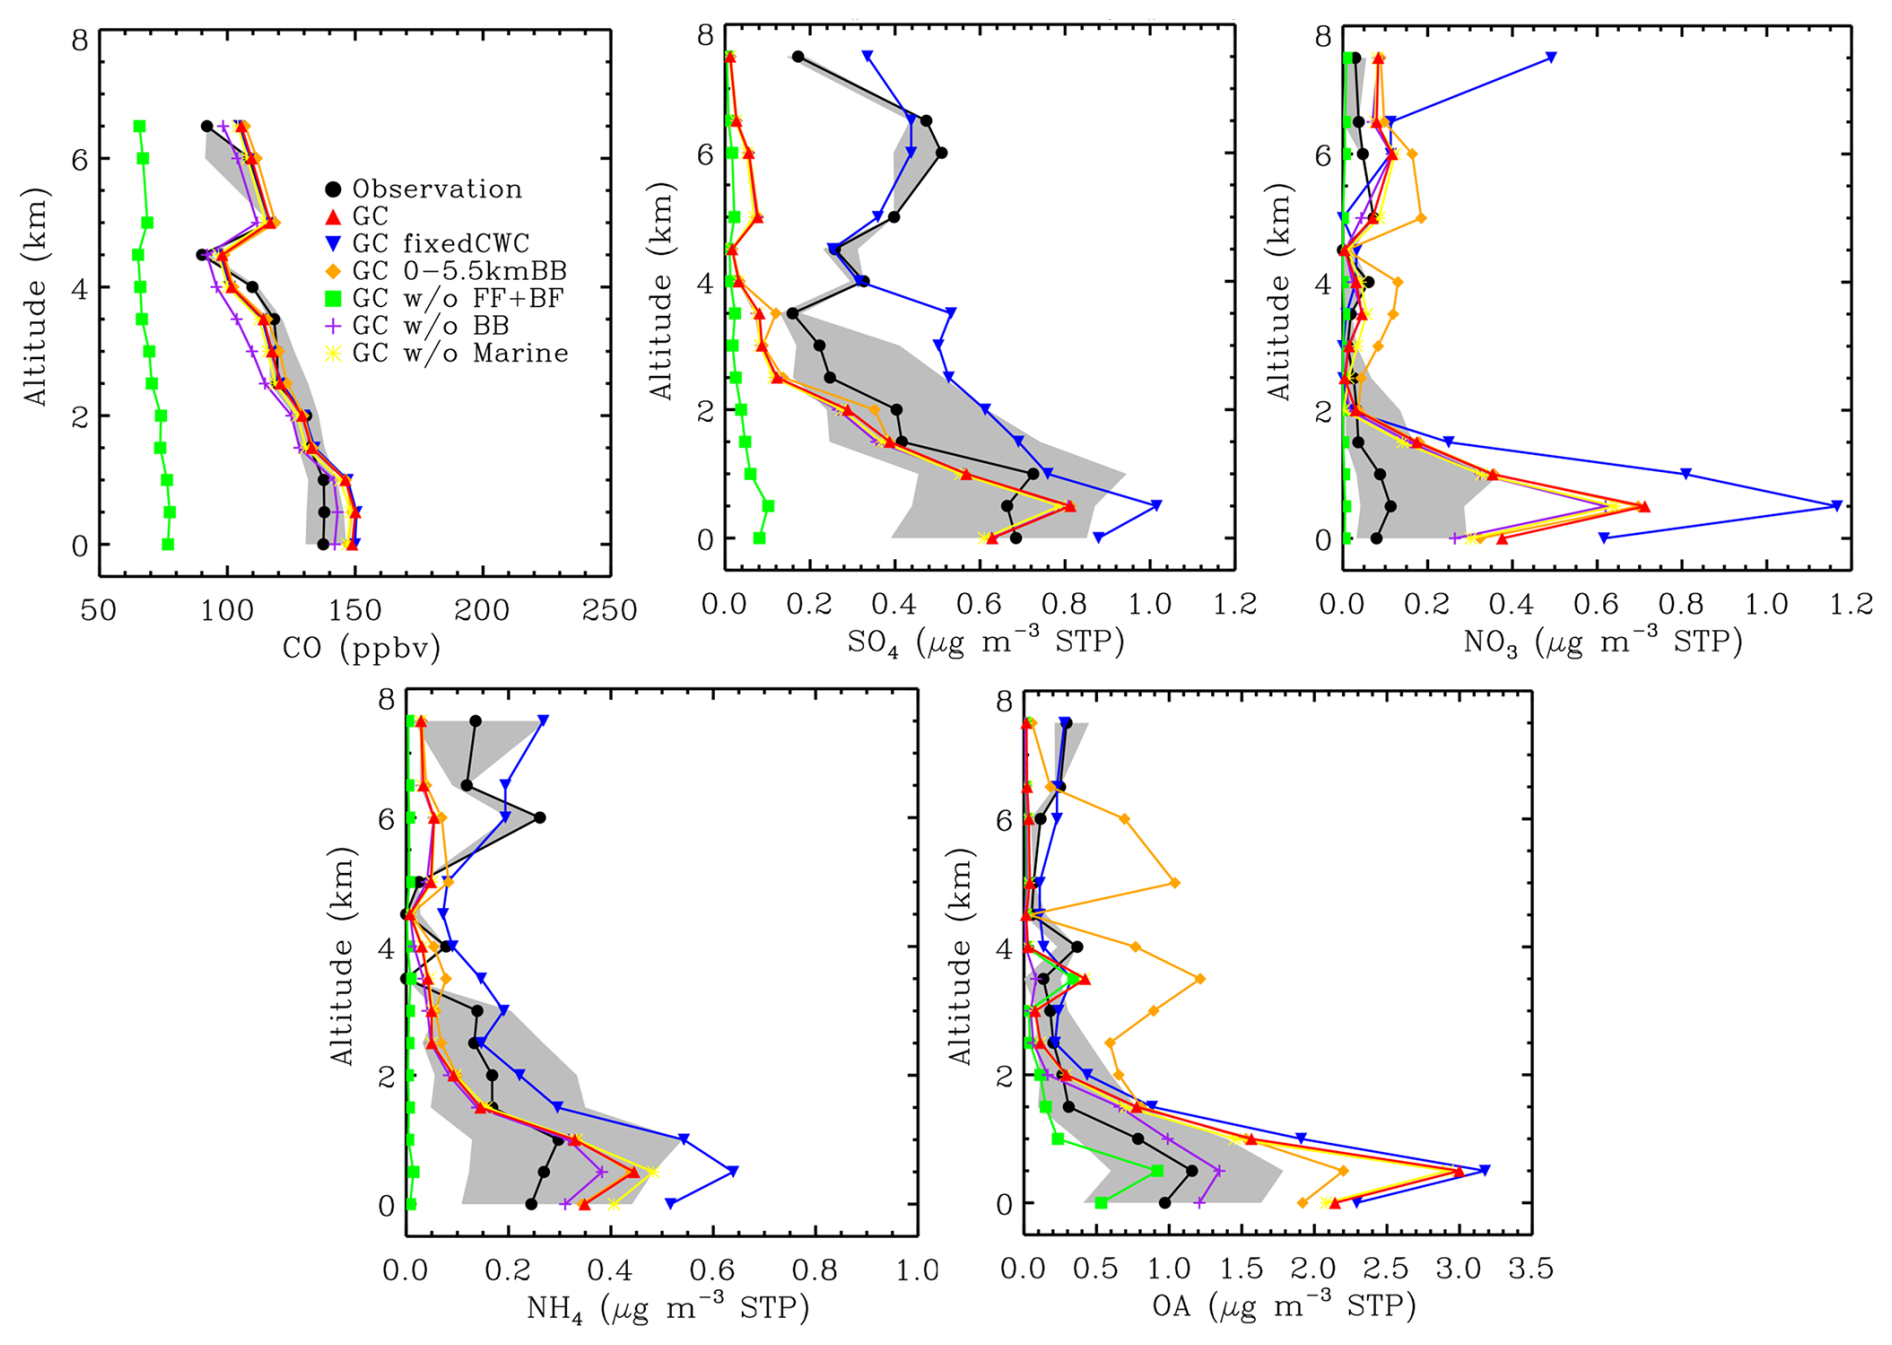
Figure 8Comparison of model-simulated (red) vertical profiles of CO (ppbv), sulfate, nitrate, ammonium, and organic aerosol (OA; µg m−3 STP) mixing ratios with Falcon aircraft measurements (black) during February–March 2020. Also shown are model results from simulations (Table 1) with (1) a fixed value for cloud water content used in aerosol scavenging (fixedCWC), (2) biomass burning emissions injected to the 0–5.5 km altitudes, (3) anthropogenic (fossil fuel and biofuel) emissions turned off, (4) biomass burning emissions turned off, or (5) marine emissions turned off, respectively. An OA OC ratio of 2.1 (Philip et al., 2014) is used to convert simulated OC to compare with AMS OA measurements. Hourly model output was sampled at the time and location of aircraft measurements. Values (500 m binned) are medians over all flights. Gray-shaded areas indicate the ranges of 25th–75th percentiles for the observations.
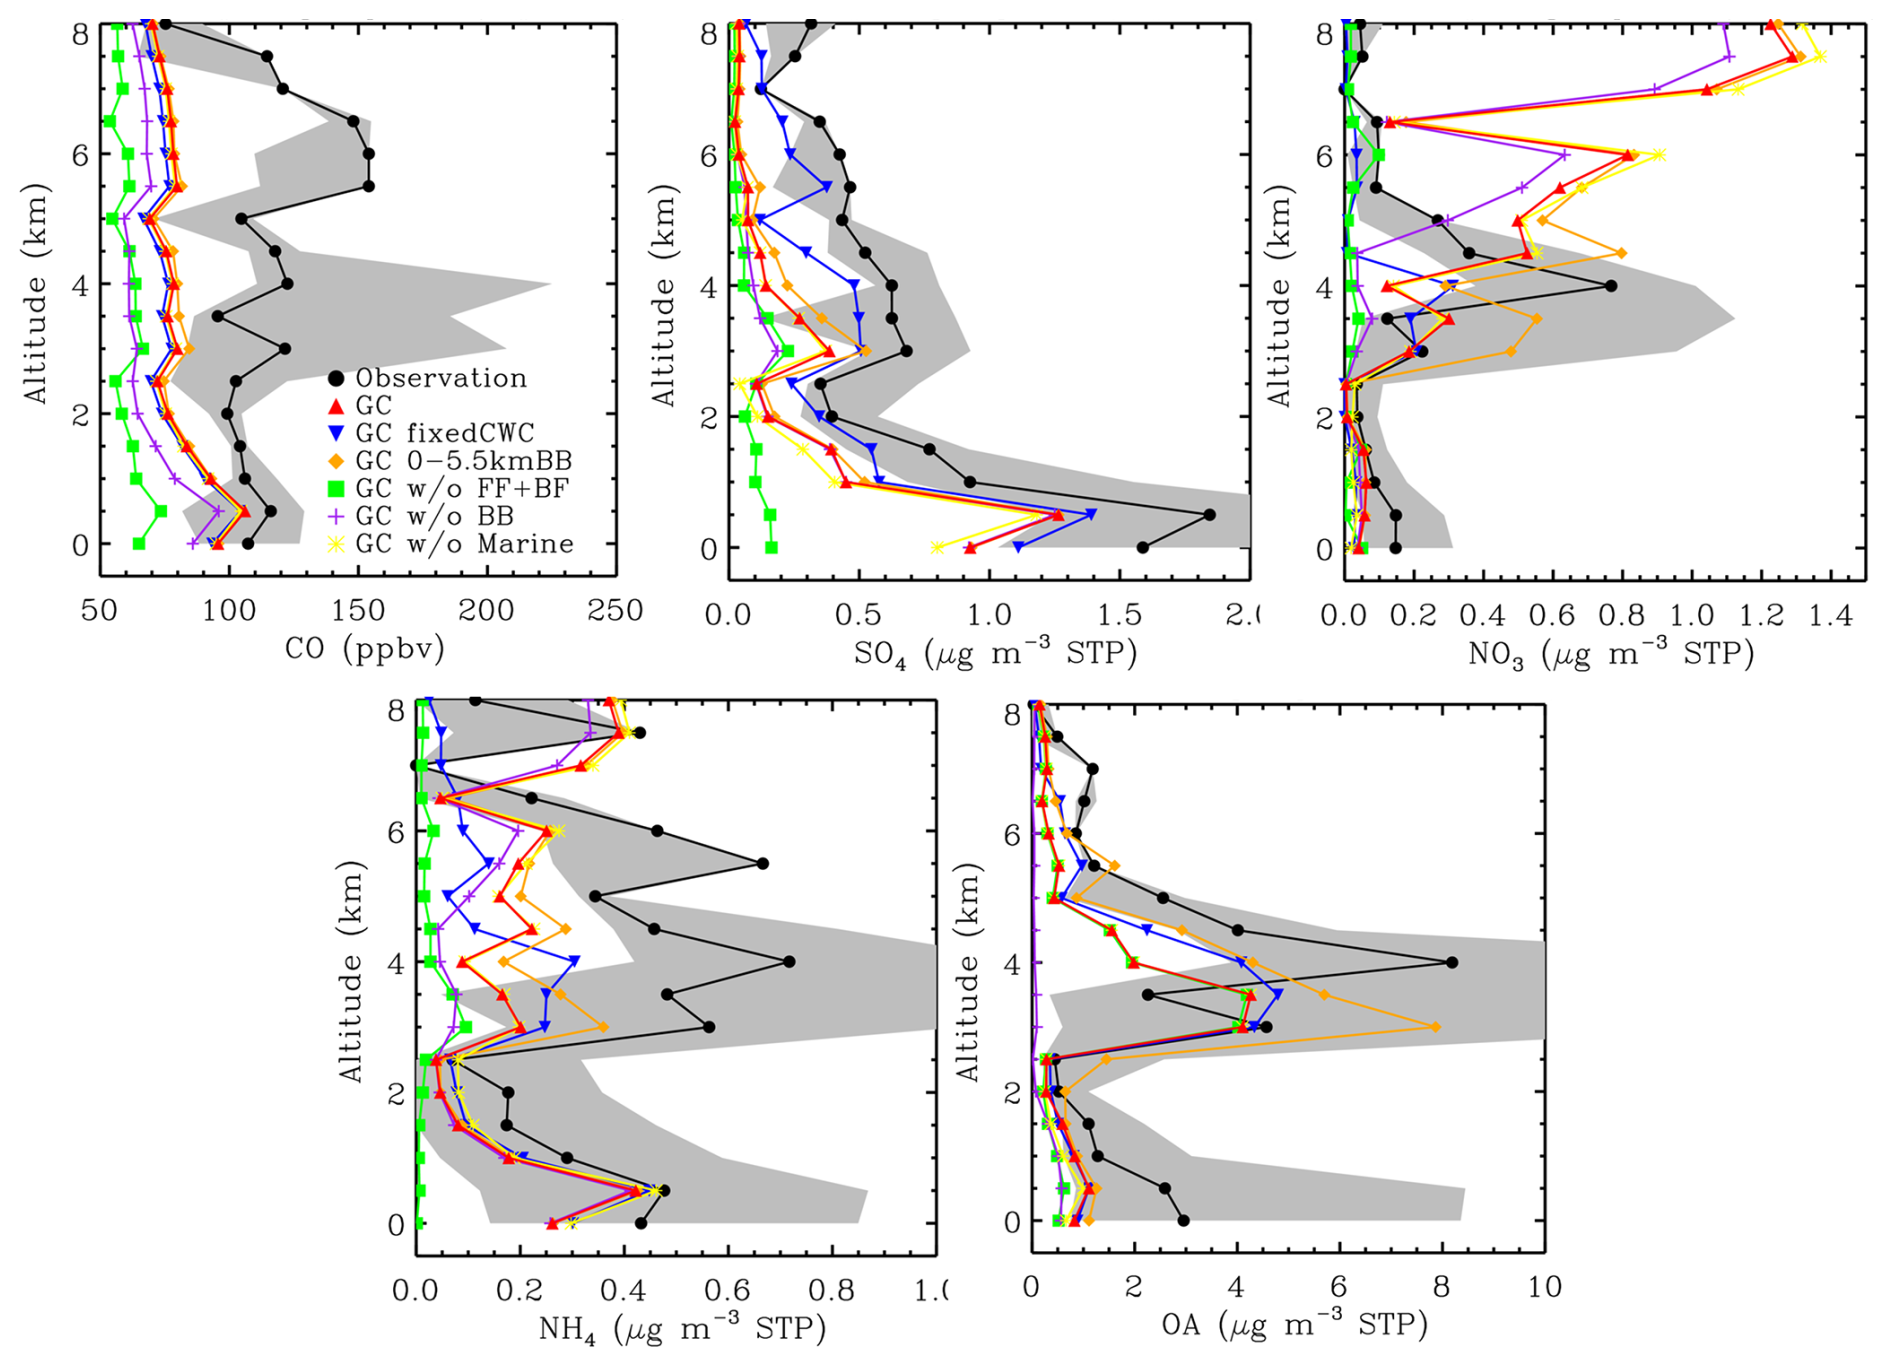
In winter, the aircraft observations showed a decreasing trend of CO, SNA, and OA aerosol concentrations with altitude, with substantially higher concentrations in the BL as part of the strong North American continental outflow of pollution and a sharp vertical gradient at ∼ 1.0 km above the sea surface. The sharper gradient in aerosols than in CO concentrations suggests that aerosols were scavenged during uplifting processes. The simulated profile of CO concentrations is in good agreement with the observations. The model captures the observed sulfate concentrations in the BL but underestimates them in the free troposphere, likely due to uncertainty in the model aerosol scavenging scheme, as discussed below. Simulated nitrate concentrations in the BL are too high compared to observations. The model reasonably captures the vertical distribution of ammonium concentrations, but the vertical gradient in the lower troposphere is too strong. The simulated OA concentrations are biased high in the BL and biased low above ∼ 4 km. The model attributes CO and SNA aerosols mainly to anthropogenic emissions, as indicated by the large reduction in their concentrations compared to the standard simulation (red lines, Fig. 8) when anthropogenic emissions are turned off in the model (green lines, Fig. 8). The model suggests that while both anthropogenic and BB emissions are major contributions to OA in the BL, BB is likely responsible for the OA enhancement at ∼ 4.0 km, for which the model predicted it at a lower altitude (∼ 3.5 km). Injecting BB emissions to the altitude range of 0–5.5 km results in OA peak concentrations (at ∼ 3.5 and ∼ 5.0 km) much higher than observed, suggesting the 0–5.5 km injection height is too high in winter (dark yellow line, Fig. 8). The occurrence of two peaks is likely due to the bifurcation of biomass burning plumes associated with transport in each layer. The effect of marine emissions on SNA and OA is small in the model.
Using the MERRA-2 interactive CWC (versus a fixed value) for the aerosol wet scavenging scheme in the model has a large impact on simulated aerosol profiles over the flight domain. As shown in Fig. 8 (blue lines), using the MERRA-2 CWC enhances aerosol scavenging and results in lower aerosol concentrations in the troposphere. Conversion of cloud water to precipitation is determined by the ratio of rainwater to CWC. Since rainwater uses the same value from MERRA-2, the smaller CWC from MERRA-2 compared to the assumed fixed value (1.0 × 10⁻³ kg m−3, Table 1) results in a faster conversion from cloud water to precipitation. SNA aerosols are affected more compared to OA because they are more soluble. The reduction in sulfate concentrations is substantial, especially in the middle and upper troposphere. The model overestimate of sulfate in the MBL compared to aircraft AMS measurements is corrected by this update in wet scavenging, but simulated concentrations above ∼ 4 km are far too low, suggesting ice scavenging is too fast. This low bias seems not as obvious for nitrate or ammonium, presumably due to the SNA thermodynamic equilibrium where lower sulfate favors more nitrate associated with ammonium in the aerosol phase.
In summer, aircraft-measured CO concentrations showed a relatively weak vertical gradient with much lower concentrations in the BL compared to winter and enhancement layers in the middle and upper troposphere (∼ 3–4 and ∼ 5.5–6.5 km; Fig. 9). The former reflects the shorter CO lifetime in summer, and the latter results from the long-range transport of North American continental pollution as well as the western US fire emissions. Observed sulfate concentrations exhibited a strong vertical gradient with much higher levels in the BL compared to winter along with enhancements at 3–4 km. The generally higher sulfate concentrations throughout the troposphere in summer reflect stronger oxidation of SO2 both in the gas phase and in-cloud (Dadashazar et al., 2022; Tai et al., 2010). The observed nitrate concentrations in the BL have a median value close to that in winter but show much smaller variability. BL ammonium and OA concentrations are substantially higher than in winter. All nitrate, ammonium, and OA observations show large enhancements between ∼ 3.5 and ∼ 5 km.
The model reasonably reproduces the observed CO concentrations in the BL but fails to capture the observations in much of the free troposphere, especially the magnitude of CO enhancements around ∼ 4 and ∼ 6 km (red and black lines, CO panel of Fig. 9). The primary reason for the underestimated CO in GEOS-Chem is likely the model's excessive OH concentrations, which accelerate CO oxidation and reduce overall CO mixing ratios. Jin et al. (2023) also highlighted that GEOS-Chem tends to underestimate concentrations of highly reactive VOCs, which likely contributes to the OH overestimation. In a comparison with airborne observations of wildfire emissions, Carter et al. (2021) found that while the model simulates well aerosol concentrations, the low CO bias suggests potential issues related to the representation of chemical processes in the model. In addition, uncoupled CH4, CO, and CO2 chemistry could lead to the OH biases in GEOS-Chem (Bukosa et al., 2023). Nevertheless, clear reductions of CO in the model simulations without BB or anthropogenic sources suggest both are important sources to CO in summer over the WNAO.
For SNA and OA aerosols, the standard model simulation tends to underestimate the observed concentrations in the BL in contrast to the wintertime (red and black lines, aerosol panels of Fig. 9). The model also underestimates observations in most of the free troposphere, except for nitrate. The observed nitrate and OA layer enhancements between 3–5 km are reasonably simulated, with the OA peak at slightly lower altitude (∼ 3.5 km) and of much lower concentration in the model. On the other hand, the model barely captures the sulfate and ammonium enhancements observed in this layer. All these underestimated enhancements are largely improved or corrected by extending the BB emission injection height from within the BL to 0–5.5 km (dark yellow lines, Fig. 9), suggesting that releasing the BB emissions within the BL significantly limits the long-range transport of fire emissions in the free troposphere. The model simulates nitrate concentrations that are too high in the mid- and upper troposphere (> 5 km). This is presumably due to the large reduction in sulfate resulting from the use of MERRA-2 CWC in the aerosol scavenging scheme (red and blue lines, sulfate panel of Fig. 9). Less sulfate shifts the SNA balance to favor nitrate in the model as more nitrate is retained in the aerosol phase to neutralize ammonium in the SNA system. The model sensitivity experiments suggest that SNA aerosols are predominantly from continental anthropogenic emissions in summer like winter. However, in summer the BB emissions are also important sources of SNA between ∼ 3–6 km. BB is the dominant source of OA (mostly primary) in the free troposphere, whereas BB, anthropogenic, and marine emissions all contribute to OA in the marine BL (with SOA accounting for less than one-third below 1 km). The large model underestimate of OA in the BL is likely due to weak entrainment from the free troposphere, low production of SOA, and/or strong scavenging associated with convective precipitation. The effect of marine emissions on sulfate appears more significant in the BL and lower free troposphere compared to winter, reflecting the stronger oxidation of marine DMS and convective lifting of DMS or its oxidation products (SO2, sulfate) in summer.
4.3 Model evaluation with AERONET AOD measurements
Comparisons of model results with surface aerosol concentration observations from the IMPROVE and CSN networks, aerosol deposition flux measurements from the NTN network of NADP, and satellite AOD measurements from MODIS/Aqua are included in the Supplement (Sect. S3). In this section we evaluate model-simulated AOD with ground-based measurements from AERONET, with a focus on the eastern US coastal region.
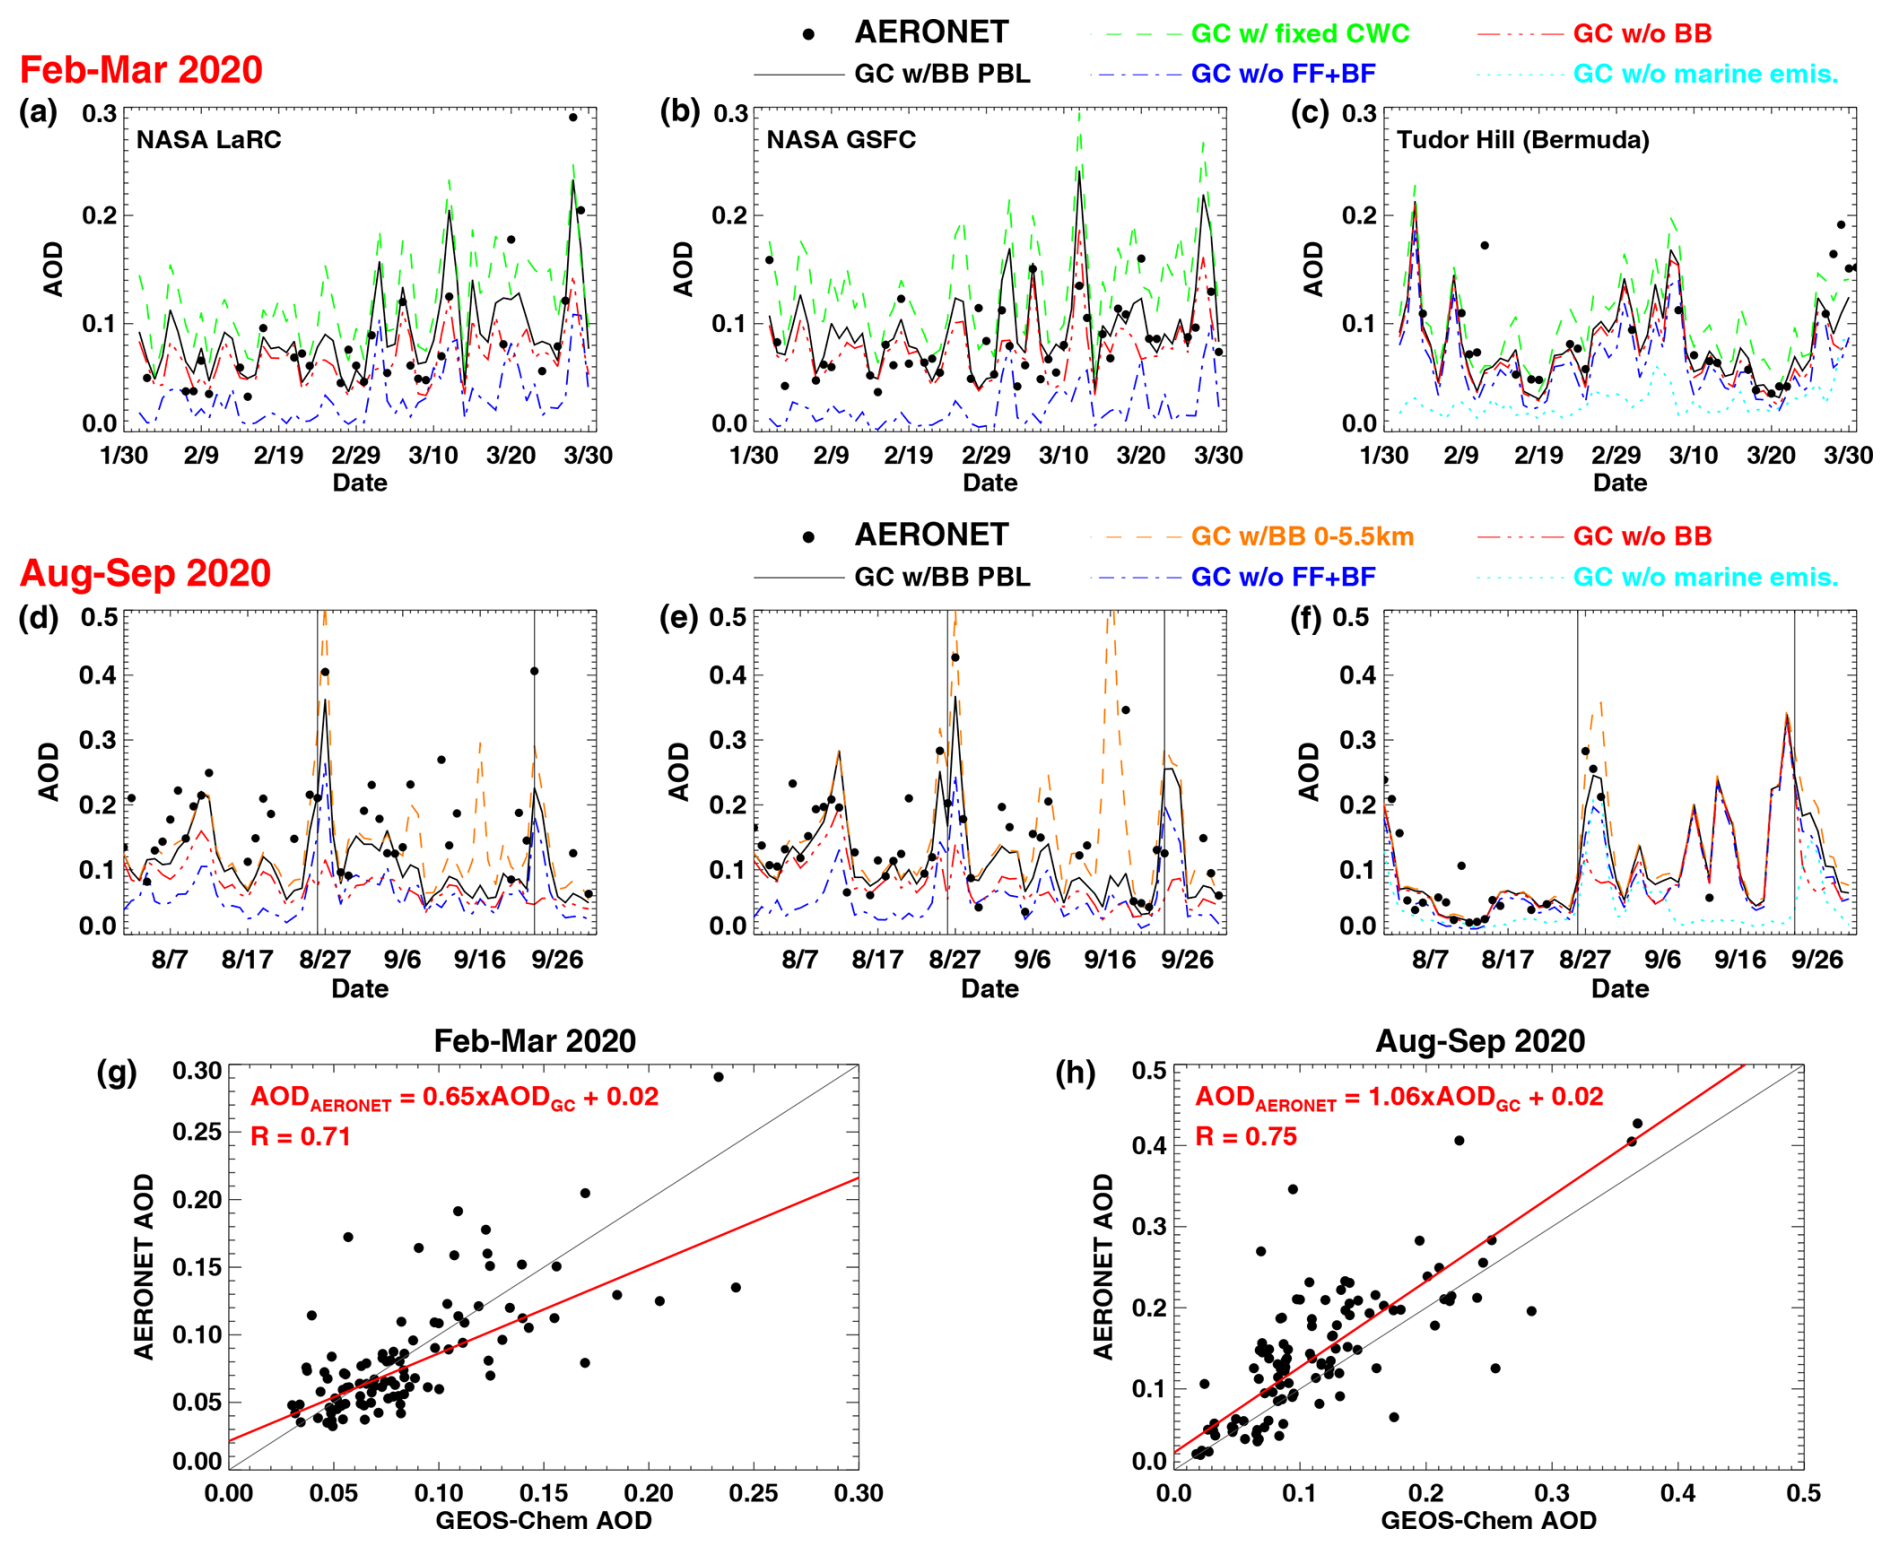
Figure 10(a–f) Model-simulated daily AOD (at 550 nm) versus daily AOD measurements from three AERONET sites (NASA LaRC, GSFC, and Tudor Hill) during February–March 2020 (a–c) and August–September 2020 (d–f), respectively. Shown for model results are the (Table 1) standard (black line), fixedCWC (green line), BB0–5.5km (orange line), noanth (blue line), nobb (red line), and nomari (cyan line) simulations. (g, h) Scatterplots of model AODs from the standard simulation vs. AERONET AODs at the three sites for February–March and August–September 2020, respectively. Red lines are linear regression lines. Gray lines are 1 : 1 lines. Legends show regression line equations and Pearson correlation coefficients (R). For August–September 2020, six very large AERONET AOD values (0.8–1.1), for which the model failed to capture (< 0.1), are excluded in the analysis.
Continuous measurements of AOD from AERONET are used to evaluate the model performance in reproducing the observed AOD magnitude and temporal variability as well as long-range transport of aerosol plumes. Figure 10 shows model-simulated daily AOD (at 550 nm) versus daily AOD measurements from two AERONET sites (NASA LaRC and NASA GSFC) in the eastern US and one site (Tudor Hill) located at Bermuda over the Atlantic Ocean during February–March and August–September 2020, respectively. Model results are from the (Table 1) standard, fixedCWC (for winter only), BB0–5.5km (for summer only), noanth, nobb, and nomari simulations, respectively. Also shown in the figure are scatterplots of model AODs from the standard simulation versus AERONET AODs at the three sites for winter and summer, respectively. In winter, AERONET AODs at LaRC and GSFC show large day-to-day variability with an increasing trend towards early spring. Those at Tudor Hill exhibit smaller day-to-day variability but much larger variability on a weekly timescale. The standard model simulation (black lines) reproduces the observations at the sites reasonably well. Using a fixed value for CWC in the wet scavenging scheme (green lines) significantly degrades the model performance. Comparisons between the standard and sensitivity simulations suggest that AODs at LaRC and GSFC are mainly attributed to anthropogenic emissions. Contributions from BB emissions are significant and may become comparable to anthropogenic contributions in some days. AODs at Tudor Hill are mostly ascribed to marine (sea salt) emissions but are also affected by anthropogenic emissions, presumably from North America. In summer, AERONET AODs at LaRC and GSFC indicate even larger day-to-day variations with larger maximum AODs (∼ 0.3–0.4) compared to winter (∼ 0.2–0.3). The minimum AODs tend to decrease with time. At Tudor Hill, AERONET AODs indicate high values (∼ 0.2–0.3) in early and late August (data not available for most of September at the time of this study). AERONET AODs at all three sites clearly identify two extremely large AOD events close to 26 August and 23 September; the western US fire smoke associated with these events was also observed by aircraft during ACTIVATE (Sect. 4.4; Mardi et al., 2021; Corral et al., 2022). The standard model (black lines) reproduces the decreasing trend of minimum AODs at LaRC and GSFC but largely underestimates the magnitude of AODs at LaRC with better performance at GSFC. The BB0–5.5km simulation (orange lines), where BB emissions are injected between 0–5.5 km, significantly improves the model's capability of capturing the large-AOD events, especially at GSFC. Comparison between the standard and sensitivity model simulations suggests that while AODs are often attributed to anthropogenic (and BB to a lesser extent) sources, BB emissions are mainly responsible for the large-AOD events on or around 26 August and 23 September. For the 26 August event, the large reduction in model AODs when BB emissions are turned off indicates that the transport of the western US fire smoke plumes to Tudor Hill is successfully captured by the model. The model attributes the observed large AODs in early August to long-range transport of dust from northern Africa. However, most of the time AODs at Tudor Hill are mainly due to marine (sea salt) emissions. The above analysis suggests that GEOS-Chem-simulated AODs and their variability in the WNAO region are reasonable.
4.4 Model evaluation with aerosol extinction profiles from aircraft HSRL-2 lidar and CALIOP/CALIPSO satellite retrievals
The NASA LaRC HSRL-2 lidar instrument on the King Air aircraft measured aerosol extinction profiles in the same vertical column as the Falcon in situ measurements in the BL in a coordinated manner, during 17 out of 17 and 17 out of 18 joint flights of the 2020 winter and summer deployments, respectively. On the other hand, the CALIOP instrument on the CALIPSO satellite provides remote sensing measurements of aerosol extinction over the WNAO from space, including three overpasses for which the two ACTIVATE aircraft performed under-flights during the 2020 summer deployment. In this section, we evaluate model-simulated aerosol extinction profiles with HSRL-2 lidar and CALIOP/CALIPSO satellite retrievals, characterize aerosol extinction vertical distribution, and examine potential sources and processes responsible for aerosol extinction enhancements. Case studies of land–ocean horizontal gradient of aerosol extinction, SNA and sea salt aerosol mixing, and long-range transport of the western US fire smoke to the ACTIVATE study domain in summer 2020, as observed by HSRL-2 and CALIOP, are also given.
4.4.1 HSRL-2 and CALIOP
Figure 11 compares model-simulated aerosol extinction profiles (550 nm, red lines) with aircraft HSRL-2 lidar measurements (532 nm, black lines) averaged over 17 HSRL-2 flights during the 2020 winter and summer deployments, respectively. Also shown in the figure are results from model simulations with different injection heights for BB emissions (Table 1). Hourly 3-D model output was sampled at the time and location of each HSRL-2 measurement from 17 (winter) and 17 (summer) flights, respectively. In winter, HSRL-2 observed high aerosol extinction near the surface in the marine BL, which reflects North American BL outflow of aerosols to the WNAO (Sect. 3), and rapid decreases in aerosol extinction with increasing altitude. A layer of aerosol extinction enhancement was observed at ∼ 2.5 km altitude. The model largely overestimates extinction in the BL and underestimates it in the free troposphere, resulting in a much sharper gradient between the BL and above (red line). Note that on the other hand the model significantly underestimates monthly mean AOD relative to MODIS/Aqua measurements in winter (Fig. S4). This discrepancy between HSRL-2 and MODIS measurements likely reflects the sampling differences; for instance, many of the HSRL-2 flights occurred during cloudy conditions when MODIS would not be able to measure AOD, while HSRL-2 may still be able to measure aerosol extinction between gaps in clouds. Increasing the injection height of BB emissions in the model improves the simulation of the vertical gradient because of directly putting part of the emissions in the free troposphere. However, the model is not able to reproduce the layer of aerosol extinction enhancement at ∼ 2.5 km, suggesting vertical lifting is probably too weak in the model in the wintertime. As shown below, this aerosol enhancement layer is also observed by CALIOP. In summer, the standard model (red line) simulates the BL aerosol extinction reasonably well but fails to capture the large extinction around 5 km as observed by HSRL-2. Increasing the injection height of BB emissions in the model to 0–5.5 km (green line) or 2–10 km (blue line) results in much higher aerosol extinction at ∼ 5 km, which is still lower than the mean observed value by a factor of > 2. However, the latter is weighted towards the extremely high aerosol extinction at ∼ 5 km observed by HSRL-2 on 15 and 22 September 2020, which will be discussed later in Fig. 16.
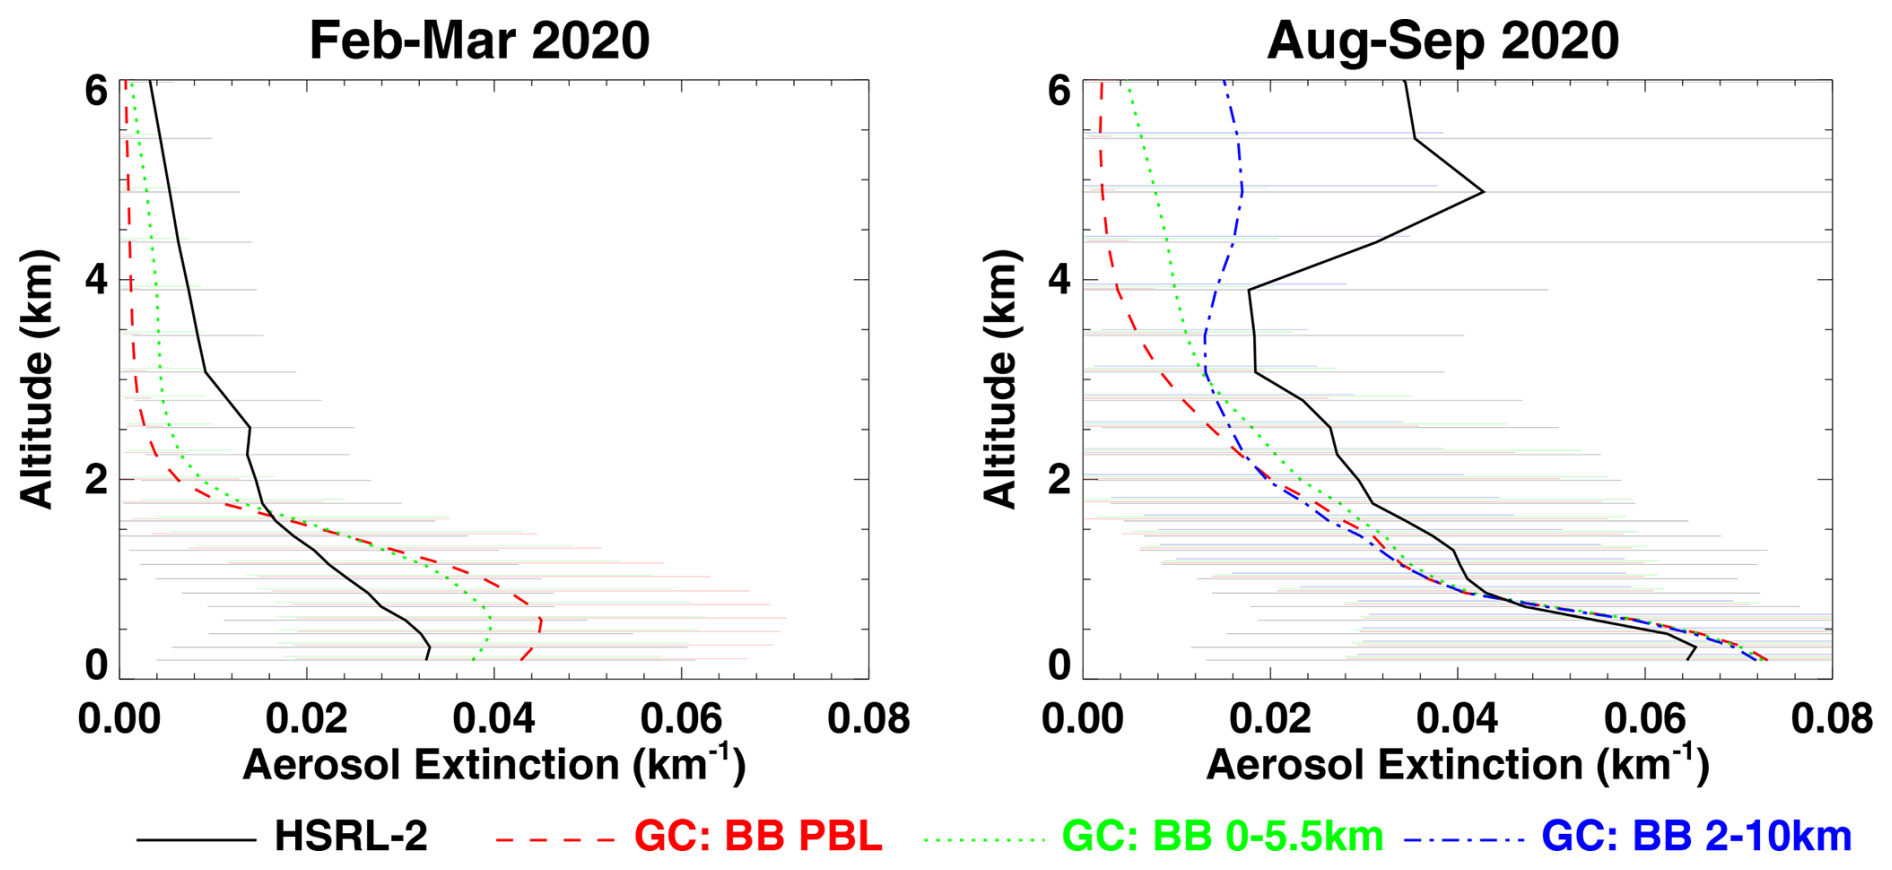
Figure 11Comparisons of model aerosol extinctions (550 nm) with aircraft HSRL-2 lidar measurements (532 nm) averaged over all flights during February–March and August–September 2020, respectively. Biomass burning emissions are injected into the planetary boundary layer (BB PBL), into the 0–5.5 km altitude interval (BB0–5.5km), or into the 2–10 km altitude interval (BB2–10km). See Table 1 for the configurations of model simulations. Hourly model output was sampled at the time and location of lidar measurements. Horizontal lines denote ± standard deviations of observed and simulated aerosol extinctions at model vertical levels.
Figure 12 compares model aerosol extinction (550 nm) vertical profiles with CALIOP measurements (532 nm) averaged over the central WNAO (32–39° N, 78–68° W) subdomain, as defined by Corral et al. (2020), during the 2020 winter and summer deployments, respectively. All ACTIVATE 2020 research flights occurred within the central WNAO. Model output of 01:00–02:00 and 13:00–14:00 LT averages is sampled along the nighttime and daytime CALIPSO orbit tracks, respectively. The right column shows the model speciated aerosol extinction profiles corresponding to the sampled total aerosol extinction profile on the left column. In winter, CALIOP observations show aerosols are mainly confined to the BL. The observed aerosol extinction reaches a peak of ∼ 0.05 km−1 at ∼ 0.5–1.0 km altitude and exhibits layers of enhancements in the free troposphere (e.g., ∼ 2.5 and ∼ 4–6 km; note the BL top < 1.6 km, Fig. 2). The peak at ∼ 2.5 km is consistent with the HSRL-2 aerosol extinction enhancement at this altitude, as mentioned above (Fig. 11). The model captures the decreasing trend of aerosol extinction with altitude but underestimates it in the free troposphere, where aerosol wet scavenging is too fast in the standard model (Sect. 4.2 and Fig. 8). Simulated speciated aerosol extinction values suggest sea salt contributes the most to BL aerosol extinction, while SNA and OC contributions are comparable.
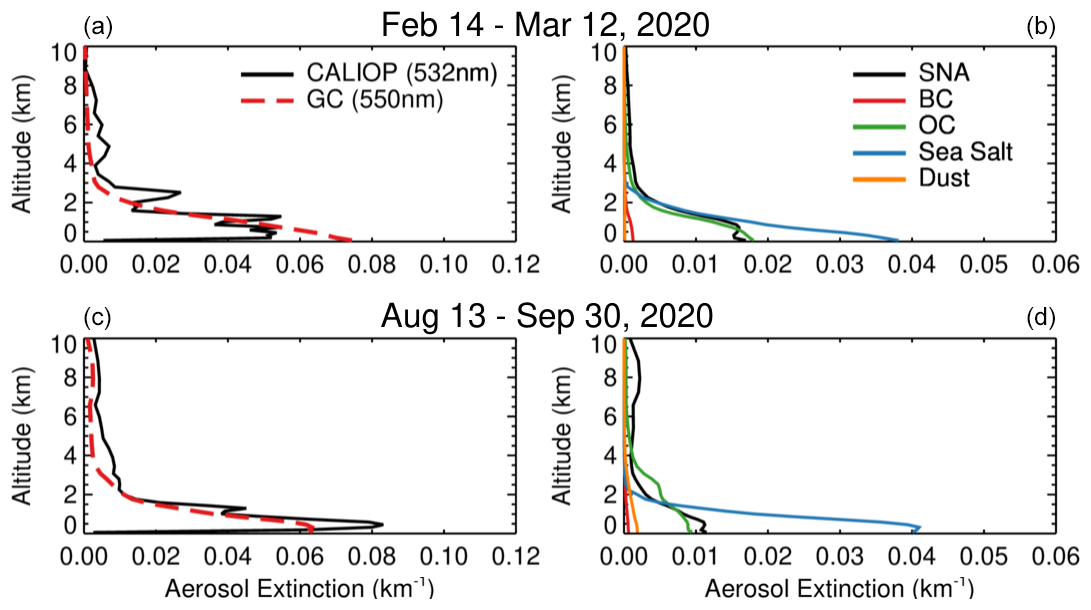
Figure 12(a, c) Comparison of model results (550 nm) with vertical profiles of CALIOP aerosol extinction (532 nm) averaged over the central WNAO (32–39° N, 78–68° W) and over the period of 14 February–12 March 2020 (a) and 13 August–30 September 2020 (c), respectively. Model results are sampled along the CALIPSO orbit tracks in the central WNAO domain. (b, d) Model speciated aerosol extinction profiles corresponding to the total aerosol extinction profile in panels (a) and (c). SNA: sulfate + nitrate + ammonium.
In summer, while aerosols are mostly confined to the BL (top < 1 km), a larger fraction of the total AOD is contributed by aerosols in the free troposphere compared to winter (Corral et al., 2020; Fig. 12). The CALIOP aerosol extinction values between ∼ 3–6 km in the central WNAO are not as high as those from King Air HSRL-2 measurements (right panel, Fig. 11), presumably because of the spatiotemporal mismatch between the CALIPSO satellite overpass and King Air HSRL-2 sampling. The CALIOP-observed aerosol extinction peak (∼ 0.08 km−1) at ∼ 0.5 km altitude in the central WNAO is ∼ 60 % higher than in winter, consistent with the model result of more sea salt in summer (Fig. 12; also see Sect. 4.1).
4.4.2 Case studies
Land–ocean aerosol extinction gradient
We present a case where a large horizontal gradient of aerosol extinction from the eastern US coast going eastwards was observed by HSRL-2. Figure 13a shows model-simulated hourly total aerosol extinction at ∼ 1 km altitude over the WNAO during the King Air morning flight (∼ 14:00–17:00 UTC) on 12 March 2020. On the morning of 12 March, King Air conducted a statistical survey flight as well as an ASTER/Terra under-flight. It flew eastwards from LaRC and turned northeastward near the ZIBUT waypoint, and then it flew back via ZIBUT after conducting an ASTER under-flight along ∼ 69.7° W. Figure 13b compares the time–height cross-section of aerosol extinction observed by the King Air HSRL-2 lidar with those of model total and speciated aerosol extinction during the flight.
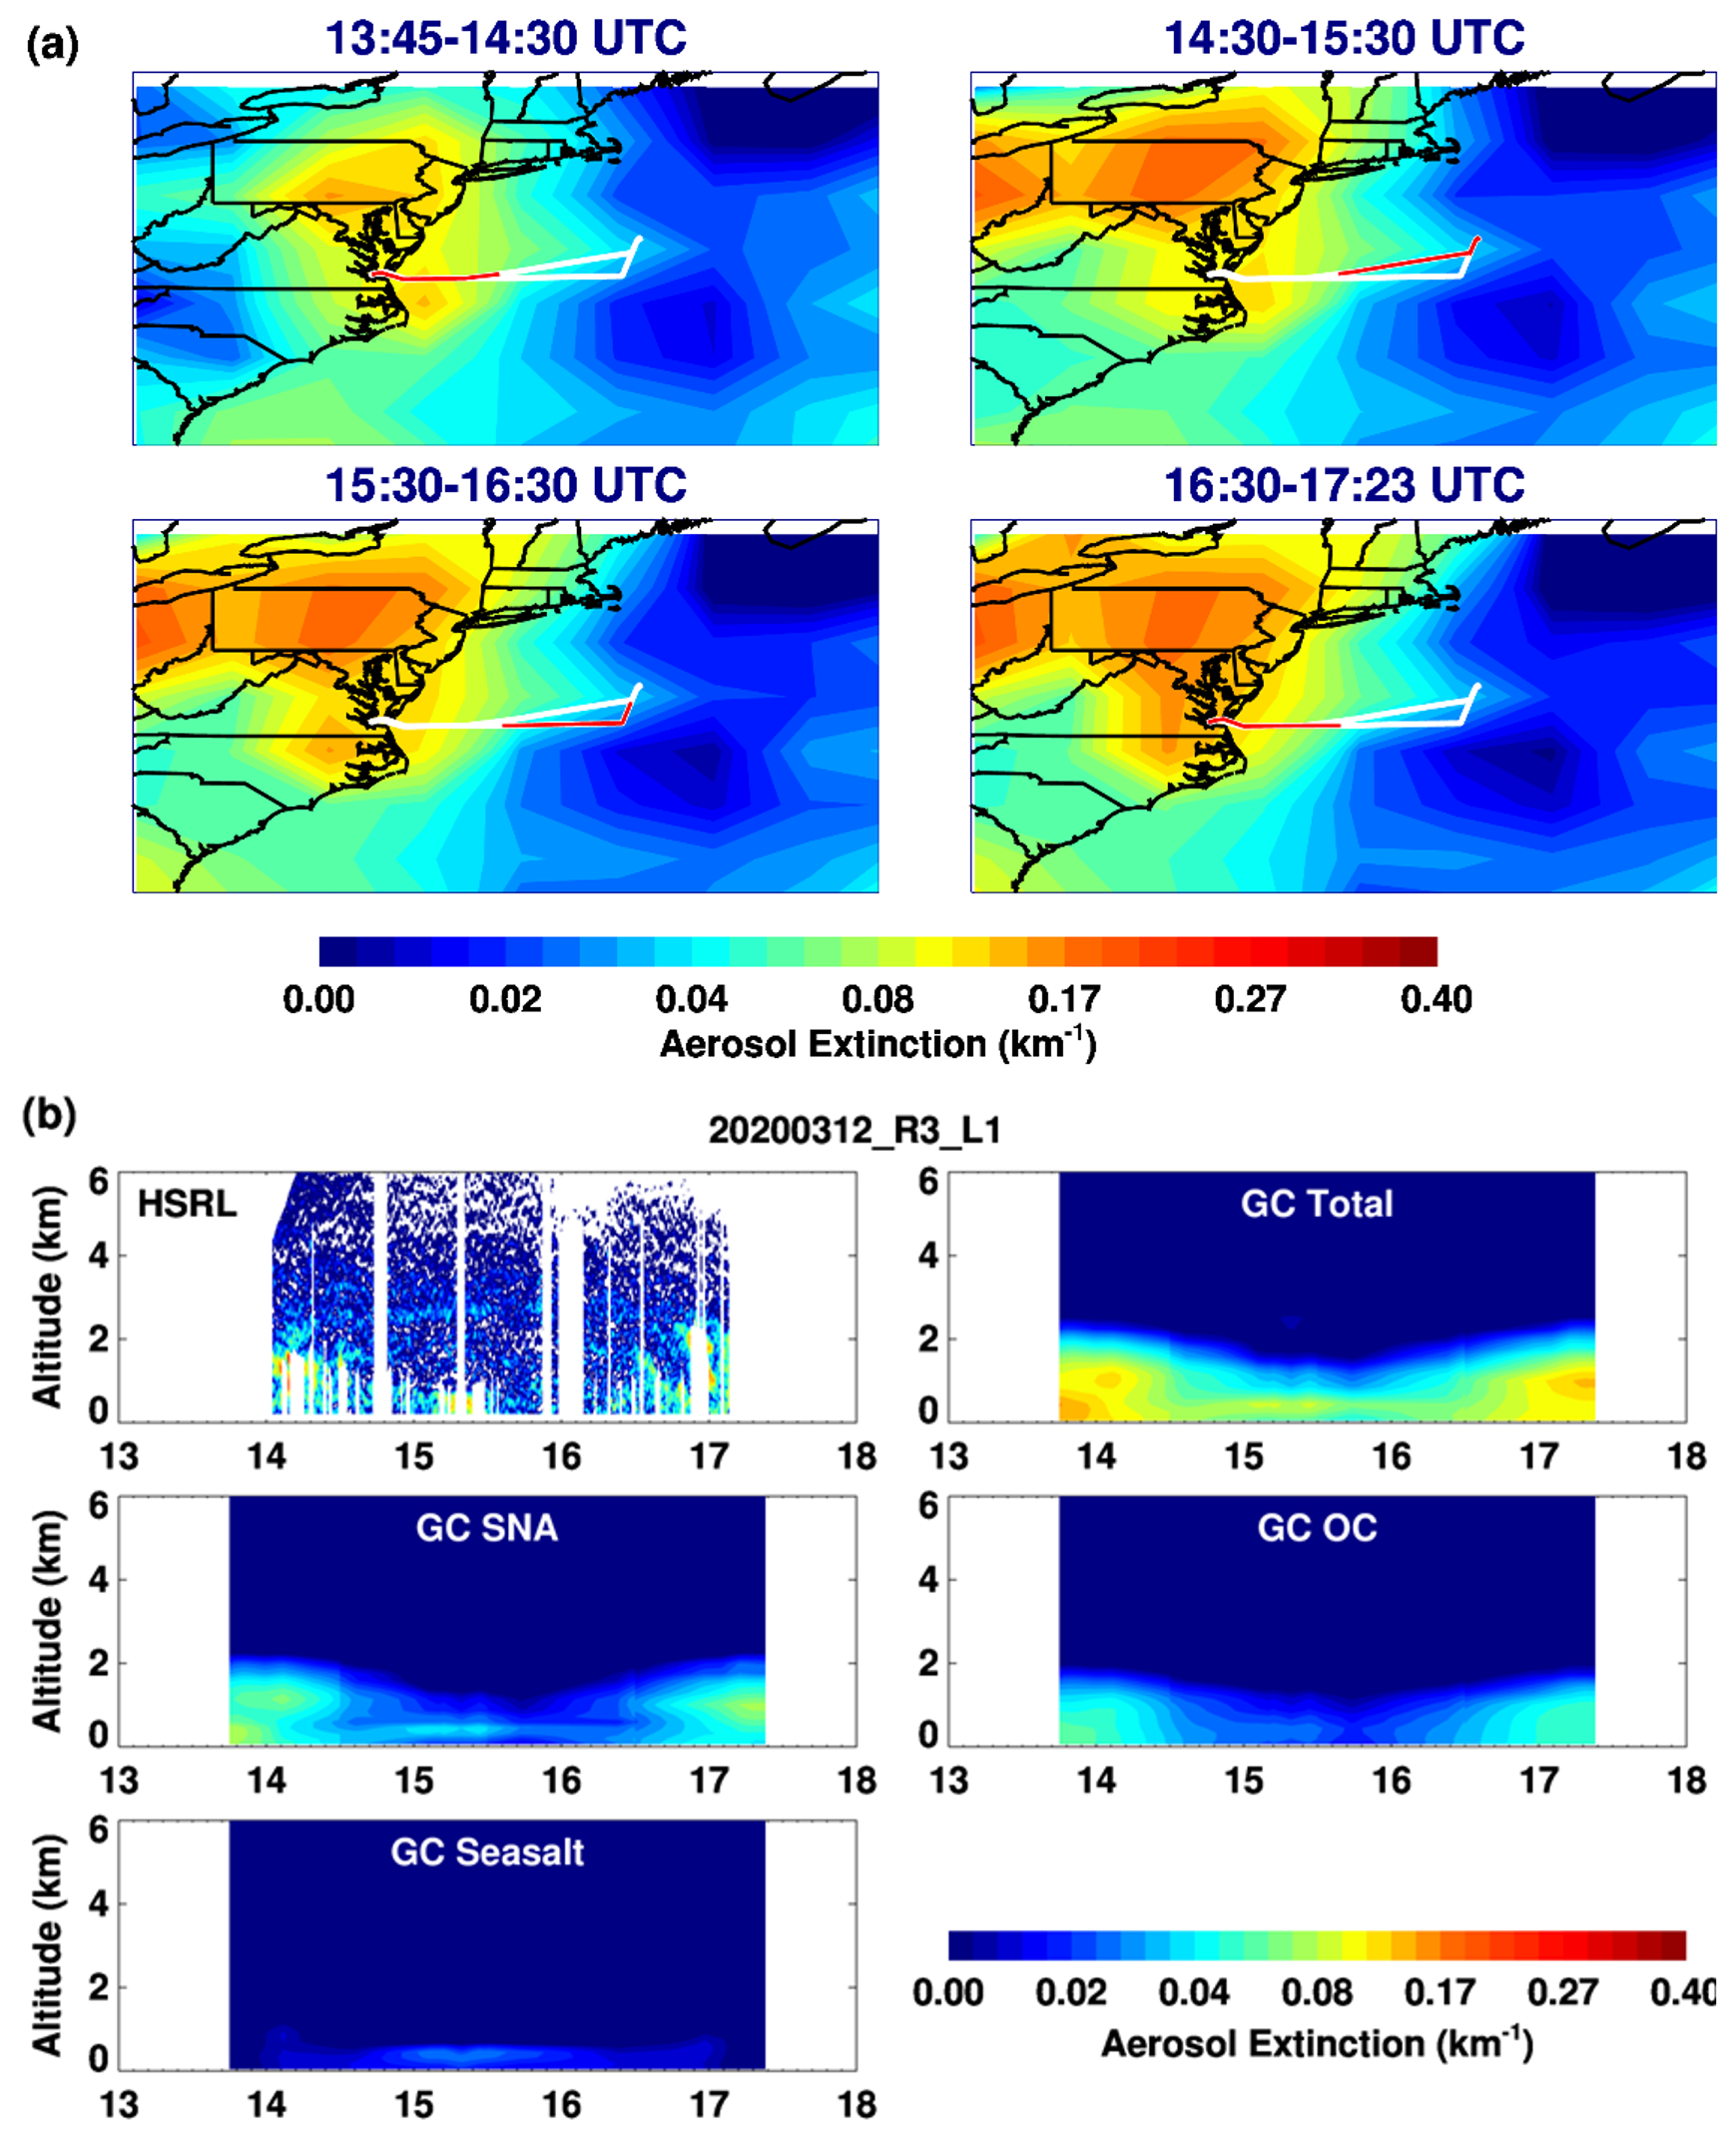
Figure 13(a) Model-simulated hourly total aerosol extinctions at ∼ 1 km altitude over the WNAO during the King Air morning flight (∼ 14:00–17:00 UTC) on 12 March 2020. White lines indicate the complete flight track with overlaid red lines denoting the flight tracks for each time interval. (b) Time–height cross-section of aerosol extinctions observed by aircraft HSRL-2 lidar (532 nm) compared to that of model aerosol extinctions (550 nm) during the morning flight on 12 March 2020. Curtain plots of model speciated aerosol extinctions along the flight track are also shown. BC and dust aerosol extinctions (not shown) are small. SNA: sulfate + nitrate + ammonium.
HSRL-2 observed very high aerosol extinction in the BL over land and off the coast with a decreasing trend toward the marine region. The model captures this trend (Fig. 13a) but generally overestimates BL aerosol extinction (Fig. S6). The HSRL-2 measurements of the general pattern of BL aerosol extinction over land and ocean are very similar to the model result (Fig. 13b). A thin layer of aerosol at 2–3 km seen by HSRL-2 is missing in the standard model simulation. This is likely due to the low injection heights (within BL) of southeast US BB emissions in the model. GEOS-Chem speciated aerosol extinction suggests that SNA and OC are the main contributions over land and off the coast with a similar magnitude of extinction (Fig. 13b). Over the ocean (∼ 14:30–16:30 UTC), SNA, OC, and SS all contribute to the thin aerosol layer close to sea surface with a slightly higher contribution from SNA. The CALIPSO descending swath scanned the WNAO region about 7 h earlier and intersected the flight track almost perpendicularly (Fig. S7a). However, the CALIOP retrieved only low aerosol extinction between 32–40° N (note ∼ 37° N is the King Air flight latitude at 14:00 UTC). This is because the CALIOP laser signal was largely attenuated by the presence of optically thick clouds at these latitudes (Fig. S7b). Indeed, the corresponding model results show high aerosol extinction in the BL along the CALIPSO orbit track. Model-simulated speciated aerosol extinction suggest SNA and OC contribute comparably to aerosol extinction at ∼ 37° N, while sea salt becomes more important towards lower latitudes (Fig. S7b).
SNA and sea salt mixing
We present a case where SNA and sea salt aerosols are mixed as suggested by our model analysis of HSRL-2 and CALIOP observations. Figure 14 presents plots similar to Fig. 13 but for the King Air flight on 6 March 2020, when the King Air conducted a statistical survey flight to the OXANA waypoint and then to a southwest point (32.8° N, 75.2° W) and encountered a high aerosol layer in the marine BL (Fig. 14a). The aircraft returned along the same flight track. HSRL-2 observed enhanced aerosol extinction in the lower troposphere despite missing retrievals for most of the flight period (∼ 18:00–22:00 UTC) due to attenuation by widespread marine stratus clouds (GOES visible image, not shown). The model attributes the observed enhanced aerosol extinction in the BL at ∼ 20:00 UTC to sea salt mixed with SNA aerosols (Fig. 14b). The detachment of the SNA aerosol extinction layer from the sea surface suggests its major source is US continental anthropogenic emissions. GEOS-Chem also simulates high aerosol extinction over the south WNAO region centered near the returning point of the flight. CALIPSO overpassed the same region at the ascending node on the next day, 7 March (Fig. 15a). CALIOP measurements (532 nm) over the WNAO during 18:04–18:06 UTC that day show enhanced aerosol extinction in the lower troposphere (< ∼ 2.5 km) south of 39° N. The model reproduces this enhancement (Fig. 15a) and attributes it mainly to coarse-mode sea salt (< 32° N) and SNA (> 32° N) (Fig. 15b). The latter is thus consistent with the model analysis of HSRL-2 measurements on 6 March (Fig. 14b). It is interesting to note that at < 35° N, especially lower latitudes, the model simulates very high sea salt (mostly coarse-mode) aerosol extinction near the top of the marine BL where RH and cloud extinction are high. This feature is typically seen over the WNAO in both CALIOP aerosol extinction profiles and GEOS-Chem simulations. It suggests strong hygroscopic growth of sea salt particles and sea salt seeding of marine BL clouds.
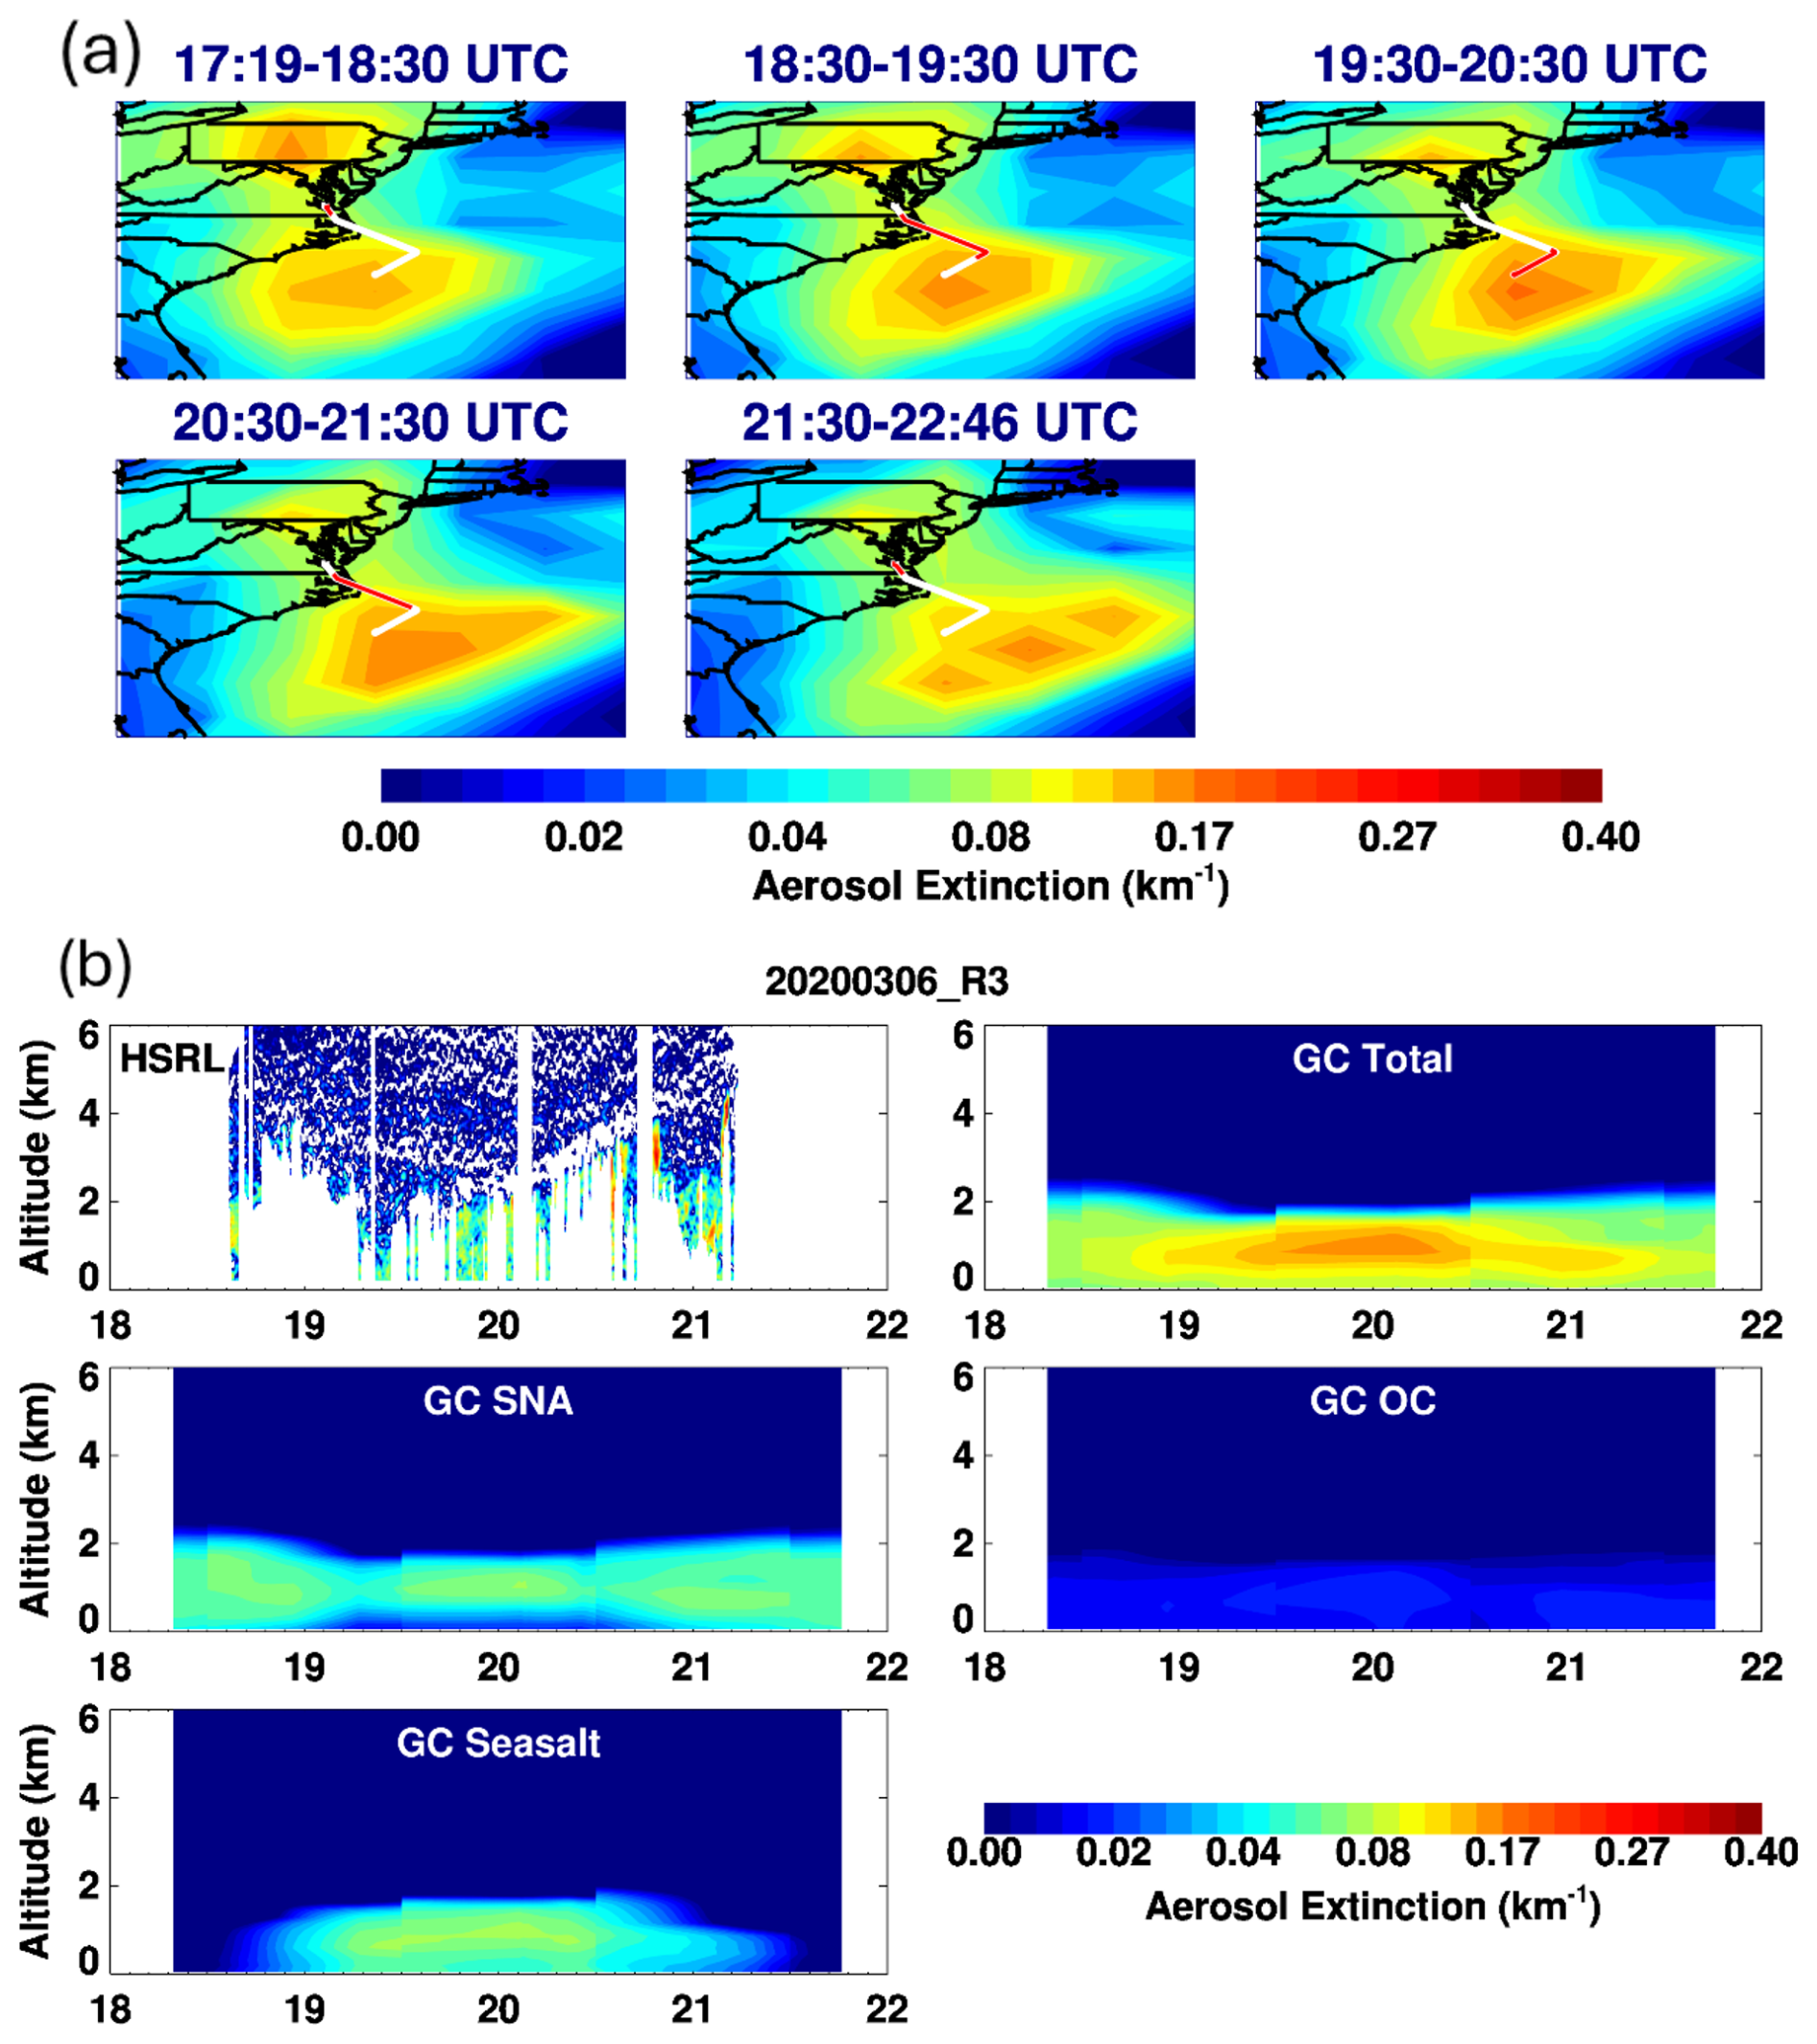
Figure 14Same as Fig. 13 but for the flight of 6 March 2020.
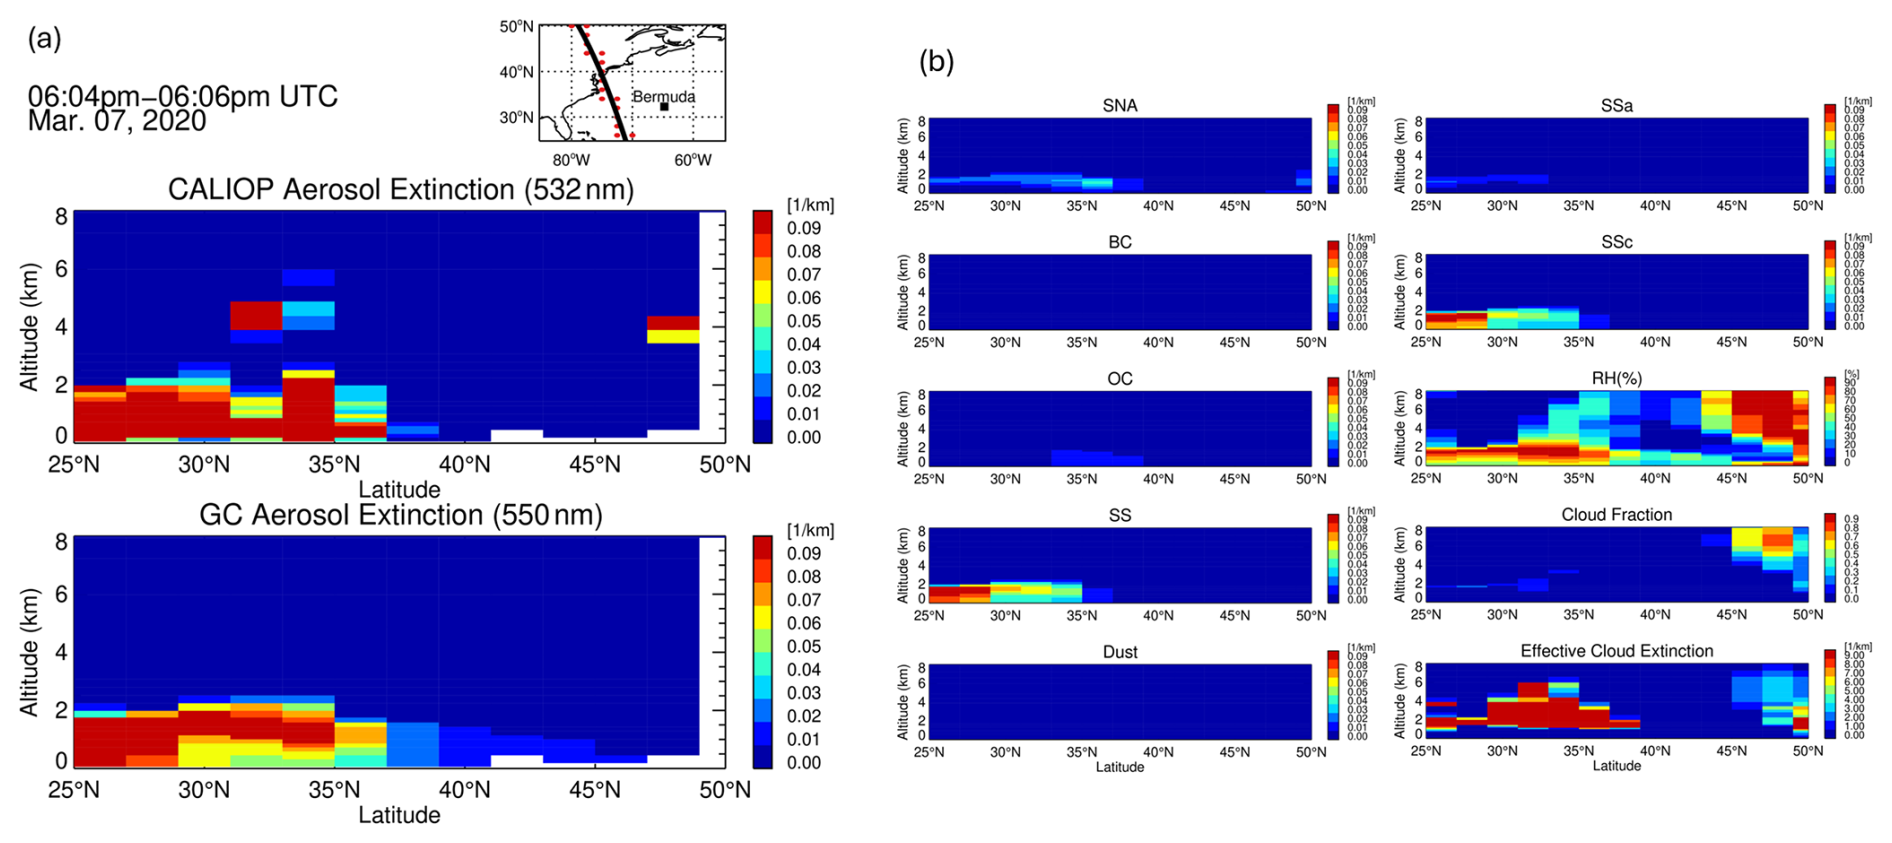
Figure 15(a) Latitude–height cross-section of aerosol extinctions measured by CALIOP (532 nm) compared to that of model aerosol extinctions (550 nm) over the WNAO during 18:04–18:06 UTC on 7 March 2020. Model output is sampled at ∼ 13:30 LT. (b) Left column: latitude–height cross-section of model speciated aerosol extinctions (550 nm) along the CALIPSO orbit track in panel (a). Right column: same as left column but for accumulated sea salt (SSa), coarse-mode sea salt (SSc), MERRA-2 RH (%), MERRA-2 cloud fraction, and MERRA-2 effective cloud extinction (i.e., cloud extinction multiplied by cloud fraction to the power of ; Liu et al., 2009).
Transport of the western US fire smoke
The above evaluation of model simulations with HSRL-2 and CALIOP composite aerosol extinction observations in summer 2020 has suggested that using 0–5.5 km BB emission injection heights significantly improves model performance in simulating the transport of the western US fire smoke plumes to the WNAO (Figs. 11, 12b). We present here model simulations of HSRL-2 aerosol extinction measurements with large enhancements in the free troposphere from several individual flights to further demonstrate the importance of BB emission injection heights with respect to the overall model performance. Figure 16 compares time–height cross-sections of HSRL-2 lidar aerosol extinction (532 nm, left column) with those of model aerosol extinction (550 nm, middle and right columns) for the flights of 26 August, 28 August, 15 September, and 22 September 2020, respectively. Model results from the standard simulation (BB emissions injected into the BL) and the BB0–5.5km simulation (BB emissions injected into 0–5.5 km) as listed in Table 1 are shown. In the case of 26 August, the aerosol plume at ∼ 1.5–2 km altitude was missing in the standard simulation but captured by BB0–5.5km. In the case of 28 August, both simulations perform similarly and reproduce the aerosol extinction enhancements in the free troposphere. Plumes with very high aerosol extinction were observed by HSRL-2 between 4–6 km on 15 and 22 September. While the standard model failed to simulate these smoke plumes on both days, the BB0–5.5km simulation successfully captures the transported smoke plumes, albeit with much lower aerosol extinction.
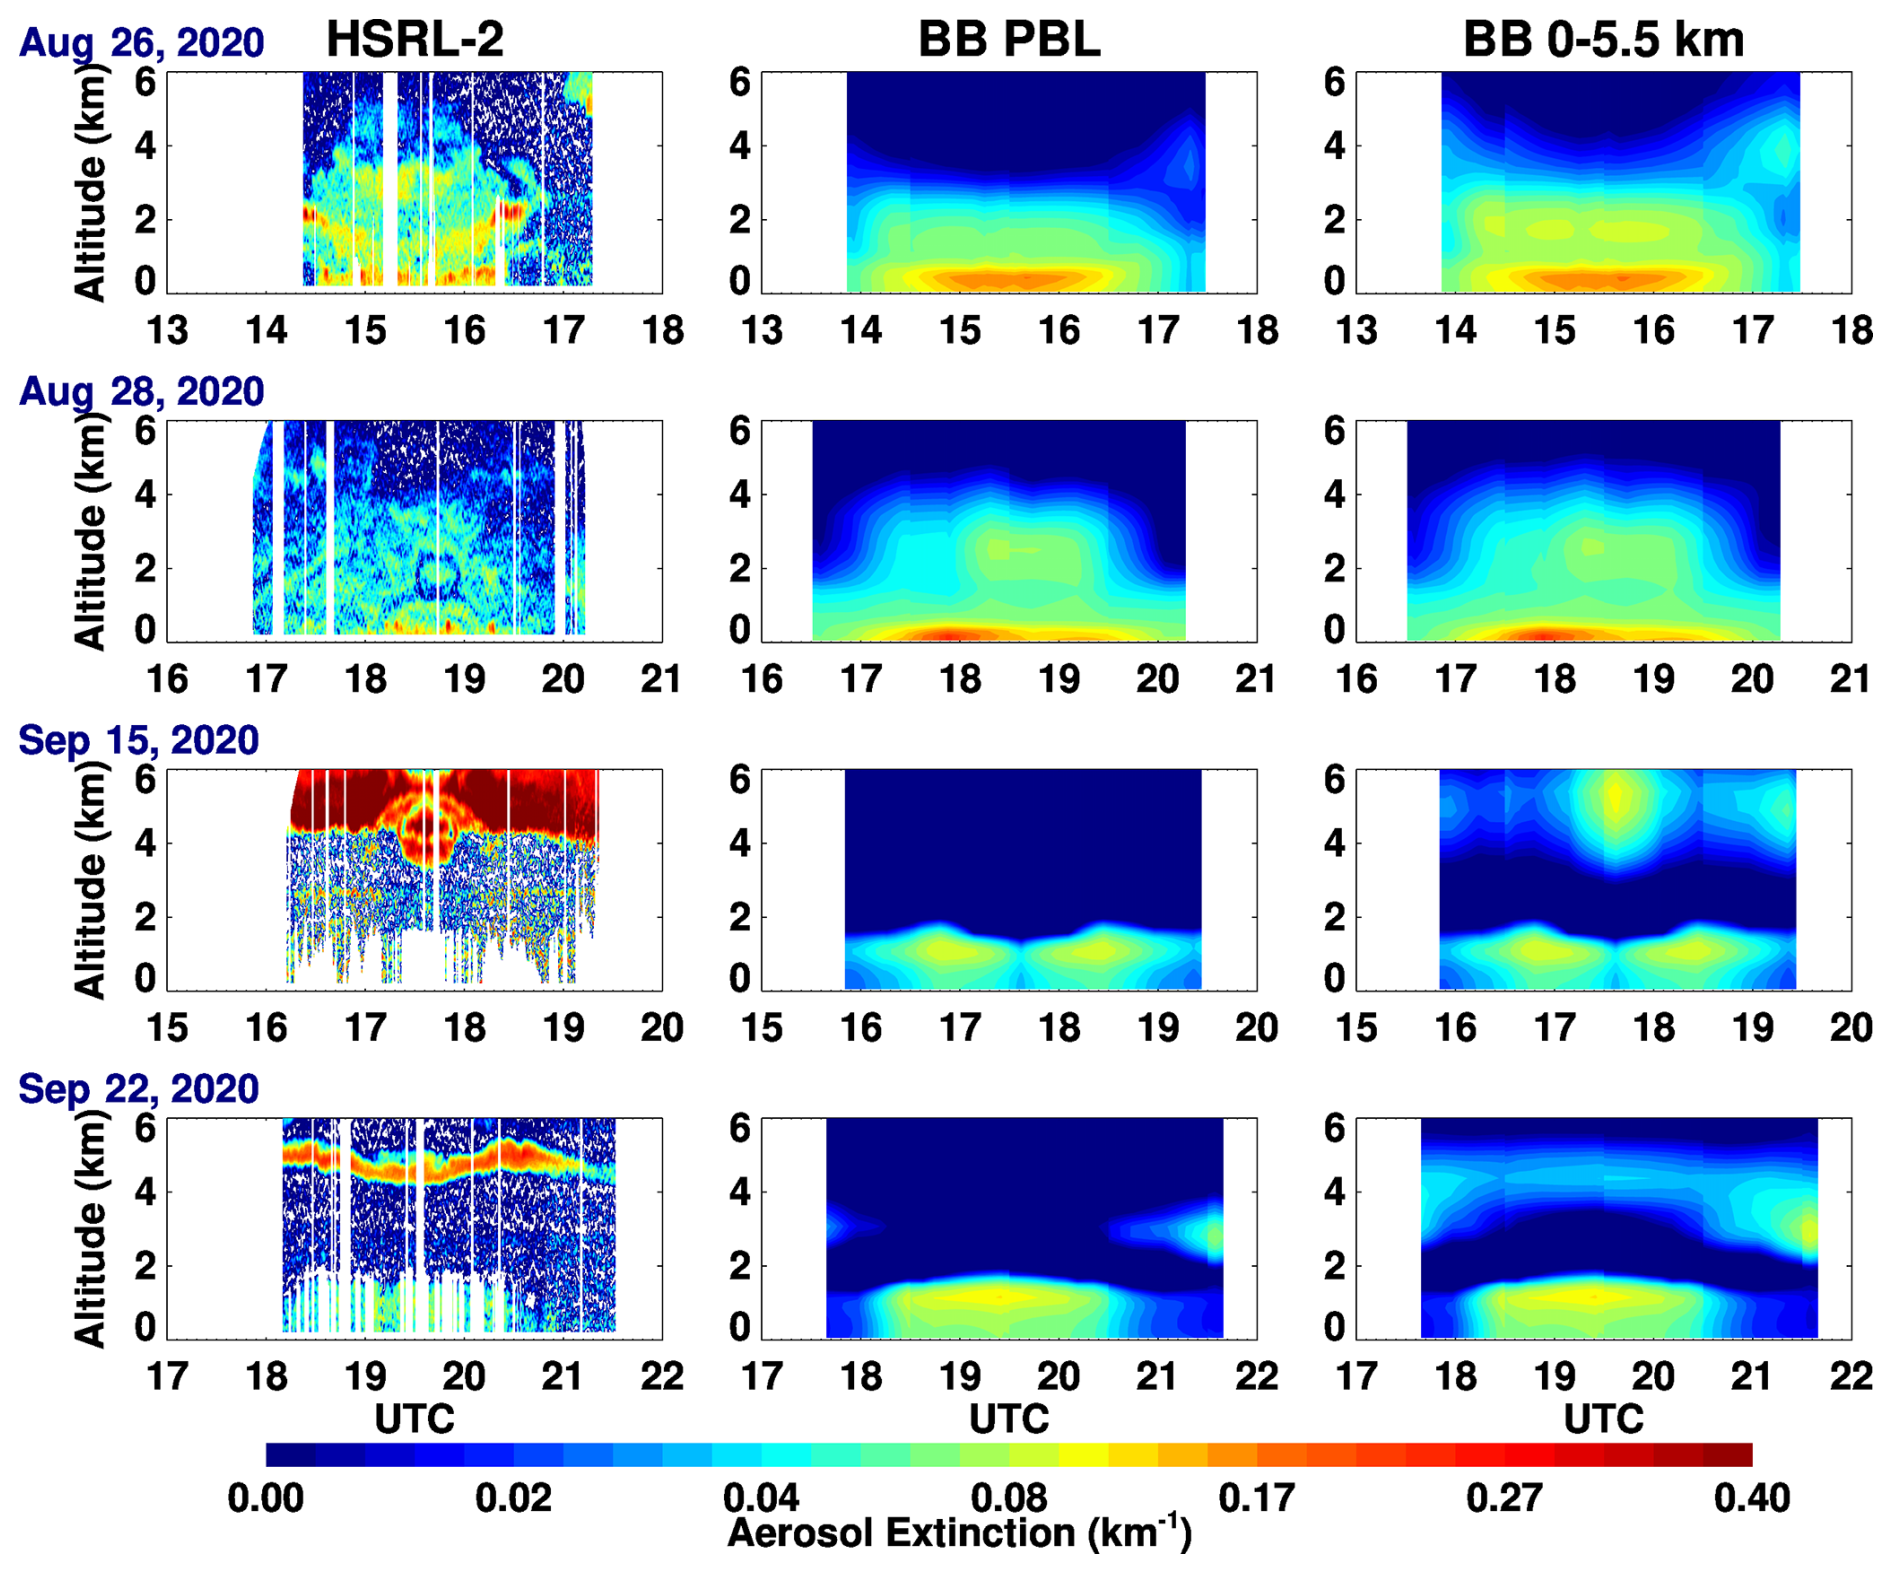
Figure 16Selected cases where using 0–5.5 km fire emission injection heights improves the model simulations of HSRL-2 aerosol extinction curtains during August–September 2020. The plots compare time–height cross-sections of aircraft HSRL-2 lidar aerosol extinctions (532 nm, left column) with those of model aerosol extinctions (550 nm, middle and right columns) for the flights of 26 August, 28 August, 15 September, and 22 September 2020, respectively. Biomass burning emissions are injected into the planetary boundary layer (BB PBL, middle column) or into the 0–5.5 km altitude interval (BB 0–5.5km, right column). See Table 1 for details on model simulations. Hourly model output was sampled at the time and location of lidar measurements.
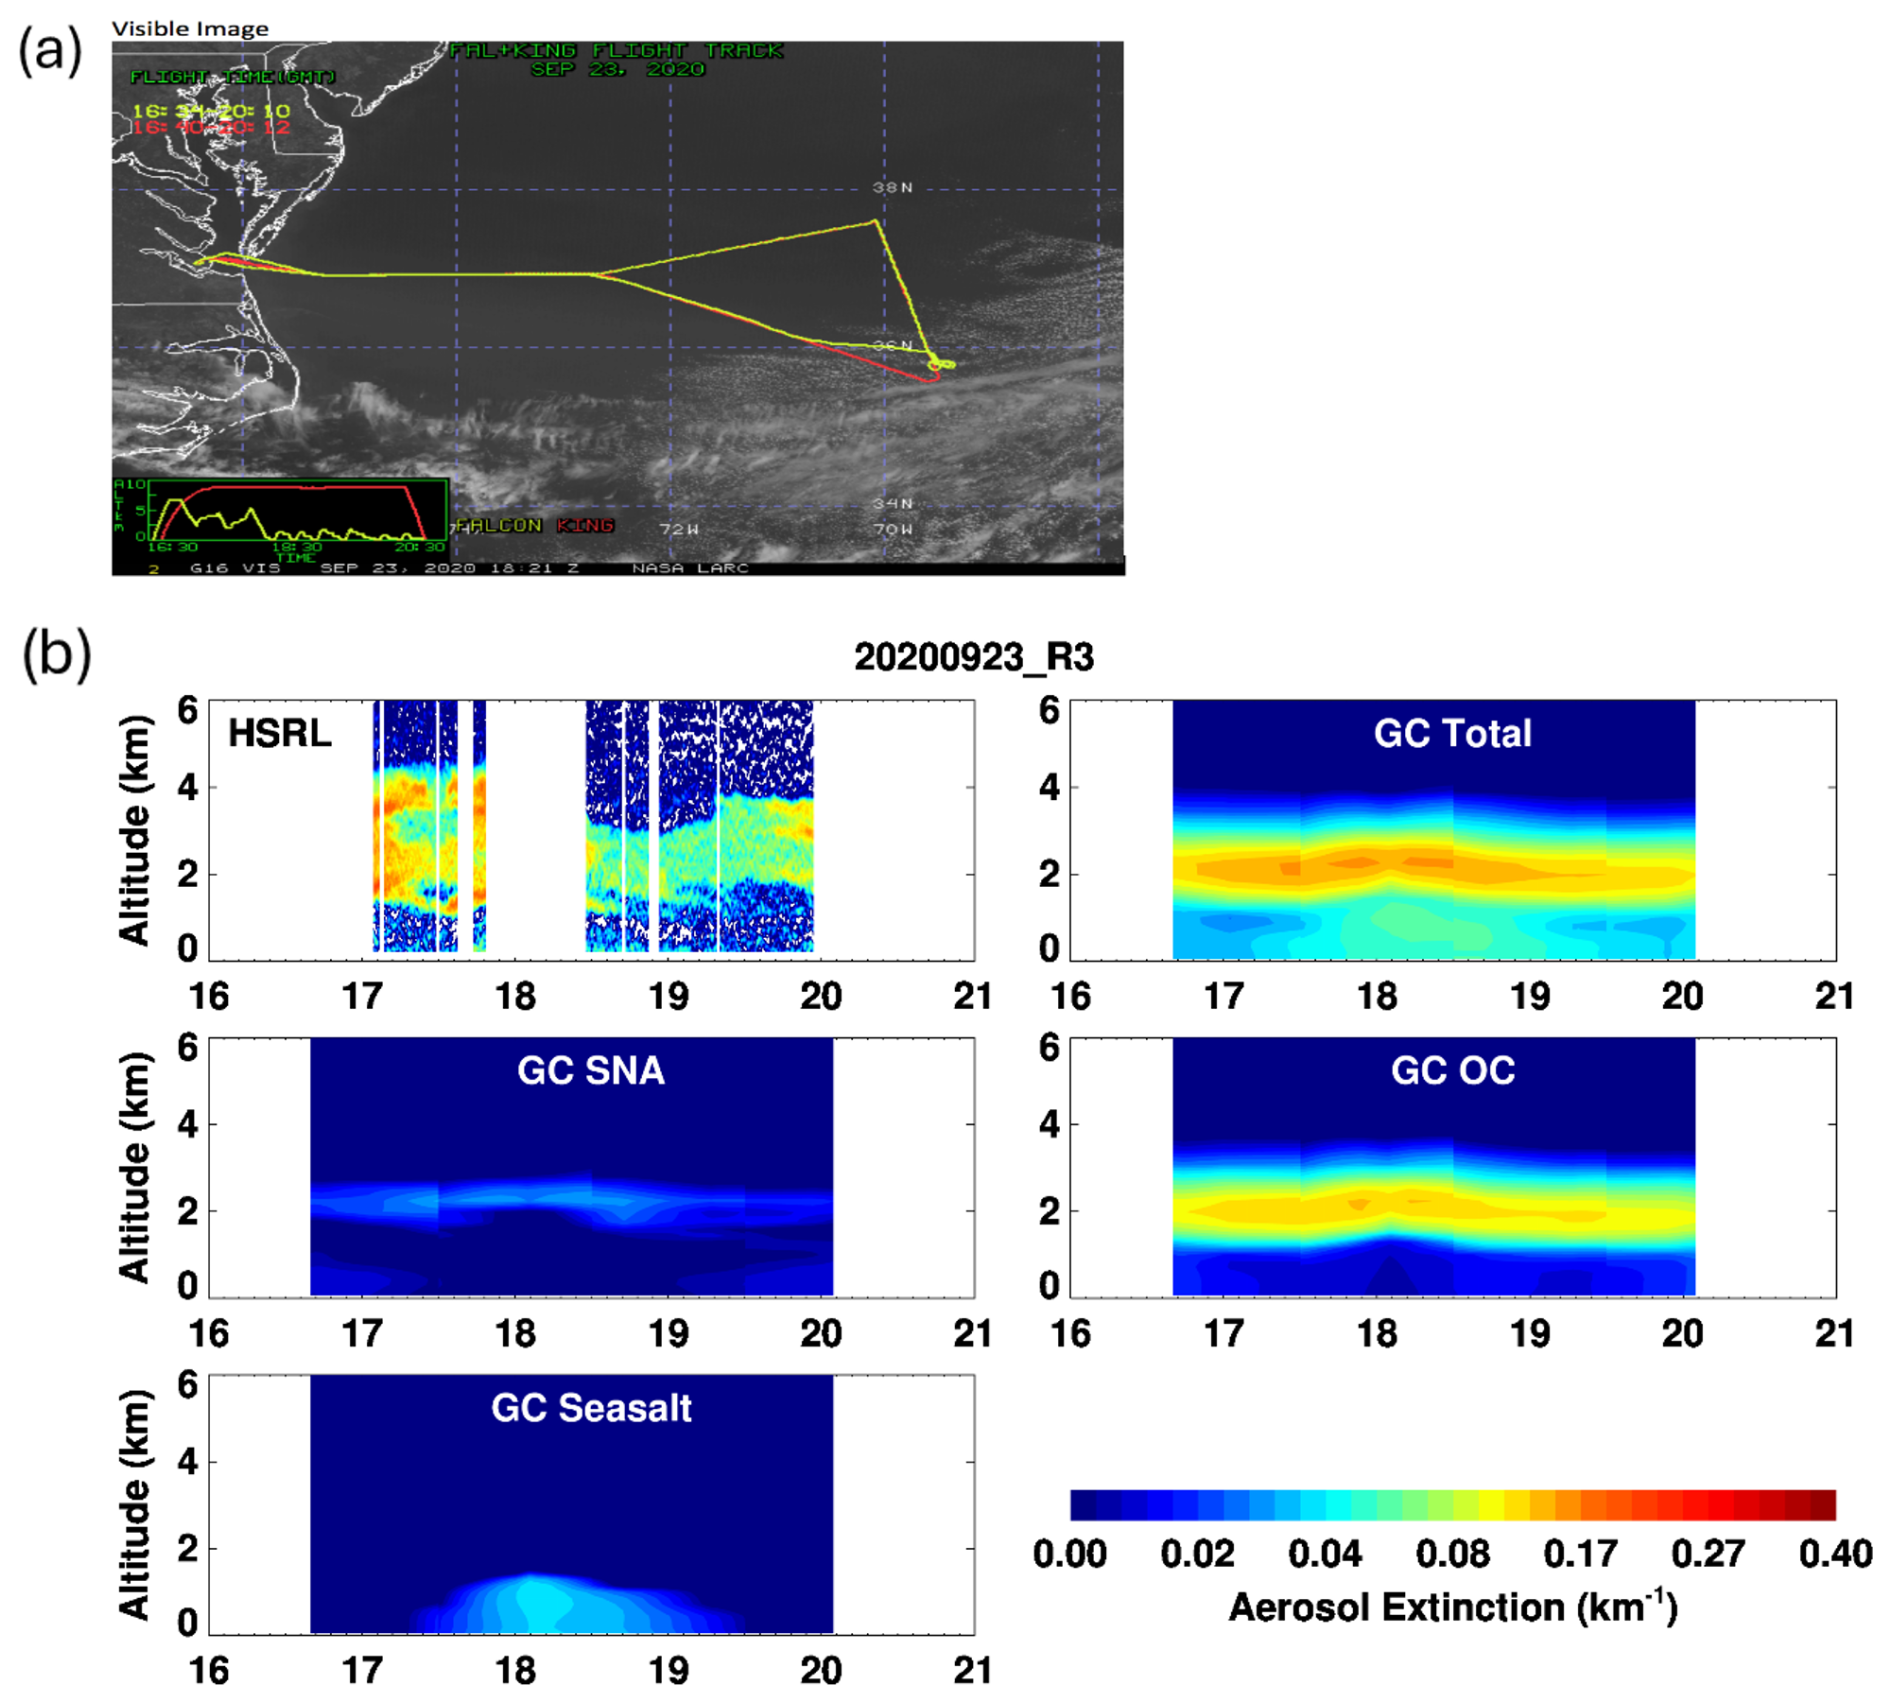
Figure 17Case study for long-range transport of the western US fire smoke to the WNAO on 23 September 2020. (a) GOES-16 Quicklook visible images for 18:21 UTC on 23 September 2020 (NASA Langley SatCORPS group). Superimposed are the King Air (red line) and Falcon (yellow line) flight tracks. (b) Time–height cross-section of aerosol extinctions observed by King Air HSRL-2 lidar (532 nm) compared to that of model aerosol extinctions (550 nm) for the flight of 23 September 2020. There were no HSRL-2 measurements between 17:48–18:28 UTC due to instrument issues. Also shown are curtain plots of model speciated aerosol extinctions along the flight track. BC and dust aerosol extinctions (not shown) are small.
We conduct a case study of long-range transport of the western US fire smoke to the WNAO on 23 September 2020, which was captured by both CALIOP and under-flying ACTIVATE aircraft. Figure 17 shows the time–height cross-section of HSRL-2 aerosol extinction (532 nm) compared to that of model total (and speciated) aerosol extinction (550 nm) for the King Air flight in the afternoon (∼ 17:00–20:00 UTC) of that day. Also shown is the GOES-16 visible image (18:21 UTC; NASA Langley SatCORPS group) superimposed with King Air (red) and Falcon (yellow) flight tracks. HSRL-2 observed a layer of very high aerosol extinction between 1.5–4.0 km during 17:00–18:00 UTC and another layer of enhanced aerosol extinction between 1.5–3 km during ∼ 18:30–20:00 UTC. The model-simulated total aerosol extinction shows a similar layer of aerosols (higher extinction between 17:00–18:30 UTC) during the entire flight, but it is consistently thinner (between ∼ 1.7–3.5 km) and located at a slightly lower altitude. Using the 0–5.5 km BB emission injection heights does not correct this model bias (not shown). The model-simulated speciated aerosol extinction suggests that the dominant contribution to the high aerosol extinction layer is from OC with a small contribution from SNA aerosols. The clear isolation above the marine BL indicates that the aerosols are very likely from long-range transport in the free troposphere. Model results show a sea salt extinction component in the marine BL between ∼ 18:00–19:00 UTC as the aircraft was at the farthest location from the coast. Unfortunately, the HSRL-2 retrievals are not available for that time window due to cloud interference but do show some BL aerosols before and after the data gap around 18:00 UTC.
In situ measurements from Falcon flying under King Air also show high CO (∼ 200 ppbv) and aerosols (mostly organics) between ∼ 2–4 km during the flight on 23 September 2020 (Fig. S8). Although the model failed to reproduce the high CO concentrations in this layer (also see Sect. 4.2), it simulates relatively weak CO enhancements due to BB near the bottom (∼ 2–3 km) of the observed layer. Similarly, the model puts the BB aerosol plume at an altitude about 1 km lower than that observed. Injecting BB emissions to higher altitudes has little effect on the simulated plume altitude in this case. As observed, the simulated BB plume is mainly composed of organic aerosols.
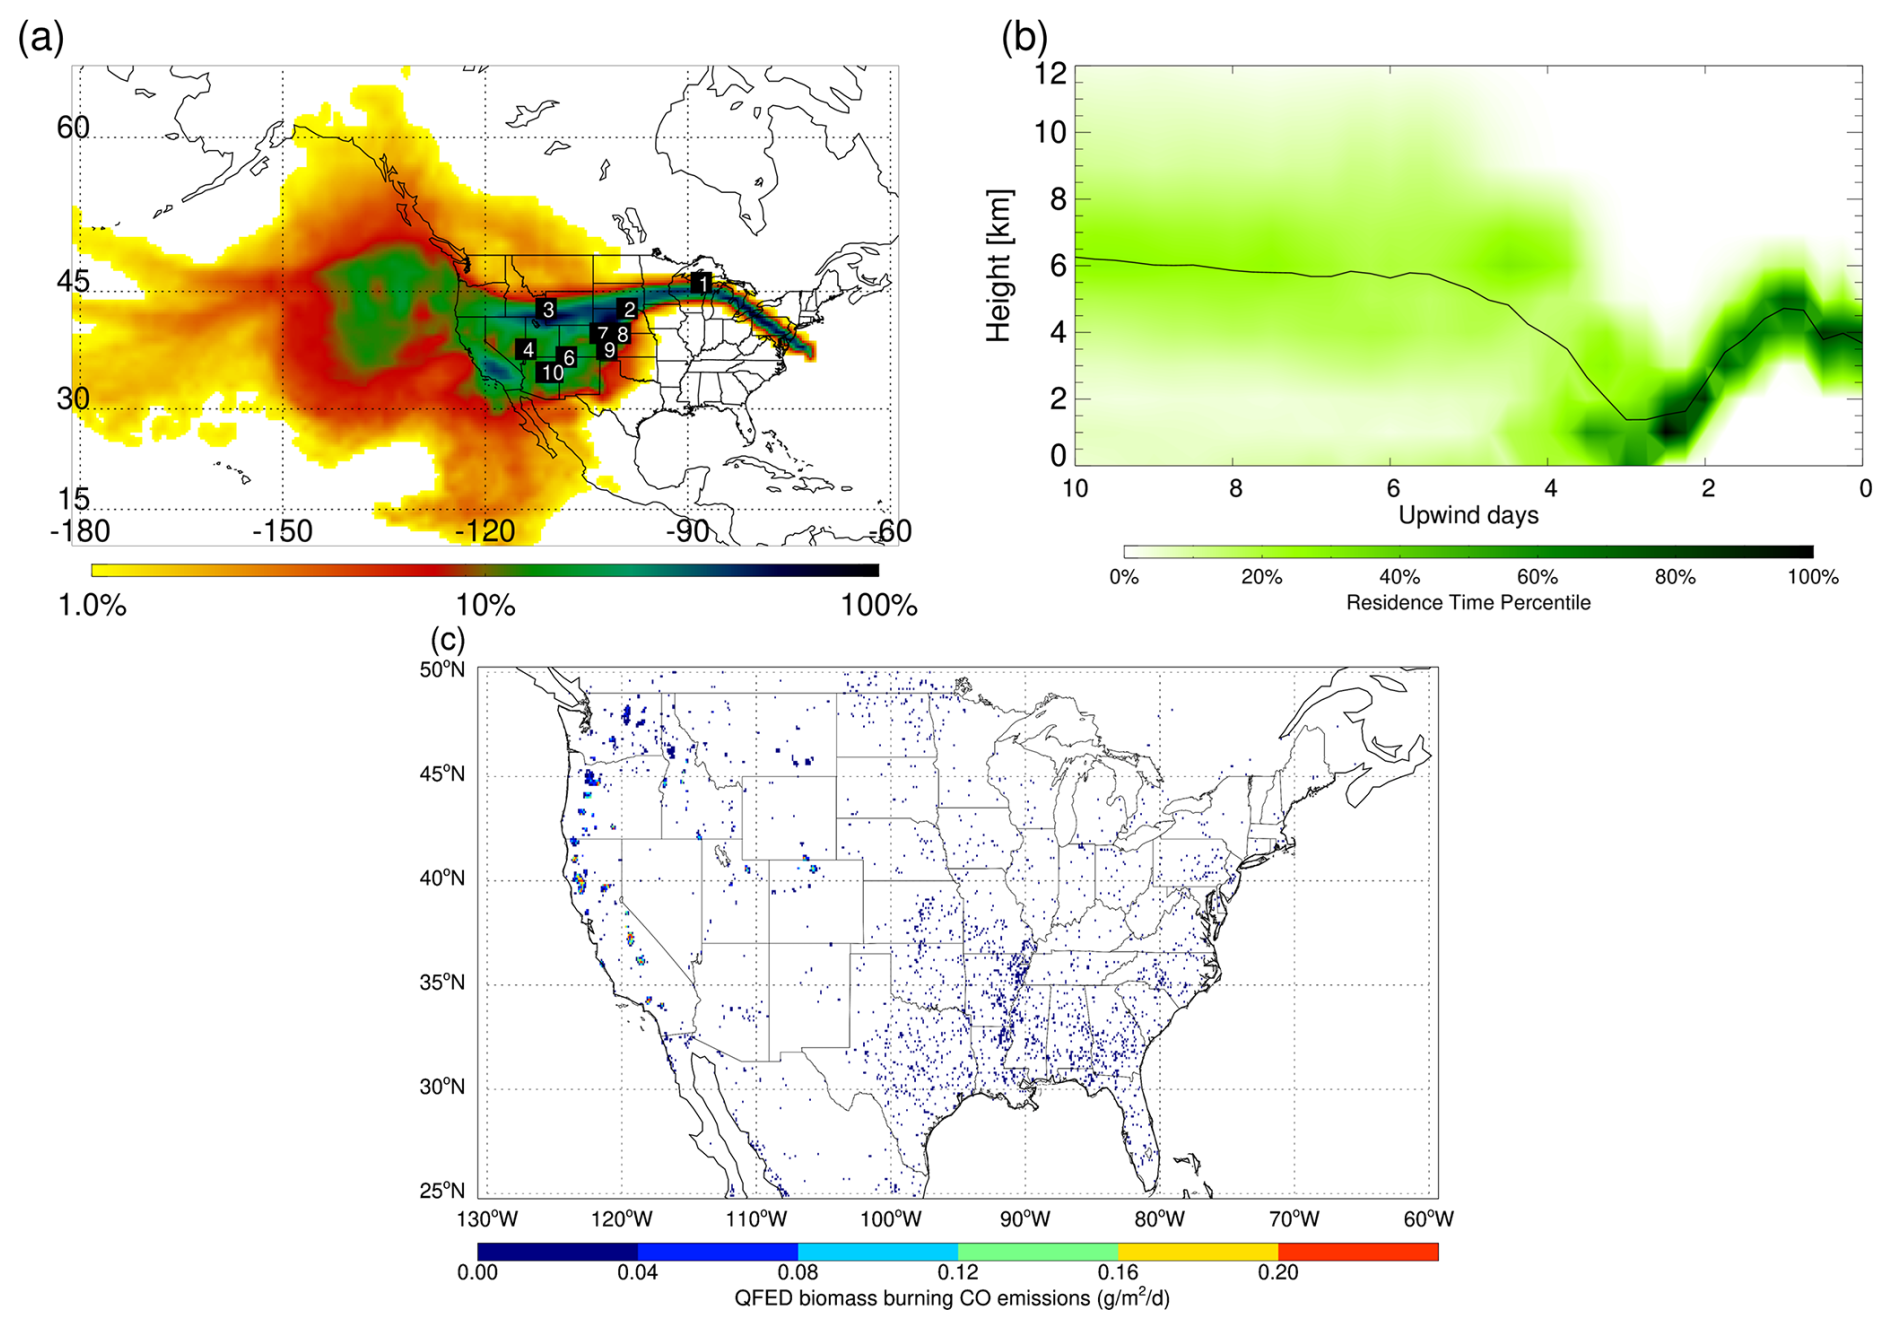
Figure 18FLEXPART-simulated upwind air parcel residence time for the western US fire smoke observed by HSRL-2 lidar over the WNAO at 17:13 UTC on 23 September 2020. Panel (a) shows the column-integrated air parcel residence time during the entire simulated transport time (20 d). The white labels indicate the approximate locations of the center of the plumes on each upwind day up to the 10th day. Air parcels may pass the same location multiple times during transport and leave a high density of residence time at those places. For better case-by-case comparison, residence time is color-coded by logarithmic grades representing its ratio to the location of maximal integrated residence time (100 %) during the transport. Panel (b) shows the vertical distribution of the residence time at given upwind times. The black line indicates the average height of air parcels during transport. (c) Monthly mean QFED biomass burning CO emissions for September 2020.
Back trajectories were calculated to determine the origin of the aforementioned smoke plume. Figure 18a and b show the FLEXPART-simulated upwind residence times for the air masses arriving at the location (latitude 36.87° N, longitude 72.57° W, altitude ∼ 3.5 km) at 17:13 UTC on 23 September 2020. A major part of the air masses originated from the BL of the western US about 3–4 d upwind, where large fire events occurred during early and mid-September as depicted by the QFED BB CO emission inventory (Fig. 19c). The trajectories in conjunction with surface weather maps (not shown) suggest that the air masses subsided to within the BL behind an eastward-moving cold front over mid-western states (∼ 110–105° W) during 19–20 September before being lifted to the free troposphere during 20–21 September, followed by fast transport between 3.5–5 km altitudes to the ACTIVATE domain.
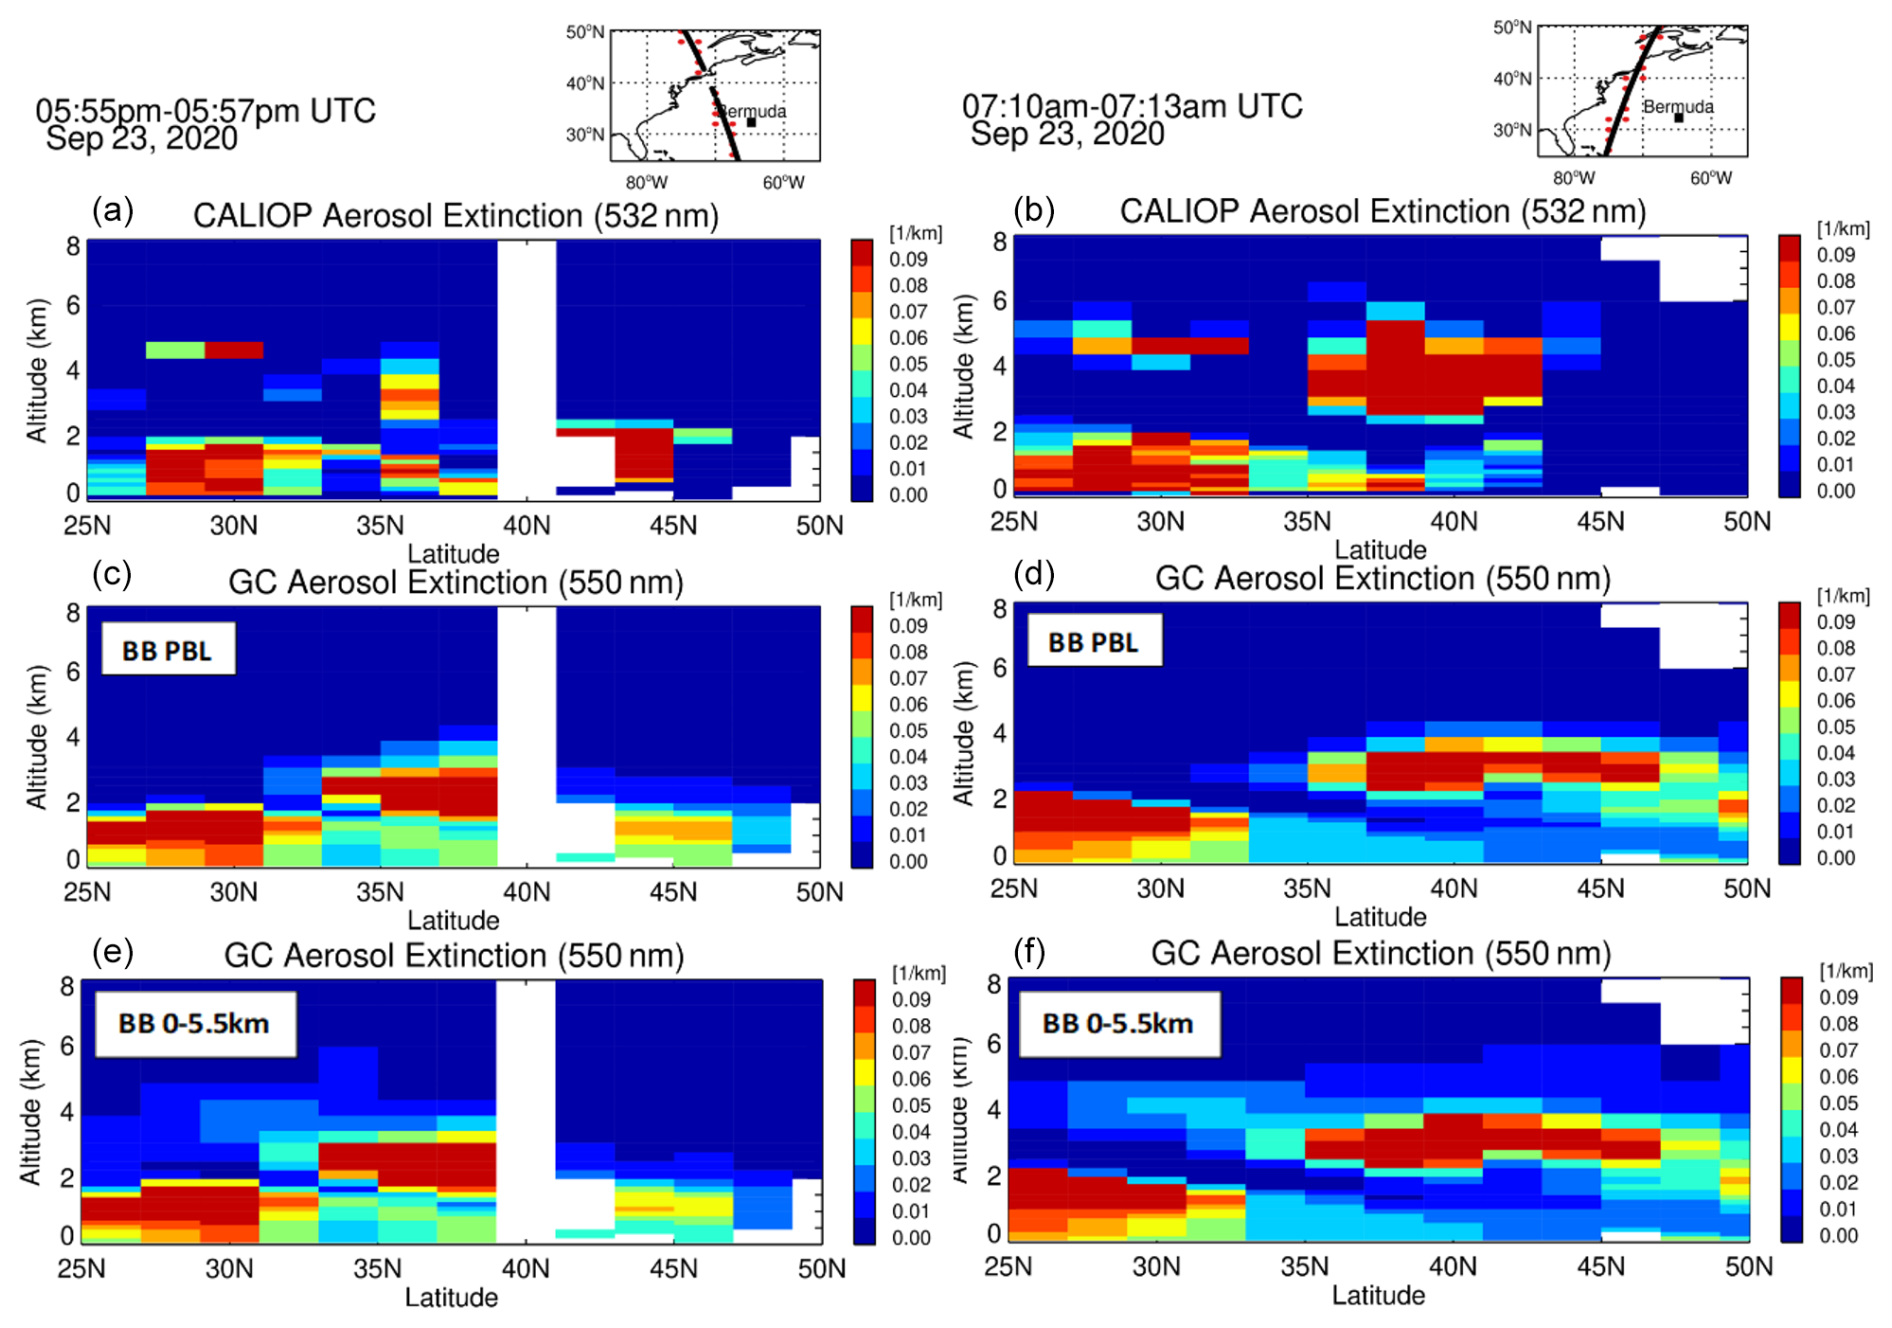
Figure 19Case study for the long-range transport of western US fire smoke to the WNAO during August–September 2020. Latitude–height cross-section of aerosol extinctions measured by CALIOP (532 nm; a, b) compared to that of model aerosol extinctions (550 nm; c–f) over the WNAO at 17:55–17:57 UTC (∼ 13:56 LT; a, c, e) and 07:10–07:13 UTC (∼ 03:12 LT; b, d, f) on 23 September 2020. Model output is sampled at ∼ 13:30 and ∼ 01:30 LT, respectively. Biomass burning emissions are injected into the planetary boundary layer (BB PBL; c, d) or into the 0–5.5 km altitude interval (BB 0–5.5km; e, f). See Table 1 for details on model simulations. The top-right map shows the corresponding model grid points (red dots) along the CALIPSO orbit track.
While both ACTIVATE aircraft captured the smoke plume from the western US fires, the satellite measurements from CALIPSO can put it in a context of latitudinal extent. Figure 19 (left column) shows the curtain of aerosol extinction measured by CALIOP over the WNAO during 17:55–17:57 UTC (∼ 13:56 LT), 23 September 2020, in comparison with model results from both the standard and BB0–5.5km simulations. Also shown (right column) is the comparison corresponding to the CALIPSO nighttime overpass during 07:10–07:13 UTC (∼ 03:12 LT) when the noise in the data is smaller compared to daytime data. During daytime, CALIOP observed high aerosol extinction in the lower troposphere at 27–33 and 41–45° N, between 2.5–4.0 km altitudes at 35–37° N, and around 4.5 km altitude at 27–31° N. The altitude 2.5–4.0 km of the aerosol plume at 35–37° N, where the CALIPSO under-flight occurred, is close to the plume altitude ∼ 1.5–4.0 km observed by HSRL-2 during 17:34–17:48 UTC (Fig. 17b). The standard model reasonably reproduces the general pattern of aerosol extinction as a function of latitude and altitude but underestimates it in the lower troposphere around 43° N and misses aerosols observed at 4.5 km between 27–31° N. For the latter, the BB0–5.5km simulation increases aerosol extinction, but the simulated plume altitude is still ∼ 1 km lower. The CALIOP nighttime observations made about 10 h earlier in close proximity show a more coherent pattern of the latitude–altitude distribution, i.e., enhanced aerosol extinction in the BL between 25–43° N and distinct aerosol plumes in the free troposphere (2.5–5.5 km, 35–43° N; 4–5 km, 27–33° N), with missing retrievals between 43–49° N. The model simulates coherent aerosol plumes in the free troposphere at a wider latitude range (35–49° N), especially with the BB0–5.5km simulation. BB0–5.5km suggests that the CALIOP-observed plume at 4.5 km between 27–33° N is a southward extension of the smoke plume at higher latitudes. The simulated aerosol plume is nevertheless at least 0.5 km lower in altitude than that observed by CALIOP.
The weaker vertical transport of trace gases and aerosols in the model is likely a result of two model uncertainties: (i) remapping of meteorological data from the native cubed-sphere grid of the parent GEOS-5 GCM to an equally rectilinear (latitude–longitude) grid and (ii) degradation of the spatial and temporal resolutions of the input meteorological data (Yu et al., 2018). Yu et al. (2018) showed that the remapping and the use of 3-hourly averaged wind archives may lead to 5 %–20 % error in the vertical transport of a surface-emitted tracer 222Rn in offline GEOS-Chem simulations compared to online GEOS-5 simulations. It was attributed partly to the loss of organized vertical motions. Degrading the spatial resolution of the meteorological data for input to GEOS-Chem (e.g., 2° × 2.5° used in this study) further weakened vertical transport because organized vertical motions are averaged out at a coarser resolution. Such inefficient vertical transport in coarse-resolution GEOS-Chem was also noted previously in the simulations of the Asian Tropopause Aerosol Layer (Fairlie et al., 2020) and upper-tropospheric 222Rn (Zhang et al., 2021), as constrained by observations. Restoring the lost vertical transport by implementing the modified relaxed Arakawa–Schubert convection scheme in GEOS-Chem would alleviate this issue (He et al., 2019). On the other hand, the spatial resolution for global models may be too coarse to resolve mean vertical motion that can be better resolved by regional models, as illustrated by Fast et al. (2016) when simulating the observed aerosol layers transported from North America over the Atlantic Ocean.
In this section, we quantify the contributions of different emission types to the AODs over the eastern US and WNAO during ACTIVATE in the model. Figure 20 shows the absolute and percentage changes in the average AODs for the periods of the 2020 winter (14 February–12 March) and summer (13 August–30 September) deployments, respectively, when anthropogenic (including biofuel), BB, biogenic, marine, and dust emissions are separately turned off in the model. In winter, anthropogenic emissions make dominant contributions (70 %–90 %) over land between 36–48° N: 30 %–60 % in the N box region and 20 %–40 % in the S box region, with a decreasing contribution trend from NW to SE. At Bermuda, about 20 % of AOD is due to anthropogenic emissions. BB emissions make the largest contributions (up to 40 %–50 %) in the southeastern US coast and contribute about 10 %–30 % of AODs in the N + S box regions. Marine emissions (mainly sea salt) contribute 30 %–60 % over most of the N + S box regions, with an increasing contribution trend from NW to SE, which is opposite of the trend of anthropogenic emission contributions. Biogenic and dust emissions make only small contributions to AODs throughout the domain. In summer, anthropogenic emission contributions are reduced over both land and WNAO compared to winter, with 20 %–30 % contribution in the N + S box regions. By contrast, BB emission contributions increase substantially over land and WNAO relative to winter, reflecting the influences of the western US fire smoke as well as BB emissions from the southeast US during summer. Interestingly, there is an apparent pathway for transport of smoke plumes towards Bermuda (left second row, Fig. 20b) as also demonstrated in recent work (Aldhaif et al., 2021; Mardi et al., 2021); this is consistent with the smoke AOD events observed by AERONET at Tudor Hill, Bermuda (Sect. 4.3). At Bermuda, BB emissions contribute more to AOD than anthropogenic emissions in summer (∼ 20 % vs. ∼ 15 %). Biogenic emission contributions (10 %–20 %) are mostly confined to the southeast US. Marine emission contributions to AOD in the N + S box regions and around Bermuda are significantly higher compared to winter (left fourth row, Fig. 20b), despite higher marine emission contributions south of 30° N in winter. African dust contributions to AOD (> 10 %) are seen mainly to the south of Bermuda but extend as far as Florida and the Gulf of Mexico.

Figure 20(a) Absolute changes (left column) and percentage changes (right column) in average AODs for the period of February–March 2020 when anthropogenic emissions, biomass burning emissions, biogenic emissions, marine emissions, and dust emissions are respectively turned off in the model. The locations of LaRC and Bermuda are marked. (b) Same as panel (a) but for the period of August–September 2020. The two rectangular boxes denote major flight areas (see N and S in Fig. 1) of February–March and August–September 2020.
We have simulated tropospheric aerosols over the western North Atlantic Ocean (WNAO) during the winter (14 February–12 March) and summer (13 August–30 September) deployments of the NASA ACTIVATE 2020 mission (Sorooshian et al., 2019, 2023) using the GEOS-Chem model driven by the MERRA-2 reanalysis (at 2° × 2.5° horizontal resolution). Model results are evaluated with measurements from two aircraft, the low-flying HU-25 Falcon and high-flying King Air, as well as ground-based and satellite observations. Our objective is to characterize and improve understanding of the aerosol life cycle, transport, and distribution over the WNAO during the two deployments.
6.1 Results
Major work and results are summarized below.
-
Contrasting atmospheric circulation patterns and meteorological conditions were prevalent during the two deployments. In winter, the flights to the north often occurred during post-frontal conditions to sample and study MBL clouds, especially during cold air outbreaks. The southern flight region experienced stronger uplifting and precipitation scavenging. In summer, the strengthened Bermuda High extended westward with southwesterly winds offshore along the US SE coast (∼ 32–36° N) and easterly in the subtropics (< 30° N). Compared to winter, the horizontal gradients in surface temperature, RH, vertical pressure velocity, precipitation, and PBL height were much weaker, and convective precipitation was much stronger in the flight domain.
-
Transport in the BL behind cold fronts is a major mechanism for the North American pollution outflow to the WNAO. The winter deployment encountered about four major periods with cold fronts passing through the study area, during which continental pollution (e.g., CO) was swept in the BL southeastward to the ACTIVATE flight latitudes (32.4–39.8° N). In summer, intrusion of cold air deep into the flight domain did not occur until late September since midlatitude cyclones were shifted northward.
-
Major pathways for vertical transport of trace gases and aerosols over the North American continental outflow region include uplifting ahead of cold fronts, convective transport, and BL turbulent mixing. In winter, large-scale vertical transport ahead of cold fronts was the dominant process responsible for lifting CO out of the BL over the US east coast and the flight domain, followed by rapid eastward transport. Convection became more important in summer. By contrast, BL turbulent mixing was found to be the dominant process responsible for the upward transport of sea salt within and ventilation out of the BL over the flight domain in winter, while both convection and turbulent mixing were important in uplifting sea salt to the free troposphere in summer.
-
We characterized the model-simulated aerosol species with respect to their distributions, mass loadings, and optical depths (AODs) over the WNAO. In winter, the horizontal distributions of SNA, BC, POA, and SOA concentrations in the BL largely reflected the frequent transport of continental pollution behind cold fronts. Sea salt had the largest mass among aerosols over the WNAO, while BC, SOA, and dust abundances across the flight domain were relatively small. In summer, BL sulfate concentrations were significantly higher, resulting from stronger production from oxidation of SO2. BL nitrate concentrations decreased substantially due to the volatility of ammonium nitrate at higher temperature and more sulfate competing with nitrate for ammonium. Substantially higher SOA concentrations reflect the large production from strong oxidation of VOCs. The vertical extent of the major North American continental outflow aerosols was significantly higher because of the impact of convective lifting. BL sea salt abundance increased in summer over the WNAO because of stronger winds during two weather events. Dust amounts also significantly increased due to long-range transport of dust emissions from North Africa. In both seasons, sea salt, OA, and SNA were the main contributors to the mean total AOD in the flight areas. The strong hygroscopic growth of fine aerosols results in a much larger fraction of AOD (versus aerosol mass) from SNA (or OA).
-
We evaluated model-simulated vertical profiles of CO, SNA, and OA concentrations with Falcon aircraft AMS measurements and performed sensitivity experiments to quantify their sources. In winter, outflow of pollution from continental sources dominated the lower troposphere, causing a sharp vertical gradient in CO, SNA, and OA concentrations at ∼ 1.0 km altitude; in summer, impacts of convection and BB sources increased and those gradients were weaker. Extending the BB emission injection height from within the BL to 0–5.5 km largely improved or corrected the model low biases in simulated aerosol enhancements in the free troposphere during the summer deployment. SNA aerosols are predominantly from continental anthropogenic emissions, but summertime BB contributions are also important between ∼ 3–6 km. OAs in the free troposphere are mainly from BB, whereas those in the marine BL have sources from BB, anthropogenic, and marine emissions.
-
Intensive aerosol profile measurements from ACTIVATE 2020 provide useful constraints on model aerosol scavenging due to stratiform precipitation. Uncertainty in CWC used in GEOS-Chem has a large impact on the simulated aerosols over the ACTIVATE study domain. Using MERRA-2's spatiotemporally varying CWC (versus a fixed value) improves model simulations of BL aerosol (especially sulfate) concentrations and AERONET AODs in the domain in winter. However, this approach leads to scavenging that is too fast in the free troposphere. The model also had some difficulties in reproducing the surface aerosol concentration and deposition flux measurements in the eastern US coastal region as well as AOD retrievals from MODIS/Aqua satellite measurements over the WNAO. Fully implementing the revised wet scavenging scheme of Luo et al. (2020) in the model could improve the model performance.
-
We evaluated model-simulated aerosol extinction (at 550 nm) profiles with King Air HSRL-2 lidar and CALIOP/CALIPSO satellite retrievals (at 532 nm) during the two deployments. In winter, HSRL-2 observed high aerosol extinction in the marine BL associated with the North American continental outflow. A layer of aerosol extinction enhancements was observed at ∼ 2.5 km altitude. The model simulates a much sharper gradient compared to HSRL-2 between the BL and free troposphere, suggesting the vertical lifting is probably too weak in the model. In summer, HSRL-2 observed much higher aerosol extinction in the BL and large extinction enhancements around 5 km altitude. The standard model fails to capture the latter but can be improved by using higher BB emission injection heights.
-
In winter, the CALIOP aerosol extinction over the central WNAO reached a peak at ∼ 0.5–1.0 km altitude and showed layers of enhancements in the free troposphere (e.g., the peak at ∼ 2.5 km altitude also observed by HSRL-2). The model captures the vertical trend of aerosol extinction but underestimates extinction in the free troposphere largely due to scavenging that is too fast. In summer, free tropospheric aerosols contribute a larger fraction of AOD relative to winter (Corral et al., 2020). The significantly higher extinction peak observed in the BL over the central WNAO compared to winter is consistent with simulated higher sea salt in summer. A feature typically seen over the WNAO (< 35° N) as suggested by CALIOP aerosol extinction profiles and GEOS-Chem simulations is very high sea salt (mostly coarse mode) aerosol extinction near the top of the marine BL where RH and cloud extinction are high. The latter suggests strong hygroscopic growth of sea salt particles and sea salt seeding of marine stratus clouds.
-
We conducted a case study of long-range transport of the western US fire smoke to the WNAO on 23 September 2020, which was captured by both CALIOP and the under-flying ACTIVATE aircraft. The CALIPSO measurements allowed us to put this smoke transport event in a context of latitudinal extent. Model simulations of HSRL-2 aerosol extinction measurements with large enhancements in the free troposphere from several individual flights (26 August, 28 August, 15 September, and 22 September 2020) demonstrate that injecting BB emissions into 0–5.5 km altitudes often improves the model performance. Case studies also show that the model reasonably captures the continental outflow of aerosols, land–ocean aerosol extinction gradient, and mixing of anthropogenic aerosols with sea salt.
-
We quantified the contributions of different emission types (anthropogenic, BB, biogenic, marine, dust) to the AOD over the eastern US and WNAO in the model. In winter, anthropogenic emission contributions dominate near the coast and decrease southeastward. BB emissions contribute most to AOD in the southeastern US coast and account for ∼ 10 %–30 % of AOD in the flight area, while marine emissions contribute 30 %–60 % over most of the flight area southeastward. In summer, anthropogenic emission contributions to AOD are reduced but BB emission contributions increase substantially. An apparent pathway for transport of smoke plumes towards Bermuda is identified (Aldhaif et al., 2021; Mardi et al., 2021) and is consistent with the smoke AOD events observed by AERONET at Tudor Hill, Bermuda. BB emissions contribute more to AOD at Bermuda than anthropogenic emissions in summer (∼ 20 % vs. ∼ 15 %). Biogenic emission contributions (10 %–20 %) are mostly confined to the southeast US. Marine emission contributions to AOD in the flight area and around Bermuda are significantly higher relative to winter. African dust contributions to AOD (> 10 %) are seen mainly to the south of Bermuda but extend as far as Florida and the Gulf of Mexico.
6.2 Implications
The above results on aerosol life cycle, transport, and distribution have important implications for studies of aerosol–cloud–meteorology interaction during ACTIVATE 2020. For instance, transport of continental aerosols over the WNAO may modulate cloud microphysics and precipitation. Recently, Painemal et al. (2023) analyzed wintertime BL cloud synoptic variability over the WNAO and linked the occurrence of a maximum in cloud droplet number concentration with continental aerosols during cold air outbreaks. Correctly representing aerosol distribution and variability is thus critical in simulating aerosol indirect effects on clouds. Biomass burning aerosols can affect the whole troposphere and interact with clouds directly or indirectly, as suggested by a case study of smoke transport from the western US during ACTIVATE on 26 August 2020 (Mardi et al., 2021). Mardi et al. (2021) also associated BB days with higher cloud drop number concentrations and lower drop effective radius. Our work implies that using reasonable BB emission injection heights in global models, among other factors, plays an essential role in representing smoke–cloud interactions. The high coarse-mode sea salt aerosol extinction along with high RH and cloud extinction near the top of the marine BL over the WNAO (< 35° N), as identified in this work, suggests a potential ideal region for studying giant CCN–cloud interactions (Gonzalez et al., 2022).
6.3 Future research
This study highlights the following areas for recommended future work to improve the modeling and understanding of tropospheric aerosol life cycle, transport, and distribution over the WNAO. An evaluation of the MERRA-2 CWC, including its partition between liquid and ice water in the vertical column, with available aircraft and satellite observations is required for a better representation of aerosol scavenging in GEOS-Chem. The liquid–ice partitioning affects the scavenging efficiencies of aerosols due to both warm and ice clouds. Accurate BB emission injection heights derived from daily or hourly observations from space (e.g., from the TEMPO geostationary satellite) are expected to significantly enhance the model's capability to simulate smoke aerosols and their vertical distribution over North America and the WNAO. Furthermore, inefficient vertical transport in coarse-resolution models may be improved by using high-resolution and/or regional models.
Observational data for model evaluation are introduced in Sect. 2.2. ACTIVATE data from the Falcon and King Air aircraft are publicly archived on the NASA Atmospheric Science Data Center's (ASDC) Distributed Active Archive Center (DAAC; https://doi.org/10.5067/SUBORBITAL/ACTIVATE/DATA001, ACTIVATE Science Team, 2020). ACTIVATE Falcon aircraft merged data files are available at https://doi.org/10.5067/ASDC/SUBORBITAL/ACTIVATE_Merge_Data_1 (NASA/LARC/SD/ASDC, 2021). ACTIVATE FLEXPART trajectory data products are available at https://doi.org/10.5067/ASDC/SUBORBITAL/ACTIVATE-FLEXPART_1 (NASA/LARC/SD/ASDC, 2023). The GEOS-Chem code v11-01 used in this work is available at https://doi.org/10.5281/zenodo.10982278 (Liu and Zhang, 2024). GEOS-Chem input files were obtained from the GEOS-Chem data portal (http://geoschemdata.wustl.edu/ExtData, The International GEOS-Chem User Community, 2022) enabled by Washington University in Saint Louis.
The supplement related to this article is available online at https://doi.org/10.5194/acp-25-2087-2025-supplement.
Conceptualization: HL, BZ, RM, AS, RF, HW, and DP. Model simulation: HL and BZ. Analysis and initial draft preparation: HL and BZ, with contributions from HC. Data collection and interpretation: RM, LZ, RF, AS, MS, AJS, JH, EC, MF, TS, CH, GD, JN, JD, and YC. CALIOP data analysis: HC, MV, and YH. Manuscript review, comments, and editing: all authors. Model modification and improvement: HL, BZ, GL, FY, CK, and MJ.
At least one of the (co-)authors is a member of the editorial board of Atmospheric Chemistry and Physics. The peer-review process was guided by an independent editor, and the authors also have no other competing interests to declare.
Publisher's note: Copernicus Publications remains neutral with regard to jurisdictional claims made in the text, published maps, institutional affiliations, or any other geographical representation in this paper. While Copernicus Publications makes every effort to include appropriate place names, the final responsibility lies with the authors.
The work was funded by ACTIVATE, a NASA Earth Venture Suborbital-3 (EVS-3) investigation funded by NASA's Earth Science Division and managed through the Earth System Science Pathfinder Program Office. Hongyu Liu and Bo Zhang acknowledge the partial support of the NASA EVS-2 NAAMES mission and ACMAP program for model development. The GEOS-Chem model is managed by the Atmospheric Chemistry Modeling Group at Harvard University with support from NASA ACMAP and MAP programs. The GEOS-Chem support team at Harvard University and Washington University in Saint Louis is acknowledged for their effort. Andrew Schuh of Colorado State University assisted with obtaining some of the GEOS-Chem input files. Hongyu Liu would like to thank Brett Gantt (EPA) for assisting with producing the MODIS/Aqua chlorophyll-a data, Lee Murray (University of Rochester) for providing the lightning NOx emission file for use with GEOS-Chem, and Robert Levy (NASA) for helpful discussions on the use of MODIS aerosol data. Hyundeok Choi would like to thank Jason Tackett for assisting with the use of CALIPSO data. The NASA Center for Climate Simulation (NCCS) provided supercomputing resources. The PIs and staff for the three AERONET sites are acknowledged for their effort. The Pacific Northwest National Laboratory (PNNL) is operated for DOE by Battelle Memorial Institute under contract DE-AC05-76RLO1830.
This research has been supported by NASA (grant nos. 80NSSC19K0389, NNX15AE33G, and NNL24OB07A).
This paper was edited by Daniel Knopf and reviewed by two anonymous referees.
ACTIVATE Science Team: Aerosol Cloud meTeorology Interactions oVer the western ATlantic Experiment Data, ASDC: Atmospheric Science Data Center [data set], https://doi.org/10.5067/SUBORBITAL/ACTIVATE/DATA001, 2020.
Aldhaif, A. M., Lopez, D. H., Dadashazar, H., and Sorooshian, A.: Sources, frequency, and chemical nature of dust events impacting the United States East Coast, Atmos. Environ., 231, 117456, https://doi.org/10.1016/j.atmosenv.2020.117456, 2020.
Aldhaif, A. M., Lopez, D. H., Dadashazar, H., Painemal, D., Peters, A. J., and Sorooshian, A.: An aerosol climatology and implications for clouds at a remote marine site: Case study over Bermuda, J. Geophys. Res.-Atmos., 126, e2020JD034038, https://doi.org/10.1029/2020JD034038, 2021.
Alexander, B., Park, R. J., Jacob, D. J., Li, Q. B., Yantosca, R. M., Savarino, J., Lee, C. C. W., and Thiemens, M. H.: Sulfate formation in sea-salt aerosols: Constraints from oxygen isotopes, J. Geophys. Res., 110, D10307, https://doi.org/10.1029/2004JD005659, 2005.
Bellouin, N., Quaas, J., Gryspeerdt, E., Kinne, S., Stier, P., Watson-Parris, D., Boucher, O., Carslaw, K. S., Christensen, M., Daniau, A.L., Dufresne, J. L., Feingold, G., Fiedler, S., Forster, P., Gettelman, A., Haywood, J. M., Lohmann, U., Malavelle, F., Mauritsen, T., McCoy, D. T., Myhre, G., Mülmenstädt, J., Neubauer, D., Possner, A., Rugenstein, M., Sato, Y., Schulz, M., Schwartz, S. E., Sourdeval, O., Storelvmo, T., Toll, V., Winker, D., and Stevens, B.: Bounding global aerosol radiative forcing of climate change, Rev. Geophys., 58, e2019RG000660, https://doi.org/10.1029/2019RG000660, 2020.
Berg, L. K., Fast, J. D., Barnard, J. C., Burton, S. P., Cairns, B., Chand, D., Comstock, J. M., Dunagan, S., Ferrare, R. A., Flynn, C. J., Hair, J. W., Hostetler, C. A., Hubbe, J., Jefferson, A., Johnson, R., Kassianov, E. I., Kluzek, C. D., Kollias, P., Lamer, K., Lantz, K., Mei, F., Miller, M. A., Michalsky, J., Ortega, I., Pekour, M., Rogers, R. R., Russell, P. B., Redemann, J., Sedlacek III, A. J., Segal-Rosenheimer, M., Schmid, B., Shilling, J. E., Shinozuka, Y., Springston, S. R., Tomlinson, J. M., Tyrrell, M., Wilson, J. M., Volkamer, R., Zelenyuk, A., and Berkowitz, C. M.: The Two-Column Aerosol Project: Phase I – Overview and impact of elevated aerosol layers on aerosol optical depth, J. Geophys. Res.-Atmos., 121, 336–361, https://doi.org/10.1002/2015JD023848, 2016.
Bey, I., Jacob, D. J., Yantosca, R. M., Logan, J. A., Field, B. D., Fiore, A. M., Li, Q., Liu, H. Y., Mickley, L. J., and Schultz, M. G.: Global modeling of tropospheric chemistry with assimilated meteorology: Model description and evaluation, J. Geophys. Res., 106, 23073–23095, https://doi.org/10.1029/2001JD000807, 2001.
Bosilovich, M., Robertson, F., Takacs, L., Molod, A., and Mocko, D.: Atmospheric water balance and variability in the MERRA-2 reanalysis, J. Climate, 30, 1177–1196, https://doi.org/10.1175/JCLI-D-16-0338.1, 2017.
Bosilovich, M. G., Akella, S., Coy, L., Cullather, R., Draper, C., Gelaro, R., Kovach, R., Liu, Q., Molod, A., Norris, P., Wargan, K., Chao, W., Reichle, R., Takacs, L., Vikhliaev, Y., Bloom, S., Collow, A., Firth, S., Labow, G., Partyka, G., Pawson, S., Reale, O., Schubert, S. D., and Suarez, M.: MERRA-2: Initial Evaluation of the Climate, NASA/TM2015104606, NASA Goddard Space Flight Center, Greenbelt, Maryland, vol. 43, 139 pp., https://gmao.gsfc.nasa.gov/pubs/docs/Bosilovich803.pdf (last access: 31 January 2025), 2015.
Boucher, O., Randall, D., Artaxo, P., Bretherton, C., Feingold, G., Forster, P., Kerminen, V.-M., Kondo, Y., Liao, H., Lohmann, U., Rasch, P., Satheesh, S. K., Sherwood, S., Stevens, B., and Zhang, X. Y.: Clouds and Aerosols, in: Climate Change 2013: The Physical Science Basis. Contribution of Working Group I to the Fifth Assessment Report of the Intergovernmental Panel on Climate Change, edited by: Stocker, T. F., Qin, D., Plattner, G.-K., Tignor, M., Allen, S. K., Boschung, J., Nauels, A., Xia, Y., Bex, V., and Midgley, P. M., Cambridge University Press, Cambridge, United Kingdom and New York, NY, USA, https://doi.org/10.1017/CBO9781107415324, 2013.
Bukosa, B., Fisher, J. A., Deutscher, N. M., and Jones, D. B.: A Coupled CH4, CO and CO2 Simulation for Improved Chemical Source Modeling, Atmosphere, 14, 764, https://doi.org/10.3390/atmos14050764, 2023.
Burrows, S. M., McCluskey, C. S., Cornwell, G., Steinke, I., Zhang, K., Zhao, B., Zawadowicz, M., Raman, A., Kulkarni, G., China, S., Zelenyuk, A., and DeMott, P. J.: Ice-nucleating particles that impact clouds and climate: Observational and modeling research needs, Rev. Geophys., 60, e2021RG000745, https://doi.org/10.1029/2021RG000745, 2022.
Burton, S. P., Hostetler, C. A., Cook, A. L., Hair, J. W., Seaman, S. T., Scola, S., Harper, D. B., Smith, J. A., Fenn, M. A., Ferrare, R. A., Saide, P. E., Chemyakin, E. V., and Müller, D.: Calibration of a high spectral resolution Lidar using a Michelson Interferometer, with data examples from Oracles, Appl. Optics, 57, 6061–6075, https://doi.org/10.1364/Ao.57.006061, 2018.
Carr, J. L., Wu, D. L., Daniels, J., Friberg, M. D., Bresky, W., and Madani, H.: GEO–GEO Stereo-Tracking of Atmospheric Motion Vectors (AMVs) from the Geostationary Ring, Remote Sens., 12, 3779, https://doi.org/10.3390/rs12223779, 2020.
Carter, T. S., Heald, C. L., Cappa, C. D., Kroll, J. H., Campos, T. L., Coe, H., Cotterell, M. I., Davies, N. W., Farmer, D. K., Fox, C., Garofalo, L. A., Hu, L., Langridge, J. M., Levin, E. J. T., Murphy, S. M., Pokhrel, R. P., Shen, Y., Szpek, K., Taylor, J. W., and Wu, H.: Investigating carbonaceous aerosol and its absorption properties from fires in the western United States (WE-CAN) and southern Africa (ORACLES and CLARIFY), J. Geophys. Res.-Atmos., 126, e2021JD034984, https://doi.org/10.1029/2021JD034984, 2021.
Charlson, R. J. and Pilat, M. J.: Climate: The influence of aerosols, J. Appl. Meteorol., 8, 1001–1002, 1969.
Chen, J., Wang, H., Li, X., Painemal, D., Sorooshian, A., Lee Thornhill, K., Robinson, C., and Shingler, T.: Impact of Meteorological Factors on the Mesoscale Morphology of Cloud Streets during a Cold Air Outbreak over the Western North Atlantic, J. Atmos. Sci., 79, 2863–2879, https://doi.org/10.1175/jas-d-22-0034.1, 2022.
Chen, L. Q. and Duce, R. A.: The sources of sulfate, vanadium and mineral matter in aerosol-particles over Bermuda, Atmos. Environ., 17, 2055–2064, 1983.
Chien, F.-C., Hong, J.-S., and Kuo, Y.-H.: The marine boundary layer height over the Western North pacific based on GPS radio occultation, island soundings, and numerical models, Sensors, 19, 155, https://doi.org/10.3390/s19010155, 2019.
Colarco, P. R., Toon, O. B., Reid, J. S., Livingston, J. M., Russell, P. B., Redemann, J., Schmid, B., Maring, H. B., Savoie, D., Welton, E. J., Campbell, J. R., Holben, B. N., and Levy, R.: Saharan dust transport to the Caribbean during PRIDE: 2. Transport, vertical profiles, and deposition in simulations of in situ and remote sensing observations, J. Geophys. Res., 108, 8590, https://doi.org/10.1029/2002JD002659, 2003.
Collaud Coen, M., Andrews, E., Alastuey, A., Arsov, T. P., Backman, J., Brem, B. T., Bukowiecki, N., Couret, C., Eleftheriadis, K., Flentje, H., Fiebig, M., Gysel-Beer, M., Hand, J. L., Hoffer, A., Hooda, R., Hueglin, C., Joubert, W., Keywood, M., Kim, J. E., Kim, S.-W., Labuschagne, C., Lin, N.-H., Lin, Y., Lund Myhre, C., Luoma, K., Lyamani, H., Marinoni, A., Mayol-Bracero, O. L., Mihalopoulos, N., Pandolfi, M., Prats, N., Prenni, A. J., Putaud, J.-P., Ries, L., Reisen, F., Sellegri, K., Sharma, S., Sheridan, P., Sherman, J. P., Sun, J., Titos, G., Torres, E., Tuch, T., Weller, R., Wiedensohler, A., Zieger, P., and Laj, P.: Multidecadal trend analysis of in situ aerosol radiative properties around the world, Atmos. Chem. Phys., 20, 8867–8908, https://doi.org/10.5194/acp-20-8867-2020, 2020.
Cooper, O. R., Moody, J. L., Parrish, D. D., Trainer, M., Holloway, J. S., Hübler, G., Fehsenfeld, F. C., and Stohl, A.: Trace gas composition of midlatitude cyclones over the Western North Atlantic Ocean: A seasonal comparison of O3 and CO, J. Geophys. Res., 107, 4057, https://doi.org/10.1029/2001JD000902, 2002.
Corral, A. F., Dadashazar, H., Stahl, C., Edwards, E.-L., Zuidema, P., and Sorooshian, A.: Source Apportionment of Aerosol at a Coastal Site and Relationships with Precipitation Chemistry: A Case Study over the Southeast United States, Atmosphere, 11, 1212, https://doi.org/10.3390/atmos11111212, 2020.
Corral, A. F., Braun, R. A., Cairns, B., Gorooh, V. A., Liu, H., Ma, L., Mardi, A. H., Painemal, D., Stamnes, S., van Diedenhoven, B., Wang, H., Yang, Y., Zhang, B., and Sorooshian, A.: An overview of atmospheric features over the Western North Atlantic Ocean and North American East Coast – Part 1: Analysis of aerosols, gases, and wet deposition chemistry, J. Geophys. Res.-Atmos., 126, e2020JD032592, https://doi.org/10.1029/2020JD032592, 2021.
Corral, A. F., Choi, Y., Crosbie, E., Dadashazar, H., DiGangi, J. P., Diskin, G. S., Fenn, M., Harper, D. B., Kirschler, S., Liu, H., Moore, R. H., Nowak, J. B., Scarino, A. J., Seaman, S., Shingler, T., Shook, M. A., Thornhill, K. L., Voigt, C., Zhang, B., Ziemba, L. D., and Sorooshian, A.: Cold Air Outbreaks Promote New Particle Formation Off the U.S. East Coast, Geophys. Res. Lett., 49, e2021GL096073, https://doi.org/10.1029/2021GL096073, 2022.
Creilson, J. K., Fishman, J., and Wozniak, A. E.: Intercontinental transport of tropospheric ozone: a study of its seasonal variability across the North Atlantic utilizing tropospheric ozone residuals and its relationship to the North Atlantic Oscillation, Atmos. Chem. Phys., 3, 2053–2066, https://doi.org/10.5194/acp-3-2053-2003, 2003.
Croft, B., Martin, R. V., Moore, R. H., Ziemba, L. D., Crosbie, E. C., Liu, H., Russell, L. M., Saliba, G., Wisthaler, A., Müller, M., Schiller, A., Galí, M., Chang, R. Y.-W., McDuffie, E. E., Bilsback, K. R., and Pierce, J. R.: Factors controlling marine aerosol size distributions and their climate effects over the northwest Atlantic Ocean region, Atmos. Chem. Phys., 21, 1889–1916, https://doi.org/10.5194/acp-21-1889-2021, 2021.
Dadashazar, H., Painemal, D., Alipanah, M., Brunke, M., Chellappan, S., Corral, A. F., Crosbie, E., Kirschler, S., Liu, H., Moore, R. H., Robinson, C., Scarino, A. J., Shook, M., Sinclair, K., Thornhill, K. L., Voigt, C., Wang, H., Winstead, E., Zeng, X., Ziemba, L., Zuidema, P., and Sorooshian, A.: Cloud drop number concentrations over the western North Atlantic Ocean: seasonal cycle, aerosol interrelationships, and other influential factors, Atmos. Chem. Phys., 21, 10499–10526, https://doi.org/10.5194/acp-21-10499-2021, 2021.
Dadashazar, H., Corral, A. F., Crosbie, E., Dmitrovic, S., Kirschler, S., McCauley, K., Moore, R., Robinson, C., Schlosser, J. S., Shook, M., Thornhill, K. L., Voigt, C., Winstead, E., Ziemba, L., and Sorooshian, A.: Organic enrichment in droplet residual particles relative to out of cloud over the northwestern Atlantic: analysis of airborne ACTIVATE data, Atmos. Chem. Phys., 22, 13897–13913, https://doi.org/10.5194/acp-22-13897-2022, 2022.
Darmenov, A. and da Silva, A.: The Quick Fire Emissions Dataset (QFED): Documentation of versions 2.1, 2.2 and 2.4, NASA Technical Report Series on Global Modeling and Data Assimilation NASA TM-2015-104606, NASA Goddard Space Flight Center, Greenbelt, Maryland, vol. 38, http://gmao.gsfc.nasa.gov/pubs/docs/Darmenov796.pdf (last access: 31 January 2025), 2015.
Davis, R. E., Hayden, B. P., Gay, D. A., Phillips, W. L., and Jones, G. V.: The North Atlantic Subtropical Anticyclone, J. Climate, 10, 728–744, https://doi.org/10.1175/1520-0442(1997)010<0728:tnasa>2.0.co;2, 1997.
DeBell, L. J., Vozzella, M., Talbot, R. W., and Dibb, J. E.: Asian dust storm events of spring 2001 and associated pollutants observed in New England by the Atmospheric Investigation, Regional Modeling, Analysis and Prediction (AIRMAP) monitoring network, J. Geophys. Res., 109, D01304, https://doi.org/10.1029/2003JD003733, 2004.
DeCarlo, P. F., Dunlea, E. J., Kimmel, J. R., Aiken, A. C., Sueper, D., Crounse, J., Wennberg, P. O., Emmons, L., Shinozuka, Y., Clarke, A., Zhou, J., Tomlinson, J., Collins, D. R., Knapp, D., Weinheimer, A. J., Montzka, D. D., Campos, T., and Jimenez, J. L.: Fast airborne aerosol size and chemistry measurements above Mexico City and Central Mexico during the MILAGRO campaign, Atmos. Chem. Phys., 8, 4027–4048, https://doi.org/10.5194/acp-8-4027-2008, 2008.
de Leeuw, G., Andreas, E. L., Anguelova, M. D., Fairall, C. W., Lewis, E. R., O'Dowd, C., Schulz, M., and Schwartz, S. E.: Production Flux of Sea Spray Aerosol, Rev. Geophys., 49, RG2001, https://doi.org/10.1029/2010rg000349, 2011.
Del Genio, A. D., Yao, M. S., Kovari,W., and Lo, K. K.W.: A prognostic cloud water parameterization for global climate models, J. Climate, 9, 270–304, 1996.
Dickerson, R. R., Kondragunta, S., Stenchikov, G., Civerolo, K. L., Doddridge, B. G., and Holben, B. N.: The impact of aerosols on solar ultraviolet radiation and photochemical smog, Science, 278, 827–830, https://doi.org/10.1126/science.278.5339.827, 1997.
DiGangi, J. P., Choi, Y., Nowak, J. B., Halliday, H. S., Diskin, G. S., Feng, S., Barkley, Z. R., Lauvaux, T., Pal, S., Davis, K. J., Baier, B. C., and Sweeney, C.: Seasonal variability in local carbon dioxide biomass burning sources over central and eastern US using airborne in situ enhancement ratios, J. Geophys. Res.-Atmos., 126, e2020JD034525, https://doi.org/10.1029/2020JD034525, 2021.
Drury, E., Jacob, D. J., Spurr, R. J. D., Wang, J., Shinozuka, Y., Anderson, B. E., Clarke, A. D., Dibb, J., McNaughton, C., and Weber, R.: Synthesis of satellite (MODIS), aircraft (ICARTT), and surface (IMPROVE, EPA-AQS, AERONET) aerosol observations over eastern North America to improve MODIS aerosol retrievals and constrain surface aerosol concentrations and sources, J. Geophys. Res., 115, D14204, https://doi.org/10.1029/2009JD012629, 2010.
Dubovik, O., Smirnov, A., Holben, B. N., King, M. D., Kaufman, Y. J., Eck, T. F., and Slutsker, I.: Accuracy assessments of aerosol optical properties retrieved from Aerosol Robotic Network (AERONET) Sun and sky radiance measurements, J. Geophys. Res., 105, 9791–9806, https://doi.org/10.1029/2000JD900040, 2000.
Eastham, S. D., Weisenstein, D. K., and Barrett, S. R. H.: Development and evaluation of the unified tropospheric-stratospheric chemistry extension (UCX) for the global chemistry-transport model GEOS-Chem, Atmos. Environ., 89, 52–63, https://doi.org/10.1016/j.atmosenv.2014.02.001, 2014.
Eck, T. F., Holben, B. N., Reid, J. S., Dubovik, O., Smirnov, A., O'Neill, N. T., Slutsker, I., and Kinne, S.: Wavelength dependence of the optical depth of biomass burning, urban, and desert dust aerosols, J. Geophys. Res., 104, 31333–31349, 1999.
Edwards, E.-L., Corral, A. F., Dadashazar, H., Barkley, A. E., Gaston, C. J., Zuidema, P., and Sorooshian, A.: Impact of various air mass types on cloud condensation nuclei concentrations along coastal southeast Florida, Atmos. Environ., 254, 118371, https://doi.org/10.1016/j.atmosenv.2021.118371, 2021.
Fairlie, T. D., Jacob, D. J., and Park, R. J.: The impact of transpacific transport of mineral dust in the United States, Atmos. Environ., 41, 1251–1266, 2007.
Fairlie, T. D., Liu, H., Vernier, J.-P., Campuzano-Jost, P., Jimenez, J. L., Jo, D. S., Zhang, B., Natarajan, M., Avery, M. A., and Huey, G.: Estimates of regional source contributions to the Asian Tropopause Aerosol Layer using a chemical transport model, J. Geophys. Res.-Atmos., 125, e2019JD031506, https://doi.org/10.1029/2019JD031506, 2020.
Fast, J. D., Berg, L. K., Zhang, K., Easter, R. C., Ferrare, R. A., Hair, J. W., Hostetler, C. A., Liu, Y., Ortega, I., Sedlacek III, A., Shilling, J. E., Shrivastava, M., Springston, S. R., Tomlinson, J. M., Volkamer, R., Wilson, J., Zaveri, R. A., and Zelenyuk, A.: Model representations of aerosol layers transported from North America over the Atlantic Ocean during the Two-Column Aerosol Project, J. Geophys. Res.-Atmos., 121, 9814–9848, https://doi.org/10.1002/2016JD025248, 2016.
Feng, J., Chan, E., and Vet, R.: Air quality in the eastern United States and Eastern Canada for 1990–2015: 25 years of change in response to emission reductions of SO2 and NOx in the region, Atmos. Chem. Phys., 20, 3107–3134, https://doi.org/10.5194/acp-20-3107-2020, 2020.
Ferrare, R., Hair, J., Hostetler, C., Shingler, T., Burton, S. P., Fenn, M., Clayton, M., Scarino, A. J., Harper, D., Seaman, S., Cook, A., Crosbie, E., Winstead, E., Ziemba, L., Thornhill, L., Robinson, C., Moore, R., Vaughan, M., Sorooshian, A., Schlosser, J. S., Liu, H., Zhang, B., Diskin, G., DiGangi, J., Nowak, J., Choi, Y., Zuidema, P., and Chellappan, S.: Airborne HSRL-2 measurements of elevated aerosol depolarization associated with non-spherical sea salt, Front. Remote Sens., 4, 1143944, https://doi.org/10.3389/frsen.2023.1143944, 2023.
Fischer, E. V., Jacob, D. J., Yantosca, R. M., Sulprizio, M. P., Millet, D. B., Mao, J., Paulot, F., Singh, H. B., Roiger, A., Ries, L., Talbot, R. W., Dzepina, K., and Pandey Deolal, S.: Atmospheric peroxyacetyl nitrate (PAN): a global budget and source attribution, Atmos. Chem. Phys., 14, 2679–2698, https://doi.org/10.5194/acp-14-2679-2014, 2014.
Fisher, J. A., Jacob, D. J., Wang, Q., Bahreini, R., Carouge, C. C., Cubison, M. J., Dibb, J. E., Diehl, T., Jimenez, J. L., Leibensperger, E. M., Meinders, M. B. J., Pye, H. O. T., Quinn, P. K., Sharma, S., van Donkelaar, A., and Yantosca, R. M.: Sources, distribution, and acidity of sulfate-ammonium aerosol in the Arctic in winter-spring, Atmos. Environ., 45, 7301–7318, 2011.
Fountoukis, C. and Nenes, A.: ISORROPIA II: a computationally efficient thermodynamic equilibrium model for K+–Ca2+–Mg2+––Na+–––Cl−–H2O aerosols, Atmos. Chem. Phys., 7, 4639–4659, https://doi.org/10.5194/acp-7-4639-2007, 2007.
Ford, B. and Heald, C. L.: Aerosol loading in the Southeastern United States: reconciling surface and satellite observations, Atmos. Chem. Phys., 13, 9269–9283, https://doi.org/10.5194/acp-13-9269-2013, 2013.
Gallo, F., Sanchez, K. J., Anderson, B. E., Bennett, R., Brown, M. D., Crosbie, E. C., Hostetler, C., Jordan, C., Yang Martin, M., Robinson, C. E., Russell, L. M., Shingler, T. J., Shook, M. A., Thornhill, K. L., Wiggins, E. B., Winstead, E. L., Wisthaler, A., Ziemba, L. D., and Moore, R. H.: Measurement report: Aerosol vertical profiles over the western North Atlantic Ocean during the North Atlantic Aerosols and Marine Ecosystems Study (NAAMES), Atmos. Chem. Phys., 23, 1465–1490, https://doi.org/10.5194/acp-23-1465-2023, 2023.
Gantt, B., Johnson, M. S., Crippa, M., Prévôt, A. S. H., and Meskhidze, N.: Implementing marine organic aerosols into the GEOS-Chem model, Geosci. Model Dev., 8, 619–629, https://doi.org/10.5194/gmd-8-619-2015, 2015.
Generoso, S., Bey, I., Labonne, M., and Breon, F. M.: Aerosol vertical distribution in dust outflow over the Atlantic: Comparisons between GEOS-Chem and Cloud-Aerosol Lidar and Infrared Pathfinder Satellite Observation (CALIPSO), J. Geophys. Res., 113, D24209, https://doi.org/10.1029/2008JD010154, 2008.
Giles, D. M., Sinyuk, A., Sorokin, M. G., Schafer, J. S., Smirnov, A., Slutsker, I., Eck, T. F., Holben, B. N., Lewis, J. R., Campbell, J. R., Welton, E. J., Korkin, S. V., and Lyapustin, A. I.: Advancements in the Aerosol Robotic Network (AERONET) Version 3 database – automated near-real-time quality control algorithm with improved cloud screening for Sun photometer aerosol optical depth (AOD) measurements, Atmos. Meas. Tech., 12, 169–209, https://doi.org/10.5194/amt-12-169-2019, 2019.
Gonzalez, M. E., Corral, A. F., Crosbie, E., Dadashazar, H., Diskin, G. S., Edwards, E.-L., Kirschler, S., Moore, R. H., Robinson, C. E., Schlosser, J. S., Shook, M., Stahl, C., Thornhill, K. L., Voigt, C., Winstead, E., Ziemba, L. D., and Sorooshian, A.: Relationships between supermicrometer particle concentrations and cloud water sea salt and dust concentrations: analysis of MONARC and ACTIVATE data, Environ. Sci.: Atmos., 2, 738–752, https://doi.org/10.1039/D2EA00049K, 2022.
Hansen, J., Sato, M., and Ruedy, R.: Radiative forcing and climate response, J. Geophys. Res.-Atmos., 102, 6831–6864, 1997.
He, T.-L., Jones, D., Molod, A., Kouatchou, J., Zhang, B., Liu, H., Yu, K., and Yantosca, R.: Sensitivity analysis and optimization of the RAS system in GEOS-Chem, 9th International GEOS-Chem Meeting, 6–9 May 2019, Cambridge, MA, USA, https://drive.google.com/file/d/13Jll1ocOqqAh6JrQTSXkjLmemrEHifzp/view (last access: 31 January 2025), 2019.
Hilario, M. R. A., Crosbie, E., Shook, M., Reid, J. S., Cambaliza, M. O. L., Simpas, J. B. B., Ziemba, L., DiGangi, J. P., Diskin, G. S., Nguyen, P., Turk, F. J., Winstead, E., Robinson, C. E., Wang, J., Zhang, J., Wang, Y., Yoon, S., Flynn, J., Alvarez, S. L., Behrangi, A., and Sorooshian, A.: Measurement report: Long-range transport patterns into the tropical northwest Pacific during the CAMP2Ex aircraft campaign: chemical composition, size distributions, and the impact of convection, Atmos. Chem. Phys., 21, 3777–3802, https://doi.org/10.5194/acp-21-3777-2021, 2021.
Holben, B. N., Eck, T. F., Slutsker, I., Tanre, D., Buis, J. P., Setzer, A., Vermote, E., Reagan, J. A., Kaufman, Y. J., Nakajima, T., Lavenu, F., Jankowiak, I., and Smirnov, A.: AERONET – A federated instrument network and data archive for aerosol characterization, Remote Sens. Environ., 66, 1–16, https://doi.org/10.1016/s0034-4257(98)00031-5, 1998.
Hubanks, P., Platnick, S., King, M., and Ridgway, B.: MODIS Algorithm Theoretical Basis Document No. ATBD-MOD-30 for Level-3 Global Gridded Atmosphere Products (08_D3, 08_E3, 08_M3) and Users Guide (Collection 6.0 & 6.1, Version 4.4, 20 February 2019), NASA Goddard Space Flight Center, Greenbelt, Maryland, https://atmosphere-imager.gsfc.nasa.gov/sites/default/files/ModAtmo/L3_ATBD_C6_C61_2019_02_20.pdf (last access: 31 January 2025), 2019.
Jacob, D. J.: Heterogeneous chemistry and tropospheric ozone, Atmos. Environ., 34, 2131–2159, 2000.
Jaeglé, L., Quinn, P. K., Bates, T. S., Alexander, B., and Lin, J.-T.: Global distribution of sea salt aerosols: new constraints from in situ and remote sensing observations, Atmos. Chem. Phys., 11, 3137–3157, https://doi.org/10.5194/acp-11-3137-2011, 2011.
Jaffe, D., Snow, J., and Cooper, O.: The 2001 Asian dust events: Transport and impact on surface aerosol concentrations in the US, Eos, Transactions American Geophysical Union, 84, 501–507, https://doi.org/10.1029/2003eo460001, 2003.
Jin, L., Permar, W., Selimovic, V., Ketcherside, D., Yokelson, R. J., Hornbrook, R. S., Apel, E. C., Ku, I.-T., Collett Jr., J. L., Sullivan, A. P., Jaffe, D. A., Pierce, J. R., Fried, A., Coggon, M. M., Gkatzelis, G. I., Warneke, C., Fischer, E. V., and Hu, L.: Constraining emissions of volatile organic compounds from western US wildfires with WE-CAN and FIREX-AQ airborne observations, Atmos. Chem. Phys., 23, 5969–5991, https://doi.org/10.5194/acp-23-5969-2023, 2023.
Jongeward, A. R., Li, Z., He, H., and Xiong, X.: Natural and Anthropogenic Aerosol Trends from Satellite and Surface Observations and Model Simulations over the North Atlantic Ocean from 2002 to 2012, J. Atmos. Sci., 73, 4469–4485, https://doi.org/10.1175/JAS-D-15-0308.1, 2016.
Keller, C. A., Knowland, K. E., Duncan, B. N., Liu, J., Anderson, D. C., Das, S., Lucchesi, R. A., Lundgren, E. W., Nicely, J. M., Nielsen, E., Ott, L. E., Saunders, E., Strode, S. A., Wales, P. A., Jacob, D. J., and Pawson, S.: Description of the NASA GEOS composition forecast modeling system GEOS-CF v1.0, J. Adv. Model. Earth Sys., 13, e2020MS002413, https://doi.org/10.1029/2020MS002413, 2021.
Kim, D., Chin, M., Yu, H. B., Diehl, T., Tan, Q., Kahn, R. A., Tsigaridis, K., Bauer, S. E., Takemura, T., Pozzoli, L., Bellouin, N., Schulz, M., Peyridieu, S., Chédin, A., and Koffi, B.: Sources, sinks, and transatlantic transport of North African dust aerosol: A multimodel analysis and comparison with remote sensing data, J. Geophys. Res.-Atmos., 119, 6259–6277, https://doi.org/10.1002/2013JD021099, 2014.
Kim, M.-H., Omar, A. H., Tackett, J. L., Vaughan, M. A., Winker, D. M., Trepte, C. R., Hu, Y., Liu, Z., Poole, L. R., Pitts, M. C., Kar, J., and Magill, B. E.: The CALIPSO version 4 automated aerosol classification and lidar ratio selection algorithm, Atmos. Meas. Tech., 11, 6107–6135, https://doi.org/10.5194/amt-11-6107-2018, 2018.
Kim, P. S., Jacob, D. J., Fisher, J. A., Travis, K., Yu, K., Zhu, L., Yantosca, R. M., Sulprizio, M. P., Jimenez, J. L., Campuzano-Jost, P., Froyd, K. D., Liao, J., Hair, J. W., Fenn, M. A., Butler, C. F., Wagner, N. L., Gordon, T. D., Welti, A., Wennberg, P. O., Crounse, J. D., St. Clair, J. M., Teng, A. P., Millet, D. B., Schwarz, J. P., Markovic, M. Z., and Perring, A. E.: Sources, seasonality, and trends of southeast US aerosol: an integrated analysis of surface, aircraft, and satellite observations with the GEOS-Chem chemical transport model, Atmos. Chem. Phys., 15, 10411–10433, https://doi.org/10.5194/acp-15-10411-2015, 2015.
Levy, R. C., Mattoo, S., Munchak, L. A., Remer, L. A., Sayer, A. M., Patadia, F., and Hsu, N. C.: The Collection 6 MODIS aerosol products over land and ocean, Atmos. Meas. Tech., 6, 2989–3034, https://doi.org/10.5194/amt-6-2989-2013, 2013.
Li, J., Carlson, B. E., Yung, Y. L., Lv, D., Hansen, J., Penner, J. E., Liao, H., Ramaswamy, V., Kahn, R. A., Zhang, P., Dubovik, O., Ding, A., Lacis, A. A., Zhang, L., and Dong, Y.: Scattering and absorbing aerosols in the climate system, Nat. Rev. Earth Environ., 3, 363–379, https://doi.org/10.1038/s43017-022-00296-7, 2022a.
Li, Q., Jacob, D. J., Bey, I., Palmer, P. I., Duncan, B. N., Field, B. D., Martin, R. V., Fiore, A. M., Yantosca, R. M., Parrish, D. D., Simmonds, P. G., and Oltmans, S. J.: Transatlantic transport of pollution and its effects on surface ozone in Europe and North America, J. Geophys. Res., 107, 4166, https://doi.org/10.1029/2001JD001422, 2002.
Li, Q., Jacob, D. J., Park, R., Wang, Y., Heald, C. L., Hudman, R., Yantosca, R. M., Martin, R. V., and Evans, M.: North American pollution outflow and the trapping of convectively lifted pollution by upper-level anticyclone, J. Geophys. Res., 110, D10301, https://doi.org/10.1029/2004jd005039, 2005.
Li, X.-Y., Wang, H., Chen, J., Endo, S., George, G., Cairns, B., Chellappan, S., Zeng, X., Kirschler, S., Voigt, C., Sorooshian, A., Crosbie, E., Chen, G., Ferrare, R. A., Gustafson, W. I., Hair, J. W., Kleb, M. M., Liu, H., Moore, R., Painemal, D., Robinson, C., Scarino, A. J., Shook, M., Shingler, T. J., Thornhill, K. L., Tornow, F., Xiao, H., Ziemba, L. D., and Zuidema, P.: Large-Eddy Simulations of Marine Boundary Layer Clouds Associated with Cold-Air Outbreaks during the ACTIVATE Campaign. Part I: Case Setup and Sensitivities to Large-Scale Forcings, J. Atmos. Sci., 79, 73–100, https://doi.org/10.1175/jas-d-21-0123.1, 2022b.
Lin, J.-T. and McElroy, M.: Impacts of boundary layer mixing on pollutant vertical profiles in the lower troposphere: Implications to satellite remote sensing, Atmos. Environ., 44, 1726–1739, https://doi.org/10.1016/j.atmosenv.2010.02.009, 2010.
Lin, S.-J. and Rood, R. B.: Multidimensional flux form semi-Lagrangian transport schemes, Mon. Weather Rev., 124, 2046–2070, 1996.
Liu, H. and Zhang, B.: GEOS-Chem v11-01 for simulating tropospheric aerosols over the western North Atlantic Ocean, Zenodo [code], https://doi.org/10.5281/zenodo.10982278, 2024.
Liu, H., Jacob, D. J., Bey, I., and Yantosca, R. M.: Constraints from 210Pb and 7Be on wet deposition and transport in a global three-dimensional chemical tracer model driven by assimilated meteorological fields, J. Geophys. Res., 106, 12109–12128, 2001.
Liu, H., Crawford, J. H., Considine, D. B., Platnick, S., Norris, P. M., Duncan, B. N., Pierce, R. B., Chen, G., and Yantosca, R. M.: Sensitivity of photolysis frequencies and key tropospheric oxidants in a global model to cloud vertical distributions and optical properties, J. Geophys. Res., 114, D10305, https://doi.org/10.1029/2008JD011503, 2009.
Liu, Z., Kar, J., Zeng, S., Tackett, J., Vaughan, M., Avery, M., Pelon, J., Getzewich, B., Lee, K.-P., Magill, B., Omar, A., Lucker, P., Trepte, C., and Winker, D.: Discriminating between clouds and aerosols in the CALIOP version 4.1 data products, Atmos. Meas. Tech., 12, 703–734, https://doi.org/10.5194/amt-12-703-2019, 2019.
Luan, Y. and Jaeglé, L.: Composite study of aerosol export events from East Asia and North America, Atmos. Chem. Phys., 13, 1221–1242, https://doi.org/10.5194/acp-13-1221-2013, 2013.
Luo, G., Yu, F., and Schwab, J.: Revised treatment of wet scavenging processes dramatically improves GEOS-Chem 12.0.0 simulations of surface nitric acid, nitrate, and ammonium over the United States, Geosci. Model Dev., 12, 3439–3447, https://doi.org/10.5194/gmd-12-3439-2019, 2019.
Luo, G., Yu, F., and Moch, J. M.: Further improvement of wet process treatments in GEOS-Chem v12.6.0: impact on global distributions of aerosols and aerosol precursors, Geosci. Model Dev., 13, 2879–2903, https://doi.org/10.5194/gmd-13-2879-2020, 2020.
Malm, W. C., Sisler, J. F., Huffman, D., Eldred, R. A., and Cahill, T. A.: Spatial and seasonal trends in particle concentration and optical extinction in the United States. J. Geophys. Res.-Atmos., 99, 1347–1370, https://doi.org/10.1029/93JD02916, 1994.
Mardi, A. H., Dadashazar, H., Painemal, D., Shingler, T., Seaman, S. T., Fenn, M. A., Hostetler, C. A., and Sorooshian, A.: Biomass burning over the United States East Coast and western North Atlantic Ocean: Implications for clouds and air quality, J. Geophys. Res.-Atmos., 126, e2021JD034916, https://doi.org/10.1029/2021JD034916, 2021.
Martin, R. V., Jacob, D. J., Yantosca, R. M., Chin, M., and Ginoux, P.: Global and regional decreases in tropospheric oxidants from photochemical effects of aerosols, J. Geophys. Res., 108, 4097, https://doi.org/10.1029/2002JD002622, 2003.
McGrath-Spangler, E. L. and Molod, A.: Comparison of GEOS-5 AGCM planetary boundary layer depths computed with various definitions, Atmos. Chem. Phys., 14, 6717–6727, https://doi.org/10.5194/acp-14-6717-2014, 2014.
NASA/LARC/SD/ASDC: ACTIVATE Falcon Aircraft Merge Data Files, NASA Langley Atmospheric Science Data Center DAAC [data set], https://doi.org/10.5067/ASDC/SUBORBITAL/ACTIVATE_Merge_Data_1, 2021.
NASA/LARC/SD/ASDC: ACTIVATE FLEXible PARTicle (FLEXPART) Dispersion Model Back-trajectories, NASA Langley Atmospheric Science Data Center DAAC [data set], https://doi.org/10.5067/ASDC/SUBORBITAL/ACTIVATE-FLEXPART_1, 2023.
Neuman, J. A., Parrish, D. D., Trainer, M., Ryerson, T. B., Holloway, J. S., Nowak, J. B., Swanson, A., Flocke, F., Roberts, J. M., Brown, S. S., Stark, H., Sommariva, R., Stohl, A., Peltier, R., Weber, R., Wollny, A. G., Sueper, D. T., Hubler, G., and Fehsenfeld, F. C.: Reactive nitrogen transport and photochemistry in urban plumes over the North Atlantic Ocean, J. Geophys. Res., 111, D23S54, https://doi.org/10.1029/2005JD007010, 2006.
Painemal, D., Corral, A. F., Sorooshian, A., Brunke, M. A., Chellappan, S., Gorooh, V. A., Ham, S.-H., O'Neill, L., Smith Jr., W. L., Tselioudis, G., Wang, H., Zeng, X., and Zuidema, P.: An overview of atmospheric features over the Western North Atlantic Ocean and North American East Coast – Part 2: Circulation, boundary layer, and clouds, J. Geophys. Res.-Atmos., 126, e2020JD033423, https://doi.org/10.1029/2020JD033423, 2021.
Painemal, D., Chellappan, S., Smith Jr., W. L., Spangenberg, D., Park, J. M., Ackerman, A., Chen, J., Crosbie, E., Ferrare, R., Hair, J., Kirschler, S., Li, X.-Y., McComiskey, A., Moore, R. H., Sanchez, K., Sorooshian, A., Tornow, F., Voigt, C., Wang, H., Winstead, E., Zeng, X., Ziemba, L., and Zuidema, P.: Wintertime synoptic patterns of midlatitude boundary layer clouds over the western North Atlantic: Climatology and insights from in situ ACTIVATE observations, J. Geophys. Res.-Atmos., 128, e2022JD037725, https://doi.org/10.1029/2022JD037725, 2023.
Park, R. J., Jacob, D. J., Field, B. D., Yantosca, R. M., and Chin, M.: Natural and transboundary pollution influences on sulfate-nitrate-ammonium aerosols in the United States: Implications for policy, J. Geophys. Res., 109, D15204, https://doi.org/10.1029/2003JD004473, 2004.
Perry, K. D., Cahill, T. A., Eldred, R. A., Dutcher, D. D., and Gill, T. E.: Long-range transport of North African dust to the eastern United States, J. Geophys. Res., 102, 11225–11238, https://doi.org/10.1029/97JD00260, 1997.
Peyridieu, S., Chédin, A., Tanré, D., Capelle, V., Pierangelo, C., Lamquin, N., and Armante, R.: Saharan dust infrared optical depth and altitude retrieved from AIRS: a focus over North Atlantic – comparison to MODIS and CALIPSO, Atmos. Chem. Phys., 10, 1953–1967, https://doi.org/10.5194/acp-10-1953-2010, 2010.
Pfister, G. G., Emmons, L. K., Hess, P. G., Honrath, R., Lamarque, J.-F., Val Martin, M., Owen, R. C., Avery, M. A., Browell, E. V., Holloway, J. S., Nedelec, P., Purvis, R., Ryerson, T. B., Sachse, G. W., and Schlager, H.: Ozone production from the 2004 North American boreal fires, J. Geophys. Res., 111, D24S07, https://doi.org/10.1029/2006JD007695, 2006.
Philip, S., Marin, R. V., Pierce, J. R., Jimenez, J. L., Zhang, Q., Canagaratna, M. R., Spracklen, D. V., Nowlan, C. R., Lamsal, L. N., Cooper, M. J., and Krotkov, N. A.: Spatially and seasonally resolved estimate of the ratio of organic mass to organic carbon, Atmos. Environ., 87, 34–40, https://doi.org/10.1016/j.atmosenv.2013.11.065, 2014.
Philip, S., Martin, R. V., and Keller, C. A.: Sensitivity of chemistry-transport model simulations to the duration of chemical and transport operators: a case study with GEOS-Chem v10-01, Geosci. Model Dev., 9, 1683–1695, https://doi.org/10.5194/gmd-9-1683-2016, 2016.
Provençal, S., Kishcha, P., da Silva, A. M., Elhacham, E., and Alpert, P.: AOD distributions and trends of major aerosol species over a selection of the world's most populated cities based on the 1st version of NASA's MERRA Aerosol Reanalysis, Urban Climate, 20, 168–191, https://doi.org/10.1016/j.uclim.2017.04.001, 2017.
Pye, H. O. T. and Seinfeld, J. H.: A global perspective on aerosol from low-volatility organic compounds, Atmos. Chem. Phys., 10, 4377–4401, https://doi.org/10.5194/acp-10-4377-2010, 2010.
Pye, H. O. T., Chan, A. W. H., Barkley, M. P., and Seinfeld, J. H.: Global modeling of organic aerosol: the importance of reactive nitrogen (NOx and NO3), Atmos. Chem. Phys., 10, 11261–11276, https://doi.org/10.5194/acp-10-11261-2010, 2010.
Quinn, P. K. and Bates, T.: Ocean-Derived Aerosol and Its Climate impacts, in: Treatise on Geochemistry, Elsevier, Oxford, 317–330, https://doi.org/10.1016/b978-0-08-095975-7.00416-2, 2014.
Ridley, D. A., Heald, C. L., and Ford, B.: North African dust export and deposition: A satellite and model perspective, J. Geophys. Res., 117, D02202, https://doi.org/10.1029/2011JD016794, 2012.
Savoie, D. L. and Prospero, J. M.: Aerosol concentration statistics for northern tropical Atlantic, J. Geophys. Res., 82, 5954–5964, 1977.
Sayer, A. M., Munchak, L. A., Hsu, N. C., Levy, R. C., Bettenhausen, C., and Jeong, M.-J.: MODIS Collection 6 aerosol products: Comparison between Aqua's e-Deep Blue, Dark Target, and “merged” data sets, and usage recommendations, J. Geophys. Res.-Atmos., 119, 13965–13989, https://doi.org/10.1002/2014JD022453, 2014.
Seethala, C., Zuidema, P., Edson, J., Brunke, M., Chen, G., Li, X.-Y., Painemal, D., Robinson, C., Shingler, T., Shook, M., Sorooshian, A., Thornhill, L., Tornow, F., Wang, H., Zeng, X., and Ziemba, L.: On Assessing ERA5 and MERRA2 Representations of Cold-Air Outbreaks Across the Gulf Stream, Geophys. Res. Lett., 48, e2021GL094364, https://doi.org/10.1029/2021GL094364, 2021.
Shingler, T., Dey, S., Sorooshian, A., Brechtel, F. J., Wang, Z., Metcalf, A., Coggon, M., Mülmenstädt, J., Russell, L. M., Jonsson, H. H., and Seinfeld, J. H.: Characterisation and airborne deployment of a new counterflow virtual impactor inlet, Atmos. Meas. Tech., 5, 1259–1269, https://doi.org/10.5194/amt-5-1259-2012, 2012.
Silva, S. J., Ridley, D. A., and Heald, C. L.: Exploring the constraints on simulated aerosol sources and transport across the North Atlantic with island-based sun photometers, Earth and Space Science, 7, e2020EA001392, https://doi.org/10.1029/2020EA001392, 2020.
Smirnov, A., Holben, B. N., Eck, T. F., Dubovik, O., and Slutsker, I.: Cloud screening and quality control algorithms for the AERONET database, Remote Sens. Environ., 73, 337–349, https://doi.org/10.1016/S0034-4257(00)00109-7, 2000.
Solomon, P. A., Crumpler, D., Flanagan, J. B., Jayanty, R. K. M., Rickman, E. E., and McDade, C. E.: U.S. National PM2.5 Chemical Speciation Monitoring Networks – CSN and IMPROVE: Description of networks, J. Air Waste Manage., 64, 1410–1438, https://doi.org/10.1080/10962247.2014.956904, 2014.
Sorooshian, A., Anderson, B., Bauer, S. E., Braun, R. A., Cairns, B., Crosbie, E., Dadashazar, H., Diskin, G., Ferrare, R., Flagan, R. C., Hair, J., Hostetler, C., Jonsson, H. H., Kleb, M. M., Liu, H., MacDonald, A. B., McComiskey, A., Moore, R., Painemal, D., Russell, L. M., Seinfeld, J. H., Shook, M., Smith, W. L., Thornhill, K., Tselioudis, G., Wang, H., Zeng, X., Zhang, B., Ziemba, L., and Zuidema, P.: Aerosol–Cloud–Meteorology Interaction Airborne Field Investigations: Using Lessons Learned from the U.S. West Coast in the Design of ACTIVATE off the U.S. East Coast, B. Am. Meteorol. Soc., 100, 1511–1528, https://doi.org/10.1175/BAMS-D-18-0100.1, 2019.
Sorooshian, A., Corral, A. F., Braun, R. A., Cairns, B., Crosbie, E., Ferrare, R., Hair, J., Kleb, M. M., Mardi, A. H., Maring, H., McComiskey, A., Moore, R., Painemal, D., Scarino, A. J., Schlosser, J., Shingler, T., Shook, M., Wang, H., Zeng, X., Ziemba, L., and Zuidema, P.: Atmospheric Research Over the Western North Atlantic Ocean Region and North American East Coast: A Review of Past Work and Challenges Ahead, J. Geophys. Res.-Atmos., 125, e2019JD031626, https://doi.org/10.1029/2019JD031626, 2020.
Sorooshian, A., Alexandrov, M. D., Bell, A. D., Bennett, R., Betito, G., Burton, S. P., Buzanowicz, M. E., Cairns, B., Chemyakin, E. V., Chen, G., Choi, Y., Collister, B. L., Cook, A. L., Corral, A. F., Crosbie, E. C., van Diedenhoven, B., DiGangi, J. P., Diskin, G. S., Dmitrovic, S., Edwards, E.-L., Fenn, M. A., Ferrare, R. A., van Gilst, D., Hair, J. W., Harper, D. B., Hilario, M. R. A., Hostetler, C. A., Jester, N., Jones, M., Kirschler, S., Kleb, M. M., Kusterer, J. M., Leavor, S., Lee, J. W., Liu, H., McCauley, K., Moore, R. H., Nied, J., Notari, A., Nowak, J. B., Painemal, D., Phillips, K. E., Robinson, C. E., Scarino, A. J., Schlosser, J. S., Seaman, S. T., Seethala, C., Shingler, T. J., Shook, M. A., Sinclair, K. A., Smith Jr., W. L., Spangenberg, D. A., Stamnes, S. A., Thornhill, K. L., Voigt, C., Vömel, H., Wasilewski, A. P., Wang, H., Winstead, E. L., Zeider, K., Zeng, X., Zhang, B., Ziemba, L. D., and Zuidema, P.: Spatially coordinated airborne data and complementary products for aerosol, gas, cloud, and meteorological studies: the NASA ACTIVATE dataset , Earth Syst. Sci. Data, 15, 3419–3472, https://doi.org/10.5194/essd-15-3419-2023, 2023.
Stohl, A., Hittenberger, M., and Wotawa, G.: Validation of the Lagrangianparticle dispersion model FLEXPART against large-scale tracer experiment data, Atmos. Environ., 32, 4245–4264, 1998.
Streets, D. G., Wu, Y., and Chin, M.: Two-Decadal Aerosol Trends as a Likely Explanation of the Global Dimming/Brightening Transition, Geophys. Res. Lett., 33, L15806, https://doi.org/10.1029/2006GL026471, 2006.
Tackett, J. L., Winker, D. M., Getzewich, B. J., Vaughan, M. A., Young, S. A., and Kar, J.: CALIPSO lidar level 3 aerosol profile product: version 3 algorithm design, Atmos. Meas. Tech., 11, 4129–4152, https://doi.org/10.5194/amt-11-4129-2018, 2018.
Tai, A. P. K., Mickley, L. J., and Jacob, D. J.: Correlations between Fine Particulate Matter (PM2.5) and meteorological variables in the United States: Implications for the sensitivity of PM2.5 to climate change, Atmos. Environ., 44, 3976–3984, https://doi.org/10.1016/j.atmosenv.2010.06.060, 2010.
The International GEOS-Chem User Community: Input data files for GEOS-Chem, The International GEOS-Chem User Community [data set], http://geoschemdata.wustl.edu/ExtData, 30 last access: June 2022.
Tornow, F., Ackerman, A. S., Fridlind, A. M., Cairns, B., Crosbie, E. C., Kirschler, S., Moore, R. H., Painemal, D., Robinson, C. E., Seethala, C., Shook, M. A., Voigt, C., Winstead, E. L., Ziemba, L. D., Zuidema, P., and Sorooshian, A.: Dilution of Boundary Layer Cloud Condensation Nucleus Concentrations by Free Tropospheric Entrainment During Marine Cold Air Outbreaks, Geophys. Res. Lett., 49, e2022GL098444, https://doi.org/10.1029/2022GL098444, 2022.
Tucker, G. B. and Barry, R. G.: Climate of the North Atlantic Ocean, in: Climates of the Oceans, edited by: Van Loon, H., Elsevier Science Ltd, New York, ISBN 0444413375, 193–262, 734 pp., 1984.
Twomey, S.: Pollution and the planetary albedo, Atmos. Environ., 8, 1251–1256, 1974.
Twomey, S.: The influence of pollution on the shortwave albedo of clouds, J. Atmos. Sci., 34, 1149–1152, 1977.
Val Martin, M., Logan, J. A., Kahn, R. A., Leung, F.-Y., Nelson, D. L., and Diner, D. J.: Smoke injection heights from fires in North America: analysis of 5 years of satellite observations, Atmos. Chem. Phys., 10, 1491–1510, https://doi.org/10.5194/acp-10-1491-2010, 2010.
van Donkelaar, A., Martin, R. V., Li, C., and Burnett, R. T.: Regional Estimates of Chemical Composition of Fine Particulate Matter using a Combined Geoscience-Statistical Method with Information from Satellites, Models, and Monitors, Environ. Sci. Technol., 53, 2595–2611, https://doi.org/10.1021/acs.est.8b06392, 2019.
Wang, Q., Jacob, D. J., Fisher, J. A., Mao, J., Leibensperger, E. M., Carouge, C. C., Le Sager, P., Kondo, Y., Jimenez, J. L., Cubison, M. J., and Doherty, S. J.: Sources of carbonaceous aerosols and deposited black carbon in the Arctic in winter-spring: implications for radiative forcing, Atmos. Chem. Phys., 11, 12453–12473, https://doi.org/10.5194/acp-11-12453-2011, 2011.
Wang, Q., Jacob, D. J., Spackman, J. R., Perring, A. E., Schwarz, J. P., Moteki, N., Marais, E. A., Ge, C., Wang, J., and Barrett, S. R. H.: Global budget and radiative forcing of black carbon aerosol: constraints from pole-to-pole (HIPPO) observations across the Pacific, J. Geophys. Res., 119, 195–206, 2014.
Wang, J., Wood, R., Jensen, M. P., Chiu, J. C., Liu, Y., Lamer, K., Desai, N., Giangrande, S. E., Knopf, D. A., Kollias, P., Laskin, A., Liu, X., Lu, C., Mechem, D., Mei, F., Starzec, M., Tomlinson, J., Wang, Y., Yum, S. S., Zheng, G., Aiken, A. C., Azevedo, E. B., Blanchard, Y., China, S., Dong, X., Gallo, F., Gao, S., Ghate, V. P., Glienke, S., Goldberger, L., Hardin, J. C., Kuang, C., Luke, E. P., Matthews, A. A., Miller, M. A., Moffet, R., Pekour, M., Schmid, B., Sedlacek, A. J., Shaw, R. A., Shilling, J. E., Sullivan, A., Suski, K., Veghte, D. P., Weber, R., Wyant, M., Yeom, J., Zawadowicz, M., and Zhang, Z.: Aerosol and Cloud Experiments in the Eastern North Atlantic (ACE-ENA), B. Am. Meteorol. Soc., 103, 1–51, https://doi.org/10.1175/BAMS-D-19-0220.1, 2021.
Wesely, M. L.: Parameterization of surface resistance to gaseous dry deposition in regional-scale numerical models, Atmos. Environ., 23, 1293–1304, 1989.
Winker, D. M., Pelon, J., Coakley Jr., J. A., Ackerman, S. A., Charlson, R. J., Colarco, P. R., Flamant, P., Fu, Q., Hoff, R. M., Kittaka, C., Kubar, T. L., Le Treut, H., McCormick, M. P., Mégie, G., Poole, L., Powell, K., Trepte, C., Vaughan, M. A., and Wielicki, B. A.: The CALIPSO mission: A global 3D view of aerosols and clouds, B. Am. Meteorol. Soc., 91, 1211–1229, https://doi.org/10.1175/2010BAMS3009.1, 2010.
Winker, D. M., Tackett, J. L., Getzewich, B. J., Liu, Z., Vaughan, M. A., and Rogers, R. R.: The global 3-D distribution of tropospheric aerosols as characterized by CALIOP, Atmos. Chem. Phys., 13, 3345–3361, https://doi.org/10.5194/acp-13-3345-2013, 2013.
Wu, S., Mickley, L. J., Jacob, D. J., Logan, J. A., Yantosca, R. M., and Rind, D.: Why are there large differences between models in global budgets of tropospheric ozone?, J. Geophys. Res., 112, D05302, https://doi.org/10.1029/2006JD007801, 2007.
Wu, H., Xu, X., Luo, T., Yang, Y., Xiong, Z., and Wang, Y.: Variation and comparison of cloud cover in MODIS and four reanalysis datasets of ERA-interim, ERA5, MERRA-2 and NCEP, Atmos. Res., 281, 106477, https://doi.org/10.1016/j.atmosres.2022.106477, 2022.
Yang, Y., Wang, H., Smith, S. J., Zhang, R., Lou, S., Yu, H., Li, C., and Rasch, P. J.: Source apportionments of aerosols and their direct radiative forcing and long-term trends over continental United States, Earths Future, 6, 793–808, https://doi.org/10.1029/2018EF000859, 2018.
Yu, H., Chin, M., Winker, D. M., Omar, A. H., Liu, Z., Kittaka, C., and Diehl, T.: Global view of aerosol vertical distributions from CALIPSO lidar measurements and GOCART simulations: Regional and seasonal variations, J. Geophys. Res., 115, D00H30, https://doi.org/10.1029/2009JD013364, 2010.
Yu, K., Keller, C. A., Jacob, D. J., Molod, A. M., Eastham, S. D., and Long, M. S.: Errors and improvements in the use of archived meteorological data for chemical transport modeling: an analysis using GEOS-Chem v11-01 driven by GEOS-5 meteorology, Geosci. Model Dev., 11, 305–319, https://doi.org/10.5194/gmd-11-305-2018, 2018.
Zender, C. S., Bian, H., and Newman, D.: Mineral dust entrainment and deposition (DEAD) model: Description and 1990s dust climatology. J. Geophys. Res., 108, 4416, https://doi.org/10.1029/2002JD002775, 2003.
Zhang, B., Liu, H., Crawford, J. H., Chen, G., Fairlie, T. D., Chambers, S., Kang, C.-H., Williams, A. G., Zhang, K., Considine, D. B., Sulprizio, M. P., and Yantosca, R. M.: Simulation of radon-222 with the GEOS-Chem global model: emissions, seasonality, and convective transport, Atmos. Chem. Phys., 21, 1861–1887, https://doi.org/10.5194/acp-21-1861-2021, 2021.
Zhang, H., Yee, L. D., Lee, B. H., Curtis, M. P., Worton, D. R., Isaacman-VanWertz, G., Offenberg, J. H., Lewandowski, M., Kleindienst, T. E., Beaver, M. R., Holder, A. L., Lonneman, W. A., Docherty, K. S., Jaoui, M., Pye, H. O. T., Hu, W., Day, D. A., Campuzano-Jost, P., Jimenez, J. L., Guo, H., Weber, R. J., de Gouw, J., Koss, A. R., Edgerton, E. S., Brune, W., Mohr, C., Lopez-Hilfiker, F. D., Lutz, A., Kreisberg, N. M., Spielman, S. R., Hering, S. V., Wilson, K. R., Thornton, J. A., and Goldstein, A. H.: Monoterpenes are the largest source of summertime organic aerosol in the southeastern United States, P. Natl. Acad. Sci. USA, 115, 2038–2043, https://doi.org/10.1073/pnas.1717513115, 2018.
Zhang, L., Kok, J. F., Henze, D. K., Li, Q., and Zhao, C.: Improving simulations of fine dust surface concentrations over the western United States by optimizing the particle size distribution, Geophys. Res. Lett., 40, 3270–3275, https://doi.org/10.1002/grl.50591, 2013.
Zhang, Y., Luo, G., and Yu, F.: Seasonal variations and long‐term trend of dust particle number concentration over the northeastern United States, J. Geophys. Res., 124, 13140–13155, https://doi.org/10.1029/2019JD031388, 2019.
Zheng, G., Wang, Y., Aiken, A. C., Gallo, F., Jensen, M. P., Kollias, P., Kuang, C., Luke, E., Springston, S., Uin, J., Wood, R., and Wang, J.: Marine boundary layer aerosol in the eastern North Atlantic: seasonal variations and key controlling processes, Atmos. Chem. Phys., 18, 17615–17635, https://doi.org/10.5194/acp-18-17615-2018, 2018.
Zheng, G., Sedlacek, A. J., Aiken, A. C., Feng, Y., Watson, T. B., Raveh-Rubin, S., Uin, J., Lewis, E. R., and Wang, J.: Long-range transported North American wildfire aerosols observed in marine boundary layer of eastern North Atlantic, Environ. Int., 139, 105680, https://doi.org/10.1016/j.envint.2020.105680, 2020.
Zheng, Y., Horowitz, L. W., Menzel, R., Paynter, D. J., Naik, V., Li, J., and Mao, J.: Anthropogenic amplification of biogenic secondary organic aerosol production, Atmos. Chem. Phys., 23, 8993–9007, https://doi.org/10.5194/acp-23-8993-2023, 2023.
Zhu, L., Val Martin, M., Gatti, L. V., Kahn, R., Hecobian, A., and Fischer, E. V.: Development and implementation of a new biomass burning emissions injection height scheme (BBEIH v1.0) for the GEOS-Chem model (v9-01-01), Geosci. Model Dev., 11, 4103–4116, https://doi.org/10.5194/gmd-11-4103-2018, 2018.
Zhuang, Y., Fu, R., Santer, B. D., Dickinson, R. E., and Hall, A.: Quantifying contributions of natural variability and anthropogenic forcings on increased fire weather risk over the western United States, P. Natl. Acad. Sci. USA, 118, e2111875118, https://doi.org/10.1073/pnas.2111875118, 2021.
- Abstract
- Introduction
- Model and data
- Meteorological settings and transport pathways
- Simulated aerosols over the WNAO and model evaluations
- Source attributions of AODs over the WNAO during ACTIVATE
- Summary and conclusions
- Code and data availability
- Author contributions
- Competing interests
- Disclaimer
- Acknowledgements
- Financial support
- Review statement
- References
- Supplement