the Creative Commons Attribution 4.0 License.
the Creative Commons Attribution 4.0 License.
 | 13 Feb 2025
Cloud processing of dimethyl sulfide (DMS) oxidation products limits sulfur dioxide (SO2) and carbonyl sulfide (OCS) production in the eastern North Atlantic marine boundary layer
Delaney B. Kilgour
Christopher M. Jernigan
Olga Garmash
Sneha Aggarwal
Shengqian Zhou
Claudia Mohr
Matt E. Salter
Joel A. Thornton
Jian Wang
Paul Zieger
Timothy H. Bertram
Dimethyl sulfide (DMS) is the major sulfur species emitted from the ocean. The gas-phase oxidation of DMS by hydroxyl radicals proceeds through the stable, soluble intermediate hydroperoxymethyl thioformate (HPMTF), eventually forming carbonyl sulfide (OCS) and sulfur dioxide (SO2). Recent work has shown that HPMTF is efficiently lost to marine boundary layer (MBL) clouds, thus arresting OCS and SO2 production and their contributions to new-particle formation and growth events. To date, no long-term field studies exist to assess the extent to which frequent cloud processing impacts the fate of HPMTF. Here, we present 6 weeks of measurements of the cloud fraction and the marine sulfur species methanethiol, DMS, and HPMTF made at the Atmospheric Radiation Measurement (ARM) research facility on Graciosa Island, Azores, Portugal. Using an observationally constrained chemical box model, we determine that cloud loss is the dominant sink of HPMTF in this region of the MBL during the study, accounting for 79 %–91 % of HPMTF loss on average. When accounting for HPMTF uptake to clouds, we calculate campaign average reductions in DMS-derived MBL SO2 and OCS of 52 %–60 % and 80 %–92 % for the study period. Using yearly measurements of the site- and satellite-measured 3D cloud fraction and DMS climatology, we infer that HPMTF cloud loss is the dominant sink of HPMTF in the eastern North Atlantic during all seasons and occurs on timescales faster than what is prescribed in global chemical transport models. Accurately resolving this rapid loss of HPMTF to clouds has important implications for constraining drivers of MBL new-particle formation.
- Article
(2186 KB) - Full-text XML
-
Supplement
(634 KB) - BibTeX
- EndNote


Aqueous reactions in clouds can significantly alter trace gas and aerosol budgets by acting as efficient terminal sinks for water-soluble species and sites for the formation of reactive products (Barth et al., 2021; Li et al., 2017; Yang et al., 2015). Examples include cloud scavenging of dinitrogen pentoxide (N2O5) and nitric acid (HNO3) influencing the tropospheric NOx budget (Holmes et al., 2019; Levine and Schwartz, 1982), uptake of sulfur dioxide (SO2) contributing to aerosol production and acid rain (Irwin and Williams, 1988), cloud processing increasing the production of isoprene secondary organic aerosol (SOA) (Lamkaddam et al., 2021), and cloud chemistry controlling the conversion of dimethyl sulfide (CH3SCH3; DMS) to SO2 and methane sulfonic acid (CH3SO3H; MSA) (Chen et al., 2018; Hoffmann et al., 2016). By redistributing chemical budgets in the lower troposphere, cloud processing can consequently affect the spatial distribution and availability of vapors to contribute to new-particle formation (Novak et al., 2021), the concentration of cloud condensation nuclei (CCN) (Feingold et al., 1998), and the magnitude of long-lived climate forcing products (Jernigan et al., 2022a; Novak et al., 2021).
For water-soluble species with high uptake coefficients that react irreversibly, uptake to cloud droplets is limited by gas-phase diffusion to the droplet surface, leading to in-cloud lifetimes for typical cloud conditions on the order of 10 s or less (Holmes et al., 2019; Levine and Schwartz, 1982). Large-eddy-simulation studies indicate that the residence time of air within the cloud is significantly longer, ranging from 15 min to 2 h for many stratus and stratocumulus clouds (Feingold et al., 1998, 2013; Kogan, 2006; Stevens et al., 1996) and even longer for cirrus clouds (Podglajen et al., 2016). This results in the complete and rapid removal of water-soluble molecules that react irreversibly in the cloud layer. As such, cloud processing of water-soluble species with irreversible uptake in the well-mixed boundary layer is dependent on the mixing rate of clear air into cloud, here referred to as the cloud entrainment rate (Holmes et al., 2019). A new method using entrainment-limited uptake, incorporating the grid cell cloud fraction from satellite reanalysis products (MERRA-2, the Modern-Era Retrospective Analysis for Research and Applications, Version 2) and entrainment into the kinetic rate expression, was recently developed to account for cloud uptake (Holmes, 2022; Holmes et al., 2019) and has been implemented into global chemical transport models to evaluate chemical budgets for a variety of species, including halogen-, sulfur-, and nitrogen-containing molecules (Alexander et al., 2020; Chan et al., 2021; Holmes et al., 2019; Jernigan et al., 2022a; Novak et al., 2021; Shah et al., 2021; Wang et al., 2021). This method utilizes an average entrainment rate of 1 h−1 based on mean values of cloud residence time for stratus and stratocumulus clouds, scaled by the satellite-derived 3D cloud fraction (Holmes et al., 2019). This entrainment-limited method has been shown to be more physically accurate and less computationally expensive than previous parameterizations for cloud uptake, such as the thin-cloud (Parrella et al., 2012) and cloud partitioning (Tost et al., 2006) approximations.
Trace gas uptake by clouds can play a particularly important role in trace gas and aerosol budgets in the marine boundary layer (MBL) due to the large and persistent cover of low-level clouds over the oceans. Globally, stratus and stratocumulus clouds are present over 10 %–70 % of the MBL, and their coverage can exceed 50 % in the annual mean over subtropical and midlatitude oceans (Wood, 2012). More recent estimates reported even larger 5-year-averaged low-level cloud fractions, exceeding 70 % in the subtropics and in the extratropical North Atlantic, North Pacific, and Southern oceans, regions where stratocumulus cloud decks are common (Naud et al., 2023). Given that the ocean is the largest natural source of reduced sulfur to the atmosphere, primarily in the form of DMS (∼ 27.1 Tg S yr−1) (Andreae, 1990; Bates et al., 1992; Hulswar et al., 2022) and to a lesser extent, methanethiol (CH3SH; MeSH) (Novak et al., 2022), low-level MBL clouds have the potential to impact the sulfur budget globally through the uptake of their soluble oxidation intermediates.
DMS is formed in the ocean as one of two major degradation products of the precursor algal metabolite dimethylsulfoniopropionate (DMSP) (Challenger and Simpson, 1948). The other DMSP degradation product is MeSH (Kiene, 1996). Once emitted to the atmosphere, the primary fate of both DMS and MeSH is reaction with hydroxyl radicals (OH), with the lifetime of DMS to OH approximately 5 times longer than that of MeSH to OH at 298 K (Burkholder et al., 2019). The OH oxidation of MeSH and subsequent O2 addition forms the CH3SOO radical; the CH3SOO radical isomerizes to CH3SO2, which has a temperature-dependent branching ratio, forming SO2 or MSA (Chen et al., 2023). Recent computational work has shown that the SO2 yield from CH3SO2 is 99 % at 300 K but drops to 4 % at 260 K (Chen et al., 2023). The OH oxidation of DMS is also highly temperature dependent, proceeding by either OH addition (∼ 30 % at 298 K) or by H abstraction (∼ 70 % at 298 K). The OH addition pathway leads to the formation of several soluble products, including MSA, methane sulfinic acid (CH4O2S; MSIA), dimethyl sulfoxide (CH3SOCH3; DMSO), and dimethyl sulfone (C2H6O2S; DMSO2), and primarily contributes to particle growth (Barnes et al., 1994; Conley et al., 2009; Hoffmann et al., 2016). The H abstraction pathway produces the methylthiomethyl peroxy radical (CH3SCH2OO; MTMP), which can undergo intramolecular hydrogen shift rearrangements and additions of O2 to form the stable, soluble intermediate hydroperoxymethyl thioformate (HOOCH2SCHO; HPMTF) (Berndt et al., 2019; Wu et al., 2015). This isomerization pathway to HPMTF production competes with bimolecular reactions between MTMP and NO, HO2, and RO2 (Berndt et al., 2019), which are typically in low concentrations in the marine atmosphere (< 15, < 15, and < 150 ppt, respectively) (Creasey et al., 2003; Lee et al., 2009; Vaughan et al., 2012). Once formed, HPMTF is further oxidized by OH to carbonyl sulfide (OCS) (Jernigan et al., 2022a) and SO2 (Veres et al., 2020), leading to new sulfate (SO) aerosol particle formation through the production of sulfuric acid (H2SO4). Recent aircraft measurements found that HPMTF was globally ubiquitous in the MBL (Veres et al., 2020), and global chemical transport modeling showed that it is the dominant reservoir of DMS oxidation products; analyses in this study indicated that the yield of HPMTF from the DMS H abstraction pathway (αHPMTF) was 0.76 and estimated that 46 % of all DMS emitted globally formed HPMTF (Novak et al., 2021). HPMTF has also been shown to be efficiently depleted in MBL cloud, suggesting irreversible loss (Novak et al., 2021; Siegel et al., 2023; Veres et al., 2020; Vermeuel et al., 2020), which is briefly summarized below.
Aircraft measurements by Veres et al. (2020) first showed the rapid depletion of HPMTF within the MBL cloud layer during Atmospheric Tomography Mission (ATom) 3 and 4, reporting a 75 % on average reduction in HPMTF in the presence of cloud. This result was subsequently supported by several qualitative findings at ground sites. For example, in coastal southern California, Vermeuel et al. (2020) found that observed HPMTF diurnal profiles could only be reproduced by a model when including time-dependent HPMTF cloud loss based on GOES imagery. In the Arctic, Siegel et al. (2023) measured reduced HPMTF in cloudy and semi-cloudy conditions compared to cloud-free conditions. The only existing collocated measurements of DMS and HPMTF are from a flight off the coast of southern California (Novak et al., 2021). In cloud-free conditions, average was low (1.25) but was much higher (20) below the cloud deck, evidence for cloud processing of the DMS oxidation product, HPMTF. Analysis of eddy covariance flux measurements of HPMTF on this same flight produced the only quantified loss rate of HPMTF to cloud currently in the literature (Novak et al., 2021). The timescale of HPMTF loss to a stratocumulus cloud deck was 1.2 ± 0.6 h, which was more than 4 times faster than other HPMTF loss pathways. This irreversible cloud uptake of HPMTF weakens the links between DMS and the climate forcing products OCS and SO2 along the H abstraction pathway, as well as subsequent new-particle formation and CCN production. Global model analyses incorporating the HPMTF cloud loss term determined from Novak et al. (2021) indicated that cloud chemistry reduced SO2 production from DMS globally by 35 % (Novak et al., 2021) and OCS production globally by 92 % (Jernigan et al., 2022a). Further, the prompt conversion of aqueous HPMTF in cloud to SO at unit yield (Jernigan et al., 2024) could significantly increase SO concentrations while bypassing new-particle formation (Novak et al., 2021).
However, to date, no long-term field studies exist with coincident measurements of DMS and HPMTF. This limits our ability to assess how cloud chemistry impacts DMS oxidation on long timescales, where the cloud fraction and cloud type are expected to vary. Here, we present 6 weeks of in situ measurements of the reactant and product pair DMS and HPMTF, as well as MeSH, made in the eastern North Atlantic (ENA). We use these gas-phase measurements and extensive observations of atmospheric and cloud properties made at the Atmospheric Radiation Measurement (ARM) research facility on Graciosa Island, Azores, Portugal, with a chemical box model to determine how frequent cloud processing impacts the conversion of DMS to SO2 and OCS in the MBL. We show that over a 6-week period, cloud uptake is the dominant loss process of HPMTF and occurs at rates significantly faster than what is currently prescribed in global chemical transport models, where uptake is scaled by the satellite-derived cloud fraction.
2.1 Measurements of gas-phase sulfur species at ENA
Continuous, real-time measurements of DMS, MeSH, and HPMTF were made from 1 June to 15 July 2022 at the ENA ARM Research Facility on Graciosa Island, Azores, Portugal (39.0916° N, 28.0257° W; 30 m elevation), as part of the Aerosol Growth in the Eastern North Atlantic (AGENA) project. DMS and MeSH were measured at 10 m above ground level with a Vocus proton transfer reaction time-of-flight mass spectrometer (RT-Vocus; Aerodyne Research, Inc. and Tofwerk AG) (Krechmer et al., 2018). Full details of the RT-Vocus sampling at AGENA and quantifications of DMS and MeSH are reported in Kilgour et al. (2024). Collocated HPMTF measurements at 4 m a.g.l. were made with a chemical ionization time-of-flight mass spectrometer (Aerodyne Research, Inc. and Tofwerk AG) equipped with a medium-pressure (50 mbar) Vocus AIM reactor (Riva et al., 2024). The lower inlet height of the Vocus AIM relative to the RT-Vocus was a result of the Vocus AIM requiring a shorter inlet to minimize inlet loss of oxidized species. Multiple reagent ions, namely iodide, bromide, and benzene, were generated using vacuum ultraviolet (VUV) lamps to target a wide range of oxygenated and non-oxygenated compounds. HPMTF was detected with the iodide reagent ion as an adduct ion with iodide ([I⋅C2H4O3S]−). This mass was < 0.1 m/Q from N2O5 and at the same unit mass as several other peaks (Supplemental Sect. S1). The instrument resolution () did not enable separable peak fitting of the closest two peaks, HPMTF and N2O5, leading to some early morning interference in HPMTF when N2O5 was present. However, the N2O5 signal was small due to low NOx ambient conditions, and HPMTF and N2O5 had different diurnal profiles, resulting in minimal impact overall on this analysis. Vocus AIM zeros were completed every hour at the capillary, and HPMTF was quantified post-campaign with the experimentally determined humidity-dependent calibration factor for formic acid, based on the similar iodide adduct binding enthalpies for HPMTF and formic acid (Iyer et al., 2016; Jernigan et al., 2022a). By comparing clear-sky measurements of HPMTF to modeled clear-sky HPMTF, we estimate that the HPMTF concentrations reported here using the formic acid calibration factor are underestimated by up to 60 % due to a combination of inlet loss of HPMTF and the lack of an authentic calibration standard (Fig. S1 in the Supplement). As a result, all of the following reported measurements of [HPMTF] and , which use the calibration factor to formic acid, should be interpreted as a lower limit and an upper limit, respectively. More details on the HPMTF measurement, quantification, and derivation of its uncertainty are in Sect. S1. The limits of detection for a signal-to-noise ratio of 3 at 5 min averaging for DMS, MeSH, and HPMTF were 1.8, 5.1, and 0.1 ppt, respectively (Bertram et al., 2011). HPMTF was below the detection limit in 19 % of 5 min averaged HPMTF data points; diurnally, this was largest in the early morning at 07:00 LT (32 %) and lowest in the afternoon at 16:00 LT (3.6 %), where these and all following times are in local time. Points below the detection limit were replaced with half the detection limit for reporting statistics and interpreting ratios (Antweiler and Taylor, 2008). Since the subsequent analysis utilizes afternoon ratios, the treatment of the detection limit had a minimal effect relative to all other sources of uncertainty. Lastly, DMS, MeSH, and HPMTF were insensitive to nearby Graciosa Airport activity and so no pollution flag was applied to the measurements in this work, contrary to those in Kilgour et al. (2024).
2.2 Development of a box model to derive HPMTF cloud loss rates from
A coupled ocean–atmosphere 0D chemical box model was created in the Framework for 0D Atmospheric Modeling (F0AM, Wolfe et al., 2016), implementing the Master Chemical Mechanism (MCM) v3.3.1 (http://mcm.york.ac.uk, last access: 5 December 2023) (Jenkin et al., 1997; Saunders et al., 2003) and using updated sulfur chemistry for MeSH, HPMTF, and other DMS oxidation products. The constrained box model was used to determine the rate of HPMTF lost to cloud, as discussed below.
The box model was run with a 4 d spin-up period to allow reactive intermediates to reach equilibrium. Diurnally averaged measurements from the aerosol observing system (AOS) (Uin et al., 2019) and RT-Vocus during the study period were used as inputs to constrain pressure, temperature, humidity, and trace gas concentrations (O3, CO, and volatile organic compounds (VOCs)). The emission flux of DMS (4.5 × 10⁹ molec. cm−2 s−1) was prescribed to match the diurnal average mixing ratio observed in the study (diurnal minimum 80 ppt–diurnal maximum 137 ppt) and was within the range of typical oceanic DMS emission fluxes (0–7.0×10⁹ molec. cm−2 s−1) (Hulswar et al., 2022). A constant OH profile peaking at 4.5 × 10⁶ molec. cm−3 (diurnal average of 1.3 × 10⁶ molec. cm−3) was used. This OH profile agreed well with previous predictions of the zonally averaged surface OH concentration for July at this latitude (1.49 × 10⁶ molec. cm−3; Spivakovsky et al., 2000). This OH concentration from climatological analysis was determined in a photochemical model constrained by surface and column observations of variables affecting OH, such as the concentrations of O3, water vapor, nitrogen oxides, CO, hydrocarbons, and temperature and cloud optical depth (Spivakovsky et al., 2000). OH production below and above cloud was assumed to be approximately equivalent based on the following two pieces of evidence: (1) < 15 % difference in measured J(O1D) in cloudy and clear conditions in the North Pacific during ATom (Hall et al., 2018) and (2) given that DMS and MeSH are co-emitted species with different known OH loss rates, can provide insight into OH exposure. Our measurements indicate no dependence of measured midday on the cloud fraction (Fig. S2). As a result, the model used a constant OH profile independent of the cloud fraction to interpret cloud loss of HPMTF across the study. Based on average boundary layer heights determined from sonde profiles approximately every 12 h during the study (average of 1009±312 m (1σ) and interquartile range of 748–1240 m), a static boundary layer height of 1000 m was assumed. Free-troposphere–boundary layer mixing was treated as a first-order dilution term, calculated using an exchange velocity of 0.5 cm s−1 (Faloona, 2009) and a 1000 m boundary layer height. Additional discussion regarding the dependence of boundary layer height and exchange velocity on the fraction of DMS oxidized in the MBL can be found in Sect. 3.2.1.
In the model, HPMTF was formed chemically via the temperature-dependent isomerization of MTMP (Assaf et al., 2023) and lost via OH oxidation (Jernigan et al., 2022a); dry deposition (Vermeuel et al., 2020); aerosol uptake (Jernigan et al., 2022b); and a variable fourth term, interpreted as cloud loss. HPMTF OH oxidation was set to 1.4 × 10⁻¹¹ cm3 molec.−1 s−1, forming SO2 at 87 % yield and OCS at 13 % yield (Jernigan et al., 2022a). HPMTF dry deposition was set to 0.75 cm s−1 and was independent of wind speed over the range of wind speeds observed (Vermeuel et al., 2020), and uptake to marine aerosol particles was calculated according to Eq. (1) (Jacob, 2000), following the F0AM example for heterogeneous loss where A is the aerosol surface area density, Dg is the diffusivity in air, r is the aerosol radius, v is the mean molecular speed, and γ is the reactive uptake coefficient. A constant aerosol surface area of 45.0 µm2 cm−3 was used, corresponding to the median dry-aerosol surface area measured by a scanning mobility particle sizer (measures 10–1000 nm diameter particles) during the 6-week study (20.0 µm2 cm−3 and 12.6–25.3 µm2 cm−3 interquartile range), with an estimated hygroscopic growth factor of 1.5 applied (Zhang et al., 2014). The reactive uptake coefficient, γ, was set to 0.0016, corresponding to an experimentally measured value for deliquesced NaCl particles (Jernigan et al., 2022b). Aerosol uptake (De Bruyn et al., 1994; Hoffmann et al., 2021) and dry deposition equivalent to the HPMTF dry deposition (Johnson, 2010; Vermeuel et al., 2020) were also included for the DMS oxidation products MSIA, MSA, DMSO, and DMSO2, but the model did not treat cloud loss of these species. A complete table of updated model chemical reactions relevant to DMS, MeSH, and HPMTF is included in Table S1 in the Supplement.
The difference between the clear-sky modeled diurnal profile and measurements of diurnal profiles during the study was used to assign a fourth term, interpreted as the rate of HPMTF cloud loss. This was completed for the 31 study days with at least 20 % data coverage between 14:00 and 16:00 LT and at least 25 % data coverage between 13:00 and 17:00 LT. These thresholds were selected to ensure data coverage when the diurnal profile of was at a stable minimum. Since measured [DMS]/[HPMTF] is an upper limit, as discussed in Sect. 2.1, the derived cloud loss rates from residual should also be interpreted as an upper limit. This same analysis was completed with the [HPMTF] corrected so that clear-sky measurements of HPMTF agreed with clear-sky modeled HPMTF (Fig. S1). From this analysis, we estimate that the cloud loss terms of HPMTF are an overestimate by up to a factor of 3. Loss rates of HPMTF to cloud and the fractional loss of HPMTF to individual pathways below are reported as ranges based on this uncertainty to more accurately compare to the values from the literature. More details on the derivation of cloud loss terms are in Sect. 3.2.2.
2.3 Supporting measurements
Continuous measurements at ENA provided by ARM were used in tandem with DMS, MeSH, and HPMTF measurements to evaluate trends in HPMTF cloud loss rates. Best estimates of cloud base height (CBH) were determined from ceilometer and micropulse lidar measurements saved at 1 Hz (Johnson et al., 2022). Boundary layer heights (BLHs) for the study period were determined manually based on inflection points in potential temperature and the water mixing ratio (Albrecht et al., 1995) from sonde measurements launched two to three times per day (Riihimaki et al., 2022). Well-mixed boundary layers had vertical slopes in both potential temperature and the water mixing ratio below the inversion layer and were interpreted to mean that the concentration of sulfur species measured at the ground level represented their concentration at the cloud level. For the yearlong analysis, BLHs were determined using the Heffter algorithm (Heffter, 1980), as these BLHs agreed with sonde measurements during the study, are independent of cloudiness, and have been used for analysis at this site previously (Ghate et al., 2023). Site-measured horizontal cloud fractions (CFH) were determined from the percentage of opaque pixels in total-sky-imager hemispheric sky images recorded every minute during daylight hours and when solar elevation was above 10° (Flynn and Morris, 2022). Site-measured vertical cloud fractions (CFV) and 3D cloud fractions (CF3A) were calculated according to Eqs. (2) and (3), respectively. For this calculation, sonde-derived BLHs were linearly interpolated to match the time points of CBH measurements, resulting in CFV uncertainty largely dependent on the assignment of the BLH. This calculation assumed that the vertical distance between the detected CBH and BLH was fully filled with cloud, such that the cloud horizontal depth in CFH does not impact the calculation.
CF3A was compared to the 3D cloud fraction derived from MERRA-2 (Global Modeling and Assimilation Office (GMAO), 2015) (CF3M), which resolves cloud properties and the cloud fraction (CFVertical Layer) at a 0.5° × 0.625° resolution for 42 vertical pressure-resolved layers (ΔPVertical Layer) every 3 h. CF3M was calculated as a weighted average cloud fraction (Eq. 4) over the entire boundary layer (ΔPBoundary Layer) for a 4° × 5.625° region encompassing Graciosa Island (37–41° N and 30.625–25° W). Boundary layers used for calculation were again based on the Heffter algorithm for sonde measurements (Riihimaki et al., 2022) and linearly interpolated to match MERRA-2 time points. These latitude, longitude, and boundary layer constraints were chosen to align with the inputs into a global chemical transport model, GEOS-Chem, if one were to model the impact of cloud chemistry in this region (Holmes et al., 2019).
3.1 Cloud and gas-phase sulfur measurements at ENA
The time series of DMS, MeSH, HPMTF, and CF3A are shown in Fig. 1. DMS showed large variability throughout the study, mostly driven by wind speed, and averaged 106 ± 69 ppt. Here and in the following reported measurements of gas-phase concentrations and gas-phase ratios, standard deviations reflect natural variability in ambient concentrations. MeSH closely tracked DMS throughout (R2=0.56), indicative of their shared DMSP source. However, MeSH concentrations were roughly a factor of 5 lower, averaging 16 ± 13 ppt. Both DMS and MeSH were highest in the early morning hours, when their oxidative loss was at a minimum, and lowest in the afternoons. The average and interquartile range of the nighttime concentration ratio (00:00–07:00 LT) of was 6.5 and 4.3–7.5 (Fig. 2). This is in line with existing measurements of the emission flux ratio of in coastal southern California (5.5 ± 3.0) (Novak et al., 2022) and in the southwest Pacific (3–7) (Lawson et al., 2020) and concentration ratio measurements of in a low-oxidant-mesocosm experiment during typical coastal ocean biological conditions (4.60 ± 0.93) (Kilgour et al., 2022).
The HPMTF measured was significantly lower in concentration than its precursor DMS, with a 24 h average of 0.7 ± 1.1 ppt and an afternoon average (13:00–17:00 LT) of 1.6 ± 1.7 ppt. The median and interquartile ranges of across all data points were 317 and 73–1797. HPMTF also exhibited a strong diurnal profile, peaking in the late afternoons between 13:00 and 17:00 LT, and was mostly at or below the detection limit during the nights and early mornings. Its near-zero concentrations in the early mornings suggested that HPMTF production from DMS restarted daily. The afternoon maximum in HPMTF and minimum in DMS resulted in low and stable ratios during the afternoons, which are exploited in the box model analysis in Sect. 3.2.2.
Figure 1Hourly averaged time series of (a) DMS measured by RT-Vocus and wind speed, (b) MeSH measured by RT-Vocus, (c) HPMTF measured by Vocus AIM with iodide reagent ions, and (d) the site-measured 3D cloud fraction (CF3A) calculated according to Eq. (3).
CF3A during the study averaged 0.28 ± 0.27, where the standard deviation reflects natural variability in cloud cover. Numerous time points of CF3A were near 1, indicating full cloud filling the region horizontally and vertically within the boundary layer. Maximum daily CF3A occurred in the morning and steadily declined throughout the day into the evening. The sky imager used to measure CFH only collected data during daylight hours, resulting in no nighttime information on CF3A at this site. The sky imager cloud mask retrieval was also optimized for later in the day, which could lead to false or exaggerated clouds at dusk and dawn and might have influenced the peak CF3A in the mornings. During the entire study, exhibited a weak positive correlation with CF3A (R2=0.27) (Fig. S3).
Figure 2Histogram of the 5 min averaged ratio during 00:00–07:00 LT, when oxidative loss was at a minimum.
3.2 Measurement-constrained box model to assess cloud loss rates
3.2.1 Sensitivity to meteorological and chemical constraints
The model was run with a constant-temperature diurnal profile corresponding to the diurnally averaged measurements during the study, averaging 292 K. At this temperature, 61 % of DMS OH oxidation occurred by H abstraction which could later form HPMTF, and 39 % occurred by OH addition with no potential formation of HPMTF (Fig. S4). The diurnal average temperature-dependent MTMP isomerization rate forming HPMTF was 0.036 s−1 (Assaf et al., 2023). The ambient temperature in this study was lower than that for which this rate constant was experimentally measured (314–433 K) and is calculated based on the extrapolation in Assaf et al. (2023). Model NO, HO2, and RO2 concentrations at 15:00 LT were 2, 12, and 36 ppt, respectively, resulting in an αHPMTF, defined previously as the yield of HPMTF from the DMS H abstraction pathway, of 0.85. Running the model with a time-varying temperature corresponding to the observed range over 6 weeks in the study (minimum 288 K–maximum 296 K) would result in a 31 % increase in the diurnally averaged HPMTF production rate and a 9 % decrease in afternoon .
Additionally, at a boundary layer height of 1000 m and exchange velocity of 0.5 cm s−1 between the boundary layer and the free troposphere, 74 % of DMS in the model was oxidized in the boundary layer and 26 % was oxidized in the free troposphere above. The fraction of DMS oxidized in the boundary layer is highly dependent on the boundary layer height and exchange velocity (Fig. S5), both of which have considerable uncertainty in the marine atmosphere, where boundary layers can be stable without a strong inversion layer, and mixing in the free troposphere is difficult to measure (Faloona, 2009). The following analysis and discussion represent DMS oxidation in the Azores-region MBL. The lower temperature in the free troposphere would shift DMS OH oxidation toward OH addition and slow down the MTMP isomerization rate forming HPMTF (Assaf et al., 2023). At a representative summertime free-troposphere temperature in this region of 283 K, the percentage of DMS OH oxidation occurring by H abstraction would reduce to 46 %, and the MTMP isomerization rate would slow to 0.016 s−1; both reductions indicate that the production of DMS-derived SO2 and OCS would be lower in the free troposphere than in the MBL.
3.2.2 Evaluation of HPMTF loss rates
Figure 3a shows modeled for several cloud loss rates. Cloud loss was modeled as a constant first-order sink with respect to HPMTF concentration. In the modeled clear sky, where HPMTF was only lost by gas-phase oxidation, aerosol uptake, and deposition, ranged between 4.2 and 12.7 during the course of a day. in the afternoon, between 13:00 and 17:00 LT, averaged 4.5 ± 0.5 in the modeled clear sky. This afternoon range corresponded to the diurnal maximum in HPMTF concentration and diurnal minimum in . Since HPMTF was often at or below the detection limit at nighttime, 13:00–17:00 LT is used to interpret model–measurement comparison. Furthermore, the near-zero nighttime HPMTF concentrations throughout the study meant that HPMTF production restarted daily with OH production, suggesting that only cloud cover along the air mass back trajectory in the hours between sunrise and the end of the model–measurement comparison period (17:00 LT) impacted HPMTF chemistry in the model. Since no consistently clear-sky day existed during the study, a close case, occurring on 11 July, was used to assess how well the model captured HPMTF chemistry in low-cloud-fraction conditions. The average CF3A on 11 July between 06:00 and 17:00 LT was 0.065 ± 0.055 (Fig. 3b, c), and the average afternoon ] was 7.6 ± 1.1. This is slightly above the clear-sky ] (Fig. 3a), which could be due to a small amount of cloud cover overhead, cloud presence along the trajectory prior to the afternoon comparison period, and/or uncertainty in the non-cloud HPMTF loss rates. Nonetheless, the close agreement indicates that DMS-HPMTF chemistry in the model is reasonably well-captured for the clear-sky case and highlights that a large HPMTF loss to photolysis is not necessary, as has been implied previously (Khan et al., 2021).
The HPMTF cloud loss term was determined for all study days. The rate of cloud loss was determined as the value needed to make up the residual difference between the modeled clear-sky in the afternoon and the measurements of afternoon . For example, to match the observed on 11 July, a small cloud loss term of 0.24 h−1 was required. This is also shown for 2 additional days in Fig. 3: 3 July and 27 June. For 3 July, a cloud loss term of 0.94 h−1 was needed for the model to match the measured afternoon of 20 ± 3. For 27 June, a cloud loss term of 2.5 h−1 was needed for the model to match the measured afternoon of 49±12. As expected, days with faster cloud loss rates have higher CF3A, where the CF3A between 06:00 and 17:00 LT was 0.17±0.10 for 3 July and 0.29±0.22 for 27 June.
The days shown in Fig. 3 were selected as case studies, as they displayed a range of CF3A values and had unstable, well-mixed boundary layers based on vertical profiles in the potential temperature and the water vapor mixing ratio (Fig. S6). Unstable, well-mixed boundary layers occurred on 16 of the 31 study days. Under these conditions, we expect that the ground-based measurements of are similar to throughout the boundary layer, due to strong vertical mixing. As a result, the inferred cloud loss terms from for these days are interpreted as an estimate of the cloud entrainment rate, thought of as the mixing rate of clear air into cloud. The 3 d in Fig. 3 were also chosen because they had more uniform cloud fractions during the time of HPMTF production. In an ideal case, where the cloud fraction and cloud type are constant, measured would fall exactly along the modeled . In practice, CF3A varies throughout the day (Fig. 3b) due to changes in boundary layer height and horizontal cloud cover, and the GOES images (GOES-R Algorithm Working Group, and GOES-R Series Program, 2017) in Fig. 3c, d, and e represent only one snapshot in time. It is more likely that the HPMTF cloud loss term changes throughout the day as CF3A in the sampling region evolves. As a result, extending this method to all study days incorporates some uncertainty in the derived cloud loss terms due to the cloud field at the site changing during the time period of HPMTF production.
Figure 3(a) Modeled for different HPMTF cloud loss rates, using the formic acid calibration factor for HPMTF, which represents upper limits on cloud loss rates. The gray line with a cloud loss term of 0 h−1 represents the modeled clear sky. Scattered points represent 5 min averaged measurements for colors matching the dates in (b). (b) The site-measured 3D cloud fraction (CF3A) for 3 selected days during the study. GOES imagery for 4° × 5° regions around Graciosa Island at 15:00 LT for (c) 11 July, (d) 3 July, and (e) 27 June. The approximate measurement location on Graciosa Island (39.0916° N, 28.0257° W) is marked with a red asterisk.
Following the approach outlined above, we derive cloud loss rates based on the residual loss required for modeled to equal the measured ratio for all 31 d. The reported range in cloud loss rates is determined based on uncertainty in the measured [HPMTF]. When using the model-derived HPMTF sensitivity, 2 of the 31 analysis days yielded a negative cloud loss term. In contrast, when using the formic-acid-derived sensitivity for HPMTF on cloud-free days, we have an unaccounted residual loss term. For the majority of the days analyzed, the difference between modeled and measured is large enough that the uncertainty in [HPMTF] does not impact the conclusions and reinforces the fast cloud processing of HPMTF. This approach enables cloud loss terms to be derived over long time periods and significantly increases the data coverage compared to prior work. However, the indirect methodology of assigning cloud loss terms based on residual differences in from a base case means that any inaccuracy in the model (e.g., rates of other HPMTF loss processes or variable fractions of DMS forming HPMTF based on changing temperature and NO and RO2 concentrations) can contribute to uncertainty in the derived cloud loss terms. Additionally, we are utilizing near-surface measurements of [DMS] and [HPMTF], which are less ideal compared to making vertically resolved measurements of these species or direct airborne eddy covariance flux measurements at different altitudes to directly calculate HPMTF loss terms (Novak et al., 2021). It is our goal for this work to present longer-term measurements of DMS and HPMTF to inform our understanding of HPMTF cloud processing and provide a basis for needed aircraft observations of vertically resolved, well-calibrated HPMTF in this region in the future.
Figure 4 displays the loss rates of HPMTF to cloud, aerosol, dry deposition, and OH for each day, following this approach. Aerosol uptake and dry deposition accounted for a minor fraction of HPMTF loss during this study, while gas-phase oxidation by OH and loss to cloud made more significant contributions. Bracketing the modeled outputs based on the uncertainty in cloud loss rates derived from [HPMTF] uncertainty, on average, 79 %–91 % of HPMTF in the model was lost to cloud, 7 %–16 % was lost to OH, and the remaining 2 %–6 % was lost to aerosol and dry deposition.
The reported loss of HPMTF to aerosol is likely a lower limit, as any acidity in the ambient marine aerosol (Angle et al., 2021) could cause enhanced HPMTF uptake (Liggio and Li, 2006). Additionally, while we do not have concurrent measurements of coarse-mode sea spray aerosol particles, we have estimated the wet surface area of particles with dry diameters larger than 0.47 µm using scattering coefficients measured by an integrated nephelometer. The relationship between the dry surface area and the scattering coefficient used for this estimation was derived from measurements collected during the Aerosol and Cloud Experiments in the Eastern North Atlantic (ACE-ENA) campaign (Wang et al., 2022), where an aerodynamic particle sizer (APS) provided direct measurements of coarse-mode dry surface area. The wet surface area was then calculated based on the hygroscopic growth factor of sea salt aerosols as a function of relative humidity (Pitchford et al., 2007). The average and interquartile range (Dp>0.47 µm) are 30 and 15–61 µm2 cm−3, although many higher instances occur. Sea spray aerosol particles are hygroscopic (Zieger et al., 2017) and provide an enhanced surface area for HPMTF uptake, particularly during the strong winds that promote sea spray production, which is not captured in the model. Based on ACE-ENA observations showing a minimum cloud droplet number concentration on the order of 30 cm−3 and an average droplet size of 10 µm (Wang et al., 2022), the cloud droplet surface area would be 9400 µm2 cm−3, at least 150 times that of the aerosol surface area. As a result, HPMTF loss to aerosol is still expected to be lower than that to cloud due to the large difference in surface area between aerosol and cloud droplets.
HPMTF was lost to cloud chemistry at a rate approximately 5–13 times faster than to OH chemistry during this study. Regardless of the uncertainty in cloud loss rates, this analysis highlights the claim that cloud loss is the dominant HPMTF loss process in the MBL during this study. The median lifetime of HPMTF to cloud, bracketed by uncertainties in HPMTF quantification, was 0.29–0.81 h (interquartile range of 0.06–2.24 h), which was significantly faster than the instantaneous chemical lifetime to OH (greater than 4 h). This is consistent with the airborne measurements in Novak et al. (2021) off the coast of southern California, where the lifetime of HPMTF to cloud (1.2±0.6 h) was also much faster than the lifetime to OH (greater than 5 h). Analysis in this work affirms cloud chemistry as the dominant HPMTF loss pathway, now over a longer time period and in another region of the MBL.

Figure 4(a) The site-measured 3D cloud fraction (CF3A) for days with modeled HPMTF loss rates. (b) Histogram of modeled HPMTF loss rates for the 31 study days, separated by HPMTF loss to OH, clouds, deposition, and aerosol. The breakdown of HPMTF loss rates corresponds to the model run with a formic acid calibration factor for HPMTF, resulting in an upper limit on the fraction of HPMTF lost to clouds.
4.1 Dependence of cloud loss rates on the site-measured 3D cloud fraction
The HPMTF cloud loss rates inferred from the model–measurement comparison of for all 31 study days are plotted against CF3A in Fig. 5 and colored by afternoon relative humidity. Higher cloud loss rates of HPMTF were observed on days with increased relative humidity, indicative of sampling in a cloud-filled boundary layer (Chernykh and Eskridge, 1996). Additionally, since the relative humidity across all days, even at low CF3A, was above the efflorescence point of inorganic sea spray aerosol (50 %) (Zieger et al., 2017), we expect that the variability in inlet loss (assuming that the inlet is coated in wet sea spray aerosol) was minimal and take the observed trend to be robust. Across all days, the median cloud loss rate of HPMTF to cloud, bracketed by uncertainties in HPMTF quantifications, was 1.2–3.4 h−1 (interquartile range of 0.45–19 h−1). In just the days with unstable, well-mixed boundary layers demarcated by squares in Fig. 5, the median and interquartile ranges of cloud loss rates were 0.86–2.5 h−1 and 0.34–9.2 h−1, respectively. Inferring HPMTF cloud loss rates from ground-based measurements of relies on the assumption that the near-surface measurements are representative of throughout the boundary layer. While this is a fair assumption in well-mixed boundary layers with strong vertical mixing, this is likely not the case in stable boundary layers. In well-mixed boundary layers, the rate of HPMTF cloud loss can be thought of as the entrainment of HPMTF in clear air into cloud, which has previously been estimated at 1 h−1 for stratocumulus clouds based on large-eddy-simulation studies (Feingold et al., 1998). Our derived cloud loss rates on the well-mixed days are closer to these values. The dashed black line in Fig. 5 shows the predicted cloud loss of HPMTF based on an average 1 h−1 entrainment rate. While our HPMTF cloud loss rates are faster than those predicted, they follow the same shape, where cloud loss increased and saturated with increasing CF3A. Unlike the prediction, the derived HPMTF cloud loss rates were variable for individual CF3A. This is likely a result of heterogeneity in the cloud fraction (Fig. 3b) and cloud type during the time period of HPMTF production, which are ignored in the calculation of the predicted rate. One particularly important aspect of cloud heterogeneity affecting the calculations can come in instances of a near-complete vertical cloud fraction, as HPMTF was likely lost to cloud at the diffusion limit, which is not well-captured by the inferred cloud loss from CF3A alone and can result in fast cloud loss rates.
Figure 5The relationship between derived cloud loss rates and CF3A measured at the site. Scattered data points represent derived cloud loss terms based on the residual in , where HPMTF was calibrated with the formic acid calibration factor and is colored according to afternoon relative humidity between 13:00 and 17:00 LT. Square points represent days with a well-mixed MBL, defined by near-vertical slopes in potential temperature and the water mixing ratio, and circles represent a stable, not-well-mixed MBL, defined by non-zero slopes in potential temperature and the water mixing ratio. Vertical black lines below the points represent the range in cloud loss rates based on HPMTF uncertainty. Horizontal gray lines across the points represent the minimum and maximum CF3A during the time of HPMTF production from 06:00 to 17:00 LT. The dotted black line represents an expected cloud loss term calculated as the product of CF3A and an assumed 1 h−1 entrainment rate. The variability in CF3A and cloud loss is also shown as histograms on the mirrored axes.
4.2 Impacts of cloud loss on MBL DMS conversion to SO2 and OCS
The efficient removal of the HPMTF intermediate via cloud chemistry has a correspondingly large impact on the amount of SO2 and OCS derived from DMS oxidized in the MBL. Figure 6 shows the fraction of DMS converted to SO2 and OCS in the modeled clear-sky case (dashed black line) and when implementing the derived cloud loss rates from (blue histogram). In both cases, the converted fraction is calculated as the 24 h average of the production rate of the product from DMS divided by the chemical loss rate of DMS. In clear-sky conditions, 27 % of DMS oxidized in the MBL is converted to SO2 (Fig. 6a). and 3 % of DMS oxidized in the MBL is converted to OCS (Fig. 6b). This analysis indicates that HPMTF cloud loss, at rates derived from , could decrease DMS-derived SO2 in the MBL by, on average, 52 %–60 % (Fig. 6a) and DMS-derived OCS in the MBL by, on average, 80 %–92 % (Fig. 6b), where the ranges correspond to the uncertainty in the cloud loss terms derived from HPMTF quantification uncertainty. These findings are consistent with earlier global modeling work based on an HPMTF cloud loss rate determined from a flight off the coast of southern California (Novak et al., 2021), which showed that HPMTF cloud loss reduced global DMS-derived SO2 production by 35 % (Novak et al., 2021) and OCS production by 92 % (Jernigan et al., 2022a). It is also possible that SO2 yields from DMS oxidation in this model could be further reduced by including the isomerization of CH3SOO to CH3SO2 (Chen et al., 2023) (yielding a reduction in clear-sky diurnally averaged SO2 from DMS by 6 %) and by including aqueous-phase oxidation of DMS by O3. Recent research has shown that the oxidation of DMS by the O3 pathway can be significant, forming DMSO, MSIA, and MSA (Hoffmann et al., 2016), all molecules with high reactive uptake coefficients (Table S1), which lead to reductions in DMS-derived SO2.
The oxidation of SO2 to sulfuric acid has been shown to result in new-particle formation in the MBL (Covert et al., 1992). Reduction in MBL SO2 due to the cloud chemistry shown here suggests that nucleation and growth rates of new particles in the MBL might be slower than previously thought or that non-SO2 precursors, such as ammonia (Jokinen et al., 2018) and iodine-containing molecules (Baccarini et al., 2020), might play larger roles than once believed, especially in cloudy regions. Importantly, aqueous-phase HPMTF chemistry in cloud has been shown to promptly form SO at unit yield (Jernigan et al., 2024). Including prompt sulfate production from HPMTF cloud chemistry in our model leads to the production of 0.18–0.20 µg m−3 SO daily for a median-derived cloud loss rate of 1.2–3.4 h−1. This means that although HPMTF cloud chemistry largely reduces SO2 concentrations in the MBL, sulfate aerosol is still being formed in cloudy regions, albeit through a different mechanism. Additionally, the DMS oxidation products along the OH addition pathway (DMSO, DMSO2, MSIA, and MSA) are also soluble. If they are irreversibly lost to cloud like HPMTF, then cloud chemistry could even more drastically control the production of DMS-derived products. Lastly, by decreasing the amount of OCS produced from DMS in the MBL, HPMTF cloud loss reduces the amount of OCS that is transported to the stratosphere (Montzka et al., 2007), where it can serve as a precursor to stratospheric SO and control Earth's radiative budget (Brühl et al., 2012; Kremser et al., 2016).
4.3 Comparison between DMS oxidation using derived cloud loss rates and current implementations of DMS oxidation in global models
The conversion of MBL DMS to SO2 and OCS, incorporating cloud loss rates derived from in situ measurements of , is compared to the conversions of DMS to SO2 and OCS from DMS oxidation in common global model implementations. Without incorporating HPMTF chemistry, the global chemical transport model GEOS-Chem assigns direct, fixed yields of SO2 (1, 1, 0.75) and MSA (0, 0, 0.25) from the NO3-oxidation, OH-oxidation–H-abstraction, and OH-oxidation–OH-addition pathways (Chin et al., 1996). At the limit of no cloud present, this yield implementation results in 93 % of MBL DMS converted to SO2 in the F0AM box model, which is significantly larger than the amount of SO2 formed when implementing the -derived cloud loss rates. The historical model of OCS formation from DMS OH oxidation also uses a direct, fixed yield of 0.007 (Barnes et al., 1994), which, coincidentally, is similar to the findings here in the presence of cloud.
As introduced earlier, when taking into account cloud chemistry, GEOS-Chem parameterizes cloud loss of reactive, soluble gases as the product of the boundary layer grid cell MERRA-2 cloud fraction (CF3M) (Gelaro et al., 2017) (Holmes et al., 2019) and an average entrainment rate of 1 h−1 based on large-eddy-simulation studies of stratocumulus clouds (Feingold et al., 1998). This cloud loss term that would be input into GEOS-Chem was instead run in the developed F0AM box model with HPMTF chemistry to assess how closely it matched the modeled outputs from the derived cloud loss terms; the results of this analysis are shown as orange bars in Fig. 6. Utilizing a cloud loss rate for HPMTF determined by CF3M resulted in, on average, a factor of 1.7–2.1 and 3.7–9.5 more MBL DMS-derived SO2 and OCS, respectively, compared to the derived cloud loss rate implementation, where the ranges indicate propagated uncertainty from HPMTF concentrations. These MERRA-2-based values were closer to the fractions of SO2 and OCS formed from DMS in the modeled clear-sky case. This is partly due to the consistent underestimate of CF3M relative to CF3A by up to a factor of 4 during June and July (Fig. 7). This is consistent with significant errors in the accuracy of satellite-derived cloud fractions in the MBL where the boundary layer is low and where there is persistent cloud cover (Kuma et al., 2020). Our analysis using in situ derived cloud loss rates and site measurements of the 3D cloud fraction suggests that (1) cloud processing in models is required to accurately capture the fate of DMS and (2) cloud loss parameterized by satellite-retrievals of the low-level cloud fraction underestimates the effects of HPMTF cloud chemistry. Models might better capture the impacts of HPMTF cloud chemistry by assuming full conversion to SO when cloud is present and conversion to SO2 in clear-sky conditions.
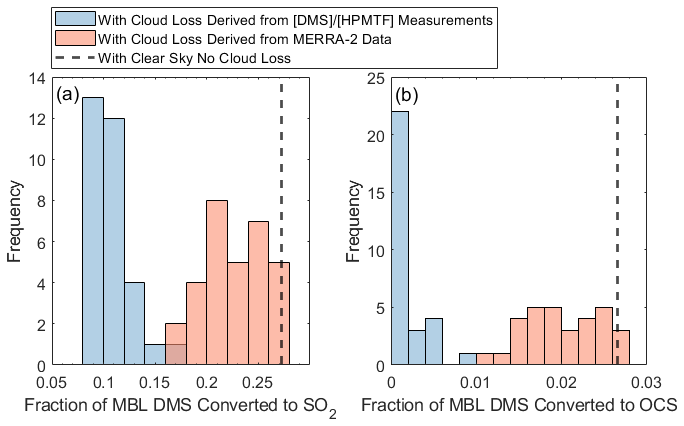
Figure 6The fraction of MBL DMS converted to (a) SO2 and (b) OCS, shown for the derived cloud loss rates based on residual and based on the MERRA-2 cloud fractions and a 1 h−1 entrainment rate. The modeled clear-sky conversion, using HPMTF chemistry and heterogeneous loss of DMS oxidation products, is in black.
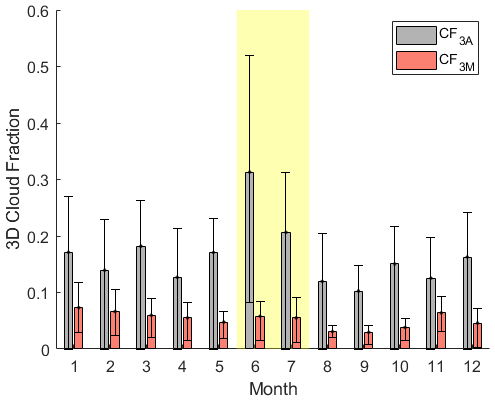
Figure 7The monthly mean boundary layer 3D cloud fraction measured at the site by ARM in gray (CF3A) and measured by MERRA-2 (CF3M) around Graciosa Island in red. Error bars represent the interquartile ranges. Both CF3A and CF3M are calculated based on the boundary layer height determined by the Heffter approximation. The yellow-shaded region indicates the time period of this study.
4.4 Insights into DMS oxidation year-round
In situ DMS, HPMTF, and CF3A measurements show that fast cloud processing strongly regulated the fate of HPMTF during the study in June and July of 2022, to a greater extent than what is currently prescribed in global models. Using DMS climatology and year-round measurements made at ENA, we build upon the summertime chemical box model to speculate on the role of cloud processing in DMS oxidation in this region during time periods beyond the summer intensive period. Monthly averaged DMS fluxes were taken from the Hulswar et al. (2022) climatology for an 8° radius box around Graciosa Island, approximating the DMS lifetime. Monthly OH profiles were determined in F0AM using the hybrid method to calculate photolysis frequencies with a default surface albedo and O3 column (Wolfe et al., 2016) and validated by the OH climatology in Spivakovsky et al. (2000). Monthly averaged site measurements of meteorological (pressure, temperature, and relative humidity) (Uin et al., 2019) and boundary layer height data (Heffter, 1980) were used as inputs. The remaining trace gas constraints, dilution terms, and non-cloud HPMTF loss processes were kept constant from the summertime model.
In the model, we demonstrate that the clear-sky HPMTF concentration in fall and winter months is reduced relative to its concentration in spring and summer months, in line with our understanding of its production as a function of DMS and oxidant concentration, temperature, and boundary layer height. Dissolved DMS concentrations are highest in this region during the spring and summer months (< 6 nM) and are low in other months (< 2 nM) (Hulswar et al., 2022). Similarly, air temperature in the MBL is lower in months outside of this study period, with sonde profiles at ENA indicating that a wintertime MBL temperature of 10 °C is representative. At this temperature, only 46 % of DMS OH oxidation occurs by H abstraction (compared to 61 % in the summertime model), and the MTMP isomerization rate is approximately halved. Fewer daylight hours in non-summer months reduce OH concentrations; the global OH climatology indicates that surface OH at this latitude is close to a factor of 10 lower in January compared to July (Spivakovsky et al., 2000). Furthermore, modeled NO and RO2 concentrations are roughly a factor of 2 higher in July than in January, although still low, resulting in αHPMTF of 0.86 in July and αHPMTF of 0.89 at 15:00 LT in January. BLHs are less sensitive to seasonality at this site, with average wintertime BLHs roughly 20 % higher than the typical heights observed during June and July. The low precursor DMS concentration, increased preference for the DMS OH addition channel, slower MTMP isomerization rate, and reduced oxidative conditions result in modeled HPMTF production being approximately 6 times slower in January compared to July.
While HPMTF production is lower beyond June and July of this study, measurements of CF3A demonstrate that the 3D cloud fraction at ENA is large year-round, shown in Fig. 7. CF3A peaks in June during this study, but other months in the year are consistent with the CF3A observed in July, during which some of our DMS and HPMTF measurements were made. Applying the median cloud loss rates derived from summertime (1.2–3.4 h−1) to all months, we demonstrate that a low fraction of DMS ultimately forms SO2 (3 %–12 %) and OCS (< 0.4 %) at this site year-round (Fig. 8). Furthermore, applying a monthly specific cloud loss rate derived from the average CF3M from MERRA-2 and a 1 h−1 entrainment rate indicates that MERRA-2 continues to overestimate the amounts of SO2 and OCS produced from DMS across the entire year (Fig. 8). Together, these findings indicate that cloud processing plays a large role in DMS oxidation in the ENA MBL year-round, and persistent underestimates in the 3D cloud fraction by MERRA-2 likely result in current global models underrepresenting the dominant impact of cloud chemistry across the entire year.
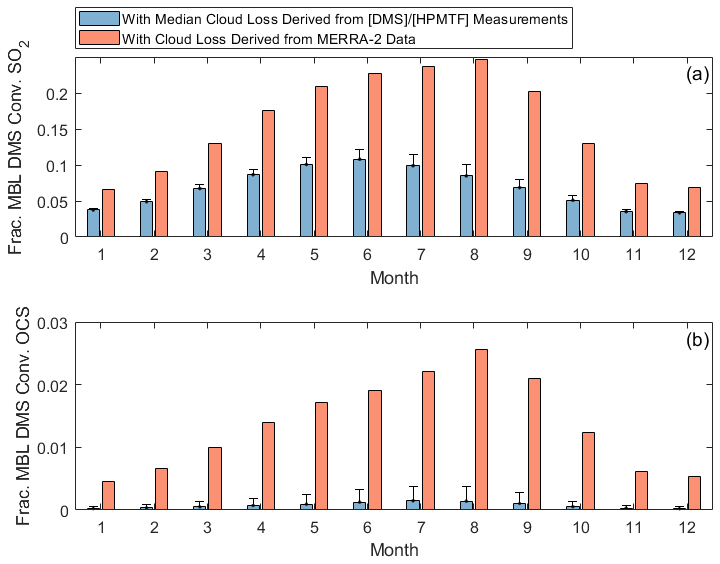
Figure 8Diurnally averaged fractions of MBL DMS converted to (a) SO2 and (b) OCS in the year-round model. Derived cloud loss bars indicate running the model with the upper limit of the median cloud loss range (1.2–3.4 h−1), and the error bar represents running the model with the lower limit of the range applied to all months. MERRA-2 cloud loss bars indicate running the model with monthly specific cloud loss rates, calculated as the product of the monthly averaged CF3M and a 1 h−1 entrainment rate.
Finally, we contextualize the impact of cloud processing on SO2 production through a model test including MeSH. Assuming that the loss rate of HPMTF to cloud derived in this study (1.2–3.4 h−1 median) is representative of its loss rate in other seasons, cloud chemistry can reduce the production of SO2 from DMS by 49 %–67 % year-round, compared to the clear-sky case shown in Fig. 9. Given that MeSH is an efficient MBL SO2 source with a short lifetime to OH and that its oxidation toward SO2 does not proceed via the soluble HPMTF intermediate, it has the potential to further close the SO2 budget. Utilizing a flux of MeSH at 20 % of the monthly averaged DMS flux for this region (Hulswar et al., 2022), in line with the limited current measurements of flux ratios of DMS and MeSH (Lawson et al., 2020; Novak et al., 2022), shows that MeSH (green in Fig. 9) can be competitive with DMS (purple in Fig. 9) as an SO2 source in this region, where its oxidation has minimal temperature dependence (Chen et al., 2023). MeSH is an especially important SO2 source when accounting for cloud processing of HPMTF at the derived cloud loss rates and in winter months, when the preference for DMS OH addition and slow MTMP isomerization limit the SO2 yielded from DMS oxidation.
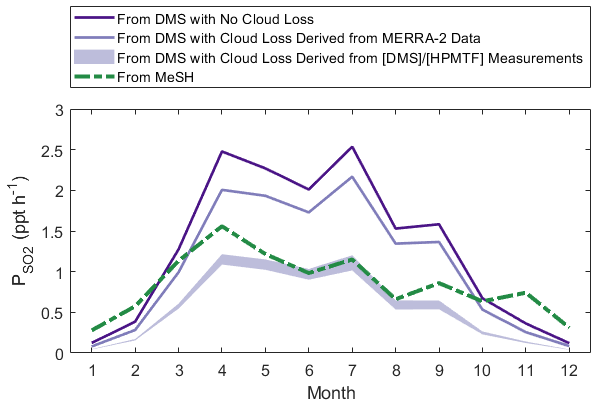
Figure 9Diurnally averaged SO2 production rates determined by the year-round model, where contributions to SO2 from MeSH (green) and DMS (purple) are run individually. SO2 production rates from DMS involving MERRA-2 cloud loss use monthly averaged CF3M and a 1 h−1 entrainment rate, and production rates from DMS involving the derived cloud loss rates from use the median cloud loss rates (1.2–3.4 h−1) applied to all months.
This work utilizes measurements of the reactant and product pair, DMS and HPMTF, and a developed box model constrained by meteorological and trace gas measurements at the site to derive the loss rate of HPMTF to cloud in the ENA MBL during June and July 2022. This method was enabled by the considerable source of DMS from the oceans and its large reservoir in the soluble oxidation product, HPMTF. The median-derived cloud loss rate based on analysis was 1.2–3.4 h−1, leading to a median lifetime of HPMTF to cloud of 0.29–0.81 h. Box model analysis indicated that cloud was the dominant sink of HPMTF, with, on average, 79 %–91 % of HPMTF lost to cloud and 7 %–16 % lost to the second-strongest loss pathway, OH. Our findings are consistent with prior airborne flux analysis, where the HPMTF lifetime to cloud on a single flight leg was similarly fast (1.2 ± 0.6 h) and similarly outpaced chemistry. The fast loss of HPMTF to cloud should continue to be validated with future aircraft studies containing vertically resolved measurements and coincident HPMTF calibration.
Our study demonstrates that cloud loss scaled with the site-measured 3D cloud fraction over 6 weeks and controlled the fate of HPMTF in the MBL throughout this entire period. The chemically derived cloud loss rates resulted in modeled reductions in DMS-derived MBL SO2 and OCS of 52 %–60 % and 80 %–92 %, respectively. Since cloud processing sets the MBL SO2 and SO aerosol budgets from DMS, additional, highly sensitive measurements of MBL SO2; DMS; and the other major marine SO2 precursor, MeSH, are warranted to constrain drivers of SO2 and new-particle formation through the production of H2SO4. Lastly, this work utilizes DMS climatology and year-round measurements at ENA to suggest that cloud processing of HPMTF is important year-round in the ENA, beyond the measurement period, due to persistent boundary layer cloud cover. Since satellite products like MERRA-2 retrieve low cloud fractions relative to in situ ground-based measurements and global chemical transport models parameterize cloud loss by the satellite cloud fraction, the controlling role of cloud processing in setting SO2, OCS, and SO budgets is likely underrepresented in current global models.
DMS, MeSH, and HPMTF time series are available at http://digital.library.wisc.edu/1793/85493 (Kilgour and Bertram, 2024).
Contains details on the HPMTF measurement and uncertainty, supplementary figures, and box model constraints. The supplement related to this article is available online at https://doi.org/10.5194/acp-25-1931-2025-supplement.
DBK, CMJ, and THB conceptualized the main ideas of the paper. DBK and CMJ collected RT-Vocus data and processed and analyzed the data. SA and OG collected Vocus AIM data, with CM contributing to the setup and supporting data analysis. OG analyzed Vocus AIM field data, and SA performed relative-humidity-dependent formic acid calibrations and analyzed calibration data. SZ and JW analyzed and derived aerosol surface area data. DBK developed the box models and wrote the paper, with input from CMJ and THB. CM, MES, JW, JAT, PZ, and THB contributed to AGENA campaign planning and execution and supported data collection and analysis. All authors reviewed and edited the paper.
At least one of the (co-)authors is a member of the editorial board of Atmospheric Chemistry and Physics. The peer-review process was guided by an independent editor, and the authors also have no other competing interests to declare.
Publisher’s note: Copernicus Publications remains neutral with regard to jurisdictional claims made in the text, published maps, institutional affiliations, or any other geographical representation in this paper. While Copernicus Publications makes every effort to include appropriate place names, the final responsibility lies with the authors.
The authors thank the ARM staff at ENA and Los Alamos National Laboratory, including Bruno Cunha and Tercio Silva, for their support and logistical contributions to the study and the ARM instrument mentors, including Donna Flynn at Pacific Northwest National Laboratory, for providing publicly accessible supporting data from ENA. Additional thanks go to Ankur Desai and Grant Petty at University of Wisconsin-Madison for valuable discussions on boundary layer stability. Lastly, the authors acknowledge Glenn Wolfe for providing the F0AM box model, which was edited for use in this analysis, and the tofTools team for providing tools for mass spectrometry data analysis.
This material is based upon work supported by the US Department of Energy, Office of Science, Office of Biological and Environmental Research, Atmospheric System Research (ASR) (award no. DE-SC0021985). This research used resources of the Atmospheric Radiation Measurement (ARM) user facility, which is a DOE Office of Science user facility (award no. AFC010011).
This paper was edited by Marc von Hobe and reviewed by two anonymous referees.
Albrecht, B. A., Jensen, M. P., and Syrett, W. J.: Marine boundary layer structure and fractional cloudiness, J. Geophys. Res.-Atmos., 100, 14209–14222, https://doi.org/10.1029/95JD00827, 1995.
Alexander, B., Sherwen, T., Holmes, C. D., Fisher, J. A., Chen, Q., Evans, M. J., and Kasibhatla, P.: Global inorganic nitrate production mechanisms: comparison of a global model with nitrate isotope observations, Atmos. Chem. Phys., 20, 3859–3877, https://doi.org/10.5194/acp-20-3859-2020, 2020.
Andreae, M. O.: Ocean-atmosphere interactions in the global biogeochemical sulfur cycle, Mar. Chem., 30, 1–29, https://doi.org/10.1016/0304-4203(90)90059-L, 1990.
Angle, K. J., Crocker, D. R., Simpson, R. M. C., Mayer, K. J., Garofalo, L. A., Moore, A. N., Mora Garcia, S. L., Or, V. W., Srinivasan, S., Farhan, M., Sauer, J. S., Lee, C., Pothier, M. A., Farmer, D. K., Martz, T. R., Bertram, T. H., Cappa, C. D., Prather, K. A., and Grassian, V. H.: Acidity across the interface from the ocean surface to sea spray aerosol, P. Natl. Acad. Sci. USA, 118, e2018397118, https://doi.org/10.1073/pnas.2018397118, 2021.
Antweiler, R. C. and Taylor, H. E.: Evaluation of Statistical Treatments of Left-Censored Environmental Data using Coincident Uncensored Data Sets: I. Summary Statistics, Environ. Sci. Technol., 42, 3732–3738, https://doi.org/10.1021/es071301c, 2008.
Assaf, E., Finewax, Z., Marshall, P., Veres, P. R., Neuman, J. A., and Burkholder, J. B.: Measurement of the Intramolecular Hydrogen-Shift Rate Coefficient for the CH3SCH2OO Radical between 314 and 433 K, J. Phys. Chem. A, 127, 2336–2350, https://doi.org/10.1021/acs.jpca.2c09095, 2023.
Baccarini, A., Karlsson, L., Dommen, J., Duplessis, P., Vüllers, J., Brooks, I. M., Saiz-Lopez, A., Salter, M., Tjernström, M., Baltensperger, U., Zieger, P., and Schmale, J.: Frequent new particle formation over the high Arctic pack ice by enhanced iodine emissions, Nat Commun, 11, 4924, https://doi.org/10.1038/s41467-020-18551-0, 2020.
Barnes, I., Becker, K. H., and Patroescu, I.: The tropospheric oxidation of dimethyl sulfide: A new source of carbonyl sulfide, Geophys. Res. Lett., 21, 2389–2392, https://doi.org/10.1029/94GL02499, 1994.
Barth, M. C., Ervens, B., Herrmann, H., Tilgner, A., McNeill, V. F., Tsui, W. G., Deguillaume, L., Chaumerliac, N., Carlton, A., and Lance, S. M.: Box Model Intercomparison of Cloud Chemistry, J. Geophys. Res.-Atmos., 126, e2021JD035486, https://doi.org/10.1029/2021JD035486, 2021.
Bates, T. S., Lamb, B. K., Guenther, A., Dignon, J., and Stoiber, R. E.: Sulfur emissions to the atmosphere from natural sourees, J. Atmos. Chem., 14, 315–337, https://doi.org/10.1007/BF00115242, 1992.
Berndt, T., Scholz, W., Mentler, B., Fischer, L., Hoffmann, E. H., Tilgner, A., Hyttinen, N., Prisle, N. L., Hansel, A., and Herrmann, H.: Fast Peroxy Radical Isomerization and OH Recycling in the Reaction of OH Radicals with Dimethyl Sulfide, J. Phys. Chem. Lett., 10, 6478–6483, https://doi.org/10.1021/acs.jpclett.9b02567, 2019.
Bertram, T. H., Kimmel, J. R., Crisp, T. A., Ryder, O. S., Yatavelli, R. L. N., Thornton, J. A., Cubison, M. J., Gonin, M., and Worsnop, D. R.: A field-deployable, chemical ionization time-of-flight mass spectrometer, Atmos. Meas. Tech., 4, 1471–1479, https://doi.org/10.5194/amt-4-1471-2011, 2011.
Brühl, C., Lelieveld, J., Crutzen, P. J., and Tost, H.: The role of carbonyl sulphide as a source of stratospheric sulphate aerosol and its impact on climate, Atmos. Chem. Phys., 12, 1239–1253, https://doi.org/10.5194/acp-12-1239-2012, 2012.
Burkholder, J. B., Sander, S. P., Abbatt, J., Barker, J. R., Cappa, C., Crounse, J. D., Dibble, T. S., Huie, R. E., Kolb, C. E., Kurylo, M. J., Orkin, V. L., Percival, C. J., Wilmouth, D. M., and Wine, P. H.: Chemical Kinetics and Photochemical Data for Use in Atmospheric Studies, Evaluation No. 19, JPL Publication 19-5, http://jpldataeval.jpl.nasa.gov (last access: 5 December 2023), 2019.
Challenger, F. and Simpson, M. I.: 320. Studies on biological methylation. Part XII. A precursor of the dimethyl sulphide evolved by Polysiphonia fastigiata. dimethyl-2-carboxyethylsulphonium hydroxide and its salts, J. Chem. Soc., 1948, 1591–1597, https://doi.org/10.1039/jr9480001591, 1948.
Chan, Y.-C., Evans, M. J., He, P., Holmes, C. D., Jaeglé, L., Kasibhatla, P., Liu, X.-Y., Sherwen, T., Thornton, J. A., Wang, X., Xie, Z., Zhai, S., and Alexander, B.: Heterogeneous Nitrate Production Mechanisms in Intense Haze Events in the North China Plain, J. Geophys. Res.-Atmos., 126, e2021JD034688, https://doi.org/10.1029/2021JD034688, 2021.
Chen, J., Lane, J. R., Bates, K. H., and Kjaergaard, H. G.: Atmospheric Gas-Phase Formation of Methanesulfonic Acid, Environ. Sci. Technol., 57, 21168–21177, https://doi.org/10.1021/acs.est.3c07120, 2023.
Chen, Q., Sherwen, T., Evans, M., and Alexander, B.: DMS oxidation and sulfur aerosol formation in the marine troposphere: a focus on reactive halogen and multiphase chemistry, Atmos. Chem. Phys., 18, 13617–13637, https://doi.org/10.5194/acp-18-13617-2018, 2018.
Chernykh, I. V. and Eskridge, R. E.: Determination of Cloud Amount and Level from Radiosonde Soundings, J. Appl. Meteorol. Climatol., 35, 1362–1369, https://doi.org/10.1175/1520-0450(1996)035<1362:DOCAAL>2.0.CO;2, 1996.
Chin, M., Jacob, D. J., Gardner, G. M., Foreman-Fowler, M. S., Spiro, P. A., and Savoie, D. L.: A global three-dimensional model of tropospheric sulfate, J. Geophys. Res.-Atmos., 101, 18667–18690, https://doi.org/10.1029/96JD01221, 1996.
Conley, S. A., Faloona, I., Miller, G. H., Lenschow, D. H., Blomquist, B., and Bandy, A.: Closing the dimethyl sulfide budget in the tropical marine boundary layer during the Pacific Atmospheric Sulfur Experiment, Atmos. Chem. Phys., 9, 8745–8756, https://doi.org/10.5194/acp-9-8745-2009, 2009.
Covert, D. S., Kapustin, V. N., Quinn, P. K., and Bates, T. S.: New particle formation in the marine boundary layer, J. Geophys. Res.-Atmos., 97, 20581–20589, https://doi.org/10.1029/92JD02074, 1992.
Creasey, D. J., Evans, G. E., Heard, D. E., and Lee, J. D.: Measurements of OH and HO2 concentrations in the Southern Ocean marine boundary layer, J. Geophys. Res.-Atmos., 108, D15, https://doi.org/10.1029/2002JD003206, 2003.
De Bruyn, W. J., Zahniser, M. S., and Kolb, C. E.: Uptake of gas phase sulfur species methanesulfonic acid, dimethylsulfoxide, and dimethyl sulfone by aqueous surfaces, J. Geophys. Res.-Atmos., 99, 16927–16932, https://doi.org/10.1029/94JD00684, 1994.
Faloona, I.: Sulfur processing in the marine atmospheric boundary layer: A review and critical assessment of modeling uncertainties, Atmos. Environ., 43, 2841–2854, https://doi.org/10.1016/j.atmosenv.2009.02.043, 2009.
Feingold, G., Kreidenweis, S. M., and Zhang, Y.: Stratocumulus processing of gases and cloud condensation nuclei: 1. Trajectory ensemble model, J. Geophys. Res.-Atmos., 103, 19527–19542, https://doi.org/10.1029/98JD01750, 1998.
Feingold, G., McComiskey, A., Rosenfeld, D., and Sorooshian, A.: On the relationship between cloud contact time and precipitation susceptibility to aerosol, J. Geophys. Res.-Atmos., 118, 10544–10554, https://doi.org/10.1002/jgrd.50819, 2013.
Flynn, D. and Morris, V.: Total Sky Imager (TSISKYCOVER), ARM Data Center [data set], https://doi.org/10.5439/1992207, 2022.
Gelaro, R., McCarty, W., Suárez, M. J., Todling, R., Molod, A., Takacs, L., Randles, C. A., Darmenov, A., Bosilovich, M. G., Reichle, R., Wargan, K., Coy, L., Cullather, R., Draper, C., Akella, S., Buchard, V., Conaty, A., Silva, A. M. da, Gu, W., Kim, G.-K., Koster, R., Lucchesi, R., Merkova, D., Nielsen, J. E., Partyka, G., Pawson, S., Putman, W., Rienecker, M., Schubert, S. D., Sienkiewicz, M., and Zhao, B.: The Modern-Era Retrospective Analysis for Research and Applications, Version 2 (MERRA-2), J. Climate, 30, 5419–5454, https://doi.org/10.1175/JCLI-D-16-0758.1, 2017.
Ghate, V. P., Surleta, T., Magaritz-Ronen, L., Raveh-Rubin, S., Gallo, F., Carlton, A. G., and Azevedo, E. B.: Drivers of Cloud Condensation Nuclei in the Eastern North Atlantic as Observed at the ARM Site, J. Geophys. Res.-Atmos., 128, e2023JD038636, https://doi.org/10.1029/2023JD038636, 2023.
Global Modeling and Assimilation Office (GMAO): MERRA-2 tavg3_3d_rad_Np: 3d,3-Hourly,Time-Averaged,Pressure-Level,Assimilation,Radiation Diagnostics V5.12.4, Goddard Earth Sciences Data and Information Services Center (GES DISC) [data set], https://doi.org/10.5067/3UGE8WQXZAOK, 2015.
GOES-R Algorithm Working Group, and GOES-R Series Program: NOAA GOES-R Series Advanced Baseline Imager (ABI) Level 2 Cloud and Moisture Imagery Products (CMIP) MCMIPF, NOAA National Centers for Environmental Information [data set], https://doi.org/10.7289/V5736P36, 2017.
Hall, S. R., Ullmann, K., Prather, M. J., Flynn, C. M., Murray, L. T., Fiore, A. M., Correa, G., Strode, S. A., Steenrod, S. D., Lamarque, J.-F., Guth, J., Josse, B., Flemming, J., Huijnen, V., Abraham, N. L., and Archibald, A. T.: Cloud impacts on photochemistry: building a climatology of photolysis rates from the Atmospheric Tomography mission, Atmos. Chem. Phys., 18, 16809–16828, https://doi.org/10.5194/acp-18-16809-2018, 2018.
Heffter, J.: Transport Layer Depth Calculations, Second Joint Conference on Applications of Air Pollution Meteorology, New Orleans, Louisiana, 1980.
Hoffmann, E. H., Tilgner, A., Schrödner, R., Bräuer, P., Wolke, R., and Herrmann, H.: An advanced modeling study on the impacts and atmospheric implications of multiphase dimethyl sulfide chemistry, P. Natl. Acad. Sci. USA, 113, 11776–11781, https://doi.org/10.1073/pnas.1606320113, 2016.
Hoffmann, E. H., Heinold, B., Kubin, A., Tegen, I., and Herrmann, H.: The Importance of the Representation of DMS Oxidation in Global Chemistry-Climate Simulations, Geophys. Res. Lett., 48, e2021GL094068, https://doi.org/10.1029/2021GL094068, 2021.
Holmes, C. D.: Technical note: Entrainment-limited kinetics of bimolecular reactions in clouds, Atmos. Chem. Phys., 22, 9011–9015, https://doi.org/10.5194/acp-22-9011-2022, 2022.
Holmes, C. D., Bertram, T. H., Confer, K. L., Graham, K. A., Ronan, A. C., Wirks, C. K., and Shah, V.: The Role of Clouds in the Tropospheric NOx Cycle: A New Modeling Approach for Cloud Chemistry and Its Global Implications, Geophys. Res. Lett., 46, 4980–4990, https://doi.org/10.1029/2019GL081990, 2019.
Hulswar, S., Simó, R., Galí, M., Bell, T. G., Lana, A., Inamdar, S., Halloran, P. R., Manville, G., and Mahajan, A. S.: Third revision of the global surface seawater dimethyl sulfide climatology (DMS-Rev3), Earth Syst. Sci. Data, 14, 2963–2987, https://doi.org/10.5194/essd-14-2963-2022, 2022.
Irwin, J. G. and Williams, M. L.: Acid rain: Chemistry and transport, Environ. Pollut., 50, 29–59, https://doi.org/10.1016/0269-7491(88)90184-4, 1988.
Iyer, S., Lopez-Hilfiker, F., Lee, B. H., Thornton, J. A., and Kurtén, T.: Modeling the Detection of Organic and Inorganic Compounds Using Iodide-Based Chemical Ionization, J. Phys. Chem. A, 120, 576–587, https://doi.org/10.1021/acs.jpca.5b09837, 2016.
Jacob, D.: Heterogeneous chemistry and tropospheric ozone, Atmos. Environ., 34, 2131–2159, https://doi.org/10.1016/S1352-2310(99)00462-8, 2000.
Jenkin, M. E., Saunders, S. M., and Pilling, M. J.: The tropospheric degradation of volatile organic compounds: a protocol for mechanism development, Atmos. Environ., 31, 81–104, https://doi.org/10.1016/S1352-2310(96)00105-7, 1997.
Jernigan, C. M., Fite, C. H., Vereecken, L., Berkelhammer, M. B., Rollins, A. W., Rickly, P. S., Novelli, A., Taraborrelli, D., Holmes, C. D., and Bertram, T. H.: Efficient Production of Carbonyl Sulfide in the Low-NOx Oxidation of Dimethyl Sulfide, Geophys. Res. Lett., 49, e2021GL096838, https://doi.org/10.1029/2021GL096838, 2022a.
Jernigan, C. M., Cappa, C. D., and Bertram, T. H.: Reactive Uptake of Hydroperoxymethyl Thioformate to Sodium Chloride and Sodium Iodide Aerosol Particles, J. Phys. Chem. A, 126, 4476–4481, https://doi.org/10.1021/acs.jpca.2c03222, 2022b.
Jernigan, C. M., Rivard, M. J., Berkelhammer, M. B., and Bertram, T. H.: Sulfate and Carbonyl Sulfide Production in Aqueous Reactions of Hydroperoxymethyl Thioformate, ACS EST Air, 1, 397–404, https://doi.org/10.1021/acsestair.3c00098, 2024.
Johnson, K., Giangrande, S., and Toto, T.: Active Remote Sensing of Clouds (ARSCL) product using Ka-band ARM Zenith Radars (ARSCLKAZRBND1KOLLISAS), ARM Data Center [data set], https://doi.org/10.5439/1393438, 2022.
Johnson, M. T.: A numerical scheme to calculate temperature and salinity dependent air-water transfer velocities for any gas, Ocean Sci., 6, 913–932, https://doi.org/10.5194/os-6-913-2010, 2010.
Jokinen, T., Sipilä, M., Kontkanen, J., Vakkari, V., Tisler, P., Duplissy, E.-M., Junninen, H., Kangasluoma, J., Manninen, H. E., Petäjä, T., Kulmala, M., Worsnop, D. R., Kirkby, J., Virkkula, A., and Kerminen, V.-M.: Ion-induced sulfuric acid–ammonia nucleation drives particle formation in coastal Antarctica, Sci. Adv., 4, eaat9744, https://doi.org/10.1126/sciadv.aat9744, 2018.
Khan, M. A. H., Bannan, T. J., Holland, R., Shallcross, D. E., Archibald, A. T., Matthews, E., Back, A., Allan, J., Coe, H., Artaxo, P., and Percival, C. J.: Impacts of Hydroperoxymethyl Thioformate on the Global Marine Sulfur Budget, ACS Earth Space Chem., 5, 2577–2586, https://doi.org/10.1021/acsearthspacechem.1c00218, 2021.
Kiene, R. P.: Production of methanethiol from dimethylsulfoniopropionate in marine surface waters, Mar. Chem., 54, 69–83, https://doi.org/10.1016/0304-4203(96)00006-0, 1996.
Kilgour, D. B. and Bertram, T. H.: Cloud processing of DMS oxidation products limits SO2 and OCS production in the Eastern North Atlantic marine boundary layer, MINDS@UW [data set], http://digital.library.wisc.edu/1793/85493 (last access: 19 June 2024), 2024.
Kilgour, D. B., Novak, G. A., Sauer, J. S., Moore, A. N., Dinasquet, J., Amiri, S., Franklin, E. B., Mayer, K., Winter, M., Morris, C. K., Price, T., Malfatti, F., Crocker, D. R., Lee, C., Cappa, C. D., Goldstein, A. H., Prather, K. A., and Bertram, T. H.: Marine gas-phase sulfur emissions during an induced phytoplankton bloom, Atmos. Chem. Phys., 22, 1601–1613, https://doi.org/10.5194/acp-22-1601-2022, 2022.
Kilgour, D. B., Jernigan, C. M., Zhou, S., Brito de Azevedo, E., Wang, J., Zawadowicz, M. A., and Bertram, T. H.: Contribution of Speciated Monoterpenes to Secondary Aerosol in the Eastern North Atlantic, ACS EST Air, https://doi.org/10.1021/acsestair.3c00112, 2024.
Kogan, Y. L.: Large-Eddy Simulation of Air Parcels in Stratocumulus Clouds: Time Scales and Spatial Variability, J. Atmos. Sci., 63, 952–967, https://doi.org/10.1175/JAS3665.1, 2006.
Krechmer, J., Lopez-Hilfiker, F., Koss, A., Hutterli, M., Stoermer, C., Deming, B., Kimmel, J., Warneke, C., Holzinger, R., Jayne, J., Worsnop, D., Fuhrer, K., Gonin, M., and de Gouw, J.: Evaluation of a New Reagent-Ion Source and Focusing Ion–Molecule Reactor for Use in Proton-Transfer-Reaction Mass Spectrometry, Anal. Chem., 90, 12011–12018, https://doi.org/10.1021/acs.analchem.8b02641, 2018.
Kremser, S., Thomason, L. W., von Hobe, M., Hermann, M., Deshler, T., Timmreck, C., Toohey, M., Stenke, A., Schwarz, J. P., Weigel, R., Fueglistaler, S., Prata, F. J., Vernier, J.-P., Schlager, H., Barnes, J. E., Antuña-Marrero, J.-C., Fairlie, D., Palm, M., Mahieu, E., Notholt, J., Rex, M., Bingen, C., Vanhellemont, F., Bourassa, A., Plane, J. M. C., Klocke, D., Carn, S. A., Clarisse, L., Trickl, T., Neely, R., James, A. D., Rieger, L., Wilson, J. C., and Meland, B.: Stratospheric aerosol – Observations, processes, and impact on climate, Rev. Geophys., 54, 278–335, https://doi.org/10.1002/2015RG000511, 2016.
Kuma, P., McDonald, A. J., Morgenstern, O., Alexander, S. P., Cassano, J. J., Garrett, S., Halla, J., Hartery, S., Harvey, M. J., Parsons, S., Plank, G., Varma, V., and Williams, J.: Evaluation of Southern Ocean cloud in the HadGEM3 general circulation model and MERRA-2 reanalysis using ship-based observations, Atmos. Chem. Phys., 20, 6607–6630, https://doi.org/10.5194/acp-20-6607-2020, 2020.
Lamkaddam, H., Dommen, J., Ranjithkumar, A., Gordon, H., Wehrle, G., Krechmer, J., Majluf, F., Salionov, D., Schmale, J., Bjelić, S., Carslaw, K. S., El Haddad, I., and Baltensperger, U.: Large contribution to secondary organic aerosol from isoprene cloud chemistry, Sci. Adv., 7, eabe2952, https://doi.org/10.1126/sciadv.abe2952, 2021.
Lawson, S. J., Law, C. S., Harvey, M. J., Bell, T. G., Walker, C. F., de Bruyn, W. J., and Saltzman, E. S.: Methanethiol, dimethyl sulfide and acetone over biologically productive waters in the southwest Pacific Ocean, Atmos. Chem. Phys., 20, 3061–3078, https://doi.org/10.5194/acp-20-3061-2020, 2020.
Lee, J. D., Moller, S. J., Read, K. A., Lewis, A. C., Mendes, L., and Carpenter, L. J.: Year-round measurements of nitrogen oxides and ozone in the tropical North Atlantic marine boundary layer, J. Geophys. Res.-Atmos., 114, D21, https://doi.org/10.1029/2009JD011878, 2009.
Levine, S. Z. and Schwartz, S. E.: In-cloud and below-cloud scavenging of Nitric acid vapor, Atmos. Environ. (1967), 16, 1725–1734, https://doi.org/10.1016/0004-6981(82)90266-9, 1982.
Li, Y., Barth, M. C., Patton, E. G., and Steiner, A. L.: Impact of In-Cloud Aqueous Processes on the Chemistry and Transport of Biogenic Volatile Organic Compounds, J. Geophys. Res.-Atmos., 122, 11131–11153, https://doi.org/10.1002/2017JD026688, 2017.
Liggio, J. and Li, S.-M.: Reactive uptake of pinonaldehyde on acidic aerosols, J. Geophys. Res.-Atmos., 111, D24, https://doi.org/10.1029/2005JD006978, 2006.
Montzka, S. A., Calvert, P., Hall, B. D., Elkins, J. W., Conway, T. J., Tans, P. P., and Sweeney, C.: On the global distribution, seasonality, and budget of atmospheric carbonyl sulfide (COS) and some similarities to CO2, J. Geophys. Res.-Atmos., 112, D9, https://doi.org/10.1029/2006JD007665, 2007.
Naud, C. M., Elsaesser, G. S., and Booth, J. F.: Dominant Cloud Controlling Factors for Low-Level Cloud Fraction: Subtropical Versus Extratropical Oceans, Geophys. Res. Lett., 50, e2023GL104496, https://doi.org/10.1029/2023GL104496, 2023.
Novak, G. A., Fite, C. H., Holmes, C. D., Veres, P. R., Neuman, J. A., Faloona, I., Thornton, J. A., Wolfe, G. M., Vermeuel, M. P., Jernigan, C. M., Peischl, J., Ryerson, T. B., Thompson, C. R., Bourgeois, I., Warneke, C., Gkatzelis, G. I., Coggon, M. M., Sekimoto, K., Bui, T. P., Dean-Day, J., Diskin, G. S., DiGangi, J. P., Nowak, J. B., Moore, R. H., Wiggins, E. B., Winstead, E. L., Robinson, C., Thornhill, K. L., Sanchez, K. J., Hall, S. R., Ullmann, K., Dollner, M., Weinzierl, B., Blake, D. R., and Bertram, T. H.: Rapid cloud removal of dimethyl sulfide oxidation products limits SO2 and cloud condensation nuclei production in the marine atmosphere, P. Natl. Acad. Sci. USA, 118, e2110472118, https://doi.org/10.1073/pnas.2110472118, 2021.
Novak, G. A., Kilgour, D. B., Jernigan, C. M., Vermeuel, M. P., and Bertram, T. H.: Oceanic emissions of dimethyl sulfide and methanethiol and their contribution to sulfur dioxide production in the marine atmosphere, Atmos. Chem. Phys., 22, 6309–6325, https://doi.org/10.5194/acp-22-6309-2022, 2022.
Parrella, J. P., Jacob, D. J., Liang, Q., Zhang, Y., Mickley, L. J., Miller, B., Evans, M. J., Yang, X., Pyle, J. A., Theys, N., and Van Roozendael, M.: Tropospheric bromine chemistry: implications for present and pre-industrial ozone and mercury, Atmos. Chem. Phys., 12, 6723–6740, https://doi.org/10.5194/acp-12-6723-2012, 2012.
Pitchford, M., Malm, W., Schichtel, B., Kumar, N., Lowenthal, D., and Hand, J.: Revised Algorithm for Estimating Light Extinction from IMPROVE Particle Speciation Data, J. Air Waste Manage. Assoc., 57, 1326–1336, https://doi.org/10.3155/1047-3289.57.11.1326, 2007.
Podglajen, A., Plougonven, R., Hertzog, A., and Legras, B.: A modelling case study of a large-scale cirrus in the tropical tropopause layer, Atmos. Chem. Phys., 16, 3881–3902, https://doi.org/10.5194/acp-16-3881-2016, 2016.
Riihimaki, L., Sivaraman, C., and Zhang, D.: Planetary Bopundary Layer Height (PBLHTSONDE1MCFARL), ARM Data Center [data set], https://doi.org/10.5439/1991783, 2022.
Riva, M., Pospisilova, V., Frege, C., Perrier, S., Bansal, P., Jorga, S., Sturm, P., Thornton, J. A., Rohner, U., and Lopez-Hilfiker, F.: Evaluation of a reduced-pressure chemical ion reactor utilizing adduct ionization for the detection of gaseous organic and inorganic species, Atmos. Meas. Tech., 17, 5887–5901, https://doi.org/10.5194/amt-17-5887-2024, 2024.
Saunders, S. M., Jenkin, M. E., Derwent, R. G., and Pilling, M. J.: Protocol for the development of the Master Chemical Mechanism, MCM v3 (Part A): tropospheric degradation of non-aromatic volatile organic compounds, Atmos. Chem. Phys., 3, 161–180, https://doi.org/10.5194/acp-3-161-2003, 2003.
Shah, V., Jacob, D. J., Thackray, C. P., Wang, X., Sunderland, E. M., Dibble, T. S., Saiz-Lopez, A., Černušák, I., Kellö, V., Castro, P. J., Wu, R., and Wang, C.: Improved Mechanistic Model of the Atmospheric Redox Chemistry of Mercury, Environ. Sci. Technol., 55, 14445–14456, https://doi.org/10.1021/acs.est.1c03160, 2021.
Siegel, K., Gramlich, Y., Haslett, S. L., Freitas, G., Krejci, R., Zieger, P., and Mohr, C.: Arctic observations of hydroperoxymethyl thioformate (HPMTF) – seasonal behavior and relationship to other oxidation products of dimethyl sulfide at the Zeppelin Observatory, Svalbard, Atmos. Chem. Phys., 23, 7569–7587, https://doi.org/10.5194/acp-23-7569-2023, 2023.
Spivakovsky, C. M., Logan, J. A., Montzka, S. A., Balkanski, Y. J., Foreman-Fowler, M., Jones, D. B. A., Horowitz, L. W., Fusco, A. C., Brenninkmeijer, C. a. M., Prather, M. J., Wofsy, S. C., and McElroy, M. B.: Three-dimensional climatological distribution of tropospheric OH: Update and evaluation, J. Geophys. Res.-Atmos., 105, 8931–8980, https://doi.org/10.1029/1999JD901006, 2000.
Stevens, B., Feingold, G., Cotton, W. R., and Walko, R. L.: Elements of the microphysical structure of numerically simulated nonprecipitating stratocumulus, J. Atmos. Sci., 53, 980–1006, https://doi.org/10.1175/1520-0469(1996)053<0980:EOTMSO>2.0.CO;2, 1996.
Tost, H., Jöckel, P., Kerkweg, A., Sander, R., and Lelieveld, J.: Technical note: A new comprehensive SCAVenging submodel for global atmospheric chemistry modelling, Atmos. Chem. Phys., 6, 565–574, https://doi.org/10.5194/acp-6-565-2006, 2006.
Uin, J., Aiken, A. C., Dubey, M. K., Kuang, C., Pekour, M., Salwen, C., Sedlacek, A. J., Senum, G., Smith, S., Wang, J., Watson, T. B., and Springston, S. R.: Atmospheric Radiation Measurement (ARM) Aerosol Observing Systems (AOS) for Surface-Based In Situ Atmospheric Aerosol and Trace Gas Measurements, J. Atmos. Ocean. Technol., 36, 2429–2447, https://doi.org/10.1175/JTECH-D-19-0077.1, 2019.
Vaughan, S., Ingham, T., Whalley, L. K., Stone, D., Evans, M. J., Read, K. A., Lee, J. D., Moller, S. J., Carpenter, L. J., Lewis, A. C., Fleming, Z. L., and Heard, D. E.: Seasonal observations of OH and HO2 in the remote tropical marine boundary layer, Atmos. Chem. Phys., 12, 2149–2172, https://doi.org/10.5194/acp-12-2149-2012, 2012.
Veres, P. R., Neuman, J. A., Bertram, T. H., Assaf, E., Wolfe, G. M., Williamson, C. J., Weinzierl, B., Tilmes, S., Thompson, C. R., Thames, A. B., Schroder, J. C., Saiz-Lopez, A., Rollins, A. W., Roberts, J. M., Price, D., Peischl, J., Nault, B. A., Møller, K. H., Miller, D. O., Meinardi, S., Li, Q., Lamarque, J.-F., Kupc, A., Kjaergaard, H. G., Kinnison, D., Jimenez, J. L., Jernigan, C. M., Hornbrook, R. S., Hills, A., Dollner, M., Day, D. A., Cuevas, C. A., Campuzano-Jost, P., Burkholder, J., Bui, T. P., Brune, W. H., Brown, S. S., Brock, C. A., Bourgeois, I., Blake, D. R., Apel, E. C., and Ryerson, T. B.: Global airborne sampling reveals a previously unobserved dimethyl sulfide oxidation mechanism in the marine atmosphere, P. Natl. Acad. Sci. USA, 117, 4505–4510, https://doi.org/10.1073/pnas.1919344117, 2020.
Vermeuel, M. P., Novak, G. A., Jernigan, C. M., and Bertram, T. H.: Diel Profile of Hydroperoxymethyl Thioformate: Evidence for Surface Deposition and Multiphase Chemistry, Environ. Sci. Technol., 54, 12521–12529, https://doi.org/10.1021/acs.est.0c04323, 2020.
Wang, X., Jacob, D. J., Downs, W., Zhai, S., Zhu, L., Shah, V., Holmes, C. D., Sherwen, T., Alexander, B., Evans, M. J., Eastham, S. D., Neuman, J. A., Veres, P. R., Koenig, T. K., Volkamer, R., Huey, L. G., Bannan, T. J., Percival, C. J., Lee, B. H., and Thornton, J. A.: Global tropospheric halogen (Cl, Br, I) chemistry and its impact on oxidants, Atmos. Chem. Phys., 21, 13973–13996, https://doi.org/10.5194/acp-21-13973-2021, 2021.
Wang, J., Wood, R., Jensen M. P., Chiu, J. C., Liu, Y., Lamer, K., Desai, N., Giangrande S. E., Knopf, D. A., Kollias, P., Laskin, A., Liu, X., Lu, C., Mechem, D., Mei, F., Starzec, M., Tomlinson, J., Wang, Y., Yum, S. S., Zheng, G., Aiken A. C., Azevedo E. B., Blanchard, Y., China, S., Dong, X., Gallo, F., Gao, S., Ghate, V. P., Glienke, S., Goldberger, L., Hardin, J. C., Kuang, C., Luke, E. P., Matthews, A. A., Miller, M. A., Moffet, R., Pekour, M., Schmid, B., Sedlacek, A. J., Shaw, R. A., Shilling, J. E., Sullivan, A., Suski, K., Veghte, D. P., Weber, R., Wyant, M., Yeom, J., Zawadowicz, M., and Zhang, Z.: Aerosol and Cloud Experiments in the Eastern North Atlantic (ACE-ENA), B. Am. Meteorol. Soc., 103, E619–E641, https://doi.org/10.1175/bams-d-19-0220.1, 2022.
Wolfe, G. M., Marvin, M. R., Roberts, S. J., Travis, K. R., and Liao, J.: The Framework for 0-D Atmospheric Modeling (F0AM) v3.1, Geosci. Model Dev., 9, 3309–3319, https://doi.org/10.5194/gmd-9-3309-2016, 2016.
Wood, R.: Stratocumulus Clouds, Mon. Weather Rev., 140, 2373–2423, https://doi.org/10.1175/MWR-D-11-00121.1, 2012.
Wu, R., Wang, S., and Wang, L.: New Mechanism for the Atmospheric Oxidation of Dimethyl Sulfide. The Importance of Intramolecular Hydrogen Shift in a CH3SCH2OO Radical, J. Phys. Chem. A, 119, 112–117, https://doi.org/10.1021/jp511616j, 2015.
Yang, Q., Easter, R. C., Campuzano-Jost, P., Jimenez, J. L., Fast, J. D., Ghan, S. J., Wang, H., Berg, L. K., Barth, M. C., Liu, Y., Shrivastava, M. B., Singh, B., Morrison, H., Fan, J., Ziegler, C. L., Bela, M., Apel, E., Diskin, G. S., Mikoviny, T., and Wisthaler, A.: Aerosol transport and wet scavenging in deep convective clouds: A case study and model evaluation using a multiple passive tracer analysis approach, J. Geophys. Res.-Atmos., 120, 8448–8468, https://doi.org/10.1002/2015JD023647, 2015.
Zhang, X., Massoli, P., Quinn, P. K., Bates, T. S., and Cappa, C. D.: Hygroscopic growth of submicron and supermicron aerosols in the marine boundary layer, J. Geophys. Res.-Atmos., 119, 8384–8399, https://doi.org/10.1002/2013JD021213, 2014.
Zieger, P., Väisänen, O., Corbin, J. C., Partridge, D. G., Bastelberger, S., Mousavi-Fard, M., Rosati, B., Gysel, M., Krieger, U. K., Leck, C., Nenes, A., Riipinen, I., Virtanen, A., and Salter, M. E.: Revising the hygroscopicity of inorganic sea salt particles, Nat. Commun., 8, 15883, https://doi.org/10.1038/ncomms15883, 2017.