the Creative Commons Attribution 4.0 License.
the Creative Commons Attribution 4.0 License.
 | 12 Feb 2025
Measurement report: Brown carbon aerosol in rural Germany – sources, chemistry, and diurnal variations
Feng Jiang
Uzoamaka Ezenobi
Junwei Song
Hengheng Zhang
Linyu Gao
Thomas Leisner
Brown carbon aerosol (BrC) is a major contributor to atmospheric air pollution in Europe, especially in winter. Therefore, we studied the chemical composition, diurnal variation, and sources of BrC from 17 February to 16 March 2021 at a rural location in southwest Germany. In total, 178 potential BrC molecules (including 7 nitro aromatic compounds, NACs) were identified in the particle phase comprising on average 83 ± 44 ng m−3, and 31 potential BrC (including 4 NACs) molecules were identified in the gas phase contributing on average 8.5 ± 6.7 ng m−3 during the whole campaign. The average light absorption of seven NACs in the particle phase was 0.2 ± 0.2 Mm−1, contributing to 2.2 ± 2.1 % of total BrC absorption at 370 nm. In addition, diurnal variations show that gas-phase BrC was higher in the daytime and lower at night. It was mainly controlled by secondary formation (e.g. photooxidation) and particle-to-gas partitioning. Correspondingly, the particle-phase BrC was lower in the daytime and higher at night. Secondary formation dominates the particle-phase BrC with 61 ± 21 %, while 39 ± 21 % originated from biomass burning. Furthermore, the particle-phase BrC showed decreasing light absorption due to photochemical ageing. This study extends the current understanding of real-time behaviours of brown carbon aerosol in the gas and particle phase at a location characteristic of central Europe.
- Article
(2060 KB) - Full-text XML
-
Supplement
(1396 KB) - BibTeX
- EndNote


Brown carbon (BrC) aerosol has a significant impact on air quality and climate, since it absorbs solar radiation in the near-ultraviolet and visible region (Laskin et al., 2015; Moise et al., 2015). Global simulations showed that the mean radiative forcing of BrC aerosol was −0.43 and 0.05 W m−2 at the surface and at the top of the atmosphere, accounting for 15 % of total radiative forcing by the absorbing aerosol (Park et al., 2010). In addition, global measurements of BrC found that the average direct radiative effect of BrC absorption accounted for between 7 % and 48 % at the top of the atmosphere (Zeng et al., 2020).
Some typical molecules of BrC have been identified, such as nitro-aromatic compounds (NACs), imidazoles, and polycyclic aromatic hydrocarbons (PAHs) (Jiang et al., 2022; Wu et al., 2018; Huang et al., 2018; Liu et al., 2023). In western Europe, the concentration levels of NACs range between 1 and 20 ng m−3, accounting for 0.3 %–4 % of total absorption of BrC at UV wavelengths (Jiang et al., 2022; Mohr et al., 2013; Teich et al., 2017). In addition, imidazoles were detected with concentrations ranging between 0.2 and 14 ng m−3 in ambient aerosol samples from different environments in Europe and China (Teich et al., 2016). Furthermore, parent PAHs and carbonyl oxygenated PAHs (OPAHs) accounted for on average ∼ 1.7 % of the overall absorption of methanol-soluble BrC in urban Xi'an, northwest China (Huang et al., 2018). Even though many studies have investigated the chemical composition of brown carbon and calculated the absorption contribution from BrC molecules, there are still many unknown brown carbon molecules to allow a quantitative assessment of their sources and atmospheric impact.
Sources of BrC can be separated as primary emissions and secondary formation. The primary sources of BrC are biomass burning and fossil fuel combustion (Andreae and Gelencsér, 2006). On a global scale, the majority of BrC aerosol mass is associated with biomass burning dominating BrC absorption (Zeng et al., 2020). The major secondary sources of brown carbon are from oxidation of aromatic volatile organic compounds, such as toluene (Lin et al., 2015), naphthalene (Siemens et al., 2022), ethylbenzene (Yang et al., 2022), and indole (Montoya-Aguilera et al., 2017; Jiang et al., 2024b), especially in the presence of NO2.
BrC in the atmosphere can be suspended in the gas phase or particle phase. However, only a few studies have investigated the sources and chemical composition of BrC in the gas phase. For example, NACs in the gas phase were highest during the daytime at a rural site in China (Salvador et al., 2021). The major sources of NACs were from secondary formation on days without extensive biomass burning emissions but mainly from primary emissions in biomass burning events (Salvador et al., 2021). The source of nitrophenol, a typical BrC molecule, was mainly from secondary formation overweighting losses by photolysis in polluted urban environments, Beijing (Cheng et al., 2021). The major chromophores of BrC in the gas phase were rich in phenol- and protein-like substances in Xi'an, China, during the summer (Chen et al., 2021). Therefore, previous studies mainly focus on sources and chromophores of BrC, especially NACs. However, the real-time diurnal variation and sources of BrC in the gas phase in the atmosphere have rarely been investigated in central Europe.
Previous field studies have investigated the sources of BrC in the particle phase, which are mainly from secondary formation and primary emissions (Wang et al., 2019a; Moschos et al., 2018; Satish et al., 2017). In central Europe, the secondary biogenic organic aerosol (OA) contributes less BrC in summer. However, the primary and secondary wood burning emissions dominated the BrC (Moschos et al., 2018). The primary emissions of BrC contributed more to organic aerosol light absorption than those from secondary processes in the North China Plain, China (Wang et al., 2019a). However, secondary sources for BrC were more important for absorption than primary ones in the southeastern margin of the Tibetan Plateau (Wang et al., 2019b). Loss pathways of BrC in the particle phase mainly comprise photooxidation and photobleaching but also dilution of BrC; for example, rising boundary layer height influences its concentration levels (Satish et al., 2017; Laskin et al., 2015; Moise et al., 2015). The absorption of BrC was high in the early morning and later decreased due to the bleaching of chromophores (Wang et al., 2019a; Satish et al., 2017). A diurnal cycle showed that secondary chromophores can be formed from photochemical oxidation after sunrise followed by photobleaching of the chromophores under the oxidizing conditions as the day progressed (Wang et al., 2019b). Lower BrC concentrations at noon were explained by the fact that planetary boundary layer heights were highest during the middle of the day (Liu et al., 2023). However, also nighttime aqueous-phase chemistry can promote the formation of secondary light absorbing compounds and the production of strongly absorbing particles (Wang et al., 2019a). In addition, higher emissions of biomass burning BrC were observed at night. Actually, the BrC in the particle phase undergoes complex photochemical processing during the whole day. The time-dependent sources and diurnal variations of BrC in aerosol particles are still reported rarely and not well understood.
To better understand the chemical characterization, diurnal variation, and sources of BrC in central Europe, we performed online measurements of BrC during February–March 2021 at a rural location in southwest Germany. In the following, we will describe the experimental methods used in this study. Subsequently, the mass concentrations of BrC in the gas and particle phase will be determined. Furthermore, the contribution of BrC to light absorption in the particle phase will be estimated. Then, the diurnal variations and sources of BrC in the gas and particle phase will be analysed. Finally, the atmospheric implications of our findings will be discussed.
2.1 Measurement site
We performed particle and trace gas measurements from 17 February–16 March 2021 at KIT Campus Nord, a rather rural area in Germany (49°05′43.1′′ N, 8°25′45.6′′ E). The sampling site is located at building number 322 of the IMK-AAF on KIT Campus Nord, as shown in Fig. S1 in the Supplement. The campus is mostly surrounded by the Hardwald forest, dominated by pine trees. The sampling site is also near some villages, e.g. 3–4 km east of the village Eggenstein-Leopoldshafen, 6–7 km northeast of the village Neureut, 3–4 km west of the village Friedrichstal, 4–5 km northwest of the village Stutensee, and 5–6 km southeast of the village Linkenheim. Therefore, influences by biomass burning emissions from wood stove combustion in these residential areas during wintertime can be expected (Thieringer et al., 2022). Furthermore, the city of Karlsruhe with 3 000 000 inhabitants is 10 km south of the measurement site. The city includes industrial areas with a coal-fired power plant called Rheinhafen and a refinery called MIRO. Therefore, the measurement site is potentially affected by different aerosol sources.
2.2 Meteorological, aerosol particle, and trace gas instruments
All instruments were set up in a temperature-controlled measurement building. The samples were collected above the roof top about 8 m above ground level (a.g.l.) via stainless steel tubes and a PM2.5 and a TSP (total suspended particle) inlet as well as FEP (fluorinated ethylene propylene) tubes for the volatility organic compound (VOC) measurements. An overview of the instruments used and the parameters measured is given in Table S1 of the Supplement.
Temperature, relative humidity (RH), pressure, wind speed, wind direction, precipitation, and global radiation were measured by a meteorological sensor (WS700, Lufft GmbH; see Table S1) about 8 m a.g.l. The main wind directions during the campaign were southwest, northeast, and southeast, since winds were channelled by the Rhine River valley. O3 and NO2 were measured with standard gas monitors (Table S1). The particle number concentrations (> 2.5 nm) were measured by a water-based condensation particle counter (CPC3789, TSI Inc.). PM2.5 was measured by an optical particle counter (OPC-FIDAS 200, Palas Inc.). The particle number size distributions were measured by a nanoparticle sizer (NanoScan, TSI Inc.) ranging from 10–410 nm at a time resolution of 1 min. Black carbon (BC) concentrations were measured with aethalometers (AE33, Aerosol Magee Scientific).
2.3 Online FIGAERO-CIMS measurement and identifications of potential BrC molecules
The individual organic compounds in both the gas and particle phase were measured with a filter inlet for gases and aerosols coupled to a high-resolution time-of-flight chemical ionization mass spectrometer (FIGAERO-HR-ToF-CIMS, Aerodyne Research Inc., hereafter CIMS) employing iodide (I−) for chemical ionization (Lopez-Hilfiker et al., 2014; Jiang et al., 2022). During the gas-phase measurement, the ambient air was sampled via a fluorinated ethylene propylene (FEP) tube of 4.5 m length (flow rate 8 L min−1, residence time 0.9 s). At the same time, the particles were collected on a Teflon (polytetrafluoroethylene, PTFE) filter via a separate sampling port connected to a PM2.5 inlet (total flow rate 16.7 L min−1) and an 8 m long stainless-steel tube. The loading time and sampling flow of Teflon filters were 30 min and 4 L min−1, respectively. At regular intervals (46 min), the gas-phase measurement was switched off, and particles on the filter were desorbed by a flow of ultra-high-purity nitrogen (99.9999 %) heated from room temperature to 200 °C over the course of 35 min (Lopez-Hilfiker et al., 2014; Huang et al., 2019). The resulting mass spectral signal evolution as a function of desorption temperature is termed a thermogram (Lopez-Hilfiker et al., 2014). Integration of thermograms of individual compounds yielded their signals in counts per second, which were converted to mass concentrations using an average sensitivity of 22 counts s−1 ppt−1 (cps ppt−1, ppt: parts per trillion) (Lopez-Hilfiker et al., 2014). First calibrations for nitro aromatic compounds (NACs) were done directly after the field campaign. However, due to technical problems, the calibration of 4-nitrophenol, 4-nitrocatechol, 2-methyl-4-nitrophenol, and 4-methyl-5-nitrocatechol was repeated in August 2024, as shown in the Supplement. Despite the large time between measurements and second calibration, we have indications from repeated measurements of formic acid that the sensitivity of the instrument did not change substantially over this time period. Please note that this leads to an additional uncertainty of about 20 %. The sensitivities of our iodide CIMS for 4-nitrophenol, 4-nitrocatechol, 2-methyl-4-nitrophenol, and 4-methyl-5-nitrocatechol were 18 ± 10, 11 ± 7, 21 ± 11, and 21 ± 14 cps ppt−1, respectively (Fig. S9). The average sensitivity of 4 NACs was 18 ± 12 cps ppt−1. We used this average sensitivity to calibrate other potential brown carbon molecules in this study. The sensitivity of levoglucosan was 9 ± 3 cps ppt−1 in this study (Fig. S10). We used the sensitivity of 9 ± 3 cps ppt−1 to estimate the concentrations of molecules, which are not identified as potential BrC molecules.
During the measurements, the mass resolution of FIGAERO-CIMS was relatively stable with about 4000 m Δm. The interference from isomers with different vapour pressures or thermal fragmentation of larger oligomeric molecules can lead to more complex, multimodal and broader thermograms (Lopez-Hilfiker et al., 2014). The signal integration can include the different isomers or thermal fragmentation of larger oligomers. Therefore, the isomers or thermal decomposition can lead to increase errors of estimating the organic mass concentrations. In this study, BrC molecules were identified and partially quantified in atmospheric aerosol by FIGAERO-CIMS. Please note that the iodide CIMS has sensitivities varying over several orders magnitude for different compounds, for example, of different oxidation states (Lopez-Hilfiker et al., 2016). Therefore, the quantitative interpretation is limited to the small number of compounds for which we could do calibration with authentic standards. Keeping this in mind, it can still be meaningful to do a relative comparison of the large number of highly oxidized compounds assuming the same sensitivity. The raw data were analysed using the toolkit Tofware (v3.1.2, Tofwerk, Thun, Switzerland, and Aerodyne, Billerica) with Igor Pro software (v7.08, Wavemetrics, Portland, OR). The gas-phase background was determined by sampling zero air (high-purity synthetic air). Particle-phase backgrounds were assessed by putting an additional Teflon filter upstream of the particle phase sampling port during the deposition (Huang et al., 2019; Lee et al., 2018).
We observed typically about 1500 mass peaks from particles and 120 mass peaks in gases corresponding to different oxygenated organic compounds using FIGAERO-CIMS. Individual compounds were assigned to the mass peaks by fitting CcHhOoNn with different numbers of atoms according to c, carbon; h, hydrogen; o, oxygen; and n, nitrogen (Lopez-Hilfiker et al., 2014). A double bond equivalent (DBE) can be calculated as follows (Daumit et al., 2013):
Lin et al. (2016, 2018) employed high-resolution mass spectrometry to analyse biomass burning organic aerosol. They assigned potential brown carbon compounds according to the correlation of double bond equivalents (DBEs) with the number of carbon atoms per molecule (Fig. S12). We used this method to assign 178 potential BrC molecules (including 7 NACs) in the particle phase and 31 potential BrC molecules (including 4 NACs) in the gas phase, as shown in Fig. 1 in the corresponding mass spectra. The gas-to-particle phase partitioning coefficients of those semi volatile potential brown carbon molecules which could be measured in both phases with sufficient sensitivity are listed in Table S6. A few other studies also used this method to assign more brown carbon molecules. For example, good correlations (r = 0.9) between mass absorption efficiency at 365 nm and potential brown carbon molecules of larger molecular weight were found by Tang et al. (2020). Xu et al. (2020) used this method to assign 149 nitrogen-containing potential BrC chromophores at the Tibetan Plateau, and we used this method to assign potential BrC molecules in downtown Karlsruhe (Jiang et al., 2022). The potential BrC molecules we assigned according to this method for the particle and the gas phase are listed in Tables S2 and S3.
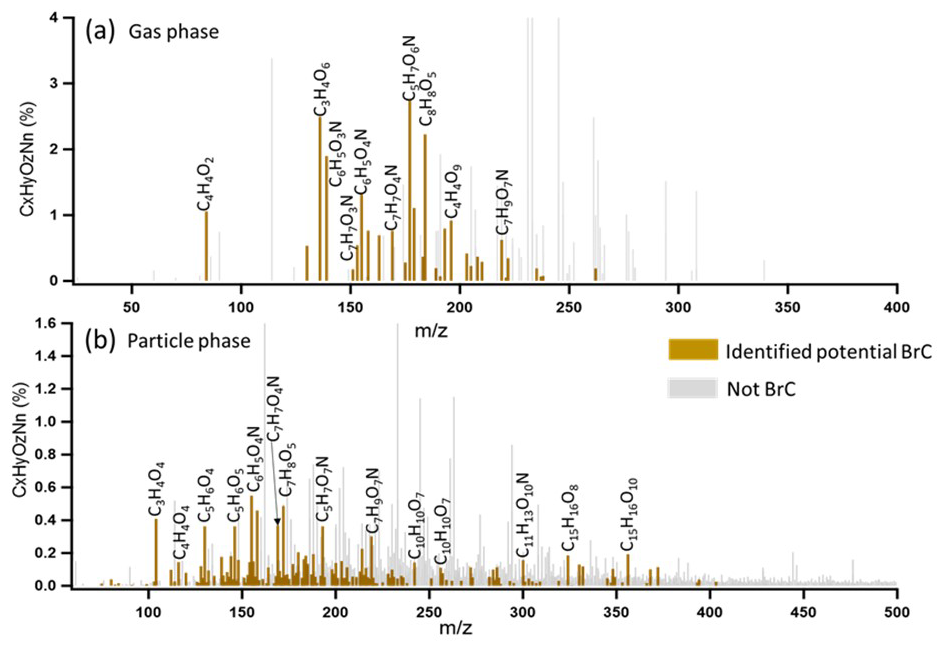
Figure 1CIMS mass spectra of organic aerosol measured by FIGAERO-CIMS for a biomass burning event on 1 March 2021: (a) the gas phase and (b) the particle phase. The CI source employs reactions of I− ions, which convert analyte molecules into ions. Legends above MS features correspond to neutral molecules. The brown peaks in mass spectra were assigned as potential BrC molecules, while the grey peaks refer to the other organic molecules.
2.4 Particle light absorption from aethalometer measurements
In the AE33 aethalometer (Magee Scientific), aerosol particles are continually sampled on a quartz filter, and the optical attenuation is measured with time resolutions of 1 min at seven wavelengths (370, 470, 520, 590, 660, 880, and 950 nm) during this campaign. The light absorption at seven wavelengths was calculated from the measured attenuation. Attenuation is measured on two spots with different sample flows and on the reference spot without sample flow. The two loading spots with different flow are used to allow for loading effect corrections (Drinovec et al., 2015). Since our aethalometer has been used with two loading spots, the loading effect was corrected by a dual-spot loading compensation algorithm (Drinovec et al., 2015). To further address the scattering effect (Yus-Díez et al., 2021), we did comparison experiments in the aerosol preparation and characterization (APC) chamber (Huang et al., 2018). Black carbon was injected into the APC chamber using the PALAS soot generator (GFG 1000, Palas) (Saathoff et al., 2003). The APC chamber was connected to a photoacoustic spectrometer (PAS) operating at three wavelengths (405, 520, and 658 nm) (Linke et al., 2016) and an aethalometer (AE33). As shown in Fig. S11, for three wavelengths (370, 520, and 660 nm), the correlation slopes were 1.88, 1.94, and 1.98, respectively. The average multiple-scattering correction factor was 1.90 ± 0.06 in this study.
The BC mass concentration is calculated from the change in optical attenuation at 880 nm in the selected time interval using the mass absorption cross section 7.77 m2 g−1 (Gundel et al., 1984), since other aerosol particles (organic aerosol or mineral) have less absorption at this wavelength and major absorption is contributed from BC alone. The attenuation mass absorption coefficients of the AE33 from 370–880 nm were 18.47, 14.54, 13.14, 11.58, 10.35, and 7.77 m2 g−1, respectively. The absorption measurements by an aethalometer have the filter-based lensing effect (Moschos et al., 2021). According to previous studies, the uncertainty from the lensing effect for BC and BrC measurement was 8 %–27 % and 6 %–20 %, respectively (Moschos et al., 2021). We assumed an AAEBC value of 1.0 in this study. However, this assumption introduces an uncertainty in the estimations of BC and BrC light absorption. According to previous studies, the AAEBC ranges between 0.8 and 1.4 (Lack and Langridge, 2013). This range, although it is maybe not fully applicable to our measurement location, potentially causes relatively large uncertainties of up to 81 % (at 370 nm) in splitting between BrC and BC absorption (Fig. S13) (Duan et al., 2024). Despite these potentially large uncertainties on absolute absorption values, we consider this method still useful. Our assumption of AAEBC = 1.0 is reasonable for our location as based on previous measurements, and it should still allow us to discuss the relative evolution of the BC and BrC absorption.
We assumed that the absorption from dust and other aerosol was negligible. Hence, the absorption was only contributed from BC and BrC. Therefore, Abs(λ) can be divided in BC and BrC absorption:
where AbsBrC(λ) is the absorption caused by BrC at the following aethalometer wavelengths: λ = 370, 470, 520, 590, or 660 nm. AbsBC(λ) is the absorption contributed by BC at the same wavelength (Wang et al., 2019a). To determine AbsBC(λ) at each wavelength, we assumed that BC was the only absorber at λ = 880 nm, and thus the AbsBC(λ) (λ = 370, 470, 520, 590, and 660) can be extrapolated from the following equation:
where AAEBC represents the spectral dependence of AbsBC(λ), and a value of 1.0 was chosen for AAEBC based on previous studies in Germany (Teich et al., 2017). Finally, one can obtain the AbsBrC(λ) as follows:
The fraction of wood burning black carbon (BCwb) was calculated using the aethalometer model (Sandradewi et al., 2008a, b):
where two pairs of Ångström exponent values were utilized to obtain BC associated with fossil fuel (BCff) and wood burning (BCwb). One of the largest sources of uncertainty in the aethalometer model is related to the section of αff and αwb values (Healy et al., 2017; Zotter et al., 2017). In addition, the αff was typically in the range of ∼ 0.8–1.2 in ambient air, whereas αwb can vary from 1.6 to 2.2 (Saarikoski et al., 2021). However, we used the αff and αwb values as 0.95 and 1.68 to calculate the BC source (Helin et al., 2018), since our measurement site is in a rural area and nearby a suburban area.
3.1 Overview of the field observations
Figures S1 and S2 give an overview of the measurement location and the meteorological parameters, traces gases, particle concentrations, and their optical properties during the campaign. The major wind directions at KIT Campus Nord, 3 km east of the village of Eggenstein-Leopoldshafen, were northeast and southwest (Fig. S1), caused by channelling of the wind in the Rhine valley. The average wind speeds were 1.1 ± 0.8 (average ± standard deviation) m s−1. Depending on meteorological conditions, local sources and regional transport had a major impact on air quality in Leopoldshafen in summer (Shen et al., 2019). As shown in Fig. S5, O3 had diurnal variations with peaks in the daytime and an average of 41.3 ± 26.2 µg m−3 during the campaign. In contrast, the relative humidity (RH) showed diurnal variations with peaks at night and an average of 68 ± 16 % during the campaign (Fig. S5). The average temperature during the winter campaign was 6.5 ± 5.6 °C and slowly increased from the beginning to the end of the campaign. NO2 had high concentrations in some periods, for example, from 20 to 23 February with 22 ± 8.6 µg m−3 and from 2 to 4 March with 35 ± 14 µg m−3. The average SO2 concentration was 0.8 ± 1.0 µg m−3, significantly lower than the NO2 concentrations. During some Saharan dust events, the PM2.5 and PM10 mass concentrations were 21 ± 6 and 45 ± 20 µg m−3, respectively, from 18 to 26 February and 19 ± 6 and 24 ± 7 µg m−3, respectively, from 1 to 4 March, as indicated by red boxes in the lowest panel of Fig. S2. In addition, BC showed many spikes and a good correlation (r = 0.8) with NO2 (Fig. S3). This indicates that there were many combustion events during the campaign (Fig. S3). The absorption Ångström exponents of particles between 370 and 520 nm (AAE370−520) and AAE660−950 had diurnal variations with peaks at night. We calculated the fraction of wood burning BC and fossil fuel BC, as shown in Fig. S3 using the aethalometer model (Sandradewi et al., 2008a). During the winter campaign, the biomass burning BC was on average 0.61 ± 0.0.49 µg m−3, mostly higher than 0.0.25 ± 0.27 µg m−3 for fossil fuel BC. The AAE370−520, AAE660−950, biomass burning BC, and NO2 values were enhanced from 20 to 23 February and 2 to 4 March. This indicates that strong biomass burning (BB) events were on these days. During this winter campaign, the BrC absorption accounted for ∼ 40 % of total absorption caused by BC and BrC at 370 nm. This points to the at least regional or seasonal importance of BrC absorption, which has an important effect on air quality and climate.
3.2 Mass concentrations and volatility of potential brown carbon molecules
Figure 2 shows an overview of levoglucosan concentrations, BC concentrations, absorption of brown carbon at 370 nm (bbrc370), AAE370−520, volatility, and mass concentrations of 178 potential brown carbon molecules identified in the particle phase and 31 potential brown carbon molecules in the gas phase during the whole winter campaign. We identified 178 potential BrC molecules according to the method developed by Lin et al. (2018) (see Sect. 2.3.). The mass of these molecules shows a good correlation (r = 0.7 ± 0.1) with the absorption at 370 nm (bBrC370) of BrC (see Fig. S6). This indicates that it is meaningful to extract these 178 potential BrC molecules from more than 1500 molecules detected by FIGAERO-CIMS based on the double bond equivalent carbon number ratio (DBE C) of each molecule being higher than 0.5 and less than 0.9. The levoglucosan showed a good correlation (r = 0.7) with BC. This is in line with the large fraction of biomass burning contributing to BC during the winter campaign. Biomass burning BC accounted for (71 ± 40) % of total BC as we discussed above. The 178 potential BrC molecules detected in the particle phase correspond to an average mass concentration of 83 ± 44 ng m−3. In addition, the nitro aromatic compounds (NACs) were also detected during the winter campaign. The mass concentrations of ∑NACs in the gas phase and particle phase were 1.9 ± 1.5 and 17.5 ± 18.4 ng m−3, respectively (Tables S4 and S5). Mohr et al. (2013) found that five BrC molecules (nitro aromatic compounds) were 20 ng m−3 detected by CIMS during winter in Detling, United Kingdom. Jiang et al. (2022) measured an average concentration of five BrC molecules (nitro aromatic compounds) of 1.6 ± 0.9 ng m−3 during the winter at a curbside in downtown Karlsruhe, a city in southwest Germany and close to our measurement site. Therefore, the detection of the 178 potential BrC molecules allows a more complete assessment of the BrC concentrations during this winter campaign. Their concentrations were significantly higher for biomass burning (BB) events e.g. 144 ± 41 ng m−3 in BB event 1 and 124 ± 39 ng m−3 in BB event 2, respectively. In addition, the absorption of brown carbon at 370 nm (bbrc370) had high peaks with ∼ 100 Mm−1, and the AAE370−520 of particles increased from ∼ 1.5 to ∼ 2 during the BB events. The average concentration of potential BrC in the gas phase was 8.5 ± 6.7 ng m−3 during the winter campaign. At BB events, their concentration can reach up to 38 ng m−3. Therefore, biomass burning had a significant impact on optical properties of aerosol and brown carbon concentrations. The lowermost panel of Fig. 2 shows the temporal variation of the average volatility of brown carbon molecules in the gas and particle phase. The average volatility or saturation concentration (log 10Csat) of potential BrC in the particle phase was −1.1 ± 0.5 µg m−3 lower than 0.9 ± 0.6 µg m−3 of potential BrC in the gas phase during the winter campaign. Organic compounds with log 10Csat lower than −4.5 µg m−3, between −4.5 and −0.5 µg m−3, between −0.5 and 2.5 µg m−3, and between 2.5 and 6.5 µg m−3 are termed extremely low volatility organic compounds (ELVOCs), low-volatility organic compounds (LVOCs), semi-volatile organic compounds (SVOCs), and intermediate-volatility organic compounds (IVOCs), respectively (Donahue et al., 2009). Therefore, BrC in the particle phase can be classified on average as LVOCs and BrC in the gas phase as SVOCs.
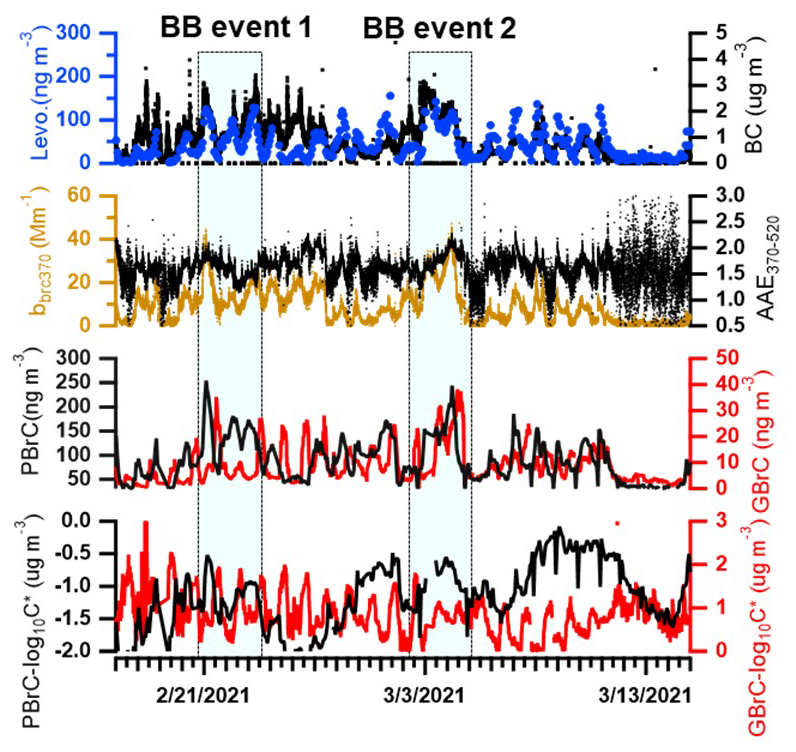
Figure 2Time series of levoglucosan (Levo.) concentrations in the particle phase from FIGAERO-CIMS, BC concentrations from the aethalometer (AE33), absorption of brown carbon at 370 nm (bbrc370), absorption Ångström exponents between 370 and 520 nm (AAE370−520), brown carbon concentrations in the particle phase (PBrC) and gas phase (GBrC), and volatility (log 10C*) of brown carbon in the particle phase (PBrC_log 10C*) and gas phase (GBrC_log 10C*) during the winter campaign.
3.3 Absorption contribution of nitro aromatic compounds
Black carbon dominated the light absorption of aerosol particles with a contribution of 100 % at 880 nm and decreasing to 73 % at 370 nm. With shorter wavelengths, the brown carbon absorption contribution significantly increased, contributing 27 % of total aerosol absorption at 370 nm (Fig. 3a). We calculated the average light absorption of seven nitro aromatic compounds (NACs) using the mass absorption coefficients (MAC365; Xie et al., 2017), given in Table S5 and the average concentrations measured. Based on this, the mean light absorption of the sum of the seven NACs was calculated to be 0.2 ± 0.2 Mm−1.The absorption of the seven NACs contributed to 2.2 ± 2.1 % of total BrC absorption at 370 nm (Fig. 3b). Palm et al. (2020) found that particulate nitroaromatic compounds (BrC molecules) can explain 29 ± 15 % of average BrC light absorption at 405 nm, despite accounting for just 4 ± 2 % of average OA mass in fresh wildfire plumes. Mohr et al. (2013) found that five nitroaromatic compounds (BrC molecules) are potentially important contributors to absorption at 370 nm measured by an aethalometer and account for 4 ± 2 % of UV light absorption by brown carbon in Detling, United Kingdom, during winter. Jiang et al. (2022) determined a mean light absorption of five nitro aromatic compounds accounting for 0.3 ± 0.1 % of methanol-soluble BrC absorption at 365 nm but only accounted for 0.03 ± 0.01 % of the organic aerosol mass. Therefore, NACs are typical brown carbon molecules with typically lower mass contributions to total organic aerosol but relatively higher contributions to the total BrC absorption.
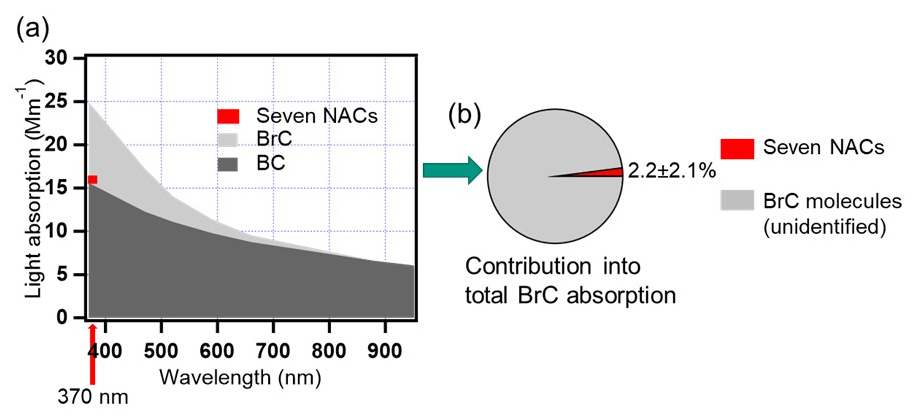
Figure 3(a) A stacked plot showing the main contributions to aerosol absorption from brown carbon and black carbon based on the seven wavelengths measured by the AE33 aethalometer. The contribution of seven NACs to the total aerosol absorption is indicated in red at 370 nm. (b) Average absorption contribution of seven NACs to total absorption by BrC. Red – seven NACs, grey – unidentified BrC molecules.
3.4 Diurnal variations and sources of potential BrC in the gas phase
As shown in Fig. 4a, the 31 gas-phase potential BrC (GBrC) molecules showed higher concentrations in the daytime (09:00–17:00 CET) and lower concentrations between evening and early morning (18:00–08:00). Salvador et al. (2021) also found that 16 gas-phase nitro-aromatic compounds (BrC molecules) measured by FIGAERO-CIMS were higher during the daytime and lower at night during winter in rural China. As discussed above, strong biomass burning emissions were mostly observed in the evening and early morning hours. However, gas-phase BrC had no peaks during those time periods. Therefore, the primary emission from biomass burning was not a major source for GBrC at KIT Campus Nord. It seems to be mainly controlled by secondary formation (e.g. photochemical smog) or/and particle-to-gas partitioning (Salvador et al., 2021).
To demonstrate how secondary formation and partitioning control the gas-phase BrC in rural Germany, we plotted diurnal profiles of the average volatility and volatility fractions of IVOCs, SVOCs, and LVOCs of the gas-phase BrC (Fig. 4b). The LVOCs of BrC increased in the evenings and decreased in the daytime. In contrast, the IVOCs of BrC increased in the daytime and reached ∼ 17 % of total log 10C* (volatility) in gas-phase BrC, while SVOCs remained with a relative constant fraction (∼ 60 %). Furthermore, the IVOC fraction of BrC in the particle phase was only 1.5 %, with a flat diurnal profile (Fig. S7). The ratio of gas-phase BrC also increased during the daytime (Fig. 4d). Therefore, the higher fraction of IVOCs in the gas phase in the daytime is most likely caused by secondary formation, e.g. photochemical conversion/ageing because of higher oxidant levels, as indicated, for example, by a higher concentration of ozone at the same time (Fig. 4c) (Saarikoski et al., 2021). Figure S8 shows that BrC in the gas phase had a moderate positive correlation (r = 0.4) with temperature. This explains why the temperature shows a similar diurnal profile to the gas-phase BrC. Therefore, particle-to-gas partitioning was also an important source for gas-phase BrC. However, our results are not consistent with previous studies, where 16 BrC molecules in the gas phase were mainly from primary emission during the biomass burning evenings and secondary formation during the clear days in rural China (Salvador et al., 2021). Our measurement site was several kilometres away from biomass burning sites with ∼ 7–10 km. And the 31 potential BrC molecules in the gas phase sum up to 8.5 ± 6.7 ng m−3, significantly lower than 1720 ng m−3 of 16 BrC molecules (Salvador et al., 2021). Cheng et al. (2021) found that secondary formation was a strong source for five BrC molecules in the gas phase. Therefore, BrC in the gas phase is less influenced by primary emissions from biomass burning but mainly controlled by secondary formation and partitioning in rural Germany.
3.5 Diurnal variations and sources of potential BrC in the particle phase
The 178 potential BrC molecules in the particle phase (PBrC) exhibited two peaks in the diurnal profile (Fig. 4a) averaged over the whole winter campaign. They increased from 19:00 to 01:00, with a peak at 82 ± 35 ng m−3 around midnight. Then, the PBrC slowly decreased after midnight. However, they increased again from 06:00 to 08:00, forming a second peak at 102 ± 49 ng m−3 in the morning. During the daytime, they decreased, reaching the lowest values of 61 ± 31 ng m−3 at 14:00–15:00. During the nighttime and morning hours, the higher mass concentrations of PBrC were caused by residential wood burning emissions. Consistently, higher PM2.5 concentration levels at night at a rural site near Karlsruhe, Germany, could be assigned to wood burning emissions from wood stove operation during winter (Thieringer et al., 2022). The low mass concentrations of PBrC in the daytime could be explained by photobleaching and evaporation of BrC and/or dilution by the increasing planetary boundary layer heights (Satish et al., 2017). Satish et al. (2017) found that BrC over the Indo-Gangetic Plain had two peaks of BrC in the evening and morning hours and the lowest values during the daytime.
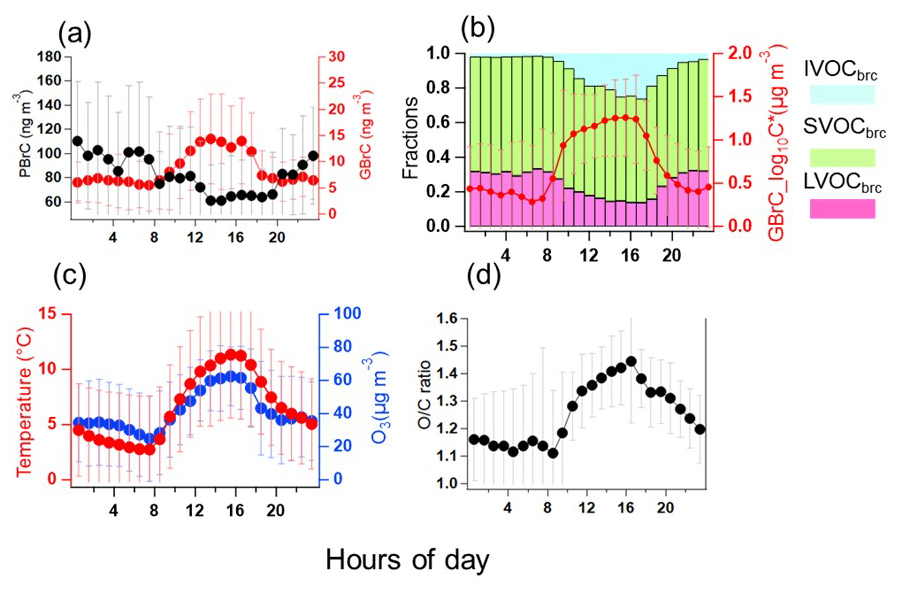
Figure 4Diurnal profiles averaged over the whole winter campaign of (a) BrC in the particle (PBrC) and gas phase (GBrC); (b) BrC volatility fractions in LVOCbrc, SVOCbrc, IVOCbrc, and mean BrC volatility in the gas phase (red line); (c) temperature and ozone concentration; and (d) ratio of the oxidized organic components in the gas phase.
To determine the sources of brown carbon, we used the edge approach (Day et al., 2015). It allows us to estimate the contribution of primary biomass burning (BB) to the measured BrC concentrations using levoglucosan as a primary source tracer. This approach is analogous to the widely used elemental carbon (EC) tracer approach, in which EC is used to distinguish the primary organic carbon (POC) and secondary organic carbon (SOC) in total organic carbon (OC) measurements (Day et al., 2015; Cabada et al., 2004). Levoglucosan (Levo.) and potential BrC were measured online by the same instruments and under the same conditions. As discussed above, we observed a good correlation (r = 0.8) between levoglucosan and BC during the winter campaign. Therefore, levoglucosan is a suitable tracer for primary BB. Please note that we did not calibrate the sensitivities of levoglucosan detected by FIGAERO-CIMS. Therefore, it could cause some uncertainties to estimate brown carbon from biomass burning and secondary formation. Figure 5a shows that the blue points can be used as edge points to determine the ratio of BrC / levoglucosan in the primary emissions from biomass burning. The relative contributions of primary emissions (BB) and secondary (sec) formation of total BrC molecules were estimated using the following expression:
where is the ratio of the concentration of the BrC to that of levoglucosan in the primary emissions from biomass burning, and this value is 1.1 ± 0.1 (Fig. 5a). BrCBB and BrCsec are the fractions of BrC generated through biomass burning and secondary production, respectively. BrCTot and Levo. are the measured concentrations of BrC and levoglucosan during the winter campaign. Using this approach, we calculated the diurnal profiles of BrC from primary emissions (BrCBB) and secondary formation (BrCsec) shown in Fig. 5b. The uncertainty of the splitting between BrC from biomass burning and of secondary origin is mainly based on the levoglucosan concentration for which we have included the calibration. Based on this we estimated the uncertainty of the BrC source splitting to ± 35 %. The mass fraction of BrCsec increased in the daytime and decreased in the evening. This indicates that the secondary formation of BrC in the particle phase was enhanced during the daytime, facilitated by the higher levels of oxidants, e.g. O3 (Fig. 4c). The mass fraction of BrCBB had two peaks in the early morning and in the evening hours, respectively. This may be caused by residential wood burning emissions. BrCBB accounts for 39 ± 21 % of the total BrC, as averaged for the whole measurement period. During biomass burning events, the BrCBB is a major mass fraction of total BrC that accounts for 61 ± 13 % during BB event 1 and 65 ± 12 % during BB event 2, respectively. Therefore, the primary emissions of BrC have a significant impact on BrC, especially in biomass burning events. However, on average over the whole campaign, BrCsec dominates the mass fraction of BrC with 61 ± 21 %. Therefore, secondary formation can be considered an important source of BrC in rural Germany. Consistently, secondary formation from biomass burning emission is important for the brown carbon absorption in the Switzerland, central Europe (Moschos et al., 2018). Secondary sources of BrC were more important for absorption than primary ones in the southeastern margin of the Tibetan Plateau (Wang et al., 2019b).
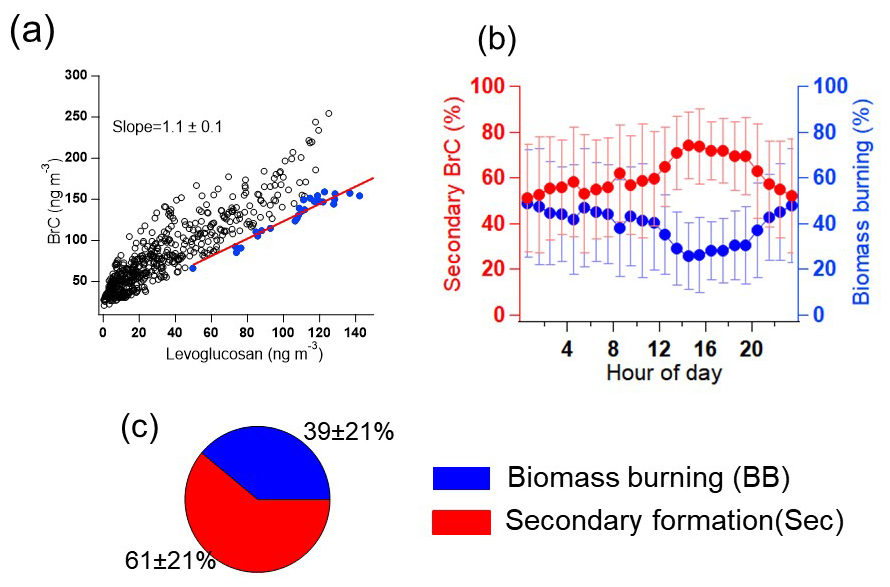
Figure 5(a) Correlation analysis of BrC and levoglucosan in the particle phase for the analysis of the contribution of biomass burning using the edge method (Day et al., 2015). Blue points are the data used to determine . (b) Diurnal profile of secondary-formed BrC and biomass burning BrC for the whole measurement campaign. (c) Average mass fractions of secondary-formed BrC and biomass burning primary BrC for the whole campaign.
To further investigate the oxidation of BrC in the particle phase we plotted, the diurnal profiles of ratios of BrC during the whole campaign was measured, as shown in Fig. 6. The ratio of the potential BrC molecules increased during the daytime and decreased at night. This is an indication for an impact of photo-oxidation on BrC either during formation or ageing, leading to an increase in its ratio. Consequently, the ratio of the potential BrC molecules shows a positive correlation (r = 0.8) with ozone, another product of photochemistry. In contrast, the light absorption of BrC at 370 nm (bbrc370) and the double bond equivalent (DBE) decreased in the daytime and increased at night. During the daytime, the absorption of brown carbon at 370 nm decreased due to a lower DBE and higher values of brown carbon caused by photooxidation. This is in accordance with previous studies where atmospheric photooxidation diminishes the light absorption of primary brown carbon aerosol from biomass burning (Sumlin et al., 2017). Oxidative whitening can reduce light absorption of brown carbon during the day (Hems et al., 2021).
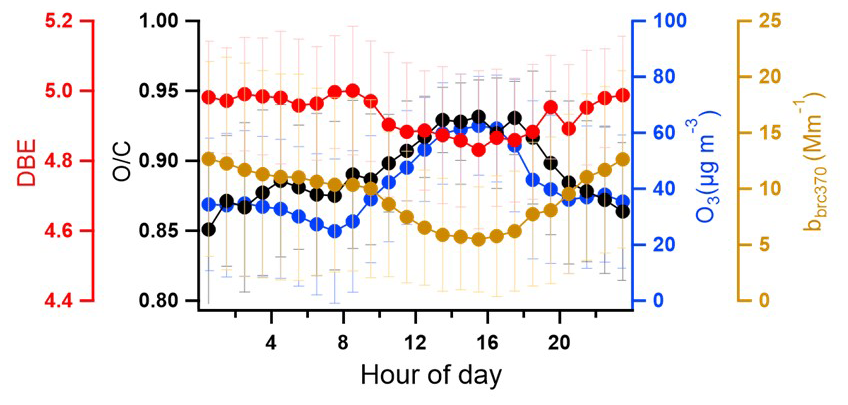
Figure 6The diurnal profile of the DBE (double bond equivalent), ratio of BrC, O3, and bbrc370 (absorption of BrC at 370 nm) during the whole measured period.
The chemical composition, diurnal variation, and sources of brown carbon aerosol were investigated during February–March 2021 in a rural area, at KIT Campus Nord, a location characteristic of central Europe. The 178 potential brown carbon molecules (including 7 nitro aromatic compounds, NACs) identified in the particle phase contributed on average 83 ± 44 ng m−3, and 31 potential brown carbon molecules (including 4 NACs) identified in the gas phase contributed on average 8.5 ± 6.7 ng m−3 during the whole campaign. During dedicated biomass burning events, potential BrC concentrations in the particle phase were significantly higher with up to ∼ 254 ng m−3. The average light absorption of seven NACs in the particle phase was 0.2 ± 0.2 Mm−1, contributing to 2.2 ± 2.1 % of total BrC absorption at 370 nm. This shows that NACs are important molecules for brown carbon. This indicates the great importance of identifying these molecules, the strong absorbers, to predict aerosol absorption.
Diurnal variations show that the particle-phase potential BrC had two peaks in the early morning and evening hours, respectively. These were mainly caused by residential wood burning emissions. In contrast, the gas-phase potential BrC showed higher concentrations in the daytime and lower concentrations at night. The gas-phase BrC molecules were mainly controlled by secondary formation (e.g. by photochemical processes) and particle-to-gas partitioning. The two main sources that contributed to particle-phase BrC were primary emission from biomass burning and secondary formation. Secondary formation, e.g. by photooxidation, is an important source of particle-phase BrC corresponding to increasing ratios of BrC during the daytime and a positive correlation (r = 0.8) with ozone concentrations. In addition, the DBE of the particle phase decreased during the daytime. This indicates that the absorption of brown carbon at 370 nm decreased due to a lower DBE and a higher ratio due to the photooxidation of brown carbon. Compared with previous measurements in central Europe (Lukács et al., 2007; Zhang et al., 2020), our study found that secondary formation, e.g. photochemical processes, was an important source for BrC in gas and particle phases. To improve air quality in winter, we need to reduce biomass burning emissions (e.g. regulate wood stoves) but also reduce the precursors to form secondary aerosol. Overall, this study provides good insight into the light absorption, sources, and diurnal variation from real-time observations of brown carbon molecules in central Europe using a mass spectrometer and an aethalometer.
The data related to this article are accessible at KITopen (https://doi.org/10.35097/d0prpzkxqkq2t09y, Jiang et al., 2024a).
The supplement related to this article is available online at https://doi.org/10.5194/acp-25-1917-2025-supplement.
FJ and HS designed the measurement campaign. FJ, LG, JS, and HS performed the experimental work. FJ did FIGAERO-CIMS and AE33 data analysis. HS and HZ processed the trace gas and meteorological data, respectively. UE did CIMS sensitivity calibrations. TL gave general comments for this paper. FJ wrote the paper with contributions from all co-authors.
At least one of the (co-)authors is a member of the editorial board of Atmospheric Chemistry and Physics. The peer-review process was guided by an independent editor, and the authors also have no other competing interests to declare.
Publisher’s note: Copernicus Publications remains neutral with regard to jurisdictional claims made in the text, published maps, institutional affiliations, or any other geographical representation in this paper. While Copernicus Publications makes every effort to include appropriate place names, the final responsibility lies with the authors.
The authors gratefully thank the staff of IMK-AAF for providing substantial technical support during the field campaigns under COVID conditions. Furthermore, Feng Jiang and Junwei Song are thankful for the support from the China Scholarship Council (CSC).
The article processing charges for this open-access publication were covered by the Karlsruhe Institute of Technology (KIT).
This paper was edited by Jason Surratt and reviewed by two anonymous referees.
Andreae, M. O. and Gelencsér, A.: Black carbon or brown carbon? The nature of light-absorbing carbonaceous aerosols, Atmos. Chem. Phys., 6, 3131–3148, https://doi.org/10.5194/acp-6-3131-2006, 2006.
Cabada, J. C., Pandis, S. N., Subramanian, R., Robinson, A. L., Polidori, A., and Turpin, B.: Estimating the secondary organic aerosol contribution to PM2.5 using the EC tracer method, Aerosol Sci. Tech., 38, 140–155, https://doi.org/10.1080/02786820390229084, 2004.
Chen, Q. C., Chen, Q., Hua, X. Y., Guan, D. J., and Chang, T.: Gas-phase brown carbon: Absorbance and chromophore types, Atmos. Environ., 264, 118646, https://doi.org/10.1016/j.atmosenv.2021.118646, 2021.
Cheng, X., Chen, Q., Li, Y., Huang, G., Liu, Y., Lu, S., Zheng, Y., Qiu, W., Lu, K., Qiu, X., Bianchi, F., Yan, C., Yuan, B., Shao, M., Wang, Z., Canagaratna, M. R., Zhu, T., Wu, Y., and Zeng, L.: Secondary Production of Gaseous Nitrated Phenols in Polluted Urban Environments, Environ. Sci. Technol., 55, 4410–4419, https://doi.org/10.1021/acs.est.0c07988, 2021.
Daumit, K. E., Kessler, S. H., and Kroll, J. H.: Average chemical properties and potential formation pathways of highly oxidized organic aerosol, Faraday Discuss., 165, 181–202, https://doi.org/10.1039/c3fd00045a, 2013.
Day, M. C., Zhang, M. H., and Pandis, S. N.: Evaluation of the ability of the EC tracer method to estimate secondary organic carbon, Atmos. Environ., 112, 317–325, https://doi.org/10.1016/j.atmosenv.2015.04.044, 2015.
Donahue, N. M., Robinson, A. L., and Pandis, S. N.: Atmospheric organic particulate matter: From smoke to secondary organic aerosol, Atmos. Environ., 43, 94–106, https://doi.org/10.1016/j.atmosenv.2008.09.055, 2009.
Drinovec, L., Močnik, G., Zotter, P., Prévôt, A. S. H., Ruckstuhl, C., Coz, E., Rupakheti, M., Sciare, J., Müller, T., Wiedensohler, A., and Hansen, A. D. A.: The ”dual-spot” Aethalometer: an improved measurement of aerosol black carbon with real-time loading compensation, Atmos. Meas. Tech., 8, 1965–1979, https://doi.org/10.5194/amt-8-1965-2015, 2015.
Duan, J., Huang, R. J., Lin, C. S., Shen, J. C., Yang, L., Yuan, W., Wang, Y., Liu, Y., and Xu, W.: Aromatic Nitration Enhances Absorption of Biomass Burning Brown Carbon in an Oxidizing Urban Environment, Environ. Sci. Technol., 58, 17344–17354, https://doi.org/10.1021/acs.est.4c05558, 2024.
Gundel, L. A., Dod, R. L., Rosen, H., and Novakov, T.: The relationship between optical attenuation and black carbon concentration for ambient and source particles, Sci. Total Environ., 36, 197–202, https://doi.org/10.1016/0048-9697(84)90266-3, 1984.
Healy, R. M., Sofowote, U., Su, Y., Debosz, J., Noble, M., Jeong, C. H., Wang, J. M., Hilker, N., Evans, G. J., Doerksen, G., Jones, K., and Munoz, A.: Ambient measurements and source apportionment of fossil fuel and biomass burning black carbon in Ontario, Atmos. Environ., 161, 34—47, https://doi.org/10.1016/j.atmosenv.2017.04.034, 2017.
Helin, A., Niemi, J. V., Virkkula, A., Pirjola, L., Teinilä, K., Backman, J., Aurela, M., Saarikoski, S., Rönkkö, T., Asmi, E., and Timonen, H.: Characteristics and source apportionment of black carbon in the Helsinki metropolitan area, Finland, Atmos. Environ., 190, 87–98, https://doi.org/10.1016/j.atmosenv.2018.07.022, 2018.
Hems, R. F., Schnitzler, E. G., Liu-Kang, C., Cappa, C. D., and Abbatt, J. P. D.: Aging of Atmospheric Brown Carbon Aerosol, ACS Earth Space Chem., 5, 722–748, https://doi.org/10.1021/acsearthspacechem.0c00346, 2021.
Huang, R.-J., Yang, L., Cao, J., Chen, Y., Chen, Q., Li, Y., Duan, J., Zhu, C., Dai, W., Wang, K., Lin, C., Ni, H., Corbin, J. C., Wu, Y., Zhang, R., Tie, X., Hoffmann, T., O'Dowd, C., and Dusek, U.: Brown Carbon Aerosol in Urban Xi'an, Northwest China: The Composition and Light Absorption Properties, Environ. Sci. Technol., 52, 6825–6833, https://doi.org/10.1021/acs.est.8b02386, 2018.
Huang, W., Saathoff, H., Pajunoja, A., Shen, X., Naumann, K.-H., Wagner, R., Virtanen, A., Leisner, T., and Mohr, C.: α-Pinene secondary organic aerosol at low temperature: chemical composition and implications for particle viscosity, Atmos. Chem. Phys., 18, 2883–2898, https://doi.org/10.5194/acp-18-2883-2018, 2018.
Huang, W., Saathoff, H., Shen, X., Ramisetty, R., Leisner, T., and Mohr, C.: Chemical Characterization of Highly Functionalized Organonitrates Contributing to Night-Time Organic Aerosol Mass Loadings and Particle Growth, Environ. Sci. Technol., 53, 1165–1174, https://doi.org/10.1021/acs.est.8b05826, 2019.
Jiang, F., Song, J., Bauer, J., Gao, L., Vallon, M., Gebhardt, R., Leisner, T., Norra, S., and Saathoff, H.: Chromophores and chemical composition of brown carbon characterized at an urban kerbside by excitation–emission spectroscopy and mass spectrometry, Atmos. Chem. Phys., 22, 14971–14986, https://doi.org/10.5194/acp-22-14971-2022, 2022.
Jiang, F., Saathoff, H., Ezenobi, U., Song, J., Zhang, H., Gao, L., and Leisner, T.: Dataset for the publication: Brown carbon aerosol in rural Germany: sources, chemistry, and diurnal variations, Karlsruhe Institute of Technology [data set], https://doi.org/10.35097/d0prpzkxqkq2t09y, 2024a.
Jiang, F., Siemens, K., Linke, C., Li, Y., Gong, Y., Leisner, T., Laskin, A., and Saathoff, H.: Molecular analysis of secondary organic aerosol and brown carbon from the oxidation of indole, Atmos. Chem. Phys., 24, 2639–2649, https://doi.org/10.5194/acp-24-2639-2024, 2024b.
Lack, D. A. and Langridge, J. M.: On the attribution of black and brown carbon light absorption using the Ångström exponent, Atmos. Chem. Phys., 13, 10535–10543, https://doi.org/10.5194/acp-13-10535-2013, 2013.
Laskin, A., Laskin, J., and Nizkorodov, S. A.: Chemistry of Atmospheric Brown Carbon, Chem. Rev., 115, 4335–4382, https://doi.org/10.1021/cr5006167, 2015.
Lee, B. H., Lopez-Hilfiker, F. D., D'Ambro, E. L., Zhou, P., Boy, M., Petäjä, T., Hao, L., Virtanen, A., and Thornton, J. A.: Semi-volatile and highly oxygenated gaseous and particulate organic compounds observed above a boreal forest canopy, Atmos. Chem. Phys., 18, 11547–11562, https://doi.org/10.5194/acp-18-11547-2018, 2018.
Lin, P., Liu, J., Shilling, J. E., Kathmann, S. M., Laskin, J., and Laskin, A.: Molecular characterization of brown carbon (BrC) chromophores in secondary organic aerosol generated from photo-oxidation of toluene, Phys. Chem. Chem. Phys., 17, 23312–23325, https://doi.org/10.1039/c5cp02563j, 2015.
Lin, P., Aiona, P. K., Li, Y., Shiraiwa, M., Laskin, J., Nizkorodov, S. A., and Laskin, A.: Molecular Characterization of Brown Carbon in Biomass Burning Aerosol Particles, Environ. Sci. Technol., 50, 11815–11824, https://doi.org/10.1021/acs.est.6b03024, 2016.
Lin, P., Fleming, L. T., Nizkorodov, S. A., Laskin, J., and Laskin, A.: Comprehensive Molecular Characterization of Atmospheric Brown Carbon by High Resolution Mass Spectrometry with Electrospray and Atmospheric Pressure Photoionization, Anal. Chem., 90, 12493–12502, https://doi.org/10.1021/acs.analchem.8b02177, 2018.
Linke, C., Ibrahim, I., Schleicher, N., Hitzenberger, R., Andreae, M. O., Leisner, T., and Schnaiter, M.: A novel single-cavity three-wavelength photoacoustic spectrometer for atmospheric aerosol research, Atmos. Meas. Tech., 9, 5331–5346, https://doi.org/10.5194/amt-9-5331-2016, 2016.
Liu, X., Wang, H., Wang, F., Lv, S., Wu, C., Zhao, Y., Zhang, S., Liu, S., Xu, X., Lei, Y., and Wang, G.: Secondary Formation of Atmospheric Brown Carbon in China Haze: Implication for an Enhancing Role of Ammonia, Environ. Sci. Technol., 57, 11163–11172, https://doi.org/10.1021/acs.est.3c03948, 2023.
Lukács, H., Gelencsér, A., Hammer, S., Puxbaum, H., Pio, C., Legrand, M., Kasper-Giebl, A., Handler, M., Limbeck, A., Simpson, D., and Preunkert, S.: Seasonal trends and possible sources of brown carbon based on 2-year aerosol measurements at six sites in Europe, J. Geophys. Res., 112, D23S18, https://doi.org/10.1029/2006JD008151, 2007.
Lopez-Hilfiker, F. D., Mohr, C., Ehn, M., Rubach, F., Kleist, E., Wildt, J., Mentel, Th. F., Lutz, A., Hallquist, M., Worsnop, D., and Thornton, J. A.: A novel method for online analysis of gas and particle composition: description and evaluation of a Filter Inlet for Gases and AEROsols (FIGAERO), Atmos. Meas. Tech., 7, 983–1001, https://doi.org/10.5194/amt-7-983-2014, 2014.
Lopez-Hilfiker, F. D., Iyer, S., Mohr, C., Lee, B. H., D'Ambro, E. L., Kurtén, T., and Thornton, J. A.: Constraining the sensitivity of iodide adduct chemical ionization mass spectrometry to multifunctional organic molecules using the collision limit and thermodynamic stability of iodide ion adducts, Atmos. Meas. Tech., 9, 1505–1512, https://doi.org/10.5194/amt-9-1505-2016, 2016.
Mohr, C., Lopez-Hilfiker, F. D., Zotter, P., Prevot, A. S. H., Xu, L., Ng, N. L., Herndon, S. C., Williams, L. R., Franklin, J. P., Zahniser, M. S., Worsnop, D. R., Knighton, W. B., Aiken, A. C., Gorkowski, K. J., Dubey, M. K., Allan, J. D., and Thornton, J. A.: Contribution of Nitrated Phenols to Wood Burning Brown Carbon Light Absorption in Detling, United Kingdom during Winter Time, Environ. Sci. Technol., 47, 6316–6324, https://doi.org/10.1021/es400683v, 2013.
Moise, T., Flores, J. M., and Rudich, Y.: Optical Properties of Secondary Organic Aerosols and Their Changes by Chemical Processes, Chem. Rev., 115, 4400–4439, https://doi.org/10.1021/cr5005259, 2015.
Montoya-Aguilera, J., Horne, J. R., Hinks, M. L., Fleming, L. T., Perraud, V., Lin, P., Laskin, A., Laskin, J., Dabdub, D., and Nizkorodov, S. A.: Secondary organic aerosol from atmospheric photooxidation of indole, Atmos. Chem. Phys., 17, 11605–11621, https://doi.org/10.5194/acp-17-11605-2017, 2017.
Moschos, V., Kumar, N. K., Daellenbach, K. R., Baltensperger, U., Prevot, A. S. H., and El Haddad, I.: Source Apportionment of Brown Carbon Absorption by Coupling Ultraviolet-Visible Spectroscopy with Aerosol Mass Spectrometry, Environ. Sci. Tech. Let., 5, 302–308, https://doi.org/10.1021/acs.estlett.8b00118, 2018.
Moschos, V., Gysel-Beer, M., Modini, R. L., Corbin, J. C., Massabò, D., Costa, C., Danelli, S. G., Vlachou, A., Daellenbach, K. R., Szidat, S., Prati, P., Prévôt, A. S. H., Baltensperger, U., and El Haddad, I.: Source-specific light absorption by carbonaceous components in the complex aerosol matrix from yearly filter-based measurements, Atmos. Chem. Phys., 21, 12809–12833, https://doi.org/10.5194/acp-21-12809-2021, 2021.
Palm, B. B., Peng, Q. Y., Fredrickson, C. D., Lee, B., Garofalo, L. A., Pothier, M. A., Kreidenweis, S. M., Farmer, D. K., Pokhrel, R. P., Shen, Y. J., Murphy, S. M., Permar, W., Hu, L., Campos, T. L., Hall, S. R., Ullmann, K., Zhang, X., Flocke, F., Fischer, E. V., and Thornton, J. A.: Quantification of organic aerosol and brown carbon evolution in fresh wildfire plumes, P. Natl. Acad. Sci. USA., 117, 29469–29477, https://doi.org/10.1073/pnas.2012218117, 2020.
Park, R. J., Kim, M. J., Jeong, J. I., Youn, D., and Kim, S.: A contribution of brown carbon aerosol to the aerosol light absorption and its radiative forcing in East Asia, Atmos. Environ., 44, 1414–1421, https://doi.org/10.1016/j.atmosenv.2010.01.042, 2010.
Saarikoski, S., Niemi, J. V., Aurela, M., Pirjola, L., Kousa, A., Rönkkö, T., and Timonen, H.: Sources of black carbon at residential and traffic environments obtained by two source apportionment methods, Atmos. Chem. Phys., 21, 14851–14869, https://doi.org/10.5194/acp-21-14851-2021, 2021.
Saathoff, H., Naumann, K. H., Schnaiter, M., Schöck, W., Möhler, O., Schurath, U., Weingartner, E., Gysel, M., and Baltensperger, U.: Coating of soot and (NH4)2SO4 particles by ozonolysis products of α-pinene, J. Aerosol Sci., 34, 1297–321, https://doi.org/10.1016/S0021-8502(03)00364-1, 2003.
Salvador, C. M. G., Tang, R., Priestley, M., Li, L., Tsiligiannis, E., Le Breton, M., Zhu, W., Zeng, L., Wang, H., Yu, Y., Hu, M., Guo, S., and Hallquist, M.: Ambient nitro-aromatic compounds – biomass burning versus secondary formation in rural China, Atmos. Chem. Phys., 21, 1389–1406, https://doi.org/10.5194/acp-21-1389-2021, 2021.
Sandradewi, J., Prévôt, A. S. H., Szidat, S., Perron, N., Alfarra, M. R., Lanz, V. A., Weingartner, E., and Baltensperger, U.: Using aerosol light absorption measurements for the quantitative determination of wood burning and traffic emission contributions to particulate matter, Environ. Sci. Technol., 42, 3316–3323, https://doi.org/10.1021/es702253m, 2008a.
Sandradewi, J., Prévôt, A. S. H., Weingartner, E., Schmidhauser, R., Gysel, M., and Baltensperger, U.: A study of wood burning and traffic aerosols in an Alpine valley using a multi-wavelength Aethalometer, Atmos. Environ., 42, 101–112, https://doi.org/10.1016/j.atmosenv.2007.09.034, 2008b.
Satish, R., Shamjad, P., Thamban, N., Tripathi, S., and Rastogi, N.: Temporal Characteristics of Brown Carbon over the Central Indo-Gangetic Plain, Environ. Sci. Technol., 51, 6765–6772, https://doi.org/10.1021/acs.est.7b00734, 2017.
Shen, X., Vogel, H., Vogel, B., Huang, W., Mohr, C., Ramisetty, R., Leisner, T., Prévôt, A. S. H., and Saathoff, H.: Composition and origin of PM2.5 aerosol particles in the upper Rhine valley in summer, Atmos. Chem. Phys., 19, 13189–13208, https://doi.org/10.5194/acp-19-13189-2019, 2019.
Siemens, K., Morales, A., He, Q., Li, C., Hettiyadura, A. P. S., Rudich, Y., and Laskin, A.: Molecular Analysis of Secondary Brown Carbon Produced from the Photooxidation of Naphthalene, Environ. Sci. Technol., 56, 3340–3353, https://doi.org/10.1021/acs.est.1c03135, 2022.
Sumlin, B. J., Pandey, A., Walker, M. J., Pattison, R. S., Williams, B. J., and Chakrabarty, R. K.: Atmospheric Photooxidation Diminishes Light Absorption by Primary Brown Carbon Aerosol from Biomass Burning, Environ. Sci. Technol. Let., 4, 540–545, https://doi.org/10.1021/acs.estlett.7b00393, 2017.
Tang, J., Li, J., Su, T., Han, Y., Mo, Y., Jiang, H., Cui, M., Jiang, B., Chen, Y., Tang, J., Song, J., Peng, P., and Zhang, G.: Molecular compositions and optical properties of dissolved brown carbon in biomass burning, coal combustion, and vehicle emission aerosols illuminated by excitation–emission matrix spectroscopy and Fourier transform ion cyclotron resonance mass spectrometry analysis, Atmos. Chem. Phys., 20, 2513–2532, https://doi.org/10.5194/acp-20-2513-2020, 2020.
Teich, M., van Pinxteren, D., Kecorius, S., Wang, Z. B., and Herrmann, H.: First Quantification of Imidazoles in Ambient Aerosol Particles: Potential Photosensitizers, Brown Carbon Constituents, and Hazardous Components, Environ. Sci. Technol., 50, 1166–1173, https://doi.org/10.1021/acs.est.5b05474, 2016.
Teich, M., van Pinxteren, D., Wang, M., Kecorius, S., Wang, Z., Müller, T., Močnik, G., and Herrmann, H.: Contributions of nitrated aromatic compounds to the light absorption of water-soluble and particulate brown carbon in different atmospheric environments in Germany and China, Atmos. Chem. Phys., 17, 1653–1672, https://doi.org/10.5194/acp-17-1653-2017, 2017.
Thieringer, J. R. D., Szabadi, J., Meyer, J., and Dittler, A.: Impact of Residential Real-World Wood Stove Operation on Air Quality concerning PM2.5 Immission, Processes, 10, 545, https://doi.org/10.3390/pr10030545, 2022.
Wang, Q., Ye, J., Wang, Y., Zhang, T., Ran, W., Wu, Y., Tian, J., Li, L., Zhou, Y., Hang Ho, S. S., Dang, B., Zhang, Q., Zhang, R., Chen, Y., Zhu, C., and Cao, J.: Wintertime Optical Properties of Primary and Secondary Brown Carbon at a Regional Site in the North China Plain, Environ. Sci. Technol., 53, 12389–12397, https://doi.org/10.1021/acs.est.9b03406, 2019a.
Wang, Q., Han, Y. M., Ye, J. H., Liu, S. X., Pongpiachan, S., Zhang, N. N., Han, Y. M., Tian, J., Wu, C., Long, X., Zhang, Q., Zhang, W. Y., Zhao, Z. Z., and Cao, J. J.: High Contribution of Secondary Brown Carbon to Aerosol Light Absorption in the Southeastern Margin of Tibetan Plateau, Geophys. Res. Lett., 46, 4962–4970, https://doi.org/10.1029/2019GL082731, 2019b.
Wu, G., Wan, X., Gao, S., Fu, P., Yin, Y., Li, G., Zhang, G., Kang, S., Ram, K., and Cong, Z.: Humic-like substances (HULIS) in aerosols of central Tibetan Plateau (Nam Co, 4730 m asl): Abundance, light absorption properties and sources, Environ. Sci. Technol., 52, 7203–7211, https://doi.org/10.1021/acs.est.8b01251, 2018.
Xie, M., Chen, X., Hays, M. D., Lewandowski, M., Offenberg, J., Kleindienst, T. E., and Holder, A. L.: Light Absorption of Secondary Organic Aerosol: Composition and Contribution of Nitroaromatic Compounds, Environ. Sci. Technol., 51, 11607–11616, https://doi.org/10.1021/acs.est.7b03263, 2017.
Xu, J. Z., Hettiyadura, A. P. S., Liu, Y. M., Zhang, X. H., Kang, S. C., and Laskin, A.: Regional Differences of Chemical Composition and Optical Properties of Aerosols in the Tibetan Plateau, J. Geophys. Res.-Atmos., 125, e2019JD031226, https://doi.org/10.1029/2019jd031226, 2020.
Yang, Z., Tsona, N. T., George, C., and Du, L.: Nitrogen-Containing Compounds Enhance Light Absorption of Aromatic-Derived Brown Carbon, Environ. Sci. Technol., 56, 4005–4016, https://doi.org/10.1021/acs.est.1c08794, 2022.
Yus-Díez, J., Bernardoni, V., Močnik, G., Alastuey, A., Ciniglia, D., Ivančič, M., Querol, X., Perez, N., Reche, C., Rigler, M., Vecchi, R., Valentini, S., and Pandolfi, M.: Determination of the multiple-scattering correction factor and its cross-sensitivity to scattering and wavelength dependence for different AE33 Aethalometer filter tapes: a multi-instrumental approach, Atmos. Meas. Tech., 14, 6335–6355, https://doi.org/10.5194/amt-14-6335-2021, 2021.
Zeng, L. H., Zhang, A. X., Wang, Y. H., Wagner, N. L., Katich, J. M., Schwarz, J. P., Schill, G. P., Brock, C., Froyd, K. D., Murphy, D. M., Williamson, C. J., Kupc, A., Scheuer, E., Dibb, J., and Weber, R. J.: Global Measurements of Brown Carbon and Estimated Direct Radiative Effects, Geophys. Res. Lett., 47, e2020GL088747, https://doi.org/10.1029/2020gl088747, 2020.
Zhang, Y., Albinet, A., Petit, J.-E., Jacob, V., Chevrier, F., Gille, G., Pontet, S., Chrétien, E., Dominik-Sègue, M., Levigoureux, G., Močnik, G., Gros, V., Jaffrezo, J.-L., and Favez, O.: Substantial brown carbon emissions from wintertime residential wood burning over France, Sci. Total Environ., 743, 140752, https://doi.org/10.1016/j.scitotenv.2020.140752, 2020.
Zotter, P., Herich, H., Gysel, M., El-Haddad, I., Zhang, Y., Močnik, G., Hüglin, C., Baltensperger, U., Szidat, S., and Prévôt, A. S. H.: Evaluation of the absorption Ångström exponents for traffic and wood burning in the Aethalometer-based source apportionment using radiocarbon measurements of ambient aerosol, Atmos. Chem. Phys., 17, 4229–4249, https://doi.org/10.5194/acp-17-4229-2017, 2017.