the Creative Commons Attribution 4.0 License.
the Creative Commons Attribution 4.0 License.
Can pollen affect precipitation?
Juha Tonttila
Xiaoxia Shang
Sami Romakkaniemi
Tomi Raatikainen
Large primary bioparticles such as pollen can be abundant in the atmosphere; for example near-surface pollen concentrations above 10 000 particles per cubic metre can occur during intense pollination periods. On one hand, due to their large size (10–100 µm), pollen can act as giant cloud condensation nuclei and enhance the collision–coalescence process in clouds that leads to drizzle formation. On the other hand, in humid conditions pollen is known to rupture and release many fine particles that can increase the cloud stability by reducing the droplet size. Additionally, both whole pollen grains and the sub-pollen particles released by pollen rupture are known to act as ice-nucleating particles (INPs). Due to these complex interactions, the role of pollen in modulating the cloud cover and precipitation remains uncertain.
We used the UCLALES-SALSA (UCLA Large-Eddy Simulation Code and Sectional Aerosol module for Large-Scale Applications) large eddy simulator for simulating birch pollen effects on liquid- and mixed-phase clouds. Our simulations show that the pollen concentrations observed during the most intense pollination seasons can locally enhance precipitation from both liquid- and mixed-phase clouds, while more commonly encountered pollen concentrations are unlikely to cause a noticeable change. The liquid precipitation enhancement depended linearly on the emitted pollen flux in both liquid- and mixed-phase clouds; however, the slope of this relationship was case-dependent. Ice nucleation happened at a relevant degree only if the process of rupturing pollen producing large number of fine ice-nucleating particles was included in the simulations. The resulting precipitation saturated for the highest INP concentrations. Secondary ice formation by rime splintering had only a minor effect in the considered 1 d timescale.
- Article
(4611 KB) - Full-text XML
- BibTeX
- EndNote
Large primary biological aerosol particles (PBAPs) such as pollen can be abundant in the atmosphere. For instance, according to Ranta and Satri (2007), the daily mean concentrations of birch plus alder pollen in Finland can exceed 1000 pollen m−3 for up to 2 weeks per year. Daily mean concentrations above 10 000 pollen m−3 occur during intense pollination periods – in the United States such pollen concentrations from both deciduous and evergreen trees have been observed (Steiner et al., 2015), and bi-hourly concentrations exceeding 50 000 birch pollen m−3 were observed in Vehmasmäki station in Finland in May 2021. In the current study we concentrate mostly on birch pollen as one of the most abundant pollen in boreal and northern temperate climates of the Northern Hemisphere, such as central and northern Europe (Skjøth et al., 2013) or North America (Steiner et al., 2015). Birch pollen is also well studied due to its high allergenicity.
The abundance of pollen in many tree species including birch and alder varies between years depending on weather conditions and the flowering intensity of the previous year (Dahl et al., 2013). Pollen concentrations also exhibit regular diurnal variations with afternoon peaks, although Rantio-Lehtimäki et al. (1991) found the concentrations of tree pollen to stay relatively constant over the day, with a slight minimum in early morning.
Typically cloud droplets are formed on hygroscopic aerosol particles (composed of sulfate, nitrate, sea salt, organic aerosol, etc.), with the number of cloud condensation nuclei (CCN) in cubic centimetres ranging from below 100 in a clean marine atmosphere to thousands in polluted areas (Seinfeld and Pandis, 1998). Compared to these numbers, even the highest observed pollen concentrations are too low to noticeably influence the CCN concentration. However, in humid conditions pollen is known to rupture and release a large number of fine sub-pollen particles (SPPs) (Aznar et al., 2024; Emmerson et al., 2021; Stone et al., 2021; Suphioglu et al., 1992; Taylor et al., 2004; Wozniak et al., 2018). These SPPs acting as extra CCN can increase the cloud stability by reducing the droplet size.
On the other hand, as shown by Houghton (1938), raindrops in liquid clouds are formed by collisions of cloud droplets of different sizes, and the presence of at least a small number of extra-large hygroscopic CCN is an essential factor for the appearance of cloud droplets of different sizes in the same location. Coarse aerosols such as sea spray and mineral dust have been shown to act as such giant CCN (GCCN), enhancing the collision–coalescence process that leads to drizzle formation (Adebiyi et al., 2023; Feingold et al., 1999). Due to their large size (10–100 µm in diameter), pollen can also act as GCCN. Feingold et al. (1999) found noticeable enhancement in drizzle formation from GCCN concentrations as low as 0.001 cm−3, which is well in the range of observed pollen concentrations.
At temperatures warmer than the homogeneous freezing limit at about −38 °C, ice in the clouds is formed heterogeneously on particles which can initiate freezing. Depending on temperature, different solid particles can act as ice-nucleating particles (INPs). In colder temperatures (below −15 °C) ice nucleation is dominated by mineral dust, while primary biological aerosol particles are the most efficient INPs for temperatures warmer than −10 °C (Hoose and Möhler, 2012). Both pollen and SPPs can act as INPs (Pummer et al., 2012). Pollen of spring flowering trees such as birch and alder has been shown to be good ice nucleators in relatively higher temperatures (Dreischmeier et al., 2017; Gute and Abbatt, 2020).
The processes leading to pollen rupture are not well understood. While sub-pollen particles from birch pollen have been observed both in lab and in atmosphere (Burkart et al., 2021; Rantio-Lehtimaki et al., 1994; Schäppi et al., 1997), the frequency of this process happening in atmosphere has not been quantified. More research exists about grass pollen related to asthma outbreaks coinciding with thunderstorms, but conditions leading to it have not been well quantified (Emmerson et al., 2021). The only data available to our knowledge regarding pollen rupture due to high air humidity were collected by Zhou (2014) for wheat and pine pollen. Wheat pollen was the only one rupturing in their set-up. Unfortunately, they made no experiments with birch pollen. Large uncertainties exist also in the number of SPPs released from rupturing birch pollen and their size distribution.
A large spread exists also in the measurements of ice nucleation efficiency by pollen and SPPs. The median freezing temperatures measured for birch pollen reach from −13.4 to −27 °C and for alder from −7.3 to −17 °C and are sensitive to atmospheric processing experienced by the pollen grains (Gute et al., 2020; Gute and Abbatt, 2020). The temperature of freezing onset is challenging to measure and uncertain (Duan et al., 2023); however, Wieland et al. (2024) showed that birch pollen can nucleate ice at temperatures at least up to −5.4 °C.
A small number of global and regional modelling studies have investigated the impact of pollen and SPPs on precipitation; however, often the pollen concentrations in those are low, representative of long-term or large-scale averages (e.g. Werchner et al., 2022; Wozniak et al., 2018). While some studies (e.g. Zhang et al., 2024) have used realistic pollen emissions, their emissions represent an average pollen year, while during intense flowering on mast years, the concentrations can locally reach many times what is used in those studies. Also, while ice nucleation is included in some of the studies, the precipitation parameterizations in global- and continental-scale models do not explicitly account for the GCCN effects of large particles.
In this study we apply UCLALES-SALSA (UCLA Large-Eddy Simulation Code and Sectional Aerosol module for Large-Scale Applications) (Tonttila et al., 2017, 2021) to explore what kind of birch pollen concentrations are required to have an impact on precipitation in liquid- and mixed-phase clouds at the local scale. We quantify the CCN, GCCN, and INP effects of pollen and SPPs for a range of pollen concentrations and test the effect of different assumptions about the SPP size distribution. The simulations allow us to quantify the fraction of pollen and SPPs that escape the boundary layer to the free troposphere and can participate in long-range transport in different cloud conditions.
2.1 Model description
We used the UCLALES-SALSA model that combines the UCLA Large Eddy Simulator (Stevens et al., 1999, 2005; Stevens and Seifert, 2008) with the Sectional Aerosol module for Large Scale Applications (SALSA; Kokkola et al., 2008, 2018) and includes representations of aerosols, liquid cloud droplets, raindrops, and ice and simulates their interactions (Ahola et al., 2020; Tonttila et al., 2017, 2021). The version of UCLALES-SALSA used in this study explicitly computes raindrop formation through the collision–coalescence of cloud droplets. This process is included in the collision scheme that handles all collisions between different types of particles including coagulation of aerosol particles, coalescence of cloud droplets, accretion of liquid droplets to ice particles and scavenging of aerosol and cloud droplets by falling raindrops or ice. The cloud droplets are moved to the rain phase when their wet diameter after collision exceeds a minimum drop size of 20 µm. When liquid droplets leave the cloud to subsaturated conditions and enough water evaporates to bring the particles close to equilibrium with the ambient relative humidity, they are moved back to the aerosol phase.
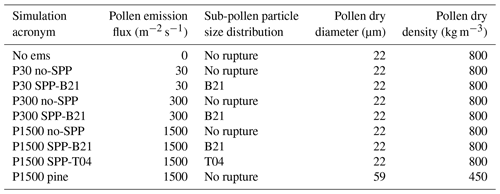
The model was amended with parameterizations for pollen emission and humidity-dependent rupture. Pollen is emitted as constant flux from the surface. We simulate pollen as spherical particles: birch pollen with a diameter of 22 µm and a density of 800 kg m−3 (Gregory, 1961) and pine pollen with a diameter of 59 µm and a density of 450 kg m−3 (Jackson and Lyford, 1999). The direct emission of sub-pollen particles from trees is not considered in this study, as there are no data available to quantify such a flux.
As no measurement data about humidity-dependent pollen rupture rate are available for birch pollen, we followed the example of Werchner et al. (2022) and parameterized the rupture process as exponential decay with timescale and humidity dependence approximated from the data of Zhou (2014) for wheat pollen. Pollen starts rupturing when relative humidity exceeds 80% and their e-fold lifetime reduces linearly from 12.5 to 2.5 h as humidity increases from 80 % to 95 %. We limit the e-fold lifetime to a minimum of half an hour. This exponential decay approximation would overestimate the rupture rate at the beginning of Zhou's (2014) experiments where the temporal development is looking more sigmoidal; however, the slow starting rate in the lab could be due to using dry pollen, while in nature the pollen has been exposed to ambient humidity already in the catkins. Thus, given all the uncertainties, we opted to use the simplest form of parameterization. The mass of the rupturing pollen is reduced by the total mass of the released SPPs, after which they continue interacting with the clouds as GCCN and INP but are not allowed to rupture again. Pollen ruptures much faster when fully immersed in water, as is the case when pollen is included in a raindrop. However, it is unclear if the released fragments would be able to leave the raindrop or if they would stay inside the drop and stick to the surface of the pollen grain when the drop evaporates. For simplicity, we simulate no SPP release from raindrops and consider the pollen that has been in raindrops incapable of rupturing further.
The size of the SPPs affects their ability to act as both CCN and INPs. To explore the impact of different assumptions regarding the size of the SPPs, lognormal distributions (Fig. 1) were fitted to the measurements from Taylor et al. (2004) (mean diameter 0.3 µm, geometric standard deviation 2.2, referred to as T04 further on) and Burkart et al. (2021) (mean diameter 1.15 µm, geometric standard deviation 1.5, further referred to as B21). Following Wozniak et al. (2018), we assumed 1000 sub-pollen particles to be emitted from each ruptured pollen, which is similar to assessments of Stone et al. (2021) and Suphioglu et al. (1992).
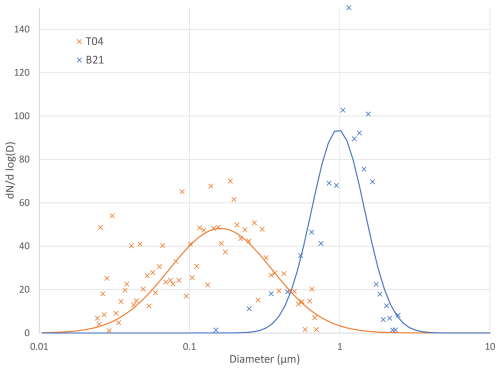
Figure 1Size distributions fitted to data from Taylor et al. (2004) (orange) or Burkart et al. (2021) (blue).
In addition to size and density, the cloud interactions are also sensitive to a particle's hygroscopicity. As a simplification, we treat pollen as a soluble particle and set the same hygroscopicity parameter to 0.16 for both SPPs and whole pollen, which is consistent with the critical supersaturation measurements for birch pollen SPPs by Steiner et al. (2015). As in reality a whole pollen is not a soluble particle, the use of kappa-Kohler theory (Petters and Kreidenweis, 2007) is not exactly correct for it. However, as particles with diameters in the range of tens of micrometres activate easily as cloud droplets as long as they are not hydrophobic, this approximation should have limited impact. Griffiths et al. (2012) reported pollen hygroscopicities in the range of 0.05 to 0.22 and found that the wettability and the large size of pollen grains lead to them activating to cloud droplets in supersaturations of 0.0015 % and lower.
Ice nucleation parameterization for both pollen and sub-pollen particles was based on a simplified version of the Augustin et al. (2013) scheme. The temperature dependence of the ice nucleation rate is computed as an exponential fit: , where j is the heterogeneous nucleation rate per second and Tc is the temperature in Celsius.
Augustin et al. (2013) also parameterized the average number of ice nucleation active macromolecules in SPPs depending on their diameter and we use this parameterization to account for the probability that a small SPP particle might not contain any ice nucleation active macromolecules. However, to avoid unrealistically high ice nucleation rates for whole pollen grains and larger SPPs in near-zero temperatures, we assume that there is exactly one ice nucleation active site in every ice nucleation active particle (SPP, or whole or ruptured pollen). Augustin et al. (2013) showed in their Appendix A that this approximation reproduces the slope of the frozen fraction for SPPs well. For whole pollen it gives us a median freezing temperature of ∼ −15 °C at a cooling rate of 0.67 K min−1 used by Gute and Abbatt (2020), which is slightly lower than their measured median freezing temperature of −13.4 °C but on the higher end of the rest of their reviewed data. It also agrees well with the model of Hoose et al. (2010), who report the temperature below which the freezing rate exceeds 10−5 s−1 for birch pollen at approximately −8 °C, while our model reaches this rate at −7.24 °C. The freezing rate in our model is zeroed for temperatures above −2 °C. All particles formed by collisions with ice are assumed to freeze. Secondary ice formation through rime splintering (Hallett and Mossop, 1974) is included in the simulations. Splinters are formed at temperatures between −3 and −8 °C with 3.5×10⁸ splinters produced per kilogram of rime at the optimal −5 °C temperature. The parameterization of Seifert et al. (2014) for cloud ice is used for the effective size and terminal velocity of the ice particles.
2.2 Model simulations
To investigate the impact of high pollen concentrations on cloud processes, we simulate two well-described cases – one for liquid- and one for mixed-phase clouds.
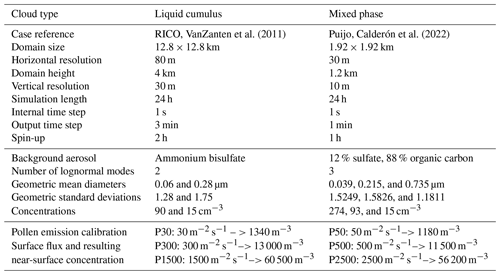
For liquid clouds we use the Rain in Cumulus over the Ocean (RICO) field campaign characterized by a lightly precipitating cumulus-topped boundary layer, adapted for large eddy simulator (LES) studies by VanZanten et al. (2011), who selected the case as a simple prototype for precipitating convective clouds. The field campaign took place over the northwestern Atlantic in winter. The clouds in this case are shallow enough to simulate with LES without the domain size becoming computationally prohibitively expensive while still being deep enough for precipitation development and sensitive to microphysics including aerosol perturbations. The case allows us to investigate the role of convective structures in transporting particles such as pollen and SPPs from the boundary layer to the free troposphere where they can be transported for long distances and contribute to cloud and ice nucleation processes on larger scales. The near-surface temperature during the campaign was +26 °C. Such a high temperature on a spring day would result in rapid pollen maturation and release and thus would lead to very high pollen concentrations. The temperature was above zero throughout the cloud layer.
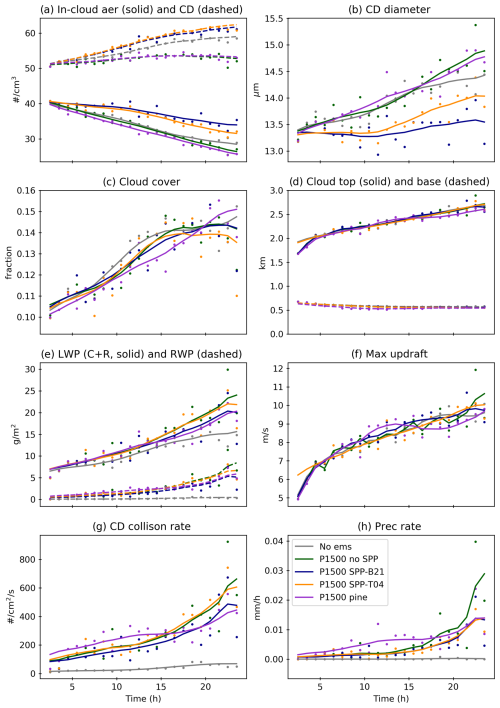
Figure 2Impact of pollen and SPPs on the liquid cumulus clouds. (a) In-cloud interstitial aerosol and cloud droplet concentration. (b) Cloud droplet size, mean over cloudy grid cells. (c) Cloud cover fraction. (d) Height of cloud top and base. (e) Liquid water path (cloud plus rain) and rainwater path. (f) Maximum updraught velocity. (g) Loss rate of cloud droplets due to collision–coalescence, mean over cloudy columns. (h) Mean precipitation rate at the surface. Simulations: grey – no-emission control; green – birch pollen flux (1500 pollen m−2 s−1), no rupture; dark blue – same birch pollen flux, SPP size from B21; orange – same birch pollen flux, SPP size from T04; purple – pine pollen flux (1500 pollen m−2 s−1), no rupture. Hourly-averaged time series, mean over the model area. A grid cell is considered cloudy if the cloud water mixing ratio exceeds kg kg−1. Dots – hourly-averaged model values; lines – trend component from singular spectrum analysis with 6 h window length.
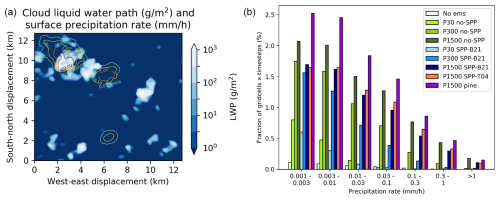
Figure 3(a) Contours – an example map of instant precipitation rate (mm h−1) 22.5 h after simulation start; white shading – liquid water path (g m−2). (b) Histogram of instant grid cell rain rates in the second half of the simulation (mm h−1). Precipitation rates below 0.001 mm h−1 are not shown.
For mixed-phase clouds we use the second case described by Calderón et al. (2022). The measurement campaign that their LES simulations were based on took place at Puijo station, Finland. The case is characterized by a low-level stratocumulus cloud with low aerosol loading and light drizzle formation in cloud. The near-surface temperature was about 0 °C, and some ice particles were observed. We extended the simulations to 24 h from the original 6 h to allow the pollen to be transported to the cloud and rupture to produce SPPs and ice nucleation to take place. The cloud-top temperature at the beginning of the episode was about −3 °C and was falling while the cloud top was rising. These temperatures are ideal for secondary ice production through rime splintering (Hallett and Mossop, 1974). While high pollen emission is unlikely with near-zero temperatures, Puijo station is elevated compared to its surroundings where the temperature is likely to be higher. Also, the case starts at midnight, so the pollen could have matured during the warmer afternoon while its release from catkins could have been delayed due to humidity that is too high or low-wind conditions. The case also gives us a chance to investigate if any pollen or SPPs manage to escape the boundary layer through the relatively strong inversion that was present in this case.
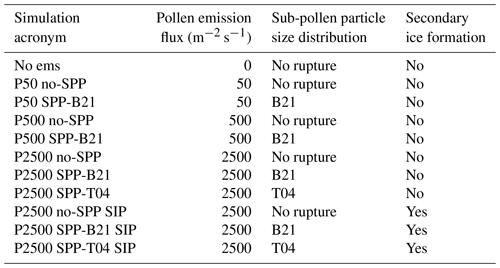
In both cases preliminary model simulations were used to calibrate the birch pollen emission flux to produce near-surface concentrations covering from commonly observed daily mean values of about 1000 up to the hourly maximum values of more than 50 000 pollen m−3. Fluxes required in the simulations to produce these concentrations are shown in Table 1. Simulations with the T04 SPP distribution were made only for the maximum pollen flux to save computational resources. To investigate the impact of pollen size on the GCCN effect, one extra simulation was made for the RICO case in which the pollen emission flux was kept the same as in the maximum birch pollen flux but pine pollen size and density were assigned. Pine pollen can be present in atmosphere in large quantities. Its diameter is about 3 times larger than that of birch pollen; however, pine pollen incorporates two large air bladders that reduce its density and help with buoyancy. As Zhou (2014) found no rupture for pine pollen, we do not consider this process for the pine pollen simulation.
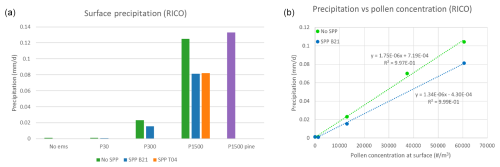
Figure 4(a) Total accumulated surface precipitation by the end of the 24 h simulations of the RICO case with various emissions. (b) Accumulated precipitation vs. mean pollen concentration near the surface in the second half of the simulation: green – no rupture; blue (or orange) – SPP size distribution from B21 (or T04).
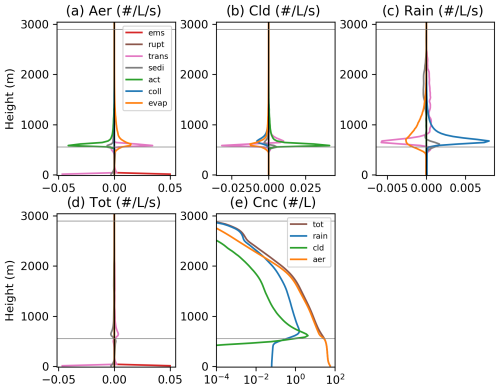
Figure 5Vertical profiles of pollen concentration tendencies in aerosol (a), cloud (b), and rain (c) phases and the sum of those (d) due to various processes: pollen emission, rupture, vertical transport, sedimentation, cloud activation, collisions, and evaporation. (e) Number concentration profiles of different phases. Domain-averaged hourly mean quantities 12 h after the beginning of the simulations, plotted for the case with maximum pollen flux and rupture according to the B21 size distribution. Grey lines denote the cloud base and top of the highest clouds. Both whole and ruptured pollen grains are included.
The set-up of the simulations is shown in Table 1. Both cases were run for 24 h with 1 s internal time step, which is further shortened if needed for model stability. Model spin-up allows the turbulence to develop while precipitation formation is turned off. All simulations are initialized with the background aerosol size distribution and properties following the specifications in the case publications (Table 1).
Tables 2 and 3 list all the simulations with their acronyms and parameters that were varied for each of the cases.
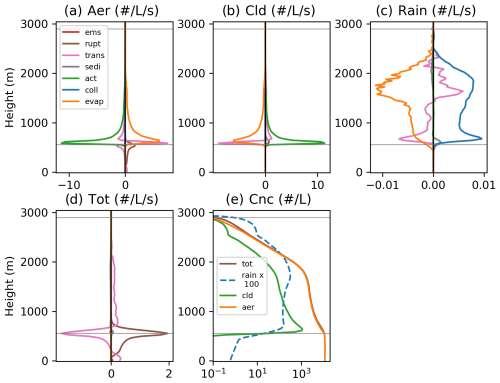
Figure 6(a)–(d) Vertical profiles of sub-pollen particle concentration tendencies in different phases due to various processes. Panels and colours are the same as in Fig. 5. (e) Number concentration profiles of SPPs in different phases. Rain phase has been multiplied by factor of 100 to fit in the same scale.
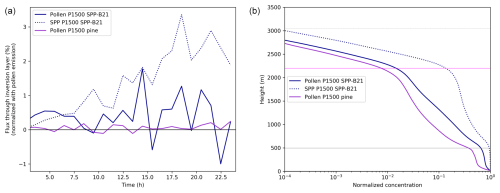
Figure 7(a) Domain mean hourly-averaged net flux of pollen and SPPs through the inversion layer. For pollen the flux is normalized with the pollen emission flux and for SPPs with pollen emission ×1000. (b) Normalized domain average vertical profiles of pollen concentration for birch (blue) and pine (purple) pollen and birch SPPs (blue, dashed) at the end of the simulation. The magenta line denotes the inversion layer, the solid grey the cloud base, and the dashed grey the top of the highest clouds.
3.1 Liquid cumulus case
To investigate the impact of pollen and SPPs on liquid clouds we simulated the RICO field campaign characterized by the cumulus-topped boundary layer, adapted for large eddy simulator studies by VanZanten et al. (2011). Figure 2 shows the temporal evolution of selected variables during the simulations. The lines have been smoothed using singular spectrum analysis with 6 h window length to make them easier to distinguish from each other, and hourly-averaged model output is plotted as dots to visualize the model variability. Comparing the grey no-emission time series with the coloured ones shows that in this case the pollen and SPPs do not affect the cloud dynamics on larger scales, as the difference in cloud height and maximum updraught velocity (Fig. 2d, f) between the simulations does not exceed the model noise and the changes in cloud cover fraction in panel c (with the exception of the pine pollen simulation) are also minor. As seen in Figs. 2h, 3b, and 4a, the UCLALES-SALSA simulation of this case without pollen emission produces almost no precipitation within 24 h. However, the GCCN effect of the pollen enhances the collision–coalescence rate in the simulations and leads to increased surface precipitation (Fig. 2g, h). The domain-averaged accumulated precipitation is low even for the maximum emitted pollen flux; however, some isolated larger clouds can produce noticeable precipitation rates (Fig. 3a). As the clouds are moving with the wind, the precipitation does not reach the surface directly below them, and in some cases the cloud that produced it has already mostly dissipated.
Figure 3b shows the histograms of the instant precipitation rate in every grid column every output time step (3 min) of the second half of the simulations, when the pollen and SPPs had had time to start influencing the precipitation. As the cloud cover fraction stayed below 15 % in all simulations, we can expect no rain in at least 85 % of the domain. Indeed, precipitation stayed below 0.001 mm h−1 in more than 90 % of the domain in all simulations. As seen in Fig. 3b, the shapes of the rain rate distributions are very similar between all the simulations and increasing pollen emission increases the number of precipitating grid cells at every rate interval. This indicates that the increase in accumulated precipitation is not due to heavier rainfall from a few clouds but due to a larger fraction of the clouds precipitating.
The precipitation enhancement is nearly linear to the pollen emission (Fig. 4b). Including the pollen rupture process increases the cloud droplet number and reduces the cloud droplet size, stabilizing the clouds and decreasing the precipitation (Fig. 2a, b, h). While the cloud droplets are slightly smaller for the B21 parameterization compared with the T04 one (Fig. 2b), it does not seem to influence the total precipitation in the highest-emission case (Fig. 4a), for which both of the parameterizations were tested.
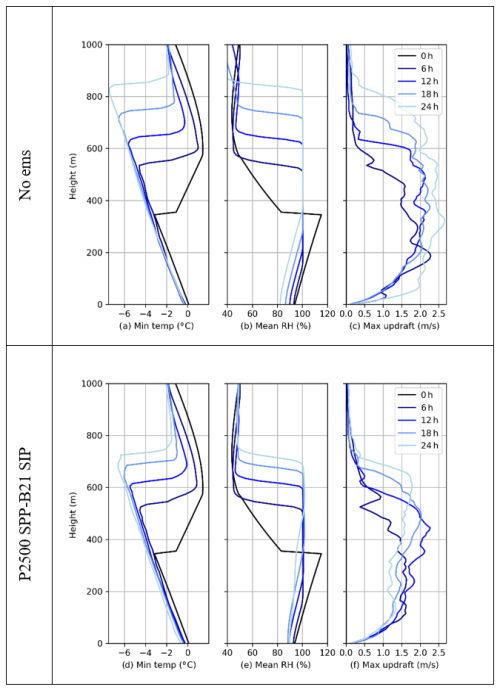
Figure 8Profiles of domain minimum temperature, mean relative humidity, and maximum updraught velocity for the no-emission control (upper row) and the maximum INP simulation (P2500 SPP-B21 SIP, lower row) (initial, 6, 12, 18, and 24 h after simulation start, from darker to lighter lines).
Figures 5 and 6 show the vertical profiles of pollen and SPP number concentration and its tendencies in aerosol, cloud, and rain phases caused by various processes in the midpoint of the simulation with maximum pollen emission and rupture according to the B21 size distribution. Pollen is emitted from the surface (Fig. 5d, red line) and thus has a large vertical gradient near the ground. Below cloud it is mostly in the aerosol phase (Fig. 5e). Cloud activation takes place at the cloud base (Fig. 5a, b, green lines) and above that the pollen-containing cloud droplets quickly grow to raindrop size by coalescence (Fig. 5c, blue line).
As seen in Fig. 6d, the most intense pollen rupture takes place at the cloud base where the humidity is high and pollen concentration is still reasonably high. Pollen rupture is not visible in Fig. 5 because the ruptured pollen is still tracked in the simulation, so their number does not change. From the cloud base the fine sub-pollen particles produced are mixed upwards and downwards (Fig. 6d, pink line) and partly also immediately activated to the cloud phase (green lines, Fig. 6a, b). The cloud activation rate is much higher than rupture rate because pollen rupture in the model is a relatively slow process, with a timescale of 2.5 h at the highest humidities. Activation to cloud droplets at the cloud base, on the other hand, is a fast process that involves all the SPPs produced cumulatively during the simulation and is balanced by evaporation back to the aerosol phase after leaving the cloud. The transport rate includes both grid-scale and sub-grid-scale vertical transport, and as a domain average it can be considered as mixing, which acts to reduce the vertical gradients produced by the other processes. The processes that move particles from one phase to the other are not visible in Fig. 6d, which depicts the sum of all the phases, so there the rupture followed by transport is the dominating process. For SPPs sedimentation is too slow compared with other processes to be visible.
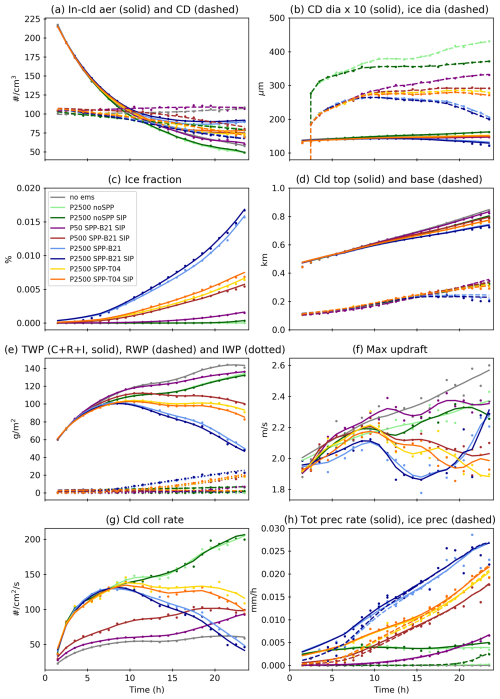
Figure 9Impact of pollen and SPPs on the mixed-phase clouds. (a) In-cloud interstitial aerosol and cloud droplet concentration. (b) Cloud droplet and ice particle size, mean over cloudy grid cells (cloud droplet diameter has been multiplied by 10 to fit on same scale). (c) Cloud ice fraction. (d) Height of cloud top and base. (e) Total water path (cloud plus rain plus ice), rainwater path, and ice water path. (f) Maximum updraught velocity. (g) Loss rate of cloud droplets due to collision–coalescence. (h) Total and ice precipitation rate at the surface. Simulations: grey – no emission control; green – birch pollen flux (2500 pollen m−2 s−1) and no rupture; blue – same birch pollen flux, SPP size from B21; orange – same birch pollen flux, SPP size from T04; brown – birch pollen flux (500 pollen m−2 s−1), SPP size from B21; purple – birch pollen flux (50 pollen m−2 s−1), SPP size from B21. Darker shades indicate simulations that include secondary ice formation (SIP). Dots are hourly-averaged model values, and lines are the trend component from singular spectrum analysis with 6 h window length.
In Fig. 6c we see that smaller particles such as SPPs form raindrops more uniformly throughout the cloud layer, while pollen-including raindrops (Fig. 5c, e) form mostly close to the cloud base. Comparing the blue lines in Figs. 5e and 6e we see that the SPP-containing raindrop concentration decreases much faster below the cloud base than the pollen-containing raindrop concentration. The raindrops formed around pollen grains are larger and thus fall faster and have less time to evaporate, leading to a larger liquid water flux to the surface, while almost all of the SPP-containing raindrops evaporate already near the cloud base.
Pollen size has a two-fold effect on its ability to act as GCCN – on one hand large pollen would be more efficient in collecting cloud droplets to form precipitation, but on the other hand the higher deposition rate of the larger particles would lead to a much lower concentration at cloud level. For pine pollen the enhanced deposition resulted in a near-ground concentration that is 3 times lower than for birch pollen and also a faster drop-off for higher vertical levels (Fig. 7b). However, the resulting precipitation started earlier (Fig. 2h) and was slightly larger than for the birch pollen case (purple bar in Fig. 4).
Figure 7a shows the normalized net flux of pine and birch pollen and birch SPPs through the inversion layer. The fluxes are positive for most of the simulation time, although for pine pollen the flux is very small. In the last hour of the simulation 0.03 % of pine pollen, 0.14 % of birch pollen, and 1.86 % of birch SPPs cumulatively emitted or produced during the whole simulation are located above the inversion layer. The majority of birch pollen and SPPs (88 % and 98 % respectively) above the inversion layer are found in the aerosol phase, indicating that they have escaped the clouds through detrainment. As SPPs survive higher in the cloud than pollen, more of them are released from the evaporating cloud droplets at higher altitudes (Figs. 5 and 6, panels a–c). By the end of the simulation, ∼ 23 % of the emitted pollen has ruptured, each releasing 1000 SPPs, leading to the number of SPPs above the inversion layer being 3 to 4 orders of magnitude higher than that of pollen.
3.2 Mixed-phase case
For mixed-phase clouds, we simulated the second case described by Calderón et al. (2022), a nocturnal low-level stratocumulus episode observed in Puijo, Finland. In the course of the 24 h simulation the cloud top rises from below 400 m to above 800 m and the cloud-top temperature falls from −3 to −7 °C (Fig. 8). Some snowflakes were observed during the measurement campaign, but the UCLALES-SALSA simulation without pollen emission produces almost no precipitation within 24 h and as no INPs were included in the background aerosol, no ice is formed.
As seen from comparing the grey and light green lines in Fig. 9g and h, the introduction of pollen to the simulations without the rupture process leads to light liquid-phase drizzle due to the GCCN enhancing the collision rate; however, the pollen concentration in the clouds is too low to cause significant ice nucleation even for the maximum pollen flux (Fig. 9c).
The rupture of a pollen grain produces 1000 potentially ice-nucleating SPPs that also have a slower settling velocity and thus their concentration in the cloud top can be much larger. As the relative humidity in this case was above 80 % from the surface to cloud top (Fig. 8, right), the rupture rate of pollen was relatively fast. While these additional particles reduce the cloud droplet and ice particle size (Fig. 9b), they also make the cloud start to glaciate. While even in the case with maximum INP production (P2500 SPP-B21) the ice particles make up only a small fraction (< 0.02 %) of the total cloud droplets (Fig. 9c), their effects are clearly noticeable. Once formed, they grow fast and end up being much larger than the cloud droplets (Fig. 9b), so by the end of the simulation with maximum ice formation, about half of the total (liquid plus ice) water path is actually frozen (Fig. 9e). Due to the faster settling of the ice particles, the total water path also reduces by half and a drop is visible in the cloud height by the end of the simulation (Fig. 9d). In fact, enough water is removed from the cloud layer by the settling of the ice particles and subsequently sublimated back to the vapour phase below cloud base to change the humidity profile. In the no-emission base case, the relative humidity at the surface falls to ∼ 80 % by the end of the simulation (Fig. 8b), while for the maximum ice nucleation case it stays around 90 % and a small drop is also seen in the near-surface temperature due to the energy spent for the vaporization of the falling ice (Fig. 8d, e). This results in less buoyancy and a slowdown of updraught velocities (Figs. 8c, f, 9f).
The additional INPs from pollen rupture lead to noticeable solid-phase precipitation (Fig. 10a), especially if assuming the larger size distribution (B21), as according to the ice nucleation parameterization used, not all the smallest SPPs include ice-nucleating macromolecules. For total precipitation, the large impact of additional INPs dominates over the competing effect of the extra CCN reducing cloud droplet size. As pollen rupture is a relatively slow process, it takes several hours for the SPP ice nucleation effect to start dominating over the pollen GCCN effect (Fig. 9h). Secondary ice production through rime splintering has a minimal effect on the simulations (Fig. 10a), with the exception of the no-SPP case where the ice precipitation rate starts rising at the end of the simulation (Fig. 9h), indicating that the process could become important at longer timescales.
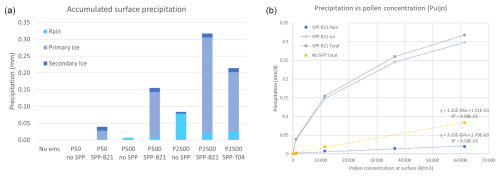
Figure 10(a) Total accumulated surface precipitation (liquid and solid) by the end of the 24 h simulations of the Puijo case with various emissions. (b) Scatter plot of precipitation vs. pollen concentration near the surface: yellow – no rupture. For the rest, SPP is from B21: grey – total precipitation; dark blue – rain; light blue – ice.
In this case, the cloud cover is 100 % in all simulations and precipitation is distributed uniformly over the model domain. During the second half of all the simulations with SPP release and also the one with maximum pollen emission without SPP, light precipitation is present in a majority of the domain. A higher INP concentration shifts the precipitation distribution towards higher rates (Fig. 11). Similarly to the liquid cloud case, the resulting precipitation is positively correlated to pollen emission (Fig. 10b). Near-linear dependence is true for liquid precipitation, while the solid phase levels off for higher INP concentrations. Figure 10a shows that the precipitation resulting from pollen emissions that are 5 times lower with the B21 SPP size distribution (P500 SPP-B21) is only ∼ 30 % lower than that of the maximum pollen emission with the T04 SPP size distribution (P2500 SPP-T04). These two simulations look similar also for other variables, e.g. cloud ice fraction, ice water path, and maximum updraught velocity (Fig. 9, brown and orange lines). Thus, depending on the assumptions about SPPs, even more commonly encountered pollen concentrations (∼ 10 000 pollen m−3) can have noticeable impacts on mixed-phase clouds through ice nucleation.
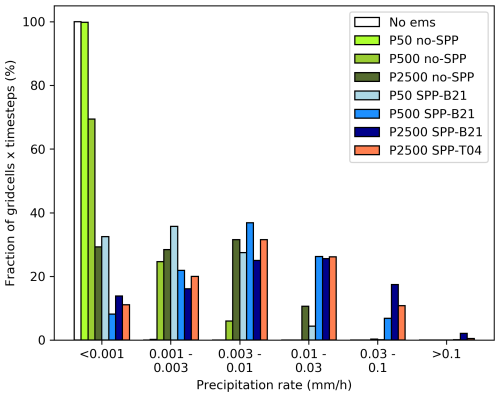
Figure 11Histogram of instant grid cell total precipitation (rain plus ice) rates in the second half of the simulation (mm h−1).
Figures 12 and 13 show the vertical profiles of aerosol and pollen number concentration tendencies in aerosol, cloud, rain, and ice phases caused by various processes in the middle of the simulation with maximum pollen flux and rupture according to the B21 size distribution.
Above the steep near-surface gradient the total pollen concentration in this case is much more uniform until the top of the cloud layer (Fig. 12f), which is much lower than in the RICO case. Practically all pollen in rising airflows is activated to cloud droplets at cloud base, followed by drizzle formation during the continuing ascent (Fig. 12a–c, green lines for cloud activation and blue for rain formation through coalescence). In Figs. 12f and 13f it is visible that the pollen and SPP concentrations in raindrops (darker blue line) decrease from the cloud base to the surface due to evaporation (orange line in Figs. 12c and 13c). The decrease is about 1 order of magnitude for the pollen particles (Fig. 12f), while the concentration decreases to almost zero in the case of SPPs (Fig. 13f). This means that the fraction of pollen particles deposited on the ground by rain is much larger than those of the smaller SPPs.
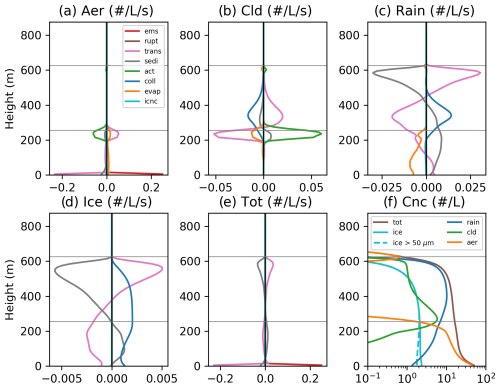
Figure 12Vertical profiles of pollen concentration tendencies in aerosol (a), cloud (b), rain (c), and ice (d) phases and the sum of those (e) due to various processes: pollen emission, rupture, vertical transport, sedimentation, cloud activation, collisions, evaporation, and ice nucleation. (f) Number concentration profiles of different phases. Dashed light blue line shows ice particles larger than 50 µm in diameter. Domain-averaged hourly mean quantities 12 h after the beginning of the simulations are plotted for the case with maximum pollen flux and rupture according to the B21 size distribution. Grey lines denote the cloud base and top.
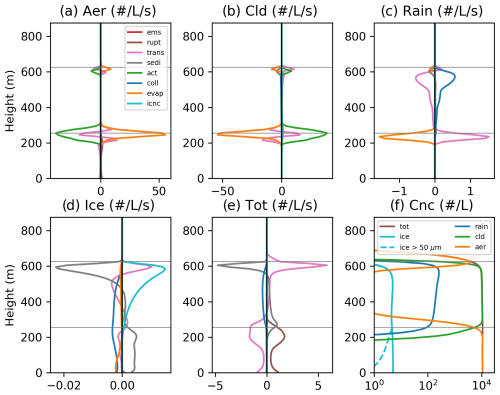
Figure 13(a)–(e) Vertical profiles of sub-pollen particle concentration tendencies in different phases due to various processes. (f) Number concentration profiles of SPPs in different phases. Panels and colours are the same as in Fig. 12.
As seen in Fig. 13, the ice-nucleating SPPs are produced by pollen rupture near the cloud base (panel e, brown line) and transported to the cloud top (panel e, pink line), where the temperatures are lowest and ice nucleation rate highest (panel d, light blue line). The ice particles grow by the deposition of water vapour while settling through the cloud layer. As the temperature is below zero at all vertical levels, they stay frozen until the ground but do shrink due to sublimation below cloud base. The role of whole pollen grains in ice nucleation is negligible due to their low concentration and short residence time at cloud top due to the high settling velocity. Instead, as seen from the dark blue line in Fig. 12d, they mostly end up in the ice phase due to scavenging by falling ice particles. However, comparing solid and dashed light blue lines in Figs. 12 and 13 we see that after falling out of the cloud the majority of the SPP-containing ice particles shrink to small sizes due to sublimation, while the pollen has accumulated more water acting as GCCN even before freezing and thus falls faster and reaches the ground with a larger water content, leading to increased ice-phase precipitation.
By the end of the simulation, ∼ 12 % of the emitted pollen has ruptured. The main reason for the smaller ruptured fraction than in the RICO case is the shorter lifetime of pollen in air – 92 % of all the emitted pollen has been deposited by the end of the simulation, while at the end of the RICO case 39 % was still in the air. Although this case is characterized by a strong inversion, some particles still manage to escape above the cloud layer. By the end of the 24 h long simulation, 0.02 % of the emitted pollen and 1.0 % of the produced SPPs could be found above the cloud top. As seen in Figs. 12f and 13f, above the clouds water has evaporated from pollen and SPPs and they have deactivated and returned to the aerosol phase – 70 % of pollen and 87 % of SPPs above the mean cloud top are found in the aerosol phase.
We used the UCLALES-SALSA large eddy simulator for simulating pollen effects on precipitation in two well-described cases, one for liquid- and one for mixed-phase clouds. The simulations showed that the effects of pollen and sub-pollen particles on precipitation could be noticeable in the vicinity of birch or pine forests during the most intense pollination seasons. While the GCCN effects on liquid precipitation became noticeable only for the highest considered pollen concentrations, which are rare in the observation history, the ice nucleation started influencing the clouds already at more commonly encountered pollen concentrations. However, ice nucleation was relevant only if pollen rupture was included in the simulation. In both cases the liquid precipitation enhancement had nearly linear dependency on the emitted pollen flux; the slope of this relationship was case-dependent. The ice precipitation from the mixed-phase clouds levelled off for higher INP concentrations.
Although a small fraction of birch pollen managed to escape the boundary layer to the free troposphere, their impact is unlikely to extend far downwind from the source regions due to dilution and deposition reducing their concentration. Pine pollen is about 3 times larger than birch pollen but half as dense, leading to a settling velocity that is a few times higher and a shorter atmospheric lifetime. The fraction of pine pollen that got transported above the inversion layer by the updraughts in the convective clouds was about 5 times smaller than that of birch pollen. Thus, while more efficient as GCCN, pine pollen is even less likely to be relevant to precipitation beyond the emission areas. However, the simulation with pine pollen led to slightly larger rain enhancement than birch pollen for the same emission flux, showing that some of these extra-large particles managed to reach cloud level, and thus they could play a role in altering the precipitation, for instance above the boreal forests.
The fine sub-pollen particles released when pollen ruptures in humid conditions, on the other hand, have longer atmospheric lifetimes, having thus the potential to affect larger areas downwind of the pollen emission. In our simulations around 1 %–2 % of the SPPs escaped the boundary layer to the free troposphere where they could accumulate and be transported for long distances to contribute to the INP population further downwind. By the end of the simulation, the number of SPPs above the inversion layer was up to 4 orders of magnitude higher than that of pollen. Zhang et al. (2024) reported a similar ratio of SPPs to pollen in the upper troposphere for their modelling study when using the same number (1000) of SPPs released from a rupturing pollen grain. SPPs have two contrasting effects – while as extra CCN they slow down the precipitation formation by reducing the cloud droplet size, in mixed-phase clouds they also act as efficient high-temperature ice nucleators and can lead to the formation of solid precipitation. The ice nucleation by the SPPs clearly dominated over their cloud stabilizing effect, and the total precipitation was increased. Zhang et al. (2024) found that the addition of SPPs also invigorated the deep convective system they studied, as extra latent heat was released by the enhanced cloud droplet formation. We did not observe this process in our liquid cumulus case, as we saw no significant differences in cloud-top height or updraught velocities between the simulations with or without SPPs. In the mixed-phase cloud simulations we observed the opposite effect from the SPPs to the cloud dynamics to that in Zhang et al. (2024) – the settling of the nucleated ice particles and their subsequent vaporization below the cloud base led to a change in the vertical distribution of water vapour and a reduction in below-cloud temperature, which reduced the updraught velocities.
One potential caveat of this study is the high uncertainty of the ice nucleation parameterizations for the relatively warm temperatures of our mixed-phase cloud simulations. The ice nucleation measurements of Augustin et al. (2013) were made at temperatures below −17 °C, and thus its applicability for temperatures above −10 °C is uncertain. The uncertainties in birch pollen and SPP ice nucleation efficiencies are large even for lower temperatures and have been reported to depend on the location where the pollen has been collected, the atmospheric processing it has experienced, and the steps taken in preparing the samples for the measurements (Augustin et al., 2013; Gute and Abbatt, 2018; Wieland et al., 2024). The ice nucleation rates at temperatures higher than −10 °C are too slow to measure without large uncertainty, and for this reason in a majority of the cases only the median freezing temperature (T50) is reported (Duan et al., 2023). For birch pollen, T50 is colder than the temperatures reached in our simulations. However, this does not mean that ice nucleation would not happen at the temperatures encountered in the Puijo simulations. Recently, Wieland et al. (2024) demonstrated that birch pollen can nucleate ice at temperatures up to at least −5.4 °C. Our ice nucleation parameterization gives similar ice nucleation rates for pollen for warmer temperatures to parameterizations that have been used in previous modelling studies. The freezing onset temperature reported for model parameterizations is usually defined as the temperature at which the ice nucleation rate exceeds a certain threshold. Hoose et al. (2010) report the freezing onset as the temperature below which the freezing rate exceeds 10−5 s−1, and their parameterization gives the freezing onset at approximately −8 °C for birch pollen. Our model reaches this rate at −7.24 °C, while slower ice nucleation takes place in the model up to −2 °C for both pollen and sub-pollen particles.
The ice nucleation parameterization of Augustin et al. (2013) used in this study was based on measurements made using pollen washing water and thus is more valid for SPPs than whole pollen grains. However, the pollen concentration at cloud top where the majority of the ice nucleation happens never got high enough to make a noticeable impact on ice formation even when secondary ice formation through rime splintering was accounted for. The limited effects of pollen on cloud ice could be because of the relatively warm temperatures in the simulation. Low-level clouds with much lower temperatures are unlikely to occur during strong birch pollination periods. Some trees such as hazel and alder flower earlier in spring or winter when the weather is colder (Linkosalo et al., 2017), and Gute and Abbatt (2020) report ice nucleation at temperatures higher than −10 °C for alder pollen. On the other hand, the peak concentrations of alder pollen do not reach values as high as those of birch pollen. Lower temperatures can also exist if the cloud layer is higher, but in that case a smaller fraction of the emitted pollen would get transported to the cloud level. This trade-off could be investigated in future studies. However, it is the unique ability of the biological particles to act as INPs at higher temperatures, which can make their role in cloud dynamics important compared with the much more abundant types of INPs, such as mineral dust, that dominate the ice nucleation in colder clouds (Hoose and Möhler, 2012).
Only those of our simulation that included a higher than usual pollen concentration (exceeding ∼ 10 000 m−3) showed a noticeable impact on clouds and precipitation. However, such pollen concentrations may be more common than reported by monitoring networks as the stations are usually designed for allergy information needs and thus located near populated areas, while high pollen concentrations are likelier to occur in forested areas far from human habitation. Additionally, while the relative effect of pollen on precipitation is likely the largest for clouds with very low precipitation like those studied here, the pollen could have a larger overall impact on precipitation and cloud dynamics in different conditions than the simulated cases, for instance in clouds more prone to precipitate or with lower CCN concentrations from other sources. Sub-pollen particle impacts of similar magnitude to the maximum pollen emission cases would appear in lower pollen concentrations if more SPPs per rupturing pollen would be emitted or if SPPs would be directly emitted from trees. As observational data were not available for birch-pollen-rupture humidity dependence and emitted SPP number, our model had to be based partly on data for other wind-pollinated plants. Using the wheat pollen rupture data probably leads to overestimation of the rupture rate for birch. More laboratory studies are required to narrow down the uncertainties in pollen rupture and ice nucleation activity of whole pollen and SPPs.
The source code of the version of UCLALES-SALSA used for the simulations can be found at https://doi.org/10.57707/FMI-B2SHARE.5B37722CC31D4B8C9EDFECA6A8DD88F6 (Prank et al., 2024).
The simulation data presented in this paper are available from https://doi.org/10.57707/FMI-B2SHARE.5B37722CC31D4B8C9EDFECA6A8DD88F6 (Prank et al., 2024).
MP, SR, and TR designed the study. MP performed and analysed the model simulations with assistance from JT, SR, and TR. XS provided pollen observations and assisted with related literature. MP, JT, SR, and TR have contributed to developing the UCLALES-SALSA model. MP prepared the manuscript with contributions from all co-authors.
The contact author has declared that none of the authors has any competing interests.
Publisher's note: Copernicus Publications remains neutral with regard to jurisdictional claims made in the text, published maps, institutional affiliations, or any other geographical representation in this paper. While Copernicus Publications makes every effort to include appropriate place names, the final responsibility lies with the authors.
This research has been supported by the Research Council of Finland (grant nos. 322532 and 356444).
This paper was edited by Maria Kanakidou and reviewed by two anonymous referees.
Adebiyi, A., Kok, J. F., Murray, B. J., Ryder, C. L., Stuut, J. B. W., Kahn, R. A., Knippertz, P., Formenti, P., Mahowald, N. M., Pérez García-Pando, C., Klose, M., Ansmann, A., Samset, B. H., Ito, A., Balkanski, Y., Di Biagio, C., Romanias, M. N., Huang, Y., and Meng, J.: A review of coarse mineral dust in the Earth system, Aeolian Res., 60, 100849, https://doi.org/10.1016/j.aeolia.2022.100849, 2023.
Ahola, J., Korhonen, H., Tonttila, J., Romakkaniemi, S., Kokkola, H., and Raatikainen, T.: Modelling mixed-phase clouds with the large-eddy model UCLALES–SALSA, Atmos. Chem. Phys., 20, 11639–11654, https://doi.org/10.5194/acp-20-11639-2020, 2020.
Augustin, S., Wex, H., Niedermeier, D., Pummer, B., Grothe, H., Hartmann, S., Tomsche, L., Clauss, T., Voigtländer, J., Ignatius, K., and Stratmann, F.: Immersion freezing of birch pollen washing water, Atmos. Chem. Phys., 13, 10989–11003, https://doi.org/10.5194/acp-13-10989-2013, 2013.
Aznar, F., Negral, L., Moreno-Grau, S., Costa, I., Lara, B., Romero-Morte, J., Rojo, J., Rodríguez-Arias, R. M., Fernández-González, F., Pérez-Badia, R., and Moreno, J. M.: Increased rupture of cypress pollen type due to atmospheric water in central and southeastern Spain, Sci. Total Environ., 954, 176298, https://doi.org/10.1016/j.scitotenv.2024.176298, 2024.
Burkart, J., Gratzl, J., Seifried, T. M., Bieber, P., and Grothe, H.: Isolation of subpollen particles (SPPs) of birch: SPPs are potential carriers of ice nucleating macromolecules, Biogeosciences, 18, 5751–5765, https://doi.org/10.5194/bg-18-5751-2021, 2021.
Calderón, S. M., Tonttila, J., Buchholz, A., Joutsensaari, J., Komppula, M., Leskinen, A., Hao, L., Moisseev, D., Pullinen, I., Tiitta, P., Xu, J., Virtanen, A., Kokkola, H., and Romakkaniemi, S.: Aerosol–stratocumulus interactions: towards a better process understanding using closures between observations and large eddy simulations, Atmos. Chem. Phys., 22, 12417–12441, https://doi.org/10.5194/acp-22-12417-2022, 2022.
Dahl, Å., Galán, C., Hajkova, L., Pauling, A., Sikoparija, B., Smith, M., and Vokou, D.: The Onset, Course and Intensity of the Pollen Season, in Allergenic Pollen, edited by: Sofiev, M. and Bergmann, K.-C., 29–70 pp., Springer Netherlands, Dordrecht, https://doi.org/10.1007/978-94-007-4881-1_3, 2013.
Dreischmeier, K., Budke, C., Wiehemeier, L., Kottke, T., and Koop, T.: Boreal pollen contain ice-nucleating as well as ice-binding “antifreeze” polysaccharides, Sci. Rep., 7, 1–13, https://doi.org/10.1038/srep41890, 2017.
Duan, P., Hu, W., Wu, Z., Bi, K., Zhu, J., and Fu, P.: Ice nucleation activity of airborne pollen: A short review of results from laboratory experiments, Atmos. Res., 285, 106659, https://doi.org/10.1016/j.atmosres.2023.106659, 2023.
Emmerson, K. M., Silver, J. D., Thatcher, M., Wain, A., Jones, P. J., Dowdy, A., Newbigin, E. J., Picking, B. W., Choi, J., Ebert, E., and Bannister, T.: Atmospheric modelling of grass pollen rupturing mechanisms for thunderstorm asthma prediction, PLoS One, 16, 1–21, https://doi.org/10.1371/journal.pone.0249488, 2021.
Feingold, G., Cotton, W. R., Kreidenweis, S. M., and Davis, J. T.: The impact of giant cloud condensation nuclei on drizzle formation in stratocumulus: Implications for cloud radiative properties, J. Atmos. Sci., 56, 4100–4117, https://doi.org/10.1175/1520-0469(1999)056<4100:TIOGCC>2.0.CO;2, 1999.
Gregory, P. H.: The microbiology of the atmosphere, edited by: Polunin, N., Leonard Hill Books Limited/Interscience publishers, Inc., London/New York, 251 pp., https://doi.org/10.5962/bhl.title.7291, 1961.
Griffiths, P. T., Borlace, J. S., Gallimore, P. J., Kalberer, M., Herzog, M., and Pope, F. D.: Hygroscopic growth and cloud activation of pollen: A laboratory and modelling study, Atmos. Sci. Lett., 13, 289–295, https://doi.org/10.1002/asl.397, 2012.
Gute, E. and Abbatt, J. P. D.: Oxidative Processing Lowers the Ice Nucleation Activity of Birch and Alder Pollen, Geophys. Res. Lett., 45, 1647–1653, https://doi.org/10.1002/2017GL076357, 2018.
Gute, E. and Abbatt, J. P. D.: Ice nucleating behavior of different tree pollen in the immersion mode, Atmos. Environ., 231, 117488, https://doi.org/10.1016/j.atmosenv.2020.117488, 2020.
Gute, E., David, R. O., Kanji, Z. A., and Abbatt, J. P. D.: Ice Nucleation Ability of Tree Pollen Altered by Atmospheric Processing, ACS Earth Sp. Chem., 4, 2312–2319, https://doi.org/10.1021/acsearthspacechem.0c00218, 2020.
Hallett, J. and Mossop, S. C.: Production of secondary ice particles during the riming process, Nature, 249, 26–28, https://doi.org/10.1038/249026a0, 1974.
Hoose, C. and Möhler, O.: Heterogeneous ice nucleation on atmospheric aerosols: a review of results from laboratory experiments, Atmos. Chem. Phys., 12, 9817–9854, https://doi.org/10.5194/acp-12-9817-2012, 2012.
Hoose, C., Kristjánsson, J. E., Chen, J. P., and Hazra, A.: A classical-theory-based parameterization of heterogeneous ice nucleation by mineral dust, soot, and biological particles in a global climate model, J. Atmos. Sci., 67, 2483–2503, https://doi.org/10.1175/2010JAS3425.1, 2010.
Houghton, H. G.: Problems Connected with the Condensation and Precipitation Processes in the Atmosphere*, B. Am. Meteorol. Soc., 19, 152–159, https://doi.org/10.1175/1520-0477-19.4.152, 1938.
Jackson, S. T. and Lyford, M. E.: Pollen dispersal models in Quaternary plant ecology: Assumptions, parameters, and prescriptions, Bot. Rev., 65, 39–75, https://doi.org/10.1007/BF02856557, 1999.
Kokkola, H., Korhonen, H., Lehtinen, K. E. J., Makkonen, R., Asmi, A., Järvenoja, S., Anttila, T., Partanen, A.-I., Kulmala, M., Järvinen, H., Laaksonen, A., and Kerminen, V.-M.: SALSA – a Sectional Aerosol module for Large Scale Applications, Atmos. Chem. Phys., 8, 2469–2483, https://doi.org/10.5194/acp-8-2469-2008, 2008.
Kokkola, H., Kühn, T., Laakso, A., Bergman, T., Lehtinen, K. E. J., Mielonen, T., Arola, A., Stadtler, S., Korhonen, H., Ferrachat, S., Lohmann, U., Neubauer, D., Tegen, I., Siegenthaler-Le Drian, C., Schultz, M. G., Bey, I., Stier, P., Daskalakis, N., Heald, C. L., and Romakkaniemi, S.: SALSA2.0: The sectional aerosol module of the aerosol–chemistry–climate model ECHAM6.3.0-HAM2.3-MOZ1.0, Geosci. Model Dev., 11, 3833–3863, https://doi.org/10.5194/gmd-11-3833-2018, 2018.
Linkosalo, T., Le Tortorec, E., Prank, M., Pessi, A. M., and Saarto, A.: Alder pollen in Finland ripens after a short exposure to warm days in early spring, showing biennial variation in the onset of pollen ripening, Agr. Forest Meteorol., 247, 408–413, https://doi.org/10.1016/j.agrformet.2017.08.030, 2017.
Petters, M. D. and Kreidenweis, S. M.: A single parameter representation of hygroscopic growth and cloud condensation nucleus activity, Atmos. Chem. Phys., 7, 1961–1971, https://doi.org/10.5194/acp-7-1961-2007, 2007.
Prank, M., Tonttila, J., Shang, X., Romakkaniemi, S., and Raatikainen, T.: Data and code for the manuscript “Can pollen affect precipitation?” by Prank et al., INVENIO [data set, code], https://doi.org/10.57707/fmi-b2share.5b37722cc31d4b8c9edfeca6a8dd88f6, 2024.
Pummer, B. G., Bauer, H., Bernardi, J., Bleicher, S., and Grothe, H.: Suspendable macromolecules are responsible for ice nucleation activity of birch and conifer pollen, Atmos. Chem. Phys., 12, 2541–2550, https://doi.org/10.5194/acp-12-2541-2012, 2012.
Ranta, H. and Satri, P.: Synchronized inter-annual fluctuation of flowering intensity affects the exposure to allergenic tree pollen in North Europe, Grana, 46, 274–284, https://doi.org/10.1080/00173130701653079, 2007.
Rantio-Lehtimäki, A., Helander, M. L., and Pessi, A. M.: Circadian periodicity of airborne pollen and spores; significance of sampling height, Aerobiologia (Bologna), 7, 129–135, https://doi.org/10.1007/BF02270681, 1991.
Rantio-Lehtimaki, A., Viander, M., and Koivikko, A.: Airborne birch pollen antigens in different particle sizes, Clin. Exp. Allergy, 24, 23–28, https://doi.org/10.1111/j.1365-2222.1994.tb00912.x, 1994.
Schäppi, G. F., Suphioglu, C., Taylor, P. E., and Knox, R. B.: Concentrations of the major birch tree allergen Bet v 1 in pollen and respirable fine particles in the atmosphere, J. Allergy Clin. Immunol., 100, 656–661, https://doi.org/10.1016/S0091-6749(97)70170-2, 1997.
Seifert, A., Blahak, U., and Buhr, R.: On the analytic approximation of bulk collision rates of non-spherical hydrometeors, Geosci. Model Dev., 7, 463–478, https://doi.org/10.5194/gmd-7-463-2014, 2014.
Seinfeld, J. H. and Pandis, S. N.: Atmospheric physics and chemistry: from air pollution to climate change. New York (NY): John Wiley & Sons, 1998.
Skjøth, C. A., Šikoparija, B., Jäger, S., and EAN-Network: Pollen Sources, in Allergenic Pollen: A Review of the Production, Release, Distribution and Health Impacts, edited by: Sofiev, M. and Bergmann, K.-C., 9–27 pp., Springer Netherlands, Dordrecht, https://doi.org/10.1007/978-94-007-4881-1, 2013.
Steiner, A. L., Brooks, S. D., Deng, C., Thornton, D. C. O., Pendleton, M. W., and Bryant, V.: Pollen as atmospheric cloud condensation nuclei, Geophys. Res. Lett., 42, 3596–3602, https://doi.org/10.1002/2015GL064060, 2015.
Stevens, B. and Seifert, A.: Understanding macrophysical outcomes of microphysical choices in simulations of shallow cumulus convection, J. Meteorol. Soc. Japan, 86A, 143–162, https://doi.org/10.2151/jmsj.86A.143, 2008.
Stevens, B., Moeng, C. H., and Sullivan, P. P.: Large-eddy simulations of radiatively driven convection: Sensitivities to the representation of small scales, J. Atmos. Sci., 56, 3963–3984, https://doi.org/10.1175/1520-0469(1999)056<3963:LESORD>2.0.CO;2, 1999.
Stevens, B., Moeng, C. H., Ackerman, A. S., Bretherton, C. S., Chlond, A., de Roode, S., Edwards, J., Golaz, J. C., Jiang, H., Khairoutdinov, M., Kirkpatrick, M. P., Lewellen, D. C., Lock, A., Müller, F., Stevens, D. E., Whelan, E., and Zhu, P.: Evaluation of large-eddy simulations via observations of nocturnal marine stratocumulus, Mon. Weather Rev., 133, 1443–1462, https://doi.org/10.1175/MWR2930.1, 2005.
Stone, E. A., Mampage, C. B. A., Hughes, D. D., and Jones, L. M.: Airborne sub-pollen particles from rupturing giant ragweed pollen, Aerobiologia (Bologna), 37, 625–632, https://doi.org/10.1007/s10453-021-09702-x, 2021.
Suphioglu, C., Singh, M. B., Taylor, P., Knox, R. B., Bellomo, R., Holmes, P., and Puy, R.: Mechanism of grass-pollen-induced asthma, Lancet, 339, 569–572, https://doi.org/10.1016/0140-6736(92)90864-Y, 1992.
Taylor, P. E., Flagan, R. C., Miguel, A. G., Valenta, R., and Glovsky, M. M.: Birch pollen rupture and the release of aerosols of respirable allergens, Clin. Exp. Allergy, 34, 1591–1596, https://doi.org/10.1111/j.1365-2222.2004.02078.x, 2004.
Tonttila, J., Maalick, Z., Raatikainen, T., Kokkola, H., Kühn, T., and Romakkaniemi, S.: UCLALES–SALSA v1.0: a large-eddy model with interactive sectional microphysics for aerosol, clouds and precipitation, Geosci. Model Dev., 10, 169–188, https://doi.org/10.5194/gmd-10-169-2017, 2017.
Tonttila, J., Afzalifar, A., Kokkola, H., Raatikainen, T., Korhonen, H., and Romakkaniemi, S.: Precipitation enhancement in stratocumulus clouds through airborne seeding: sensitivity analysis by UCLALES-SALSA, Atmos. Chem. Phys., 21, 1035–1048, https://doi.org/10.5194/acp-21-1035-2021, 2021.
VanZanten, M. C., Stevens, B., Nuijens, L., Siebesma, A. P., Ackerman, A. S., Burnet, F., Cheng, A., Couvreux, F., Jiang, H., Khairoutdinov, M., Kogan, Y., Lewellen, D. C., Mechem, D., Nakamura, K., Noda, A., Shipway, B. J., Slawinska, J., Wang, S., and Wyszogrodzki, A.: Controls on precipitation and cloudiness in simulations of trade-wind cumulus as observed during RICO, J. Adv. Model. Earth Syst., 3, M06001, https://doi.org/10.1029/2011MS000056, 2011.
Werchner, S., Gute, E., Hoose, C., Kottmeier, C., Pauling, A., Vogel, H., and Vogel, B.: When Do Subpollen Particles Become Relevant for Ice Nucleation Processes in Clouds?, J. Geophys. Res.-Atmos., 127, 1–14, https://doi.org/10.1029/2021JD036340, 2022.
Wieland, F., Bothen, N., Schwidetzky, R., Seifried, T. M., Bieber, P., Pöschl, U., Meister, K., Bonn, M., Fröhlich-Nowoisky, J., and Grothe, H.: Aggregation of ice-nucleating macromolecules from Betula pendula pollen determines ice nucleation efficiency, EGUsphere [preprint], https://doi.org/10.5194/egusphere-2024-752, 2024.
Wozniak, M. C., Solmon, F., and Steiner, A. L.: Pollen Rupture and Its Impact on Precipitation in Clean Continental Conditions, Geophys. Res. Lett., 45, 7156–7164, https://doi.org/10.1029/2018GL077692, 2018.
Zhang, Y., Subba, T., Matthews, B. H., Pettersen, C., Brooks, S. D., and Steiner, A. L.: Effects of pollen on hydrometeors and precipitation in a convective system, JGR Atmos., 129, e2023JD039891, https://doi.org/10.1029/2023JD039891, 2024.
Zhou, Q.: Relative Humidity Induced Plant Pollen Grain Rupture and Conceptual Model Development, Washington State University, 57 pp., https://hdl.handle.net/2376/101522 (last access: 23 December 2024), 2014.


