the Creative Commons Attribution 4.0 License.
the Creative Commons Attribution 4.0 License.
 | 09 Dec 2025
Measurement report: Mobile measurements to estimate urban methane emissions in Tokyo
Yukio Terao
Masahito Ueyama
Satoshi Kameyama
Mark Lunt
James Lawrence France
To investigate distributions and magnitudes of methane (CH4) emissions in Tokyo, the world's largest megacity, a vehicle-based mobile measurement was set up and 3-week measurement campaign was conducted in September to October 2023. As part of the campaign, we conducted a control release experiment to link downwind excess CH4 values to CH4 emission rate at the source. The empirical equation derived from the experiment was significantly different from those reported by previous studies, suggesting the limitation of such enhancement-to-emission rate conversion, which is a source of large uncertainty in estimating urban CH4 emissions based on street-level measurements. The uncertainty stems from different experiment settings and underlying assumptions (e.g., source distance and height) which do not always represent actual urban measurement environments. The mobile measurement campaign covered a large extent of the Greater Tokyo Area with total driving distance of over 2000 km. Locations of CH4 enhancement were identified and C2H6-to-CH4 enhancement ratios were determined for individual locations to categorize them into biogenic, fossil fuel and combustion CH4 sources. Among a total of 565 locations inferred as CH4 sources, 53 % and 42 % were considered as biogenic and fossil fuel origins, respectively, with the rest being minor contributions from combustion. Based on the statistics of measured CH4 excesses, CH4 emissions were estimated for the specific areas where relatively high measurement coverage was achieved. In the areas with biogenic facilities (landfill and wastewater treatment plants), our emission estimates are well correlated with local government reporting, indicating actual key contributions of the waste-sector facilities. On the other hand, in the residential areas, CH4 emissions were predominantly of fossil-fuel origin, with a magnitude comparable to the area with waste facilities. However, such fossil-fuel emissions are not accounted for in local government reporting. This result highlights the need for improved accounting of urban fossil fuel-related emissions.
- Article
(6116 KB) - Full-text XML
- Companion paper
- BibTeX
- EndNote


Methane (CH4) is a strong greenhouse gas whose atmospheric abundance has increased over the industrial era (e.g., Etheridge et al., 1998; Umezawa et al., 2022) including the recent decades (e.g., Lan et al., 2025; Umezawa et al., 2025a) due to enhanced anthropogenic emissions (e.g., Chandra et al., 2021, 2024). Because of its relatively short lifetime in the atmosphere (about a decade), reduction of CH4 emissions is effective to contribute to near-term mitigation of climate change towards the Paris Agreement goal (e.g., Collins et al., 2018). The Global Methane Pledge initiative further calls for emission reduction actions in the anthropogenic CH4 source sectors. Despite great efforts, current understanding of the CH4 budget remains incomplete from global to national scales (e.g., Chandra et al., 2021, 2024; Jackson et al., 2024; Niwa et al., 2025; Janardanan et al., 2024). Furthermore, for taking mitigation actions, accurate estimates of facility-scale emissions are needed (Varon et al., 2019; Maasakkers et al., 2022).
CH4 is emitted from various sources including wetlands, agriculture, fossil fuels and combustion. To attribute atmospheric CH4 variations to contributions from different sources, previous studies utilized simultaneous measurements of isotopes of CH4 (e.g., Quay et al., 1999; Umezawa et al., 2012; Morimoto et al., 2017; Michel et al., 2024) and other gas tracers such as carbon monoxide (CO) and ethane (C2H6) (e.g., Xiao et al., 2004; Baker et al., 2012; Simpson et al., 2012). In particular, due to coincident emissions of CH4 and C2H6 from fossil fuel sources with characteristic hydrocarbon composition (e.g., Schwietzke et al., 2014), it has been shown that C2H6 measurements are useful to evaluate CH4 emissions from oil and gas sectors (e.g., Peischl et al., 2013; Yakovitch et al., 2015).
Cities are considered to be sources of CH4 with emissions mainly from energy and waste sectors (e.g., Hopkins et al., 2016a; Takano and Ueyama, 2021). The former includes fugitive emissions associated with downstream oil and gas supply chain (refining, storage, distribution and consumption), and the latter landfills and wastewater treatment. The latter is of biogenic origin, produced from anaerobic decomposition. Although activity-based CH4 emission estimates for urban areas have been examined (Marcotullio et al., 2013; Crippa et al., 2021), observation-based methodologies for citywide verification have been still under development. Eddy covariance measurements provide accurate CH4 fluxes for footprint areas at urban sites (e.g., Helfter et al., 2016; Takano and Ueyama, 2021), but, in many cases, they represent emissions from partial areas of a large city. Atmospheric transport modelling (including inverse analysis), combined with atmospheric mole fraction variations at upwind and downwind measurement sites, also provides quantification of CH4 emissions for urban areas where atmospheric measurements and corresponding emission inventory data are available (McKain et al., 2015; Sargent et al., 2021; Saboya et al., 2022).
An increasing number of studies have examined on-street measurements using a vehicle to locate and quantify CH4 emissions in cities (Zazzeri et al., 2015; Hopkins et al., 2016b; von Fischer et al., 2017; Weller et al., 2018; Maazallahi et al., 2020; Ars et al., 2020; Xueref-Remy et al., 2020; Defratyka et al., 2021; Fernandez et al., 2022; Wietzel and Schmidt, 2023; Joo et al., 2024; Ueyama et al., 2025). These studies have shown characteristics of CH4 emissions from worldwide large cities such as London (Zazzeri et al., 2015), Los Angels (Hopkins et al., 2016b), Tronto (Ars et al., 2020), Paris (Xueref-Remy et al., 2020; Defratyka et al., 2021), Seoul (Joo et al., 2024) and Osaka (Ueyama et al., 2025), which indicated strong emissions from natural gas distribution and waste management sectors in these urban areas. Combining vehicle-based measurement data from different cities, Vogel et al. (2024) presented an analysis of natural gas leakage in Canada and European countries. Recently, Ueyama et al. (2025) conducted a vehicle-based CH4 survey in Osaka, the second largest city in Japan. As part of the joint project of Ueyama et al. (2025), this study presents analogous measurements in Tokyo, which is Japan's and currently the world's largest megacity in population (United Nations, 2019).
According to Tokyo Metropolitan Government, CH4 emissions from Tokyo Metropolis were 21 kt CH4 yr−1 for 2023, which were predominantly from waste sectors (96.0 %) with minor contributions of fuel combustion (3.3 %) and agriculture (0.8 %) (Bureau of Environment of Tokyo Metropolitan Government, 2025). When aggregated for Tokyo Metropolis, the EDGAR (Emission Database for Global Atmospheric Research) dataset shows CH4 emissions of 18 kt CH4 yr−1 for 2023, where waste, energy (including fossil fuel), and agriculture sectors constitute 45 %, 41 % and 14 % of the total emissions, respectively (Crippa et al., 2024). Given the general small decreasing trend of CH4 emissions of Tokyo (e.g., 0.5 % yr−1 in the Tokyo Metropolitan Government reporting), comparison of these datasets indicates discrepancy in magnitude and attribution of CH4 sources in Tokyo between the local government reporting and the global data commonly used in the atmospheric science community, highlighting the importance to improve activity-based CH4 emission datasets for Tokyo. In this study, we present our vehicle-based CH4 measurements in Tokyo (including instrument evaluations), data analyses to identify CH4 source locations and types, and current-best approximations of CH4 emissions for specific areas where the data allows.
2.1 Target area and measurement campaign
The Greater Tokyo Area is the world's most populated metropolitan area. According to the Japan Statistics Bureau, the Kanto Major Metropolitan Area, one of various definitions of the Greater Tokyo Area, is defined as the area that consists of all municipalities that have > 1.5 % of their population (aged 15 and above) commuting to designated cities (Chiba, Kawasaki, Sagamihara, Saitama and Yokohama) or the 23 special wards of Tokyo Metropolis. The area's population was about 38 million in 2020, according to the Census. To our knowledge, no vehicle-based measurements of CH4 and C2H6 have been ever reported within this area. In designing driving routes, we therefore prioritized coverage of large extent of the Greater Tokyo Area. In addition, particular focus was the area around the Yoyogi site (35.66° N, 139.68° E). Atmospheric CH4 mole fraction measurement (not shown in this study) is ongoing at the site located in the central part of Tokyo, with the surrounding main land cover being residential buildings (Ishidoya et al., 2020; Sugawara et al., 2021). The Tokyo Bay area was also of interest, as part of the area is occupied by Japan's two major industrial zones (Keihin and Keiyo Industrial Zones) that hold heavy industries (e.g., steel mills, oil refineries, chemical plants and electricity generation). In the area, there is also Tokyo Bay-side Landfill in the Port of Tokyo, which is the final disposal site of solid wastes from the 23 special ward areas of Tokyo. In addition, the 23 special wards have 13 wastewater treatment plants, and they were also targets of the present measurement surveys. CH4 emissions from the individual landfill and wastewater facilities are however beyond the scope of this study and will be investigated in a separate paper.
Our vehicle-based mobile measurements were conducted during daytime on 15 d (18–22 September, and 2–6, 16 and 18–21 October 2023: 14 weekdays and 1 Saturday). The measurement survey covered populated areas of Tokyo Metropolis as well as areas around the Tokyo Bay in Chiba and Kanagawa Prefectures, as shown in Fig. 1. The measurements were made on public roads only. The driving distance on each measurement day ranged from 71 to 208 km, depending on focus areas, and the total distance was 2012 km.
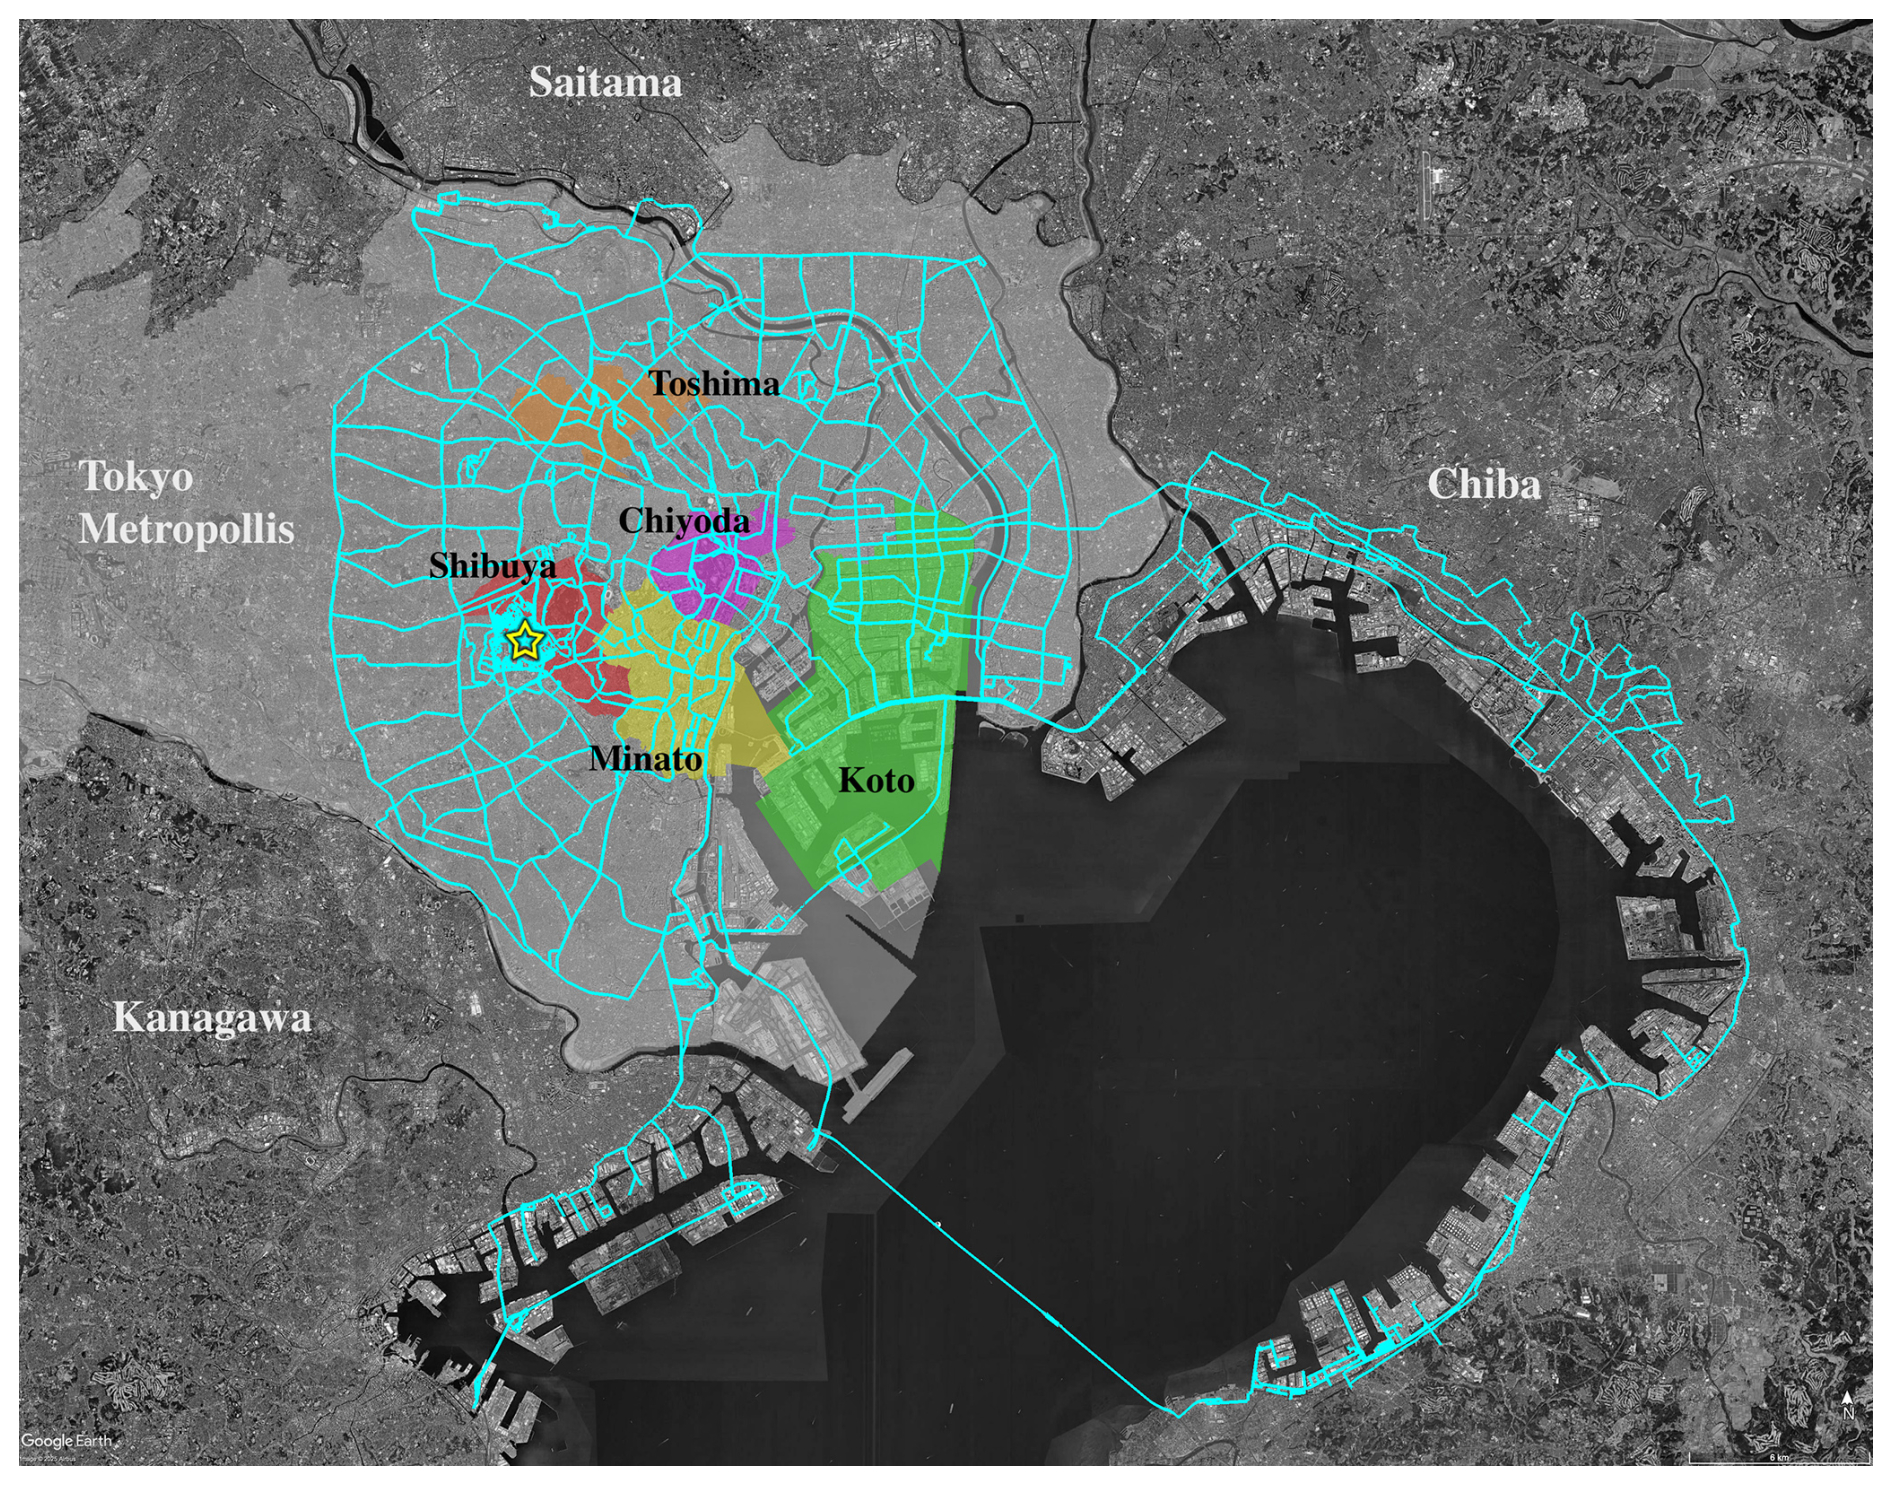
Figure 1A map showing the Greater Tokyo Area and the driving routes (light blue lines) of the measurement campaign conducted in September–October 2023. Tokyo Metropolis is shaded white and five selected special wards of Tokyo Metropolis (Chiyoda, Minato, Koto, Shibuya and Toshima) are shaded colors. A star in Shibuya Ward indicates the location of the site Yoyogi. The map imagery was from © Google Earth.
2.2 Laboratory evaluation
To measure atmospheric mole fractions of CH4 and C2H6, we used a MIRA Ultra gas analyzer (Aeris Technologies, USA). The analyzer is a mid-infrared absorption spectrometer with a multi-pass cell (60 cm3 volume). The cell pressure is maintained at ∼ 240 mbar by an internal pump. More descriptions on the analyzer were previously given in Travis et al. (2020) and Commane et al. (2023).
To determine the CH4 and C2H6 mole fractions in sample air, we prepared a suite of dry-air standard gases containing CH4 and C2H6 at ambient to urban elevated mole fraction levels, ranging approximately from 2 to 5 µmol mol−1 (hereafter denoted as ppm) for CH4 and 1 to 10 nmol mol−1 (hereafter denoted as ppb) for C2H6. These standard gases were produced gravimetrically in 9.4 L aluminum cylinders by Taiyo Nippon Sanso JFP Corporation. The CH4 and C2H6 mole fractions reported in this study are traceable to those in these standard gases. Prior to the measurements, the CH4 mole fractions in the standard gases were measured by a cavity ring-down spectroscopy analyzer (G-2401, Picarro Inc., USA). The measurements confirmed that the CH4 mole fractions in the standard gases show excellent linearity with reproducibility of < 1.0 ppb. The standard gases were also measured for C2H6 by a preconcentration and refocusing gas-chromatography mass-spectrometry (GC-MS) system (Umezawa et al., 2025b). The measurement results showed a good linearity of the standard gases with reproducibility of < 0.1 ppb.
The repeatability of the MIRA Ultra analyzer has been evaluated by Allan-Werle variance plots (e.g., Commane et al., 2023). We measured compressed air in a 47 L cylinder for about 24 h and calculated the Allan-Werle variance (not shown). The same experiment was made twice: 6–7 September 2023 and 21–22 February 2024. The first experiment was soon after delivery of the analyzer and the second was made after the modified version of the software (data acquisition frequency increased) being implemented. Repeatability of MIRA Ultra for 100 s was 0.02 ppb for CH4 and 0.004 ppb for C2H6, which were later improved to 0.007 ppb for CH4 and 0.003 ppb for C2H6. These values exceed those reported by Commane et al. (2023) for the same product.
The standard gases were measured periodically to evaluate longer-term stability of the analyzer. The instrument showed good stability during the mobile measurement campaign period in Tokyo (18 September–21 October 2023), with the measured CH4 values of the standard gases agreed to the nominal value within ∼ 5 ppb at baseline level (∼ 2 ppm). In contrast, the measured values for the standard gases with higher CH4 mole fractions (up to ∼ 5 ppm) showed differences up to ∼ 25 ppb. As this possible bias (∼ 0.025 ppm) is relatively small in comparison to the observed variability (> 1 ppm excess values with respect to the baseline), we apply no corrections for CH4 measurements during the Tokyo mobile campaign measurements. It was also shown that measured C2H6 values by MIRA Ultra varied significantly from day to day. This suggests that raw C2H6 values reported from the analyzer are not compatible among different measurement days. We however confirmed that the measurement span covered by the standard gases remained constant (for the mole fraction range approximately from 1 to 10 ppb) over the course of measurements, indicating that the excess values in the C2H6 mole fraction were robust. We therefore report excess values only for C2H6.
We evaluated two MIRA Ultra analyzers of two institutions (National Institute for Environmental Studies, NIES and Osaka Metropolitan University, OMU) for sensitivity to humidity as previously reported by Commane et al. (2023). The NIES and OMU analyzers were operated for the measurements in Tokyo (this study) and Osaka (Ueyama et al., 2025), respectively. Figure 2 displays the CH4 and C2H6 mole fraction dependence on the amount of water vapor. The mole fractions here are reported values by the instrument and applied no corrections. In this experiment, a compressed dry air was introduced into the analyzer. The air passed through a moisture exchanger (ME-110-72COMP-4, Perma Pure LLC) housed in a food container in which a humidor pack (84 % RH, Boveda Inc.) was placed. Warm up of the container increased humidity inside the container, which also increased the amount of water vapor in the sample flow of the air via the moisture exchanger. To examine response with low humidity, silica gel was placed in the container instead of the humidor pack to dry the sample air.

Figure 2Sensitivity of the CH4 (top) and C2H6 (bottom) mole fractions to the water vapor of the two MIRA Ultra analyzer of NIES (blue) and OMU (red). Note that CH4 and C2H6 mole fractions are plotted as differences from nominal values.
As shown in Fig. 2, CH4 measurement by the analyzer showed a quadratic curve (grey and black lines) expressed by:
Commane et al. (2023) reported the humidity response of the MIRA Ultra analyzer, but interestingly, their experiment indicated a different curve in shape. They reported that the CH4 value from the analyzer showed a quadratic but monotonically decreased curve with increasing humidity. In contrast, our results in Fig. 2 suggest that the measured CH4 value has a plateau at water vapor range of approximately 5000–15 000 ppm. For the NIES MIRA Ultra, in the water vapor range of 7500–18 000 ppm, the measured CH4 value falls within −0.01 ppm relative to the top of the quadratic convex curve positioned at ∼ 13 000 ppm water vapor. This implies that measurements with water vapor in the above target range would report CH4 values with better reproducibility. We therefore consider that (1) calibration of the analyzer should be made by reference gases humidified to as close as the target range, and (2) CH4 values reported by the analyzer should be corrected according to the water vapor values.
For C2H6, the measured value from the NIES MIRA Ultra showed a slight increase with increasing humidity expressed by:
In the above water vapor range (7500–18 000 ppm), the C2H6 values are expected to fall within ±0.3 ppb from the nominal value. The C2H6 values reported by the analyzer should be corrected accordingly. In contrast, the MIRA Ultra analyzer of OMU did not show a consistent trend between experiments when the water vapor was increased and decreased (Fig. 2, bottom panel). Note that measurements by OMU MIRA Ultra are not included in this study and presented in the companion paper (Ueyama et al., 2025). It should be noted that the water response curve, as presented in this study, is likely different from instrument to instrument even within the same model product MIRA Ultra; we therefore recommend careful evaluation of each analyzer for high-accuracy measurements.
2.3 Mobile measurement set-up
The vehicle-based measurement system consisted of the MIRA Ultra analyzer, a sample air inlet and connecting tubings, a GPS (Global Positioning System) receiver (16X-HVS, Garmin, USA), an anemometer (Portable Mini, Calypso Instruments, USA), a data logger (CR-1000X, Campbell Scientific, Inc., USA), and power supply. The car is equipped with the anemometer on the roof, the GPS receiver at the inner side of the front window, and the air inlet at front low part of the car (∼ 0.5 m height from the ground). Sample air is drawn by the internal pump of the MIRA Ultra instrument. Length of the tubing from the air inlet to MIRA Ultra is 6.25 m (5 m 1/8′′ OD and 1.25 m 1/4′′ OD). Power is supplied from the car power socket (+12 VDC) via a power inverter to MIRA Ultra and the data acquisition system. The main component of the data acquisition system is the data logger, which collects data from the anemometer, GPS and MIRA Ultra. Prior to measurement, a gas mixture that contains 1 % of hydrocarbons including CH4 and C2H6 was sprayed to the air inlet to measure response time from the air inlet to MIRA Ultra. The response time was 8 s in most days with only a few days of 7 or 9 s. The data were located with the response time corrected for each measurement day.
Mobile vehicle-based measurements provide CH4 mole fractions along the driving track so that emissions are indicated by enhancement from the background value. To give a preliminary estimate of CH4 emission rate simply based on enhancements of the CH4 mole fraction, we conducted a controlled CH4 emission experiment. In the experiment, CH4 outflow from a 47 L cylinder is controlled at a fixed flow rate for ∼ 10 min, and the CH4 gas is released from the downstream pipe at ∼ 5 m height from the ground. The controlled flow rate ranged from 1.0 to 15.0 NL min−1 at about 5 min intervals. The CH4 mole fraction was measured ∼ 50 m downwind by the MIRA Pico analyzer. The outlet pipe was visible from the measurement site and there was almost no obstacle that interfered wind advection in between except a mesh fence and bushes. The analyzer was subsequently calibrated by using a set of reference gases. Note that this experiment was not carried out by the MIRA Ultra analyzer, which was used in the mobile measurement campaign, but we confirmed consistency of response outputs from both analyzers within the measurement uncertainties.
The experiment was conducted on 28 July 2023. The first set of the experiment with the above varying flow rates started around 10:00 and ended around 12:30 local time (LT), and it was repeated in the afternoon approximately from 14:00 to 16:30 LT. The weather was sunny with temperatures of 31 °C in the morning and up to 34 °C in the afternoon. The easterly wind (direction of the outlet pipe to the measurement site) prevailed during the experiment with wind speed below 3 m s−1. These weather conditions agree to those typically observed at the site and in Tokyo (Japan Meteorological Agency, 2025). From time series of observed CH4 enhancements, the excess CH4 was defined as the CH4 mole fraction difference from a background value, which was calculated as the median values in the 3 min time window (±1.5 min from the individual data points). When the excess CH4 exceeded +0.05 ppm from the background, the data point was tagged. Among the tagged data points with enhanced CH4, the maximum excess CH4 value in each emission period was plotted as a function of the CH4 emission rate (Fig. 3a). The linear fit yielded the following relationship between the excess CH4 (ppm) and CH4 emission rate (g CH4 min−1):
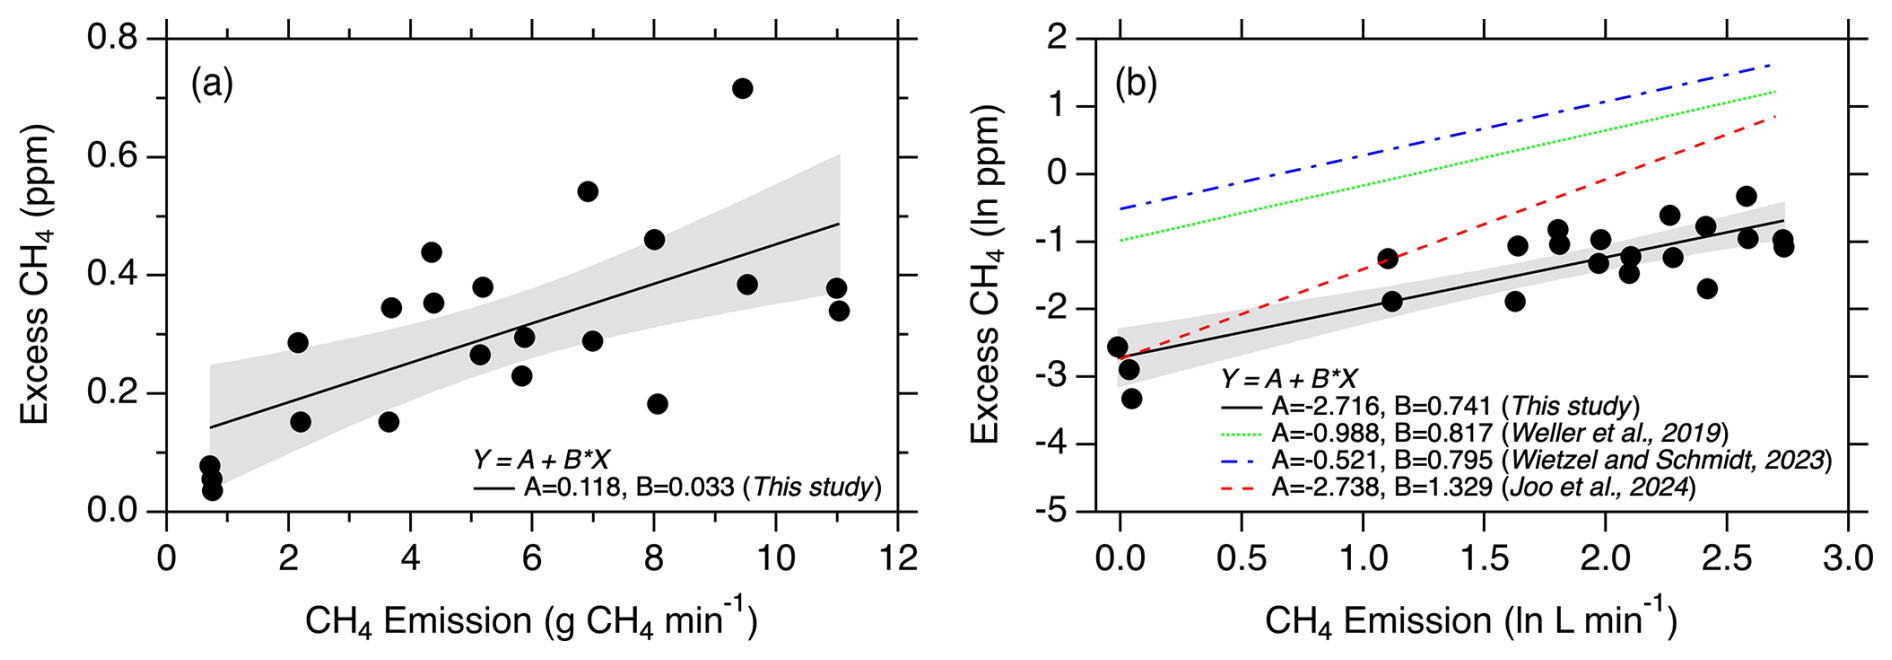
Figure 3(a) The observed maximum excess CH4 as a function of the CH4 emission rate. The original CH4 emission rate in unit NL min−1 was converted to g CH4 min−1 with the gas density of CH4 (0.717 kg m−3). (b) Same as (a), but both axes are on ln scales. Our experiment data and the linear fit are shown in black and the linear relationships suggested by Weller et al. (2019), Wietzel and Schmidt (2023) and Joo et al. (2024) are shown by green dotted, blue dash-dotted and red dashed lines, respectively. The linear regression coefficients are also shown. The grey shades indicate the 95 % confidence bands.
In Fig. 3b, the above linear relationship was converted into the natural log (ln) scales for comparison to those reported by previous studies (Weller et al., 2019; Wietzel and Schmidt, 2023; Joo et al., 2024). Our data aligned in the range of lower excess CH4 with the slope being smaller than other studies, showing that our equation gives a larger estimate of the emission rate when given a same excess CH4 value. The discrepancy may be attributable to difference in the experiment settings. Weller et al. (2019) and Wietzel and Schmidt (2023) assumed an average approximate distance between leak and measurement points to be 15.75 and 7 m, respectively. Joo et al. (2024) assumed 0 m distance between leak and measurement location, as their test experiment was conducted on a narrow driving path surrounded by buildings. In contrast, our experiment data was collected with source distance of ∼ 50 m after horizontal advection. These differences imply that distance to the source is an important factor. For the present experiment with distance of ∼ 50 m, the equation by Weller et al. (2019) and Wietzel and Schmidt (2023) could underestimate the emission rate. Comparison to Joo et al. (2024) also suggests that the slope could be considerably different depending on surrounding environment of the experiments. Furthermore, in contrast to the 5 m height of CH4 release in this study, CH4 was released from the ground in the above three studies, where detection of leakage from underground pipes was assumed. The emission height is also one of decisive initial conditions that determine how the gas disperse in space and time (e.g., Yakovitch et al., 2015). In practice, given that the actual distance of an emission from the measurement vehicle, as well as actual emission height in a city, is unknown, accurate estimation of emission magnitude (choice of a suitable equation) is challenging. Emission estimates with different equations are discussed in the companion paper (Ueyama et al., 2025).
4.1 Leak Indication (LI) and Leak Point (LP)
In this study, we identified CH4 enhancements in a similar manner to previous studies (von Fischer et al., 2017; Weller et al., 2019; Maazallahi et al., 2020; Defratyka et al., 2021; Wietzel and Schmidt 2023; Fernandez et al., 2022; Vogel et al., 2024; Ueyama et al., 2025). The baseline CH4 mole fraction was defined as the 5th percentile of all the data obtained within ±2.5 min moving time window for individual data points. Subtracting the baseline from each measurement value allowed us to determine the CH4 excess value. When the CH4 excess exceeds 0.1 ppm, the data point is tagged as a Leak Indication (LI), as visualized in Fig. 4a. We then identified a Leak Point (LP) when 5 or more consecutive data points were tagged as LIs, which means that CH4 excess values of > 0.1 ppm lasted for > 5 s at LPs, as our measurement was at 1 Hz. The central locations (latitude and longitude) and the maximum excess CH4 value among these consecutive data points were assigned to represent each LP. The C2H6 mole fraction data were processed in the same manner to determine the C2H6 excess. To avoid possible influence from the vehicle exhaust, the data points with vehicle speed less than 1.5 km h−1 was excluded.
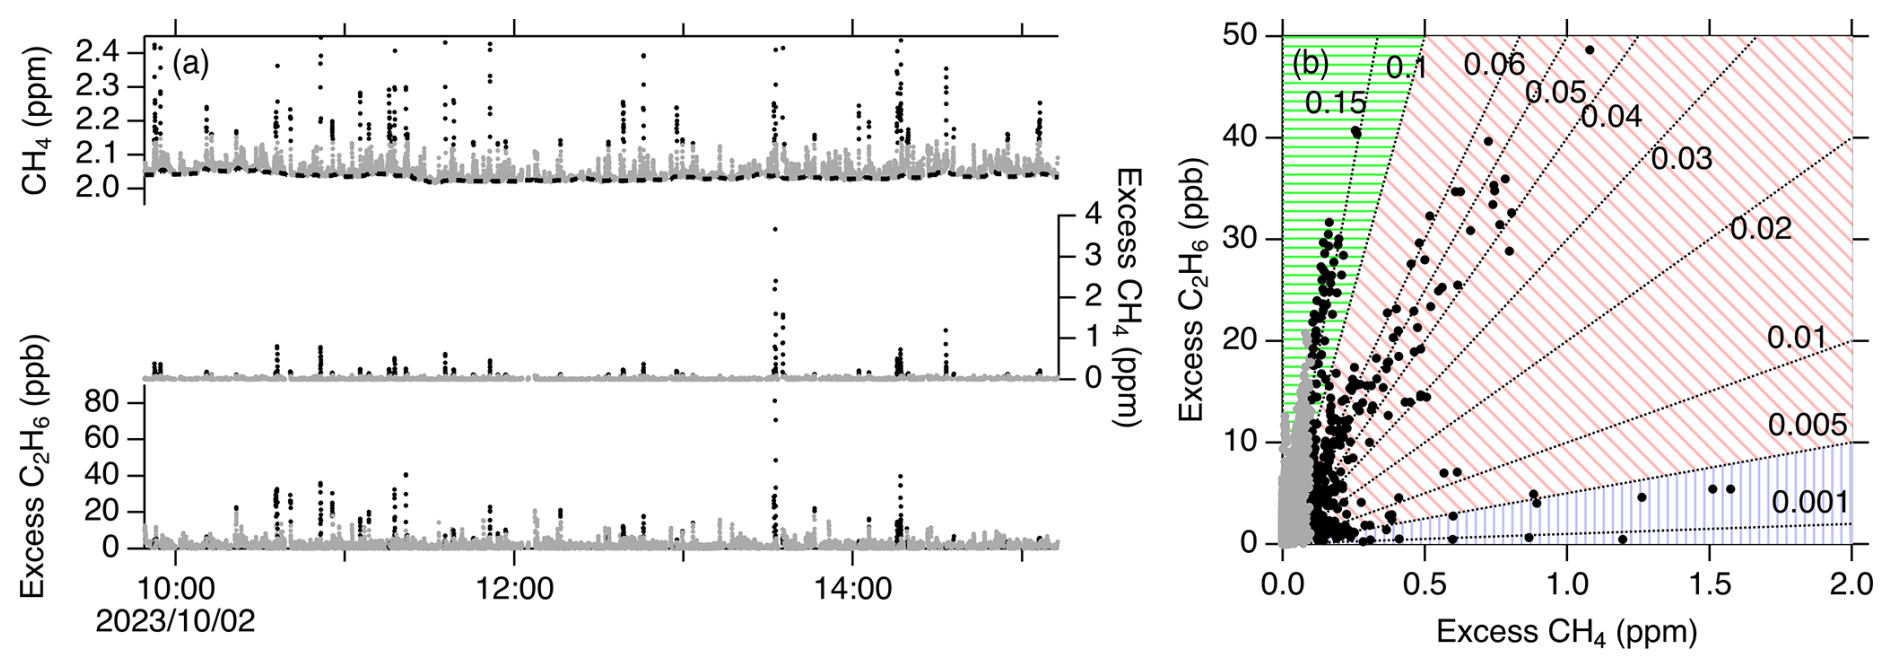
Figure 4(a) An example of the Leak Indication (LI) methodology applied for the data obtained on 2 October 2023. The measured CH4 mole fraction (top), excess CH4 (middle) and excess C2H6 (bottom) on the driving vehicle are shown. The baseline CH4 mole fraction was calculated as the 5th percentiles of the measurement data within ±2.5 min moving time window (black dashed line) and the excess values were determined as deviations from the baseline. The excess C2H6 was calculated in the same manner. The data points identified as LI (the excess CH4 of > 0.1 ppm) are shown by black dots, while other data are coloured grey. (b) Scatterplots of excess CH4 and C2H6 values for the data in panel (a). The data points are coloured in the same manner. Black dotted lines indicate slopes corresponding to different ratios (ppm ppm−1) and each Leak Point (LP) was classified into biogenic (blue vertical-line area), fossil fuel (red slant-line area) and combustion (green horizontal-line area) sources accordingly.
It is noted that our threshold (0.1 ppm) is same as that in our companion paper (Ueyama et al., 2025), similar to that applied for measurements in German cities (5 % by Wietzel and Schmidt, 2023) and smaller than that for measurements in Paris, France (0.5 ppm by Defratyka et al., 2021) and Bucharest, Romania (0.2 ppm by Fernandez et al., 2022). In this regard, we found that the magnitude of CH4 excess was generally smaller in the Tokyo area than in US and Europe cities, and the threshold (0.1 ppm) was appropriate for effective detection of LI as a CH4 emitting location. For instance, a higher threshold of 0.2 ppm would miss ∼ 60 % of LPs with smaller enhancements. In contrast, a lower threshold of 0.05 ppm would more than double the LP counts, but, due to comparable magnitudes of the observed baseline CH4 variability, the LP detection would entail larger uncertainty. As shown in Fig. 5, the LPs with excess CH4 < 0.2 ppm comprise 41 % of all the LPs found during the measurement campaign. About 93 % of the LPs fell in the range of excess CH4 values of < 1 ppm. On the other hand, we detected 28 LPs (5 %) exceeding excess CH4 of 2 ppm with maximum of 19.8 ppm, of which 23 and 5 LPs were classified as biogenic and fossil fuel sources (see Sect. 5).
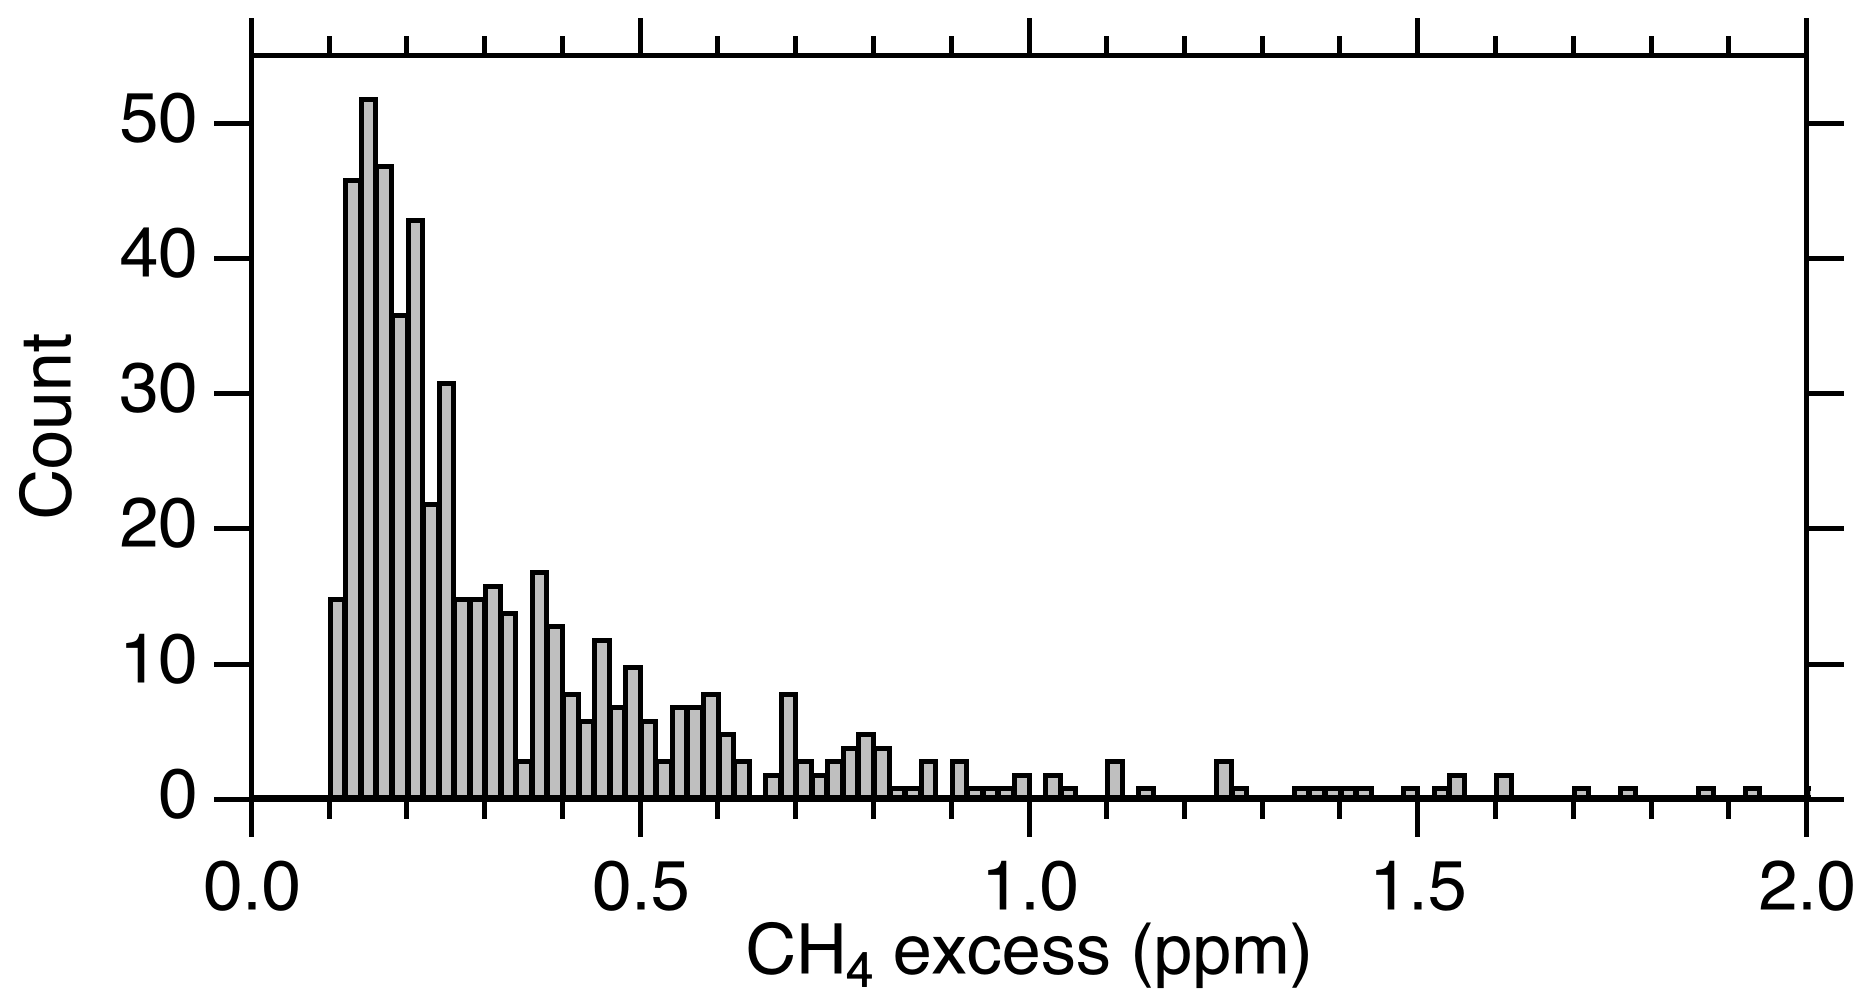
Figure 5Histogram of the excess CH4 values of all the LPs observed during the measurement campaign. Note that data points with excess CH4 of < 0.1 ppm were excluded in the data processing, and that 5 % of LPs (N = 28) exceeded excess CH4 of 2 ppm (see text).
4.2 C2H6 to CH4 ratio (C2 C1 ratio) and source classification
As shown in Fig. 4a and b, we observed coincident increases of CH4 and C2H6 mole fractions, and their enhancement ratio varied at different LPs. We determined C2H6-to-CH4 enhancement ratios ( ratio) for individual LPs. The ratio was used for source attribution of each LP according to the source classification by Fernandez et al. (2022); LPs with the ratio of < 0.005, 0.005–0.1 and > 0.1 are attributed to biogenic, fossil fuel and combustion sources, respectively. Note that the gas composition reported by the local gas company corresponds to the ratio of 0.063. For the measurement day shown in Fig. 4, we have clusters of the data categorized into biogenic (< 0.005), fossil fuel ( ∼ 0.05) and combustion ( ∼ 0.15).
Figure 6 presents LP locations identified during the measurement campaign. When classified into emission magnitude categories by previous studies (von Fischer et al., 2017; Fernandez et al., 2022; Ueyama et al., 2025), 531 (94 %) LPs were identified as low emissions (excess CH4 of < 1.6 ppm or < 6 L min−1 emission calculated by equation Weller et al., 2019), while 30 and 4 LPs were considered as medium (intermediate of low and high categories) and high (> 7.6 ppm or > 40 L min−1) emissions, respectively. Among the 4 LPs of the high emission category, 3 of them were found near wastewater treatment plants and the rest was in a residential area (see below). The LPs were also grouped into three source categories (biogenic, fossil fuel and combustion) according to the ratio as described in Sect. 4.2. Among 565 LPs identified during the whole measurement period, 300 LPs (53 %) were attributed to biogenic sources with little enhancement in C2H6, while 235 (42 %) and 30 (5 %) LPs were classified into fossil fuel and combustion origins, respectively. In this study, due to the very limited number of the combustion LPs, our analysis below mainly addresses biogenic and fossil fuel sources.
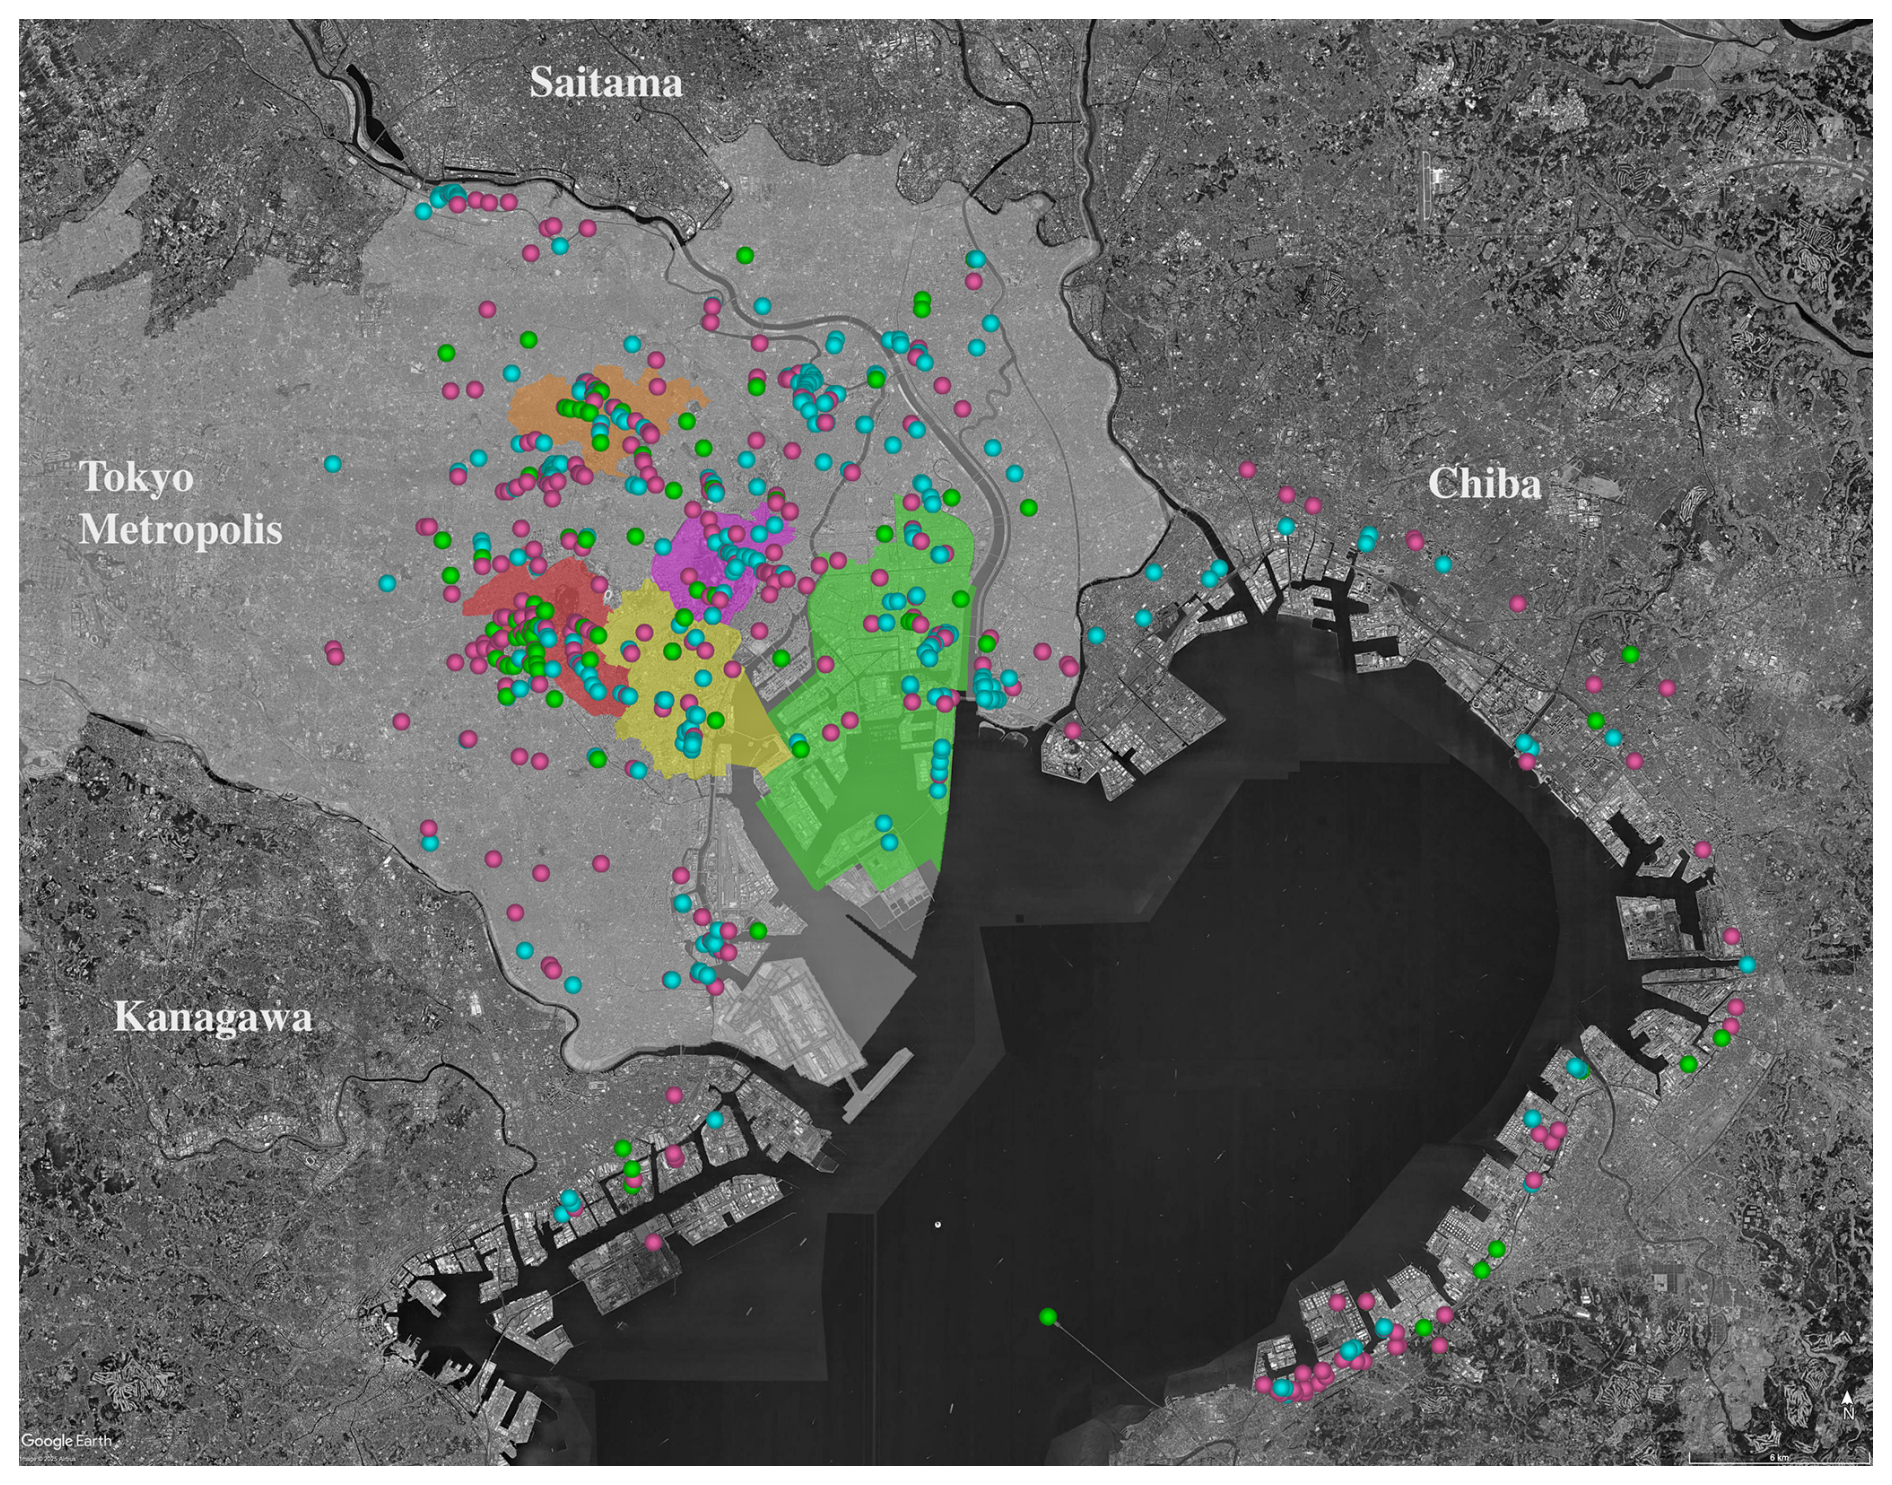
Figure 6Overview of the Leak Point (LP) locations for all the measurement days. The LP locations are indicated by circles and categorized by the observed ratios: blue for biogenic, pink for fossil fuel, and green for combustion sources. Areas are shaded same as Fig. 1. The map imagery was from © Google Earth.
All the measurement data points were classified into different survey areas: 23 special wards of Tokyo Metropolis, Chiba and Kanagawa Prefectures. Maximum excess CH4 values at LPs in different areas are shown in Fig. 7. Relatively high CH4 excesses were found mainly in the special wards of Tokyo Metropolis, although some smaller enhancements were detected also in the bay areas of Chiba and Kanagawa Prefectures. In the bay areas of Chiba, 28 biogenic LPs, 38 fossil fuel LPs, and 7 combustion LPs were found. The biogenic and fossil fuel LPs with the highest CH4 excesses of 1.44 and 2.27 ppm, respectively, were located in the southern part of Keiyo Industrial Zone. In the bay area of Kanagawa (Keihin Industrial Zone), 3 biogenic LPs, 9 fossil fuel LPs, and 2 combustion LPs were found. The CH4 excesses were at most 0.29 and 0.48 ppm for biogenic and fossil fuel LPs, respectively. In Tokyo Metropolis, we found large CH4 enhancements such as biogenic LPs in Minato, Shinjuku, Sumida, Koto, Ota, Arakawa, Katsushika and Edogawa Wards as well as fossil fuel LPs in Shibuya and Toshima Wards. In these areas, many of biogenic LPs with large CH4 enhancements (> 1 ppm) were detected downwind of wastewater treatment plants, indicating importance of the large facilities in CH4 emissions in Greater Tokyo Area. Below we address characterization of overview from the campaign measurements with focus on quantification of areal emissions. Detailed analysis of emissions from individual known CH4 sources, such as the landfill site and wastewater treatment plants will be presented in a separate follow-up study.
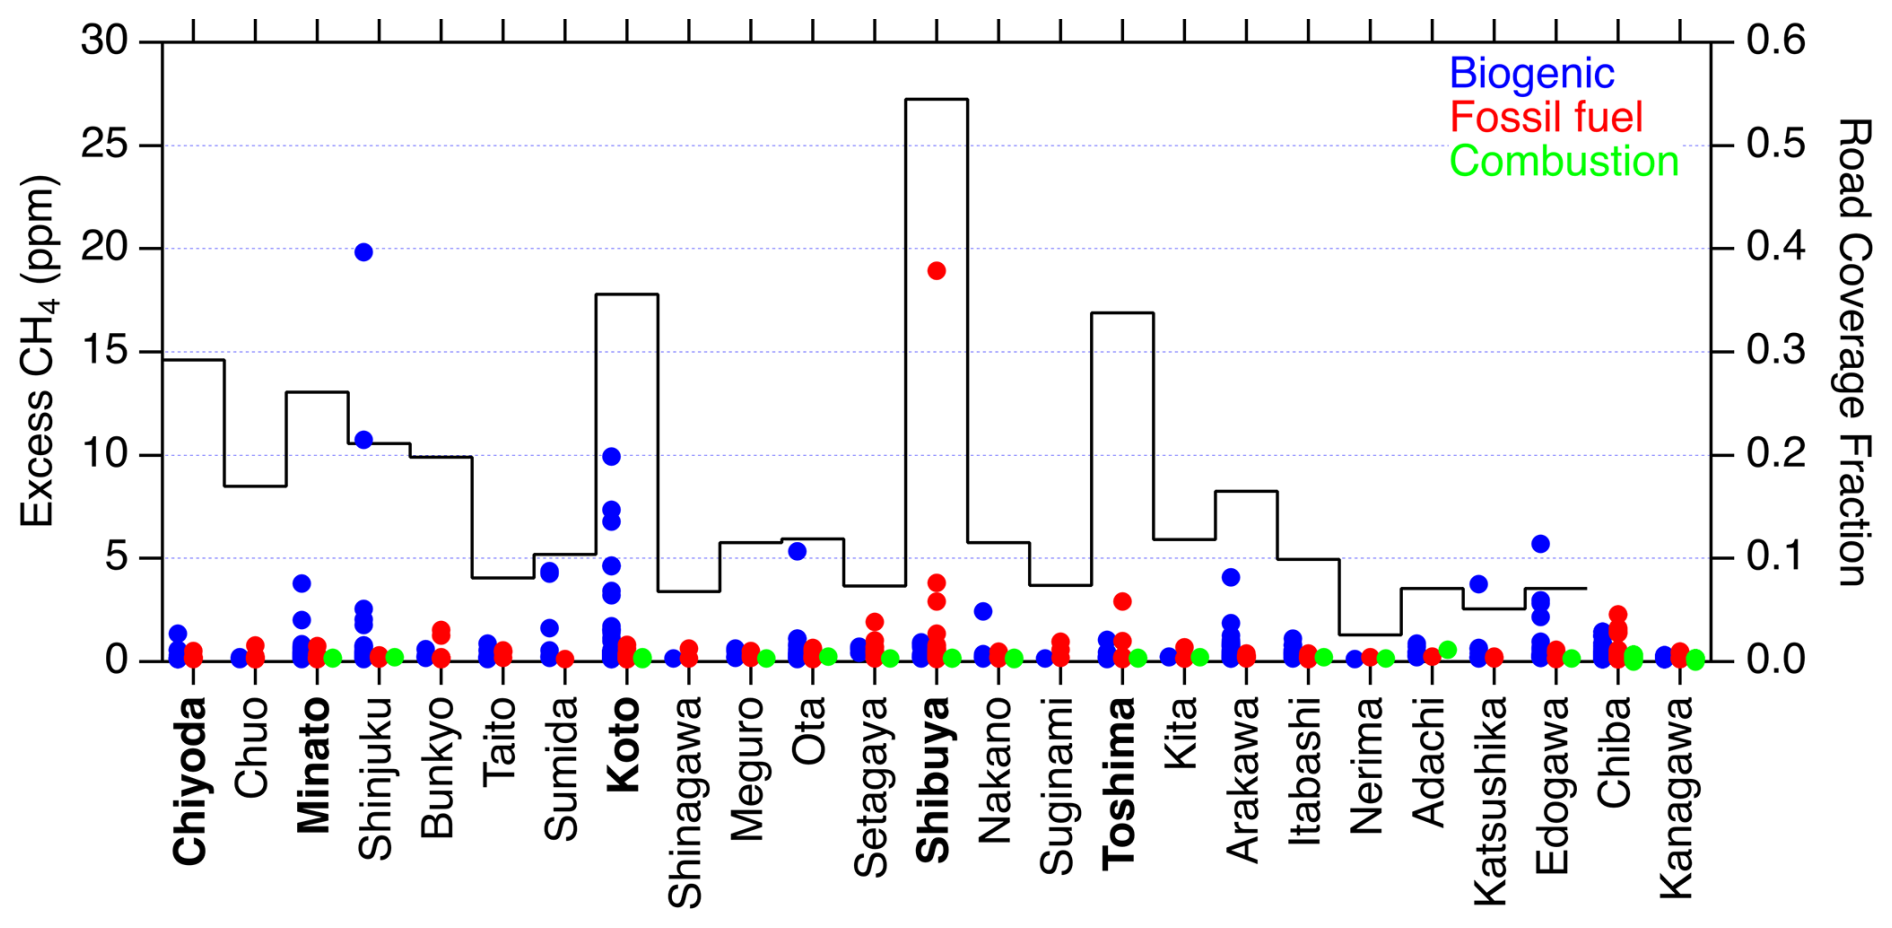
Figure 7Excess CH4 values at the LP locations observed in the 23 special wards of Tokyo, Chiba and Kanagawa Prefectures grouped into the three source categories: biogenic (blue circles), fossil fuel (red squares) and combustion (green triangles) sources. Coverage of road distance in each area is also shown by black solid line (right axis), although not applicable to Chiba and Kanagawa Prefectures due to very limited road coverage. Five selected special wards are in bold.
5.1 Characterization of LPs for different wards of Tokyo
Table 1 summarizes relevant statistics and the observed appearances of LPs for 5 selected wards. We note that the road distance covered by the present measurement campaign was only ∼ 12 % of the total roads of Tokyo Metropolis. The coverage for each ward ranged from 2.6 % to 54.5 % (see Fig. 7). As shown in Table 1, the best coverage was in Shibuya Ward, followed by Toshima, Koto, Chiyoda and Minato Wards (> 25 %). Among 469 LPs found in Tokyo Metropolis, count of LPs ranged from 17 to 66 in these 5 wards, which correspond to LP densities from 0.16 to 0.47 km−1. The LP density is count of LPs per travel distance and indicate average frequency of CH4 enhancement encounters in a target city (Vogel et al., 2024; Ueyama et al., 2025). When grouped into source categories, biogenic and fossil fuel LP densities ranged from 0.07 to 0.35 km−1 and from 0.08 to 0.20 km−1, respectively. The average LP density in Tokyo Metropolis (0.33 km−1) is comparable to that observed in Osaka (0.39 km−1), the second largest city of Japan (Ueyama et al., 2025). When classified by source categories, the average LP densities of biogenic and fossil fuel origins in Tokyo were 0.18 and 0.13 km−1, respectively, in comparison to 0.13 and 0.24 km−1 in Osaka. Vogel et al. (2024) presented comparisons of leak indication densities across cities in Europe and North America. Although not exactly compared due to differences in data processing, the fossil fuel LP density in Tokyo is apparently as large as those of most European cities with relatively small numbers of leak indications (roughly from Barcelona to Groningen in Fig. 2 of Vogel et al., 2024). Note that we counted CH4 enhancements of > 0.1 ppm, which falls between thresholds used in the two classification methods of Vogel et al. (2024).
Table 1Measurement statistics and relevant information of the selected 5 wards of Tokyo Metropolis including road distances covered by the present measurements, areas and observed counts of LPs. The numbers in brackets in the column “Biogenic” show LP counts in the proximities of biogenic facilities (landfill and wastewater treatment plants).
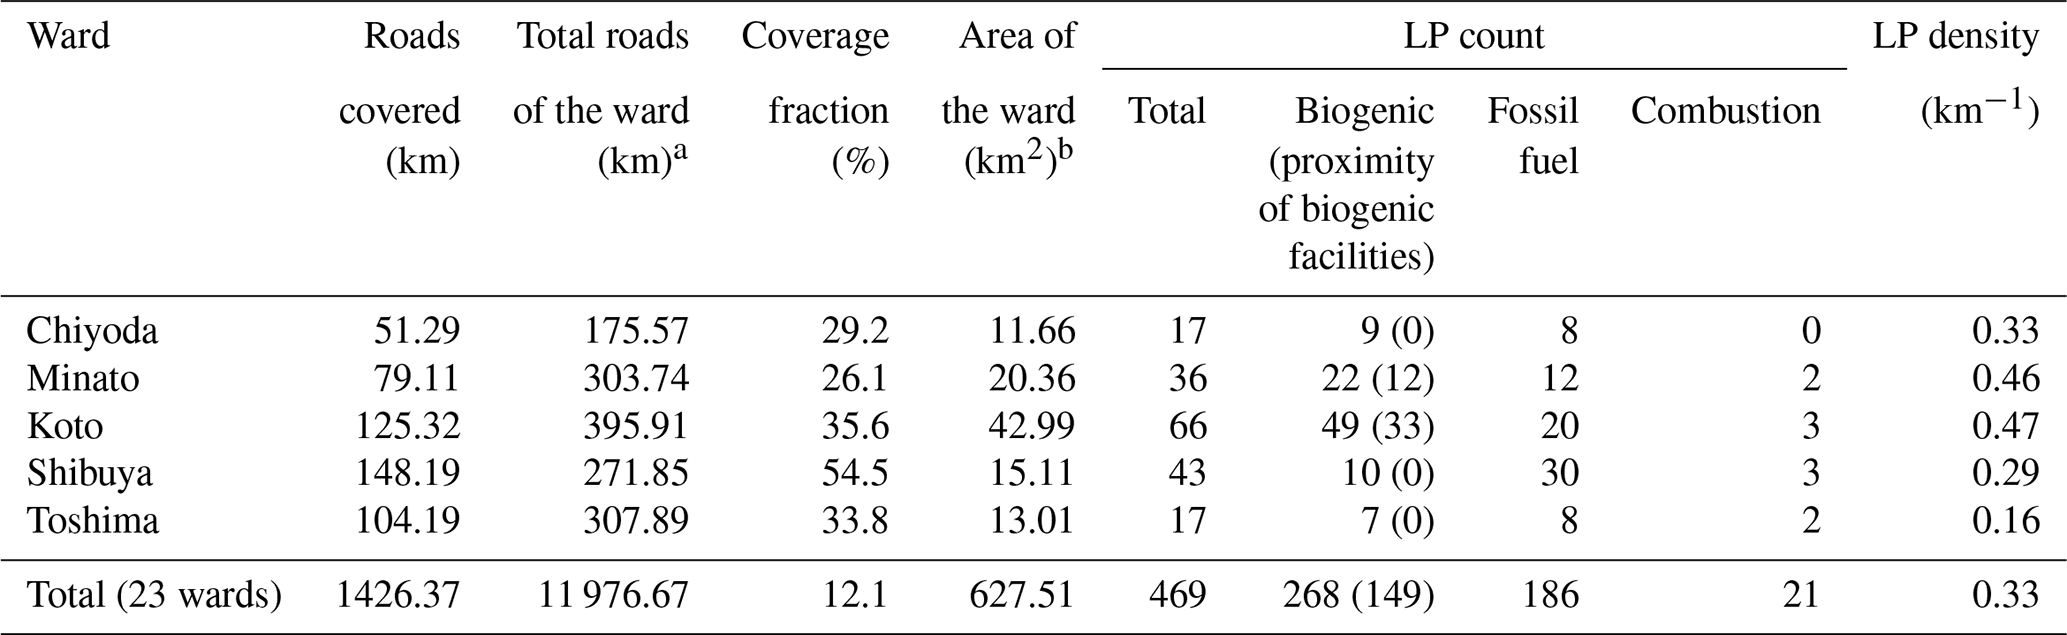
a Bureau of Construction of Tokyo Metropolitan Government (2025).
b Tokyo Metropolitan Government (2025).
We analysed the observed frequency of the ratio in each ward. In many wards, as represented by Minato and Koto Wards, ratios close to zero (i.e., biogenic sources) were observed most frequently (Fig. 8). In contrast, Shibuya Ward showed distinct characteristics of the ratio with the highest frequency at ∼ 0.05, which is likely to correspond to fossil fuel sources. As a result, about three quarters of the LP counts in Shibuya Ward was attributed to the fossil fuel source (Table 1). Toshima and Chiyoda Wards also showed that about half of LPs was attributed to fossil fuel, although number of LPs were limited. The appearance of combustion LPs ( ratio of > 0.1) was minor for all areas.
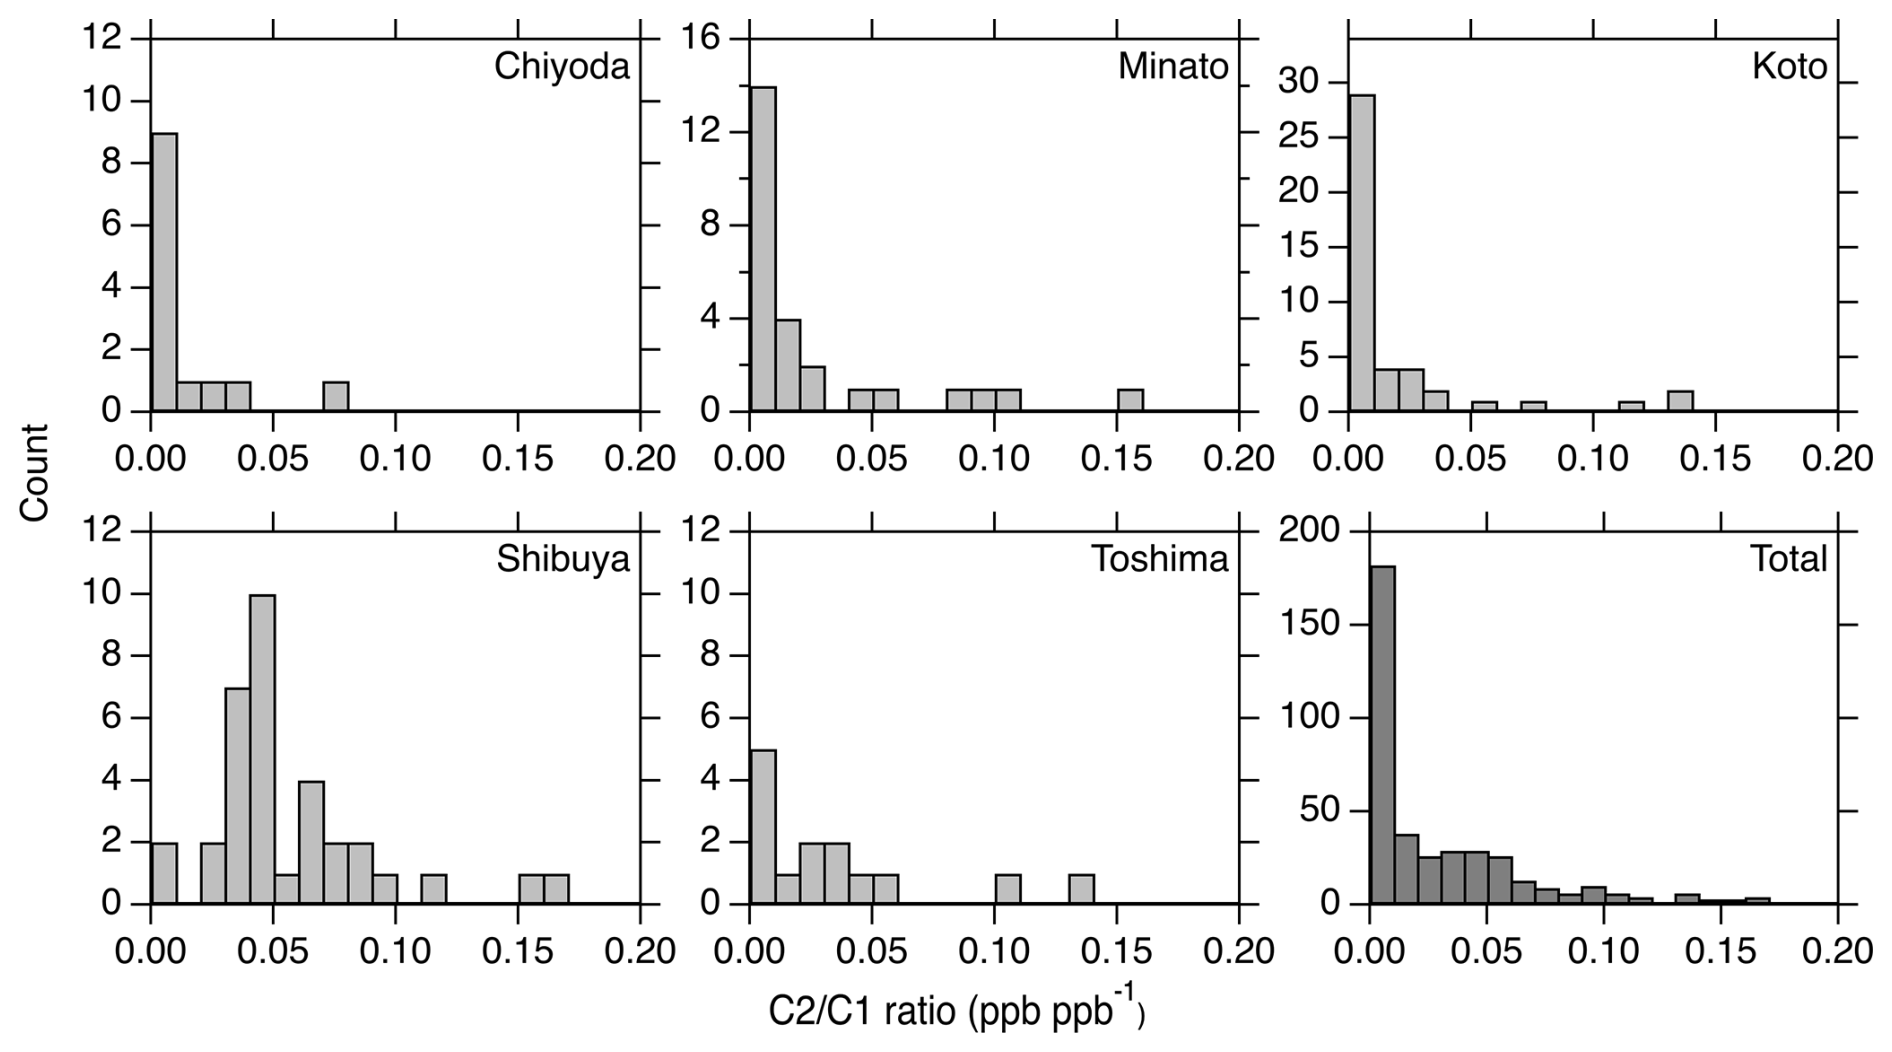
The different frequencies of the source attributions were plausibly associated with land uses and known CH4 sources of the different wards. According to the report of Tokyo Metropolitan Government (Bureau of Urban Development 2023), Shibuya and Toshima Wards are mainly covered by residential land (68.7 % and 68.3 %, respectively), while the fraction is relatively low in Koto Ward (47.5 %). In addition, we note that our measurements prioritized coverage of residential areas for Shibuya Ward. The residential land of Koto Ward is occupied substantially by industrial areas (26.6 %), whereas the predominant coverage in other 4 wards are public, commercial, and residential spaces. It is also important to note that the present study surveyed streets near landfill sites (Tokyo Bay-side Landfill) and two wastewater treatment plants resided in Koto Ward, contributing to large number of biogenic LPs in the area. Minato Ward also has a wastewater treatment plant surveyed. In Koto Ward, 2 and 31 LPs were found in the vicinities of landfill site and wastewater treatment plants, respectively, among 44 biogenic LPs in total (Table 1). In Minato Ward, 12 of 22 LPs were identified near the wastewater treatment plant. In contrast, our measurement did not survey any known biogenic CH4 source facilities in Shibuya and Toshima Wards. It should be noted that the above LP counts (and its density) include those found at proximities of biogenic facilities as mentioned above. Other biogenic LPs could be related to sewer networks and other water environment distributed in the survey areas. These facility and non-facility sources should be separately evaluated in a more sophisticated approach to estimating areal CH4 emissions, but due to the limited data currently available, we do not distinguish these sources in the analysis below.
5.2 Emission estimates
To estimate areal CH4 emissions, we employ empirical equations as referred in section 3 and previous studies. Also relevant is LP density (km−1) defined as number of the observed LPs divided by the road distance covered in each ward (Table 1). Below we estimate CH4 emissions from the 5 selected wards (Chiyoda, Minato, Koto, Shibuya and Toshima) only, because estimates for other wards are considered to be far from representative due to limited data. Using the average maximum CH4 excesses in the area (Table 2), we calculated emission rates (L min−1 or g CH4 min−1) according to Eq. (4) and equations suggested by previous studies. In this study, we present estimates using the equation by Weller et al. (2019) for compatibility with our companion paper (Ueyama et al., 2025) and previous studies (Maazallahi et al., 2020; Vogel et al., 2024). It is noted that, when Equation 4 (our control release experiment) was employed, the estimated emissions would be about 10 times larger than those using the Weller et al. (2019) equation, indicating that conversion from CH4 excess to emission rate with an empirical equation is the considerable source of uncertainty. As described in Sect. 3, suitable choice of such an empirical conversion equation requires consideration of important factors such as emission height and distance from the source in the target area. Use of Weller et al. (2019) equation assumes that most CH4 emissions are represented by ground emissions occurring near the vehicle (roughly within 10 m). In contrast, Eq. (4) (our control experiment) assumes emissions some tens m away at 5 m height. The former might approximate emissions underground sources (e.g., natural gas distribution pipes or urban sewer networks), whereas the latter downwind advection from large facilities or local restaurants at significant distance (Ueyama et al., 2025). Since the survey areas have these mixtures, it is difficult to determine appropriateness of the equations for individual cases.
Table 2The averages of the maximum CH4 excess values and estimated and reported emissions for the 5 selected wards of Tokyo Metropolis. The uncertainties (range) of the average of the maximum CH4 excess and emission estimates were calculated using a Bootstrap method. The reported emissions for the year 2021 were available at https://all62.jp/jigyo/ghg.html (last access: 8 July 2025) (in Japanese).
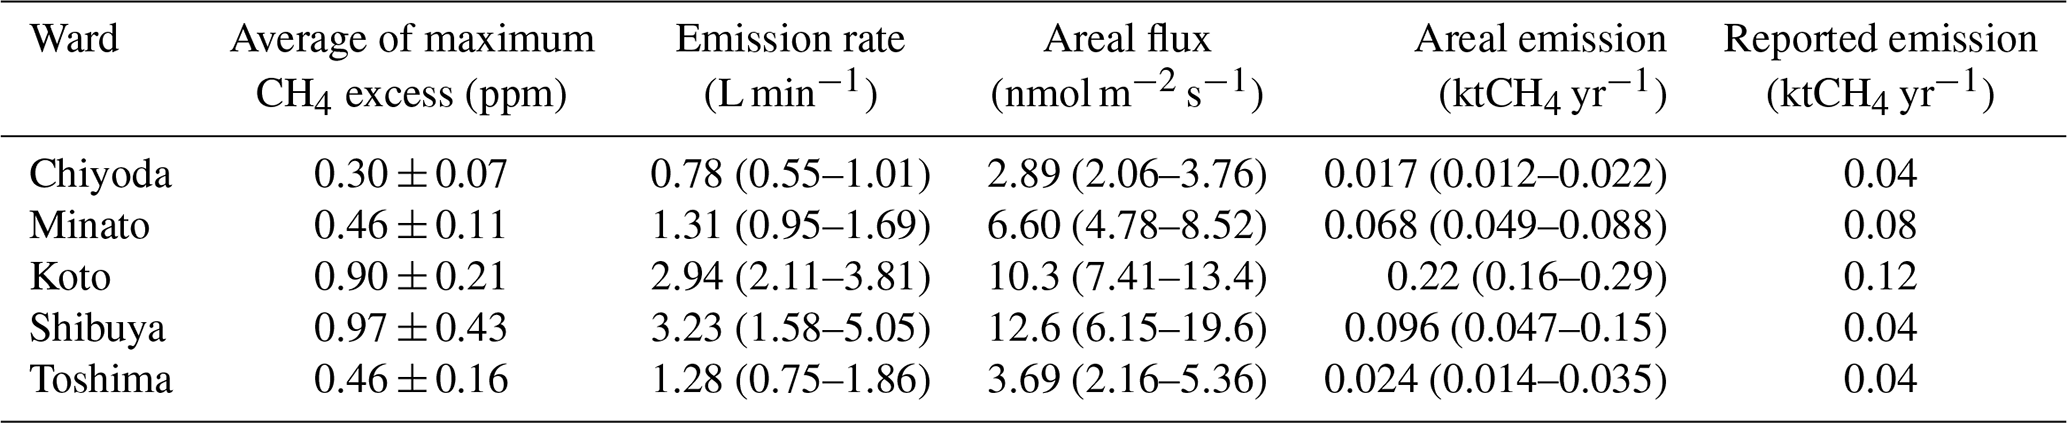
The areal flux was estimated by the following equation (Ueyama et al., 2025):
where F is the areal flux (nmol m−2 s−1), ER is the emission rate, N is the number of LPs per travel distance (km−1), RD is the total road distance (km), and A is the total area of the ward (km2). The estimated areal fluxes for the selected wards are tabulated in Table 2 and shown in Fig. 9a. As seen in Fig. 9a, reflecting significant counts of the measurement data downwind of the landfill site and wastewater treatment plants, the estimated fluxes for Minato and Koto Wards were contributed predominantly by biogenic sources. In contrast, emissions from residential areas in Shibuya and Toshima Wards were almost entirely attributed to fossil fuel sources.
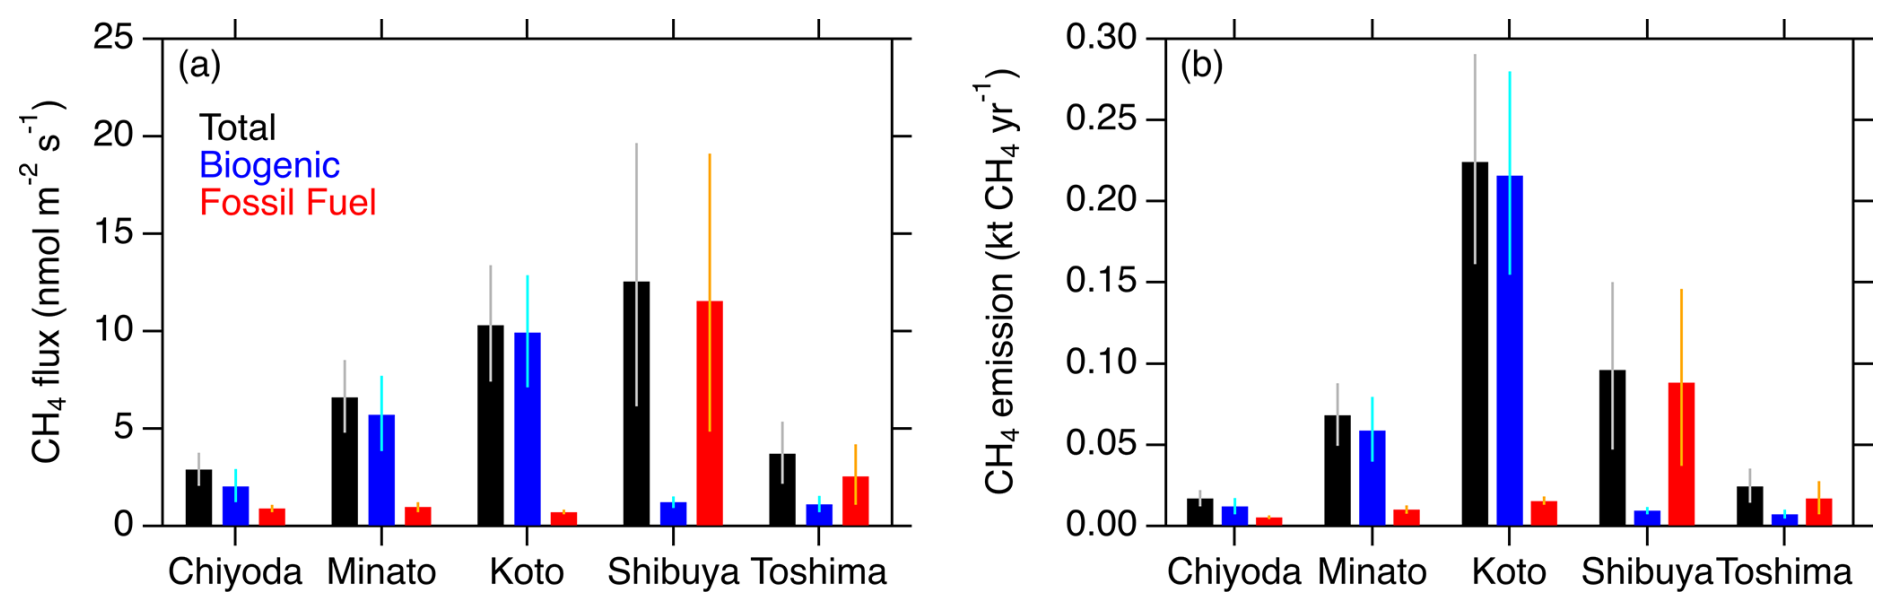
Figure 9(a) Total areal flux estimates (black) and those of biogenic (blue) and fossil fuel (red) sources for the 5 selected wards of Tokyo Metropolis. (b) Same as (a), but for upscaled CH4 emission estimates. The error bars indicate uncertainty ranges calculated using a Bootstrap method.
The areal fluxes can be converted to annual areal emissions (kt CH4 yr−1) by multiplying the total areas of the individual wards as shown in Table 2 and Fig. 9b. Based on our measurements, it was indicated that Koto Ward had the largest CH4 emission of 0.22 kt CH4 yr−1, followed by Shibuya (0.096 kt CH4 yr−1), and Minato (0.068 kt CH4 yr−1) Wards. As discussed earlier, our estimates suggested that the areal emissions were predominantly of biogenic origin for Chiyoda, Minato and Koto Wards, whereas fossil fuel sources dominated the total emissions of Shibuya and Toshima Wards. In comparison to our estimates, CH4 emissions from these wards were reported to be 0.04, 0.08, 0.12, 0.04 and 0.04 kt CH4 yr−1 for respective wards (Table 2). Although these emission estimates are not considered to be conclusive due to large uncertainties, it is noteworthy that our biogenic emission estimates for the five selected wards were correlated with the reported emissions. This is apparently consistent with the reporting of the Tokyo Metropolitan Government that biogenic emissions account for most of the reported emissions according to the standard emission methodologies with nominal emission factors (Bureau of Environment of Tokyo Metropolitan Government, 2024). However, for Shibuya and Toshima Wards, where our emission estimates attributed primarily to fossil fuel sources, the discrepancies between the estimated and reported emissions were large. This implies that either the fossil fuel emissions observed in this study were not taken into account or emission factors for the relevant sectors employed for the report were smaller than actual.
Lastly, we stress that our emission estimates presented in this study are preliminary and that accurate evaluation of the emission reporting by the local government is currently difficult. As described earlier, our survey covered only ∼ 10 % of roads of the Tokyo Metropolis, and up to ∼ 50 % at a maximum for the wards with relatively high measurement coverages. In addition, the survey prioritized measurements in the proximities of known CH4 sources (mainly biogenic), by which the result may be biased towards biogenic emissions for the target wards with such known sources (Minato and Koto Wards). For residential areas where fossil fuel-related CH4 enhancements were frequently found (Shibuya and Toshima Wards), the measurements were not even in space, by which the current estimates may be underrepresentative for respective areas. We plan the second phase of mobile measurement campaign in Tokyo to increase the road coverage. It should be also noted that upscaled calculation from vehicle-based mobile measurements at ground level could underestimate citywide emissions, since such observations could miss CH4 emission signals taking place at heights above street level (Ueyama et al., 2025). Moreover, as discussed earlier, the empirical conversion from the CH4 excess to the emission rate (Sect. 3) is a source of large uncertainty, roughly a factor of 10. The equation will be better evaluated through comparison to the ongoing eddy covariance measurements at the site Yoyogi located in a residential area of Shibuya Ward (Sugawara et al., 2021), as performed by Ueyama et al. (2025). For preliminary comparison to Ueyama et al. (2025), CH4 flux estimations for selected wards of Tokyo would fall within the range of variability found in various areas in Osaka and Sakai cities if the same conversion equation from excess CH4 to emission rate was applied, which implies comparable magnitudes of urban CH4 emissions in both megacity areas.
Based on the vehicle-based mobile atmospheric CH4 and C2H6 measurement data newly obtained in September–October 2023, this study significantly improved our understanding of urban CH4 emissions in Tokyo. It is clearly inferred that CH4 emitting locations of fossil fuel origin, identified by the C2H6 to CH4 enhancement ratio, are almost ubiquitous in residential areas, which contrasts to the reporting of the Tokyo Metropolitan Government that account for 95 % of CH4 emissions from waste sectors (biogenic CH4). It is also shown that waste sectors, such as solid waste landfills and wastewater treatment plants, are consistently large CH4 emitters, as high CH4 enhancements were observed in downwind proximities. We also presented preliminary estimates of CH4 emissions for 5 selected wards of Tokyo Metropolis where the measurement densities were relatively high. Although our preliminary estimates of areal CH4 emissions are subject to large uncertainties, currently available data imply that Tokyo's natural gas emissions are as low as those of Osaka (Japan's second largest megacity, Ueyama et al., 2025) and European cities of the lower-emission group (Vogel et al., 2024). However, the present study has raised further challenges for better understanding of urban CH4 emissions in Tokyo. First, although 3 weeks of mobile measurements with a driving distance of roughly 2000 km were performed, coverage of the public roads of Tokyo Metropolis was only ∼ 10 %. Although the coverages exceeded 30 % in a few special wards of Tokyo, more measurements are needed to reduce possible sampling biases in locating CH4 emissions and attributing them to different sectors. Second, following earlier studies, this study also inferred a large uncertainty range originating from the empirical equation employed for conversion from CH4 enhancement measurement to emission rate. To reduce uncertainties in estimating the upscaled emissions, usefulness of the equation in the measurement environment should be carefully evaluated, as examined in the companion paper (Ueyama et al., 2025). Even without such evaluation, mobile survey data can be utilized to support mitigation planning by identifying the largest point source fugitive emissions and prioritizing for repair. With further work, and when uncertainties in measurement-based CH4 emission estimates are sufficiently reduced with increased data, our methodologies may be able to support tracking of mitigation actions of local governments through identifying CH4 emission locations, sectors and magnitude.
The dataset from the Tokyo mobile measurement campaign is available via Umezawa and Terao (2025) at https://doi.org/10.17595/20251021.001.
TU, YT, and MU designed the study, conducted the measurement, and ensured data quality, with discussion of study goals with ML and JLF. TU analyzed the data with SK for analysis of the area allocation. TU wrote the manuscript with contributions of all co-authors.
The contact author has declared that none of the authors has any competing interests.
Publisher's note: Copernicus Publications remains neutral with regard to jurisdictional claims made in the text, published maps, institutional affiliations, or any other geographical representation in this paper. While Copernicus Publications makes every effort to include appropriate place names, the final responsibility lies with the authors. Views expressed in the text are those of the authors and do not necessarily reflect the views of the publisher.
This article is part of the special issue “Greenhouse gas monitoring in the Asia–Pacific region (ACP/AMT/GMD inter-journal SI)”. It is not associated with a conference.
The vehicle measurements were made by CLIMATEC, Inc. The control release experiment was conducted at the Methane Emission Facility of the JGC Corporation (JGC R&D Center in Oarai, Ibaraki, Japan). We thank Hideki Nara for helpful discussion about evaluation of the analyzer.
This study was supported by the Environmental Defense Fund and Climate Change and Air Quality Research Program of National Institute for Environmental Studies.
This paper was edited by Tanja Schuck and reviewed by two anonymous referees.
Ars, S., Vogel, F., Arrowsmith, C., Heerah, S., Knuckey, E., Lavoie, J., Lee, C., Pak, N. M., Phillips, J. L., and Wunch, D.: Investigation of the Spatial Distribution of Methane Sources in the Greater Toronto Area Using Mobile Gas Monitoring Systems, Environ. Sci. Technol., 54, 15671–15679, https://doi.org/10.1021/acs.est.0c05386, 2020.
Baker, A. K., Schuck, T. J., Brenninkmeijer, C. A. M., Rauthe-Schöch, A., Slemr, F., van Velthoven, P. F. J., and Lelieveld, J.: Estimating the contribution of monsoon-related biogenic production to methane emissions from South Asia using CARIBIC observations, Geophys. Res. Lett., 39, L10813, https://doi.org/10.1029/2012GL051756, 2012.
Bureau of Construction of Tokyo Metropolitan Government: https://www.kensetsu.metro.tokyo.lg.jp, last access: 31 January 2025 (in Japanese).
Bureau of Environment of Tokyo Metropolitan Government: https://www.kankyo.metro.tokyo.lg.jp/climate/zenpan/emissions_tokyo/, last access: 25 October 2025 (in Japanese).
Bureau of Urban Development: Tokyo Metropolitan Government: Land Use in Tokyo Special-Ward Area 2021 Edition, https://www.toshiseibi.metro.tokyo.lg.jp/seisaku/tochi_c/tochi_kekka_r3.html (last access: 31 January 2025), 2023 (in Japanese).
Chandra, N., Patra, P. K., Bisht, J. S. H., Ito, A., Umezawa, T., Saigusa, N., Morimoto S., Aoki, S., Janssens-Maenhout, G., Fujita, R., Takigawa, M., Watanabe, S., Saitoh, N., and Canadell, J. G: Emissions from the oil and gas sectors, coal mining and ruminant farming drive methane frowth over the past three decades, J. Meteorol. Soc. Jpn., 99, 309–337, https://doi.org/10.2151/jmsj.2021-015, 2021.
Chandra, N., Patra, P. K., Fujita, R., Höglund-Isaksson, L., Umezawa, T., Goto, D., Morimoto, S., Vaughn, B. H., and Röckmann, T.: Methane emissions decreased in fossil fuel exploitation and sustainably increased in microbial source sectors during 1990–2020, Communications Earth & Environment, 5, 147, https://doi.org/10.1038/s43247-024-01286-x, 2024.
Collins, W. J., Webber, C. P., Cox, P. M., Huntingford, C., Lowe, J., Sitch, S., Chadburn, S. E., Comyn-Platt, E., Harper, A. B., Hayman, G., and Powell, T.: Increased importance of methane reduction for a 1.5 degree target, Environ. Res. Lett., 13, 054003, https://doi.org/10.1088/1748-9326/aab89c, 2018.
Commane, R., Hallward-Driemeier, A., and Murray, L. T.: Intercomparison of commercial analyzers for atmospheric ethane and methane observations, Atmos. Meas. Tech., 16, 1431–1441, https://doi.org/10.5194/amt-16-1431-2023, 2023.
Crippa, M., Guizzardi, D., Pisoni, E., Solazzo, E., Guion, A., Muntean, M., Florczyk, A., Schiavina, M., Melchiorri, M., and Hutfilter, A. F.: Global anthropogenic emissions in urban areas: patterns, trends, and challenges, Environ. Res. Lett., 16, 074033, https://doi.org/10.1088/1748-9326/ac00e2, 2021.
Crippa, M., Guizzardi, D., Pagani, F., Banja, M., Muntean, M., Schaaf, E., Monforti-Ferrario, F., Becker, W. E., Quadrelli, R., Risquez Martin, A., Taghavi-Moharamli, P., Köykkä, J., Grassi, G., Rossi, S., Melo, J., Oom, D., Branco, A., San-Miguel, J., Manca, G., Pisoni, E., Vignati, E., and Pekar, F.: GHG emissions of all world countries, Publications Office of the European Union, Luxembourg, JRC138862, https://doi.org/10.2760/4002897, 2024.
Defratyka, S. M., Paris, J.-D., Yver-Kwok, C., Fernandez, J. M., Korben, P., and Bousquet, P.: Mapping Urban Methane Sources in Paris, France, Environ. Sci. Technol., 55, 8583–8591, https://doi.org/10.1021/acs.est.1c00859, 2021.
Etheridge, D. M., Steel, L. O., Francey, R. J., and Langenfelds, R. L.: Atmospheric methane between 1000 A. D. and present: evidence of anthropogenic emissions and climatic variability, J. Geophys. Res., 103, 15979–15993, https://doi.org/10.1029/98JD00923, 1998.
Fernandez, J. M., Maazallahi, H., France, J. L., Menoud, M., Corbu, M., Ardelean, M., Calcan, A., Townsend-Small, A., van der Veen, C., Fisher, R. E., Lowry, D., Nisbet, E. G., and Röckmann T.: Street-level methane emissions of Bucharest, Romania and the dominance of urban wastewater, Atmos. Environ.: X, 13, 100153, https://doi.org/10.1016/j.aeaoa.2022.100153, 2022.
Helfter, C., Tremper, A. H., Halios, C. H., Kotthaus, S., Bjorkegren, A., Grimmond, C. S. B., Barlow, J. F., and Nemitz, E.: Spatial and temporal variability of urban fluxes of methane, carbon monoxide and carbon dioxide above London, UK, Atmos. Chem. Phys., 16, 10543–10557, https://doi.org/10.5194/acp-16-10543-2016, 2016.
Hopkins, F. M., Ehleringer, J. R., Bush, S. E., Duren, R. M., Miller, C. E., Lai, C.-T., Hsu, Y.-K., Carranza, V., and Randerson, J. T.: Mitigation of methane emissions in cities: How new measurements and partnerships can contribute to emissions reduction strategies, Earth's Future, 4, 408–425, https://doi.org/10.1002/2016EF000381, 2016a.
Hopkins, F. M., Kort, E. A., Bush, S. E., Ehleringer, J. R., Lai, C.-T., Blake, D. R., and Randerson, J. T.: Spatial patterns and source attribution of urban methane in the Los Angeles Basin, J. Geophys. Res.-Atmos., 121, 2490–2507, https://doi.org/10.1002/2015JD024429, 2016b.
Ishidoya, S., Sugawara, H., Terao, Y., Kaneyasu, N., Aoki, N., Tsuboi, K., and Kondo, H.: O2:CO2 exchange ratio for net turbulent flux observed in an urban area of Tokyo, Japan, and its application to an evaluation of anthropogenic CO2 emissions, Atmos. Chem. Phys., 20, 5293–5308, https://doi.org/10.5194/acp-20-5293-2020, 2020.
Jackson, R. B., Saunois, M., Martinez, A., Canadell, J. G., Yu, X., Li, M., Poulter, B., Raymond, P. A., Regnier, P., and Ciais, P.: Human activities now fuel two-thirds of global methane emissions, Environ. Res. Lett., 19, 101002, https://doi.org/10.1088/1748-9326/ad6463, 2024.
Janardanan, R., Maksyutov, S., Wang, F., Nayagam, L., Sahu, S. K., Mangara, P., Saunois, M., Lan, X., and Matsunaga, T.: Country-level methane emissions and their sectoral trends during 2009–2020 estimated by high-resolution inversion of GOSAT and surface observations, Environ. Res. Lett., 19, 034007, https://doi.org/10.1088/1748-9326/ad2436, 2024.
Japan Meteorological Agency: Tables of Monthly Climate Statistics: https://www.data.jma.go.jp/stats/data/en/smp, last access: 29 October 2025.
Joo, J., Jeong, S., Shin, J., and Chang, D. Y.: Missing methane emissions from urban sewer networks, Environ. Pollut., 342, 123101, https://doi.org/10.1016/j.envpol.2023.123101, 2024.
Lan, X., Thoning, K. W., and Dlugokencky, E. J.: Trends in globally-averaged CH4, N2O, and SF6, determined from NOAA Global Monitoring Laboratory measurements, Version 2025-01, NOAA lobal Monitoring Laboratory [data set], https://doi.org/10.15138/P8XG-AA10, 2025.
Maasakkers, J. D., Varon, D. J., Elfarsdóttir, A., McKeever, J., Jervis, D., Mahapatra, G., Pandey, S., Lorente, A., Borsdorff, T., Foorthuis L. R., Schuit, B. J., Tol, P., van Kempen, T. A., van Hees, R., and Aben, I.: Using satellites to uncover large methane emissions from landfills, Sci. Adv., 8, eabn9683, https://doi.org/10.1126/sciadv.abn9683, 2022.
Maazallahi, H., Fernandez, J. M., Menoud, M., Zavala-Araiza, D., Weller, Z. D., Schwietzke, S., von Fischer, J. C., Denier van der Gon, H., and Röckmann, T.: Methane mapping, emission quantification, and attribution in two European cities: Utrecht (NL) and Hamburg (DE), Atmos. Chem. Phys., 20, 14717–14740, https://doi.org/10.5194/acp-20-14717-2020, 2020.
Marcotullio, P. J., Sarzynski, A., Albrecht, J., Schulz, N., and Garcia, J.: The geography of global urban greenhouse gas emissions: an exploratory analysis, Clim. Change, 121, 621–634, https://doi.org/10.1007/s10584-013-0977-z, 2013.
McKain, K., Down, A., Raciti, S. M., Budney, J., Hutyra, L. R., Floerchinger, C., Herndon, S. C., Nehrkorn, T., Zahniser, M. S., Jackson, R. B., Phillips, N., and Wofsy, S. C.: Methane emissions from natural gas infrastructure and use in the urban region of Boston, Massachusetts, P. Natl. Acad. Sci. USA, 112, 1941–1946, https://doi.org/10.1073/pnas.1416261112, 2015.
Michel, S. E., Lan, X., Miller, J., Tans, P., Clark, J. R., Schaefer, H., Sperlich, P., Brailsford, G., Morimoto, S., Moossen, H., and Li, J.: Rapid shift in methane carbon isotopes suggests microbial emissions drove record high atmospheric methane growth in 2020–2022, P. Natl. Acad. Sci. USA, 121, e2411212121, https://doi.org/10.1073/pnas.2411212121, 2024.
Morimoto, S., Fujita, R., Aoki, S., Goto, D., and Nakazawa, T.: Long-term variations of the mole fraction and car- bon isotope ratio of atmospheric methane observed at Ny-Ålesund, Svalbard from 1996 to 2013, Tellus B, 69, 1380497, https://doi.org/10.1080/16000889.2017.1380497, 2017.
Niwa, Y., Tohjima, Y., Terao, Y., Saeki, T., Ito, A., Umezawa, T., Yamada, K., Sasakawa, M., Machida, T., Nakaoka, S.-I., Nara, H., Tanimoto, H., Mukai, H., Yoshida, Y., Morimoto, S., Takatsuji, S., Tsuboi, K., Sawa, Y., Matsueda, H., Ishijima, K., Fujita, R., Goto, D., Lan, X., Schuldt, K., Heliasz, M., Biermann, T., Chmura, L., Necki, J., Xueref-Remy, I., and Sferlazzo, D.: Multi-observational estimation of regional and sectoral emission contributions to the persistent high growth rate of atmospheric CH4 for 2020–2022, Atmos. Chem. Phys., 25, 6757–6785, https://doi.org/10.5194/acp-25-6757-2025, 2025.
Peischl, J., Ryerson, T. B., Brioude, J., Aikin, K. C., Andrews, A. E., Atlas, E., Blake, D., Daube, B. C., de Gouw, J. A., Dlugokencky, E., Frost, G. J., Gentner, D. R., Gilman, J. B., Goldstein, A. H., Harley, R. A., Holloway, J. S., Kofler, J., Kuster, W. C., Lang, P. M., Novelli, P. C., Santoni, G. W., Trainer, M., Wofsy, S. C., and Parrish, D. D.: Quantifying sources of methane using light alkanes in the Los Angeles basin, California, J. Geophys. Res.-Atmos., 118, 4974–4990, https://doi.org/10.1002/jgrd.50413, 2013.
Quay, P., Stutsman, J., Wilbur, D., Snover, A., Dlugokencky, E., and Brown, T.: The isotopic composition of atmospheric methane, Global Biogeochem. Cy., 13, 445–461, https://doi.org/10.1029/1998GB900006, 1999.
Saboya, E., Zazzeri, G., Graven, H., Manning, A. J., and Englund Michel, S.: Continuous CH4 and δ13CH4 measurements in London demonstrate under-reported natural gas leakage, Atmos. Chem. Phys., 22, 3595–3613, https://doi.org/10.5194/acp-22-3595-2022, 2022.
Sargent, M. R., Floerchinger, C., McKain, K., Budney, J., Gottlieb, E. W., Hutyra, L. R., Rudek, J., and Wofsy, S. C.: Majority of US urban natural gas emissions unaccounted for in inventories, P. Natl. Acad. Sci. USA, 118, e2105804118, https://doi.org/10.1073/pnas.2105804118, 2021.
Schwietzke, S., Griffin, W. M., Matthews, H. S., and Bruhwiler, L. M. P.: Global bottom-up fossil fuel fugitive methane and ethane emissions inventory for atmospheric modelling, ACS Sustainable Chem. Eng., 2, 1992–2001, https://doi.org/10.1021/sc500163h, 2014.
Simpson, I., Andersen, M. P. S., Meinardi, S., Bruhwiler, L., Blake, N. J., Helmig, D., Rowland, F. S., and Blake, D. R.: Long-term decline of global atmospheric ethane concentrations and implications for methane, Nature, 488, 490–494, https://doi.org/10.1038/nature11342, 2012.
Sugawara, H., Ishidoya, S., Terao, Y., Takane, Y., Kikegawa, Y., and Nakajima, K.: Anthropogenic CO2 emissions changes in an urban area of Tokyo, Japan, due to the COVID-19 pandemic: a case study during the state of emergency in April–May 2020, Geophys. Res. Lett., 48, e2021GL092600, https://doi.org/10.1029/2021GL092600, 2021.
Takano, T. and Ueyama, M.: Spatial variations in daytime methane and carbon dioxide emissions in two urban landscapes, Sakai, Japan, Urban Clim., 36, 100798, https://doi.org/10.1016/j.uclim.2021.100798, 2021.
Tokyo Metropolitan Government: https://www.metro.tokyo.lg.jp/tosei/tokyoto/profile/gaiyo/kushichoson.html, last access: 31 January 2025 (in Japanese).
Travis, B., Dubey, M., and Sauer J.: Neural networks to locate and quantify fugitive natural gas leaks for a MIR detection system, Atmos. Environ.: X, 8, 100092, https://doi.org/10.1016/j.aeaoa.2020.100092, 2020.
Ueyama, M., Umezawa, T., Terao, Y., Lunt, M., and France, J. L.: Evaluating urban methane emissions and their attributes in a megacity, Osaka, Japan, via mobile and eddy covariance measurements, Atmos. Chem. Phys., 25, 12513–12534, https://doi.org/10.5194/acp-25-12513-2025, 2025.
Umezawa, T. and Terao, Y.: Mobile measurements of methane and ethane in the Tokyo area, Global Environmental Database [data set], https://doi.org/10.17595/20251021.001, 2025.
Umezawa, T., Machida, T., Aoki, S., and Nakazawa, T.: Contributions of natural and anthropogenic sources to atmospheric methane variations over western Siberia estimated from its carbon and hydrogen stable isotopes, Global Biogeochem. Cy., 26, GB4009, https://doi.org/10.1029/2011GB004232, 2012.
Umezawa, T., Sugawara, S., Kawamura, K., Oyabu, I., Andrews, S. J., Saito, T., Aoki, S., and Nakazawa, T.: Towards reconstructing the Arctic atmospheric methane history over the 20th century: measurement and modelling results for the North Greenland Ice Core Project firn, Atmos. Chem. Phys., 22, 6899–6917, https://doi.org/10.5194/acp-22-6899-2022, 2022.
Umezawa, T., Tohjima, Y., Terao, Y., Sasakawa, M., Müller, A., Saeki, T., Machida, T., Nakaoka S., Nara, H., Nomura, S., Nishihashi, M., Mukai, H., Frey, M. M., Morino, I., Ohyama, H., Yoshida, Y., Zeng, J., Noda, H., Saito, M., Matsunaga, T., Sugita, T., Tanimoto, H., Niwa, Y., Ito, A., Yamashita, Y., Shirai, T., Ishizawa, M., Ishijima, K., Tsuboi, K., Sawa, Y., and Matsueda, H.: Long-term and interannual variations of atmospheric methane observed by the NIES and collaborative observation networks, Progress Earth Planet. Sci., 12, 39, https://doi.org/10.1186/s40645-025-00711-9, 2025a.
Umezawa, T., Sugawara, S., Hikichi, S., Morimoto, S., Saito, T., Krummel, P. B., Fraser, P. J., and Weiss, R.: Evaluation of stratospheric age of air estimated from halocarbon measurements of air samples collected by a balloon-borne cryogenic air samples, SOLA, 21, 237–243, https://doi.org/10.2151/sola.2025-029, 2025b.
United Nations: World Urbanization Prospects: The 2018 Revision, ST/ESA/SER.A/420, Department of Economic and Social Affairs, Population Division, United Nations, New York, ISBN 978-92-1-148319-2, 2019.
Varon, D. J., McKeever, J., Jervis, D., Maasakkers, J. D., Pandey, S., Houweling, S., Aben, I., Scarpelli, T., and Jacob, D. J.: Satellite discovery of anomalously large methane point sources from oil/gas production, Geophys. Res. Lett., 46, 13507–13516, https://doi.org/10.1029/2019GL083798, 2019.
Vogel, F., Ars, S., Wunch, D., Lavoie, J., Gillespie, L., Maazallahi, H., Röckmann, T., Nęcki, J., Bartyzel, J., Jagoda, P., Lowry, D., France, J., Fernandez, J., Bakkaloglu, S., Fisher, R., Lanoiselle, M., Chen, H., Oudshoorn, M., Yver-Kwok, C., Defratyka, S., Morgui, J. A., Estruch, C., Curcoll, R., Grossi, C., Chen, J., Dietrich, F., Forstmaier, A., Denier van der Gon, H. A. C., Dellaert, S. N. C., Salo, J., Corbu, M., Iancu, S. S., Tudor, A. S., Scarlat, A. I., and Calcan A.: Ground-Based Mobile Measurements to Track Urban Methane Emissions from Natural Gas in 12 Cities across Eight Countries, Environ. Sci. Technol., 58, 2271–2281, https://doi.org/10.1021/acs.est.3c03160, 2024.
von Fischer, J. C., Cooley, D., Chamberlain, S., Gaylord, A., Griebenow, C. J., Hamburg, S. P., Salo, J., Schumacher, R., Theobald, D., and Ham, J.: Rapid, Vehicle-Based Identification of Location and Magnitude of Urban Natural Gas Pipeline Leaks, Environ. Sci. Technol., 51, 4091–4099, https://doi.org/10.1021/acs.est.6b06095, 2017.
Xiao, Y., Jacob, D. J., Wang, J. S., Logan, J. A., Palmer, P. I., Sun- tharalingam, P., Yantosca, R. M., Sachse, G. W., Blake, D. R., and Streets, D. G.: Constraints on Asian and European sources of methane from CH4-C2H6-CO correlations in Asian outflow, J. Geophys. Res., 109, D15S16, https://doi.org/10.1029/2003JD004475, 2004.
Xueref-Remy, I., Zazzeri, G., Bréon, F. M., Vogel, F., Ciais, P., Lowry, D., and Nisbet, E. G.: Anthropogenic methane plume detection from point sources in the Paris megacity area and characterization of their δ13C signature, Atmos. Environ., 222, 117055, https://doi.org/10.1016/j.atmosenv.2019.117055, 2020.
Yakovitch, T. I., Herndon, S. C., Petìron, G., Kofler, J., Lyon, D., Zahniser, M. S., and Kolb, C. E.: Mobile Laboratory Observations of Methane Emissions in the Barnett Shale Region, Environ. Sci. Technol., 49, 7889–7895, https://doi.org/10.1021/es506352j, 2015.
Weller, Z. D., Roscioli, J. R., W. Daube, C., Lamb, B. K., Ferrara, T. W., Brewer, P. E., and von Fischer, J. C.: Vehicle-Based Methane Surveys for Finding Natural Gas Leaks and Estimating Their Size: Validation and Uncertainty, Environ. Sci. Technol., 52, 11922–11930, https://doi.org/10.1021/acs.est.8b03135, 2018.
Weller, Z. D., Yang, D. K., and von Fischer, J. C.: An open source algorithm to detect natural gas leaks from mobile methane survey data, PLoS ONE, 14, e0212287, https://doi.org/10.1371/journal.pone.0212287, 2019.
Wietzel, J. B. and Schmidt, M.: Methane emission mapping and quantification in two medium-sized cities in Germany: Heidelberg and Schwetzingen, Atmos. Environ.: X, 20, 100228, https://doi.org/10.1016/j.aeaoa.2023.100228, 2023.
Zazzeri, G., Lowry, D., Fisher, R. E., France, J. L., Lanoisellé, M., and Nisbet, E. G.: Plume mapping and isotopic characterisation of anthropogenic methane sources, Atmos. Environ., 110, 151–162, https://doi.org/10.1016/j.atmosenv.2015.03.029, 2015.