the Creative Commons Attribution 4.0 License.
the Creative Commons Attribution 4.0 License.
 | 09 Dec 2025
Microfluidic immersion freezing of binary mineral mixtures containing microcline, montmorillonite, or quartz
Florin N. Isenrich
Julia Nette
Christopher Dreimol
Ning Ma
Zamin A. Kanji
Andrew J. deMello
Claudia Marcolli
Mineral dusts are among the most active ice-nucleating particles present in cloud droplets, with their properties influencing radiative properties and precipitation formation. To improve weather predictions and climate projections, it is important to understand under which conditions ice will form on mineral dusts. Laboratory experiments have primarily focused on single minerals, and field samples are complex mixtures that cannot be controlled in their composition or particle size. To fill this gap, a bottom-up investigation of suspensions containing pure or binary mixtures of microcline, montmorillonite, or quartz at concentrations between 0.0001 and 0.1 wt % is presented. Arrays of monodisperse aqueous droplets (diameters of 75 µm) are generated using a microfluidic device and subsequently cooled at a rate of 1 K min−1. The probability of freezing in the presence of binary mixtures generally follows that of the most ice-active mineral. Each pure mineral's nucleation site density is fit as a function of temperature and used to predict the frozen fraction curves for each binary mixture assuming additivity of mineral surface area. Predictions are also made for Arizona Test Dust from the obtained pure mineral fits, and general agreement with experiments is observed. This work presents a systematic study of ice formation in the presence of pure and binary mixtures of common mineral dusts, providing information for the future design of composition-aware parameterizations for ice nucleation in the atmosphere.
- Article
(5876 KB) - Full-text XML
- BibTeX
- EndNote


Heterogeneous ice nucleation in the atmosphere is an important step in the Earth's hydrological cycle, including cloud formation and precipitation. It occurs on ice-nucleating particles (INPs) that are aerosolized primarily from natural sources, of which mineral dust particles have been identified as a significant category both in terms of mass and propensity to catalyze ice nucleation (Beall et al., 2022; Kanji et al., 2017). Other INP types originate from biological and anthropogenic sources (Kanji et al., 2017). INPs are required for the formation of mixed-phase clouds, which contain both liquid water droplets and ice crystals, through a mechanism known as immersion freezing (Vali et al., 2015), wherein INPs immersed in water droplets provide a surface on which ice nucleates upon reaching a sufficiently low temperature. The size and composition of the INP present in a droplet influence the likelihood of ice nucleation. As a consequence, these INP properties affect the properties of mixed-phase clouds since the nucleation of ice precedes many processes that determine what fraction of the cloud becomes ice, such as secondary ice production, collision–coalescence, and the Wegener–Bergeron–Findeisen process (Wegener, 1911; Bergeron, 1935; Findeisen, 1938). Since there are large uncertainties in INP properties, their global distribution, and interactions with other aerosols (such as those of biological origin; Kanji et al., 2017; Klumpp et al., 2022), the indirect effect of INPs through aerosol–cloud interactions on the Earth's top-of-atmosphere radiative budget remains poorly constrained (Kok et al., 2023).
Numerous studies have reported the ice-nucleating ability of minerals in the immersion mode of freezing, both in the field and in the laboratory. In the field, aerosol samples are characterized using either a continuous flow instrument (e.g., a horizontal ice nucleation chamber – HINC; Lacher et al., 2017; Rogers, 1988; Rogers et al., 2001) or a batch assay (e.g., droplet assays; Miller et al., 2021; Wright and Petters, 2013; Polen et al., 2018; Whale et al., 2017) to quantify the number of freezing events. However, the rarity of ice-nucleating particles in the atmosphere is one challenge for their systematic investigation (Burrows et al., 2022), and it is difficult to draw generalizable conclusions from field campaigns due to a lack of systematic control or knowledge of particle size and composition. Laboratory investigations of single minerals often approach the quantification of ice nucleation behavior in a bottom-up manner: a mineral rock of known composition is crushed, suspended in an aqueous solution, and cooled under observation until ice forms. Such laboratory measurements have been carried out for a range of droplet numbers (tens to thousands) and volumes (microliters to picoliters) (e.g., Atkinson et al., 2013; Tarn et al., 2018, 2025; Reicher et al., 2018; House and Dutcher, 2024; see Table 1 in Miller et al., 2021 for an overview of instruments reported in the literature), and parameterizations of the observed trends in ice nucleation have been developed for input to climate models.
There has been growing interest in developing parameterizations of ice nucleation that account for the properties of INPs, including their composition and size distribution (Burrows et al., 2022; Chatziparaschos et al., 2023; Knopf and Alpert, 2023). With such an aerosol-aware parameterization (Burrows et al., 2022), the effect of variations in regional emissions might be more accurately accounted for in global models. Presently, primarily single-component, monodisperse aerosols are used as a representative of the true aerosol population. For example, the ice nucleation activity of K-feldspar is an adequate surrogate of mineral dusts (e.g., Atkinson et al., 2013). Recently, Chatziparaschos et al. (2023) performed simulations using a global chemistry transport model and considered two of the components in the dust, K-feldspar and quartz, to be ice-nucleating. They showed that both mineral types could contribute significantly to ice nucleation depending on their relative concentration and regional temperature, even though K-feldspar is known to initiate ice formation at higher temperatures than quartz. For example, when the mass of quartz was 6 times that of the feldspar, the percentage of ice crystals that formed on quartz particles reached more than 35 % (Chatziparaschos et al., 2023).
Wong (2019) investigated one concentration of each of three minerals (0.5 wt % K-feldspar, 1 wt % NX illite, and 1 wt % kaolinite KGa-1b) suspended in binary combinations in water droplets with volumes of 0.2 µL. In this study, the frozen fraction observed in binary mixtures reflected the freezing behavior of the most ice-active single component. However, the concentrations of all combinations of two components were either equal or within a factor of 2, and it was not possible to discern whether there may be a departure from the freezing being dominated by the most active mineral type when the difference in concentrations is much larger, such as the factor of 6 considered in the study by Chatziparaschos et al. (2023).
In this work, we investigate the effect of mineral mixture composition by suspending known concentrations of mineral dust particles in microfluidically-generated aqueous droplets. Both single- and multi-mineral systems are analyzed at varying concentrations (0.0001 wt % to 0.1 wt % in increments of 10×) of microcline, quartz, and montmorillonite, which have all been identified as important ice-nucleating particles in the atmosphere (Harrison et al., 2019; Harrison et al., 2016; Atkinson et al., 2013). These three minerals are also the primary components of Arizona Test Dust (ATD), a common proxy of atmospheric mineral dust, suspensions of which are also studied herein. A comparison between the ice nucleation activity of the controlled mixtures and that of ATD is drawn to investigate whether samples mixed from the pure components can explain the ice nucleation activity of samples that were collected as mixtures from the air or ground. Through these results, we quantify the likelihood of ice nucleation in binary mineral mixtures, with this information providing a basis for inferring the behavior of immersion mode freezing on real mineral dust mixtures in the atmosphere where concentrations of minerals may span several orders of magnitude.
For all studied suspensions, we used ultrapure water (molecular biology reagent-grade, Sigma-Aldrich, USA). Single minerals included microcline (originally from Macedonia and obtained from the ETH Mineralogical and Petrographical Collection; milled with a tungsten carbide disk mill), quartz (Sigma-Aldrich, ≥99.995 % trace metals basis), and Na-rich SWy-2 montmorillonite (The Clay Minerals Society). The composition of the microcline and montmorillonite samples were confirmed by powder X-ray diffraction to be 97 % microcline and 3 % albite for the microcline sample (Fig. A1), while the montmorillonite sample was pure montmorillonite. Ultrafine Arizona Test Dust (ISO 12103-1, A1 Ultrafine; Filter & Aerosol Technologie GmbH) was used as received, with a documented size distribution of 65.0 %–69.0 % being less than 5.50 µm in size and 95.5 %–97.5 % of particles being less than 11 µm.
2.1 Sample preparation, droplet generation, and cooling
All single minerals (microcline, quartz, and montmorillonite) were suspended in water, sonicated (8×30 s pulse in a UP200ST ultrasonic VialTweeter; Hielscher Ultrasonics GmbH, Germany), filtered through a 0.45 µm polyethersulfone sterile syringe filter (TPP Techno Plastic Products AG, Switzerland), dried (SpeedVac, SavantTM SPD111V, Thermo ScientificTM, USA), and stored in dried form in separate Eppendorf tubes. On the day of each experiment, a dried sample was resuspended in water and diluted or mixed to the desired concentration. For each pure mineral suspension of 0.1 wt %, 1 µL was placed on a silicon wafer for SEM analysis. Immediately before generating droplets, the resuspended sample was transferred to the polytetrafluoroethylene (PTFE) tubing attached to the syringes and pumps for controlling the sample flow rate. For samples of ATD, dust was only suspended in water and sonicated (VialTweeter) without filtration or further drying, followed by physical agitation (shaking) immediately prior to being transferred to the PTFE tubing before droplet generation. To remove the possibility for contamination in the inlet PTFE tubing to the microfluidic device, the same tubing was only reused for experiments with the same mineral. The tubing was also flushed with isopropanol after each day of experiments. If multiple mineral concentrations were investigated on the same day, the lower concentration of each mineral suspension was investigated first to avoid potential contamination of subsequent experiments.
Three independent populations of droplets were generated sequentially from the same starting suspension in the Microfluidic Ice Nuclei Counter Zürich (MINCZ) (Isenrich et al., 2022). MINCZ consists of: a polydimethylsiloxane (PDMS) microfluidic device, three glass syringes (1 mL, Hamilton® syringe, Sigma-Aldrich) in syringe pumps (Aladdin AL1000-220Z, World Precision Instruments, USA), high-purity perfluoroalkoxyalkane (PFA) tubing (50 cm in length with 360 µm o.d. and 75 µm i.d.; IDEX Health & Science LLC, USA) to store the generated droplets, a stereoscope (Nikon SMZ1270, 0.5× objective lens, fibre ring illuminator with LED light source), a CMOS camera (iDS UI-3060CP-M-GL Rev. 2) for optical freezing detection, and cooling instrumentation (an ethanol bath cooled by a Peltier element (PKE 128A 0020 HR 150, Peltron GmbH, Germany) and a chiller (Huber KISS K6, Huber Kältemaschinenbau AG, Germany) that recirculates an aqueous 55 % ethylene glycol (98 % technical grade, Sigma-Aldrich, USA) solution). PDMS microfluidic devices were manufactured following an established protocol, as described by Isenrich et al. (2022). Briefly, this involved patterning of an SU-8 coated silicon wafer, transferring this pattern to PDMS (Elastosil RT 601 A/B, Ameba AG, Switzerland; mass ratio of 10:1 between the base and curing agent) via soft lithography and bonded the structured PDMS layer to a glass slide (Menzler-Glaser, Germany) via plasma treatment. Using MINCZ, 75 µm diameter aqueous droplets were generated within a continuous surfactant laden oil phase (1 % 008-FluoroSurfactant–RAN Biotechnologies, USA in HFE-7500) and stored in the PFA tubing, followed by cooling at 1 K min−1 (automatically controlled by a proportional controller implemented in Python with images saved every 3 s). As discussed by Alpert and Knopf (2016), a sufficient number of experiments and number of droplets are needed for a reliable statistical interpretation of heterogeneous nucleation. Based on these recommendations around 100–200 droplets and three repeats were used for experiments in the current study. There were inherent variations in the number of droplets observed in each experiment because of variability in the process of droplet generation between experiments. The primary goal of droplet generation was to obtain a stable, monodisperse population of droplets with sufficient spacing to avoid droplet coalescence. The spacing proved to be slightly variable depending on the exact fluid flow rates required to achieve a stable droplet population, which influenced the number of droplets in the field of view.
2.2 Mineral characterization
Secondary electron scanning electron microscopy (SEM) images were obtained using a FEI Magellan 400 scanning electron microscope. Each pure mineral was pre-processed (sonication, filtration, and drying) and re-suspended in a 0.1 wt % aqueous solution. A single droplet of this suspension was deposited on a dried and ultrasonicated silicon substrate for characterization.
Dynamic vapor sorption (DVS; Advantage ET 1, Surface Measurement Systems Ltd., London, UK) using deionized water was employed to measure the adsorption isotherms. Samples were preconditioned at 298 K for 720 min under a nitrogen atmosphere (grade N5.0) to remove any pre-adsorbed moisture. Subsequently, samples were subjected to stepwise increases in relative humidity (RH), with increments of 5 % RH between 0 %–40 %, 10 % RH between 40 %–70 %, and 2 % RH between 70 %–98 %. Quasi-equilibrium at each step was defined as a mass change rate below 0.0005 % min−1 over a period of 10 min, or after a maximum duration of 1000 min. Throughout the experiment, the temperature was maintained at 298 K, while nitrogen (grade N5.0) served as the carrier gas at a constant flow rate of 200 mL min−1 to regulate RH. The specific surface area (As; m2 g−1) of the solid particles was estimated in accordance with the Brunauer–Emmett–Teller (BET) model, consistent with previous studies (Gronquist et al., 2019; Klumpp et al., 2023; Mahrt et al., 2023). For this purpose, data points from the adsorption isotherms within the 15 %–35 % RH range were used to perform a linear regression. A cross-sectional area of 0.114 nm2 per water molecule was assumed to represent monolayer coverage.
Based on the observed fraction of frozen droplets during an experiment as a function of temperature (), the number of nucleation sites per unit surface area, ns, was calculated using (Vali, 2014)
where A=Asmwi and m is the mass of a droplet (221 ng) and wi is the mineral mass fraction in a droplet.
2.3 Image analysis
Automated detection of possible freezing events (Fig. 1) was carried out in three steps. In Step 1, the location of the PFA tubing in each recorded image was detected using an algorithm developed by Deck et al. (2024), consisting of histogram equalization, Otsu's thresholding, and smoothing with a Savitzky–Golay filter. For one experimental series, the raw recorded image sequences were not completely stationary, so image registration (i.e., image alignment) was carried out by identifying features, tracking their evolution over time, and aligning the images accordingly (using the scikit-image package in Python) before carrying out further analysis. In Step 2, the difference image between two consecutive images was calculated (It and It−Δt), and in Step 3, the OpenCV package in Python was used for further image processing (1936×1216 pixels) aimed at identification of potential freezing events through a sequence of steps: bilateral filtering, opening, Canny edge detection, Hough circle detection, and applying a threshold for the average greyscale value within the found circles. Each potential freezing event was cropped to an image size of 60×60 pixels and passed to classification by a deep convolutional neural network (CNN).
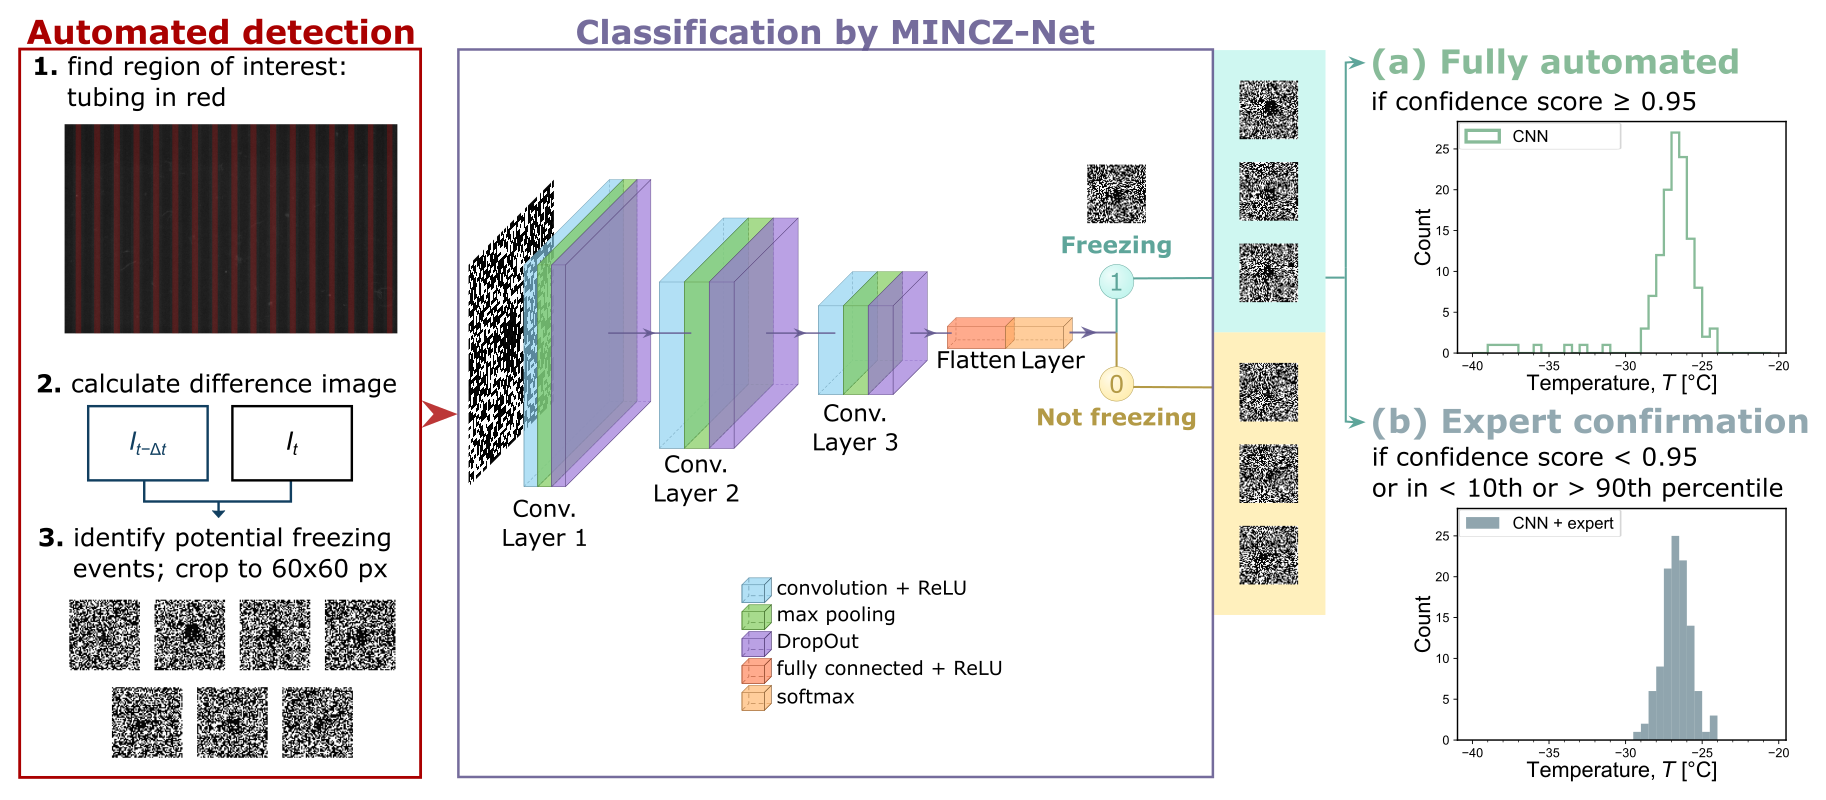
Figure 1Image processing workflow consisting of automated detection of potential freezing events and a convolutional neural network, MINCZ-Net, for their classification to obtain either (a) a fully automated count of frozen droplets as a function of temperature or (b) a count that is confirmed by the expert.
At the classification stage, the CNN named MINCZ-Net was used to classify each event as either “freezing” or “not freezing”. The CNN contained three sets of convolutional, pooling, and dropout layers (as shown in Fig. 1; implemented with the TensorFlow and Keras packages in Python) between the input and output layers, and it was trained on images from three experiments (one from each pure mineral suspension) for a total of 689 images with an 80:20 split between training and test data. The last layer used rectified linear unit (ReLU) and softmax activation functions to determine the final classification. In the fully automated workflow (Fig. 1a), freezing events identified with a confidence score ≥ 0.95 were counted as a function of temperature. In comparison, the workflow with expert confirmation (Fig. 1b) prompted the expert to assess any freezing events that were classified by MINCZ-Net with a confidence score < 0.95 and those that were below the 10th percentile or above the 90th percentile of the population.
Since the neural network training was carried out for one experiment for each single mineral, we tested the accuracy of the resulting classification for five other cases – one for each binary mineral mixture containing microcline (mc), quartz (qu), and montmorillonite (mm), as shown in Fig. 2. Results from three methods of classifying potential freezing events are shown: by the expert only, fully automated by the CNN (Fig. 1a), and with expert confirmation of the CNN categorization (Fig. 1b). All three methods yielded similar counts of freezing events as a function of temperature. The most important difference is in the tails of the frozen fraction distribution, where the expert alone and the combined CNN–expert methods identified fewer freezing events than the CNN alone. False positives may occur with the CNN due to noise or optical interference (e.g., dust moving in between frames) resembling a freezing event with a localized increase in pixel brightness, and thus the CNN method overestimates the number of freezing events. The expert-only method generally identifies more freezing events than the combined CNN–expert method due to the false negative categorizations by the CNN; other deviations between these methods can also originate from expert classification error. Between the expert-only and the CNN–expert methods, the CNN–expert analysis is beneficial when considering the required analysis time for one experiment (up to 1000 potential freezing events): more than 1 h is needed to classify all the possible freezing events by an expert alone, while less than 15 min is typical for the CNN and expert together. Thus, the best methodology for counting the number of frozen droplets is a combination of the CNN with expert confirmation, and this is used in all experiments.
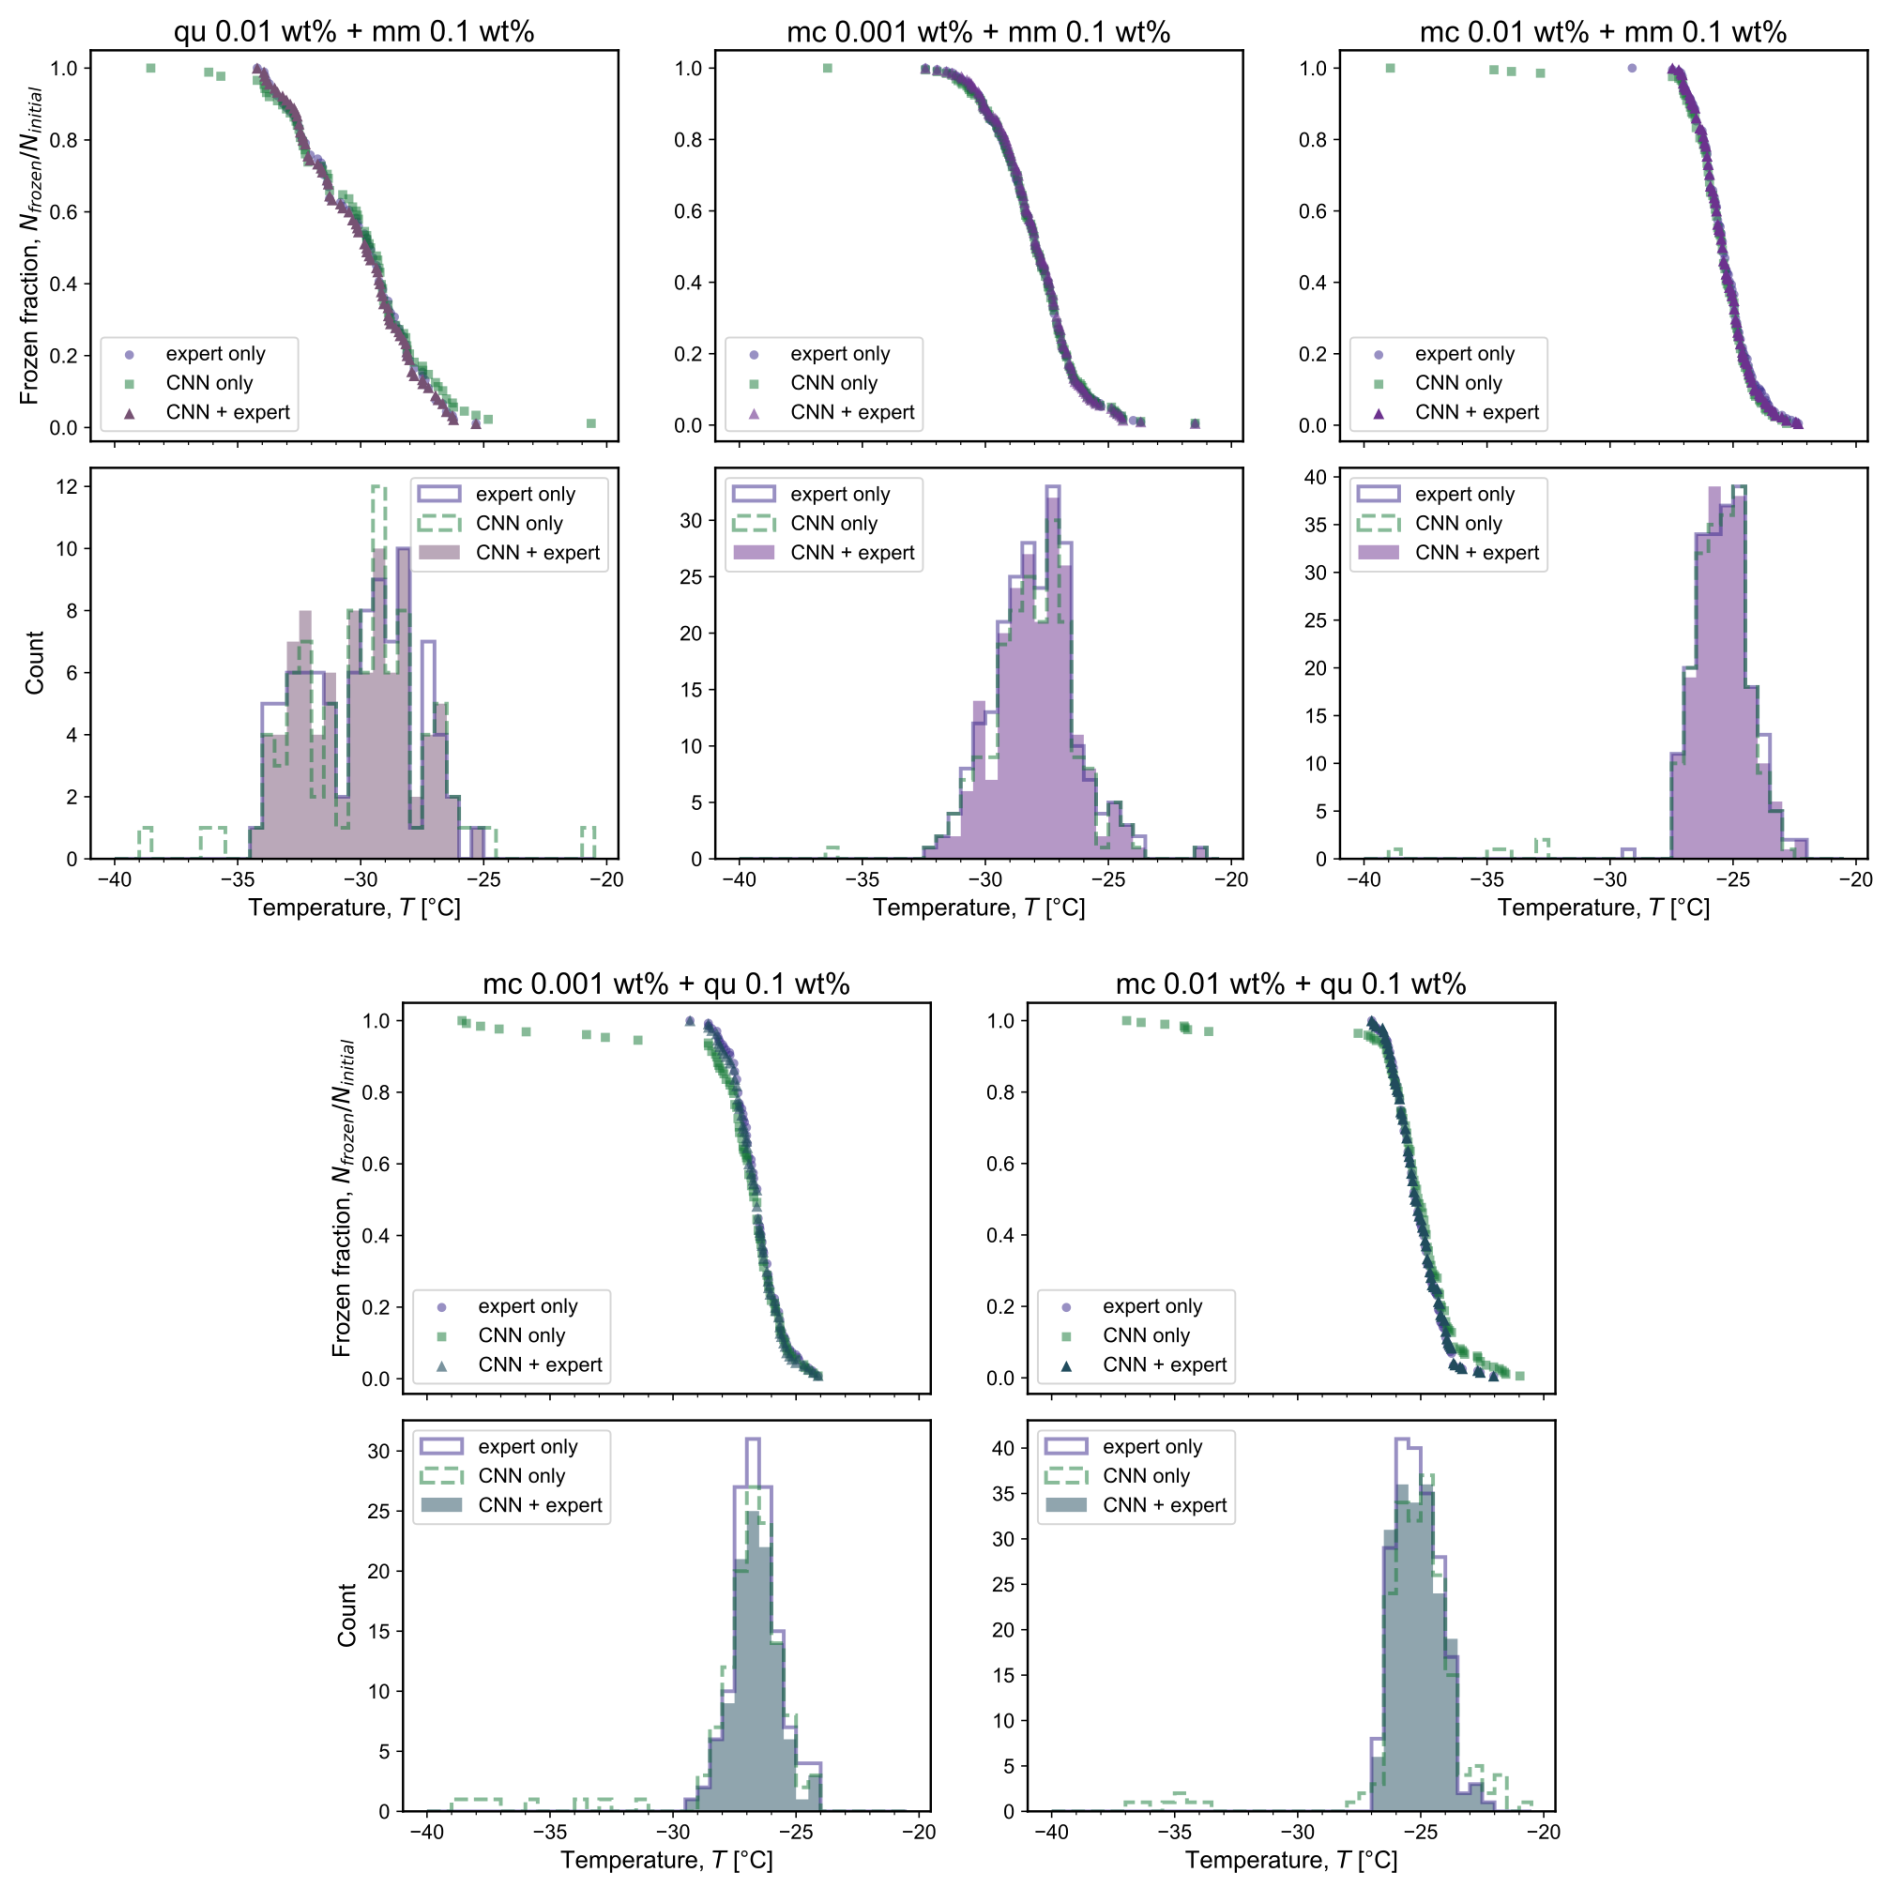
Figure 2Comparison of frozen fraction and counts of freezing events for one experiment on each mineral mixture containing quartz (qu), montmorillonite (mm), or microcline (mc) of different weight percentages. The results were obtained through classification by the expert only (purple circles and line); the convolutional neural network (CNN) (green squares and dashed line); and the CNN followed by expert confirmation (triangles and shaded region) of the frozen droplets that were classified with either less than 95 % confidence by the CNN or were below the 10th percentile or above the 90th percentile. The total number of droplets present in the field of view is assumed to be equal to the total number of freezing events detected, with variations between experiments arising from differences in droplet spacing during droplet generation.
2.4 Governing equations for fitting and prediction
The following empirical equation was fit to the experimentally-derived ns values as a function of temperature for each pure mineral:
where ai, bi, ci and di are fitting coefficients for mineral i determined after discarding the first 10 % of data points calculated from the experimental frozen fraction to prevent overfitting to the rare nucleation events at the higher temperatures. The curve_fit function in the Python package SciPy was used for obtaining fitting coefficients that minimized the sum of squares of residuals. For all coefficients reported herein for Eq. (2), T is in units of °C and ns is in units of cm−2. The goodness of fit was assessed via the standard deviation (SD) calculated using:
where is a predicted value, ns,i is an experimental value, N is the number of experimental data points, and p is the number of fitting parameters (p=4). The validity of the obtained fit is limited to the range of experimental temperatures, and the expression should be used with caution outside this range.
Using the pure mineral fits for ns, predictions of frozen fraction for mixtures as a function of temperature were calculated by applying Eq. (1) to a multi-mineral suspension where to yield the following expression:
where .
3.1 Freezing temperatures of pure mineral suspensions
The observed frozen fractions of droplets as a function of temperature are shown in Fig. 3 (symbols) with each frozen fraction calculated as the ratio between the number of frozen droplets and the total number of droplets in an experiment. The relative ability of each pure mineral to nucleate ice is comparable to previous reports, with microcline being the most ice-active mineral at the highest temperature (Atkinson et al., 2013; Harrison et al., 2019), followed by quartz and montmorillonite (Atkinson et al., 2013; Harrison et al., 2019; Pinti et al., 2012), although a wide variety in activity has also been reported depending on the source of the mineral (Kanji et al., 2017; Harrison et al., 2016; Hoose and Möhler, 2012; Murray et al., 2012; Harrison et al., 2019). For each series of experiments in Fig. 3, the temperature at which nucleation is observed decreased as the concentration of the mineral in each droplet decreased. This is expected because the surface area available for ice nucleation decreases with reducing concentration, thus lessening the probability of ice nucleation. Figure 3 also presents the homogeneous freezing of contemporaneously-measured pure water droplets (black circles and light grey shading) from Isenrich et al. (2022), confirming that droplets with higher mineral concentrations freeze at higher temperatures than the pure water background.
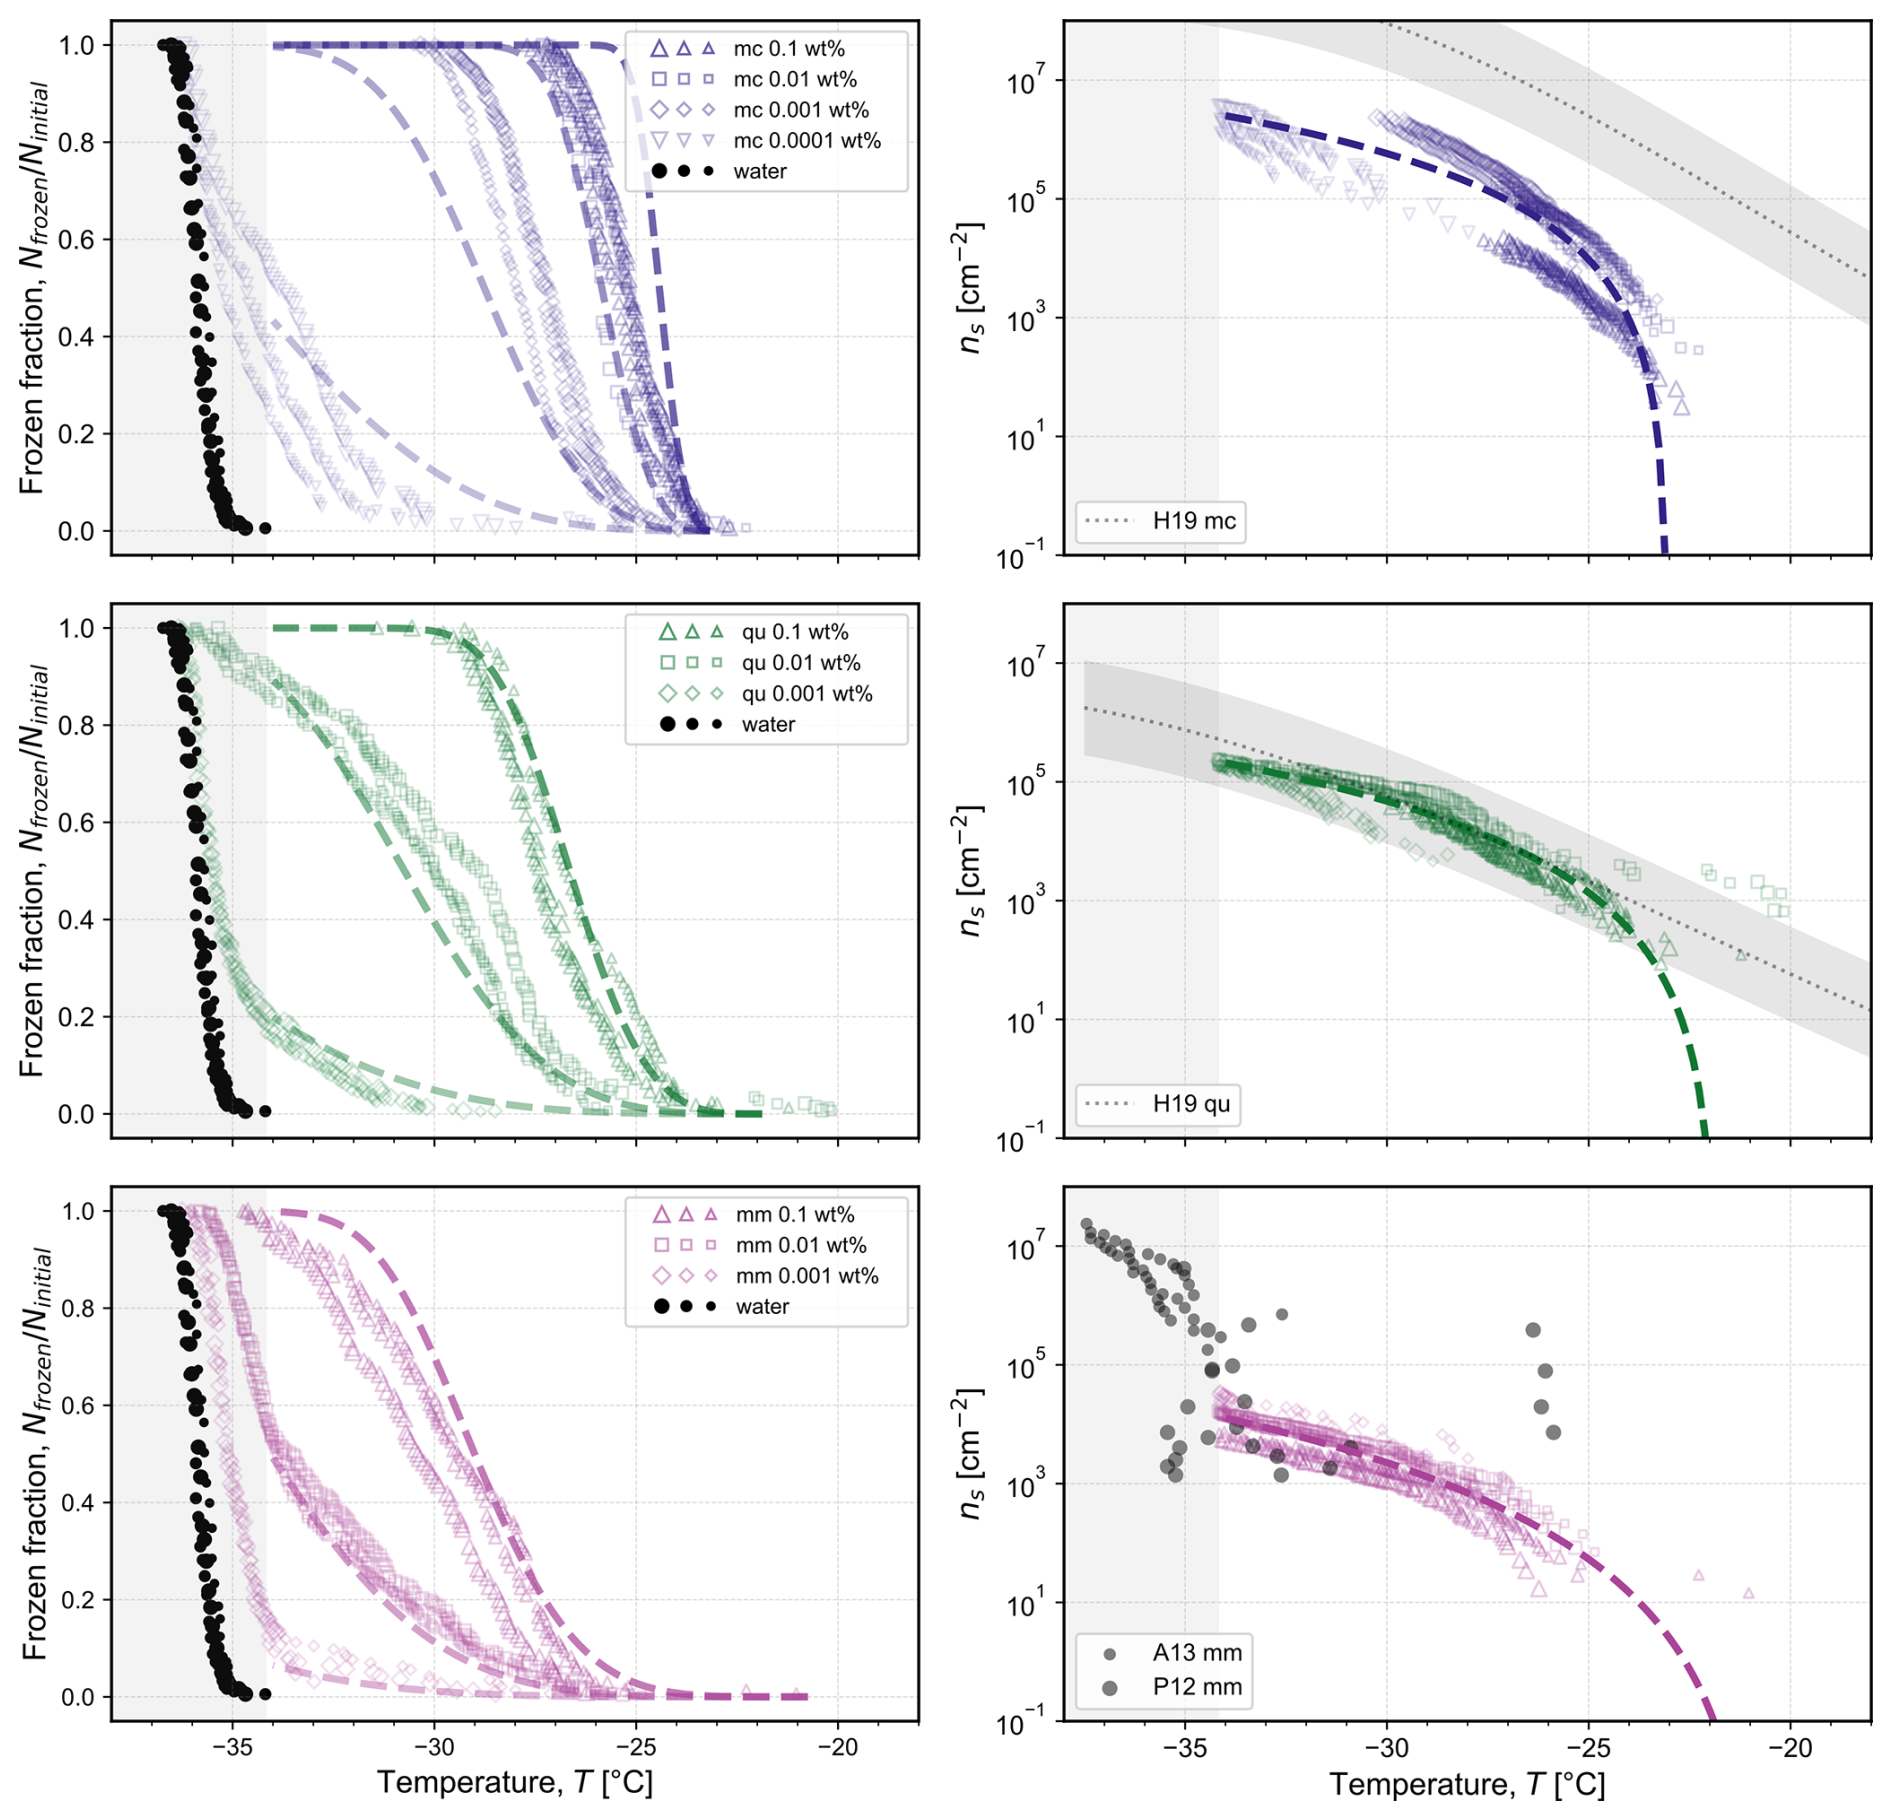
Figure 3Frozen fraction of droplets as a function of temperature for each studied single mineral: microcline (mc) at concentrations of 0.1 wt %, 0.01 wt %, 0.001 wt %, and 0.0001 wt %; quartz (qu) at concentrations of 0.1 wt %, 0.01 wt %, and 0.001 wt %; and montmorillonite (mm) at concentrations of 0.1 wt %, 0.01 wt %, and 0.001 wt %. The measured frozen fraction for the homogeneous freezing of water droplets of the same volume shown with black symbols is reproduced from Isenrich et al. (2022). Each symbol type denotes a different mineral concentration, and the different symbol sizes represent independent populations (i.e., triplicates) of monodisperse droplets with diameters of approximately 75 µm cooled at 1 K min−1 (temperature uncertainty is 0.2 K; Isenrich et al., 2022). The corresponding number of nucleation sites per unit surface area, ns, is plotted as a function of temperature according to Eq. (1) using specific surface areas of 102, 48, and 241 m2 g−1 for mc, qu, and mm, respectively. For comparison, parameterizations or experimental data of ns are plotted and labeled as: H19 from Fig. 7 in Harrison et al. (2019) with shading for the reported uncertainty; A13 from Atkinson et al. (2013); and P12 from Pinti et al. (2012) as calculated by Hoose and Möhler (2012). The dashed lines are model fits for ns as a function of temperature, from which frozen fraction curves are calculated using Eq. (1). The equations are given by: , , and . In all plots, the shaded grey area at the lowest temperatures highlights the region where the homogeneous nucleation of pure water in 75 µm droplets occurs; ns values are thus not plotted in this region.
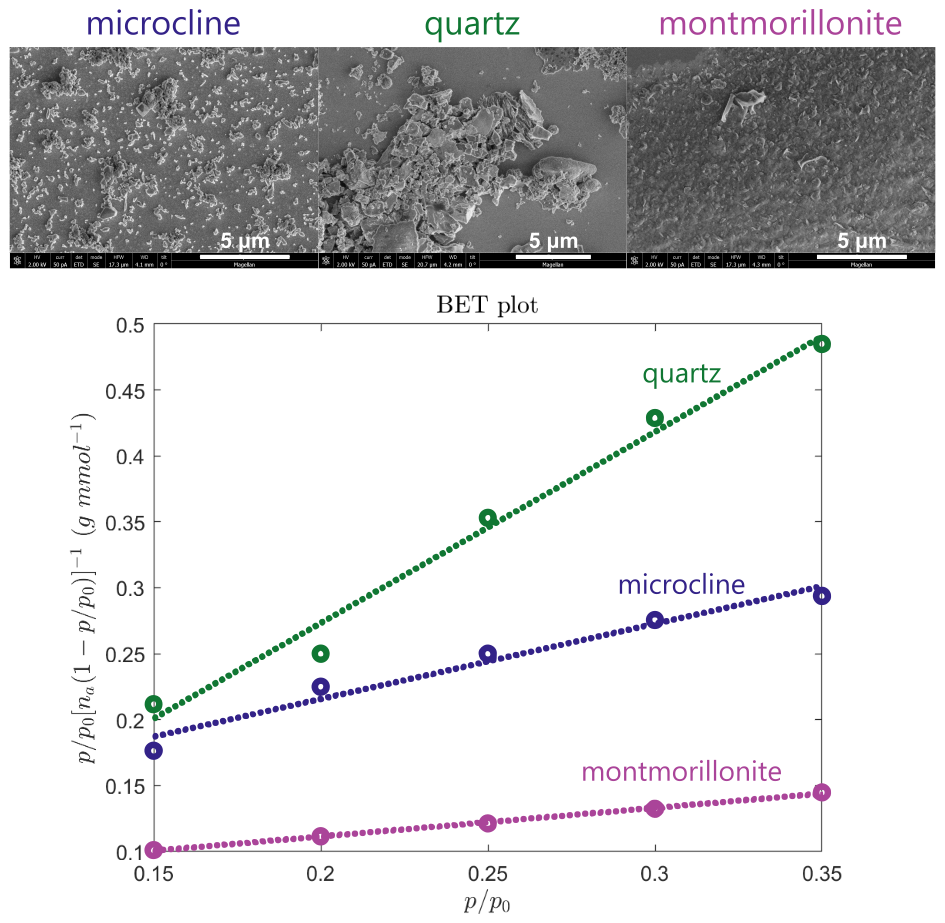
Figure 4Scanning electron microscopy images and linear regressions performed on adsorption isotherm measurements via dynamic vapor sorption (DVS; see Fig. A2) for the determination of the BET surface area of each mineral (microcline, quartz, and montmorillonite) after sonication, filtration, and drying.
Figure 3 also shows the number of nucleation sites per unit surface area, ns, for temperatures above the onset of homogeneous freezing. Equation (1) was used with As=102, 48, and 241 m2 g−1 for microcline, quartz, and montmorillonite, respectively, as obtained from BET analysis of DVS measurements (shown in Fig. 4 alongside SEM images) to convert experimental frozen fractions to ns vs. T. For microcline and montmorillonite, the derived ns values do not agree between different mineral concentrations, which suggests that there are differences in the number of nucleation sites per unit surface area as a function of concentration. However, we cannot exclude the possibility that these apparent discrepancies may be due to deviations in the actual suspension concentrations from the nominal ones in the process of preparing the samples from the stock suspension. To obtain a representative model of the site density, we therefore consider all ns data over all mineral concentrations of a single mineral. The dashed lines in the plots of ns in Fig. 3 are fits obtained using Eq. (2) for microcline, quartz, and montmorillonite with standard deviations (SD) for log 10ns of 0.47, 0.19, and 0.22, respectively. The highest standard deviation is obtained for microcline due to the spread of the experimentally-derived values of ns between different nominal suspension concentrations. The obtained fitting parameters for each pure mineral were used to calculate frozen fractions for each concentration using Eq. (1), as illustrated by dashed lines in Fig. 3, showing close agreement with experimental observations for quartz and montmorillonite. Some of the predicted frozen fractions for microcline, however, deviate from those obtained experimentally, with a steeper slope in frozen fraction predicted for the highest concentration of 0.1 wt % and a shallower slope for the concentration of 0.001 wt %. As in our analysis of ns for microcline, we attribute these discrepancies to potential variation in the actual concentration of the suspensions. The three replicates shown at each concentration were prepared from the same starting suspension and show high reproducibility, while different concentrations were prepared independently, and variability may be greater.
Figure 3 includes representative correlations or experimental data from the literature for nucleation site density as a function of temperature for each mineral. It is difficult to draw an exact comparison between our results and literature reports of ns, since ice activity depends on the exact physicochemical properties of a mineral sample, such as its composition, source, processing (e.g., milling), size, and age. For microcline samples, our results indicate a lower density of nucleation sites compared to literature values (Harrison et al., 2019) by approximately 1–2 orders of magnitude. This may be due to an inherently different ice activity for the sample studied or due to a dependence of ice activity on particle size. We filtered all pure mineral samples through a 0.45 µm filter to narrow the polydispersity of particle sizes between droplets and to reduce the probability of clogging in the microfluidic device; such size selection may influence the resulting ice nucleation behavior if smaller particles have either fewer or inferior active sites. For quartz and montmorillonite samples, our results for ns as a function of temperature broadly align with the representative literature sources. In Atkinson et al. (2013), a different montmorillonite was investigated (STx-1 containing Ca2+) compared to the one used herein (SWy-2 containing primarily Na+), and it has previously been reported to be less ice active than SWy-2 (Pinti et al., 2012; Kumar et al., 2023).
Another contributing factor to the different orders of magnitude of ns for microcline and montmorillonite shown in Fig. 3 may be the uncertainty in the determination of specific surface area (As), both in our work and in previous reports. In the literature, specific surface areas are determined based either on the BET adsorption of nitrogen or on the particle size distribution observed via SEM imaging. Adsorption-based measurements typically yield higher estimates of As because they capture the rough surface features and internal surface area (e.g., pores) of the sample. In addition, BET measurements with water tend to overestimate the surface area compared to the same measurements carried out with nitrogen (Blattmann and Plötze, 2024). The relatively high specific surface areas measured for the studied minerals is partially due to the small particle sizes (filtered through a 0.45 µm filter), but more likely attributed to a significant amount of internal surface area. Assuming a mineral density of ρ=2.6 g cm−3 and a perfectly spherical particle diameter of D=450 nm yields a specific surface area of m2 g−1, which is 1–2 orders of magnitude smaller than the estimated BET values. In comparison, for example, reported specific surface areas of montmorillonite samples range between 22.7 and 350 m2 g−1 (Dogan et al., 2007), with a value of 31.82 m2/g for SWy-2 (Pinti et al., 2012). For microcline samples, reported BET specific surface areas have typical values of around 2–3 m2 g−1 (1.91 m2 g−1, Kumar et al., 2018); 1.6 m2 g−1, Klumpp et al., 2022; 3.2 m2 g−1, Atkinson et al., 2013; and 1.8–3 m2 g−1, Peckhaus et al., 2016). For quartz, a value of 5.5 m2 g−1 was previously reported by Zolles et al. (2015) in a sample where 80 % of the particles had sizes between 1 and 5 µm. Thus, the combination of smaller particle sizes and significant internal surface area contributes to the difference in the magnitude of the specific surface areas for the pure minerals studied herein compared to the literature.
3.2 Freezing temperatures of binary mineral mixtures
Three binary mixtures containing microcline, quartz, and montmorillonite are shown in Fig. 5 in comparison to the pure minerals at the concentrations that comprise the mixture. For both mixtures containing 0.01 wt % microcline (Fig. 5a and b), there is no significant difference between the experimental frozen fractions of the mixture and those of the pure microcline (symbols), as expected based on the predictions using Eq. (4) assuming additivity of the pure minerals' surface areas (solid lines). Even though the concentrations of quartz and montmorillonite in their respective binary mixtures are 10× that of microcline, the active sites on quartz and montmorillonite were less active than those of microcline. For the mixture containing 0.01 wt % quartz and 0.1 wt % montmorillonite, the frozen fractions follow the same trend as the individual minerals' frozen fraction, which are themselves indistinguishable at these concentrations. Even though there was more surface area available for nucleation to occur in the binary mixture, there was no increase in the observed nucleation temperature, suggesting that the 0.01 wt % quartz and 0.1 wt % montmorillonite surfaces do not have a detectable additive effect. This is likely because the available surface area was only doubled, and this change did not lead to a measurable change in the frozen fraction within the variability of replicate experiments, as is shown by the solid line in Fig. 5c depicting the frozen fraction calculated using Eq. (4) with the pure quartz and montmorillonite fits of ns. To detect a significant enough change in the frozen fraction, the available surface area would need to increase by a larger factor, such as that between 0.01 wt % quartz and 0.1 wt % quartz leading to the shift in frozen fraction shown in Fig. 3.
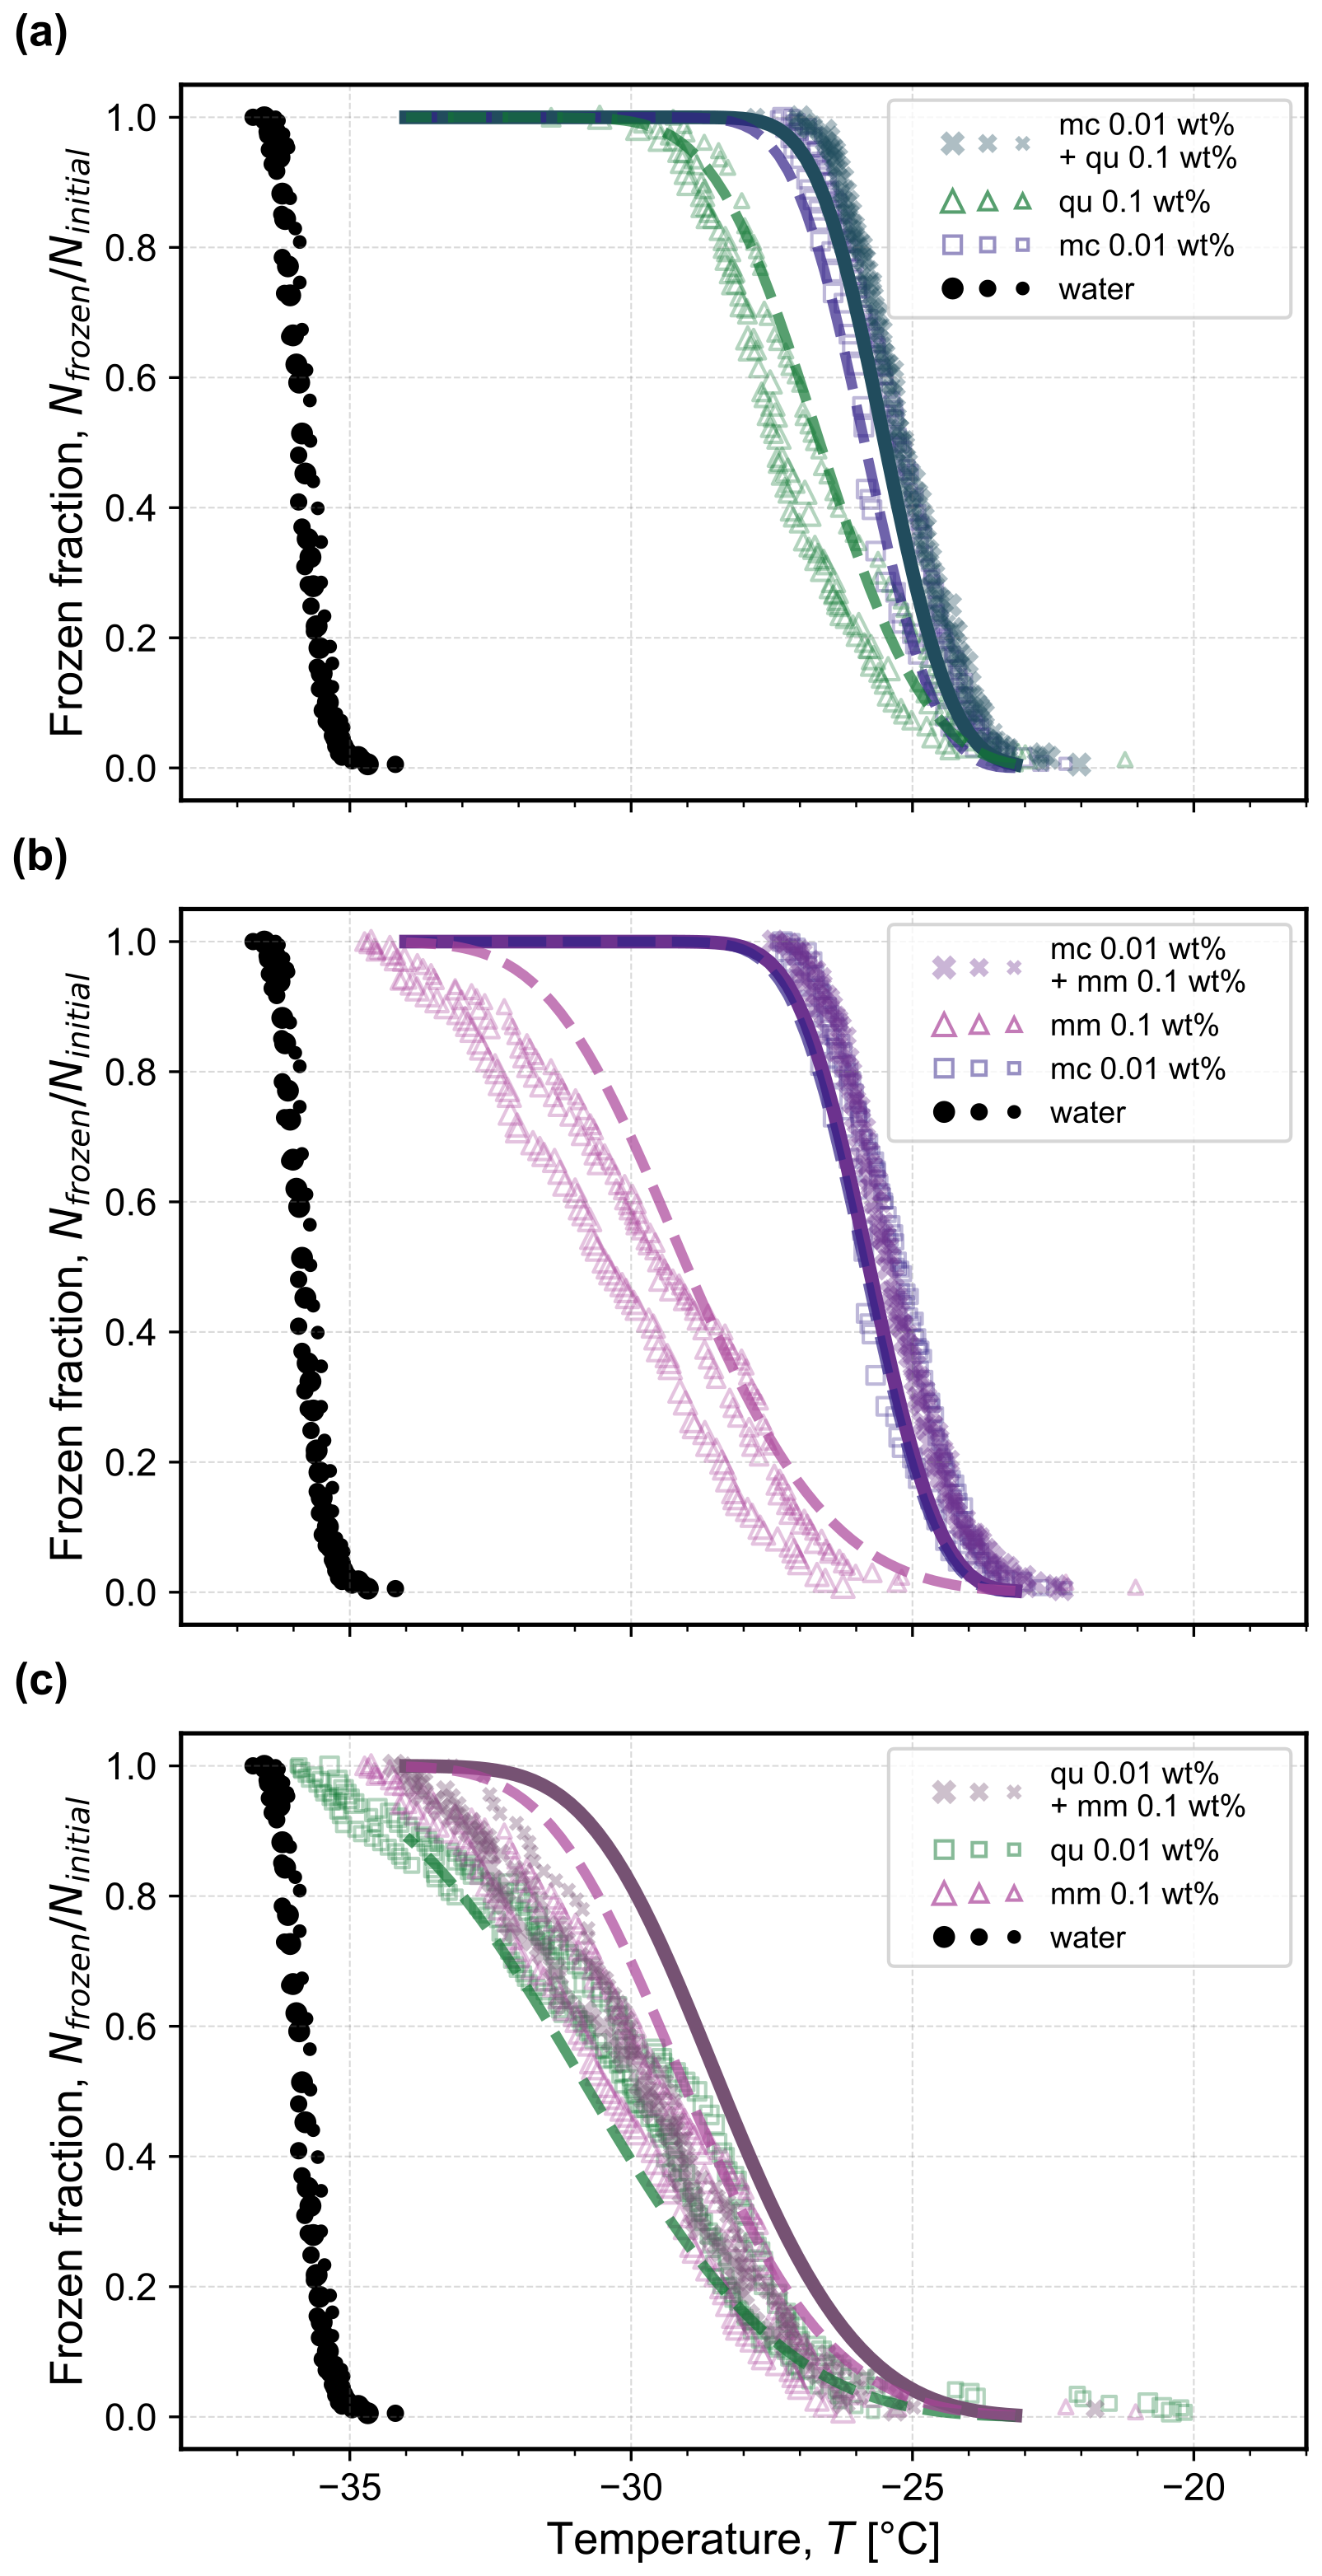
Figure 5Frozen fraction of droplets as a function of temperature for three binary mixtures where the most active single mineral dictates the mixture's freezing behavior: (a) 0.01 wt % microcline (mc) and 0.1 wt % quartz (qu); (b) 0.01 wt % microcline and 0.1 wt % montmorillonite (mm); and (c) 0.01 wt % quartz and 0.1 wt % montmorillonite. The constituent single-mineral frozen fractions are reproduced from Fig. 3 for comparison at the corresponding concentration in each mixture. The measured frozen fraction for the homogeneous freezing of water droplets of the same volume shown with black symbols is reproduced from Isenrich et al. (2022). Each symbol size represents an independent population of monodisperse droplets (i.e., triplicates) with diameters of approximately 75 µm cooled at 1 K min−1 (temperature uncertainty is 0.2 K; Isenrich et al., 2022). Dashed lines are calculated from the pure component fits of ns vs. T using Eq. (1), and solid lines are predictions (not fits) using Eq. (4) with input of the pure component ns fits.
When the microcline concentration was decreased from 0.01 wt % to 0.001 wt % in the binary mixtures with quartz and montmorillonite, the nucleation temperatures of the droplets decreased accordingly, as shown in Fig. 6. In the binary mixture containing microcline and quartz, there is no significant change in the frozen fraction curves compared to the individual minerals' frozen fractions that were observed experimentally (open triangles and diamonds). In the binary mixture containing microcline and montmorillonite, however, there was a significant proportion of droplets freezing in the tail end at even lower temperatures than observed for droplets containing pure microcline. This observation can also be seen by directly comparing the microcline–quartz mixture with the microcline–montmorillonite mixture, as shown in Fig. 6c. Here, approximately 15 % of the microcline–montmorillonite droplets froze at temperatures below −30 °C, where there was no observed freezing for the microcline–quartz mixture.
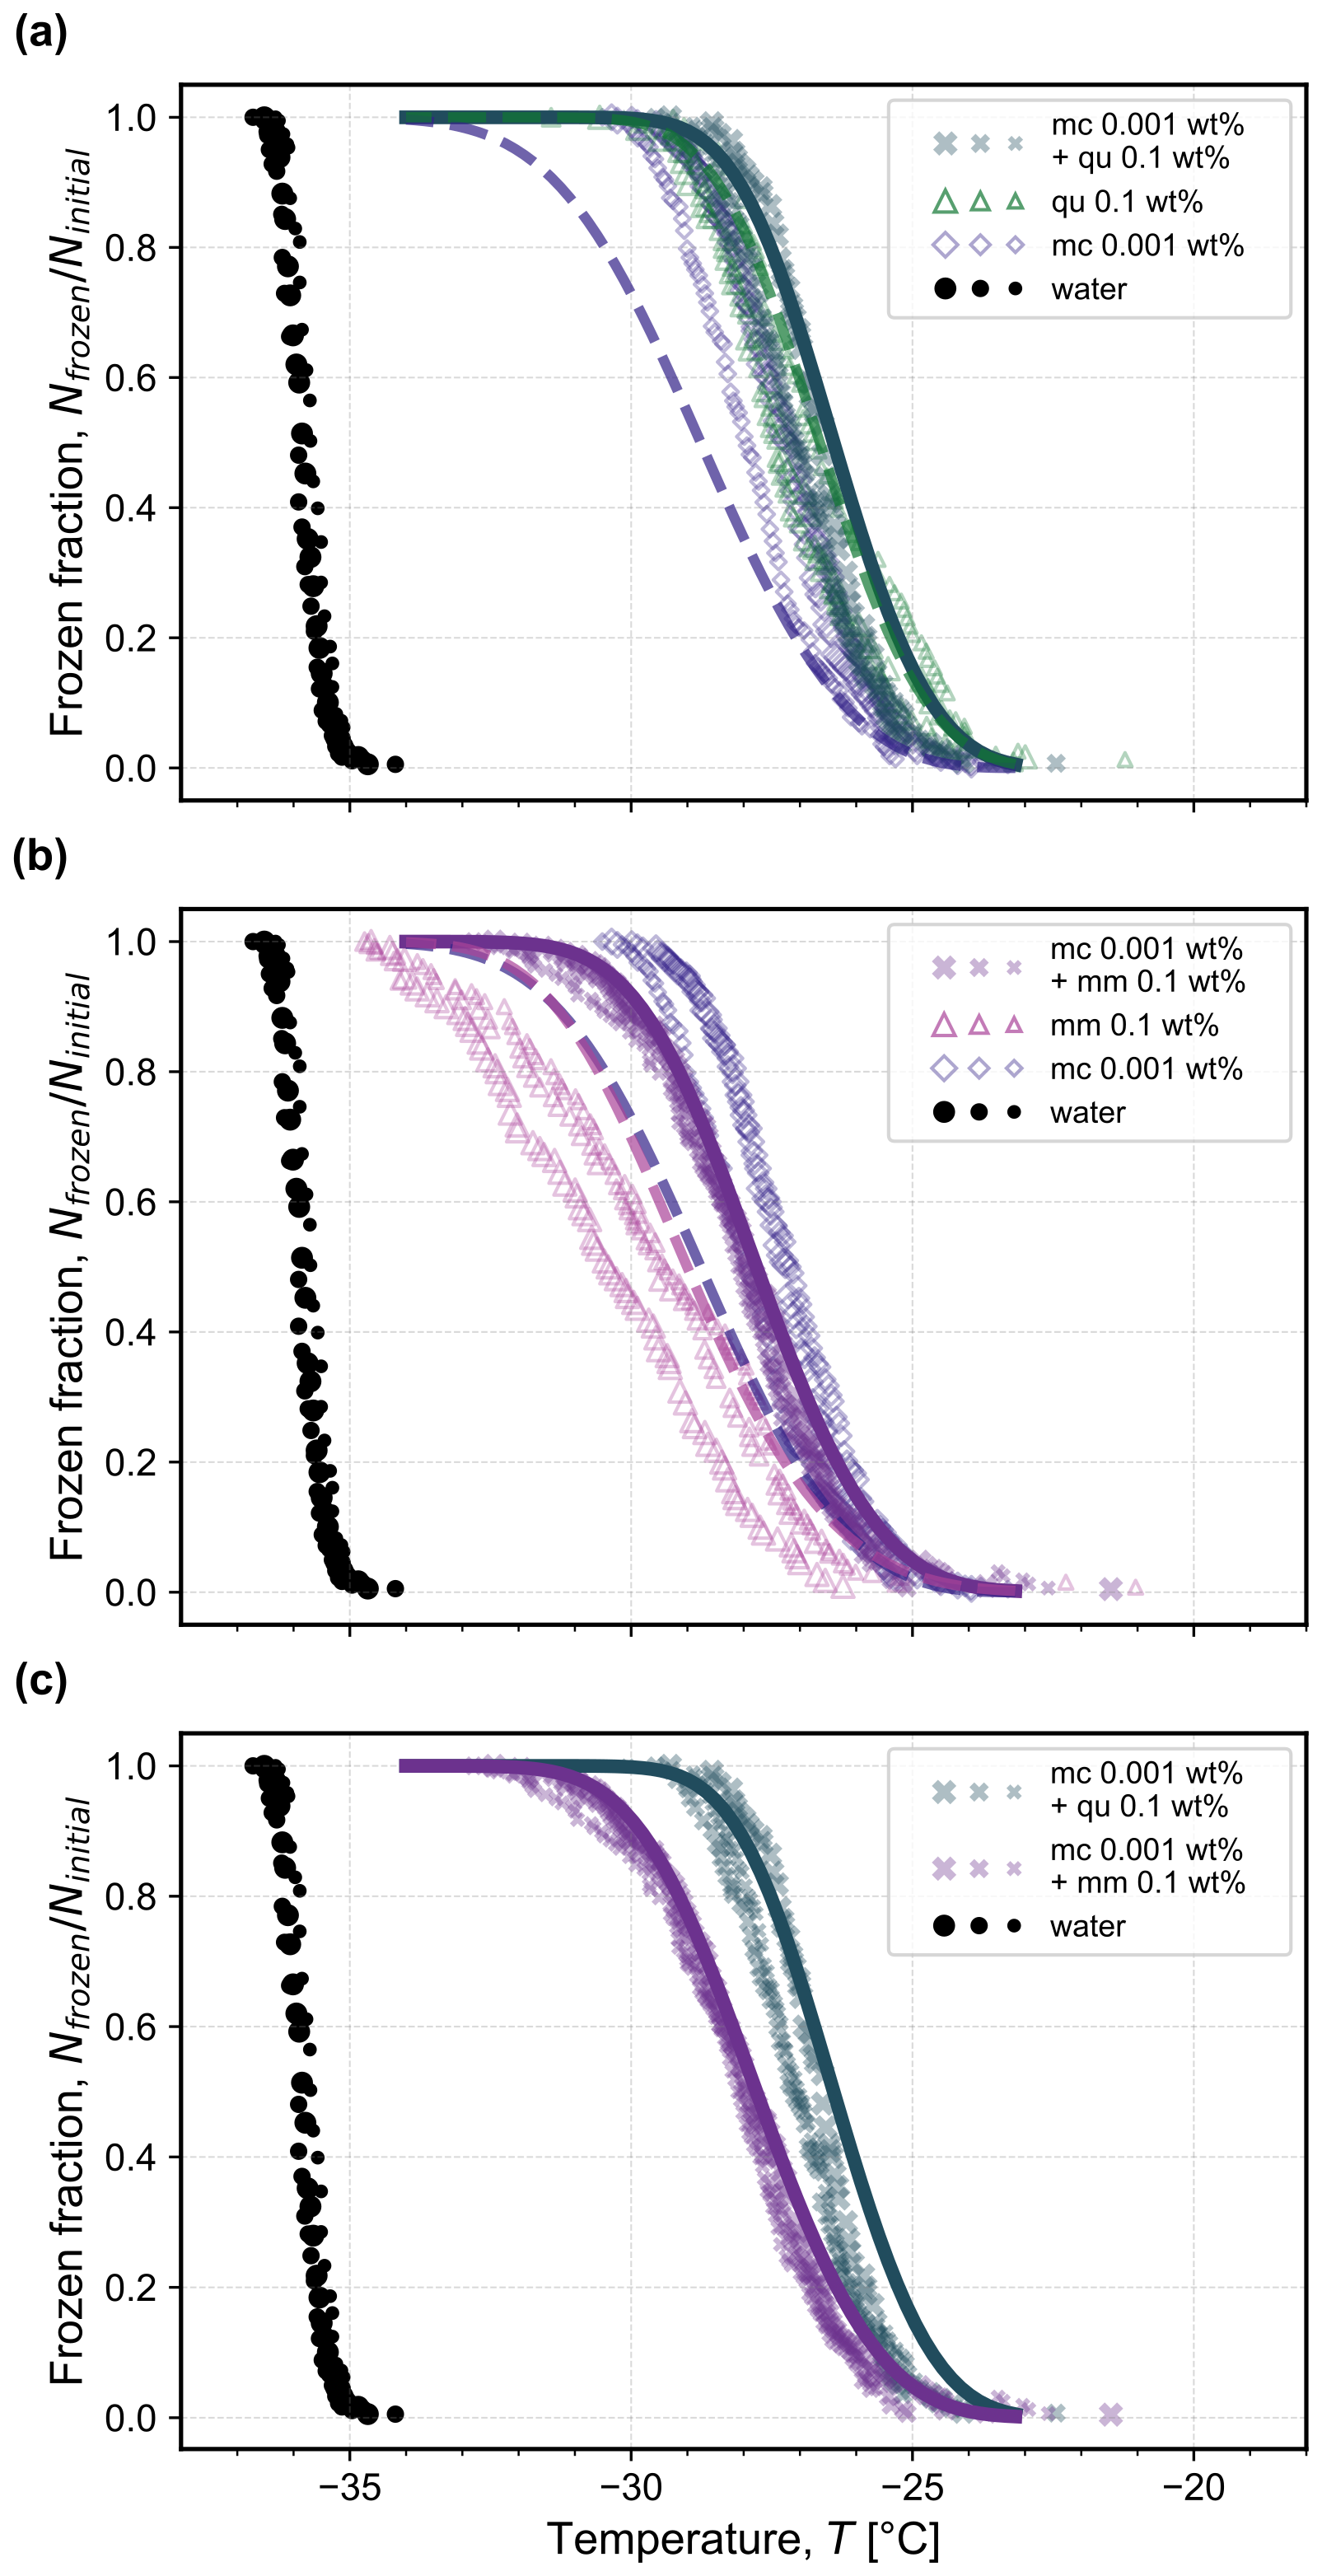
Figure 6Frozen fraction of droplets as a function of temperature for two binary mixtures containing 0.001 wt % microcline (mc) and (a) 0.1 wt % quartz (qu) or (b) 0.1 wt % montmorillonite (mm). The constituent single-mineral frozen fractions are reproduced from Fig. 3 for comparison at the corresponding concentration in each mixture. In (c), the binary mixtures are directly compared to highlight the noticeable reduction in ice nucleation activity in the presence of 0.1 wt % montmorillonite compared to 0.1 wt % quartz with the same concentration of 0.001 wt % microcline. The measured frozen fraction for the homogeneous freezing of water droplets of the same volume shown with black symbols is reproduced from Isenrich et al. (2022). Each symbol size represents an independent population of monodisperse droplets (i.e., triplicates) with diameters of approximately 75 µm cooled at 1 K min−1 (temperature uncertainty is 0.2 K; Isenrich et al., 2022). Dashed lines are calculated from the pure component fits of ns vs. T using Eq. (1), and solid lines are predictions (not fits) using Eq. (4) with input of the pure component ns fits.
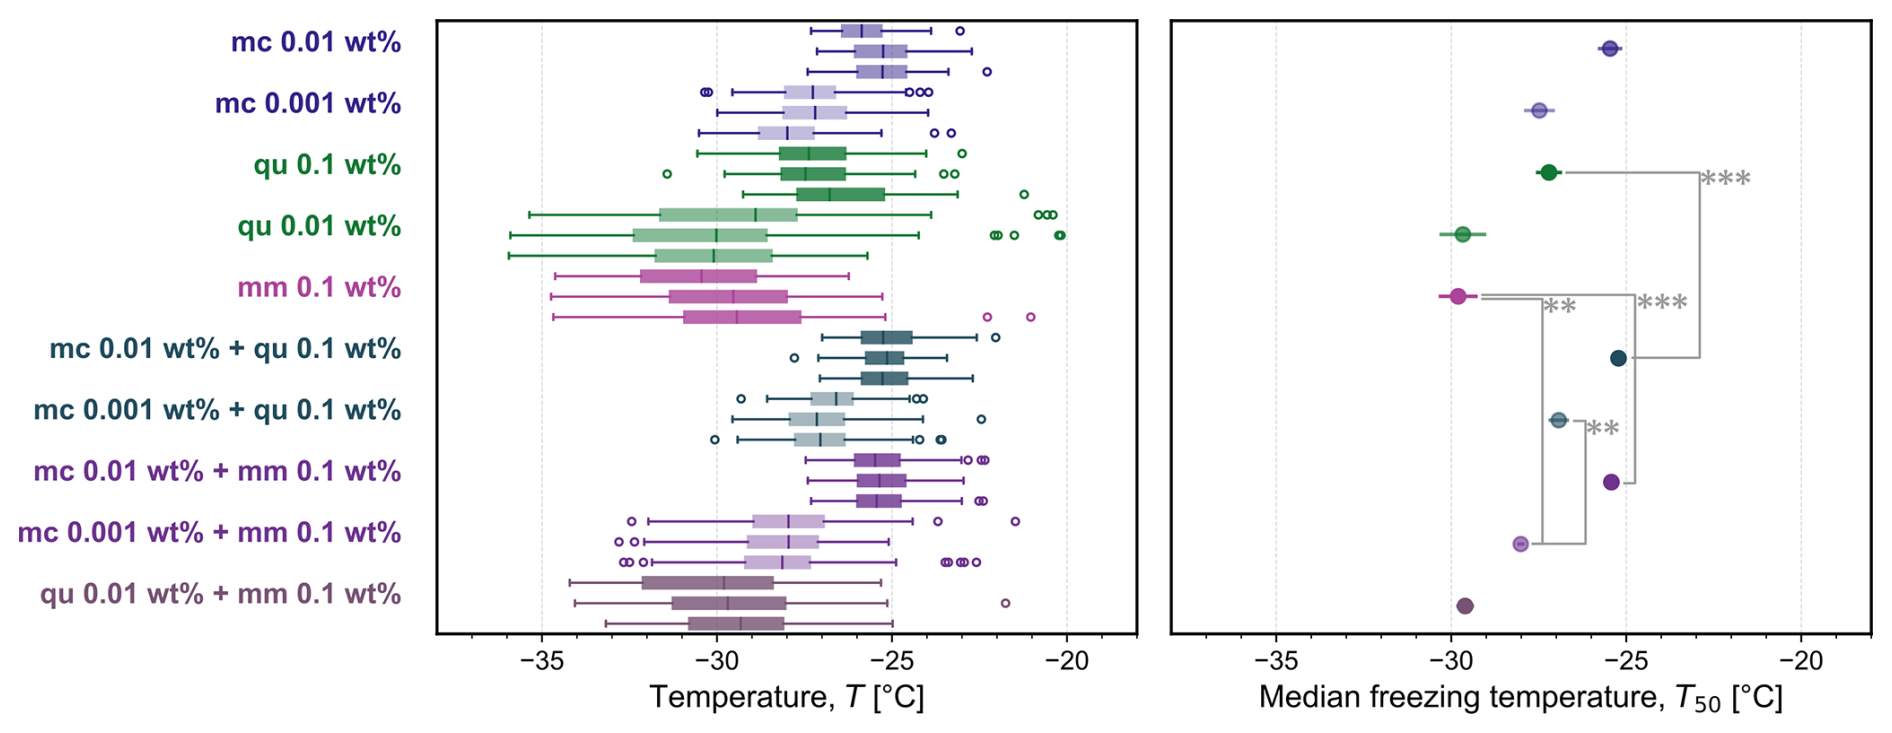
Figure 7Box plot of the freezing temperatures for a subset of all experiments shown in Fig. A3: pure microcline (mc 0.01 wt % and 0.001 wt %), quartz (qu 0.1 wt % and 0.01 wt %), montmorillonite (mm 0.1 wt %), and all studied binary mixtures in triplicate. In each box plot, the vertical line indicates the median freezing temperature, the upper and lower bounds of the box stretch across the 25th to 75th percentiles, whiskers span the maximum and minimum temperatures, and open circles are outliers beyond 1.5 times the interquartile range. The corresponding average median temperature T50 is plotted for each set of three experiments (error bars show one standard deviation). Four significant differences in median freezing temperature are labeled with two or three asterisks to denote that Welch's unequal variances t test yielded p≤0.01 () or p≤0.001 ().
One possible explanation for the extended tail of the distribution could be that the 100× higher concentration of montmorillonite compared to microcline may interfere with the activity of microcline in solution. SWy-2 montmorillonite is a clay mineral that releases Na+ ions when suspended in water, and we hypothesize that these ions may exchange with the K+ ions at the surface of the microcline. Such ionic interactions between microcline and dissociated species were hypothesized by Kumar et al. (2018) to explain the enhancement or reduction in the ice-nucleation activity of microcline suspensions containing different combinations of NH, Na+, K+, SO, Cl−, and NO. The presence of any cation except NH decreased the ice-nucleation activity of microcline at the studied concentrations. Whale et al. (2018) and Hamzehpour et al. (2022) also reported a reduction in the activity of microcline in the presence of NaCl. In addition, Yun et al. (2020, 2021) observed a reduction of microcline's ice-nucleation activity in the presence of inorganic acids and carboxylic acids (Yun et al., 2021) and NaNO3 (Yun et al., 2020). It is therefore likely that the surface interaction of microcline with Na+ ions from montmorillonite explains why the frozen fraction curves of microcline–montmorillonite droplets lie between the frozen fraction curves of the pure minerals at their respective concentrations. In contrast, at the higher concentration of microcline (0.01 wt %) in the binary mixture with montmorillonite shown in Fig. 5b, we hypothesize that the concentration of montmorillonite was insufficient (only 10× higher than microcline) to fully exchange surface ions; there was therefore no perceptible change in the frozen fraction of the mixture compared to that of pure microcline at the same composition.
Yet we cannot exclude the possibility that experimental variability in the determination of microcline's ice nucleation activity explains the observed tail of the microcline–montmorillonite mixture compared to the microcline–quartz mixture. As shown in Fig. 3, the trend of ns vs. T for microcline derived from experimental frozen fractions does not collapse onto a single line over all studied concentrations, and in Fig. 6, the obtained fit for ns to this data thus yields a frozen fraction at lower temperatures (dashed blue line) than those observed experimentally at a nominal microcline concentration of 0.001 wt % (open diamonds). If the true activity of 0.001 wt % microcline is represented by the dashed blue line, then the frozen fraction observed in Fig. 6a for microcline–quartz is explained by the inherent activity of a 0.1 wt % quartz suspension, and the frozen fraction observed in Fig. 6b for microcline–montmorillonite is explained by the additive activity of each constituent, as depicted by the solid purple line calculated using Eq. (4).
Figure 7 highlights the freezing behavior of some studied aqueous suspensions containing pure minerals and their binary mixtures, and all experiments are shown in Fig. A3. The corresponding average median temperature T50 for each set of three independent experiments at each concentration is also shown. A statistical comparison of all pairs of T50 was carried out (Table A1), highlighting several significant differences between pure components and the binary mixtures, as shown in Fig. 7 denoted by asterisks. In mixtures containing microcline at 0.01 wt %, the median freezing temperature is greater than that of the second component, whether it is quartz or montmorillonite. As seen previously in Fig. 6, we confirm that there is a statistically significant difference (according to Welch's unequal variances t test) between the median freezing temperature of the microcline–quartz and microcline–montmorillonite mixtures when microcline was present at a concentration of 0.001 wt %. We also confirm that there is no statistically significant difference between the median freezing temperature of the mixture containing microcline at 0.001 wt % and quartz at 0.1 wt % when compared to the median freezing temperatures of the pure minerals at the same concentrations (also seen in Fig. 6).
Figure 7 also shows the relative unimportance of quartz in the quartz–microcline mixtures even when the mass of quartz is ten or a hundred times that of microcline. This is an interesting comparison to the results of Chatziparaschos et al. (2023), who modelled ice nucleation in a global climate model and determined that the percentage of ice crystals forming on quartz particles was more than 35 % when the mass of quartz was 6× that of feldspar. This difference may be a result of the droplets herein containing an internal mixture of quartz and microcline instead of each droplet containing either quartz or microcline. In a cloud, each droplet would only contain a single ice-nucleating particle (an external mixture), and thus particles that are less active can still contribute to the frozen fraction, because ice nucleation is not initiated at a higher temperature by the presence of a particle that is more active.
3.3 Freezing temperatures of Arizona test dust (ATD) suspensions
Figure 8 summarizes the observed frozen fractions and corresponding nucleation site densities for suspensions of ATD at three concentrations (symbols). As expected, the freezing temperatures decreased as the concentration decreased, in line with the decrease in surface area available for freezing. Normalizing based on the surface area through Eq. (1) shows that all results collapse onto a single curve of ns as a function of temperature. The specific surface area has been shown to vary as a function of particle size; for example, Ibrahim et al. (2018) reported a value of 37.8±1.7 m2 g−1 for the 0–3 µm nominal size range and a value of 2.8±0.4 m2 g−1 for the 40–80 µm nominal size range. We assume a specific surface area of 22 m2 g−1 from Ibrahim et al. (2018) for the fraction of particle sizes between 5 and 10 µm to represent the specific surface area of the A1 Ultrafine ATD investigated herein, which is documented to have 95.5 %–97.5 % of particles being <11 µm in size by the supplier. Our results for nucleation site density are lower than representative literature sources (Wheeler et al., 2015; Hader et al., 2014), possibly due to natural variation in the source material or a different assumption for the specific surface area. As reported by Kaufmann et al. (2016), ATD consists primarily of microcline, quartz, and montmorillonite (29 wt %, 23 wt %, and 25 wt %, respectively, for a total of 77 wt %), while for a sample containing the nominal 0–3 µm fraction analyzed by Broadley et al. (2012), the composition was 33.2 wt.% feldspar and 17.1 wt % quartz, with 10.2 wt % being an illite–smectite mixed layer). No individual component is present at concentrations orders-of-magnitude higher than the others, in contrast to the experiments performed for binary mixtures shown in Figs. 5 and 6. Instead, all three minerals are present in similar proportion, and all provide a comparable surface area for ice nucleation.
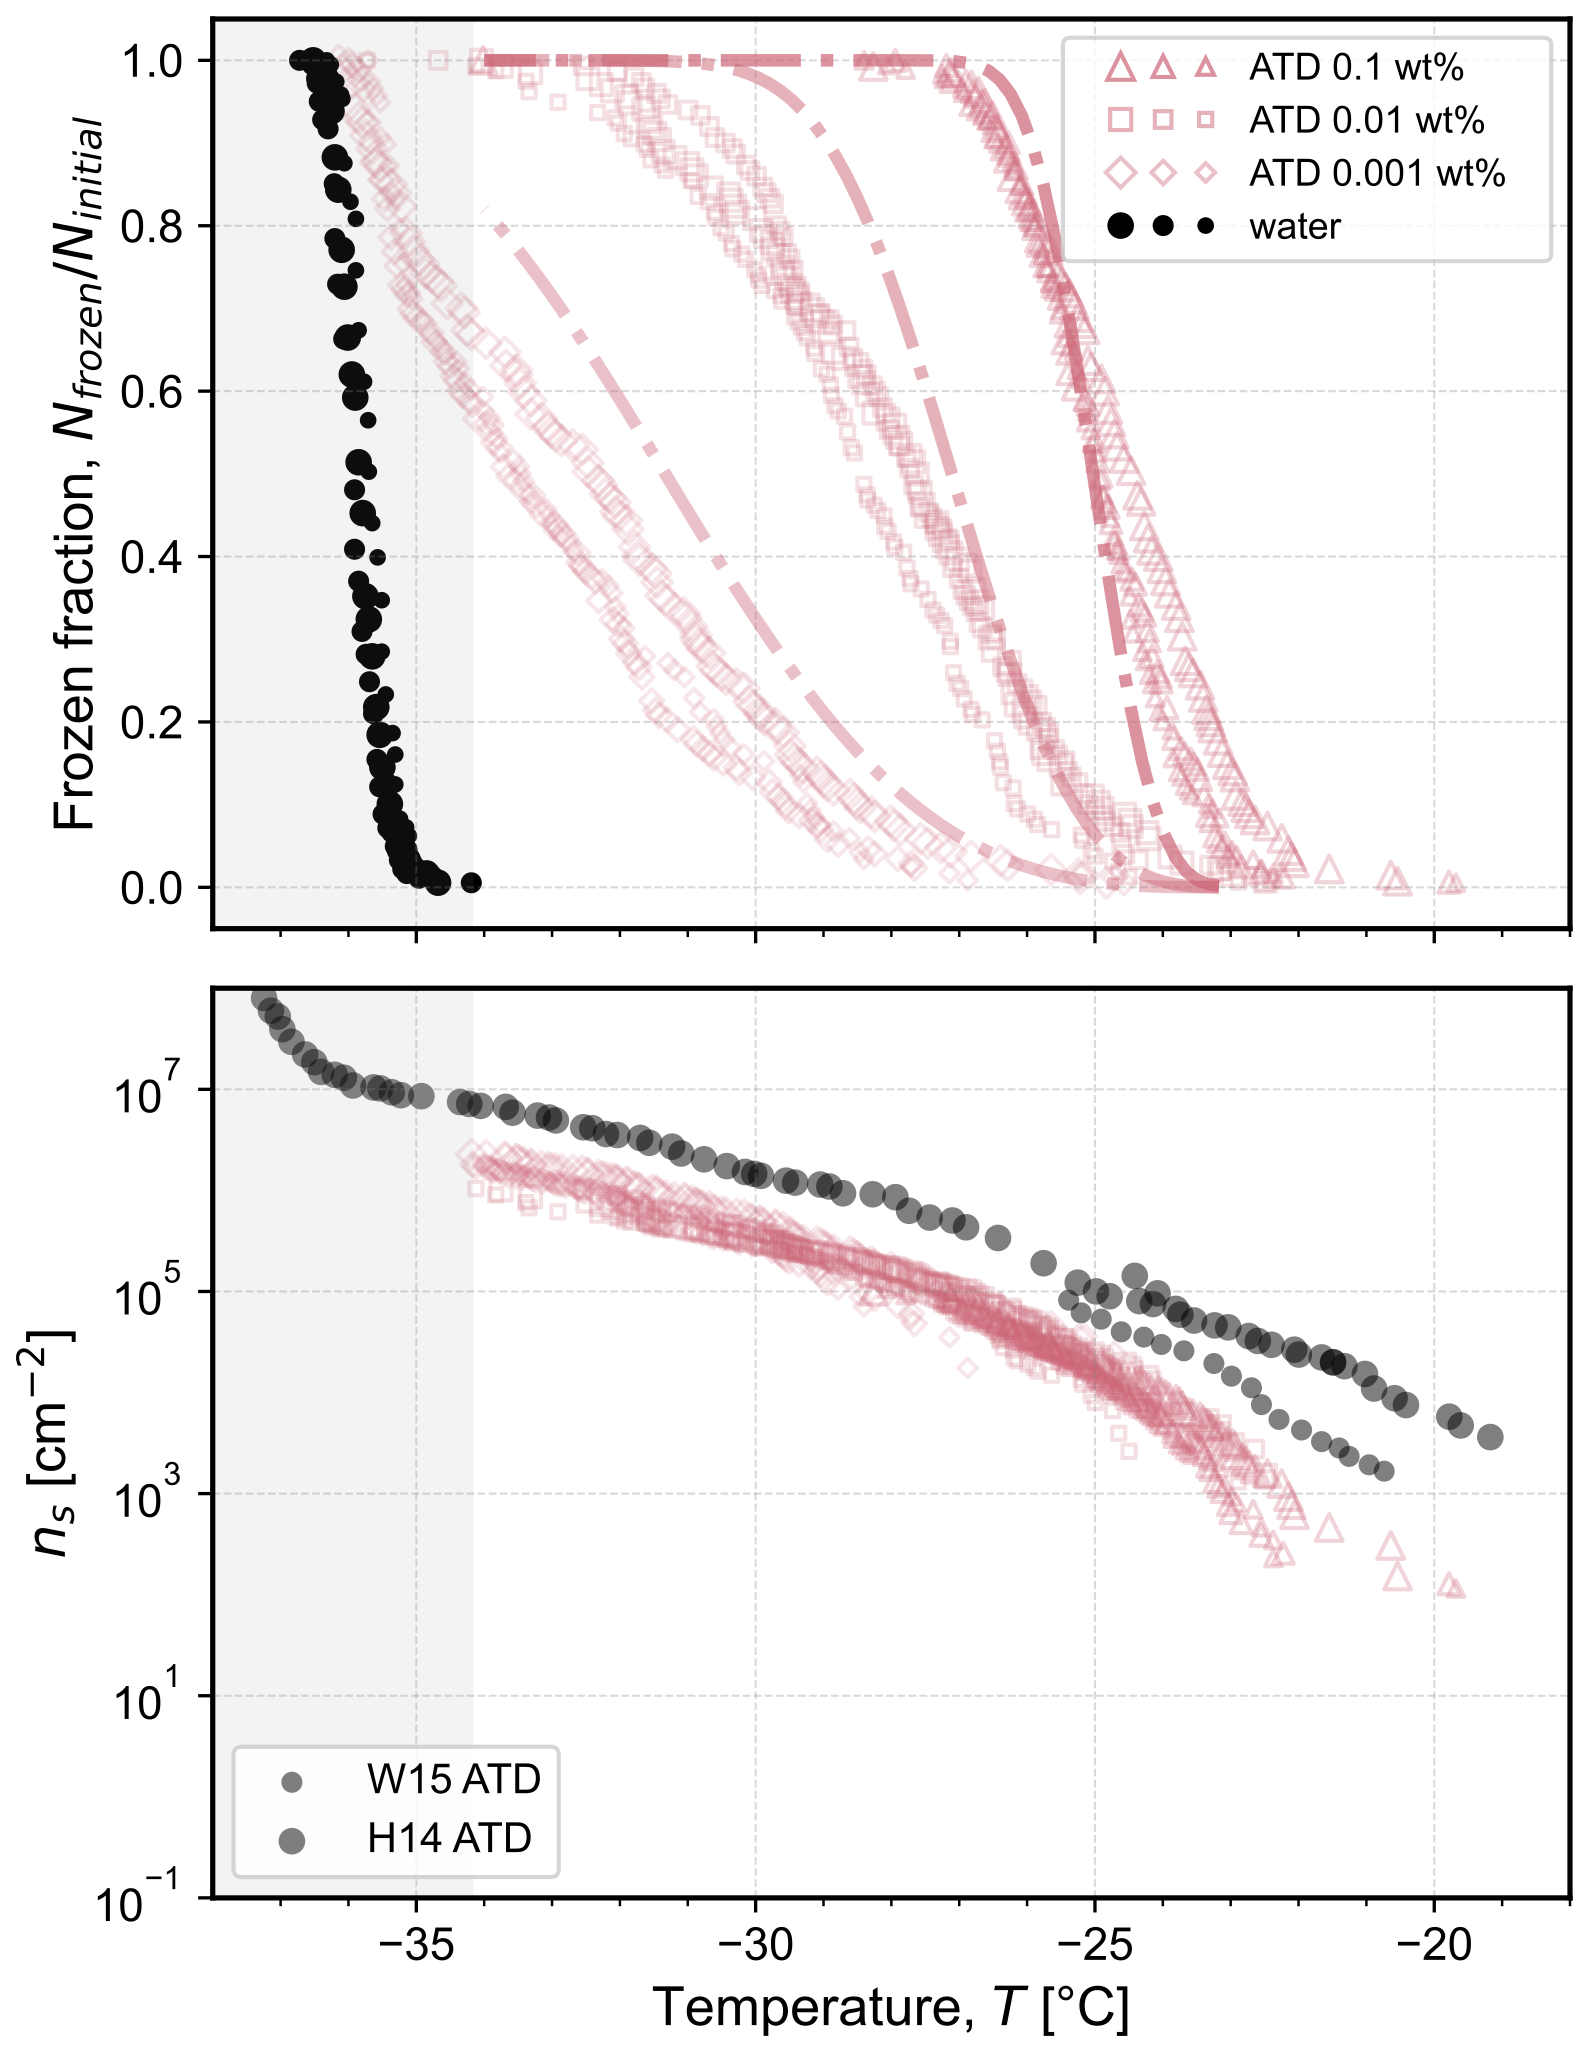
Figure 8Frozen fraction of droplets as a function of temperature for Arizona Test Dust (ATD; A1 Ultrafine) at concentrations of 0.1 wt %, 0.01 wt %, and 0.001 wt %. The measured frozen fraction for the homogeneous freezing of water droplets of the same volume shown with black symbols is reproduced from Isenrich et al. (2022). Each symbol type represents a different concentration, and different symbol sizes represent independent populations of monodisperse droplets with diameters of approximately 75 µm cooled at 1 K min−1 (temperature uncertainty is 0.2 K; Isenrich et al., 2022). The dash-dotted lines are predictions (not fits) of frozen fractions calculated using Eq. (4) with inputs of each pure mineral's nucleation site density vs. temperature shown in Fig. 3 assuming an ATD composition of 29 wt % microcline, 23 wt % quartz, and 25 wt % montmorillonite. The corresponding number of nucleation sites per unit surface area, ns, is plotted as a function of temperature according to Eq. (1) from the experimental frozen fractions using a specific surface area of 22 m2 g−1, as reported by for particles between 5 and 10 µm by Ibrahim et al. (2018). For comparison, experimental data of ns are plotted (circles) and labeled as: W15 digitized from Wheeler et al. (2015); and H14 digitized from Hader et al. (2014) (data labeled unfiltered). The shaded grey area at the lowest temperatures highlights the region where the homogeneous nucleation of pure water in 75 µm droplets occurs; ns values are thus not plotted in this region.
The median freezing temperatures at each concentration are in the same range as those that would be expected for the fraction of microcline present. If we assume the composition of ATD to be that reported by Kaufmann et al. (2016) (i.e., 29 wt % microcline, 23 wt % quartz, and 25 wt % montmorillonite), we obtain the predictions of frozen fraction shown by the dash-dotted lines for each concentration of ATD in Fig. 8 using Eq. (4) with the fits obtained from each pure mineral's nucleation site density (shown in Fig. 3). There is general agreement between the experimental frozen fractions for ATD and the predicted frozen fractions obtained from the activity of the pure components. This agreement suggests that samples mixed from the pure components can explain the ice nucleation activity of samples that were collected as mixtures from the air or ground, such as ATD. Such an observation can inform future work in: (i) the design of experimental campaigns with controlled bottom-up mineral mixtures acting as surrogates of real field samples without their variability and complexity, and (ii) the development of composition-aware parameterizations for ice nucleation in the atmosphere.
This work provides a systematic investigation of the ice-nucleation behavior of single minerals and their binary mixtures suspended in varying proportions in microfluidic droplets. The monodispersity and large number of microfluidic droplets in a single experiment provide an important benefit in ensuring the reliable statistical interpretation of results. To process the images obtained from each experiment, a neural network MINCZ-Net was developed to accelerate image processing followed by expert confirmation. One challenge of the microfluidic technique is that pre-processing of the mineral sample was needed to prevent microfluidic channel clogging and to ensure a more homogeneous distribution of particle sizes in the generated droplets. Herein, we filtered all single minerals, and filtration of the montmorillonite was especially challenging due to its swelling behavior. Therefore, such a microfluidic approach is likely better suited for investigating aerosol particles that are inherently smaller via collection by filters or with impactors. Soil samples or crushed mineral samples may have a larger share of supermicron particles that may settle in the tubing or in the microfluidic device, and pre-processing may lead to the exclusion of ice-active material.
A comparison of the active site density of the single mineral microcline to literature results showed a bias towards lower densities, and this difference may be due to the filtration exposing a size-dependence in the ice-nucleation activity (either in the number of sites or their activity). Alternatively, the difference may be accounted for by inherent differences in activity between mineral samples in the literature depending on their source, purity, and processing (e.g., by milling). For the studied binary mixtures, the observed freezing behavior generally followed that of the single most ice-active mineral, and this can be explained by the fact that the minerals are internally mixed within each droplet. Finally, the freezing behavior of Arizona Test Dust (ultrafine fraction) also followed its mineralogical composition (i.e., similar to that of the investigated pure microcline), while its active site density was biased to lower values than those reported in literature, possibly due to uncertainties in the specific surface area or due to inherently different sample-to-sample activity.
This systematic study of three common atmospheric mineral types (microcline, quartz, and montmorillonite) over a wide range of compositions and binary mixture combinations will provide useful input for the design of aerosol- and composition-aware parameterizations of ice nucleation in the presence of multi-mineral particles in the atmosphere. Future work using the microfluidic instrument could investigate the impact of particle size on ice-nucleation activity, other mixtures beyond mineral dusts (e.g., of biological origin), or the effect of solutes in a mixture, while fine-tuning of CNN-supported image processing could lead to rapid analysis of experimental data.
A1 XRD analysis and DVS isotherms
The composition and purity of natural microcline and montmorillonite were determined using powder X-ray diffraction (XRD). To this end, approximately 1–3 mg of finely-ground sample powders was loaded on a low-background single-crystal silicon holder. Powder XRD measurements were conducted using an Empyrean 3 diffractometer (Malvern Panalytical) equipped with a Cu source (Cu Kα=1.5406 A, 40 kV, 40 mA) and secondary graphite monochromator at the Institute of Geochemistry and Petrology, Department of Earth and Planetary Sciences, ETH Zurich. The diffraction patterns were continuously collected from 5 to 90° (2θ) with a step size of 0.013° and a 65 s dwell time at ambient temperature using a PIXcel1D detector. Phase identification and Rietveld refinements were carried out using HighScore software and the Crystallography Open Database (COD) to identify the mineralogy and estimate modal abundances. The XRD spectrum for the microcline sample is shown in Fig. A1.
Figure A2 shows the adsorption isotherm for each pure mineral using dynamic vapor sorption (DVS).
A2 Statistical analysis
A summary of all experiments reported in the main text is shown in Fig. A3, and the corresponding statistical analysis of each pairwise comparison is reported in Table A1.
Table A1Statistical comparison between the median freezing temperatures (T50) of each single mineral and binary mixture studied shown in Fig. A3. Differences are tested using Welch's unequal variances t test and classified into the following categories: not significant (ns), p≤0.05 (*), p≤0.01 (), and p≤0.001 ().
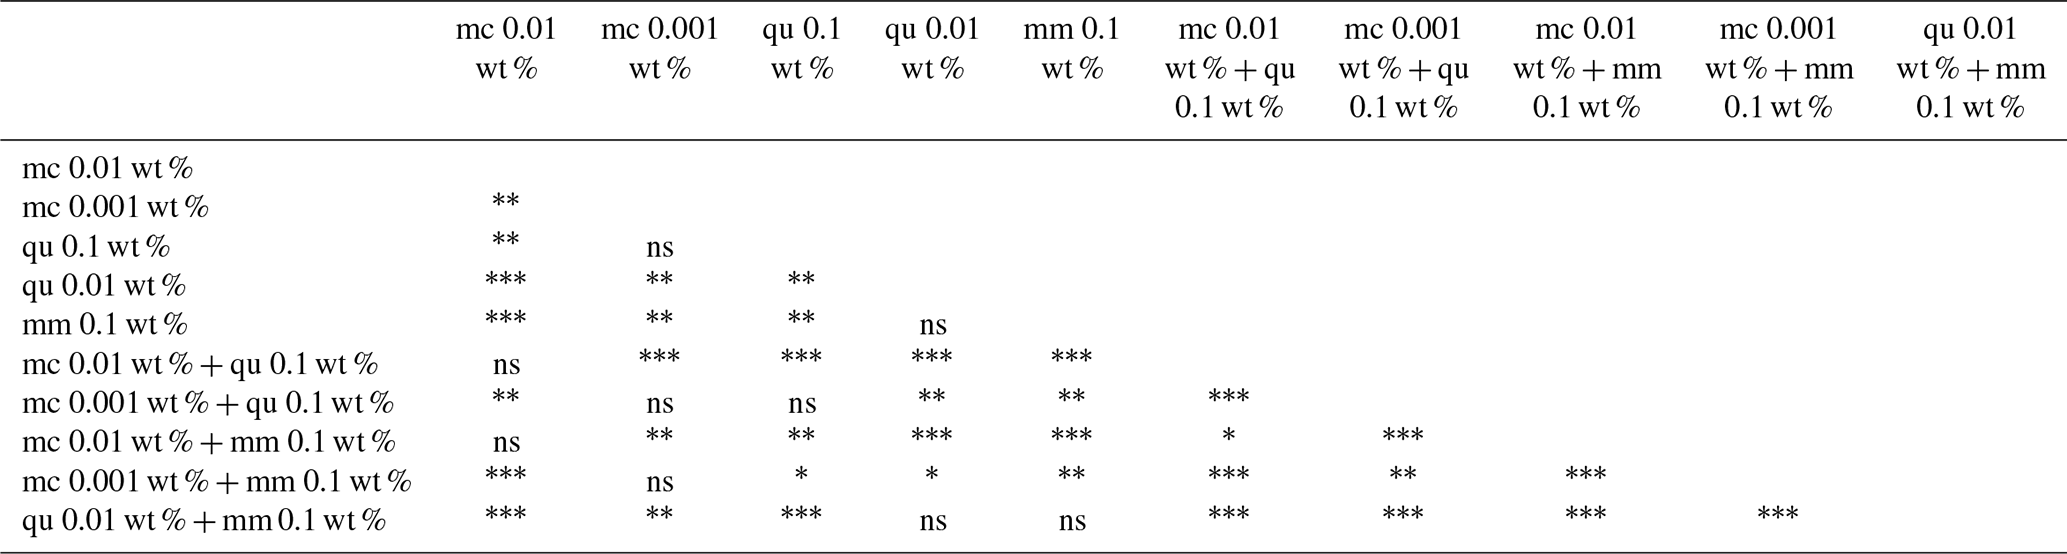
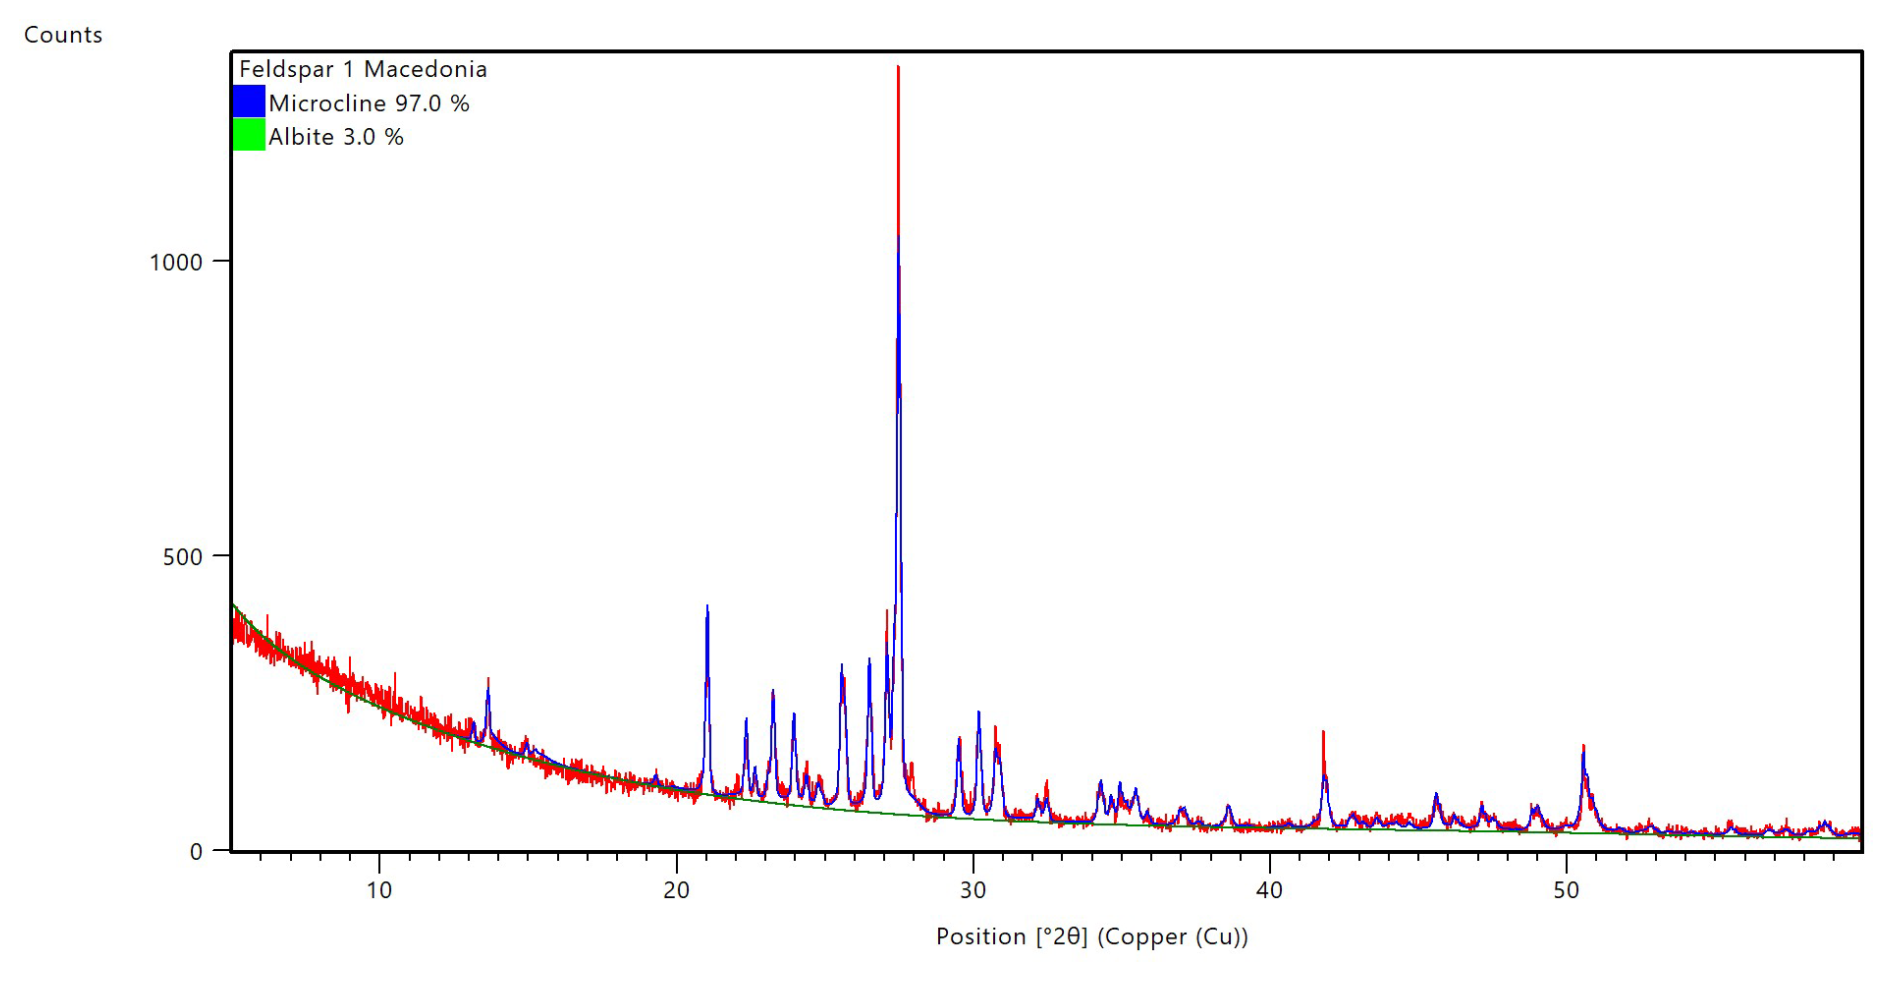
Figure A1XRD spectrum of the unprocessed microcline sample from Macedonia obtained from the ETH Mineralogical and Petrographical Collection.
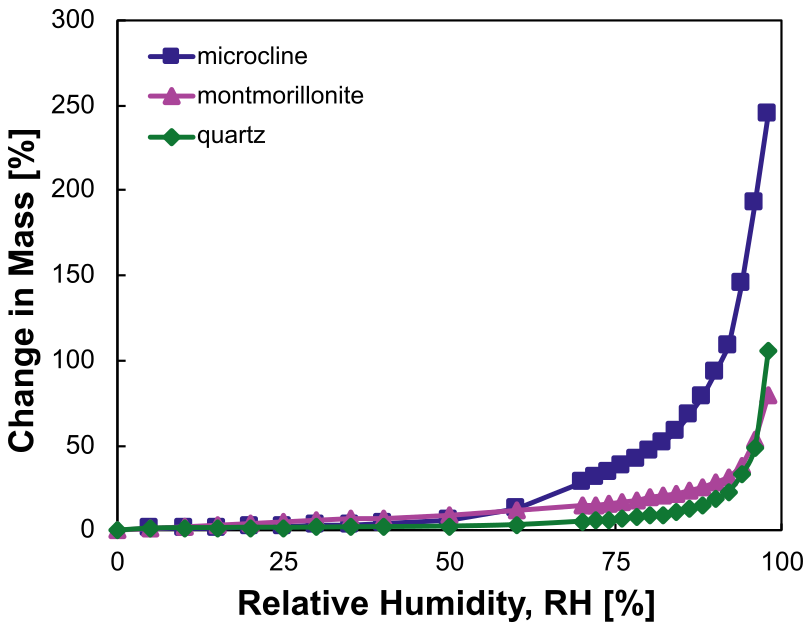
Figure A2Adsorption isotherms from dynamic vapor sorption (DVS) measurements for each pure mineral: microcline, montmorillonite, and quartz.
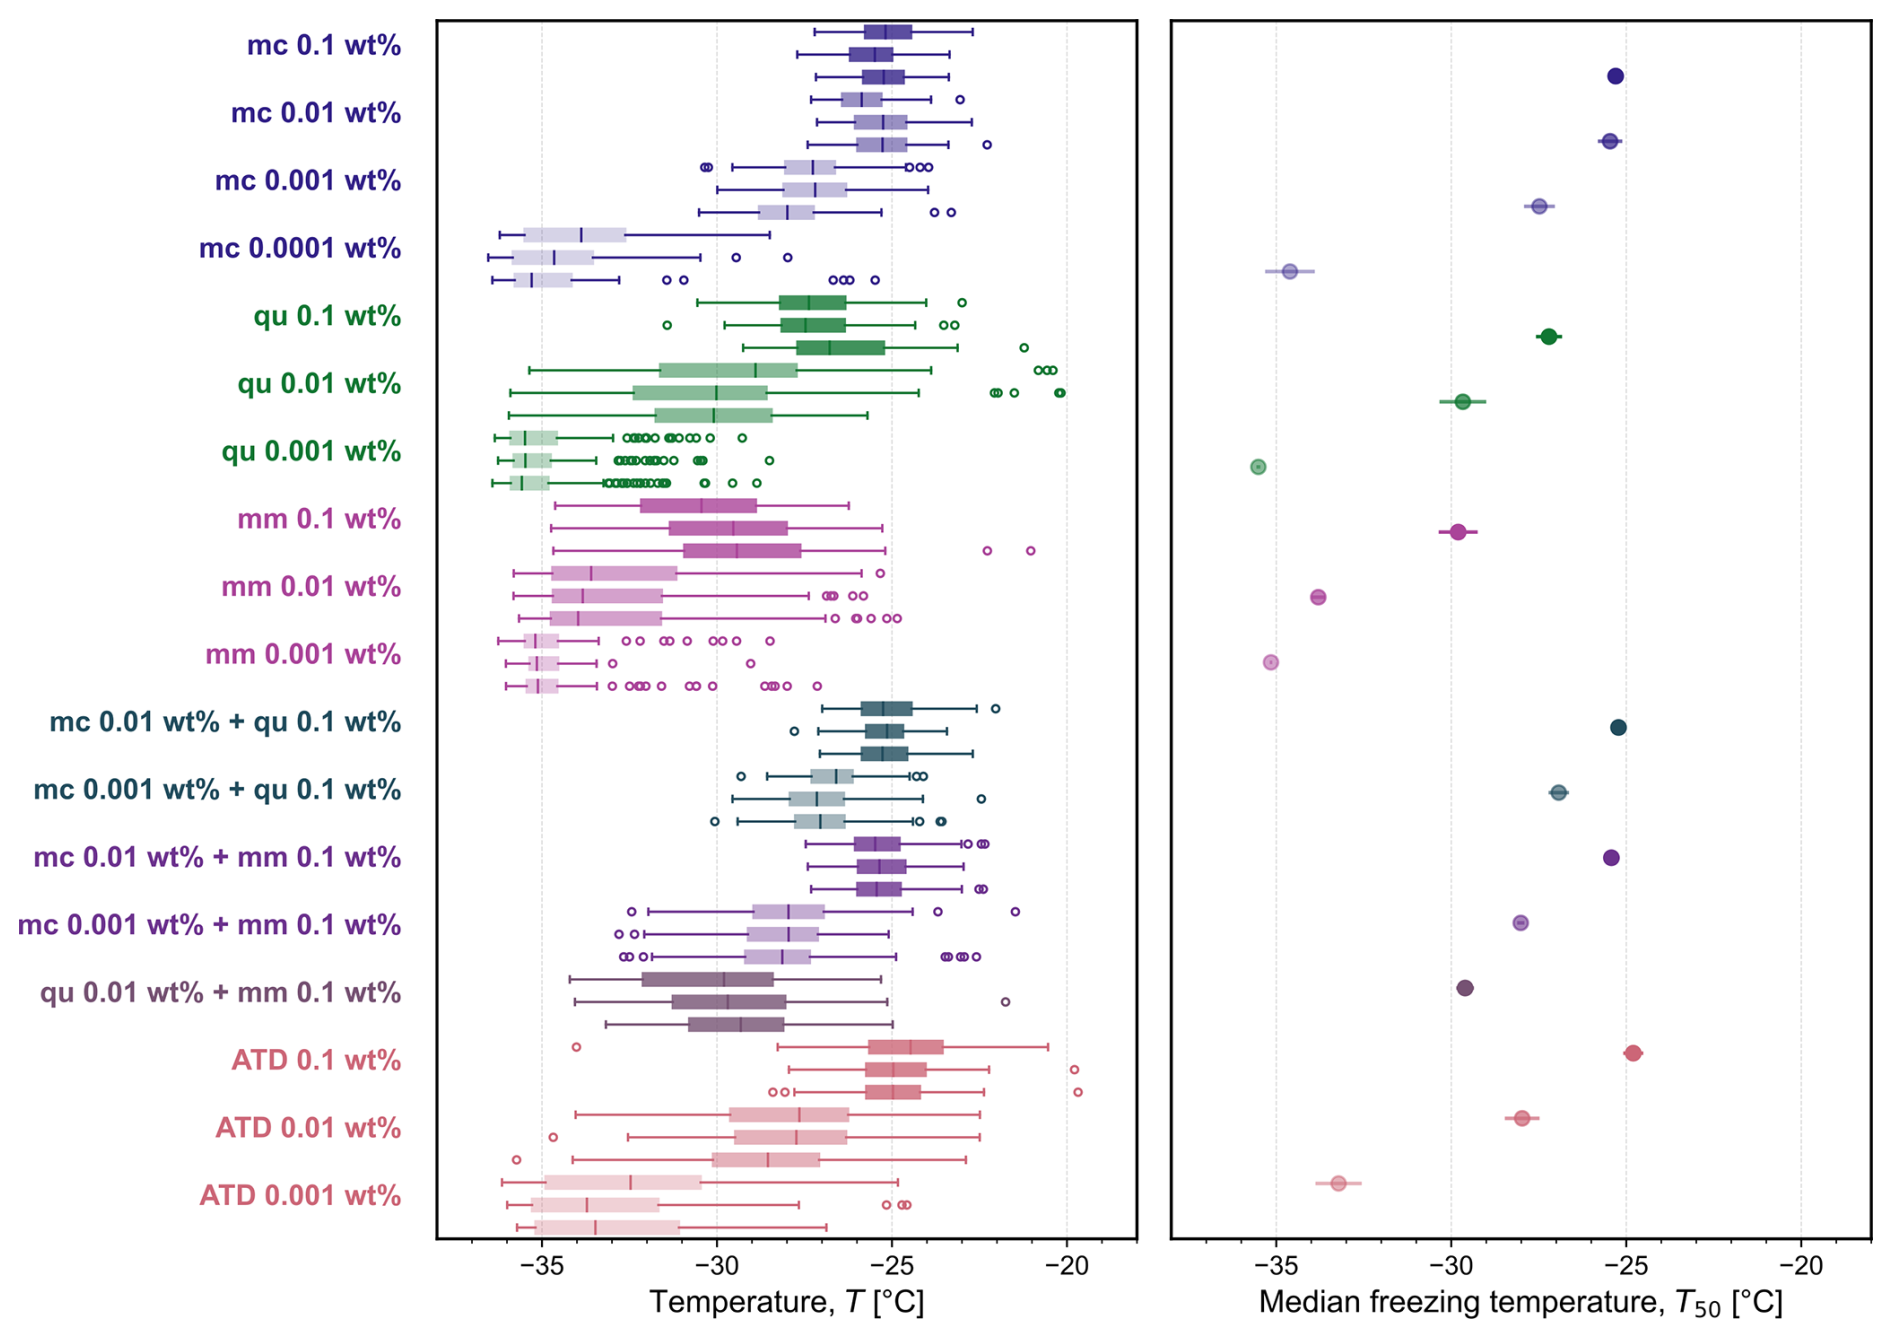
Figure A3Box plots of the freezing temperatures for each experiment containing microcline (mc), quartz (qu), montmorillonite (mm), and Arizona Test Dust (ATD) and the corresponding average median temperature T50 for each set of three experiments (error bars show one standard deviation). In each box plot, the vertical line indicates the median freezing temperature, the upper and lower bounds of the box stretch across the 25th to 75th percentiles, whiskers span the maximum and minimum temperatures, and open circles are outliers beyond 1.5 times the interquartile range.
Plot data are compiled in the ETH Research Collection data repository at https://doi.org/10.3929/ethz-b-000736892 (Shardt et al., 2025). Python scripts are available upon request.
NS contributed to project conceptualization, methodology, experimental measurements, software development, data analysis and interpretation, and writing (first draft). FNI contributed to the design of the microfluidic devices, methodology, sample preparation, and data interpretation. JN contributed to SEM analysis; CD to DVS measurements; and NM to XRD analysis. CM and ZAK contributed to project conceptualization, methodology development, and data interpretation. All authors contributed to writing (review and editing) and have approved the final version of the manuscript.
The contact author has declared that none of the authors has any competing interests.
Publisher's note: Copernicus Publications remains neutral with regard to jurisdictional claims made in the text, published maps, institutional affiliations, or any other geographical representation in this paper. While Copernicus Publications makes every effort to include appropriate place names, the final responsibility lies with the authors. Views expressed in the text are those of the authors and do not necessarily reflect the views of the publisher.
We acknowledge Roland Walker and Michael Rösch for technical support with hardware upgrades to the instrument; Andrea Galli for providing the microcline sample from the ETH Mineralogical and Petrographical Collection and for helpful discussions; Lydia Zehnder for milling the microcline sample; Imad El-Bakouri for assisting with making microfluidic devices and for motivating both hardware and software upgrades to the instrument; Evdokia Saiti for assistance with image registration and visualizing the CNN in Fig. 1; Kristian Klumpp and Thomas Peter for enthusiastic discussions and interest in the setup and results; Ulrike Lohmann for hosting the project and providing infrastructure and support; and the anonymous reviewers for their suggestions that improved the quality of this manuscript.
This research has been supported by the ETH Zürich Foundation (grant no. 20-1 FEL-46).
This paper was edited by Thomas Berkemeier and reviewed by two anonymous referees.
Alpert, P. A. and Knopf, D. A.: Analysis of isothermal and cooling-rate-dependent immersion freezing by a unifying stochastic ice nucleation model, Atmos. Chem. Phys., 16, 2083–2107, https://doi.org/10.5194/acp-16-2083-2016, 2016.
Atkinson, J. D., Murray, B. J., Woodhouse, M. T., Whale, T. F., Baustian, K. J., Carslaw, K. S., Dobbie, S., O'Sullivan, D., and Malkin, T. L.: The importance of feldspar for ice nucleation by mineral dust in mixed-phase clouds, Nature, 498, 355–358, https://doi.org/10.1038/nature12278, 2013.
Beall, C. M., Hill, T. C. J., DeMott, P. J., Köneman, T., Pikridas, M., Drewnick, F., Harder, H., Pöhlker, C., Lelieveld, J., Weber, B., Iakovides, M., Prokeš, R., Sciare, J., Andreae, M. O., Stokes, M. D., and Prather, K. A.: Ice-nucleating particles near two major dust source regions, Atmos. Chem. Phys., 22, 12607–12627, https://doi.org/10.5194/acp-22-12607-2022, 2022.
Bergeron, T.: On the physics of clouds and precipitation, in: Proces Verbaux de l'Association de Météorologie, International Union of Geodesy and Geophysics, 156–178, 1935.
Blattmann, T. M. and Plötze, M.: BET-based mineral surface area quantification comparing nitrogen with water, Appl. Clay Sci., 258, https://doi.org/10.1016/j.clay.2024.107477, 2024.
Broadley, S. L., Murray, B. J., Herbert, R. J., Atkinson, J. D., Dobbie, S., Malkin, T. L., Condliffe, E., and Neve, L.: Immersion mode heterogeneous ice nucleation by an illite rich powder representative of atmospheric mineral dust, Atmos. Chem. Phys., 12, 287–307, https://doi.org/10.5194/acp-12-287-2012, 2012.
Burrows, S. M., McCluskey, C. S., Cornwell, G., Steinke, I., Zhang, K., Zhao, B., Zawadowicz, M., Raman, A., Kulkarni, G., China, S., Zelenyuk, A., and DeMott, P. J.: Ice-Nucleating Particles That Impact Clouds and Climate: Observational and Modeling Research Needs, Rev. Geophys., 60, https://doi.org/10.1029/2021rg000745, 2022.
Chatziparaschos, M., Daskalakis, N., Myriokefalitakis, S., Kalivitis, N., Nenes, A., Gonçalves Ageitos, M., Costa-Surós, M., Pérez García-Pando, C., Zanoli, M., Vrekoussis, M., and Kanakidou, M.: Role of K-feldspar and quartz in global ice nucleation by mineral dust in mixed-phase clouds, Atmos. Chem. Phys., 23, 1785–1801, https://doi.org/10.5194/acp-23-1785-2023, 2023.
Deck, L. T., Shardt, N., El-Bakouri, I., Isenrich, F. N., Marcolli, C., deMello, A. J., and Mazzotti, M.: Monitoring Aqueous Sucrose Solutions Using Droplet Microfluidics: Ice Nucleation, Growth, Glass Transition, and Melting, Langmuir, 40, 6304–6316, https://doi.org/10.1021/acs.langmuir.3c03798, 2024.
Dogan, M., Dogan, A. U., Yesilyurt, F. I., Alaygut, D., Buckner, I., and Wurster, D. E.: Baseline studies of the Clay Minerals Society special clays: Specific surface area by the Brunauer Emmett Teller (BET) method, Clays Clay Miner., 55, 534–541, https://doi.org/10.1346/ccmn.2007.0550508, 2007.
Findeisen, W.: Die kolloidmeteorologischen Vorgänge bei der Niederschlagsbildung (Colloidal meteorological processes in the formation of precipitation), Meteorol. Z., 55, 121–133, https://doi.org/10.1127/metz/2015/0675, 1938.
Gronquist, P., Frey, M., Keplinger, T., and Burgert, I.: Mesoporosity of Delignified Wood Investigated by Water Vapor Sorption, ACS Omega, 4, 12425–12431, https://doi.org/10.1021/acsomega.9b00862, 2019.
Hader, J. D., Wright, T. P., and Petters, M. D.: Contribution of pollen to atmospheric ice nuclei concentrations, Atmos. Chem. Phys., 14, 5433–5449, https://doi.org/10.5194/acp-14-5433-2014, 2014.
Hamzehpour, N., Marcolli, C., Klumpp, K., Thöny, D., and Peter, T.: The Urmia playa as a source of airborne dust and ice-nucleating particles – Part 2: Unraveling the relationship between soil dust composition and ice nucleation activity, Atmos. Chem. Phys., 22, 14931–14956, https://doi.org/10.5194/acp-22-14931-2022, 2022.
Harrison, A. D., Whale, T. F., Carpenter, M. A., Holden, M. A., Neve, L., O'Sullivan, D., Vergara Temprado, J., and Murray, B. J.: Not all feldspars are equal: a survey of ice nucleating properties across the feldspar group of minerals, Atmos. Chem. Phys., 16, 10927–10940, https://doi.org/10.5194/acp-16-10927-2016, 2016.
Harrison, A. D., Lever, K., Sanchez-Marroquin, A., Holden, M. A., Whale, T. F., Tarn, M. D., McQuaid, J. B., and Murray, B. J.: The ice-nucleating ability of quartz immersed in water and its atmospheric importance compared to K-feldspar, Atmos. Chem. Phys., 19, 11343–11361, https://doi.org/10.5194/acp-19-11343-2019, 2019.
Hoose, C. and Möhler, O.: Heterogeneous ice nucleation on atmospheric aerosols: a review of results from laboratory experiments, Atmos. Chem. Phys., 12, 9817–9854, https://doi.org/10.5194/acp-12-9817-2012, 2012.
House, M. L. and Dutcher, C. S.: Microfluidic enabled ice nucleation studies of montmorillonite clay at varying pH and ionic strengths with refreezing and relative humidity cycling, Aerosol Sci. Tech., 58, 1168–1181, https://doi.org/10.1080/02786826.2024.2371412, 2024.
Ibrahim, S., Romanias, M. N., Alleman, L. Y., Zeineddine, M. N., Angeli, G. K., Trikalitis, P. N., and Thevenet, F.: Water Interaction with Mineral Dust Aerosol: Particle Size and Hygroscopic Properties of Dust, ACS Earth Space Chem., 2, 376–386, https://doi.org/10.1021/acsearthspacechem.7b00152, 2018.
Isenrich, F. N., Shardt, N., Rösch, M., Nette, J., Stavrakis, S., Marcolli, C., Kanji, Z. A., deMello, A. J., and Lohmann, U.: The Microfluidic Ice Nuclei Counter Zürich (MINCZ): a platform for homogeneous and heterogeneous ice nucleation, Atmos. Meas. Tech., 15, 5367–5381, https://doi.org/10.5194/amt-15-5367-2022, 2022.
Kanji, Z. A., Ladino, L. A., Wex, H., Boose, Y., Burkert-Kohn, M., Cziczo, D. J., and Krämer, M.: Overview of Ice Nucleating Particles, Meteorol. Monogr., 58, 1.1–1.33, https://doi.org/10.1175/amsmonographs-d-16-0006.1, 2017.
Kaufmann, L., Marcolli, C., Hofer, J., Pinti, V., Hoyle, C. R., and Peter, T.: Ice nucleation efficiency of natural dust samples in the immersion mode, Atmos. Chem. Phys., 16, 11177–11206, https://doi.org/10.5194/acp-16-11177-2016, 2016.
Klumpp, K., Marcolli, C., and Peter, T.: The impact of (bio-)organic substances on the ice nucleation activity of the K-feldspar microcline in aqueous solutions, Atmos. Chem. Phys., 22, 3655–3673, https://doi.org/10.5194/acp-22-3655-2022, 2022.
Klumpp, K., Marcolli, C., Alonso-Hellweg, A., Dreimol, C. H., and Peter, T.: Comparing the ice nucleation properties of the kaolin minerals kaolinite and halloysite, Atmos. Chem. Phys., 23, 1579–1598, https://doi.org/10.5194/acp-23-1579-2023, 2023.
Knopf, D. A. and Alpert, P. A.: Atmospheric ice nucleation, Nat. Rev. Phys., 5, 203–217, https://doi.org/10.1038/s42254-023-00570-7, 2023.
Kok, J. F., Storelvmo, T., Karydis, V. A., Adebiyi, A. A., Mahowald, N. M., Evan, A. T., He, C., and Leung, D. M.: Mineral dust aerosol impacts on global climate and climate change, Nat. Rev. Earth Environ., 4, 71–86, https://doi.org/10.1038/s43017-022-00379-5, 2023.
Kumar, A., Marcolli, C., Luo, B., and Peter, T.: Ice nucleation activity of silicates and aluminosilicates in pure water and aqueous solutions – Part 1: The K-feldspar microcline, Atmos. Chem. Phys., 18, 7057–7079, https://doi.org/10.5194/acp-18-7057-2018, 2018.
Kumar, A., Klumpp, K., Barak, C., Rytwo, G., Plötze, M., Peter, T., and Marcolli, C.: Ice nucleation by smectites: the role of the edges, Atmos. Chem. Phys., 23, 4881–4902, https://doi.org/10.5194/acp-23-4881-2023, 2023.
Lacher, L., Lohmann, U., Boose, Y., Zipori, A., Herrmann, E., Bukowiecki, N., Steinbacher, M., and Kanji, Z. A.: The Horizontal Ice Nucleation Chamber (HINC): INP measurements at conditions relevant for mixed-phase clouds at the High Altitude Research Station Jungfraujoch, Atmos. Chem. Phys., 17, 15199–15224, https://doi.org/10.5194/acp-17-15199-2017, 2017.
Mahrt, F., Rösch, C., Gao, K., Dreimol, C. H., Zawadowicz, M. A., and Kanji, Z. A.: Physicochemical properties of charcoal aerosols derived from biomass pyrolysis affect their ice-nucleating abilities at cirrus and mixed-phase cloud conditions, Atmos. Chem. Phys., 23, 1285–1308, https://doi.org/10.5194/acp-23-1285-2023, 2023.
Miller, A. J., Brennan, K. P., Mignani, C., Wieder, J., David, R. O., and Borduas-Dedekind, N.: Development of the drop Freezing Ice Nuclei Counter (FINC), intercomparison of droplet freezing techniques, and use of soluble lignin as an atmospheric ice nucleation standard, Atmos. Meas. Tech., 14, 3131–3151, https://doi.org/10.5194/amt-14-3131-2021, 2021.
Murray, B. J., O'Sullivan, D., Atkinson, J. D., and Webb, M. E.: Ice nucleation by particles immersed in supercooled cloud droplets, Chem. Soc. Rev., 41, 6519–6554, https://doi.org/10.1039/c2cs35200a, 2012.
Peckhaus, A., Kiselev, A., Hiron, T., Ebert, M., and Leisner, T.: A comparative study of K-rich and Na/Ca-rich feldspar ice-nucleating particles in a nanoliter droplet freezing assay, Atmos. Chem. Phys., 16, 11477–11496, https://doi.org/10.5194/acp-16-11477-2016, 2016.
Pinti, V., Marcolli, C., Zobrist, B., Hoyle, C. R., and Peter, T.: Ice nucleation efficiency of clay minerals in the immersion mode, Atmos. Chem. Phys., 12, 5859–5878, https://doi.org/10.5194/acp-12-5859-2012, 2012.
Polen, M., Brubaker, T., Somers, J., and Sullivan, R. C.: Cleaning up our water: reducing interferences from nonhomogeneous freezing of “pure” water in droplet freezing assays of ice-nucleating particles, Atmos. Meas. Tech., 11, 5315–5334, https://doi.org/10.5194/amt-11-5315-2018, 2018.
Reicher, N., Segev, L., and Rudich, Y.: The WeIzmann Supercooled Droplets Observation on a Microarray (WISDOM) and application for ambient dust, Atmos. Meas. Tech., 11, 233–248, https://doi.org/10.5194/amt-11-233-2018, 2018.
Rogers, D. C.: Development of a continuous flow thermal gradient diffusion chamber for ice nucleation studies, Atmos. Res., 22, 149–181, https://doi.org/10.1016/0169-8095(88)90005-1, 1988.
Rogers, D. C., DeMott, P. J., Kreidenweis, S. M., and Chen, Y.: A Continuous-Flow Diffusion Chamber for Airborne Measurements of Ice Nuclei, J. Atmos. Ocean. Tech., 18, 725–741, https://doi.org/10.1175/1520-0426(2001)018<0725:ACFDCF>2.0.CO;2, 2001.
Shardt, N., Isenrich, F. N., Nette, J., Dreimol, C., Ma, N., Kanji, Z., deMello, A. J., and Marcolli, C.: Microfluidic immersion freezing of binary mineral mixtures containing microcline, montmorillonite, or quartz, ETH Zurich Research Collection, [data set] https://doi.org/10.3929/ethz-b-000736892, 2025.
Tarn, M. D., Sikora, S. N. F., Porter, G. C. E., O'Sullivan, D., Adams, M., Whale, T. F., Harrison, A. D., Vergara-Temprado, J., Wilson, T. W., Shim, J. U., and Murray, B. J.: The study of atmospheric ice-nucleating particles via microfluidically generated droplets, Microfluid Nanofluidics, 22, 52, https://doi.org/10.1007/s10404-018-2069-x, 2018.
Tarn, M. D., Shaw, K. J., Foster, P. B., West, J. S., Johnston, I. D., McCluskey, D. K., Peyman, S. A., and Murray, B. J.: Microfluidics for the biological analysis of atmospheric ice-nucleating particles: Perspectives and challenges, Biomicrofluidics, 19, 011502, https://doi.org/10.1063/5.0236911, 2025.
Vali, G.: Interpretation of freezing nucleation experiments: singular and stochastic; sites and surfaces, Atmos. Chem. Phys., 14, 5271–5294, https://doi.org/10.5194/acp-14-5271-2014, 2014.
Vali, G., DeMott, P. J., Möhler, O., and Whale, T. F.: Technical Note: A proposal for ice nucleation terminology, Atmos. Chem. Phys., 15, 10263–10270, https://doi.org/10.5194/acp-15-10263-2015, 2015.
Wegener, A.: Thermodynamik der atmosphäre, Johann Ambrosius Barth, Leipzig, 1911.
Whale, T. F., Holden, M. A., Kulak, A. N., Kim, Y. Y., Meldrum, F. C., Christenson, H. K., and Murray, B. J.: The role of phase separation and related topography in the exceptional ice-nucleating ability of alkali feldspars, Phys. Chem. Chem. Phys., 19, 31186–31193, https://doi.org/10.1039/c7cp04898j, 2017.
Whale, T. F., Holden, M. A., Wilson, T. W., O'Sullivan, D., and Murray, B. J.: The enhancement and suppression of immersion mode heterogeneous ice-nucleation by solutes, Chem. Sci., 9, 4142–4151, https://doi.org/10.1039/c7sc05421a, 2018.
Wheeler, M. J., Mason, R. H., Steunenberg, K., Wagstaff, M., Chou, C., and Bertram, A. K.: Immersion freezing of supermicron mineral dust particles: freezing results, testing different schemes for describing ice nucleation, and ice nucleation active site densities, J. Phys. Chem. A, 119, 4358–4372, https://doi.org/10.1021/jp507875q, 2015.
Wong, B.: The Impact of Mixed Mineral Dust Particle Populations on Atmospheric Ice Nucleation, Stony Brook University, 2019.
Wright, T. P. and Petters, M. D.: The role of time in heterogeneous freezing nucleation, J. Geophys. Res.-Atmos., 118, 3731–3743, https://doi.org/10.1002/jgrd.50365, 2013.
Yun, J., Link, N., Kumar, A., Shchukarev, A., Davidson, J., Lam, A., Walters, C., Xi, Y., Boily, J.-F., and Bertram, A. K.: Surface Composition Dependence on the Ice Nucleating Ability of Potassium-Rich Feldspar, ACS Earth Space Chem., 4, 873–881, https://doi.org/10.1021/acsearthspacechem.0c00077, 2020.
Yun, J., Kumar, A., Removski, N., Shchukarev, A., Link, N., Boily, J.-F., and Bertram, A. K.: Effects of Inorganic Acids and Organic Solutes on the Ice Nucleating Ability and Surface Properties of Potassium-Rich Feldspar, ACS Earth Space Chem., 5, 1212–1222, https://doi.org/10.1021/acsearthspacechem.1c00034, 2021.
Zolles, T., Burkart, J., Hausler, T., Pummer, B., Hitzenberger, R., and Grothe, H.: Identification of ice nucleation active sites on feldspar dust particles, J. Phys. Chem. A, 119, 2692–2700, https://doi.org/10.1021/jp509839x, 2015.