the Creative Commons Attribution 4.0 License.
the Creative Commons Attribution 4.0 License.
 | 04 Dec 2025
Evaluation of and updates to the oxidized reactive nitrogen gaseous dry-deposition parameterization from the GEOS-Chem model, including a pathway for ground surface NO2 hydrolysis
Brian L. Boys
Randall V. Martin
Trevor C. VandenBoer
Dry deposition is a major loss pathway for reactive nitrogen species from the atmospheric boundary layer. We evaluate isolated components of the parameterization for species-specific gaseous dry-deposition velocity Vd(x) for HNO3 and NO2 from the GEOS-Chem chemical transport model by running a stand-alone version of Vd code in single-point mode to enable a more direct comparison to field observations. Improved measurement–model agreement results mainly from (i) updates to the calculation of molecular diffusivities and (ii) the representation of ground surface NO2 hydrolysis in the formulation of non-stomatal uptake. We evaluate the parameterization for non-stomatal dry deposition of NO2 by comparing to eddy-covariance-inferred nocturnal Vd(NO2) over Harvard Forest. We address a large low bias (−80 %) in simulated nocturnal Vd(NO2) by representing NO2 heterogeneous hydrolysis on deposition surfaces, paying attention to chemical flux divergence, soil NO emission, and canopy surface area effects. Finally, we evaluate the updated oxidized reactive nitrogen (NOy) dry-deposition parameterization by comparing to eddy-covariance-inferred Vd(NOy) over Harvard Forest, finding that a modest nocturnal low bias (−19 %) remains in simulated Vd(NOy) due to the compensating effects of updates to the calculation of molecular diffusivities (28 % reduction in nocturnal Vd(NOy)) and the representation of NO2 heterogeneous hydrolysis (25 % increase in nocturnal Vd(NOy)). These developments are a first step towards a tractable representation of NO2 hydrolysis in a dry-deposition scheme and have important implications for the near-surface NO2 lifetime through a mechanism involving HONO emission.
- Article
(3336 KB) - Full-text XML
-
Supplement
(2531 KB) - BibTeX
- EndNote


Chemical species constituting oxidized reactive nitrogen (NOy) form a major component of atmospheric reactive nitrogen (Nr≡ NOy+ reduced nitrogen species), which together play a central role in atmospheric chemistry by modulating the oxidative capacity of the atmosphere through nitrogen oxides (NOx≡ NO + NO2) (Crutzen, 1979), contributing to nitrogen loading of natural ecosystems (Clark et al., 2018) and influencing air quality (Fields, 2004). Accurate knowledge of the sources and sinks of Nr is vital for understanding and modeling atmospheric chemistry, including the sensitivity of air quality to changes in anthropogenic emissions. Dry deposition of Nr from the atmospheric boundary layer is an important removal process, typically contributing between one-third and two-thirds of total (wet + dry) deposition (Flechard et al., 2011; Hanson and Linderg, 1991; Munger et al., 1998; Sparks et al., 2008; Walker et al., 2020), but questions remain about its representation in chemical transport models (CTMs).
The atmosphere–surface exchange of Nr may be measured directly via micrometeorological techniques (Businger, 1986; Walker et al., 2020) or under more controlled conditions via enclosure techniques (Breuninger et al., 2012; Hanson and Linderg, 1991). Direct measurements of the above-canopy air–surface exchange of Nr, including via the eddy covariance technique, are technically complex and resource intensive, resulting in a scarcity of flux observations across representative land types and seasons (Walker et al., 2020). Therefore, studies of above-canopy dry deposition tend to be intensive in nature and are typically designed to characterize exchange processes rather than to monitor long-term deposition patterns. Dry-deposition budgets thus fall in the realm of inferential methods, where deposition fluxes Fx are inferred from parameterizations of above-canopy deposition velocity Vd – a first-order rate coefficient for heterogeneous surface reaction/uptake for a specific gas x to a specific bulk surface/land type from a specified height:
By convention, downward fluxes toward the surface are negative values represented by positive deposition velocities. Nr component concentrations [x] from which dry-deposition budgets may be inferred have been obtained from (i) surface networks such as the US CASTNET (Clarke et al., 1997) and Canadian CAPMoN (Zhang et al., 2009), (ii) chemical transport models (Dennis et al., 2013; Zhang et al., 2012, 2018), and (iii) satellite observations (Geddes and Martin, 2017; Kharol et al., 2018; Nowlan et al., 2014).
Deposition velocity represents a bulk quantity with contributions from complex processes including turbulent and molecular diffusion in air; meteorological influence on the physical, chemical, and biological state of surfaces; and species-specific interfacial chemistry. The most common parameterization of Vd in large-scale CTMs considers the deposition pathway as a series of three resistances (Baldocchi et al., 1987; Wesely and Hicks, 1977):
where, for bulk-canopy Vd above a projected ground area, Ra(z) is the aerodynamic resistance to turbulent transport from a specified height z and is common for all species, Rb(x) is the species-specific quasi-laminar boundary layer resistance to transport through the thin non-turbulent layer in direct contact with surfaces, and Rc(x) is the bulk-canopy surface resistance for a specific land type. Expressions for Ra and Rb can be obtained from micrometeorological flux–gradient relationships (Garratt, 1992; Wesely and Hicks, 1977) and vary as a function of surface roughness, wind speed, diabatic stability, and molecular diffusivity in air. For highly soluble species such as HNO3 and H2O2, contributions from Rc are nominally small, with the resulting deposition varying between being Ra and Rb limited depending on the state of the turbulence (Nguyen et al., 2015). For species with low aqueous solubility or limited interfacial reactivity, Rc is the limiting term, except under very stable conditions (Toyota et al., 2016). Given the complexity and variability in canopy types and species-specific surface reactivities, Rc is difficult to treat theoretically, with parameterizations relying heavily on empirical formulations.
The most common parameterization of Rc used by large-scale atmospheric models, including the widely utilized WRF-Chem and GEOS-Chem CTMs, is the Wesely 1989 algorithm (Wesely, 1989; hereafter referred to as W89) or modifications thereof (Hardacre et al., 2015). In this scheme, the bulk canopy is treated as a single uniform surface or “big leaf”, with stomatal and various non-stomatal deposition pathways acting in parallel. Trace-gas-specific component surface resistances are calculated following basic similarity relations, including solubility relative to SO2 and oxidative potential relative to O3. Zhang et al. (2003a) present a parameterization of Rc(x) for use in air quality models, including at the global scale, using similarity arguments to SO2 and O3 as was done in W89, with updates including online computation of within-canopy aerodynamic resistance, the influence of leaf water vapor pressure deficit and water stress on stomatal resistance, and updated parameterizations of non-stomatal surface resistances for O3 (Zhang et al., 2002b) and SO2 (Zhang et al., 2003b). Zhang et al. (2003a) note that application of the algorithm (hereafter referred to as Z03) to compounds for which few to no deposition flux observations exist will continue to be a source of uncertainty. Bulk-canopy surface resistances deviating from W89 similarity to SO2 and O3 have been observed for NO2 (Eugster and Hesterberg, 1996; Horii et al., 2004; Stocker et al., 1995), PAN (Shepson et al., 1992; Sun et al., 2016; Turnipseed et al., 2006), and many other species (Nguyen et al., 2015). Wu et al. (2012) compare observed Vd(PAN) over a coniferous forest to deposition velocities parameterized according to both the W89 (WRF-Chem) and Z03 (NOAH) schemes and find underestimates greater than a factor of 2, motivating efforts to fit non-stomatal Rc(PAN) directly from above-canopy flux observations. Using the eddy covariance flux dataset from Nguyen et al. (2015), the Z03 scheme was extended by Wu et al. (2021) to additional species by fitting non-stomatal uptake of oxidized volatile organic compounds (VOCs) and hydrogen cyanide directly from observations. Wu et al. (2021) maintain the Z03 algorithm structure through similarity to SO2 and O3; however, they suggest that future developments to dry-deposition schemes should consider other species-specific processes and reactions affecting measured uptake, including below-sensor chemical flux divergence, enzymatic reactions, and other non-stomatal processes/reactions.
A main result of the Horii et al. (2004) analysis of an extensive eddy covariance flux dataset of NO2 over a northeastern US mixed forest (Harvard Forest) from April to November was that a persistent deposition process was active at night, yielding NO2 deposition velocities on average of ∼ 0.2 cm s−1, with values up to 0.5 cm s−1 noted under high-NO2 loads of ∼ 30 ppb. This observation is contrary to the widely used W89 parameterization, which does not allow significant surface uptake of NO2 at night when leaf stomata are assumed to be closed or during vegetatively dormant seasons. Geddes and Murphy (2014) monitored eddy covariance fluxes of NO, NO2, and NOy above midlatitude (∼ 45° N) summertime mixed hardwood forests in Ontario (Canada) and Michigan (USA), finding that, on average, NOx fluxes were indistinguishable from zero for these relatively low-NOy environments (< 2 ppb on average). However, infrequent nocturnal events with high NOx NOy ratios and large downward NOy fluxes could be interpreted as yielding NO2 deposition velocities similar to the average values of Horii et al. (2004). Geddes and Murphy (2014) were careful to note that above-canopy fluxes of NOx are influenced by not only deposition processes but also within-canopy emissions and chemistry, resulting in above-canopy fluxes of NOx that are confounded by a combination of counteracting mechanisms, which render flux observations difficult to interpret. Horii et al. (2004) considered below-sensor chemical flux divergence of NO2 due to the formation and subsequent hydrolysis of N2O5, where the maximum rate of loss was insufficient to account for the observed downward nocturnal NO2 flux. To reconcile this, they proposed a non-stomatal hydrolysis pathway for uptake of NO2 on ground and canopy surfaces – a reaction that has been suspected to be of atmospheric relevance in the field for some time (Harrison and Kitto, 1994; Harrison et al., 1996).
The hydrolysis of NO2 on hydrated surfaces is a well-known heterogeneous reaction from lab investigations, yielding adsorbed HNO3 and evolved nitrous acid (HONO):
Despite the stoichiometry of Reaction (R1), first-order kinetics for NO2 have generally been observed in the lab and field, with a rate dependence on surface area density (as expected for collision-limited heterogeneous catalysis), surface water content, and other surface chemical properties (Finlayson-Pitts et al., 2003; Finlayson-Pitts, 2009; Lammel, 1999; Spataro and Ianniello, 2014). In addition to hydrated ground (Kurtenbach et al., 2001; Lammel, 1999; Ren et al., 2020; VandenBoer et al., 2013) and aerosol (Bröske et al., 2003; Burkholder et al., 2015; Crowley et al., 2010; Tan et al., 2016) surfaces, Reaction (R1) has been suggested to be occuring on the sea surface (Wojtal et al., 2011; Yang et al., 2021; Zha et al., 2014), on snow and ice surfaces (Beine et al., 2001; Kim and Kang, 2010), and on indoor surfaces (Collins et al., 2018; Febo and Perrino, 1991; Spicer et al., 1993). Spicer et al. (1993) and Collins et al. (2018) both found an indoor lifetime of NO2 to reactive loss (HONO producing) on residential interior surfaces on the order of 1 h in well-mixed air – lower than typical ambient NO2 chemical lifetimes, which are on the order of hours in regional (Kenagy et al., 2018; Shah et al., 2020) or urban outflows (Laughner and Cohen, 2019) and remote-forest environments (Browne and Cohen, 2012). Reaction (R1) may be an especially important surface removal process during summertime nights or winter months when NO2 is longer lived, with lifetimes on the order of 10 h to more than a day (Browne and Cohen, 2012; Kenagy et al., 2018; Martin et al., 2003). Reaction (R1) has also been implicated in the uptake of NO2 through leaf stomata, where it may be an important contributor to NO2 deposition within the moist and high-surface-area substomatal cavities (apoplast) of leaves (Ammann et al., 1995).
Despite the evidence for Reaction (R1) occurring on nearly any environmental surface with adsorbed water, regional and global CTMs have yet, to our knowledge, to update dry-deposition parameterizations of NO2 to include this effect, potentially underestimating and/or misrepresenting Vd(NO2) at night and throughout vegetatively senescent periods when stomatal uptake would be weak or absent. In this study, we compare simulated dry-deposition velocities from the GEOS-Chem CTM to above-canopy observations of Vd(NO2) and Vd(NOy) inferred from an extensive publicly available dataset of NO2 and NOy eddy covariance fluxes and speciated NOy concentration measurements over Harvard Forest (Munger and Wofsy, 2023), paying attention to soil NO emission, chemical flux divergence, and canopy surface area effects. Prior to updating simulated Rc(NO2) to include Reaction (R1), we conduct sensitivity tests to evaluate the parameterization of Ra and Rb used in GEOS-Chem by comparing to daytime deposition velocities of rapidly depositing species inferred by the method of eddy covariance over a southern US temperate forest (Nguyen et al., 2015). Specifically, we comment on the effects that site-specific roughness length, reference height, and the roughness sublayer have on the simulation of daytime Ra, followed by the correction of a positive bias in calculated molecular diffusivities that greatly improves the simulation of daytime Vd(HNO3) via a large relative increase in Rb.
2.1 Reference algorithms for computing gaseous dry-deposition velocities
2.1.1 GEOS-Chem dry-deposition module
To facilitate site-specific comparisons to measured deposition velocities, we use a stand-alone version of the gaseous dry-deposition algorithm from GEOS-Chem v10-01 (https://www.geos-chem.org, last access: 4 October 2024) implemented to run in single-point mode with the option to use on-site meteorology and canopy characterizations (i.e., leaf area index (LAI), canopy height, and land type classification). Section S1 in the Supplement details the formulations used in GEOS-Chem for the resistance-in-series components of Eq. (2), which were also detailed in the recent literature (Wong et al., 2019). Briefly, aerodynamic resistance Ra to the turbulent transport of scalars from a reference height z down to the roughness length zo of the surface is computed following standard surface layer flux–gradient relationships (Wesely and Hicks, 1977). The quasi-laminar boundary layer resistance Rb is estimated following the semiempirical formulation from Wesely and Hicks (1977) and has dependency on both friction velocity u∗ and species-specific molecular diffusivity Dx. Surface resistance Rc is computed following a big-leaf scheme based on the W89 algorithm, modified for application to the global scale (Wang et al., 1998).
2.1.2 Non-stomatal branch of Z03 dry-deposition algorithm
The Z03 dry-deposition algorithm includes several updates to the W89 scheme. Z03 is used in the Canadian Air and Precipitation Monitoring Network (CAPMoN) (Zhang et al., 2009) as well as in air quality models (e.g., Zhang et al., 2002a) and was recently compared globally to the W89 scheme as implemented in GEOS-Chem for Vd(O3) (Wong et al., 2019). We implement a stand-alone version of the non-stomatal branch of the Z03 dry-deposition algorithm for NO2 to enable evaluation against nocturnal eddy-covariance-inferred Vd(NO2) at Harvard Forest. Leaf stomata are treated as being fully closed at night in the Z03 scheme; accordingly, we treat stomatal resistance as infinite. The Z03 algorithm assigns scale factors (their α and β) for non-stomatal NO2 uptake relative to inverse surface resistances (conductances) for SO2 and O3 of 0 and 0.8, respectively, resulting in parameterized NO2 deposition velocities 10 %–20 % smaller than for O3 (Zhang et al., 2002a). The canopy is flagged as wet from dew following the formalism adopted by Brook et al. (1999), with dependence on cloud fraction, temperature, dew point, and u∗. We estimate the snow cover fraction from snow depth following Zhang et al. (2003a). Following a similar approach to Wu et al. (2018), we compute component surface resistances for the mixed forest as an average of deciduous broadleaf and evergreen needleleaf land-type-specific values from Z03, weighted by the LAI-determined deciduous and coniferous fractions for Harvard Forest of ∼ 80 % and 20 %, respectively (Fig. S5 in the Supplement). As with the stand-alone GEOS-Chem dry-deposition algorithm, we use on-site meteorology and canopy characterizations when available (Sect. 2.2.2).
2.2 Above-canopy dry-deposition velocities inferred from eddy covariance measurements
We evaluate the gaseous dry-deposition scheme from GEOS-Chem against eddy-covariance-inferred deposition velocities over two temperate forests in the USA. First, we compare to deposition velocities from Nguyen et al. (2015) for species found to dry deposit with minimal surface resistance. Being able to neglect the complexities of a surface resistance scheme allows for a more direct evaluation of Ra and Rb components of the resistance-in-series pathway used in the parameterization of Vd (Wu et al., 2021). Second, for an in-depth evaluation of simulated Vd(NO2) and Vd(NOy), we use a publicly available long-term hourly dataset of eddy covariance flux observations of NO2 and NOy from Harvard Forest, supported with ancillary measurements including NOy component concentrations, meteorological observations, and canopy characteristics.
2.2.1 Talladega National Forest: H2O2, HMHP, and HNO3
Nguyen et al. (2015) present a novel dataset containing eddy-covariance-inferred deposition velocities of 16 gaseous species, including species found to deposit with negligible surface resistance: H2O2, hydroxy methylhydroperoxide (HMHP), and HNO3. Observations were taken at the Centreville (CTR) Southeastern Aerosol Research and Characterization Study (SEARCH) site (32.90289° N, 87.24968° W) near Brant, Alabama, USA, in June 2013. The CTR site is situated in a grassy clearing in the Talladega National Forest – a mixed forest consisting of coniferous and deciduous tree species, with a mean canopy height hc of ∼ 10 m and LAI of 4.7 m2 m−2. Eddy covariance flux observations were measured at 22 m a.g.l (meters above ground level). The analysis of Nguyen et al. (2015) includes daytime mean (10:00–15:00 local time (LT)) deposition velocities averaged across 5 ideal days in June 2013 when winds had exclusively forest fetch. To compare with the reported daytime deposition velocities for H2O2 (5.2 ± 1.1 cm s−1), HMHP (4.1 ± 1.1 cm s−1), and HNO3 (3.8 ± 1.3 cm s−1), we average the Ra and Rb components of the stand-alone GEOS-Chem dry-deposition algorithm, applied at the location of the CTR site for the hours of 10:00–15:00 LT on the aforementioned days. The meteorological inputs required to compute the Ra and Rb components of the algorithm (, and sensible heat flux) were obtained from NASA's Goddard Earth Observing System (GEOS) Forward Processed (FP) assimilated meteorological fields (Lucchesi, 2013) at the native horizontal resolution of ° × °, which Nguyen et al. (2015) note are in excellent agreement with the values measured at the CTR site during this period.
2.2.2 Harvard Forest: NO2 and NOy
The utility of the Harvard Forest Environmental Monitoring Site (HFEMS) for evaluating parameterizations of atmosphere–surface exchange stems from the extensive datasets of meteorological and trace gas observations spanning many months to years at high temporal (hourly) resolution. The HFEMS is located in central Massachusetts, USA (42.54° N, 72.18° W; 340 m a.s.l. (meters above sea level)) and is situated in a mature mixed forest (hc ≃ 20 m), with a summertime LAI and deciduous LAI (DLAI) of 4.3 and 3.4, respectively (Fig. S5). Due to prevailing westerly winds, emissions from Boston (100 km to the east) rarely influence the site. Cool, dry, and unpolluted air from the northwest and warm, moist, anthropogenically influenced air from the southwest are the predominant influences at this site (Horii et al., 2005).
Munger et al. (1996) have described the methodology of the long-term above-canopy (29 m) total nitrogen oxide (NOy) concentration measurements for eddy covariance flux computation, as well as other details of the HFEMS. Measurements of above-canopy PAN concentrations were added in April 2000 (Horii et al., 2005). Eddy covariance fluxes of NO2 along with above-canopy (22 m) measurements of HNO3 concentrations were made at the HFEMS from April through November 2000 (Horii et al., 2004).
Trace gas data from the HFEMS used in this study, specifically hourly eddy covariance fluxes of NOy and NO2 and hourly concentrations of NOy, NO, NO2, PAN, and HNO3, are publicly available from the Harvard Forest Data Archive (Munger and Wofsy, 2023). Exchange velocities (Vex) are computed herein by normalizing reported hourly NOy and NO2 eddy covariance fluxes by the respective ambient hourly concentrations. Equating Vex to Vd assumes that the observed flux is due to surface deposition only. Processes causing deviation from this assumption are discussed in later sections and include surface emission of NO, chemical flux divergence of NO2, and a potential non-zero canopy accumulation rate of NOy. Eddy covariance fluxes have fewer errors under conditions where turbulence is well developed (Baldocchi, 2003; Cherin et al., 2015; Goulden et al., 1996; Nguyen et al., 2015). Turbulent threshold u∗ values in the range of 0.15–0.35 m s−1 (median 0.23 m s−1) have been found to be representative of multiple sites across many years (Cherin et al., 2015). Herein, following the approach of Wu et al. (2011), periods of low surface layer turbulence (u∗ < 0.2 m s−1) have been omitted from the analysis, resulting in ∼ 25 % of the hourly values of nocturnal Vd(NO2) and 18 % of the hourly values of Vd(NOy) being removed from the dataset. Outliers in the remaining hourly Vd(NO2) and Vd(NOy) time series were identified via the method of median absolute deviation (MAD) (Leys et al., 2013), where hourly values outside of the median MAD were removed from calculations of subsequent means; ∼ 20 % of the hourly nocturnal Vd(NO2) and 10 % of the hourly Vd(NOy) were removed from the u∗ filtered dataset. Overall, 60 % of the nocturnal Vd(NO2) and 74 % of the Vd(NOy) hourly time series were retained for analysis after application of these turbulence and outlier filters. Figure S6 in the Supplement depicts monthly fractional coverage of hourly measurements of above-canopy trace gas concentrations and eddy-covariance-observed exchange velocities from 2000 to 2002, filtered for conditions of low turbulence.
Meteorological input variables required in the parameterization of Vd were taken from the HFEMS data archive; specifically, P, T, RH, and sensible heat flux (Munger and Wofsy, 2024) and incoming solar radiation (Fitzjarrald and Sakai, 2023) were available at an hourly temporal resolution throughout the study period. Cloud fraction and snow depth were the only required meteorological variables not available and were instead taken from NASA's Modern-Era Retrospective analysis for Research and Applications version 2 (MERRA-2)-assimilated meteorological fields (Gelaro et al., 2017). Figure S7 in the Supplement depicts comparisons of hourly observations of u∗, sensible heat flux, downward shortwave radiation, T, P, and RH made over Harvard Forest to coincident values from MERRA-2-assimilated meteorology, depicting good to excellent agreement. Canopy-specific inputs to the parameterization of Vd include roughness length zo, displacement height d, LAI, and deposition land type. Values for zo and d were estimated as and of canopy height, respectively – values representative of many vegetative surfaces (Garratt, 1992; Oke, 1987), including zo for Harvard Forest (Wu et al., 2011). We estimate daily LAI values from a spline fit to daily plant area index (PAI) measurements from the HFEMS over April–December for the years 1998–2015 (Matthes et al., 2024), corrected for the reported stem and twig area index (STAI) of 0.9 m2 m−2 noted for this canopy (Horii et al., 2005). Estimated climatological daily LAI values range from ∼ 0.9 m2 m−2 in winter to 4.3 m2 m−2 in summer, in good agreement with MODIS LAI, used by GEOS-Chem, at the location of Harvard Forest (Fig. S5).
2.3 Measured diffusion coefficients of atmospherically relevant molecules
A main result of the work of Nguyen et al. (2015) was the importance of molecular diffusion in atmosphere–surface exchange of rapidly depositing compounds, where it was shown that maximum daytime dry-deposition velocities scale with the inverse square root of molecular mass, as do gas-phase diffusion coefficients (Poling and Prausnitz, 2004). To evaluate the calculation of molecular diffusivities used in the parameterization of gaseous dry-deposition velocities in GEOS-Chem, we conducted a literature search to compile a list of measured diffusion coefficients for atmospherically relevant molecules, consisting of 23 inorganic and 17 organic species (Table S1 in the Supplement). Diffusion coefficients (D) measured in either air or N2 near standard temperature and pressure (STP) were corrected to STP following Langenberg et al. (2020):
where we set the temperature power dependence to b=1.75 following Fuller's method, a semiempirical technique for the estimation of binary gas-phase diffusion coefficients (Fuller et al., 1966), which is discussed further in Sect. 3.2.
2.4 Measurements of surface-specific deposition velocities for NO2
Surface-specific NO2 uptake coefficients () to both foliar and non-foliar forest elements facilitate bottom-up estimates of bulk-canopy Rc(NO2) and the resulting Vd(NO2) to forest environments when the corresponding surface area scale factors (i.e., LAI and STAI) and meteorological data are available. From the literature values of surface-specific deposition velocities , we infer for both non-foliar and foliar materials:
where is the mean thermal speed of NO2. Table S2 in the Supplement contains the literature values of and the associated experimental temperatures that were used to infer values of to foliar surfaces of deciduous and coniferous species under nocturnal/dark conditions, non-foliar forest materials (bark and forest floor), snow, and fabricated materials. With the exception of deposition to snow, the literature values of are from chamber studies where mechanically mixed chamber air enables the direct estimation of through Eq. (4); i.e., turbulent (Ra) and quasi-laminar (Rb) resistances may be neglected for species with slow surface uptake (such as NO2) since . Values of leaf-level for both deciduous and coniferous species were averaged across periods of minimum stomatal conductance resulting from the absence of photosynthetically active radiation (PAR) and are interpreted herein for the purpose of making the resulting value non-stomatal. Table S2 also includes the corresponding surface areas used for flux normalization; care must be taken when comparing surface-specific and , as various surface areas are used (i.e., planar, geometric, projected leaf area, and total leaf area). Hanson et al. (1989) report to coniferous species normalized to total leaf area, as stomata are distributed across the whole needle surface (amphistomatic). Often, studies normalize to projected leaf area, as is routinely done for deciduous leaves, which generally have stomata on the lower (abaxial) leaf surface. Failing to recognize this difference would result in a misrepresentation of and inferred by a factor of ∼ 2.7 for coniferous species (Riederer et al., 1988).
Table 1 summarizes the values of , including those used in Sect. 3.3.4 to compute nocturnal bottom-up estimates of bulk-canopy Rc(NO2) and the resulting Vd(NO2) over Harvard Forest. Also included are the associated surface area scale factors α for which is to be applied and the relative humidities over which measurements were made. We suggest that NO2 uptake to the surfaces listed in Table 1 may result from heterogeneous hydrolysis of NO2 following Reaction (R1), with variability between surfaces primarily a result of differences in microscopic surface area supporting adsorbed water. Some of the studies measuring foliar uptake of NO2 under conditions where stomatal aperture should be at a minimum conclude that uptake could occur to the interior of leaves via partially open stomata rather than non-stomatally to the exterior leaf surfaces (Breuninger et al., 2013; Chaparro-Suarez et al., 2011; Delaria et al., 2020; Rondón et al., 1993). Our assumption of nocturnal stomatal closure with deposition of NO2 to the exterior of leaves via Reaction (R1) is discussed further in Sect. 4. To help contextualize values of , Sect. S3 in the Supplement provides a brief literature review of uptake coefficients for NO2 to hydrated surfaces.
Table 1Surface-specific NO2 uptake coefficients inferred from the literature values of surface-specific deposition velocitiesa following Eq. (4). Also included are surface area scale factors α for which is to be applied and the surface areas and relative humidities over which surface-specific deposition measurements were made.
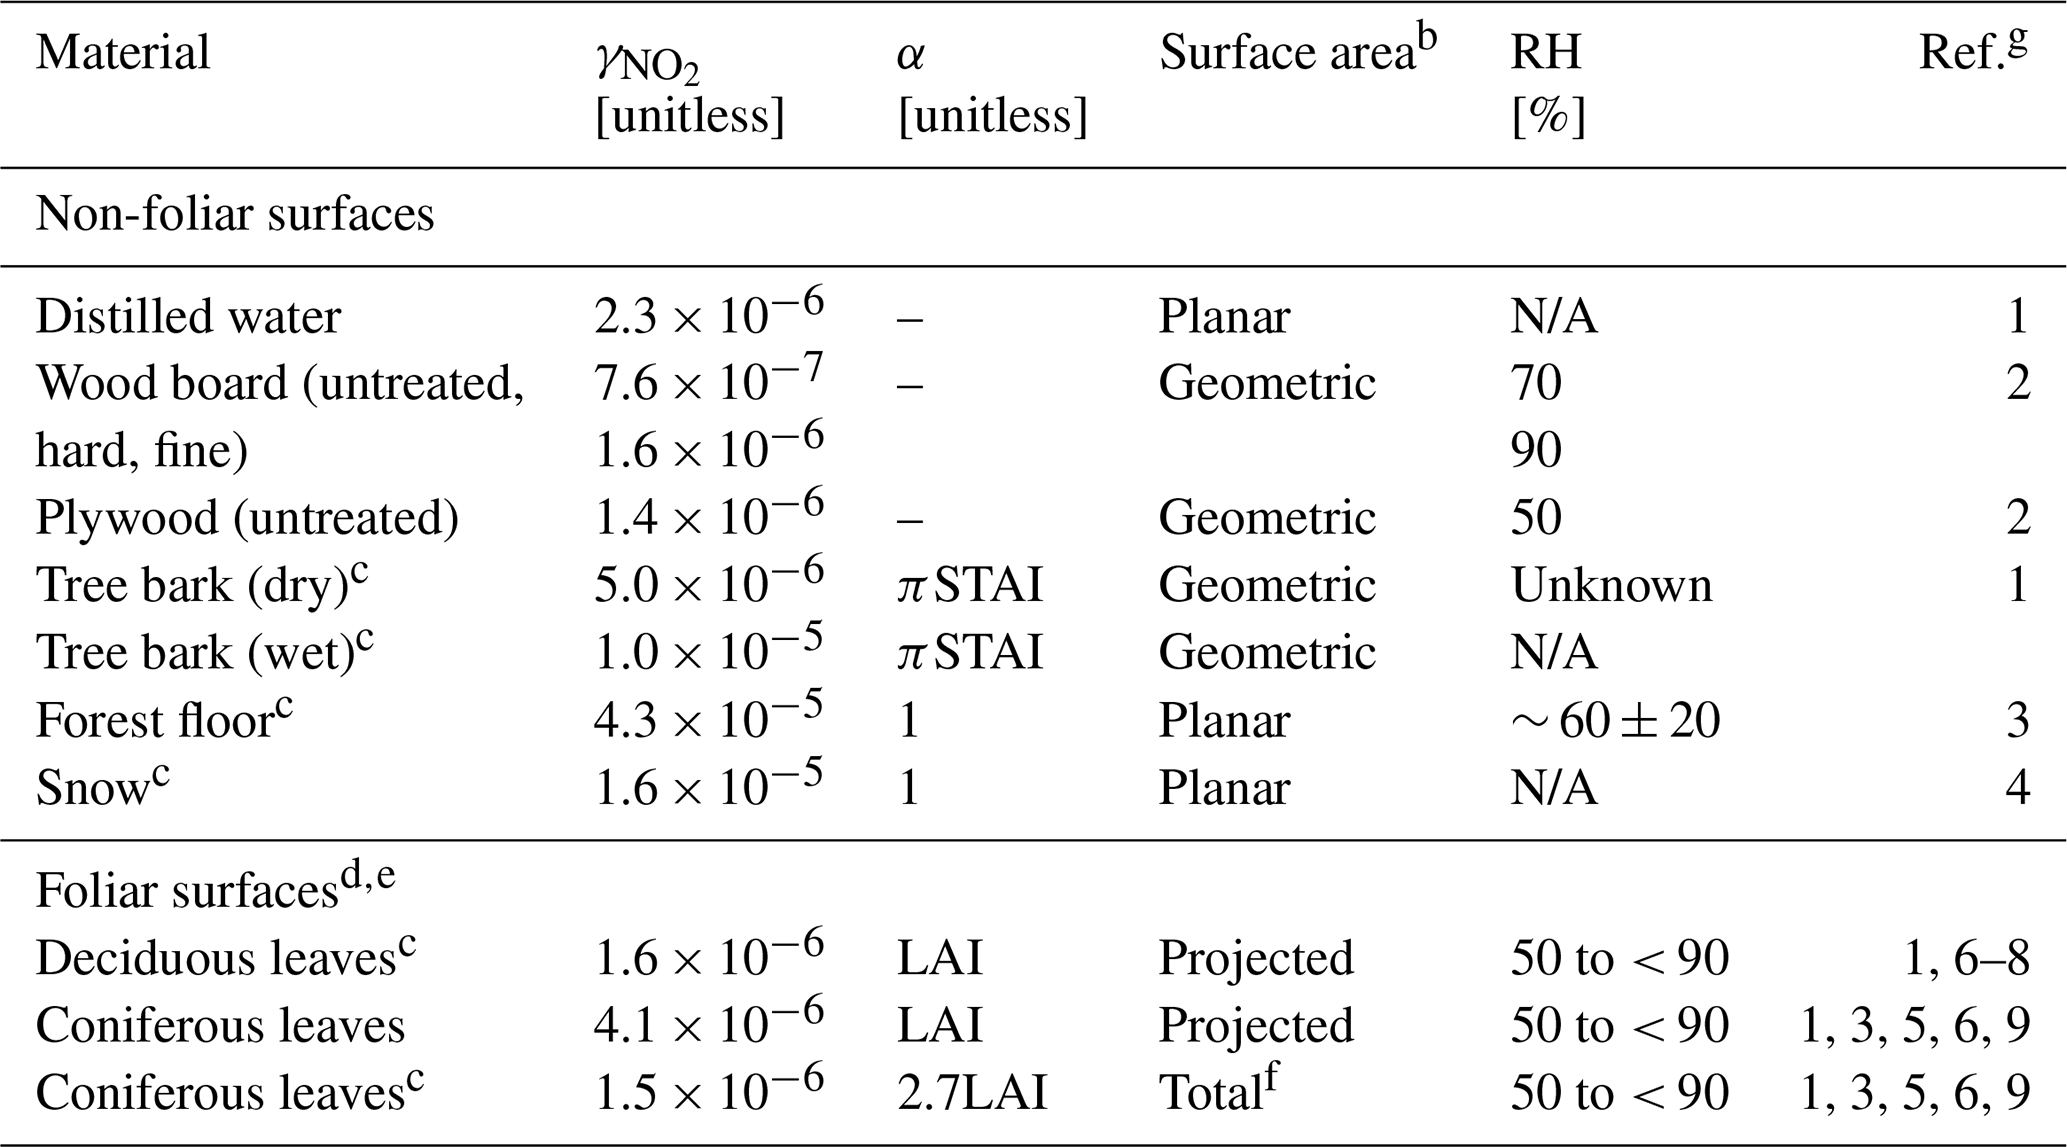
a Surface-specific deposition velocities () were taken from chamber studies, with the exception of uptake to snow, which was measured via the eddy covariance technique. Table S2 in the Supplement contains study-specific details. b Surface area used to normalize surface-specific deposition fluxes in the computation of (Table S2). c Values used in Sect. 3.3.4 to compute bottom-up estimates of nocturnal bulk-canopy Vd(NO2) over Harvard Forest. d Foliar uptake was measured under conditions of minimal stomatal aperture, i.e., dark conditions. We assume this uptake to be non-stomatal (Sect. 4). e Multi-study mean values computed herein (Table S2). f Reported normalized to projected leaf areas were scaled herein to reflect uptake to total leaf surface area – a factor of 2.7 for coniferous needles (Riederer et al., 1988). g References for surface-specific ) are (1) Hanson et al. (1989), (2) Grøntoft and Raychaudhuri (2004), (3) Rondón et al. (1993), (4) Stocker et al. (1995), (5) Wang et al. (2020), (6) Delaria et al. (2020), (7) Delaria et al. (2018), (8) Chaparro-Suarez et al. (2011), and (9) Breuninger et al. (2013). NA denotes not applicable.
Table 2 summarizes modifications made herein to the offline gaseous dry-deposition parameterization from GEOS-Chem discussed throughout this section. Briefly, parameterization P1 is equivalent to the dry-deposition scheme in GEOS-Chem, which references deposition from grid box centers (GBCs) of the lowest model level (∼ 60 m). Serial modifications to P1 include changes to the height at which dry deposition is referenced (P2), changes to the calculation of aerodynamic resistance (P3) and molecular diffusivities (P4), updating non-stomatal surface resistance for NO2 following the Z03 scheme (P5) and subsequent replacement with a scheme that represents heterogeneous hydrolysis on deposition surfaces (P6, P7), and finally, implementation of empirical updates to the non-stomatal uptake of PAN (P8). We begin by evaluating parameterizations P1–P4 by comparing to measured dry-deposition velocities from Nguyen et al. (2015), where it was noted that above-canopy deposition velocities for H2O2, HMHP, and HNO3 corresponded to computed theoretical maximums (i.e., ), thus enabling a more direct evaluation of the deposition pathway consisting of resistances Ra and Rb, as discussed in Sect. 3.1 and 3.2, respectively. Parameterizations P5–P7 are evaluated by comparing to both above-canopy nocturnal Vd(NO2) observed at the HFEMS (Sect. 3.3.3) and bottom-up estimates of nocturnal Vd(NO2) for Harvard Forest from the literature values of surface-specific deposition velocities (NO2) (Sect. 3.3.4). Parameterization P8 is evaluated in Sect. 3.4 in the context of its effects on simulated Vd(NOy), including a comparison to the above-canopy diel Vd(NOy) observed at the HFEMS.
Table 2Modifications to the offline dry-deposition parameterization tested in this study. Parameterization P1 is equivalent to the gaseous dry-deposition scheme in GEOS-Chem (GC). Modifications to P1 include changes to reference height zref (P2), to the formulation of aerodynamic resistance Ra (P3), to molecular diffusivity D (P4), and to non-stomatal surface resistances Rc for NO2 (P5–P7) and PAN (P8).
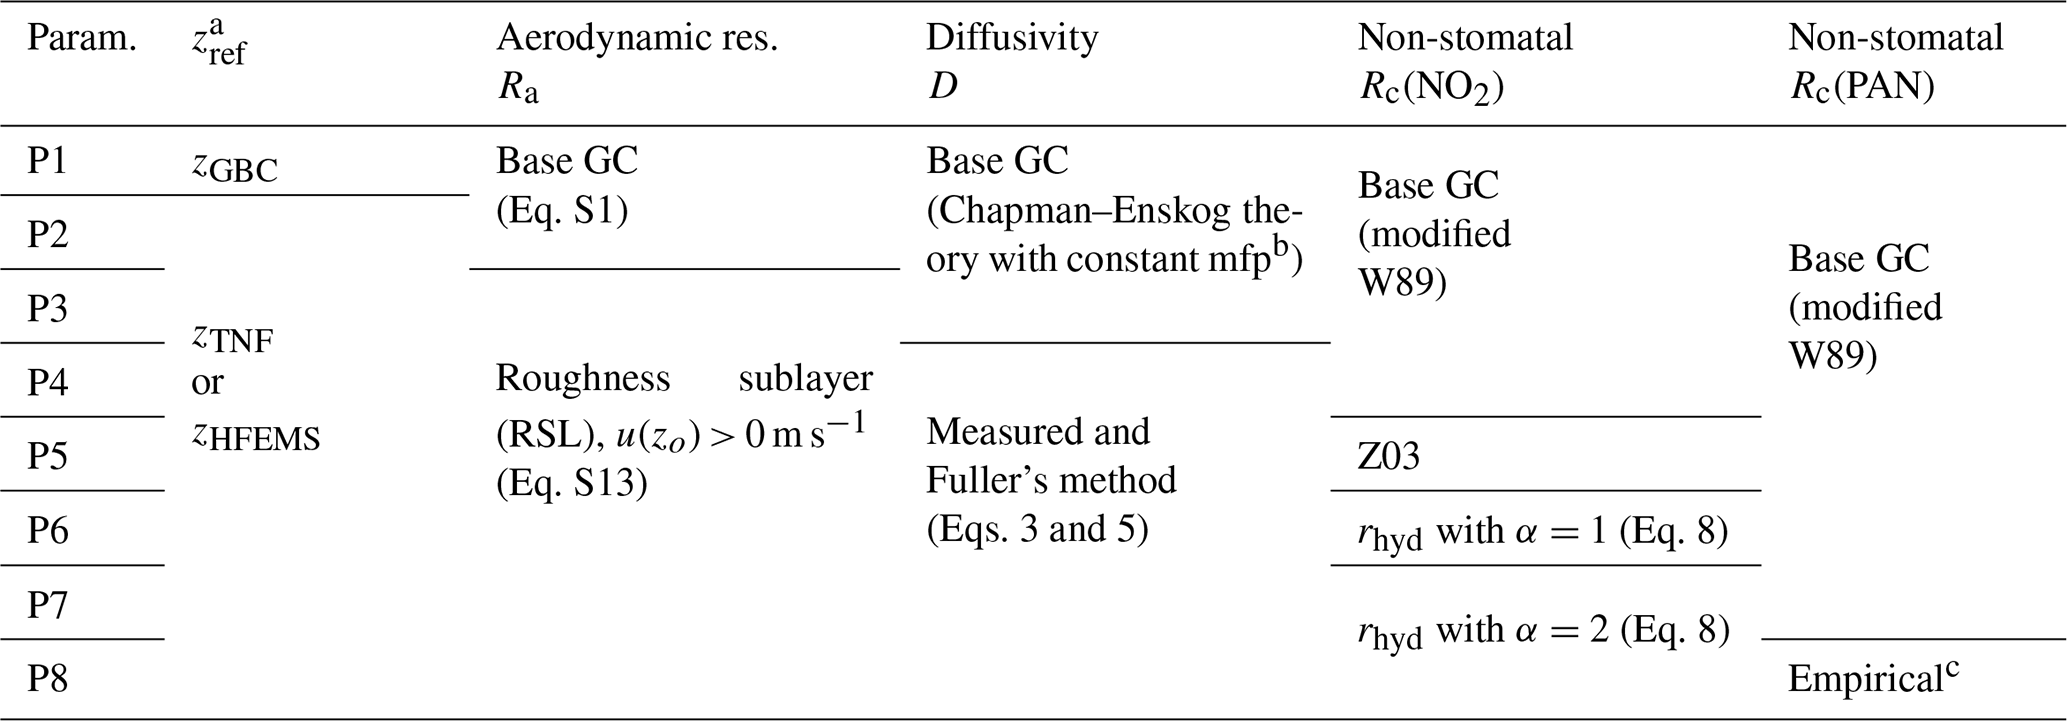
a Dry-deposition reference height is zGBC ≃ 60 m, zTNF=22 m, and zHFEMS=29 m. b Mean free path (mfp) is held constant across depositing gases. c Empirical fit of non-stomatal cuticular deposition (Turnipseed et al., 2006) modified herein for LAI (Sect. S5 in the Supplement).
3.1 Updates to the calculation of aerodynamic resistance
Table 3 contains an evaluation of simulated atmospheric resistances (Ra and Rb) in parameterizations P1–P4 by comparing to measured daytime deposition velocities for rapidly depositing species from Nguyen et al. (2015). In contrast to the findings of Wu et al. (2021) that show excellent model–measurement agreement of peak daytime Vd(HNO3) and Vd(H2O2) between the Z03 scheme and the dataset from Nguyen et al. (2015), parameterization P1 overestimates daytime mean deposition velocities for the following rapidly depositing species: H2O2 (+15 %), HMHP (+41 %), and HNO3 (+52 %). Nguyen et al. (2015) found excellent agreement between hourly GEOS-FP-assimilated meteorology at this site (used herein for computation of Vd in Table 3) and measured values, including u∗ and sensible and latent heat fluxes. GEOS-FP fields report a summertime zo=2.2 m for the 0.25° × 0.3125° grid cell that includes the CTR site – greater than would be expected at this site given the local 10 m canopy height. Prescribing zo to be 10 % of hc in parameterization P1b, in accordance with conventionally used values for natural vegetation and in agreement with an updated land use module developed for GEOS-Chem (Geddes et al., 2016), results in a 35 % increase in Ra and notable reductions in Vd high biases. However, following the computation of Ra in GEOS-Chem, P1b computes Ra from a reference height z of ≃ 60 m despite a measurement height of 22 m at the CTR site, while neglecting a displacement height d. Neglecting d from the computation of Ra in Eq. (S1) in the Supplement increases daytime Ra in parameterization P1b by 1 % when referenced from 60 m and 9 % when referenced from 22 m. Although the greatest sensitivity of Ra to z occurs in proximity to zo (Fig. S2), the difference between Ra computed from an above-canopy measurement height and the typical heights from which global CTMs reference dry deposition can be significant (Figs. S1 and S2). Referencing Ra from the CTR measurement height of 22 m in parameterization P2 results in a 23 % decrease in daytime Ra, returning Vd biases to P1 levels (Table 3).
Table 3Effects of updates to the calculation of aerodynamic resistance (Ra) and quasi-laminar sublayer resistance (Rb) on simulated daytime (10:00–15:00 LT) dry-deposition velocities (Vd) over Talladega National Forest (temperate, mixed) for three rapidly depositing species. Serial modifications to the base parameterization P1 are highlighted, i.e., PX (update). Shown are the mean quantities ± standard deviations about the hourly time seriesa and the normalized mean bias (NMB) between simulated and measuredb Vd.
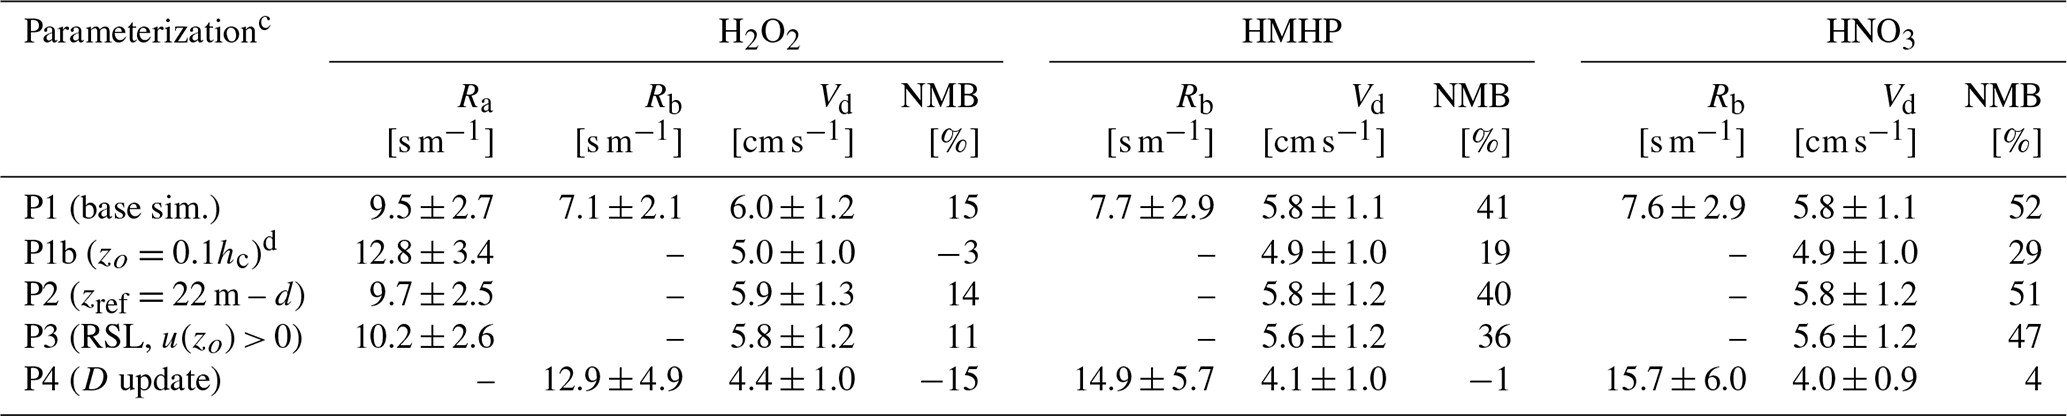
a Mean quantities are averaged across the five daytime periods in June 2013 that Nguyen et al. (2015) used in their analysis of eddy-covariance-observed deposition velocities (Sect. 2.2.1). b Measured (eddy covariance) daytime (10:00–15:00 LT) Vd(H2O2)=5.2 ± 1.1 cm s−1, Vd(HMHP) = 4.1 ± 1.1 cm s−1, and Vd(HNO3)=3.8 ± 1.3 cm s−1 (Nguyen et al., 2015). c Table 2 contains a list of parameterization updates. Surface resistance (Rc) was set to 1 s m−1 following the minimum allowed in GEOS-Chem (Sect. S1 in the Supplement). d Roughness length (zo) was set to 10 % of canopy height (hc) for parameterizations P1b–P8.
Considering the fact that the CTR and HFEMS measurement heights, ∼ 2 hc and 1.5 hc, respectively, are at the upper limits of the roughness sublayer (RSL), a region where turbulent mixing in the wake of roughness elements is enhanced by a factor of 2 to 3 above that predicted by Monin–Obukhov (M–O) similarity theory (see Sect. S2.4 in the Supplement for a review of RSL mixing), Ra computed according to M–O similarity theory following Eq. (S1) may be a slight underestimate due to non-zero horizontal winds at zo resulting from enhanced downward mixing of momentum. To quantify this effect, parameterization P3 computes Ra corrected for RSL mixing, which allows u(zo) > 0 m s−1 (Eq. S13), resulting in a small (5 %) increase in Ra at the CTR measurement height under the daytime conditions of Table 3 and even smaller changes to Vd given the influence of Rb (Sect. 3.2). As demonstrated herein and in agreement with previous work (Simpson et al., 1998), it may be appropriate to neglect the effects of RSL on depositing species when referenced from a height of at least 1.5–2 hc. However, studies endeavoring to understand bidirectional exchange or the dispersion of near-surface emissions should consider the effect of asymmetrical Ra that the RSL imposes (Sect. S2.2 and S2.4).
3.2 Updates to the calculation of molecular diffusivities
As seen in Table 3, updates to the calculation of Ra failed to address high biases in simulated deposition velocities of rapidly depositing species. The higher-molecular-weight species HMHP and HNO3 exhibit a greater high bias in Vd, 36 % and 47 %, respectively, than the lower-molecular-weight species H2O2 (11 %). Given the dependence of Vd,max on molecular diffusivity through its influence on Rb (Eq. S2) (Meyers et al., 1989), we evaluate the calculation of molecular diffusion coefficients in GEOS-Chem against measured values for atmospherically relevant molecules.
Figure 1 depicts a large high bias in calculated diffusion coefficients from the dry-deposition module of GEOS-Chem, which uses the Chapman–Enskog theory for binary diffusivity (Seinfeld, 1986). The bias results from the use of a constant collision diameter of σ=2.7 Å with air for all species – an underestimate for many atmospherically relevant molecules, i.e., σ for O3 with air is 3.793 Å (Massman, 1998; Poling and Prausnitz, 2004). The collision diameter σ is a pairwise characteristic length scale of the Lennard–Jones intermolecular force, which is not readily available for many atmospheric trace gases (Tang et al., 2014). Several semiempirical methods have been proposed for the estimation of D (the diffusion coefficient) in low-pressure binary systems (Poling and Prausnitz, 2004). Fuller et al. (1966) developed a simple and generalized semiempirical correlation equation for the estimation of binary gas-phase diffusion coefficients using additive atomic diffusion volumes Vi for each species and . The diffusion coefficient D [cm2 s−1] for trace gas A in bath gas B is given by
where P is the pressure [atm], T is the temperature [K], and M is the molecular mass [g mol−1]. Atomic and, in some cases, molecular diffusion volumes were obtained from regression analysis of 153 binary systems across 340 T–P states and are summarized in Poling and Prausnitz (2004), Tang et al. (2014), and Tang et al. (2015). As seen in Fig. 1, diffusion coefficients computed using Fuller's method result in a much-improved comparison to measurements, with better agreement to organic species (R2=0.99 and NMB = −3 %) than to inorganics (R2=0.88 and NMB = 13 %), consistent with the findings of Tang et al. (2014, 2015).
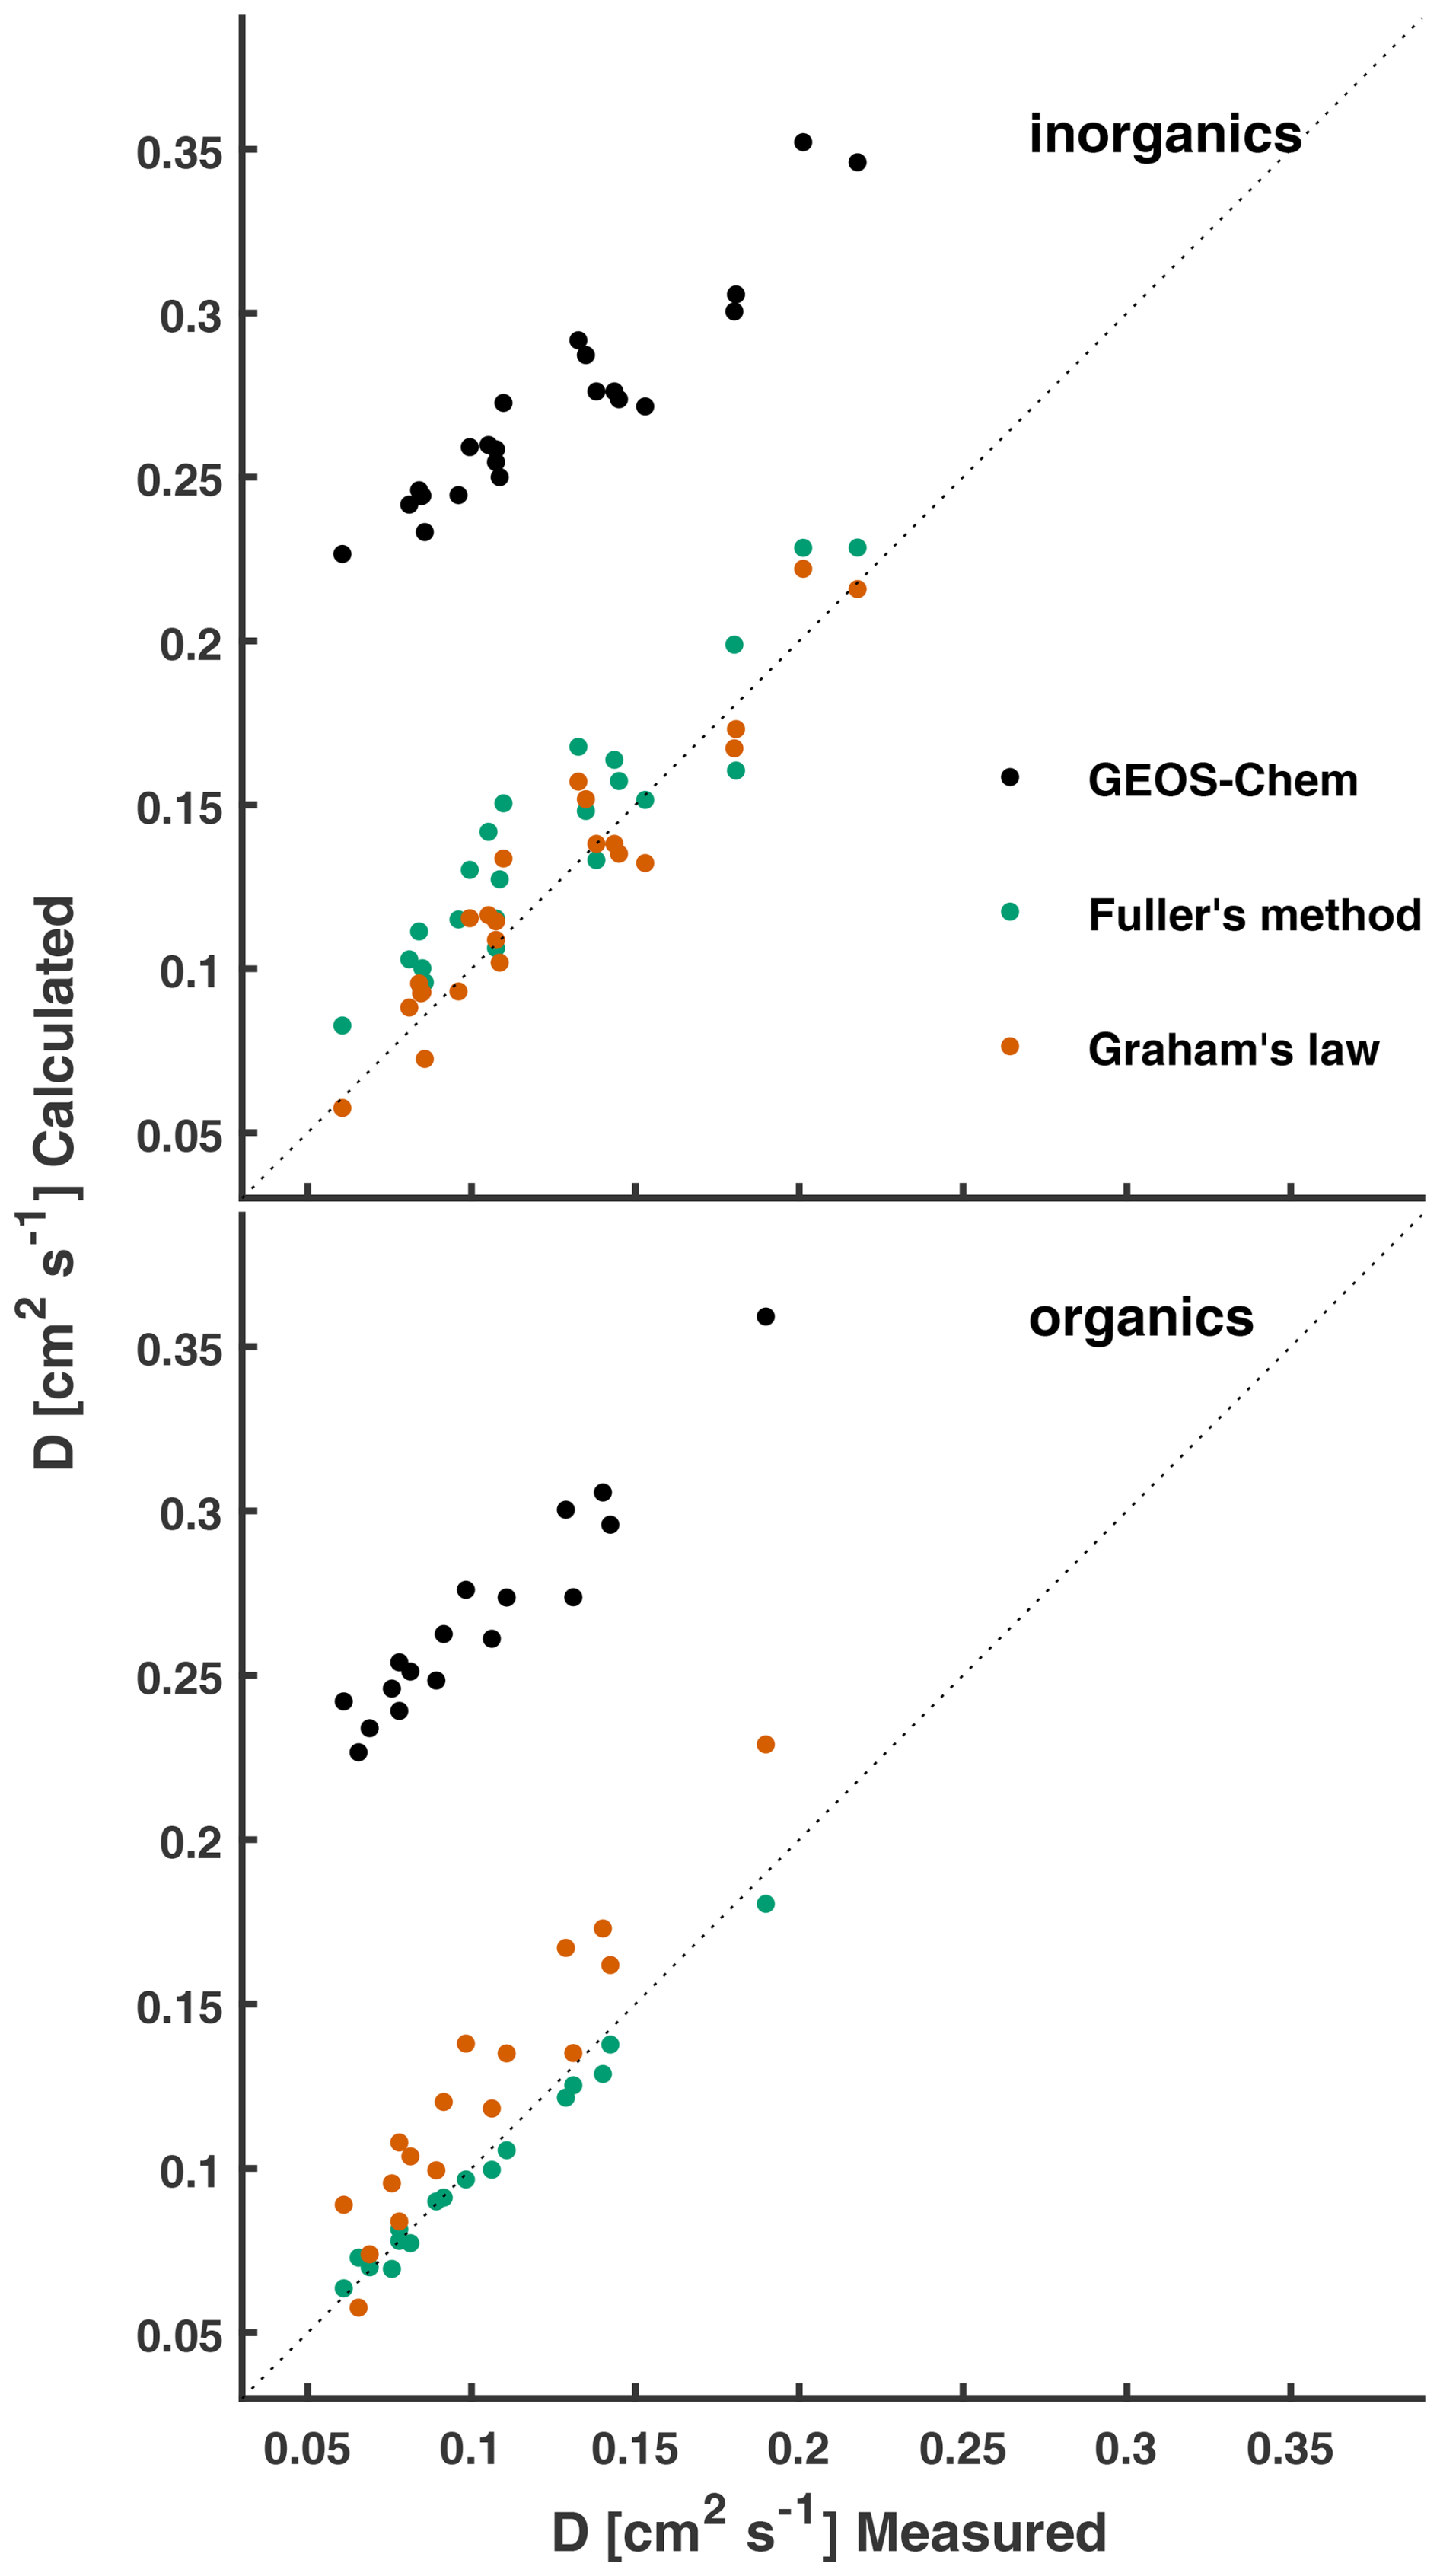
Figure 1Measured diffusion coefficients of atmospherically relevant molecules in air or N2 at STP are compared to the calculated values. Molecular diffusivities calculated following the method used in GEOS-Chem (P1–P3) are compared to those calculated following Fuller's method and Graham's law (referenced from ). Measured and computed (Fuller's method) values are listed in Table S1 in the Supplement.
Figure 1 also depicts molecular diffusion coefficients approximated by Graham's law of effusion, i.e., (Mason and Evans, 1969), where (continuum) diffusion coefficients are approximated by the Knudsen diffusion coefficients Dk – an oversimplification of Eq. (5) and a strategy commonly used in the atmospheric science community (Nguyen et al., 2015; Weber and Renenberg, 1996; Wesely, 1989). The resulting diffusion coefficients scaled from measured correlate well with the measured values (R2=0.91), with normalized mean biases (NMBs) to inorganic and organic species of 3 % and 20 %, respectively. In a review of molecular diffusivities of atmospherically relevant molecules, Massman (1998) note that misapplication of Graham's law to molecular diffusivities can lead to errors of up to 23 %. Measured and computed diffusion coefficients from Fuller's method, assuming air as the bath gas, are presented in Fig. 1 and tabulated in Table S1. We do not differentiate between diffusivity measurements carried out in air and in N2, as differences are expected to be small, i.e., a 2 % difference in at STP in air vs. in N2.
Parameterization P4 computes Rb using measured diffusion coefficients when available and diffusion coefficients according to Fuller's method in the absence of measured values. Diffusion coefficients are adjusted to ambient T-P following Eq. (3) prior to calculating Rb. Eliminating the high bias in calculated molecular diffusivities resulted in a near doubling of Rb for the species in Table 3 and a much-improved comparison to the daytime deposition velocities for the higher-molecular-weight species HMHP (NMB −1 %) and HNO3 (NMB 4 %). The increase in Rb for H2O2 results in a low bias of −15 %, which is well within the large relative uncertainty for Rb due to variations in canopy structures (Massman et al., 1994; Sievering et al., 2001).
Molecular diffusivity is also involved in the calculation of Rc via its influence on stomatal resistance rs, which is scaled by the ratio in the dry-deposition parameterizations commonly used in chemical transport models (Wesely, 1989; Zhang et al., 2003a). The effect of updated molecular diffusivity on Rc in GEOS-Chem is significant for molecules that dry deposit under stomatal control, i.e., species with low aqueous solubility or surface reactivity, and is discussed in Sect. S5 in the Supplement.
3.3 Nocturnal dry deposition of NO2 over Harvard Forest
3.3.1 Eddy-covariance-inferred Vd(NO2)
Nocturnal hourly eddy covariance NO2 fluxes and the resulting exchange velocities Vex(NO2) over Harvard Forest from April to November 2000 are shown in Fig. 2 as a function of NO2 concentration. We restrict our analysis to nighttime (20:00–04:00 local standard time (LST)), when above-canopy NO2 : NOx is ∼ 1, and photochemical flux divergence of the NO–NO2–O3 triad due to the presence of a vertical gradient in irradiance through the forest canopy (Gao et al., 1993) is absent. As seen in the top panel of Fig. 2, nocturnal fluxes of NO2 over Harvard Forest are predominantly (∼ 70 %) downward, especially at higher ambient NO2 concentrations. Nocturnal mean (median) ±1σ fluxes of NO2 from April to November are −0.8 (−0.3) ± 2 ppb cm s−1. These downward (p < 0.01) above-canopy aggregate fluxes of NO2 are comparable in magnitude to counteracting summertime nocturnal soil NO emissions, estimated by Munger et al. (1996) through a mass–balance approach to be ∼ 0.9 µmol m−2 h−1 (3.5 ng N m−2 s−1 or 0.62 ppb cm s−1) at the HFEMS. Munger et al. (1996) note that nocturnal NO is elevated near the forest floor, and Horii et al. (2004) find decreasing within-canopy nocturnal NO profiles at Harvard Forest, with above-canopy concentrations and fluxes indistinguishable from zero despite net downward fluxes of NO2, presumably due to the titration of soil-emitted NO by O3 on a timescale much shorter (minutes) than in-canopy vertical mixing, followed by nocturnal canopy loss processes for NO2. Previous studies have noted the importance of knowledge of local soil NO emissions and within-canopy processes involving NOx when interpreting above-canopy NO2 fluxes (Delaria and Cohen, 2020; Eugster and Hesterberg, 1996; Flechard et al., 2011; Min et al., 2014).
In an effort to isolate the contribution that dry deposition makes to the above-canopy nocturnal eddy covariance fluxes (FEC) of NO2, we infer Vd(NO2) following Eq. (6) to account for the effects of nocturnal chemical flux divergence (Vchem) and to counteract the soil NO emissions that are assumed to rapidly titrate with O3 and ventilate the canopy as NO2 (Fsoil). The resulting observation-inferred Vd(NO2) is a best estimate of the nocturnal dry-deposition pathway with which to evaluate parameterizations:
where Vex is the eddy-covariance-observed NO2 exchange velocity, which does not assume predominant deposition and therefore has sign convention analogous to FEC; Vchem represents an estimate of below-sensor nocturnal chemical loss of NO2 via formation and loss of N2O5, limited by the rate of oxidation of NO2 with O3 (Browne and Cohen, 2012; Jacob, 2000). We use an estimate of the maximum rate of nocturnal chemical loss of NO2 proposed by Horii (2002) in their analysis of the dataset used herein, Vchem ≃ 0.05 cm s−1, which translates to a below-sensor (< 29 m) nocturnal chemical lifetime of NO2 to oxidation by O3 of ∼ 16 h. The bottom panel of Fig. 2 includes hourly values of Vex(NO2), both uncorrected and corrected for soil NO. Values of Fsoil used in Eq. (6) are less than the peak summertime forest floor estimate from Munger et al. (1996) due to seasonality and within-canopy loss processes. Hourly estimates of Fsoil were calculated by scaling the reported summertime nocturnal soil NO emission flux at Harvard Forest, FNO, summer (0.62 ppb cm s−1), by GEOS-Chem-simulated seasonality κ and a parameterized canopy reduction factor (CRF):
Month-specific κ scale factors were obtained by normalizing simulated monthly mean nocturnal soil NO emission, which was output at the location of the HFEMS from a high-resolution (0.25° × 0.3125°) GEOS-Chem simulation, by the peak monthly mean simulated emission (July at the location of HFEMS). GEOS-Chem simulated soil NO emission in the region of Harvard Forest exhibits significant seasonality, with a winter minimum that is a small fraction (< 5 %) of the summertime maximum (Fig. S3). Section S4 in the Supplement describes the parameterization of CRF used in GEOS-Chem and in Eq. (7). As NO2 surface uptake resistance Rc(NO2) is used in the calculation of CRF, values are parameterization specific (Fig. S3), with larger values of CRF resulting from lower values of Rc(NO2).
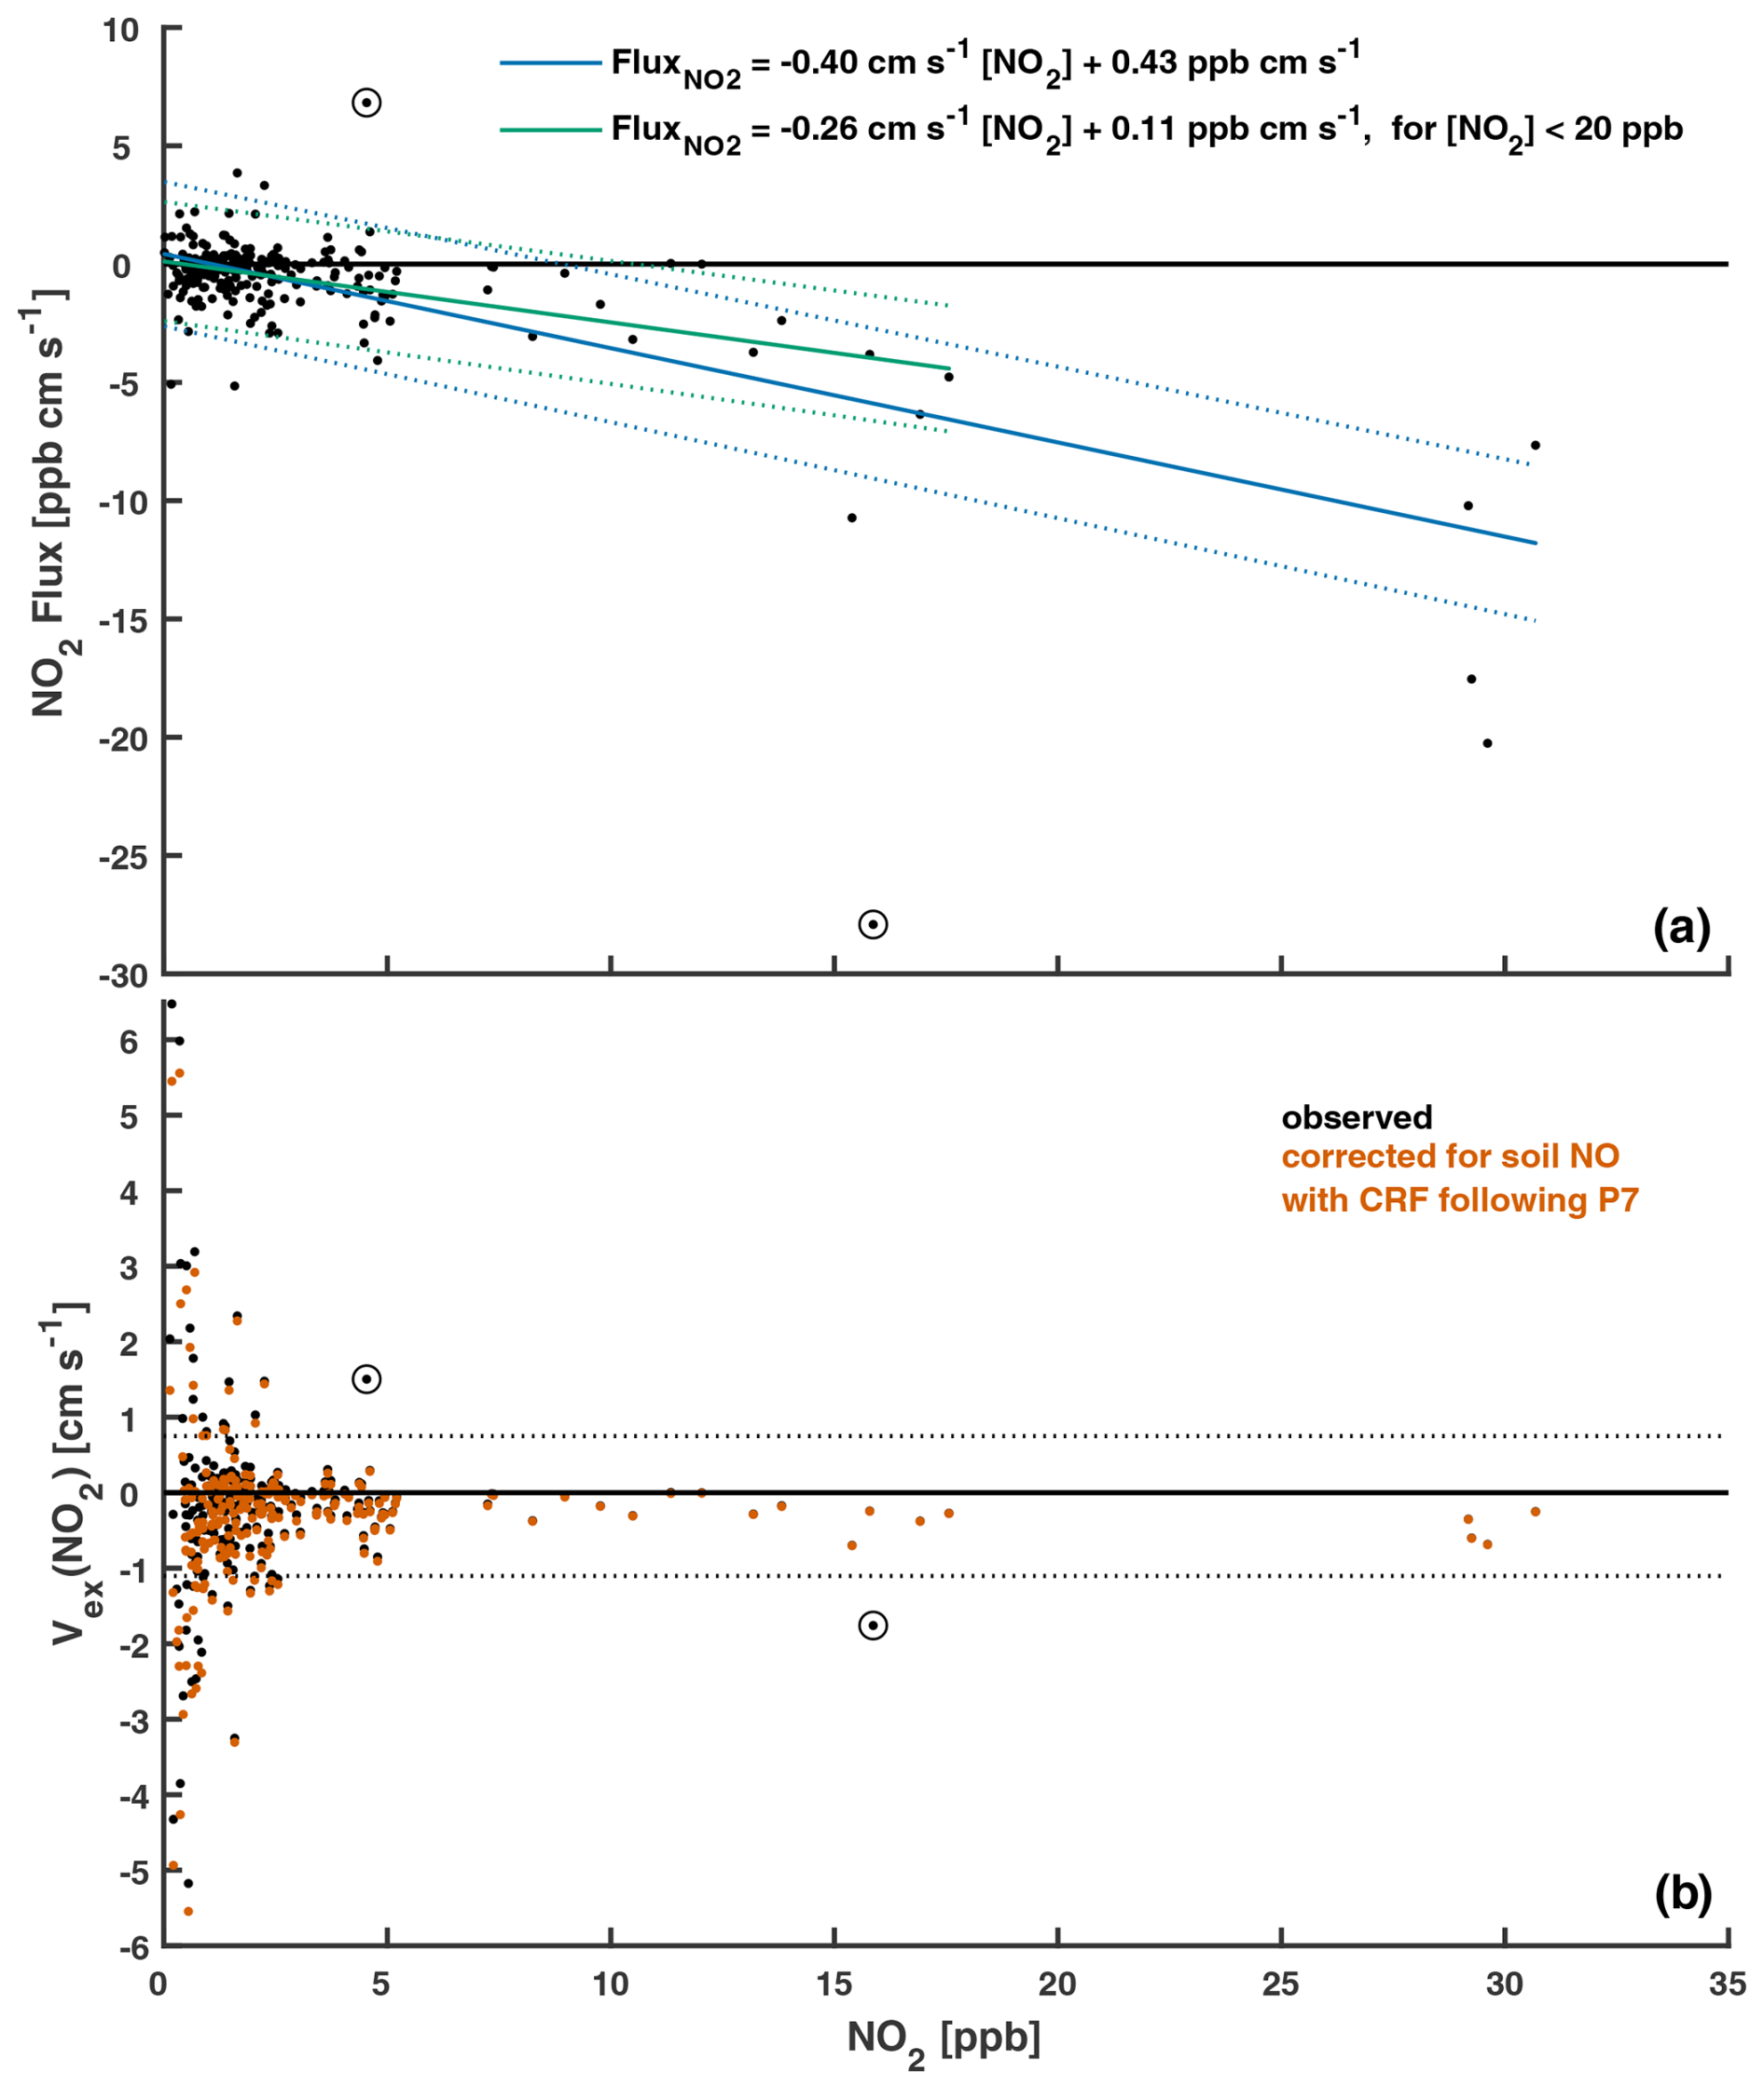
Figure 2(a) Nocturnal (20:00–04:00 LST) hourly eddy covariance NO2 fluxes and (b) the resulting exchange velocities Vex(NO2) as a function of NO2 concentration. These publicly available measurements (Sect. 2.2.2) were taken over an established mixed forest (Harvard Forest) from April to November 2000. Estimated soil NO flux (assumed to ventilate the canopy as NO2) was subtracted from measured hourly NO2 fluxes in order to estimate Vex(NO2) corrected for soil NO (Eqs. 6–7). Included in (a) are linear fits and the associated 95 % prediction intervals. Dashed lines in (b) depict boundaries of an outlier filter applied to hourly Vex(NO2) prior to the calculation of means (Sect. 2.2.2). Data points excluded from the analysis based on visual inspection are circled. Hourly observations made under conditions of low turbulence (u∗ < 0.2 m s−1) were excluded from this analysis.
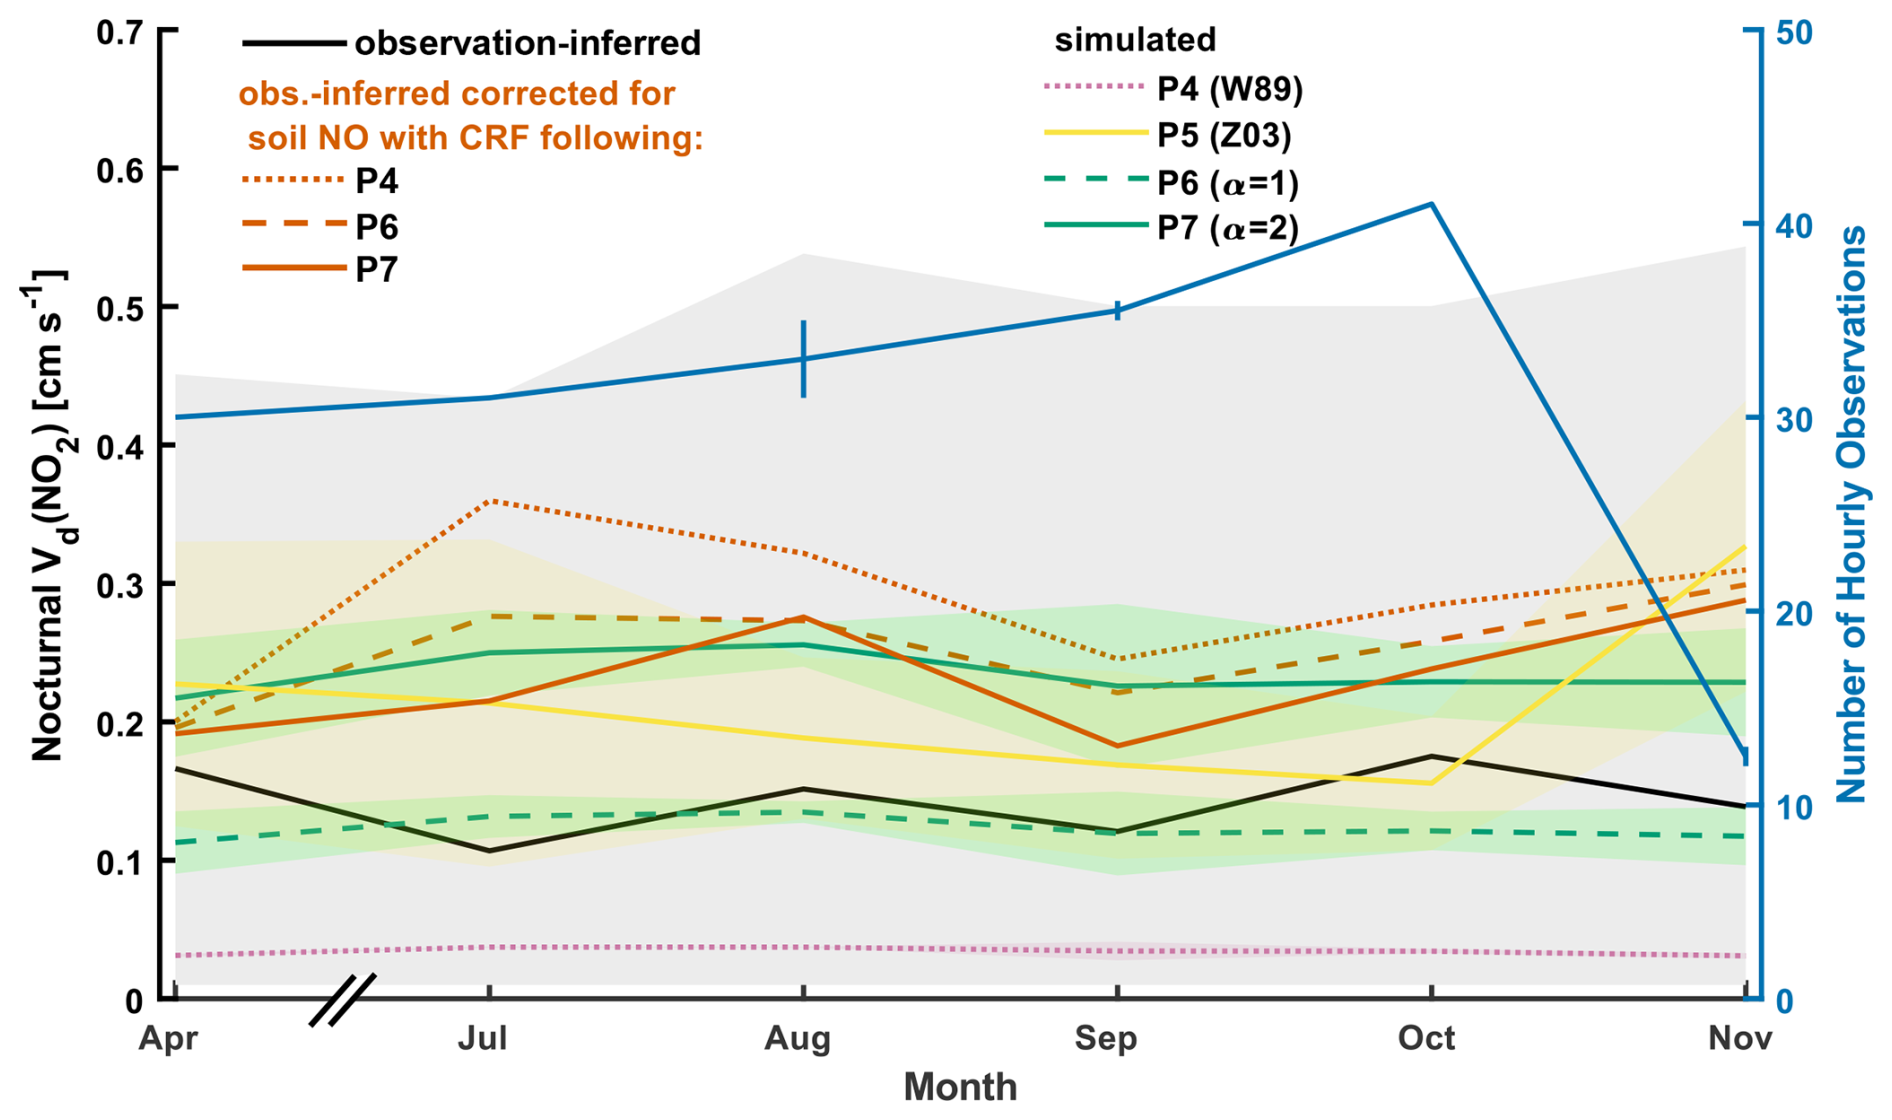
Figure 3Observation-inferred (eddy covariance) and simulated monthly mean nocturnal (20:00–04:00 LST) NO2 deposition velocities Vd(NO2) over Harvard Forest. Simulated values are coincidently sampled with hourly observations prior to averaging. Also depicted is observation-inferred Vd(NO2) corrected for soil NO emission using simulated soil NO canopy reduction factors (CRFs) from parameterizations P4, P6, and P7. Standard deviations about simulated monthly mean values, as well as observation-inferred monthly mean values uncorrected for soil NO, are depicted as shaded areas. Month-specific ranges in number of hourly observations used in the calculation of monthly means are indicated as vertical lines and result from parameterization-specific soil NO corrections causing differential outlier filter exceedance (Fig. 2 and Table 4). Insufficient data prevented analysis for May and June (Fig. S6).
Figure 3 depicts monthly nocturnal Vd(NO2) inferred from Eq. (6) over the HFEMS from April to November 2000 alongside coincidently sampled simulated values from parameterizations P4 to P7. Table 4 presents observation-inferred and simulated values of Vd(NO2) aggregated across all months, as well as associated NO2 lifetimes to dry deposition from the 29 m measurement height. We begin the discussion of eddy-covariance-inferred bulk-canopy Vd(NO2) below, followed by discussions in Sect. 3.3.2 of (i) the large low bias in simulated values stemming from the widely used W89 parameterization of surface resistances and (ii) the reduced bias using the Z03 scheme. In Sect. 3.3.3, we evaluate a simple representation of non-stomatal NO2 uptake following Reaction (R1) against eddy-covariance-inferred Vd(NO2).
Table 4Nocturnal (20:00–04:00 LST) NO2 deposition velocities over Harvard Forest aggregated from April to November. Observation-inferred values with and without estimated soil NO corrections using simulated canopy reduction factors (CRFs) corresponding to parameterizations P4, P6, and P7 are shown along with coincidently sampled simulated values. Measurements under conditions of low turbulence (friction velocity u∗ < 0.2 m s−1) were excluded from the analysis, leaving 230 hourly observations in the time series (Sect. 2.2.2).
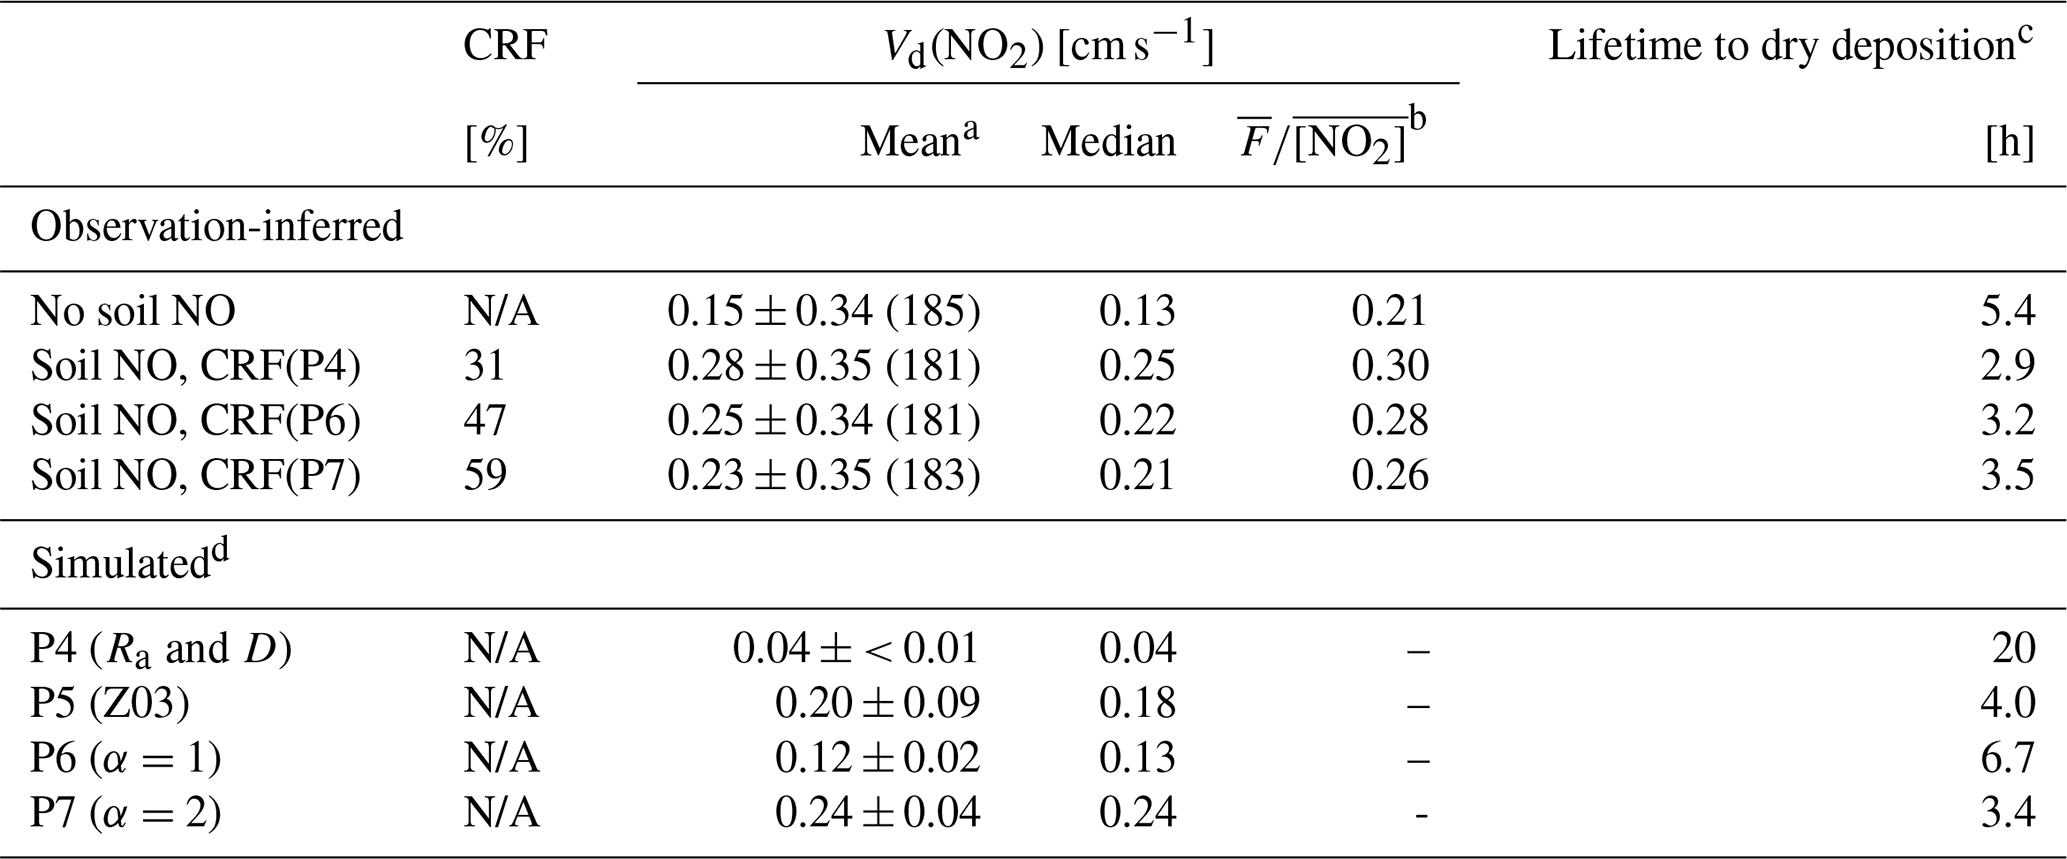
a Observation-inferred hourly values of Vex(NO2), both uncorrected and corrected for soil NO, were subjected to an outlier filter (Fig. 2) prior to the calculation of the arithmetic mean Vd(NO2); the remaining number of hourly observations are included in brackets adjacent to the corresponding mean values and standard deviations. b The ratio of mean NO2 flux to mean NO2 concentration () [cm s−1] is included for comparison (Sect. 3.3.1). c Calculated at 29 m (measurement height) from aggregate mean deposition velocities. d See Table 2 for serial updates. Briefly, P4 has updates to aerodynamic resistance (Ra) and molecular diffusivity (D). P5 computes the resistance to non-stomatal surface uptake of NO2 following Zhang et al. (2003a). P6 computes the resistance to non-stomatal surface uptake of NO2 following Reaction (R1), with surface area scale factor α=1 in Eq. (8). P7 is analogous to P6 but with α=2. N/A denotes not applicable.
As previously mentioned, hourly values of observed Vex(NO2) were subjected to an outlier filter (Fig. 2) prior to computation of mean values, whereas median and “mean flux to mean concentration” ratios () included in Table 4 were not and instead were computed directly from u∗-filtered hourly data, as the latter two statistics are less influenced by outliers than arithmetic means. Aggregate values of in Table 4 are in the same units as Vd(NO2) [cm s−1] and include corrections for Fsoil and Vchem, as do the mean and median quantities computed from hourly values following Eq. (6). Assuming a first-order dependence of NO2 dry deposition on concentration (Eq. 1), computing values of over long averaging times is a strategy to reduce the influence of random variability in deposition velocity estimates, especially under low-NO2 conditions, as are evident in Fig. 2.
As seen in Fig. 3, monthly mean values of observation-inferred Vd(NO2) uncorrected for the influence of soil-emitted NO are in the range of 0.1–0.2 cm s−1. Although the variability is large, with standard deviations greater than the mean values, corrections for soil NO (venting from the canopy as NO2) result in a significant (p < 0.03) increase in nocturnal Vd(NO2), yielding monthly mean values in the approximate range of 0.2–0.3 cm s−1. Both uncorrected and soil-NO-corrected nocturnal Vd(NO2) lack discernible seasonality. In Sect. 3.3.4, bottom-up estimates of nocturnal Vd(NO2) for Harvard Forest are developed in an effort to understand the apparent lack of seasonality in top-down observations. Large variability in the eddy-covariance-observed NO2 flux and the resulting deposition velocities has been noted in other studies (Eugster and Hesterberg, 1996; Farmer et al., 2006; Geddes and Murphy, 2014), wherein authors restrict their analysis to average values in order to reduce the variability in these complex ecosystem-scale observations (Baldocchi, 2003). Herein, we restrict our analysis to the average values over at least 1 month.
3.3.2 Evaluation of nocturnal Vd(NO2) from GEOS-Chem and Z03
Parameterization P4, which computes NO2 surface uptake resistance Rc(NO2) following the W89 representation in GEOS-Chem, yields a simulated nocturnal Vd(NO2) that has a nearly 4-fold low bias compared to observations uncorrected for soil NO, increasing to a 7-fold low bias after correcting for soil NO from parameterization P4 (Table 4). This underestimate is driven by the large nocturnal Rc(NO2) of ∼ 2700 s m−1 in parameterization P4 (Fig. S8), which has been noted in previous studies comparing the W89 algorithm to eddy covariance observations over forest (Horii et al., 2004) and grassland (Eugster and Hesterberg, 1996) ecosystems. Wesely et al. (1982) reported a nocturnal eddy-covariance-observed Vd(NO2) of 0.05 cm s−1 over a summertime soybean field, similar to the P4 value in Table 4. The authors acknowledge that counteracting soil NO emissions may have resulted in low measured values of above-canopy NO2 deposition. In their analysis of eddy covariance fluxes of NO2 over a managed grassland in central Switzerland, Eugster and Hesterberg (1996) found that accounting for counteracting fluxes of soil-emitted NO, oxidized to NO2 below the height of the sensor (∼ 2.7 to 3.6 ng N m−2 s−1), resulted in an increase in inferred nocturnal Vd(NO2) by up to a factor of 2, corresponding to an inferred median value for nocturnal non-stomatal Rc(NO2) of 700 s m−1 (range 500–950 s m−1) – a surface resistance on the order of 4 times lower than was predicted by the W89 algorithm.
In parameterization P5, Rc(NO2) is computed following the Z03 scheme, resulting in large increases in simulated nocturnal Vd(NO2) across all months, as well as increased intra- and inter-month variability (Fig. 3). The Z03 scheme increases non-stomatal NO2 uptake relative to in the W89 scheme. The representation in the W89 scheme results in stomatal control over uptake, with very low non-stomatal uptake (Sect. S5, Fig. S4). The diurnal behavior of observed Vd(NO2) relative to Vd(O3) reported in Wesely et al. (1982) provided support for the use of W89. For use in algorithmic developments to gaseous dry deposition, Zhang et al. (2002a) compiled an updated list of half-reaction redox potentials for species of interest in dry-deposition models, noting greater oxidizing capacity for both NO2 and NO over their assignments in W89. Zhang et al. (2002a) justify setting the non-stomatal conductance of NO2 at 80 % that of O3 – greater than the 10 % used in W89 – based on noted oxidizing capacity and contemporary field studies (Eugster and Hesterberg, 1996; Pilegaard et al., 1998; Rondón et al., 1993; Walton et al., 1997). As seen in Fig. 3, we find the Z03 scheme in parameterization P5 to be in good agreement with eddy-covariance-inferred nocturnal Vd(NO2) at Harvard Forest, with monthly mean values between the observation-inferred values that are uncorrected and corrected for emissions of soil NO. As seen in Table 4, parameterization P5 compares well to observation-inferred Vd(NO2) corrected for soil NO with CRF at greater levels of uptake (i.e., P7 levels).
Although nocturnal Vd(NO2) from parameterization P5 is in good agreement with observation-inferred values over Harvard Forest, it is difficult to justify the increase in parameterized non-stomatal uptake of NO2 in Zhang et al. (2002a), a predecessor to the Z03 scheme, from half-reaction redox potentials alone. Support for the level of non-stomatal NO2 uptake in the Z03 scheme comes largely from field observations – many of which are referenced herein in subsequent sections, as we discuss the plausibility of non-stomatal NO2 uptake being a result of heterogeneous hydrolysis – rather than from suspected NO2 reduction reactions based on half-reaction redox potentials. Exploring this potential misrepresentation of non-stomatal NO2 uptake may have important implications for future representation of HONO surface sources in atmospheric CTMs.
3.3.3 Updates to parameterized Vd(NO2) by representing NO2 hydrolysis on deposition surfaces
Horii et al. (2004) note that observed nocturnal dry deposition of NO2 may result from a surface hydrolysis reaction following Reaction (R1). In parameterizations P6–P8, we replace the non-stomatal components of the bulk-surface resistance scheme for NO2 with a dry-deposition pathway representing NO2 hydrolysis rhyd [s m−1], formulated as a collision-limited heterogeneous reaction with ground surfaces (Cano-Ruiz et al., 1993):
where is a ground uptake coefficient for NO2 resulting from heterogeneous hydrolysis on deposition surfaces, the mean thermal speed of NO2, and α a dimensionless scale factor introduced herein to facilitate application of Eq. (8) across land types of varying surface area densities. Lammel and Cape (1996) recommend that Reaction (R1) be parameterized in atmospheric chemistry models using field-derived uptake coefficients, as realistic conditions are difficult to reproduce in the lab. We use the field-derived ground uptake coefficient for Reaction (R1) from VandenBoer et al. (2013), determined from the production of HONO in a winter nocturnal boundary layer in an agricultural region of Colorado, USA. Consistent with the heterogeneous hydrolysis of NO2 requiring adsorbed water to proceed, VandenBoer et al. (2013) parameterized as a function of RH [ %] according to Eq. (9) to capture the factor of 2 variability in on either side of their best-fit value ():
Parameterization P6 computes rhyd with α=1, resulting in a simulated nocturnal aggregate mean Vd(NO2) of 0.12 ± 0.02 cm s−1 – a 3-fold increase over P4 and satisfactory agreement with observation-inferred Vd(NO2) uncorrected for soil-emitted NO (Table 4). However, this is an underestimate by ∼ 50 % when soil NO emissions are accounted for. The larger nocturnal mean CRF of 47 % for parameterization P6 is due to reduced nocturnal Rc(NO2) (median value ∼ 750 s m−1, Fig. S8), resulting in a small (11 %) decrease in observation-inferred Vd(NO2) corrected for soil NO (Table 4). Increasing the rate of non-stomatal uptake of NO2 by computing rhyd with α=2 in parameterization P7 resulted in a simulated nocturnal aggregate mean Vd(NO2) of 0.24 ± 0.04 cm s−1, which compares well to the observation-inferred Vd(NO2) of 0.23 ± 0.35 cm s−1 after correction for soil-emitted NO using a 59 % CRF from P7 (Table 4). Although parameterization P7 results in satisfactory simulation of nocturnal Vd(NO2) at the HFEMS when averaged across all months, intra- and inter-month variability in observation-inferred Vd(NO2) is not captured in simulated values (Fig. 3).
Physical justification for the scale factor value α > 1 being necessary to reduce the bias between simulated nocturnal Vd(NO2) and observation-inferred values corrected for estimated soil NO could stem from the larger surface area available for NO2 heterogeneous hydrolysis in a mature forest environment compared to the US Midwest wintertime agricultural region over which VandenBoer et al. (2013) derived . Heterogeneous reactions not limited by transport or diffusion to reaction surfaces are governed by a collision-limited rate that scales linearly with the surface area to volume ratio of the reaction vessel or environment (Jacob, 2000). Heterogeneous hydrolysis of NO2 may proceed on any surface accommodating adsorbed water, including foliar surfaces, bark, or elements of the forest floor (i.e., rock, soil, and debris). Despite the hydrophobic nature of many foliar surfaces, thin aqueous films have been observed on coniferous needles (Altimir et al., 2006; Burkhardt and Eiden, 1994) and stomata-bearing surfaces of deciduous leaves (Burkhardt et al., 1999) at ambient humidities well-below saturation. In addition to radiative cooling, elevated humidity within the thin laminar boundary layer surrounding leaves may result from stomatal transpiration (Burkhardt and Hunsche, 2013) and to a lesser extent the hydraulic activation of stomata (HAS) (Burkhardt, 2010), a process discussed further in Sect. 4. Surface area indices [m2 m−2] for forest components at the HFEMS have been estimated (Fig. S5), including for stems and twigs (STAI = 0.9), coniferous needles (CAI = 0.8), and deciduous leaves (DLAI = 3.4 summertime maximum). Assuming round stems and twigs (Sörgel et al., 2011) and oblate coniferous needles (Oren et al., 1986; Riederer et al., 1988), the total wintertime canopy surface area is estimated as πSTAI + 2.7CAI ≃ 5 m2 m−2. We estimate the summertime canopy surface area to be ∼ 12 m2 m−2 accounting for both sides of deciduous leaves or ∼ 9 m2 m−2 neglecting the non-stomatal adaxial (top) surface of deciduous leaves, in agreement with typical macroscopic surface area indices for temperate and boreal forest canopies (12 m2 m−2, range of 5–14 m2 m−2) (Lammel, 1999). The surface area of the forest floor, including debris, would also be much greater than the planar ground area and that of tree bark is greater than the simple geometric surface area (Sect. 3.3.4).
The lack of seasonality in observation-inferred nocturnal Vd(NO2) depicted in Fig. 3 may reflect an inter-seasonal buffering of available surface area for the reaction of above-canopy NO2 due to increased air parcel mixing throughout the lower canopy in the absence of deciduous leaves (see Sect. 3.3.4). We did not attempt to parameterize non-stomatal deposition of NO2 to upper- and lower-canopy elements separately in our top-down sensitivity analysis of Rc(NO2), as is currently the approach in the W89 and Z03 dry-deposition schemes. Due to the lack of discernible seasonal variability in observation-inferred nocturnal Vd(NO2), above-canopy observations were insufficient to justify the additional variables. We acknowledge that the nocturnal canopy environment is under reduced turbulent mixing compared to daytime conditions when the forest experiences enhanced vertical exchange (Bannister et al., 2023; Sörgel et al., 2011; Thomas and Foken, 2007). Although the daytime surface area available to above-canopy deposition is therefore likely to be greater than that at night, the nighttime sensitivity of Vd(NO2) to α is much greater than during the day when stomata are open and foliar uptake of NO2 is a more substantial pathway to deposition than non-stomatal uptake (Fig. S8). Increasing α from 1 to 2 results in a 100 % increase in simulated Vd(NO2) at night (Table 4) but only a 10 % increase during midday (Sect. S5).
The canopy compensation point for NO2 is the ambient above-canopy concentration at which point consumption (i.e., dry deposition) and production (i.e., soil emission) are in balance (Duyzer et al., 1995). Studies of above-canopy NO2 exchange have observed aggregate fluxes to be upward (Min et al., 2014; Vaughan et al., 2016), downward (Coe and Gallagher, 1992; Horii et al., 2004; Walton et al., 1997), and not significantly different from zero (Geddes and Murphy, 2014) – highlighting the importance of knowledge of below-canopy NOx emission and subsequent uptake and reaction prior to attempting interpretation of above-canopy fluxes. Although foliar compensation points for NO2 – the concentration below which vegetation is proposed to become a net source of NO2 – have been observed in the past via leaf-level chamber measurements to be generally < 2 ppb (Geßler et al., 2002; Sparks et al., 2001; Weber and Renenberg, 1996), recent chamber studies using highly specific NO2 detection methods have failed to observe foliar emission (Breuninger et al., 2013; Chaparro-Suarez et al., 2011; Delaria et al., 2018, 2020; Wang et al., 2020). By restricting analysis to (i) nocturnal conditions when RH is generally high (Fig. S7) and stomata are assumed to be closed (Sect. 4), and to (ii) well-established turbulence (u∗ > 0.2 m s−1), we find that monthly aggregate Vd(NO2) is relatively constant in the range of 0.2–0.3 cm s−1 across April–November, with expected large variability on finer timescales (i.e., σ=0.35 cm s−1 across the hourly dataset). Linear regression of hourly nocturnal NO2 flux vs. ambient NO2 concentration (Fig. 2) yields a Vex(NO2) of −0.40 cm s−1 (p < 0.01) over the entire NO2 concentration range (up to ∼ 30 ppb) and −0.26 cm s−1 (p < 0.01) when the four outlying hourly observations beyond 20 ppb NO2 are excluded – consistent with the findings of Horii et al. (2004). An inferred Vd(NO2) of 0.21 cm s−1 is obtained after subtraction of Vchem=0.05 cm s−1 – similar to the aggregate values presented in Table 4. The y-axis intercept of 0.11 ppb cm s−1 in Fig. 2, although not significant (p > 0.1), is in line with the estimated mean (April–November) above-canopy NO2 flux of 0.13 ppb cm s−1 resulting from soil NO emission and an average CRF of 59 % from parameterization P7. An empirical CRF of ∼ 70 % is obtained from the ratio of the y-axis intercept (0.11 ppb cm s−1, Fig. 2) to the seasonal mean below-canopy soil NO flux (0.39 ppb cm s−1). An NO2 canopy compensation point for Harvard Forest, likely due to soil NO emission, is approximated by the x-axis intercept of ∼ 0.4 ppb in Fig. 2.
Given the dependence of rhyd on surface area, land-type-specific α values evaluated across seasons would be desirable to improve confidence in their use in global CTMs. As previously mentioned, Eugster and Hesterberg (1996) inferred a nocturnal non-stomatal median value for Rc(NO2) of 700 s m−1 (range 500–950 s m−1) over managed grassland from soil-NO-corrected eddy covariance observations – similar to the median value of 750 s m−1 simulated herein following Eq. (8) with α=1 (Fig. S8). Pilegaard et al. (1998) report nocturnal Rc(NO2) of 771 ± 111 s m−1 inferred from eddy covariance observations over a harvested wheat field (with re-growth) in southern Germany during mid-September. Given the high nocturnal NO2 concentrations of 10–30 ppb at the location, soil NO most likely had a reduced effect on the resulting Vd(NO2) compared to the large influence noted by Eugster and Hesterberg (1996), where nocturnal NO2 concentrations were less than 10 ppb during periods of soil NO emission. The effect of soil NO on Vex(NO2) as a function of above-canopy NO2 concentration can be seen in Fig. 2, where negligible influence is noted for concentrations above ∼ 5 ppb. Coe and Gallagher (1992) used eddy covariance to estimate a non-stomatal Rc(NO2) of 548 s m−1 over a heather moorland located in the southern Netherlands. Plake et al. (2015) find a maximum median nocturnal bulk Rc(NO2) over a natural grassland site in Mainz, Germany, of 560 s m−1 via the dynamic chamber approach. The nocturnal Rc(NO2) values reported by Coe and Gallagher (1992) and Plake et al. (2015) are in between the rhyd values computed here using α of 1 or 2. Assigning α=1 for low-roughness vegetative land types appears reasonable but may yield slight underestimates in nocturnal NO2 uptake.
Reaction (R1) has been observed proceeding efficiently on ice surfaces, even at low temperatures (< 170 k) (Bang et al., 2015; Kim and Kang, 2010). Stocker et al. (1995) observed nocturnal deposition of NO2 to a snow-covered grassland by eddy covariance in northern Colorado, reporting a median resistance to surface uptake of 740 s m−1, from which we estimate an uptake coefficient to snow γsnow of ∼ 1.6 × 10⁻⁵ (Tables 1 and S2) – similar to following Eq. (9) at 100 % RH. If NO2 dry deposition persists into winter months at the levels observed for late fall in Fig. 3, this represents a significant depositional sink for wintertime NO2 not currently represented in CTMs when both the lifetime and near-surface concentrations of NOx are at a maximum.
3.3.4 Bottom-up estimates of nocturnal Vd(NO2)
Simple estimates of bottom-up bulk-canopy Vd(NO2) provide a useful sanity check on top-down eddy-covariance-inferred values and are a starting point for a mechanistic explanation of bulk-canopy deposition. Bottom-up estimates of nocturnal Rc(NO2) for Harvard Forest were computed from parallel contributions of uptake to leaves, bark, and the forest floor:
where in-canopy aerodynamic resistance ra was computed according to the Z03 scheme. Component canopy surface resistances in Eq. (10) were computed at an hourly resolution following Eq. (8) using the surface-specific NO2 uptake coefficients from Table 1. Component surface area scale factors α are material dependent, varying according to the surface area used to normalize the deposition fluxes in corresponding measurement studies (Tables 1 and S2). Attention must be paid to the corresponding surface area over which a particular uptake coefficient is to be applied and to the understanding that application of an uptake coefficient for a complex surface where planar or simple estimates of geometric surface areas were used during measurement (i.e., forest floor, snow, or bark) assumes surface area equivalence in subsequent applications. As seen in Table 1, uptake of NO2 to coniferous foliage under conditions of minimal stomatal aperture and RH < 90 % was found to be ∼ 2.6 times greater than to deciduous leaves on a projected area basis. In addition to the greater total-to-projected surface area of coniferous (∼ 2.7) compared to deciduous (∼ 2) leaves, we attribute the reduced non-stomatal uptake of NO2 to deciduous leaves as a consequence of the hydrophobic adaxial (top) surface of deciduous leaves, which lack the elevated water vapor concentrations from stomata to support the thin water films for Reaction (R1) to proceed. We treat the leaves and bark of the forest canopy as wet following the dew flag from the Z03 scheme (Sect. 2.1.2). Under wet conditions, both top and bottom faces of deciduous leaves would be wetted, and we increase the α value used to scale uptake to deciduous leaves from LAI to 2LAI. The α value used to scale uptake to bark is computed as πSTAI, where STAI = 0.9 is the projected area index of tree branches (Horii et al., 2005). We compute forest floor surface resistances rc floor as parallel contributions from uptake to snow and to the snow-free forest floor, weighted by the snow cover fraction following the Z03 scheme (Zhang et al., 2003a). As seen in Table 1, NO2 uptake to wet bark is twice that to dry bark, and uptake to snow is approximately one-third that to the snow-free forest floor.
The top panel of Fig. 4 depicts monthly mean estimates of the nocturnal component canopy resistances used in Eq. (10) to compute bottom-up bulk-canopy Rc(NO2). Also included for comparison are monthly mean estimates of top-down bulk-canopy rhyd for α values of 1 and 2. The middle and bottom panels of Fig. 4 depict parameterized Vd(NO2) following Eq. (2) using both bottom-up and top-down estimates of bulk-canopy surface resistance. Also included are the fractional contributions that leaf, bark, and forest floor surfaces make to total bottom-up NO2 uptake. Due to the compensating seasonal contributions of rc leaf and rc floor to the total NO2 deposition, bottom-up nocturnal Vd(NO2) shows little seasonality, in accordance with eddy-covariance-inferred Vd(NO2) from spring through fall (Fig. 3). As depicted in the middle panel of Fig. 4, bottom-up estimates of Vd(NO2) computed using the uptake coefficients from Table 1 are greater than top-down optimized values across all seasons. Computing NO2 uptake to dry and wet bark using the uptake coefficients from Table 1 of and , respectively, results in bark surfaces being the predominant nocturnal dry-depositional sink of NO2 at Harvard Forest. Uptake coefficients to dry and wet bark in Table 1 are from Hanson et al. (1989), where chamber-measured NO2 uptake was performed with Teflon end-capped cylindrical branch or trunk samples with diameters of ∼ 15 cm. It is expected that the calculated cylindrical geometric surface area used to normalize uptake to exposed bark samples in Hanson et al. (1989) is less than the surface area available for the reaction due to bark roughness and shape complexity for samples of this size. From Table 1, NO2 uptake to smoother wood surfaces (i.e., wood board or plywood) at RH < 90 % is at least 3 times smaller than uptake to dry bark, which we speculate could result from the greater available surface area for the bark samples tested. Bark surface area for the trunk and branch samples examined in Hanson et al. (1989) may not be representative of the average bark surface area for the canopy at Harvard Forest. As depicted in the bottom panel of Fig. 4, reducing NO2 uptake to bark by a factor of 2 (equivalent to a 2-fold increase in rc bark) results in bottom-up Vd(NO2) within the range of eddy-covariance-inferred monthly values corrected for soil NO (0.2–0.3 cm s−1) and within 6 % of the top-down Vd(NO2) for α=2 (parameterization P7) over a 12-month period. At this uptake level, bark is no longer the predominant sink for nocturnal dry deposition of NO2, instead taking on a secondary role, where the predominant uptake alternates between canopy foliage during summer months and the forest floor during late fall, winter, and early spring. On an annual basis, nocturnal NO2 uptake to forest surfaces is within 30 % for the reduced-bark-uptake case; specifically, the forest floor accounts for 37 % of uptake, bark 36 %, and foliage 27 %. Bottom-up modeling estimates of canopy-scale dry deposition of NO2 would benefit from future chamber studies detailing NO2 uptake to a variety of bark surfaces over a range of humidities and temperatures.
Figure 4 also depicts the nocturnal Vd(NO2) computed using Rc(NO2) parameterized following the Z03 scheme (Table S3). As with top-down and bottom-up estimates of Vd(NO2), little seasonality is seen across monthly mean values. Over a 12-month period, Vd(NO2) following Z03 is within 12 % and 17 % of top-down (α=2) and bottom-up (rc bark×2) values, respectively. The Z03 scheme formulates non-stomatal uptake of NO2 by scaling inverse surface resistances optimized for O3 by 0.8 (Zhang et al., 2002a); herein, we explored the plausibility of non-stomatal NO2 uptake being a result of Reaction (R1), with negligible contributions from other reactions. Although additional pathways for NO2 uptake may exist in parallel to Reaction (R1) in some instances – particularly in leaf interiors (Sect. S6 in the Supplement) – non-stomatal NO2 uptake to the natural land types examined and reviewed herein can plausibly be understood as occurring via Reaction (R1) when surface area effects are considered. Future work investigating the relative roles of Reaction (R1) and reduction reactions in NO2 uptake to a variety of natural land type surfaces would aid mechanistic realism in future model developments.
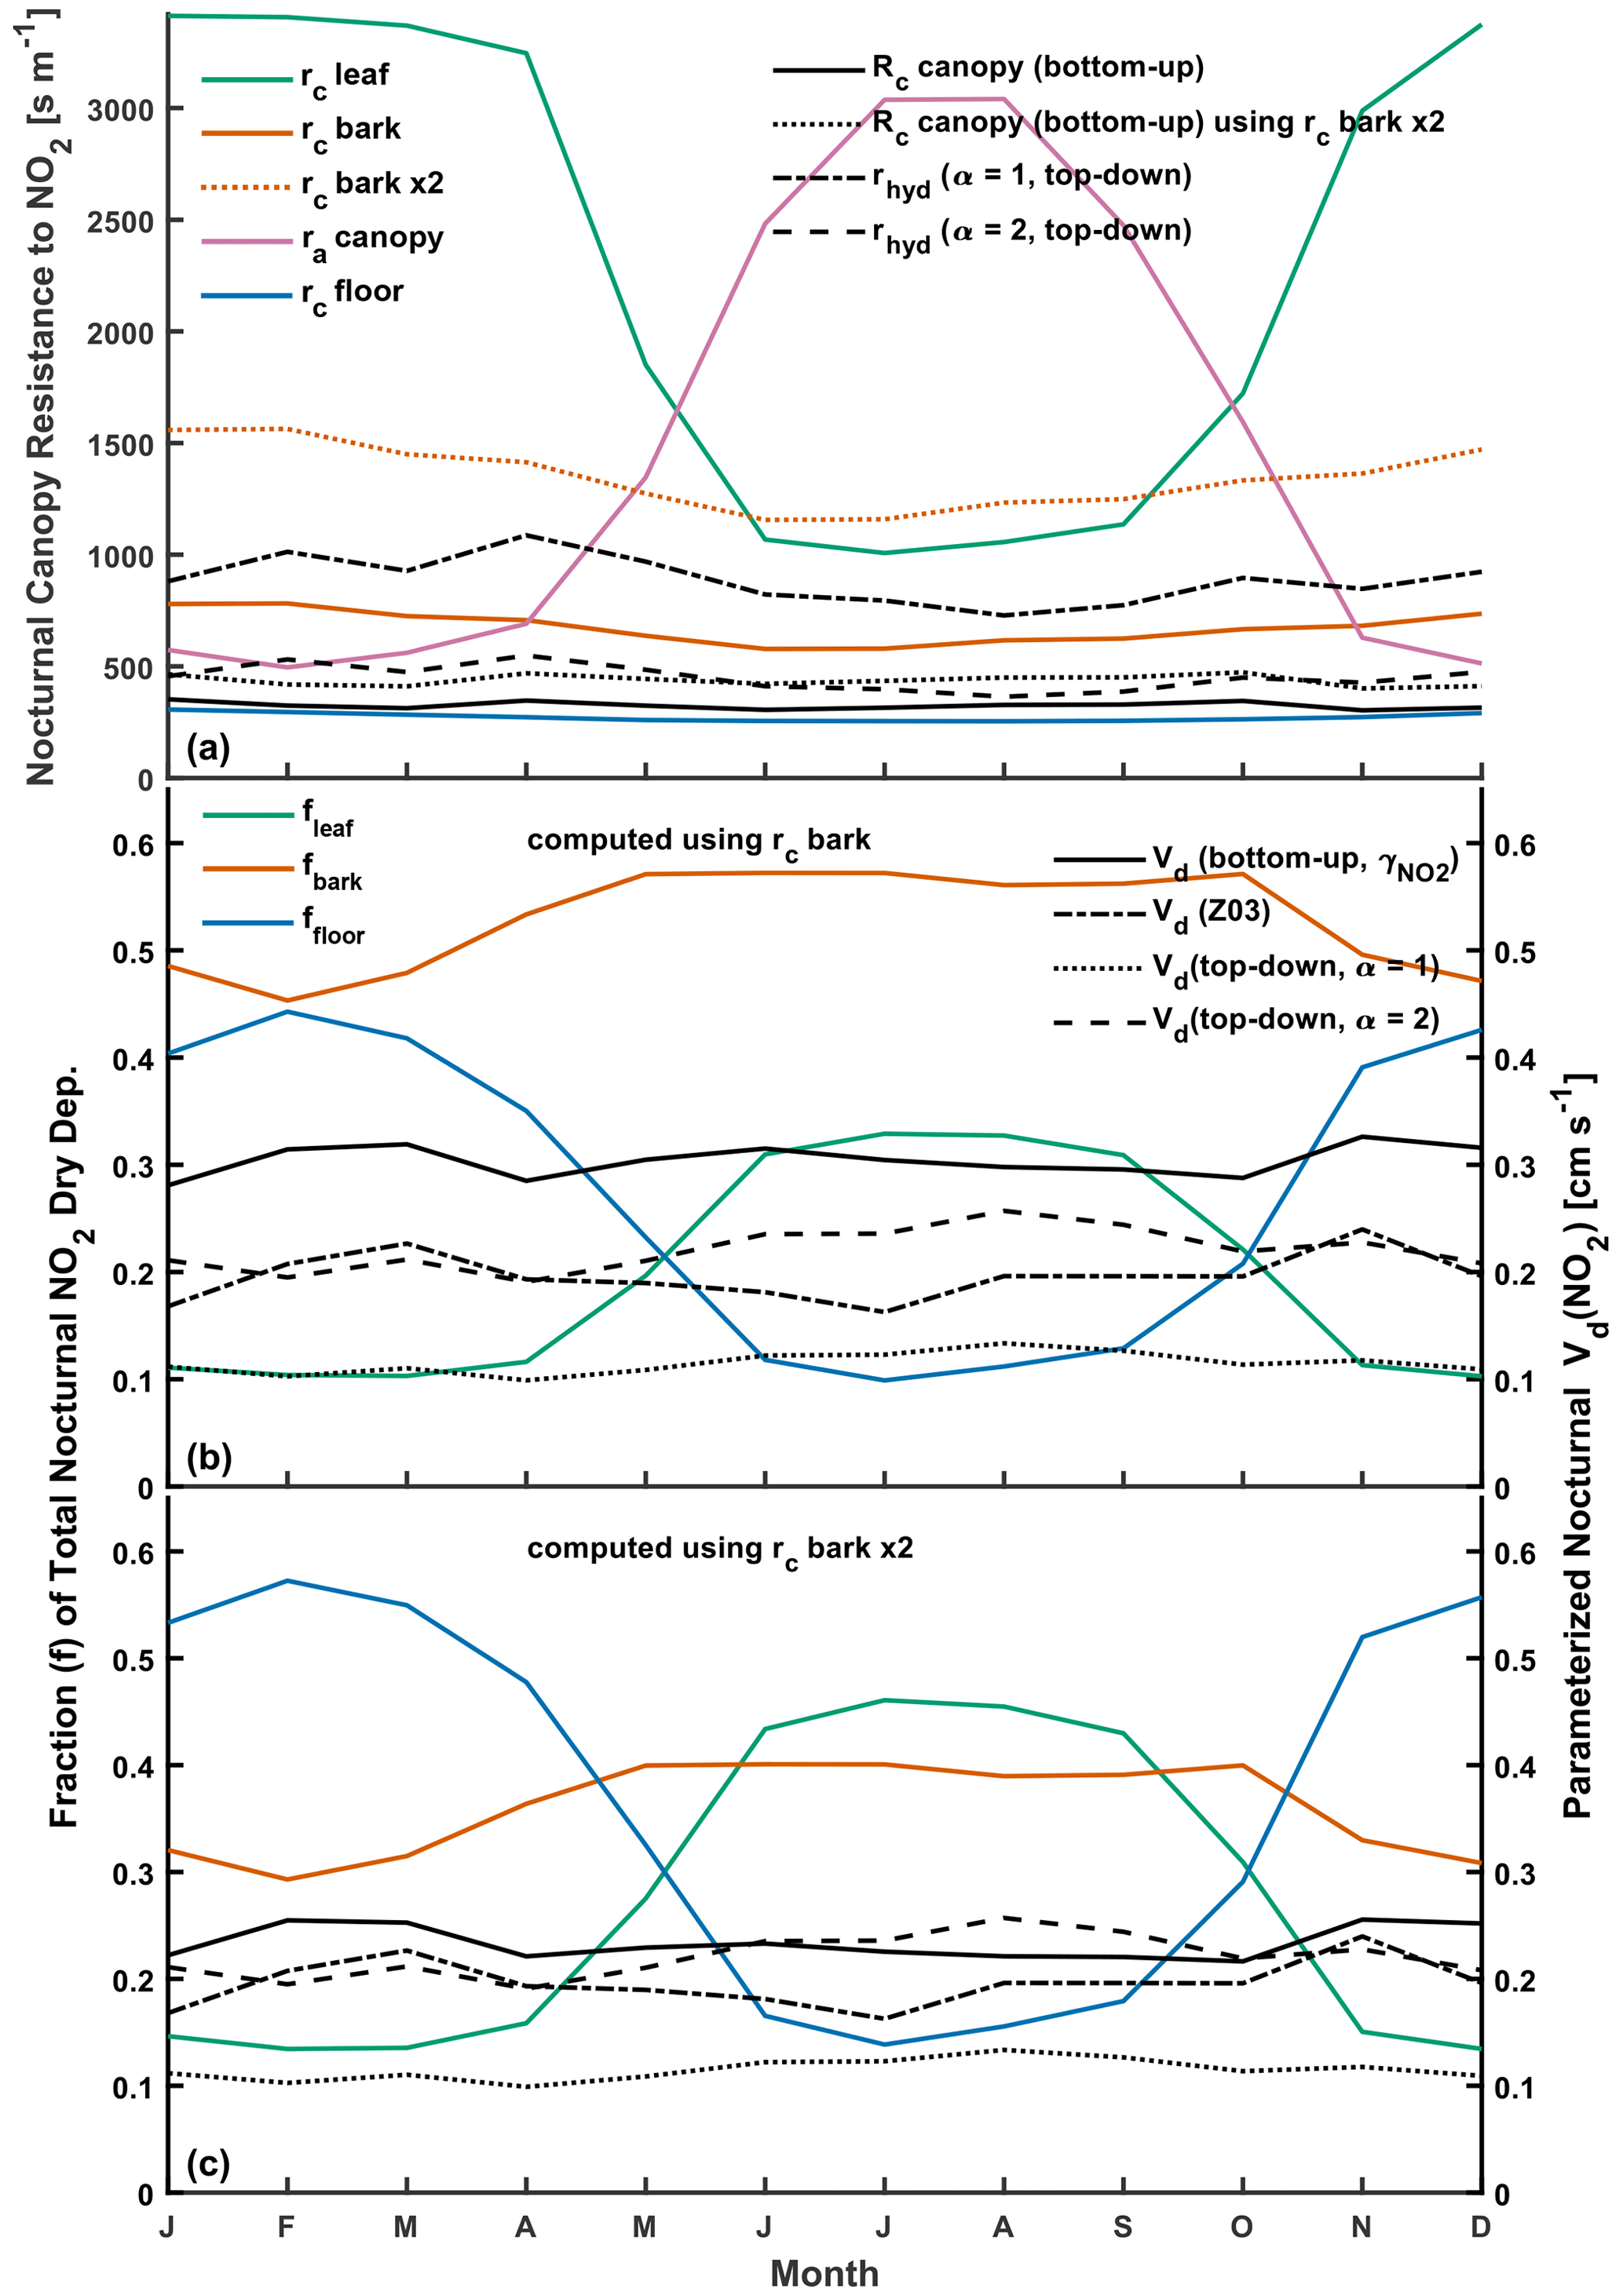
Figure 4(a) Computed estimates of monthly mean component canopy resistances for nocturnal NO2 uptake to leaves, bark, and the forest floor at Harvard Forest and the resulting bottom-up bulk-canopy Rc following Eq. (10). Also included are top-down bulk-canopy resistances rhyd following Eq. (8). (b) The resulting bottom-up and top-down canopy-scale nocturnal deposition velocities Vd(NO2), including fractional contributions of leaf, bark, and forest floor surfaces to bottom-up Vd(NO2). Also depicted is nocturnal Vd(NO2) computed following the Z03 parameterization. (c) As in panel (b) but with deposition fractions and bottom-up Vd(NO2) computed with uptake to bark reduced by a factor of 2. Monthly values of resistances, deposition velocities, and meteorological inputs are included in Table S3 in the Supplement. The surface-specific NO2 uptake coefficients used to calculate bottom-up Rc are included in Table 1.
3.4 Evaluation of parameterized Vd(NOy) over Harvard Forest
Improved representation of Vd for NOy component species HNO3 and NO2 via updates to molecular diffusivity (Sect. 3.2) and non-stomatal NO2 uptake (Sect. 3.3.3), respectively, may be further evaluated at a broader scale through a full NOy budget analysis. Simulated Vd(NOy) from base and updated parameterizations is evaluated against observations from the HFEMS, considering NOy component species NO2, NO, HNO3, and PAN. Of particular interest is the period from June to November 2000, when hourly observations of above-canopy HNO3 concentration – a significant contributor to NOy dry deposition at this location (Horii et al., 2005) – were added to the suit of measurements (Fig. S6). The top panel of Fig. 5 depicts the diel climatology of measured NOy and component species over Harvard Forest alongside inferred NOy computed as the sum of the component species. The middle panel of Fig. 5 depicts species-specific fractional contributions to measured NOy. On average, NOy inferred from the sum of measured component species is ∼ 76 % of measured total NOy, with component contributions of 48 % (NO2), 16 % (HNO3), 8 % (PAN), and 4 % (NO).
To compare to Vd(NOy) inferred from measured fluxes, we compute simulated deposition velocities Vd,sim(NOy) from a linear combination of parameterized component deposition velocities Vd(xi) weighted by species-specific concentration fractions (Michou et al., 2005; Wu et al., 2011):
Due to the large number of coincident hourly observations required for the comparison, only 19 coincident hourly values of Vd(NOy) and Vd,sim(NOy) exist across the entire dataset, which consists of over 2000 hourly measurement points. For this reason, a gap-filling method is used to estimate date- (d) and hour-specific (h) missing NOy component concentrations for NO2, NO, HNO3, and PAN from measured NOy:
where the diel climatologies of component fractions are depicted in the middle panel of Fig. 5. This method of gap filling was used by Wu et al. (2011) to evaluate simulated NOy deposition velocities from the WRF-Chem and NOAH-GEM dry-deposition modules against this dataset. Here, we compute component fractions as the “ratio of smoothed means” rather than the “mean of ratios” to reduce the effect of outliers. The fraction of inferred species-specific hourly concentrations required for gap-filling over the study period is depicted in the bottom panel of Fig. 5 as the missing measurement fraction.
Diel profiles of the simulated Vd(x) used in Eq. (11) to compute simulated Vd(NOy) are depicted in Fig. S4 and reviewed in Sect. S5 in the Supplement. Given the predominant contributions that NO2 and HNO3 make to the NOy budget at Harvard Forest (Fig. 5), updates to the parameterization of Vd(NO2) and Vd(HNO3) discussed in previous sections will have a notable impact on simulated Vd(NOy).
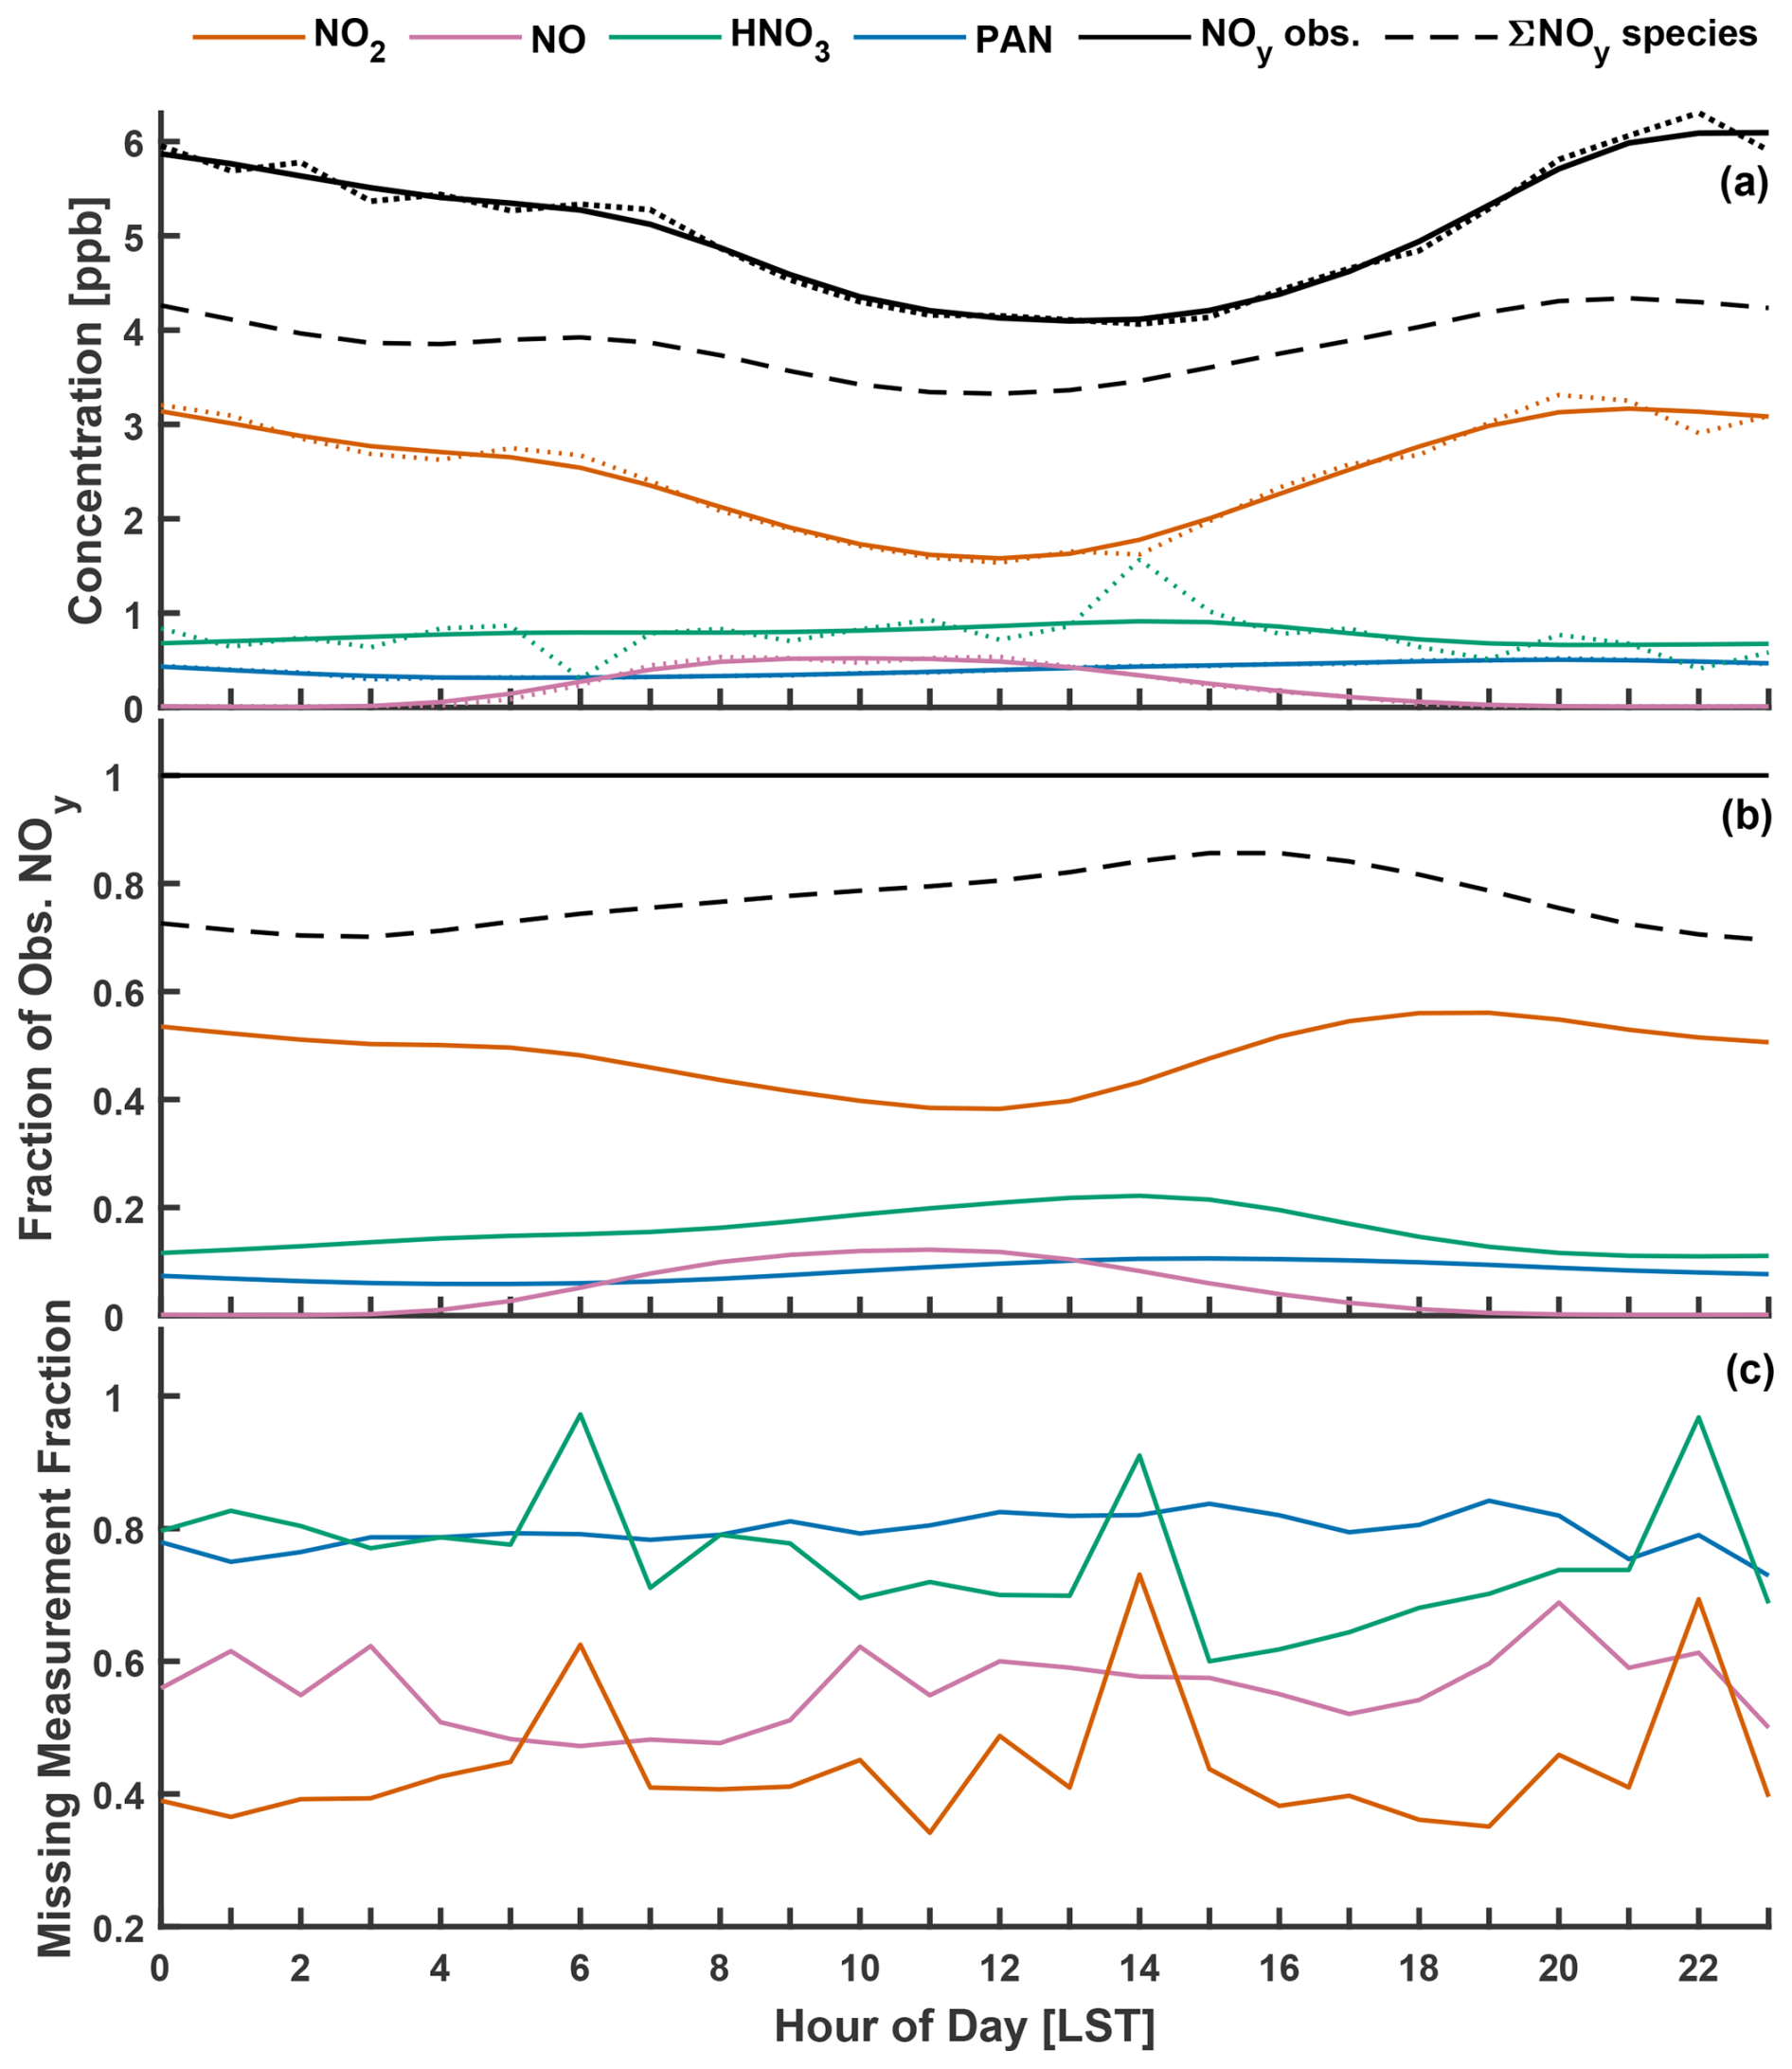
Figure 5(a) Diel climatology of observed NOy and component species NO2, HNO3, PAN, and NO measured above Harvard Forest (June–November 2000–2002). Solid lines depict a smoothing spline fit to hourly mean concentrations (dotted). Also shown is the sum of smoothed NOy component species concentrations. (b) Fractional contributions of NOy component species to observed NOy. These values were computed as ratios of the smoothed diel mean concentrations in panel (a). Shown are individual NOy species fractions (colored as above) and their sum (dashed black). (c) Fraction of hourly NOy component species concentrations (colored as above) missing from the measured NOy hourly time series spanning June–November 2000. As a gap-filling strategy for the calculated Vd(NOy) hourly time series, missing values were inferred using Eq. (12).
3.4.1 Measurement–model comparison of Vd(NOy)
Observations of hourly above-canopy eddy covariance fluxes of NOy at the HFEMS are mostly downward (> 99 %; Fig. S9), regardless of adjustment for soil-emitted NO. Figure 6 depicts observation-inferred diel mean Vd(NOy) alongside the simulated values from parameterizations P2, P4, and P8 – selected from Table 2 to highlight the dominant effects of diffusivity updates (P4) and surface resistance updates to NO2 and PAN (P8) on simulated Vd(NOy) referenced from the measurement height at Harvard Forest (P2). Inferred Vd(NOy) was calculated from eddy-covariance-observed Vex(NOy) adjusted for estimates of soil-emitted NO, analogous to Vd(NO2) in Eq. (6). As evident from Fig. 6, soil NO corrections to observed Vex(NOy) result in small increases to inferred Vd(NOy) – 9 % for parameterizations P2 and P4, decreasing to 7 % for P8 due to an increase in the simulated canopy reduction factor (CRF) (Fig. S3) from updates to non-stomatal NO2 uptake. By far the largest contributor to simulated Vd(NOy) in Fig. 6 is HNO3, contributing over 75 % to the dry deposition 24 h NOy flux for parameterization P2 (Table 5). Despite nocturnal mean NO2 concentrations on the order of 3 ppb (Fig. 5), NO2 makes near-negligible contributions to simulated nocturnal Vd(NOy) in parameterizations P2 and P4.
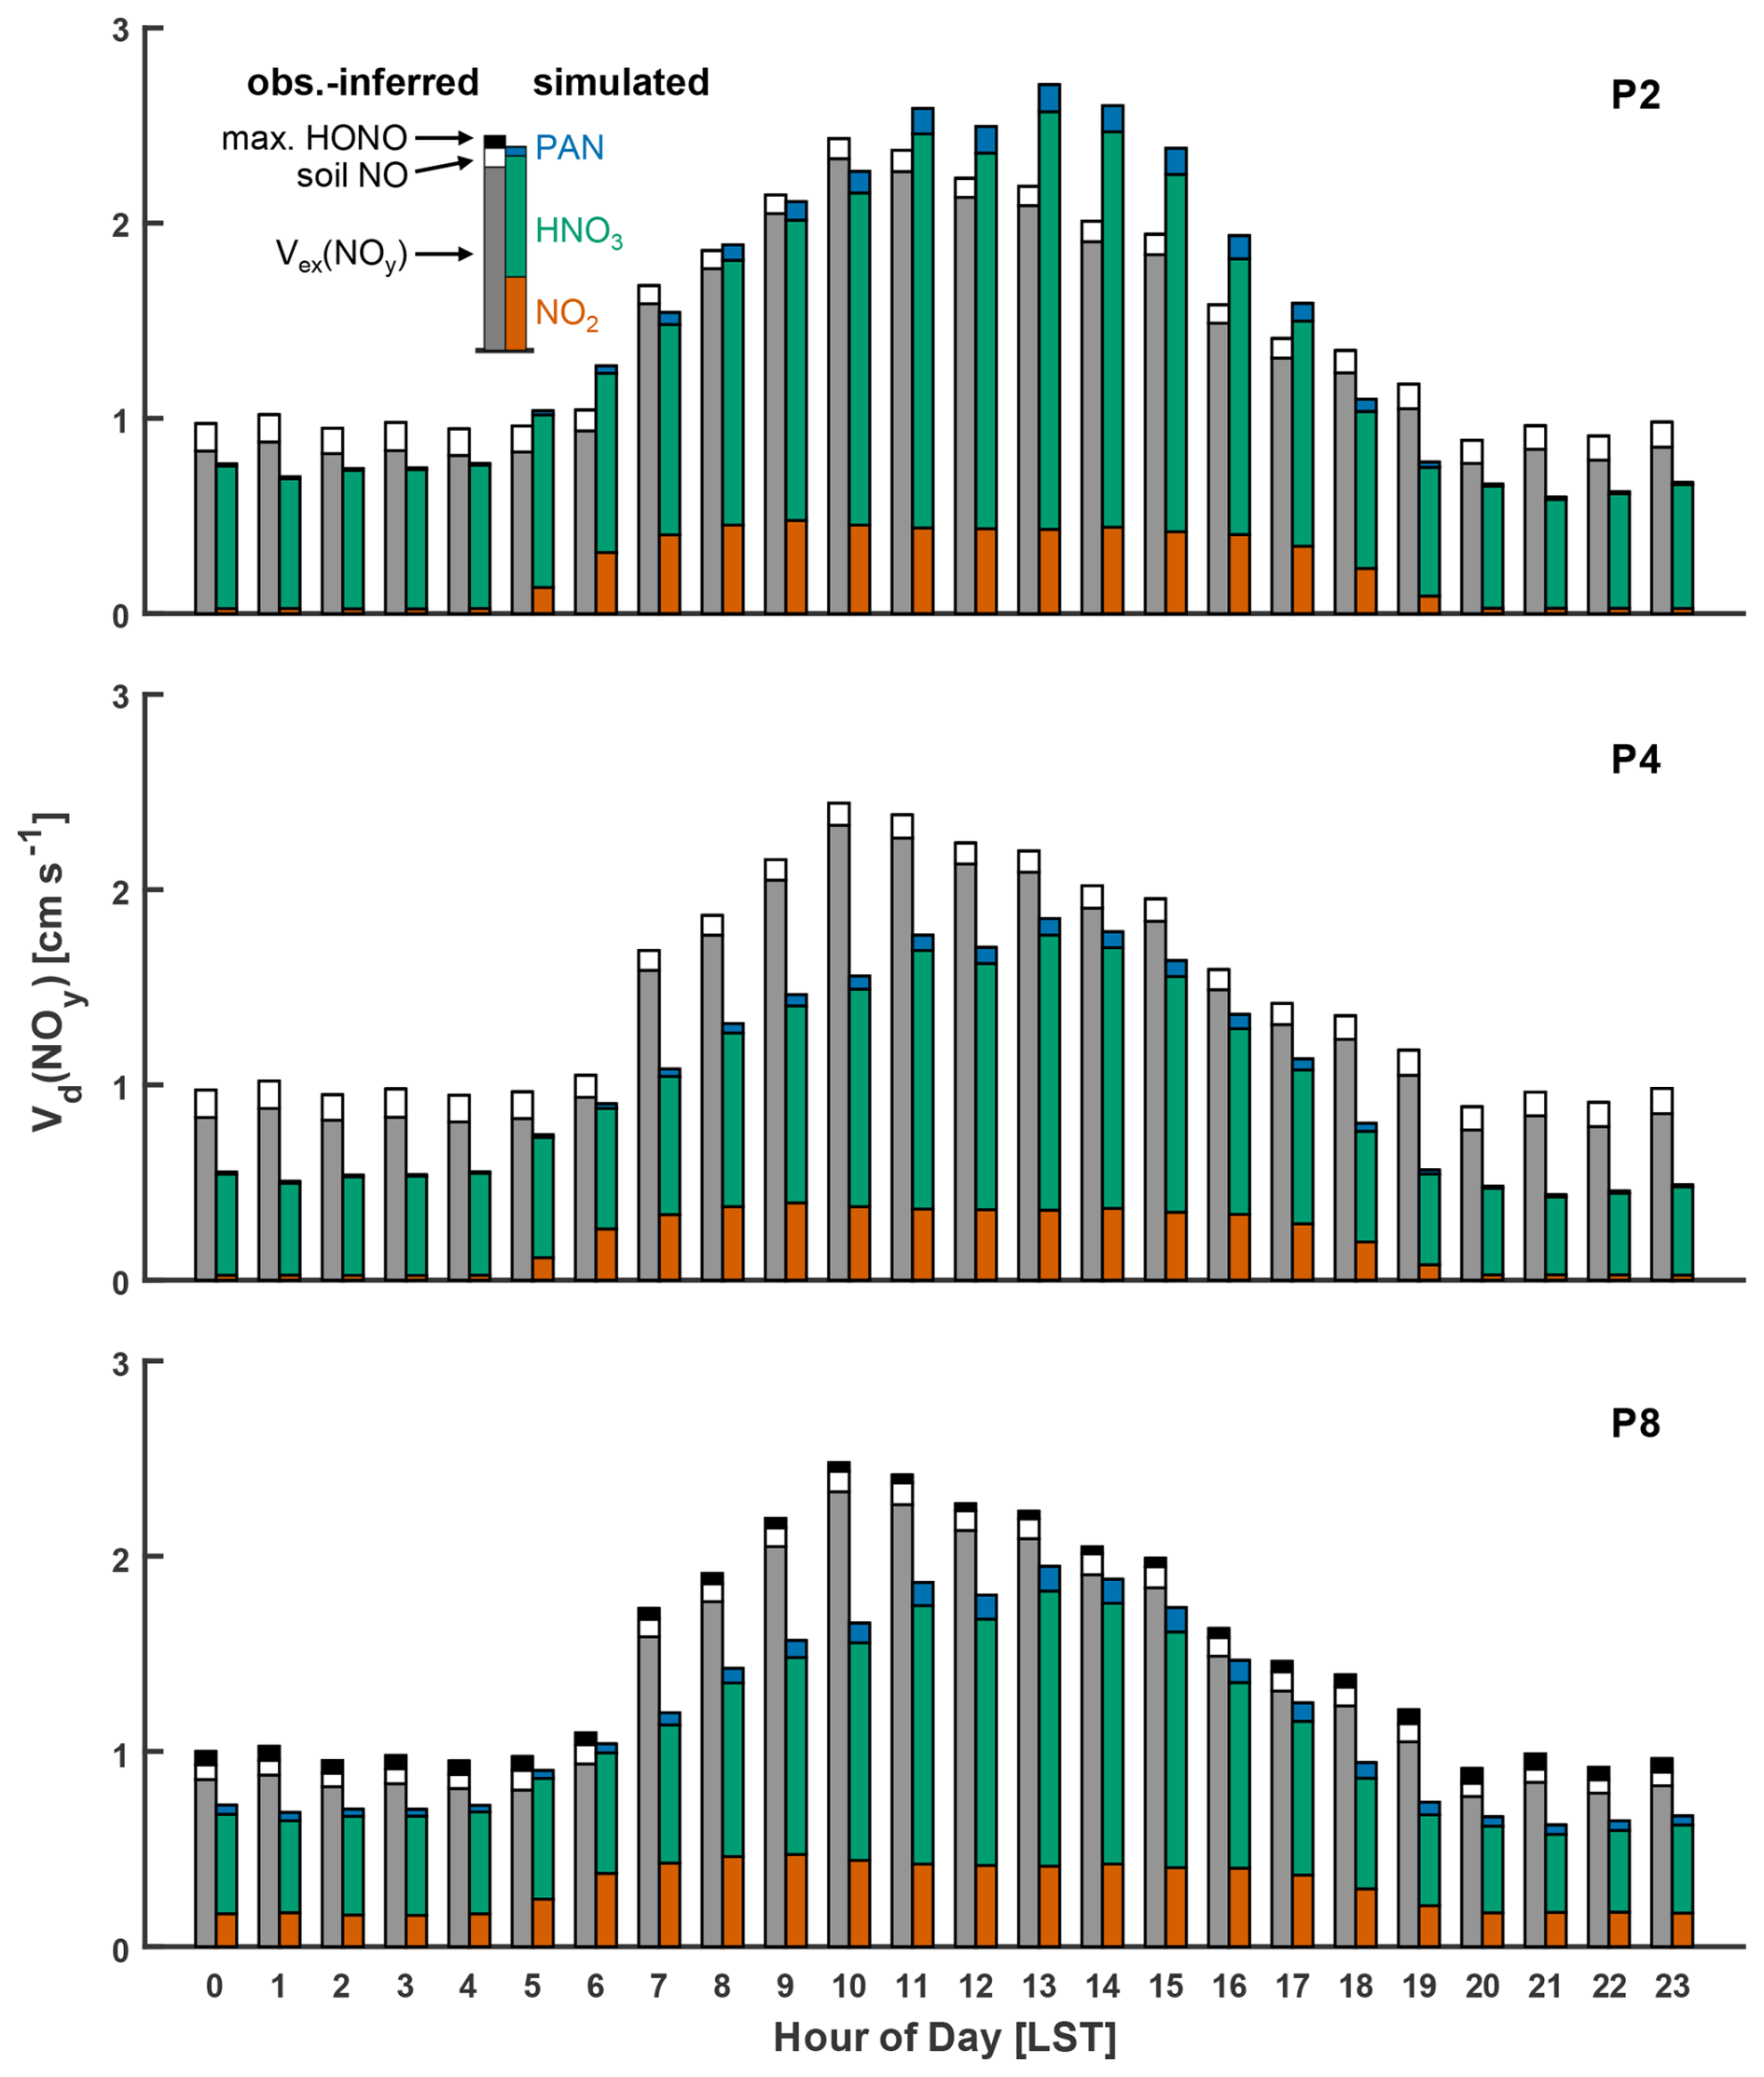
Figure 6Simulated and observation-inferred diel mean NOy dry-deposition velocities over Harvard Forest (June–November). In addition to observed Vex(NOy), inferred contributions to Vd(NOy) from estimated soil NO emissions (Eq. 7) and maximum HONO emitted following Reaction (R1) are also depicted. Simulated Vd(NOy) is depicted as the weighted sum (Eq. 11) of the contributing NOy component species NO2, HNO3, and PAN for three simulation types: (P2) (base), (P4) (updated Ra and diffusivity D), and (P8) (updated Rc(NO2) and Rc(PAN)).
Table 5Inferred mean dry deposition fluxes of NOy and component species over Harvard Forest.
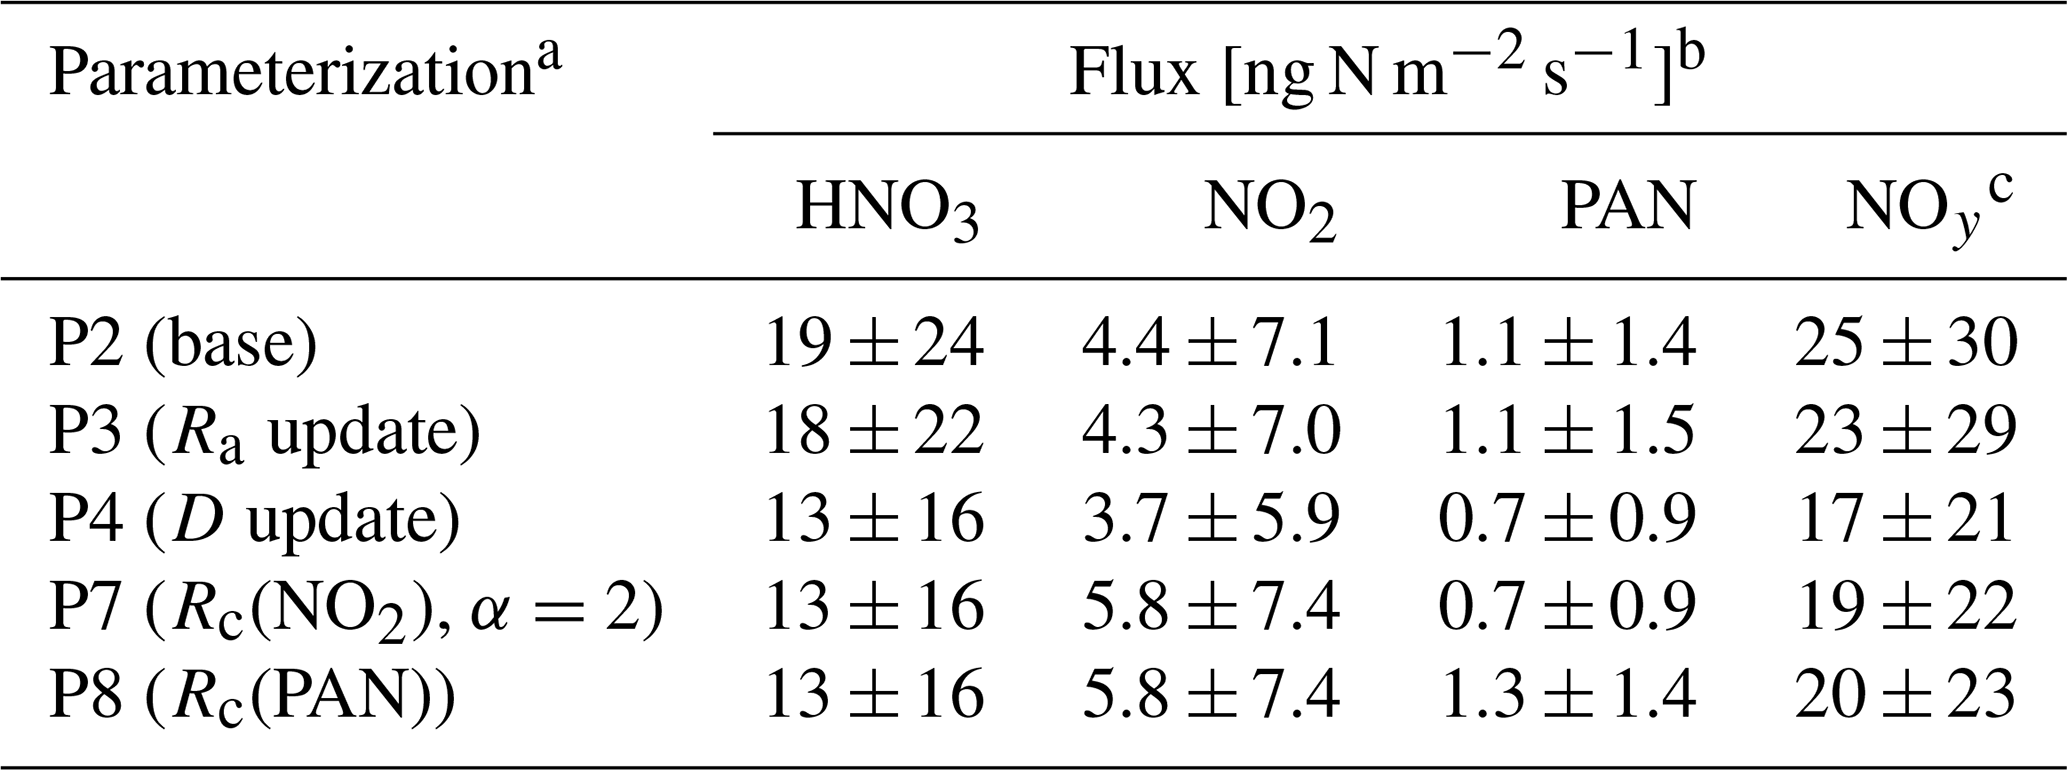
a See Table 2 for serial parameterization updates. Briefly, P2 is equivalent to the base P1 referenced from a Harvard Forest measurement height of 29 m. P3 has updates to aerodynamic resistance (Ra). P4 has updates to molecular diffusivity (D). P7 updates the resistance to surface uptake of NO2 (Rc(NO2)) to include Reaction (R1) using the surface area scale factor α=2 (Eq. 8). P8 updates the resistance to surface uptake of PAN (Rc(PAN)). b 24 h mean (±1σ) dry deposition fluxes inferred from the product of simulated Vd(x) and gap-filled measured concentrations over June–November 2000. c Inferred NOy flux from the sum of inferred component (HNO3, NO2, and PAN) fluxes.
Updates to the parameterization of molecular diffusivity (P4) results in large reductions in simulated Vd(NOy) (−30 % during the day, −28 % at night) and consequently in a 24 h depositional flux (26 % reduction, Table 5) due to large reductions in simulated Vd(HNO3) (Fig. S4). This update exposes a morning peak in observation-inferred Vd(NOy) in Fig. 6, which simulated values fail to capture. Given the heavy reliance on the climatological diel profile of HNO3 (Fig. 5) due to the paucity of hourly HNO3 observations (Figs. 5 and S6) and the potential influence of unmeasured rapidly depositing NOy species (Horii et al., 2005), further discussion of this model–measurement discrepancy is beyond the scope of this work; however, we note that it overlaps with the period of mixed layer growth.
As seen for parameterization P8 in Fig. 6, updates to non-stomatal deposition of NO2 and PAN result in noticeable increases in simulated Vd(NOy) (8 % during the day, 30 % at night), with updates to NO2 deposition having a greater relative impact at night (25 % increase in Vd(NOy)) than during the day (5 % increase in Vd(NOy)). Parameterization P8 updates are associated with an 18 % increase in the inferred 24 h NOy dry deposition flux due to large increases in inferred dry deposition of NO2 (56 % increase) and PAN (85 % increase) (Table 5).
Also depicted in Fig. 6 is the effect on observation-inferred Vd(NOy) from a maximum estimate of HONO emitted from the heterogeneous hydrolysis of NO2 on deposition surfaces following Reaction (R1). Assuming unity for HONO surface emission to the gas phase and subsequent ventilation from the canopy produces a 4 % increase in inferred Vd(NOy). Uncertainties exist regarding the nature of the dynamic equilibrium that establishes between evolved and adsorbed/dissolved HONO (Collins et al., 2018; Harrison et al., 1996; Lee, 2012; Spicer et al., 1993; Wojtal et al., 2011) and subsequent implications of a nocturnal reservoir of deposited HONO as a daytime source of HONO to the atmospheric surface layer (He et al., 2006; Ren et al., 2020; VandenBoer et al., 2014, 2015; Wentworth et al., 2016). Lee (2012) monitored near-continuous above-canopy NO2 and HONO concentrations and eddy covariance fluxes at the HFEMS during 2011, finding nocturnal enhancements in HONO concomitant with NO2. However, neither upward nor downward fluxes of HONO were observed, suggesting the establishment of dynamic equilibrium between HONO emission and deposition at Harvard Forest, where perturbation fluxes were below detection limits. Measurements of HONO and NO2 fluxes over grassland and sugar beet surfaces have highlighted the bidirectional nature of HONO exchange; HONO emission was found to dominate the bidirectional flux under elevated NO2 concentrations (> 10 ppb for the land types studied), while deposition was noted to be dominant at lower ambient NO2 concentrations (Harrison et al., 1996; Harrison and Kitto, 1994). The diel flux behavior of HONO is likely multifactorial, depending on land type, meteorology, and trace gas and particulate concentrations (Pusede et al., 2015; VandenBoer et al., 2015). The absence of significant fluxes of HONO over Harvard Forest, as noted by Lee (2012) despite observed downward nocturnal fluxes of NO2 and nocturnal enhancement of HONO, does not exclude Reaction (R1) as a source of HONO. Rather, this indicates the importance of deposition and re-emission processes from canopy surfaces, which may dominate HONO behavior at rural forest sites (Ren et al., 2011, 2020; Sörgel et al., 2011; Zhou et al., 2002) in the absence of strong pulses of ambient NO2 perturbing the dynamic equilibrium between adsorbed/dissolved and gas-phase HONO – as is routinely observed in laboratory studies (Finlayson-Pitts et al., 2003; Spicer et al., 1993).
Neglecting the possible effect of emitted HONO on Vd(NOy), given the findings of Lee (2012), we find a moderate underestimate of 20 % in simulated Vd(NOy) (24 h) from parameterization P8, with similar daytime and nighttime biases of −20 % and −19 %, respectively. As previously discussed in Sect. 3.4 and depicted in Fig. 5b, the NOy concentration budget at the HFEMS is closed to 76 % on average from observations of NOx, HNO3, and PAN. Horii et al. (2005) provide evidence of a rapidly depositing unidentified NOy species at this site, especially under southwesterly flow, and speculate that the unidentified NOy species are organic nitrates.
Despite long-standing uncertainty regarding nocturnal stomatal behavior (Caird et al., 2007; Costa et al., 2015; Dawson et al., 2007), it is generally assumed that at night in response to elevated guard cell CO2 concentration, the stomata of C3 and C4 plants are nearly closed (Nobel, 2009), thereby restricting trace gas exchange. In both the widely used W89 and Z03 dry-deposition schemes, stomata are assumed to be closed at night, and therefore all nocturnal deposition is parameterized through non-stomatal pathways. Although chamber studies consistently find that stomatal control dominates daytime foliar uptake of NO2, uncertainty remains regarding the importance of non-stomatal pathways at night. Some studies note negligible non-stomatal contributions to NO2 deposition, attributing nocturnal uptake to partially open stomata (Chaparro-Suarez et al., 2011; Delaria et al., 2020; Geßler et al., 2000; Rondón et al., 1993; Sparks et al., 2001), while others find non-stomatal contributions to be non-negligible (Geßler et al., 2002; Hanson et al., 1989; Thoene et al., 1996; Wang et al., 2020; Weber and Renenberg, 1996). This amalgam of contradictory results warrants further consideration and is discussed in the context of a literature review in Sect. S6 in the Supplement.
Notwithstanding nocturnal stomatal behavior, nocturnal ambient humidity is often elevated at locations with lush vegetation, as it is during summer months at Harvard Forest (monthly median RH 92 %–95 %; Table S3), whereby growth of aqueous films has been observed to occlude stomatal pores (Grantz et al., 2018); heterogeneous hydrolysis of NO2 would be expected to proceed on foliar as well as other surfaces under these conditions. Furthermore, nocturnal uptake of NO2 through a deposition process involving HONO production has been implicated in the field on several occasions (Harrison and Kitto, 1994; Ren et al., 2020; Stutz et al., 2002), including with RH dependence (Stutz et al., 2004; VandenBoer et al., 2013).
Inferred values of in Tables 1 and S2 fall within the range expected for uptake due to NO2 heterogeneous hydrolysis, i.e., 10−6 to 10−5 (Sect. S3). For foliar surfaces under dark conditions, “total leaf area” normalized uptake was not observed to exceed that of the planar surface of distilled water, supporting the possibility that Reaction (R1) is the predominant mechanism driving uptake to both the non-foliar and foliar surfaces presented. Three features stand out from the tabulated values of in Tables 1 and S2. First, there is a dependence on surface moisture – dependence on RH or surface wetness is seen for uptake to wood board, concrete, and tree bark. The RH or wetness dependence for NO2 uptake to wood board and bark is similar to the factor of 2 increase in from Eq. (9) between RH 50 % and 100 %. Second, the surface area available for heterogeneous reaction has a direct influence on the resulting surface-specific uptake, as expected for a collision-limited heterogeneous process such as Reaction (R1). Surfaces with complex and undetermined microscopic surface areas (i.e., bark, coarse concrete, forest floors, and snow) exhibit higher and resulting – a factor of 2 to 30 greater than surfaces normalized by accurate predictions of available surface area (i.e., bulk water and foliar). This increased uptake to convoluted surfaces could be an indirect measure of the total microscopic surface area available for reaction, thus highlighting the utility of using field-derived uptake coefficients to parameterize surface uptake in dry-deposition models. Third, there is a distinctive feature between NO2 uptake to coniferous and deciduous leaves when stomatal aperture is at a minimum under dark conditions. When uptake is normalized by projected leaf area, inferred to coniferous species is on average 2.6 times greater than to deciduous species – a factor similar to the ratio of total-to-projected needle leaf area (Riederer et al., 1988). Since coniferous needles have stomata distributed across the entire leaf surface, whereas most deciduous leaves have stomata located on the lower (abaxial) leaf surface and a thicker hydrophobic wax cuticle on the upper (adaxial) leaf surface, the ∼ 2.6-fold greater uptake to coniferous species (when normalized by projected leaf area) may reflect the absence of thin water films on the adaxial surface of deciduous leaves in chamber studies from Table 1. These inferences are consistent with the work of Sumner et al. (2004), where similar rates of NO2 heterogeneous hydrolysis across a variety of hydrophilic and hydrophobic surfaces were understood in the context of the available surface areas supporting thin water films. However, given the intra- and interspecies variability in nocturnal from leaf-level studies across a range of environmental conditions (i.e, Breuninger et al., 2013; Delaria et al., 2018, 2020; Rondón et al., 1993; Wang et al., 2020), further investigation into this simple generalization is warranted.
A stand-alone version of the gaseous dry-deposition algorithm from GEOS-Chem, implemented to run in single-point mode, enabled a detailed and more direct evaluation of various branches of the algorithm against eddy-covariance-inferred deposition velocities over two North American temperate forest ecosystems. Observations of deposition velocities for species that deposit under dynamical control (i.e., nominally small surface uptake resistance Rc) facilitated the identification of a large high bias in computed molecular diffusivities. Correction of this bias using Fuller's method to calculate diffusivities in the absence of measured values resulted in improved simulation of Vd(HNO3). Consequently, this exposed a morning peak in observation-inferred Vd(NOy) that simulated values failed to capture. Site-specific roughness length and reference height were found to be important constraints on the calculation of aerodynamic resistance for rapidly depositing species, whereas correction for the influence of the roughness sublayer was found to be of minor importance at the measurement heights involved and to have a negligible effect at the dry-deposition reference height used in GEOS-Chem, in agreement with previous work (Simpson et al., 1998).
A large low bias (−80 %) in simulated nocturnal Vd(NO2) against eddy-covariance-inferred values spanning many months over Harvard Forest was identified in accordance with previous work (Horii, 2002; Horii et al., 2004). We addressed this low bias by representing NO2 heterogeneous hydrolysis – a well-known surface reaction (Finlayson-Pitts et al., 2003) shown to be of importance in the field (VandenBoer et al., 2013) but to our knowledge still unrepresented in dry-deposition parameterizations – in the calculation of non-stomatal surface resistance. A literature review of surface-specific NO2 deposition velocities to both non-foliar and nocturnal foliar surfaces highlights the importance of considering microscopic surface area for heterogeneous reaction and enabled estimates of bottom-up Vd(NO2) for Harvard Forest, which agree well with top-down estimates from eddy-covariance-inferred values when uptake to bark was reduced by a factor of 2 – indicating a need for further laboratory study of uptake to bark for representative samples. Consideration of the effect of soil NO emission on eddy-covariance-inferred Vd(NO2) at Harvard Forest was found to be important, as was representative canopy surface area when applying NO2 uptake coefficients from field and laboratory observations.
We persist with the assumption that nocturnal uptake of NO2 follows non-stomatal pathways, as is currently the case in the dry-deposition schemes widely used in atmospheric CTMs. Meanwhile, the nocturnal behavior of stomata remains an active area of research. Confounding processes such as the hydraulic activation of stomata (HAS) and condensation at elevated RH complicate the inference of stomatal conductance to trace gases from observations of water vapor flux, especially in well-mixed chambers under dark conditions. It would be helpful for future enclosure studies of NO2 uptake to consider the effects of heterogeneous hydrolysis of NO2 on foliar and non-foliar surfaces, as well as potential biases in estimates of stomatal conductance resulting from possible HAS.
Although we find that the Z03 dry-deposition scheme adequately captures the magnitude of nocturnal Vd(NO2) over Harvard Forest, formulating uptake relative to Vd(O3) neglects contributions from Reaction (R1) and therefore may be a misrepresentation for NO2, with implications for surface HONO production in models. We recommend consideration of a non-stomatal dry-deposition scheme for NO2 in atmospheric models that considers the effect of NO2 hydrolysis on surface resistances. This represents a significant depositional sink for NO2 under conditions when both the lifetime and the near-surface concentration of NO2 may be elevated, i.e., nocturnal and urban wintertime conditions. We present two approaches that result in general agreement for a mature temperate forest ecosystem. The simplest approach is to represent non-stomatal resistance to NO2 uptake as rhyd following Eq. (8), with a surface area scale factor α=2 for high-surface-area land types such as urban and forest, and α=1 for remaining land types. We caution that the value α=2 is not a fit to observations at Harvard Forest; instead, it is likely an upper estimate from a sensitivity study. Long-term field studies quantifying atmosphere–surface exchange across a variety of land types and seasons would facilitate further development of this unique dry-deposition pathway.
Although a main focus of this work was on the effect that NO2 hydrolysis has on Vd(NO2), there is much interest in accurate HONO simulation, given that the near-surface nocturnal buildup of HONO results in an early-morning burst of OH and NO radicals as HONO photolyzes (Finlayson-Pitts, 2009; Ren et al., 2020), initiating photochemistry prior to other HOx precursors (Platt et al., 1980). Future work will present the implementation of updates to Vd(NO2) developed in this paper within the GEOS-Chem CTM, including analysis of impacts on simulated concentration fields (i.e., NO2, HONO, OH, and O3) and deposition budgets.
The source code for the dry-deposition module from GEOS-Chem version 10-01 is available in a Zenodo repository (https://doi.org/10.5281/zenodo.13892258) (Boys, 2024). Harvard Forest data used herein include trace gas concentrations and fluxes (https://doi.org/10.6073/pasta/7415aa04ce4ad8e864aad5e1721b33d3, Munger and Wofsy 2023), meteorological observations (https://doi.org/pasta/f3adbe87e7e506c720d0d9ee91d2b6c4, Fitzjarrald and Sakai, 2023; https://doi.org/10.6073/pasta/56c6fe02a07e8a8aaff44a43a9d9a6a5, Munger and Wofsy, 2024), and LAI (https://doi.org/10.6073/pasta/0292c5bdb53f80dffee596295cb080ca, Matthes et al., 2024).
The Supplement for this article contains additional model and measurement descriptions, review material, and the supplemental figures and tables referenced herein. The supplement related to this article is available online at https://doi.org/10.5194/acp-25-17553-2025-supplement.
The manuscript was written with contributions from all authors. BLB designed the study under the supervision and support of RVM. BLB performed the model simulations and data analysis with feedback from RVM. BLB wrote the original draft with feedback from RVM. TCV provided an extensive review of, edits to, and direction for the original draft, which was incorporated into subsequent drafts. All authors have reviewed, edited, and approved the final version of the paper.
The contact author has declared that none of the authors has any competing interests.
Publisher’s note: Copernicus Publications remains neutral with regard to jurisdictional claims made in the text, published maps, institutional affiliations, or any other geographical representation in this paper. While Copernicus Publications makes every effort to include appropriate place names, the final responsibility lies with the authors.
We gratefully acknowledge the publicly available Harvard Forest dataset provided by Steven Wofsy and William Munger (Harvard University), which enabled much of this work, and access to computational resources maintained by Rachel Chang (Dalhousie University). Many helpful discussions were had with Glen Lesins (Dalhousie University) and Jennifer Murphy (University of Toronto), and feedback from the two anonymous reviewers helped to improve the utility and focus of the paper.
This research has been supported by the Natural Sciences and Engineering Research Council of Canada and the U.S. National Science Foundation (grant no. 2244984).
This paper was edited by Bryan N. Duncan and reviewed by two anonymous referees.
Altimir, N., Kolari, P., Tuovinen, J.-P., Vesala, T., Bäck, J., Suni, T., Kulmala, M., and Hari, P.: Foliage surface ozone deposition: a role for surface moisture?, Biogeosciences, 3, 209–228, https://doi.org/10.5194/bg-3-209-2006, 2006.
Ammann, M., Stalder, M., Suter, M., Brunold, C., Baltensperger, U., Jost, D. T., Türler, A., and Gäggeler, H. W.: Tracing uptake and assimilation of NO2 in spruce needles with 13N, J. Exp. Bot., 46, 1685–1691, https://doi.org/10.1093/jxb/46.11.1685, 1995.
Baldocchi, D. D.: Assessing the eddy covariance technique for evaluating carbon dioxide exchange rates of ecosystems: past, present and future, Glob. Chang. Biol., 9 479–492, https://doi.org/10.1046/j.1365-2486.2003.00629.x, 2003.
Baldocchi, D. D., Hicks, B. B., and Camara, P.: A canopy stomatal resistance model for gaseous deposition to vegetated surfaces, Atmos. Environ., 21, 91–101, https://doi.org/10.1016/0004-6981(87)90274-5, 1987.
Bang, J., Lee, D. H., Kim, S.-K., and Kang, H.: Reaction of nitrogen dioxide with ice surface at low temperature (=170 K), J. Phys. Chem. C, 119, 22016–22024, https://doi.org/10.1021/acs.jpcc.5b05497, 2015.
Bannister, E. J., Jesson, M., Harper, N. J., Hart, K. M., Curioni, G., Cai, X., and MacKenzie, A. R.: Residence times of air in a mature forest: observational evidence from a free-air CO2 enrichment experiment, Atmos. Chem. Phys., 23, 2145–2165, https://doi.org/10.5194/acp-23-2145-2023, 2023.
Beine, H. J., Honrath, R. E., Fuentes, J. D., Shepson, P. B., and Bottenheim, J. W.: Snowpack photochemical production of HONO: a major source of OH in the arctic boundary layer in springtime, Geophys. Res. Lett., 28, 4087–4090, https://doi.org/10.1029/2001GL013531, 2001.
Boys, B. L.: Dry deposition module source code from GEOS-Chem version 10-01, Zenodo [code], https://doi.org/10.5281/zenodo.13892258, 2024.
Breuninger, C., Oswald, R., Kesselmeier, J., and Meixner, F. X.: The dynamic chamber method: trace gas exchange fluxes (NO, NO2, O3) between plants and the atmosphere in the laboratory and in the field, Atmos. Meas. Tech., 5, 955–989, https://doi.org/10.5194/amt-5-955-2012, 2012.
Breuninger, C., Meixner, F. X., and Kesselmeier, J.: Field investigations of nitrogen dioxide (NO2) exchange between plants and the atmosphere, Atmos. Chem. Phys., 13, 773–790, https://doi.org/10.5194/acp-13-773-2013, 2013.
Brook, J. R., Zhang, L., Di-Giovanni, F., and Padro, J.: Description and evaluation of a model of deposition velocities for routine estimates of air pollutant dry deposition over North America. Part I: Model development, Atmos. Environ., 33, 5037–5051, https://doi.org/10.1016/S1352-2310(99)00250-2, 1999.
Bröske, R., Kleffmann, J., and Wiesen, P.: Heterogeneous conversion of NO2 on secondary organic aerosol surfaces: A possible source of nitrous acid (HONO) in the atmosphere?, Atmos. Chem. Phys., 3, 469–474, https://doi.org/10.5194/acp-3-469-2003, 2003.
Browne, E. C. and Cohen, R. C.: Effects of biogenic nitrate chemistry on the NOx lifetime in remote continental regions, Atmos. Chem. Phys., 12, 11917–11932, https://doi.org/10.5194/acp-12-11917-2012, 2012.
Burkhardt, J.: Hygroscopic particles on leaves: nutrients or desiccants?, Ecol. Monogr., 80, 369–399, https://doi.org/10.1890/09-1988.1, 2010.
Burkhardt, J. and Eiden, R.: Thin water films on coniferous needles, Atmos. Environ., 28, 2001–2017, https://doi.org/10.1016/1352-2310(94)90469-3, 1994.
Burkhardt, J. and Hunsche, M.: “ Breath figures ” on leaf surfaces – formation and effects of microscopic leaf wetness, Front. Plant Sci., 4, Article 422, https://doi.org/10.3389/fpls.2013.00422, 2013.
Burkhardt, J., Kaiser, H., Goldbach, H., and Kappen, L.: Measurements of electrical leaf surface conductance reveal recondensation of transpired water vapour on leaf surfaces, Plant Cell Environ., 22, 189–196, https://doi.org/10.1046/j.1365-3040.1999.00387.x, 1999.
Burkholder, J. B., Sander, S. P., Abbatt, J. D., Barker, J. R., Huie, R. E., Kolb, C. E., Kurylo, M. J., Orkin, V. L., Wilmouth, D. M., and Wine, P. H.: Chemical Kinetics and Photochemical Data for Use in Atmospheric Studies, Evaluation No. 18, JPL Publication 15-10, Jet Propulsion Laboratory, Pasadena, California, http://jpldataeval.jpl.nasa.gov (last access: 12 April 2025), 2015.
Businger, J. A.: Evaluation of the accuracy with which dry deposition can be measured with current micrometeorological techniques, J. Clim. Appl. Meteorol., 25, 1100–1124, https://doi.org/10.1175/1520-0450(1986)025<1100:EOTAWW>2.0.CO;2, 1986.
Caird, M. A., Richards, J. H., and Donovan, L. A.: Nighttime stomatal conductance and transpiration in C3 and C4 plants, Plant Physiol., 143, 4–10, https://doi.org/10.1104/pp.106.092940, 2007.
Cano-Ruiz, J. A., Kong, D., Balas, R. B., and Nazaroff, W. W.: Removal of reactive gases at indoor surfaces: combining mass transport and surface kinetics, Atmos. Environ., 27, 2039–2050, https://doi.org/10.1016/0960-1686(93)90276-5, 1993.
Chaparro-Suarez, I. G., Meixner, F. X., and Kesselmeier, J.: Nitrogen dioxide (NO2) uptake by vegetation controlled by atmospheric concentrations and plant stomatal aperture, Atmos. Environ., 45, 5742–5750, https://doi.org/10.1016/j.atmosenv.2011.07.021, 2011.
Cherin, N., Roustan, Y., Musson-Genon, L., and Seigneur, C.: Modelling atmospheric dry deposition in urban areas using an urban canopy approach, Geosci. Model Dev., 8, 893–910, https://doi.org/10.5194/gmd-8-893-2015, 2015.
Clark, C. M., Phelan, J., Doraiswamy, P., Buckley, J., Cajka, J. C., Dennis, R. L., Lynch, J., Nolte, C. G.m and Spero, T. L.: Atmospheric deposition and exceedances of critical loads from 1800-2025 for the conterminous United States, Ecol. Appl., 28, 978–1002, https://doi.org/10.1002/eap.1703, 2018.
Clarke, J. F., Edgerton, E. S.m and Martin, B. E.: Dry deposition calculations for the clean air status and trends network, Atmos. Environ., 31, 3667–3678, https://doi.org/10.1016/S1352-2310(97)00141-6, 1997.
Coe, H. and Gallagher, M. W.: Measurements of dry deposition of NO2 to a Dutch heathland using the eddy-correlation technique, Q. J. Roy. Meteor. Soc., 118, 767–786, https://doi.org/10.1002/qj.49711850608, 1992.
Collins, D. B., Hems, R. F., Zhou, S., Wang, C., Grignon, E., Alavy, M., Siegel, A., and Abbatt, J. P. D.: Evidence for gas-surface equilibrium control of indoor nitrous acid, Environ. Sci. Technol., 52, 12419–12427, https://doi.org/10.1021/acs.est.8b04512, 2018.
Costa, J. M., Monnet, F., Jannaud, D., Leonhardt, N., Ksas, B., Reiter, I. M., Pantin, F., and Genty, B.: Open all night long: the dark side of stomatal control, Plant Physiol., 167, 289–294, https://doi.org/10.1104/pp.114.253369, 2015.
Crowley, J. N., Ammann, M., Cox, R. A., Hynes, R. G., Jenkin, M. E., Mellouki, A., Rossi, M. J., Troe, J., and Wallington, T. J.: Evaluated kinetic and photochemical data for atmospheric chemistry: Volume V – heterogeneous reactions on solid substrates, Atmos. Chem. Phys., 10, 9059–9223, https://doi.org/10.5194/acp-10-9059-2010, 2010.
Crutzen, P. J.: The role of NO and NO2 in the chemistry of the troposphere and stratosphere, Annu. Rev. Earth Pl. Sci., 7, 443–72, https://doi.org/10.1146/annurev.ea.07.050179.002303, 1979.
Dawson, T. E., Burgess, S. S. O., Tu, K. P., Oliveira, R. S., Santiago, L. S., Fisher, J. B., Simonin, K. A., and Ambrose, R.: Nighttime transpiration in woody plants from contrasting ecosystems, Tree Physiol., 27, 561–575, https://doi.org/10.1093/treephys/27.4.561, 2007.
Delaria, E. R. and Cohen, R. C.: A model-based analysis of foliar NOx deposition, Atmos. Chem. Phys., 20, 2123–2141, https://doi.org/10.5194/acp-20-2123-2020, 2020.
Delaria, E. R., Vieira, M., Cremieux, J., and Cohen, R. C.: Measurements of NO and NO2 exchange between the atmosphere and Quercus agrifolia, Atmos. Chem. Phys., 18, 14161–14173, https://doi.org/10.5194/acp-18-14161-2018, 2018.
Delaria, E. R., Place, B. K., Liu, A. X., and Cohen, R. C.: Laboratory measurements of stomatal NO2 deposition to native California trees and the role of forests in the NOx cycle, Atmos. Chem. Phys., 20, 14023–14041, https://doi.org/10.5194/acp-20-14023-2020, 2020.
Dennis, R. L., Schwede, D. B., Bash, J. O., Pleim, J. E., Walker, J. T., and Foley, K. M.: Sensitivity of continental United States atmospheric budgets of oxidized and reduced nitrogen to dry deposition parametrizations, Philos. T. R. Soc. B, 368, 20130, https://doi.org/10.1098/rstb.2013.0124, 2013.
Duyzer, J., Weststrate, H., and Walton, S.: Exchange of ozone and nitrogen oxides between the atmosphere and coniferous forest, Water Air Soil Pollut., 85, 2065–2070, https://doi.org/10.1007/BF01186138, 1995.
Eugster, W. and Hesterberg, R.: Transfer resistances of NO2 determined from eddy correlation flux measurements over a litter meadow at a rural site on the Swiss plateau, Atmos. Environ., 30, 1247–1254, https://doi.org/10.1016/1352-2310(95)00418-1, 1996.
Farmer, D. K., Wooldridge, P. J., and Cohen, R. C.: Application of thermal-dissociation laser induced fluorescence (TD-LIF) to measurement of HNO3, Σalkyl nitrates, Σperoxy nitrates, and NO2 fluxes using eddy covariance, Atmos. Chem. Phys., 6, 3471–3486, https://doi.org/10.5194/acp-6-3471-2006, 2006.
Febo, A. and Perrino, C.: Prediction and experimental evidence for high air concentration of nitrous acid in indoor environments, Atmos. Environ., 25, 1055–1061, https://doi.org/10.1016/0960-1686(91)90147-Y, 1991.
Fields, S.: Global Nitrogen: Cycling out of Control, Environ. Health Perspect., 112, A556–A563, https://doi.org/10.1289/ehp.112-a556, 2004.
Finlayson-Pitts, B. J.: Reactions at surfaces in the atmosphere: integration of experiments and theory as necessary (but not necessarily sufficient) for predicting the physical chemistry of aerosols, Phys. Chem. Chem. Phys., 11, 7760–7779, https://doi.org/10.1039/B906540G, 2009.
Finlayson-Pitts, B. J., Wingen, L. M., Sumner, A. L., Syomin, D., and Ramazan, K. A.: The heterogeneous hydrolysis of NO2 in laboratory systems and in outdoor and indoor atmospheres: An integrated mechanism, Phys. Chem. Chem. Phys., 5, 223–242, https://doi.org/10.1039/B208564J, 2003.
Fitzjarrald, D. and Sakai, R.: Radiation Measurements at Harvard Forest EMS Tower 1991–2007, Harvard Forest Data Archive: HF102 [data set], https://doi.org/10.6073/pasta/f3adbe87e7e506c720d0d9ee91d2b6c4, 2023.
Flechard, C. R., Nemitz, E., Smith, R. I., Fowler, D., Vermeulen, A. T., Bleeker, A., Erisman, J. W., Simpson, D., Zhang, L., Tang, Y. S., and Sutton, M. A.: Dry deposition of reactive nitrogen to European ecosystems: a comparison of inferential models across the NitroEurope network, Atmos. Chem. Phys., 11, 2703–2728, https://doi.org/10.5194/acp-11-2703-2011, 2011.
Fuller, E. N., Schettler, P. D., and Giddings, J. C.: A new method for prediction of binary gas-phase diffusion coefficients, Ind. Eng. Chem., 58, 18–27, https://doi.org/10.1021/ie50677a007, 1966.
Gao, W., Wesely, M. L., and Doskey, P. V.: Numerical modeling of the turbulent diffusion and chemistry of NOx, O3, isoprene, and other reactive trace gases in and above a forest canopy, J. Geophys. Res., 98, 18339–18353, https://doi.org/10.1029/93jd01862, 1993.
Garratt, J. R.: The atmospheric boundary layer, Cambridge University Press, ISBN 9780521467452, 1992.
Geddes, J. A. and Martin, R. V.: Global deposition of total reactive nitrogen oxides from 1996 to 2014 constrained with satellite observations of NO2 columns, Atmos. Chem. Phys., 17, 10071–10091, https://doi.org/10.5194/acp-17-10071-2017, 2017.
Geddes, J. A. and Murphy, J. G.: Observations of reactive nitrogen oxide fluxes by eddy covariance above two midlatitude North American mixed hardwood forests, Atmos. Chem. Phys., 14, 2939–2957, https://doi.org/10.5194/acp-14-2939-2014, 2014.
Geddes, J. A., Heald, C. L., Silva, S. J., and Martin, R. V.: Land cover change impacts on atmospheric chemistry: simulating projected large-scale tree mortality in the United States, Atmos. Chem. Phys., 16, 2323–2340, https://doi.org/10.5194/acp-16-2323-2016, 2016.
Gelaro, R., McCarty, W., Suárez, M. J., Todling, R., Molod, A., Takacs, L., Randles, C. A., Darmenov, A., Bosilovich, M. G., Reichle, R., Wargan, K., Coy, L., Cullather, R., Draper, C., Akella, S., Buchard, V., Conaty, A., da Silva, A. M., Gu, W., Kim, G. K., Koster, R., Lucchesi, R., Merkova, D., Nielsen, J. E., Partyka, G., Pawson, S., Putman, W., Rienecker, M., Schubert, S. D., Sienkiewicz, M., and Zhao, B.: The modern-era retrospective analysis for research and applications, version 2 (MERRA-2), J. Climate, 30, 5419–5454, https://doi.org/10.1175/JCLI-D-16-0758.1, 2017.
Geßler, A., Rienks, M., and Rennenberg, H.: NH3 and NO2 fluxes between beech trees and the atmosphere – Correlation with climatic and physiological parameters, New Phytol., 147, 539–560, https://doi.org/10.1046/j.1469-8137.2000.00712.x, 2000.
Geßler, A., Rienks, M., Rennenberg, H., and Geßler, A.: Stomatal uptake and cuticular adsorption contribute to dry deposition of NH3 and NO2 to needles of adult spruce (Picea abies) trees, New Phytol., 156, 179–194, https://doi.org/10.1046/j.1469-8137.2002.00509.x, 2002.
Goulden, M. L., Munger, J. W., Fan, S. M., Daube, B. C., and Wofsy, S. C.: Measurements of carbon sequestration by long-term eddy covariance: Methods and a critical evaluation of accuracy, Glob. Change Biol., 2, 169–182, https://doi.org/10.1111/j.1365-2486.1996.tb00070.x, 1996.
Grantz, D. A., Zinsmeister, D., and Burkhardt, J.: Ambient aerosol increases minimum leaf conductance and alters the aperture–flux relationship as stomata respond to vapor pressure deficit (VPD), New Phytol., 219, 275–286, https://doi.org/10.1111/nph.15102, 2018.
Grøntoft, T. and Raychaudhuri, M. R.: Compilation of tables of surface deposition velocities for O3, NO2 and SO2 to a range of indoor surfaces, Atmos. Environ., 38, 533–544, https://doi.org/10.1016/j.atmosenv.2003.10.010, 2004.
Hanson, P. J. and Linderg, S. E.: Dry deposition of reactive nitrogen compounds: a review of leaf, canopy and non-foliar measurements, Atmos. Environ., 25A, 1615–1634, https://doi.org/10.1016/0960-1686(91)90020-8, 1991.
Hanson, P. J., Rott, K., Taylor, G. E., Gunderson, C. A., Lindberg, S. E., and Ross-Todd, B. M.: NO2 deposition to elements representative of a forest landscape, Atmos. Environ., 23, 1783–1794, https://doi.org/10.1016/0004-6981(89)90061-9, 1989.
Hardacre, C., Wild, O., and Emberson, L.: An evaluation of ozone dry deposition in global scale chemistry climate models, Atmos. Chem. Phys., 15, 6419–6436, https://doi.org/10.5194/acp-15-6419-2015, 2015.
Harrison, R. M. and Kitto, A. N.: Evidence for a surface source of atmospheric nitrous acid, Atmos. Environ., 28, 1089–1094, https://doi.org/10.1016/1352-2310(94)90286-0, 1994.
Harrison, R. M., Peak, J. D., and Collins, G. M.: Tropospheric cycle of nitrous acid, J. Geophys. Res., 101, 14429–14439, https://doi.org/10.1029/96JD00341, 1996.
He, Y., Zhou, X., Hou, J., Gao, H., and Bertman, S. B.: Importance of dew in controlling the air-surface exchange of HONO in rural forested environments, Geophys. Res. Lett., 33, 2–5, https://doi.org/10.1029/2005GL024348, 2006.
Horii, C. V.: Tropospheric reactive nitrogen speciation, deposition, and chemistry at Harvard Foreset, Doctoral dissertation, Harvard University, https://id.lib.harvard.edu/alma/990094243900203941/catalog (last access: 12 November 2022), 2002.
Horii, C. V., Munger, J. W., Wofsy, S. C., Zahniser, M., Nelson, D., and McManus, J. B.: Fluxes of nitrogen oxides over a temperate deciduous forest, J. Geophys. Res., 109, D08305, https://doi.org/10.1029/2003JD004326, 2004.
Horii, C. V., Munger, J. W., Wofsy, S. C., Zahniser, M., Nelson, D., and Mcmanus, J. B.: Atmospheric reactive nitrogen concentration and flux budgets at a Northeastern U.S. forest site, Agr. Forest Meteorol., 133, 210–225, https://doi.org/10.1016/j.agrformet.2004.08.009, 2005.
Jacob, D. J.: Heterogeneous chemistry and tropospheric ozone, Atmos. Environ., 34, 2131–2159, https://doi.org/10.1016/S1352-2310(99)00462-8, 2000.
Kenagy, H. S., Sparks, T. L., Ebben, C. J., Wooldrige, P. J., Lopez-Hilfiker, F. D., Lee, B. H., Thornton, J. A., McDuffie, E. E., Fibiger, D. L., Brown, S. S., Montzka, D. D., Weinheimer, A. J., Schroder, J. C., Campuzano-Jost, P., Day, D. A., Jimenez, J. L., Dibb, J. E., Campos, T., Shah, V., Jaeglé, L., and Cohen, R. C.: NOx Lifetime and NOy Partitioning During WINTER, J. Geophys. Res.-Atmos., 123, 9813–9827, https://doi.org/10.1029/2018JD028736, 2018.
Kharol, S. K., Shephard, M. W., McLinden, C. A., Zhang, L., Sioris, C. E., O'Brien, J. M., Vet, R., Cady-Pereira, K. E., Hare, E., Siemons, J., and Krotkov, N. A.: Dry Deposition of Reactive Nitrogen From Satellite Observations of Ammonia and Nitrogen Dioxide Over North America, Geophys. Res. Lett., 45, 1157–1166, https://doi.org/10.1002/2017GL075832, 2018.
Kim, S. K. and Kang, H.: Efficient conversion of nitrogen dioxide into nitrous acid on ice surfaces, J. Phys. Chem. Lett., 1), 3085–3089, https://doi.org/10.1021/jz1011669, 2010.
Kurtenbach, R., Becker, K. H., Gomes, J. A. G., Kleffmann, J., Lörzer, J. C., Spittler, M., Wiesen, P., Ackermann, R., Geyer, A., and Platt, U.: Investigations of emissions and heterogeneous formation of HONO in a road traffic tunnel, Atmos. Environ., 35, 3385–3394, https://doi.org/10.1016/S1352-2310(01)00138-8, 2001.
Lammel, G.: Formation of nitrous acid: parameterization and comparison with observations, Report No. 286, Max Planck Institute for Meteorology, Hamburg, Germany, https://hdl.handle.net/21.11116/0000-0005-838C-9 (last access: 6 December 2020), 1999.
Lammel, G. and Cape, J. N.: Nitrous acid and nitrite in the atmosphere, Chem. Soc. Rev., 25, 361–369, https://doi.org/10.1039/cs9962500361, 1996.
Langenberg, S., Carstens, T., Hupperich, D., Schweighoefer, S., and Schurath, U.: Technical note: Determination of binary gas-phase diffusion coefficients of unstable and adsorbing atmospheric trace gases at low temperature – arrested flow and twin tube method, Atmos. Chem. Phys., 20, 3669–3682, https://doi.org/10.5194/acp-20-3669-2020, 2020.
Laughner, J. L. and Cohen, R. C.: Direct observation of changing NOx Lifetime in North American cities, Science,, 366, 723–727, https://doi.org/10.1126/science.aax6832, 2019.
Lee, H.: Development and Field-Deployment of an Absorption Spectrometer to Measure Atmospheric HONO and NO2, Doctoral dissertation, Harvard University, http://nrs.harvard.edu/urn-3:HUL.InstRepos:9280214 (last access: 12 November 2020), 2012.
Leys, C., Ley, C., Klein, O., Bernard, P., and Licata, L.: Detecting outliers: Do not use standard deviation around the mean, use absolute deviation around the median, J. Exp. Soc. Psychol., 49, 764–766, https://doi.org/10.1016/j.jesp.2013.03.013, 2013.
Lucchesi, R.: File Specification for GEOS-5 FP (Forward Processing), GMAO Office Note No. 4 (Version 1.0), Global Modeling and Assimilation Office, NASA Goddard, https://ntrs.nasa.gov/citations/20150001437 (last access: 2 June 2021), 2013.
Martin, R. V., Jacob, D. J., Chance, K., Kurosu, T. P., Palmer, P. I., and Evans, M. J.: Global inventory of nitrogen oxide emissions constrained by space-based observations of NO2 columns, J. Geophys. Res., 108, 4537, https://doi.org/10.1029/2003jd003453, 2003.
Mason, E. A. and Evans III, R. B.: Graham's Laws: simple demonstrations of gases in motion: Part I, Theory, J. Chem. Educ., 46, 358–364, https://doi.org/10.1021/ed046p358, 1969.
Massman, W. J.: A review of the molecular diffusivities of H2O, CO2, CH4, CO, O3, SO2, NH3, N2O, NO, and NO2 in air, O2 and N2 near STP, Atmos. Environ., 32, 1111–1127, https://doi.org/10.1016/S1352-2310(97)00391-9, 1998.
Massman, W. J., Pederson, J., Delany, A., Grantz, D., den Hartog, G., Neumann, H. H., Oncley, S. P., Pearson, R., and Shaw, R. H.: An evaluation of the regional acid deposition model surface module for ozone uptake at three sites in the San Joaquin Valley of California, J. Geophys. Res., 99, 8281–8294, https://doi.org/10.1029/93JD03267, 1994.
Matthes, J., Munger, W., and Wofsy, S.: Biomass Inventories at Harvard Forest EMS Tower since 1993, Harvard Forest Data Archive: HF069 [data set], https://doi.org/10.6073/pasta/0292c5bdb53f80dffee596295cb080ca, 2024.
Meyers, T. P., Huebert, B. J., and Hicks, B. B.: HNO3 deposition to a deciduous forest, Bound.-Lay. Meteorol., 49, 395–410, https://doi.org/10.1007/BF00123651, 1989.
Michou, M., Laville, P., Serça, D., Fotiadi, A., Bouchou, P., and Peuch, V. H.: Measured and modeled dry deposition velocities over the ESCOMPTE area, Atmos. Res., 74, 89–116, https://doi.org/10.1016/j.atmosres.2004.04.011, 2005.
Min, K.-E., Pusede, S. E., Browne, E. C., LaFranchi, B. W., and Cohen, R. C.: Eddy covariance fluxes and vertical concentration gradient measurements of NO and NO2 over a ponderosa pine ecosystem: observational evidence for within-canopy chemical removal of NOx, Atmos. Chem. Phys., 14, 5495–5512, https://doi.org/10.5194/acp-14-5495-2014, 2014.
Munger, J. W., Wofsy, S. C., Bakwin, P. S., Fan, S., Goulden, M. L., Daube, B. C., Goldstein, A. H., Moore, K. E., and Fitzjarrald, D. R.: Atmospheric deposition of reactive nitrogen oxides and ozone in a temperate deciduous forest and a subarctic woodland 1. Measurements and mechanisms, J. Geophys. Res., 101, 12639–12657, https://doi.org/10.1029/96JD00230, 1996.
Munger, J. W., Fan, S. M., Bakwin, P. S., Goulden, M. L., Goldstein, A. H., Colman, A. S., and Wofsy, S. C.: Regional budgets for nitrogen oxides from continental sources: variations of rates for oxidation and deposition with season and distance from source regions, J. Geophys. Res.-Atmos., 103, 8355–8368, https://doi.org/10.1029/98JD00168, 1998.
Munger, W. and Wofsy, S.: Concentrations and Surface Exchange of Air Pollutants at Harvard Forest EMS Tower since 1990, Harvard Forest Data Archive: HF066 [data set], https://doi.org/10.6073/pasta/7415aa04ce4ad8e864aad5e1721b33d3, 2023.
Munger, W. and Wofsy, S.: Canopy-Atmosphere Exchange of Carbon, Water and Energy at Harvard Forest EMS Tower since 1991, Harvard Forest Data Archive: HF004 [data set], https://doi.org/10.6073/pasta/56c6fe02a07e8a8aaff44a43a9d9a6a5, 2024.
Nguyen, T. B., Crounse, J. D., Teng, A. P., St. Clair, J. M., Paulot, F., Wolfe, G. M., and Wennberg, P. O.: Rapid deposition of oxidized biogenic compounds to a temperate forest, P. Natl. Acad. Sci. USA, 112, E392–E401, https://doi.org/10.1073/pnas.1418702112, 2015.
Nobel, P. S.: Physicochemical and Environmental Plant Physiology, 4th Edn., Elsevier, ISBN 978-0-12-374143-1, 2009.
Nowlan, C. R., Martin, R. V., Philip, S., Lamsal, L. N., Krotkov, N. A., Marais, E. A., Wang, S.m and Zhang, Q.: Global dry deposition of nitrogen dioxide and sulfur dioxide inferred from space-based measurements, Global Biogeochem. Cy., 28, https://doi.org/10.1002/2014GB004805, 2014.
Oke, T. R.: Boundary Layer Climates, 2nd Edn., Routledge, ISBN 9780415043199, 1987.
Oren, R., Matyssek, R., and Zimmermann, R.: Estimating photosynthetic rate and annual carbon gain in conifers from specific leaf weight and leaf biomass, Oecologia, 70, 187–193, https://doi.org/10.1007/BF00379238, 1986.
Pilegaard, K., Hummelshøj, P., and Jensen, N. O.: Fluxes of ozone and nitrogen dioxide measured by eddy correlation over a harvested wheat field, Atmos. Environ., 32, 1167–1177, https://doi.org/10.1016/S1352-2310(97)00194-5, 1998.
Plake, D., Stella, P., Moravek, A., Mayer, J. C., Ammann, C., Held, A., and Trebs, I.: Comparison of ozone deposition measured with the dynamic chamber and the eddy covariance method, Agric. For. Meteorol., 206, 97–112, https://doi.org/10.1016/j.agrformet.2015.02.014, 2015.
Platt, U., Perner, D., Harris, G. W., Winer, A. M., and Pitts, J. N.: Observations of nitrous acid in an urban atmosphere by differential optical absorption, Nature, 285, 312–314, https://doi.org/10.1038/285312a0, 1980.
Poling, B. E. and Prausnitz, J. M.: The Properties of Gases and Liquids, 5th Edn., McGraw-Hill, New York, ISBN 9780070116825, 2004.
Pusede, S. E., VandenBoer, T. C., Murphy, J. G., Markovic, M. Z., Young, C. J., Veres, P. R., Roberts, J. M., Washenfelder, R. A., Brown, S. S., Ren, X., Tsai, C., Stutz, J., Brune, W. H., Browne, E. C., Wooldridge, P. J., Graham, A. R., Weber, R., Goldstein, A. H., Dusanter, S., Griffith, S. M., Stevens, P. S., Lefer, B. L., and Cohen, R. C.: An Atmospheric Constraint on the NO2 Dependence of Daytime Near-Surface Nitrous Acid (HONO), Environ. Sci. Technol., 49, 12774–12781, https://doi.org/10.1021/acs.est.5b02511, 2015.
Ren, X., Sanders, J. E., Rajendran, A., Weber, R. J., Goldstein, A. H., Pusede, S. E., Browne, E. C., Min, K.-E., and Cohen, R. C.: A relaxed eddy accumulation system for measuring vertical fluxes of nitrous acid, Atmos. Meas. Tech., 4, 2093–2103, https://doi.org/10.5194/amt-4-2093-2011, 2011.
Ren, Y., Stieger, B., Spindler, G., Grosselin, B., Mellouki, A., Tuch, T., Wiedensohler, A., and Herrmann, H.: Role of the dew water on the ground surface in HONO distribution: a case measurement in Melpitz, Atmos. Chem. Phys., 20, 13069–13089, https://doi.org/10.5194/acp-20-13069-2020, 2020.
Riederer, M., Kurbasik, K., Steinbrecher, R., Voss, A., Miinchen, T. U., and Miinchen, D.: Surface areas, lengths and volumes of Picea abies (L.) Karst. needles: determination, biological variability and effect of environmental factors, Trees, 2, 165–172, https://doi.org/10.1007/BF00196021, 1988.
Rondón, A., Johansson, C., and Granat, L.: Dry deposition of nitrogen dioxide and ozone to coniferous forests, J. Geophys. Res., 98, 5159–5172, https://doi.org/10.1029/92JD02335, 1993.
Seinfeld, J. H.: Atmospheric Chemistry and Physics of Air Pollution, John Wiley and Sons, ISBN 0-471-82857-2, 1986.
Shah, V., Jacob, D. J., Li, K., Silvern, R. F., Zhai, S., Liu, M., Lin, J., and Zhang, Q.: Effect of changing NOx lifetime on the seasonality and long-term trends of satellite-observed tropospheric NO2 columns over China, Atmos. Chem. Phys., 20, 1483–1495, https://doi.org/10.5194/acp-20-1483-2020, 2020.
Shepson, P. B., Bottenheim, J. W., Hastie, D. R., and Venkatram, A.: Determination of the relative ozone and PAN deposition velocities at night, Geophys. Res. Lett., 19, 1121–1124, https://doi.org/10.1029/92GL01118, 1992.
Sievering, H., Kelly, T., McConville, G., Seibold, C., and Turnipseed, A.: Nitric acid dry deposition to conifer forests: Niwot Ridge spruce-fir-pine study, Atmos. Environ., 35, 3851–3859, https://doi.org/10.1016/S1352-2310(01)00156-X, 2001.
Simpson, I. J., Thurtell, G. W., Neumann, H. H., Den Hartog, G., and Edwards, G. C.: The validity of similarity theory in the roughness sublayer above forests, Bound.-Lay. Meteorol., 87, 69–99, https://doi.org/10.1023/A:1000809902980, 1998.
Sörgel, M., Trebs, I., Serafimovich, A., Moravek, A., Held, A., and Zetzsch, C.: Simultaneous HONO measurements in and above a forest canopy: influence of turbulent exchange on mixing ratio differences, Atmos. Chem. Phys., 11, 841–855, https://doi.org/10.5194/acp-11-841-2011, 2011.
Sparks, J. P., Monson, R. K., Sparks, K. L., and Lerdau, M.: Leaf uptake of nitrogen dioxide (NO2) in a tropical wet forest: implications for tropospheric chemistry, Oecologia, 127, 214–221, https://doi.org/10.1007/s004420000594, 2001.
Sparks, J. P., Walker, J., Turnipseed, A. W., and Guenther, A.: Dry nitrogen deposition estimates over a forest experiencing free air CO2 enrichment, Glob. Change Biol., 14, 768–781, https://doi.org/10.1111/j.1365-2486.2007.01526.x, 2008.
Spataro, F. and Ianniello, A.: Sources of atmospheric nitrous acid: State of the science, current research needs, and future prospects, J. Air Waste Manage. Assoc., 64, 1232–1250, https://doi.org/10.1080/10962247.2014.952846, 2014.
Spicer, C. W., Kenny, D. V, Ward, G. F., and Billick, I. H.: Transformations, lifetimes, and sources of NO2, HONO, and HNO3 in indoor environments, Air Waste, 43, 1479–1485, https://doi.org/10.1080/1073161X.1993.10467221, 1993.
Stocker, D. W., Zeller, K. F., and Stedman, D. H.: O3 and NO2 fluxes over snow measured by eddy correlation, Atmos. Environ., 29, 1299–1305, https://doi.org/10.1016/1352-2310(94)00337-K, 1995.
Stutz, J., Alicke, B.m and Neftel, A.: Nitrous acid formation in the urban atmosphere: Gradient measurements of NO2 and HONO over grass in Milan, Italy, J. Geophys. Res., 107, 8192, https://doi.org/10.1029/2001JD000390, 2002.
Stutz, J., Alicke, B., Ackerman, R., Geyer, A., Wang, S., White, A. B., Williams, E. J., Spicer, C. W.m and Fast, J. D.: Relative humidity dependence of HONO chemistry in urban areas, J. Geophys. Res., 109, D03307, https://doi.org/10.1029/2003jd004135, 2004.
Sumner, A. L., Menke, E. J., Dubowski, Y., Newberg, J. T., Penner, R. M., Hemminger, J. C., Wingen, L. M., and Finlayson-pitts, B. J.: The nature of water on surfaces of laboratory systems and implications for heterogeneous chemistry in the troposphere, Phys. Chem. Chem. Phys., 6, 604–613, https://doi.org/10.1039/B308125G, 2004.
Sun, S., Moravek, A., Trebs, I., Kesselmeier, J., and Sörgel, M.: Investigation of the influence of liquid surface films on O3 and PAN deposition to plant leaves coated with organic/inorganic solution, J. Geophys. Res. Atmos., 121, 14239–14256, https://doi.org/10.1002/2016JD025519, 2016.
Tan, F., Tong, S., Jing, B., Hou, S., Liu, Q., Li, K., Zhang, Y., and Ge, M.: Heterogeneous reactions of NO2 with CaCO3–(NH4)2SO4 mixtures at different relative humidities, Atmos. Chem. Phys., 16, 8081–8093, https://doi.org/10.5194/acp-16-8081-2016, 2016.
Tang, M. J., Cox, R. A., and Kalberer, M.: Compilation and evaluation of gas phase diffusion coefficients of reactive trace gases in the atmosphere: volume 1. Inorganic compounds, Atmos. Chem. Phys., 14, 9233–9247, https://doi.org/10.5194/acp-14-9233-2014, 2014.
Tang, M. J., Shiraiwa, M., Pöschl, U., Cox, R. A., and Kalberer, M.: Compilation and evaluation of gas phase diffusion coefficients of reactive trace gases in the atmosphere: Volume 2. Diffusivities of organic compounds, pressure-normalised mean free paths, and average Knudsen numbers for gas uptake calculations, Atmos. Chem. Phys., 15, 5585–5598, https://doi.org/10.5194/acp-15-5585-2015, 2015.
Thoene, B., Rennenberg, H., and Weber, P.: Absorption of atmospheric NO2 by spruce (Picea abies) trees: II. Parameterization of NO2 fluxes by controlled dynamic chamber experiments, New Phytol., 134, 257–266, https://doi.org/10.1111/j.1469-8137.1996.tb04630.x, 1996.
Thomas, C. and Foken, T.: Flux contribution of coherent structures and its implications for the exchange of energy and matter in a tall spruce canopy, Bound.-Lay. Meteorol., 123, 317–337, https://doi.org/10.1007/s10546-006-9144-7, 2007.
Toyota, K., Dastoor, A. P., and Ryzhkov, A.: Parameterization of gaseous dry deposition in atmospheric chemistry models: sensitivity to aerodynamic resistance formulations under statically stable conditions, Atmos. Environ., 147, 409–422, https://doi.org/10.1016/j.atmosenv.2016.09.055, 2016.
Turnipseed, A. A., Huey, L. G., Nemitz, E., Stickel, R., Higgs, J., Tanner, D. J., Slusher, D. L., Sparks, J. P., Flocke, F., and Guenther, A.: Eddy covariance fluxes of peroxyacetyl nitrates (PANs) and NOy to a coniferous forest, J. Geophys. Res., 111, D09304, https://doi.org/10.1029/2005JD006631, 2006.
VandenBoer, T. C., Brown, S. S., Murphy, J. G., Keene, W. C., Young, C. J., Pszenny, A. A. P., Kim, S., Warneke, C., De Gouw, J. A., Maben, J. R., Wagner, N. L., Riedel, T. P., Thornton, J. A., Wolfe, D. E., Dubé, W. P., Öztürk, F., Brock, C. A., Grossberg, N., Lefer, B., Lerner, B., Middlebrook, A. M., and Roberts, J. M.: Understanding the role of the ground surface in HONO vertical structure: High resolution vertical profiles during NACHTT-11, J. Geophys. Res.-Atmos., 118, 10155–10171, https://doi.org/10.1002/jgrd.50721, 2013.
VandenBoer, T. C., Markovic, M. Z., Sanders, J. E., Ren, X., Pusede, S. E., Browne, E. C., Cohen, R. C., Zhang, L., Thomas, J., Brune, W. H., and Murphy, J. G.: Evidence for a nitrous acid (HONO) reservoir at the ground surface in Bakersfield, CA, during CalNex 2010, J. Geophys. Res.-Atmos., 119, 9093–9106, https://doi.org/10.1002/2013JD020971, 2014.
VandenBoer, T. C., Young, C. J., Talukdar, R. K., Markovic, M. Z., Brown, S. S., Roberts, J. M., and Murphy, J. G.: Nocturnal loss and daytime source of nitrous acid through reactive uptake and displacement, Nat. Geosci., 8, 55–60, https://doi.org/10.1038/ngeo2298, 2015.
Vaughan, A. R., Lee, J. D., Misztal, P. K., Metzger, S., Shaw, M. D., Lewis, A. C., Purvis, R. M., Carslaw, D. C., Goldstein, A. H., Hewitt, C. N., Davison, B., Beevers, S. D., and Karl, T. G.: Spatially resolved flux measurements of NOx from London suggest significantly higher emissions than predicted by inventories, Faraday Discuss., 189, 455–472, https://doi.org/10.1039/c5fd00170f, 2016.
Walker, J. T., Beachley, G., Zhang, L., Benedict, K. B., Sive, B. C., and Schwede, D. B.: A review of measurements of air-surface exchange of reactive nitrogen in natural ecosystems across North America, Sci. Total Environ., 698, 133975, https://doi.org/10.1016/j.scitotenv.2019.133975, 2020.
Walton, S., Gallagher, M. W., Choularton, T. W., and Duyzert, J.: Ozone and NO2 exchange to fruit orchards, Atmos. Environ., 31, 2767–2776, https://doi.org/10.1016/S1352-2310(97)00096-4, 1997.
Wang, W., Ganzeveld, L., Rossabi, S., Hueber, J., and Helmig, D.: Measurement report: Leaf-scale gas exchange of atmospheric reactive trace species (NO2, NO, O3) at a northern hardwood forest in Michigan, Atmos. Chem. Phys., 20, 11287–11304, https://doi.org/10.5194/acp-20-11287-2020, 2020.
Wang, Y., Jacob, D. J., and Logan, J. A.: Global simulation of tropospheric O3-NOx-hydrocarbon chemistry: 1. Model Formulation, J. Geophys. Res., 103, 10713–10725, https://doi.org/10.1029/98JD00158, 1998.
Weber, P. and Renenberg, H.: Dependency of nitrogen dioxide (NO2) fluxes to wheat (Triticum aestivum L.) leaves from NO2 concentration, light intensity, temperature and relative humidity determined from controlled dynamic chamber experiments, Atmos. Environ., 30, 3001–3009, https://doi.org/10.1016/1352-2310(96)00008-8, 1996.
Wentworth, G. R., Murphy, J. G., Benedict, K. B., Bangs, E. J., and Collett Jr., J. L.: The role of dew as a night-time reservoir and morning source for atmospheric ammonia, Atmos. Chem. Phys., 16, 7435–7449, https://doi.org/10.5194/acp-16-7435-2016, 2016.
Wesely, M. L.: Parametrization of surface resistances to gaseous dry deposition in regional-scale numerical models, Atmos. Environ., 23, 1293–1304, https://doi.org/10.1016/0004-6981(89)90153-4, 1989.
Wesely, M. L. and Hicks, B. B.: Some factors that affect the deposition rates of sulfur dioxide and similar gases on vegetation, J. Air Pollut. Control Assoc., 27, 1110–1116, https://doi.org/10.1080/00022470.1977.10470534, 1977.
Wesely, M. L., Eastman, J. A., Stedman, D. H., and Yalvac, E. D.: An eddy-correlation measurement of NO2 flux to vegetation and comparison to O3 flux, Atmos. Environ., 16, 815–820, https://doi.org/10.1016/0004-6981(82)90399-7, 1982.
Wojtal, P., Halla, J. D., and McLaren, R.: Pseudo steady states of HONO measured in the nocturnal marine boundary layer: a conceptual model for HONO formation on aqueous surfaces, Atmos. Chem. Phys., 11, 3243–3261, https://doi.org/10.5194/acp-11-3243-2011, 2011.
Wong, A. Y. H., Geddes, J. A., Tai, A. P. K., and Silva, S. J.: Importance of dry deposition parameterization choice in global simulations of surface ozone, Atmos. Chem. Phys., 19, 14365–14385, https://doi.org/10.5194/acp-19-14365-2019, 2019.
Wu, Z., Wang, X., Chen, F., Turnipseed, A. A., Guenther, A. B., Niyogi, D., Charusombat, U., Xia, B., William Munger, J., and Alapaty, K.: Evaluating the calculated dry deposition velocities of reactive nitrogen oxides and ozone from two community models over a temperate deciduous forest, Atmos. Environ., 45, 2663–2674, https://doi.org/10.1016/j.atmosenv.2011.02.063, 2011.
Wu, Z., Wang, X., Turnipseed, A. A., Chen, F., Zhang, L., Guenther, A. B., Karl, T., Huey, L. G., Niyogi, D., Xia, B., and Alapaty, K.: Evaluation and improvements of two community models in simulating dry deposition velocities for peroxyacetyl nitrate (PAN) over a coniferous forest, J. Geophys. Res., 117, D04310, https://doi.org/10.1029/2011JD016751, 2012.
Wu, Z., Schwede, D. B., Vet, R., Walker, J. T., Shaw, M., Staebler, R., and Zhang, L.: Evaluation and Intercomparison of Five North American Dry Deposition Algorithms at a Mixed Forest Site, J. Adv. Model. Earth Sy., 10, 1571–1586, https://doi.org/10.1029/2017MS001231, 2018.
Wu, Z., Zhang, L., Walker, J. T., Makar, P. A., Perlinger, J. A., and Wang, X.: Extension of a gaseous dry deposition algorithm to oxidized volatile organic compounds and hydrogen cyanide for application in chemistry transport models, Geosci. Model Dev., 14, 5093–5105, https://doi.org/10.5194/gmd-14-5093-2021, 2021.
Yang, J., Shen, H., Guo, M. Z., Zhao, M., Jiang, Y., Chen, T., Liu, Y., Li, H., Zhu, Y., Meng, H., Wang, W., and Xue, L.: Strong marine-derived nitrous acid (HONO) production observed in the coastal atmosphere of northern China, Atmos. Environ., 244, 117948, https://doi.org/10.1016/j.atmosenv.2020.117948, 2021.
Zha, Q., Xue, L., Wang, T., Xu, Z., Yeung, C., Louie, P. K. K., and Luk, C. W. Y.: Large conversion rates of NO2 to HNO2 observed in air masses from the South China Sea: Evidence of strong production at sea surface?, Geophys. Res. Lett., 41, 7710–7715, https://doi.org/10.1002/2014GL061429, 2014.
Zhang, L., Moran, M. D., Makar, P. A., Brook, J. R., and Gong, S.: Modelling gaseous dry deposition in AURAMS: A unified regional air-quality modelling system, Atmos. Environ., 36, 537–560, https://doi.org/10.1016/S1352-2310(01)00447-2, 2002a.
Zhang, L., Brook, J. R., and Vet, R.: On ozone dry deposition – with emphasis on non-stomatal uptake and wet canopies, Atmos. Environ., 36, 4787–4799, https://doi.org/10.1016/S1352-2310(02)00567-8, 2002b.
Zhang, L., Brook, J. R., and Vet, R.: A revised parameterization for gaseous dry deposition in air-quality models, Atmos. Chem. Phys., 3, 2067–2082, https://doi.org/10.5194/acp-3-2067-2003, 2003a.
Zhang, L., Brook, J. R., and Vet, R.: Evaluation of a non-stomatal resistance parameterization for SO2 dry deposition, Atmos. Environ., 37, 2941–2947, https://doi.org/10.1016/S1352-2310(03)00268-1, 2003b.
Zhang, L., Vet, R., O'Brien, J. M., Mihele, C., Liang, Z., and Wiebe, A.: Dry deposition of individual nitrogen species at eight Canadian rural sites, J. Geophys. Res., 114, D02301, https://doi.org/10.1029/2008JD010640, 2009.
Zhang, L., Jacob, D. J., Knipping, E. M., Kumar, N., Munger, J. W., Carouge, C. C., van Donkelaar, A., Wang, Y. X., and Chen, D.: Nitrogen deposition to the United States: distribution, sources, and processes, Atmos. Chem. Phys., 12, 4539–4554, https://doi.org/10.5194/acp-12-4539-2012, 2012.
Zhang, Y., Mathur, R., Bash, J. O., Hogrefe, C., Xing, J., and Roselle, S. J.: Long-term trends in total inorganic nitrogen and sulfur deposition in the US from 1990 to 2010, Atmos. Chem. Phys., 18, 9091–9106, https://doi.org/10.5194/acp-18-9091-2018, 2018.
Zhou, X., Civerolo, K., Dai, H., Huang, G., Schwab, J., and Demerjian, K.: Summertime nitrous acid chemistry in the atmospheric boundary layer at a rural site in New York State, J. Geophys. Res., 107, 4590, https://doi.org/10.1029/2001JD001539, 2002.
- Abstract
- Introduction
- Reference model and measurements
- Measurement–model comparisons and updates
- Assumptions of nocturnal stomatal closure and non-stomatal NO2 uptake via Reaction (R1)
- Conclusions
- Code and data availability
- Author contributions
- Competing interests
- Disclaimer
- Acknowledgements
- Financial support
- Review statement
- References
- Supplement