the Creative Commons Attribution 4.0 License.
the Creative Commons Attribution 4.0 License.
 | 02 Dec 2025
Strong aerosol indirect radiative effect from dynamic-driven diurnal variations of cloud water adjustments
Yang Wang
Jiming Li
Weiyuan Zhang
Lijie Zhang
Yuan Wang
Aerosol-cloud interaction (ACI) remains a key uncertainty in climate projections. A major challenge is that the sign and magnitude of cloud liquid water path (LWP) response to aerosol perturbations (represented by cloud droplet number concentration, Nd) at different temporal and spatial scales are highly variable, but potential microphysical-dynamical mechanisms are still unclear, especially at a diurnal scale. Here, Himawari-8 retrievals were used to investigate LWP adjustments in two distinct cloud regions: the stratocumulus region off the western Australia (AUW) and clouds over the East China Sea (ECS) characterized by a transition from stratocumulus to cumulus under strong anthropogenic influences. In the ECS region, LWP exhibits a unique pronounced rising (positive LWP adjustments) at high Nd. Results indicate that this pattern is driven by northerly cold-air advection during the cold seasons, which enhances surface fluxes and subsequently leads to increases in both LWP and Nd. Furthermore, the diurnal variation of LWP adjustments is likely driven by cloud-top entrainment in the ECS region, but is primarily associated with diurnal-related boundary layer decoupling in the AUW region. The results indicate that neglecting diurnal variations of LWP adjustments leads to an underestimation (up to 89 %) of the cooling effect induced by changes in cloud albedo due to aerosol perturbations in the AUW. The bias spans from a 32 % overestimation to a 37 % underestimation in the ECS. Our findings highlight the key role of diurnal variations of ACI in reducing the uncertainty in climate projections.
Please read the corrigendum first before continuing.
-
Notice on corrigendum
The requested paper has a corresponding corrigendum published. Please read the corrigendum first before downloading the article.
-
Article
(3992 KB)
- Corrigendum
-
Supplement
(3336 KB)
-
The requested paper has a corresponding corrigendum published. Please read the corrigendum first before downloading the article.
- Article
(3992 KB) - Full-text XML
- Corrigendum
-
Supplement
(3336 KB) - BibTeX
- EndNote


Marine low-level clouds (MLCs), which cover one-third of the global ocean (Klein and Hartmann, 1993), exert a strong cooling effect by reflecting the incoming solar radiation back into space (Jiang et al., 2023). Cloud reflectivity to solar radiation is highly sensitive to atmospheric aerosol concentrations. Because aerosols can serve as the cloud condensation nuclei (CCN), which modify key microphysical variables such as cloud droplet number concentrations (Nd) and droplet effective radius (re). For a given cloud liquid water content, aerosol-induced increases in CCN can enhance Nd and hence reduce re, boosting cloud albedo (Twomey, 1977), which is known as cloud albedo effect, being an important component of aerosol-cloud interactions (ACI). Additional alterations in cloud microphysics may arise from changes in the quantity of liquid water or cloud cover that are induced by aerosol variations. These changes can lead to rapid adjustments within the cloud in response to aerosol perturbations, which is another crucial component of ACI (Bellouin et al., 2020). For example, it has been documented that liquid water path (LWP) can either increase (positive LWP adjustments) due to precipitation suppression (Albrecht, 1989) or decrease due to entrainment feedbacks (negative LWP adjustments) (Ackerman et al., 2004; Bretherton et al., 2007; Small et al., 2009). While the Twomey effect is well-recognized, however, LWP adjustments are highly uncertain as the most poorly quantified in all climate forcing (IPCC, 2023).
These large uncertainties in LWP adjustments are generally attributed to the complex interplay of microphysical-dynamical conditions and aerosol loading (represented by Nd) that vary with different temporal and spatial scales (Bender et al., 2019; Chen et al., 2014; Glassmeier et al., 2021; Gryspeerdt et al., 2022a). Numerous observational studies have been carried out to understand the extent of this variability and uncertainties of LWP adjustments, with the aim of constraining model simulations (Gryspeerdt et al., 2019, 2021; Rosenfeld et al., 2019; Trofimov et al., 2020; Wilcox, 2010). These investigations have spanned various regions and targets, revealing diverse cloud responses attributable to the varied mechanisms of LWP adjustments. In addition, it has been confirmed that analysis methods, sampling strategies, and meteorological covariations could be another considerable source of uncertainty in LWP adjustments (Chen et al., 2014; Gryspeerdt et al., 2022b; Rosenfeld et al., 2019, 2023). Here, we focus on the time-dependence of LWP adjustments (i.e., diurnal variations) as it is associated with both sampling strategies and meteorological covariations. It has been established that marine cloud properties and the cloud-topped marine boundary layer exhibit prominent diurnal variations in response to solar radiation, which are closely related to their regional dependence (Duynkerke and Hignett, 1993; Wood et al., 2002). The microphysical-dynamical boundary layer feedback, which generally covaries with the regional diurnal cycle, could augment or weaken the LWP adjustments and thus lead to the diurnal variation of LWP adjustments with broad spreads and even different signs. This means that a one-size-fits-all approach to global-mean LWP adjustments may not provide a robust constraint, given the regional and temporal mechanisms at play (Michibata et al., 2016). Additionally, the microphysical-dynamical mechanisms behind are complex and still poorly understood (Feingold et al., 2024). This drives the speculation that the diurnal variations of LWP adjustments could be one of the most significant yet overlooked sources of uncertainty of ACI.
To date, a majority of studies have relied on observations from polar-orbiting satellites to investigate LWP adjustments and cloud microphysical properties (Bennartz and Rausch, 2017; Gryspeerdt et al., 2019; Li et al., 2018; McCoy et al., 2018; Rosenfeld et al., 2019), which are insufficient to depict the time-dependent nature of LWP adjustments. Recent studies began to emphasize the diurnal evolutions of LWP adjustments with geostationary satellites. For example, Rahu et al. (2022) detected polluted cloud tracks over Eastern Europe and revealed afternoon LWP increases in some cases. Qiu et al. (2024) identified a distinct “U-shaped” diurnal pattern of LWP adjustments over the Eastern North Atlantic. However, the understanding of diurnal LWP adjustments, particularly their interplay with varying meteorological conditions and boundary layer dynamic mechanisms, remains limited. Based on Himawari-8 geostationary satellite, the diurnal variations of cloud microphysical properties and LWP adjustments in two typical regions, and the associated influencing factors and mechanisms are presented in this study. Our research aims to expand our understanding of the influence of meteorological factors, initial aerosol states (especially Nd), and the covariance between meteorology and aerosols on cloud LWP, gaining a comprehensive understanding of the diurnal variations in LWP adjustments, which is a highly time-dependent variable lacking quantification, in conjunction with shifts in regional meteorological conditions.
Our analysis focuses on 1° × 1° marine low-level cloud samples, aggregated from filtered pixel-level satellite data. Within the sight of Himawari-8, we selected two cloud regions with significantly different environmental backgrounds (see Fig. S1 in the Supplement). One is a remote stratocumulus region located in the west of Australia (AUW: 25–35° S, 95–105° E) (Klein and Hartmann, 1993). The other is in the East China Sea (ECS: 20–30° N, 120–130° E), which is significantly impacted by anthropogenic aerosols and characterized by Sc to Cu transition (Long et al., 2020). The comparison between the two regions allows us to explore the regional differences of LWP adjustments and their potential driving mechanisms. In total, we collected 480 189 cloud samples in the AUW and 173 181 cloud samples in the ECS using a 4-year (2016–2019) hourly record from SatCORPS Himawari-8.
2.1 Nd retrieval based on geostationary satellite product
In this study, 4 years (2016–2019) of hourly cloud microphysical properties data from the Satellite Cloud and Radiation Property retrieval System (SatCORPS) Clouds and the Earth's Radiant Energy System (CERES) Geostationary Satellite (GEO) Edition 4 Himawari-8 over the Northern Hemisphere (NH) (Southern Hemisphere (SH)) Version 1.2 data product (CER_GEO_ED4_HIM08_NH_V01.2, CER_GEO_ED4_HIM08_SH_V01.2) were collected (NASA/LARC/SD/ASDC, 2018b, a). The datasets are derived from the Advanced Himawari Imagers (AHI) on Himawari-8 geostationary satellite, using the Langley Research Center (LARC)s SatCORPS algorithms in support of the CERES project (Minnis et al., 2021; Trepte et al., 2019). The retrievals are at 2 km resolution (at nadir) and are sub-sampled to 6 km. The sub-sampled resolution meets the needs of the CERES project without having a data implosion. The cloud optical thickness (τ), cloud effective radius (re) and cloud-top temperature (CLTT) from the SatCORPS product during the daytime were used to calculateNd in our study. Other cloud properties such as cloud-top height (CLTH), cloud base height (CLBH) and cloud thickness (H) were used in further analysis. The SatCORPS product is based on the CERES Ed4 cloud retrieval algorithm (Minnis et al., 2021), which provides more accurate parameterizations of CLTH and H than the CERES Edition 2 retrieval algorithm (Minnis et al., 2011). Briefly, for boundary layer clouds, CLTH is estimated based on the method in Sun-Mack et al. (2014). H is computed using empirical formulas with τ: for liquid clouds. CLBH is directly obtained by subtracting H from CLTH.
SatCORPS cloud droplet effective radius (re) is primarily estimated from the 3.9 µm near-infrared band (Kang et al., 2021), which is closest to the cloud top with less bias in further calculation of Nd (Grosvenor et al., 2018). Nd is estimated as (Bennartz, 2007):
where ρw is liquid water density. The extinction efficiency factor Q≈2. k, related to droplet size distribution, is set as 0.8 for maritime cloud (Martin et al., 1994; Painemal and Zuidema, 2011). cw represents the condensation rate determined by temperature in cloud (here is the cloud-top temperature from SatCORPS). A constant adiabatic value (fad) of 0.8 is used to represent the deviation from the adiabatic profile (Bennartz, 2007). This is the most common method to derive Nd from passive satellite observations (Bennartz, 2007; Bennartz and Rausch, 2017; Li et al., 2018; McCoy et al., 2018) and has been validated as a reliable technique for observing changes in long-term variations of Nd (Boers et al., 2006). Li et al. (2018) demonstrated that passive satellite Nd retrievals exhibit strong consistency with active satellite retrievals. The SatCORPS Himawari-8 retrievals agree well with in-situ observations according to Kang et al. (2021). In this study, the LWP from SatCORPS is calculated as in sub-adiabatic conditions, following the method by Wood and Hartmann (2006). The combination of these two retrieval methods of Nd and LWP has been widely used in the satellite investigations of LWP adjustments (Fons et al., 2023; Gryspeerdt et al., 2019; Qiu et al., 2024; Smalley et al., 2024).
Several sampling strategies were adopted in this study to select cloud pixels to reduce uncertainties (Grosvenor et al., 2018; Gryspeerdt et al., 2019; Li et al., 2018). Only pixels in the liquid phase with cloud-top temperature warmer than 268 K under 3.2 km were included. To maintain consistency with previous studies (Bennartz and Rausch, 2017; Li et al., 2018), we adopted 268 K as the threshold of CLTT for liquid clouds, rather than 273 K. In fact, 96 % (97 %) of the samples exhibited CLTT above 273 K in the AUW (ECS) region. Therefore, the threshold has a negligible impact on the overall results. The lower bounds of re (τ) were set as 4 µm (4) to reduce uncertainties. Moreover, pixels with solar zenith angles larger than 65° were excluded. Filtered data were used to calculate Nd and then aggregated to a 1° × 1° grid. Each grid containing at least 30 pixels is considered a cloud sample. On average, each grid contains 83 (87) pixels in the AUW (ECS) region.
We followed the above methods to filter cloud pixels, which only limit cloud top properties and cloud phase, inevitably including different cloud regimes, such as low-level cumulus clouds. This might introduce uncertainties as cumulus clouds and stratocumulus clouds have different adiabatic properties, but we have set fad as a constant value in Nd calculations. Small et al. (2013) found that the fad of cumulus clouds showed no significant variation with height, whereas Wood (2005) observed that the adiabaticity in stratocumulus clouds decreased from cloud base to cloud top. The difference in departures from adiabaticity between cumulus and stratocumulus stems from their different entrainment processes. Stratocumulus clouds are primarily influenced by the entrainment of dry air at cloud top (Mellado, 2017). In contrast, cumulus clouds are dominated by lateral entrainment (Heus et al., 2008). Uncertainties may also occur as fad varies with cloud depth (Grosvenor et al., 2018; Min et al., 2012; Wang et al., 2021). As acquiring hourly fad on a global scale is rather difficult, to date, studies investigating diurnal variations of LWP adjustments based on geostationary satellites continue to employ a constant fad value (Fons et al., 2023; Qiu et al., 2024; Smalley et al., 2024). Also, the choices of a constant k might introduce bias into the retrieval of Nd (Grosvenor et al., 2018). Studies have found that k parameter varied with the height within cloud and cloud types (Brenguier et al., 2011; Martin et al., 1994; Painemal and Zuidema, 2011). This indicates that the presence of diurnal variations in k and fad (e.g., hourly changes in entrainment rate can modify fad) introduces further bias. The resulting uncertainties warrant further in situ observation to improve the accuracy.
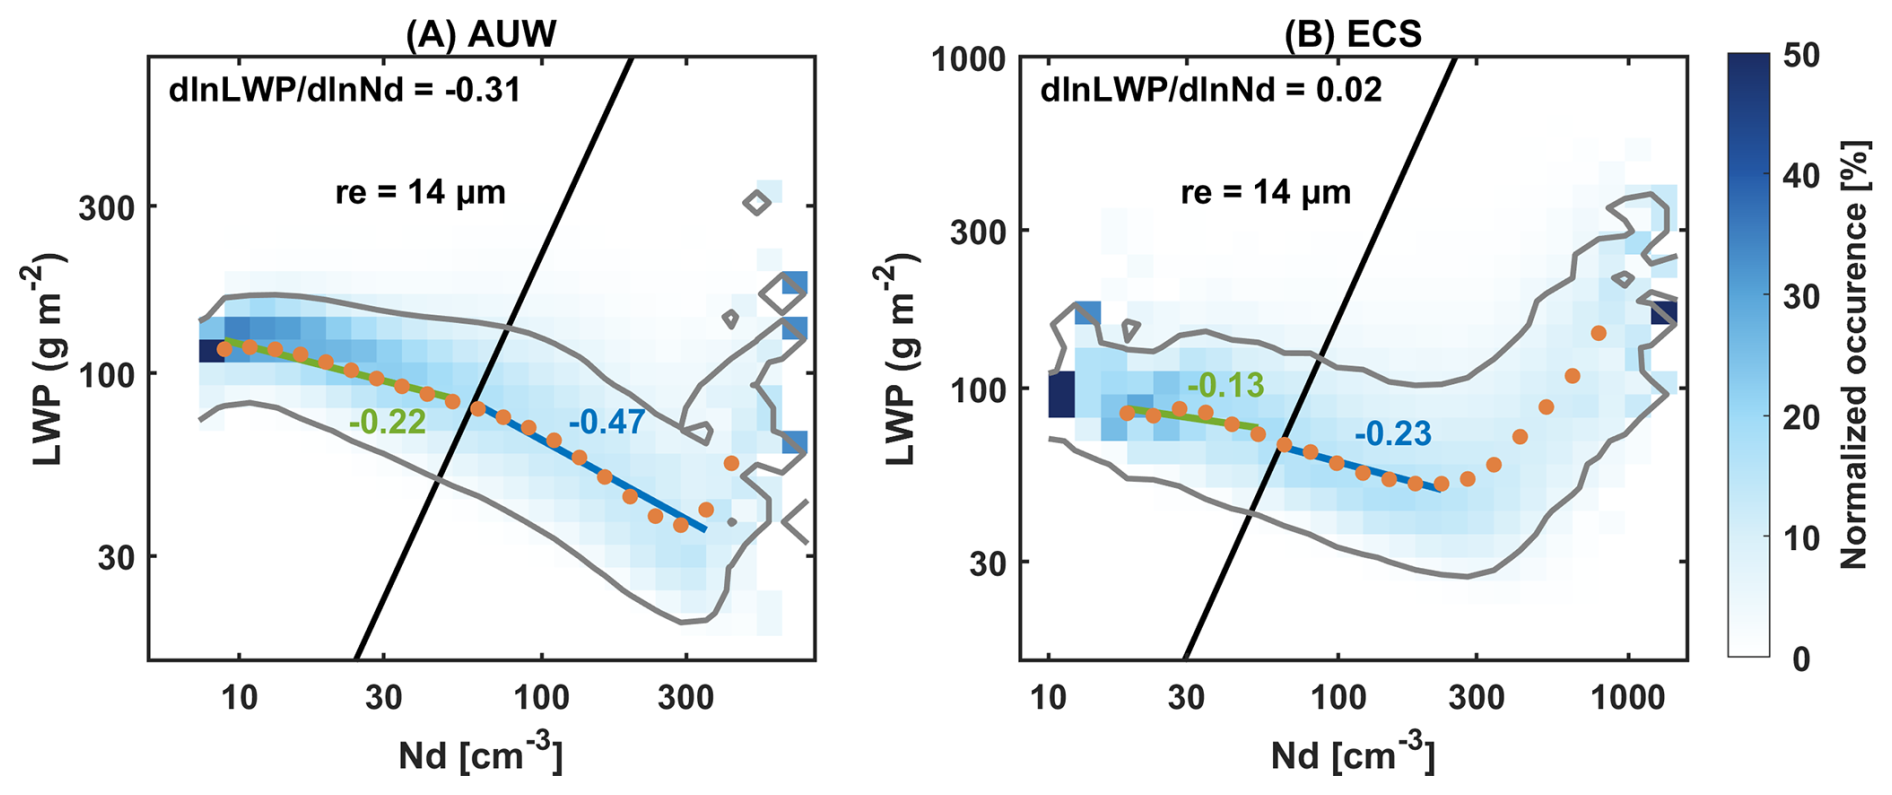
Figure 1Joint histograms of Nd and LWP in log-log space for all samples in the AUW and ECS regions (the west of Australia, AUW and the East China Sea, ECS). The column of each Nd bin is normalized. The black lines are fitted based on the bins in the joint histogram with the effective radius (re) closest to 14 µm. The gray lines represent the contour of 5 % occurrence. Orange dots represent the median LWP in each Nd bins with a sample size greater than 50. The green and blue lines are regression slopes for the orange points with re above and below 14 µm, respectively.
To minimize the influence of precipitation on Nd and LWP retrievals, GPM IMERG Final Precipitation L3 Half Hourly 0.1° × 0.1° V07 (GPM_3IMERGHH) was used (Huffman et al., 2020). Cloud samples were included in the analysis only if the GPM_3IMERGHH precipitation rate equals 0 mm h−1 in a 1° × 1° grid. To align these two satellite products, SatCORPS cloud pixels within each 0.1° grid of GPM_3IMERGHH are assigned the same precipitation value. Considering the limited ability of GPM to detect light precipitation and drizzle, we additionally applied a re = 14 µm threshold to distinguish between drizzle scenes and non-drizzle scenes (Rosenfeld et al., 2012) (black lines in Fig. 1).
2.2 Quantification of LWP adjustments
To quantify LWP response, two methods have been used in previous studies. The logarithmic relationship between Nd and LWP is the standard way to quantify LWP sensitivity to aerosol from satellite data, where Nd is considered a proxy of CCN. Another way of describing the changes of cloud water due to aerosols is deduced from the contributions of changes in LWP and re to the changes in cloud optical depth (Christensen and Stephens, 2011; Coakley and Walsh, 2002). Whereas the latter method is put forward with a default condition that Δre is always negative, it is only applicable to small-scale pollution tracks like industry tracks, volcano tracks or ship tracks, etc. (Rahu et al., 2022; Toll et al., 2019). Therefore, the former method is applied in this study, which has been commonly used in research on aerosol-cloud interactions based on large-scale satellite observations.
LWP adjustment at any given moment is the result of all available data at that moment. The regression slope of Nd and LWP in log-log space is calculated on 1° grid scale. Given our substantial sample size and to ensure consistency with the subsequent analysis of the joint histograms of Nd and LWP in log-log space, we employed equal-width binning, using the median LWP within each log(Nd) bin to regress the slope. To reduce noise from sparse samples, only bins with more than 50 samples were used to calculate LWP adjustments. Additionally, we tested the equal-sample binning method. The patterns of theNd-LWP relationship and diurnal variations of LWP adjustments remained robust across different binning methods.
2.3 Reanalysis datasets
Aerosol property is represented by the total column extinction optical depth (AOD) at 550 nm from hourly time-averaged 2-dimensional data collection in Modern-Era Retrospective analysis for Research and Applications version 2 (MERRA-2), with a spatial resolution of 0.5° × 0.625° (Buchard et al., 2017). It is interpolated onto a 1° × 1° grid using the bilinear interpolation method.
Meteorological indicators related to cloud microphysical process are obtained from ERA5 reanalysis data (Hersbach et al., 2020), including sea surface temperature (SST), lower-tropospheric stability (LTS), relative humidity on 700 and 1000 hPa (RH700 and RH1000), vertical velocity on 700 hPa (omega700), horizontal wind field on 700 hPa and horizontal temperature advection at the surface (SSTadv). The ERA5 is the fifth-generation atmospheric reanalysis of global climate and is produced using the ECMWF's Integrated Forecast System cycle 41r2 with a 4-dimensional variation assimilation system. Compared to the ERA-Interim, the ERA5 has higher spatial (0.25° × 0.25°) and temporal resolutions (hourly), and the representation of atmospheric processes has been further improved. In this study, the ERA5 reanalysis data is matched to SatCORPS data in the same way as GPM_3IMERGHH.
The LTS is expressed as the difference of potential temperature between 700 hPa and the surface (Klein and Hartmann, 1993). For the horizontal temperature advection at the surface (SSTadv), it is expressed in spherical coordinates as Jian et al. (2021) and Qu et al. (2015):
where RE is the mean Earth radius, SST is the sea surface temperature, u and v are the eastward and northward horizontal 10 m wind components, respectively. Φ and λ represent the radians of latitude and longitude. A positive/negative SSTadv indicates warm/cold advection, which influences the surface latent and sensible heat fluxes then the moisture transport within the cloud layer and the cloud thickness (George and Wood, 2010) and, consequently, influences the cloud liquid water.
3.1 LWP adjustments vary alongside microphysical-dynamical conditions
Figure 1 shows the normalized joint histograms of Nd and LWP in log-log space for all samples in the AUW and ECS regions. The complete pictures of all available daytime are presented in Fig. S2. The Nd-LWP relationships show similar patterns during daytime in each region, but different results in the two regions. The overall LWP adjustments are −0.31 in the AUW and 0.02 in the ECS region. For Nd < ∼ 300 cm−3, LWP decreases with increased Nd, which is typically attributed to sedimentation-entrainment feedback (Ackerman et al., 2004) and evaporation-entrainment feedback (Small et al., 2009), leading to negative LWP adjustments in both regions. Unlike the inverted-V shape observed in previous studies (Glassmeier et al., 2021; Gryspeerdt et al., 2019), we did not observe positive LWP adjustments at low Nd, which have been linked to precipitation suppression. That is, as increasing Nd, the reducedre may enhance the stability against coalescence and suppress the precipitation and loss of LWP (Albrecht, 1989; Glassmeier et al., 2021). The positive slopes are often observed in very pristine environments (Gryspeerdt et al., 2023), especially when Nd is below approximately 10 cm−3 (Fons et al., 2023; Goren et al., 2025). In contrast, in this study, 98 % of the AUW samples exhibit Nd values exceeding 15 cm−3, and 99 % of the ECS samples have Nd greater than 30 cm−3. Therefore, we did not find this positive slope of the inverted-V shape. Nevertheless, the LWP increasing signal resulting from precipitation suppression is still detectable in our study. For instance, samples with re > 14 µm – conditions more likely to contain drizzle (Rosenfeld et al., 2012) – still exhibit a weaker negative LWP adjustment than those with re < 14 µm (Fig. 1, −0.22 vs. −0.47 in the AUW and −0.13 vs. −0.23 in the ECS), consistent with the results of Zhou and Feingold (2023) in the northwestern Atlantic. It suggests that in drizzle-like samples, the precipitation suppression partially offsets the dominant LWP reduction caused by the entrainment effect, resulting in a weak decrease in LWP with increasingNd compared to non-drizzle samples.
According to Fig. 1B, LWP begins to rise at high Nd (> ∼ 300 cm−3), exhibiting a V shape that dominates the overall positive LWP adjustments in the ECS region. Although a positive sensitivity of LWP to Nd perturbations has been reported (Bender et al., 2019; Gryspeerdt et al., 2019; Michibata et al., 2016; Zhang et al., 2021), its origin remains unclear. To investigate whether the positive Nd-LWP relationship is biased by broken scenes, we assessed the sensitivity of our results to CF. As shown in Fig. S3, the rise in LWP at high Nd coincides with an increase in CF. The average CF for samples with Nd > 300 cm−3 is 86 %. The positive Nd-LWP relationship persists in both overcast (CF > 80 %) and broken (CF < 80 %) cloud scenes, but the magnitude of the positive adjustment is markedly larger under high-CF scenes. Thus, the LWP rise at high Nd is unlikely to be an artifact of broken-cloud scenes; rather, overcast environments amplify the positive LWP adjustment.
It is plausible that the unique Nd-LWP relationship over the East China Sea is closely related to heavy pollution advected from the continent. Previous studies of LWP adjustments have typically concentrated on the range of Nd below 300 cm−3. However, 18 % of the samples exhibited Nd values exceeding 300 cm−3 in the ECS region, where clouds are downwind of the major emission sources of China. We further compare the Nd-LWP relationships over the continental region (46 % of samples have Nd > 300 cm−3) in the west of ECS and the oceanic region (5 % of samples have Nd > 300 cm−3) in the east of ECS, respectively (Fig. S4). Results demonstrate that LWP generally rose with increasing Nd on the heavily polluted continent, while LWP declined with Nd over the ocean. The opposing Nd-LWP relationships correspond to the ascending and descending branches of the V shape, which indicates that V shape results from mixing samples of continental and oceanic air masses.
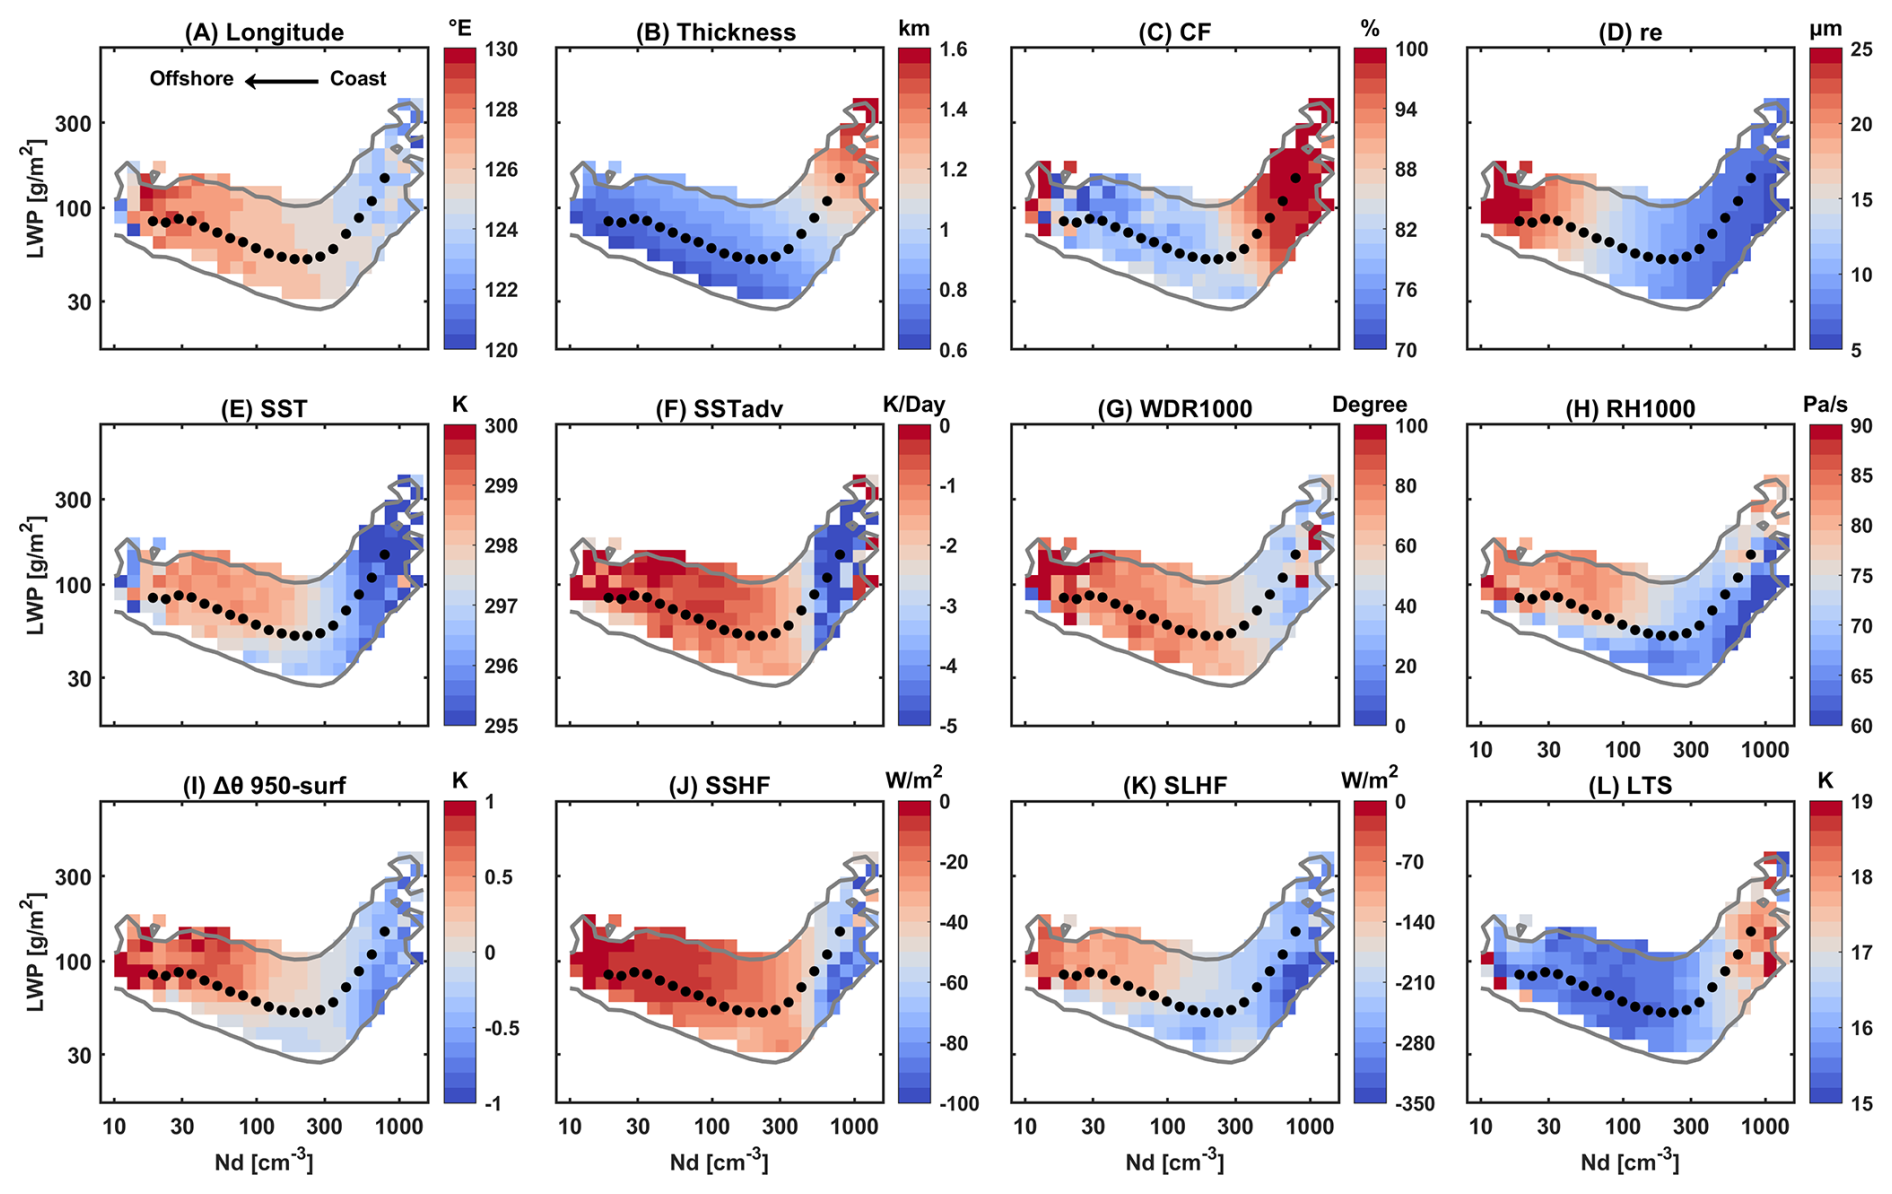
Figure 2Distributions of meteorological conditions in Nd-LWP log-log space in the ECS region. The color scale represents the median values in each bin. Only bins with an occurrence of at least 5 % are shown, bounded by the gray lines. (A) Longitude. (B) Cloud thickness. (C) Cloud fraction (CF). (D) Cloud effective radius (re). (E) Sea surface temperature (SST). (F) Horizontal temperature advection at the surface (SSTadv). (G) Wind direction on 1000 hPa. 0° indicates a northerly wind. (H) Relative humidity on 1000 hPa (RH1000). (I) The potential temperature difference between 950 hPa and 2 m above the sea surface (Δθ950-surf), a proxy of the sub-cloud layer stability. (J) Surface sensible heat flux (SSHF). (K) Surface latent heat flux (SLHF). For the vertical fluxes, the negative is upwards. (L) Lower-tropospheric stability (LTS). Black dots represent the median LWP in each Nd bins with a sample size greater than 50.
To further investigate the spatial variability of the ECS region and the potential reasons for the rising behavior of LWP at high Nd, we followed the method of Goren et al. (2025) to present the distribution of environmental conditions inNd-LWP space (Fig. 2). The cloud samples in the ascending branch are concentrated west of 125° E (Fig. 2A). We performed a sub-domain analysis in the coast and offshore (Fig. S5). LWP adjustments demonstrate a clear spatial gradient, transitioning from positive values near the coast to negative values offshore. The spatial distribution of LWP adjustments is consistent withNd. For coastal grids with high Nd values, LWP increases with Nd, particularly after ∼ 300 cm−3, while for offshore grids where Nd values are concentrated below ∼ 300 cm−3, LWP decreases with Nd. Therefore, the V shape is the manifestation of spatial variability in the ECS region. The observed increase in LWP at high Nd is attributed to samples from the coastal area. These coastal samples are characterized by cold SST (Fig. 2E), since 75 % of the samples are from spring and winter when the Kuroshio Current produces a sharp SST gradient in the ECS region (Fig. S6) (Liu et al., 2016). Results of summer are statistically insignificant due to the limited samples (3 %), particularly after excluding cases with strong precipitation (GPM = 0 mm h−1). Such seasonal patterns indicate that the samples are strongly influenced by the northerly cold-air advection at the surface that destabilizes the air-sea interface (Fig. 2F and G). The potential temperature difference between 950 hPa and 2 m above the sea surface (Δθ950-surf) is calculated as an indicator of sub-cloud layer stability, revealing an extremely unstable sub-cloud layer in the ascending branch (Fig. 2I). Northerly winds transport relatively dry, cold, aerosol-rich air across the warm ocean (Fig. 2F, G, and H). This destabilizes the sub-cloud layer and intensifies the upward fluxes of sensible and latent heat from sea surface into the atmosphere (Fig. 2I, J and K) (Long et al., 2020), raising saturation water vapor pressure and facilitating cloud droplet activation. Additionally, high LTS along the coast (Fig. 2L) suppresses the entrainment drying at cloud top (Scott et al., 2020), allowing activated droplets to accumulate more liquid water with thicker clouds (Fig. 2B) and higher CF (Fig. 2C). These conditions jointly elevate both Nd and LWP, resulting in the observed increasing LWP at high Nd.
In the AUW region, LWP also increases when Nd exceeds 300 cm−3. However, the region is relatively clean with only 0.02 % of all samples exhibiting Nd above ∼ 300 cm−3. Given the limited sample size, these results are not statistically representative, and only a brief discussion is provided here. Samples with Nd > ∼ 300 cm−3 still demonstrate distinct meteorological conditions compared to samples with Nd < ∼ 300 cm−3 (Fig. S7). In contrast to the ECS region, pollution sources in the AUW region originate from lower latitudes (Fig. S7A). This may be attributed to the influence of warm and moist environment over the warm ocean with weak large-scale subsidence (Fig. S7E, H, and L), which promote cloud droplet activation and consequently lead to positive LWP adjustments at high Nd.
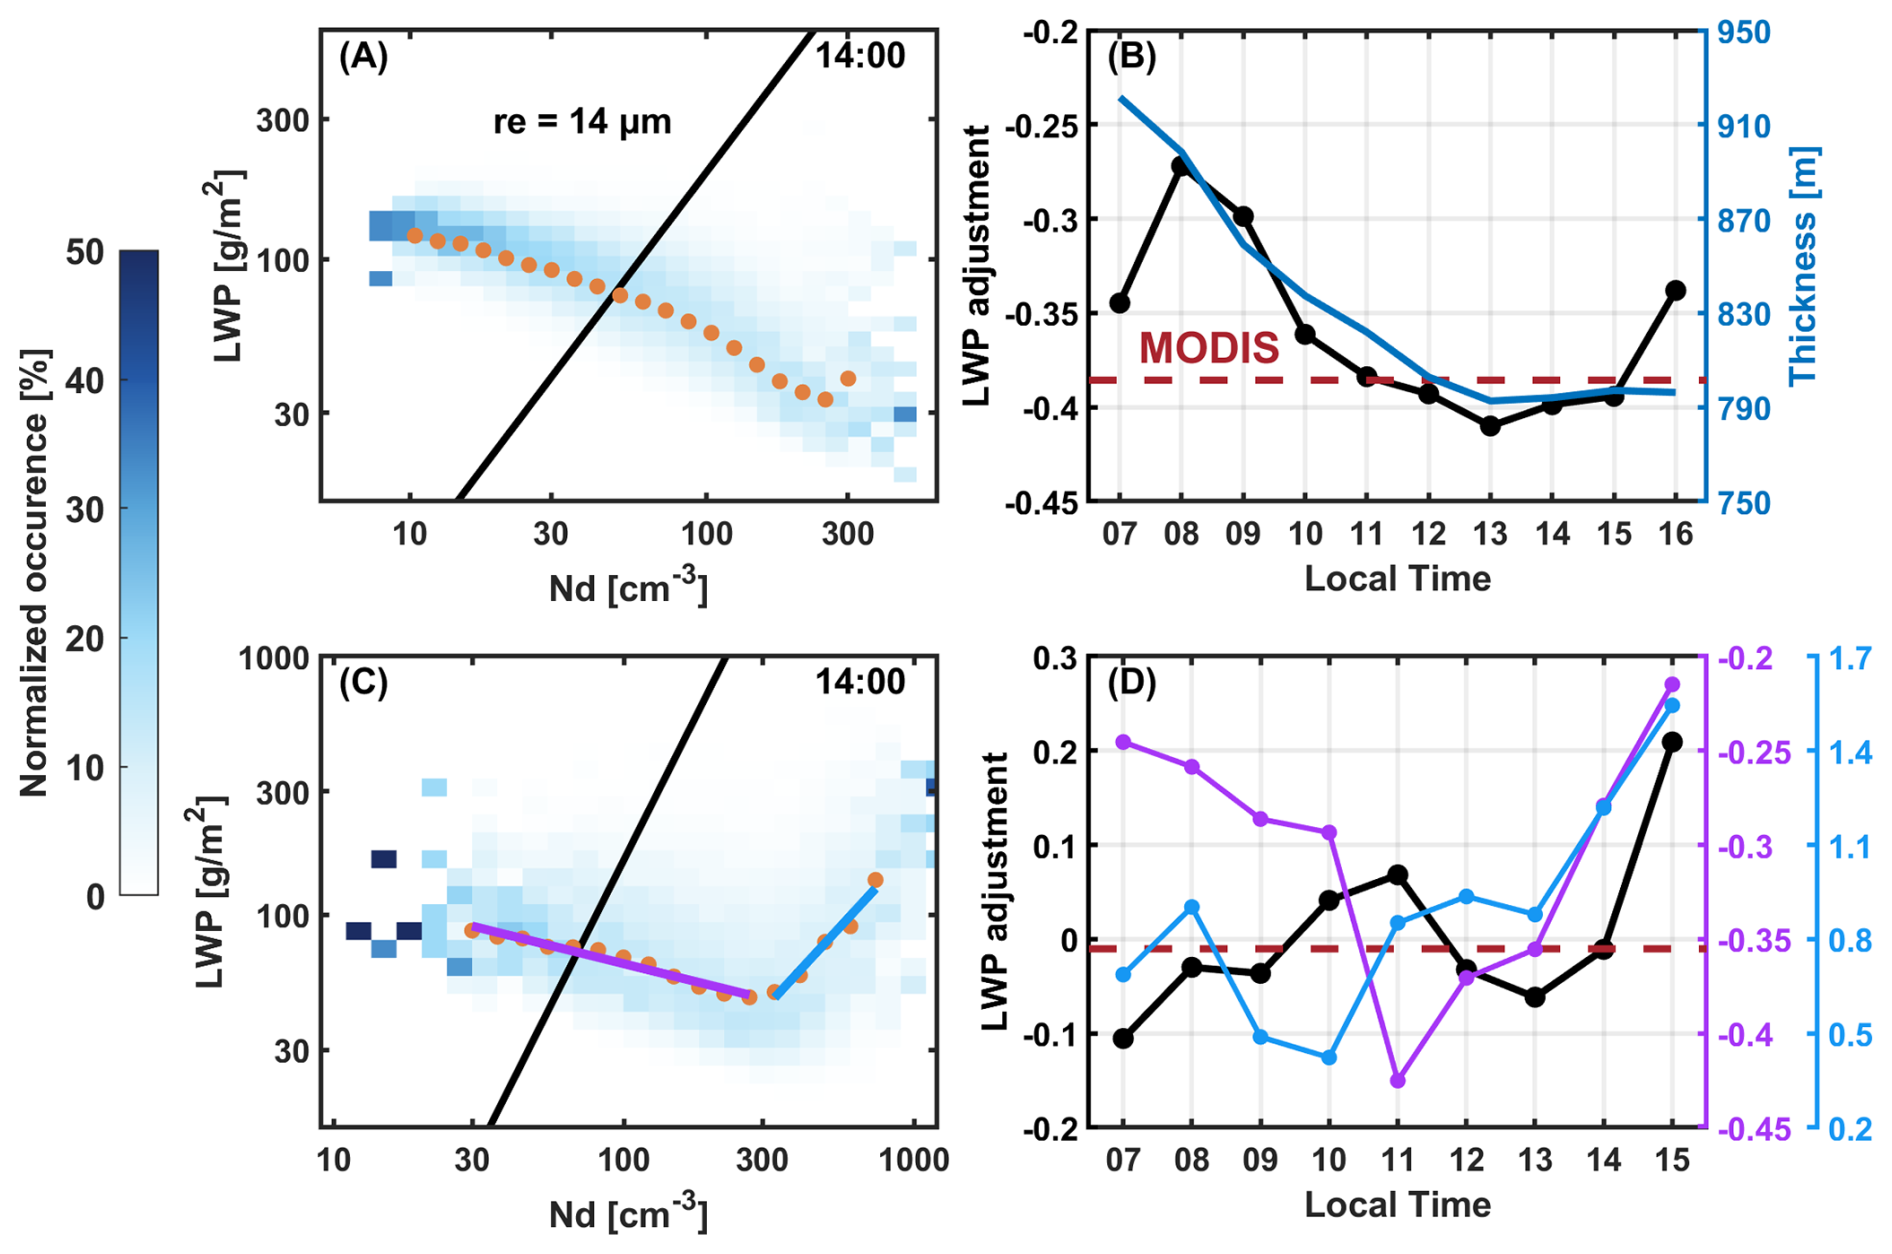
Figure 3Panels (A) and (C) display the normalized joint histograms of Nd and LWP in log-log space at 14:00 LT for the AUW region and the ECS region, respectively. The complete pictures of all available daytime are presented in Fig. S2. The solid black lines in panels (B) and (D) show the diurnal variations of LWP adjustments. The blue line in panel (B) represents the diurnal variation of H in the AUW region. Colored lines in panel (D) are diurnal variations of different stages in panel (C). Red dashed lines represent the average LWP adjustments during MODIS Terra (10:30 LT) and Aqua (13:30 LT) overpasses, −0.39 for the AUW region (B) and −0.01 for the ECS region (D).
In summary, the above results reveal that LWP adjustments strongly depend on microphysical-dynamical processes (e.g., precipitation suppression, and entrainment feedbacks), cloud properties (Nd range), large-scale meteorology (e.g., cold-air advection and the stability of MBL). Given that some of these factors display diurnal variations in response to the solar radiation cycle, LWP adjustments would also exhibit diurnal patterns (black lines in Fig. 3B and D). We surmise that the prevailing dynamic conditions at any given time are responsible for the observed diurnal variations of LWP adjustments. To verify this hypothesis, we investigate the diurnal variations in LWP adjustments and their potential influencing factors.
3.2 How LWP adjustments change over the diurnal scale and associated mechanisms
LWP adjustments exhibit pronounced diurnal variations with distinct regional contrasts (Fig. 3). In the AUW region, the negative LWP adjustments strengthen from around 08:00 to 13:00 LT, reaching their strongest value at −0.41, and then weaken to −0.34 (black line in Fig. 3B). In the ECS region, the positive LWP adjustments exhibit two local peaks during the observation period, occurring at 11:00 and 15:00 LT, with peak values of 0.07 and 0.21, respectively (black line in Fig. 3D). And two local minima LWP adjustments are observed at 07:00 and 13:00 LT, with values of −0.11 and −0.06, respectively. The results highlight the limitations of using the sparse polar-orbiting satellite observations to represent LWP adjustments at specific times. For example, MODIS overpass averages (red dashed line in Fig. 3B) overestimate the intensity of negative LWP adjustment in the AUW region by 44 % at 08:00 LT. In the ECS region, the intensity of negative LWP adjustments are underestimated by 91 % at 07:00 LT, while the intensity of positive adjustments at 15:00 LT are underestimated by 105 % (Fig. 3D). Such biases can lead to substantial errors in estimation of ACI (see Sect. 4 for details).
We first analyze the role of meteorological factors in driving the diurnal variations of LWP adjustments (Fig. S8). Overall, the covariance of a single meteorological factor affects only the magnitude of LWP adjustments. In the AUW region, the lower LTS corresponds to weaker negative LWP adjustments. Samples with relatively low LTS are characterized by larger re in the Nd-LWP space (Fig. S9), leading to stronger precipitation suppression by increasing Nd and thus a weaker negative LWP adjustment. In the ECS region, stronger cold-air advection corresponds to greater sensible and latent heat fluxes, resulting in more positive LWP adjustments, which is consistent with the findings presented in the previous section. The diurnal variations of LWP adjustments cannot be explained by a single meteorological factor. Therefore, it is necessary to start with the diurnal variations of cloud properties to analyze the mechanisms behind the diurnal LWP adjustment patterns.
The AUW region is one of the subtropical Sc regions over the eastern part of the ocean away from continents (Klein and Hartmann, 1993), characterized by large LTS and strong large-scale subsidence (Fig. S10), which are favorable for the formation of Sc. Figure 4 depicts the diurnal variations of cloud properties in the Sc-like AUW region. The diurnal variation of LWP shows a typical pattern with a peak in the morning and a gradual reduction until early afternoon. According to previous studies, this pattern is subject to the diurnal cycle of solar insolation (Bretherton et al., 2004; Mechoso et al., 2014; Wood et al., 2002). Specifically, during the daytime, solar radiation absorption within the cloud layer and long-wave cooling at the cloud top drive the turbulent mixing within the cloud layer and inhibit turbulence to the sea surface, thus leading to the decoupling of the cloud-topped marine boundary layer (MBL) (Duynkerke and Hignett, 1993; Ghosh et al., 2005; Slingo et al., 1982). As decoupling cuts off the moisture source from the sea surface, the imbalance between entrainment drying and upward moisture flux may thin the cloud layer. The decrease of LWP before 13:00 LT is primarily attributed to the lifting of the cloud base, indicating that the upward moisture transport is suppressed, which is in line with an early modeling study for typical Sc cloud regimes (Bougeault, 1985). After 13:00 LT, the gradual reduction of solar heating hinders the intensification of decoupling and helps rebuild the turbulence between the cloud and subcloud layer. Therefore, LWP increases after 13:00 LT likely due to the reconstruction of turbulence.
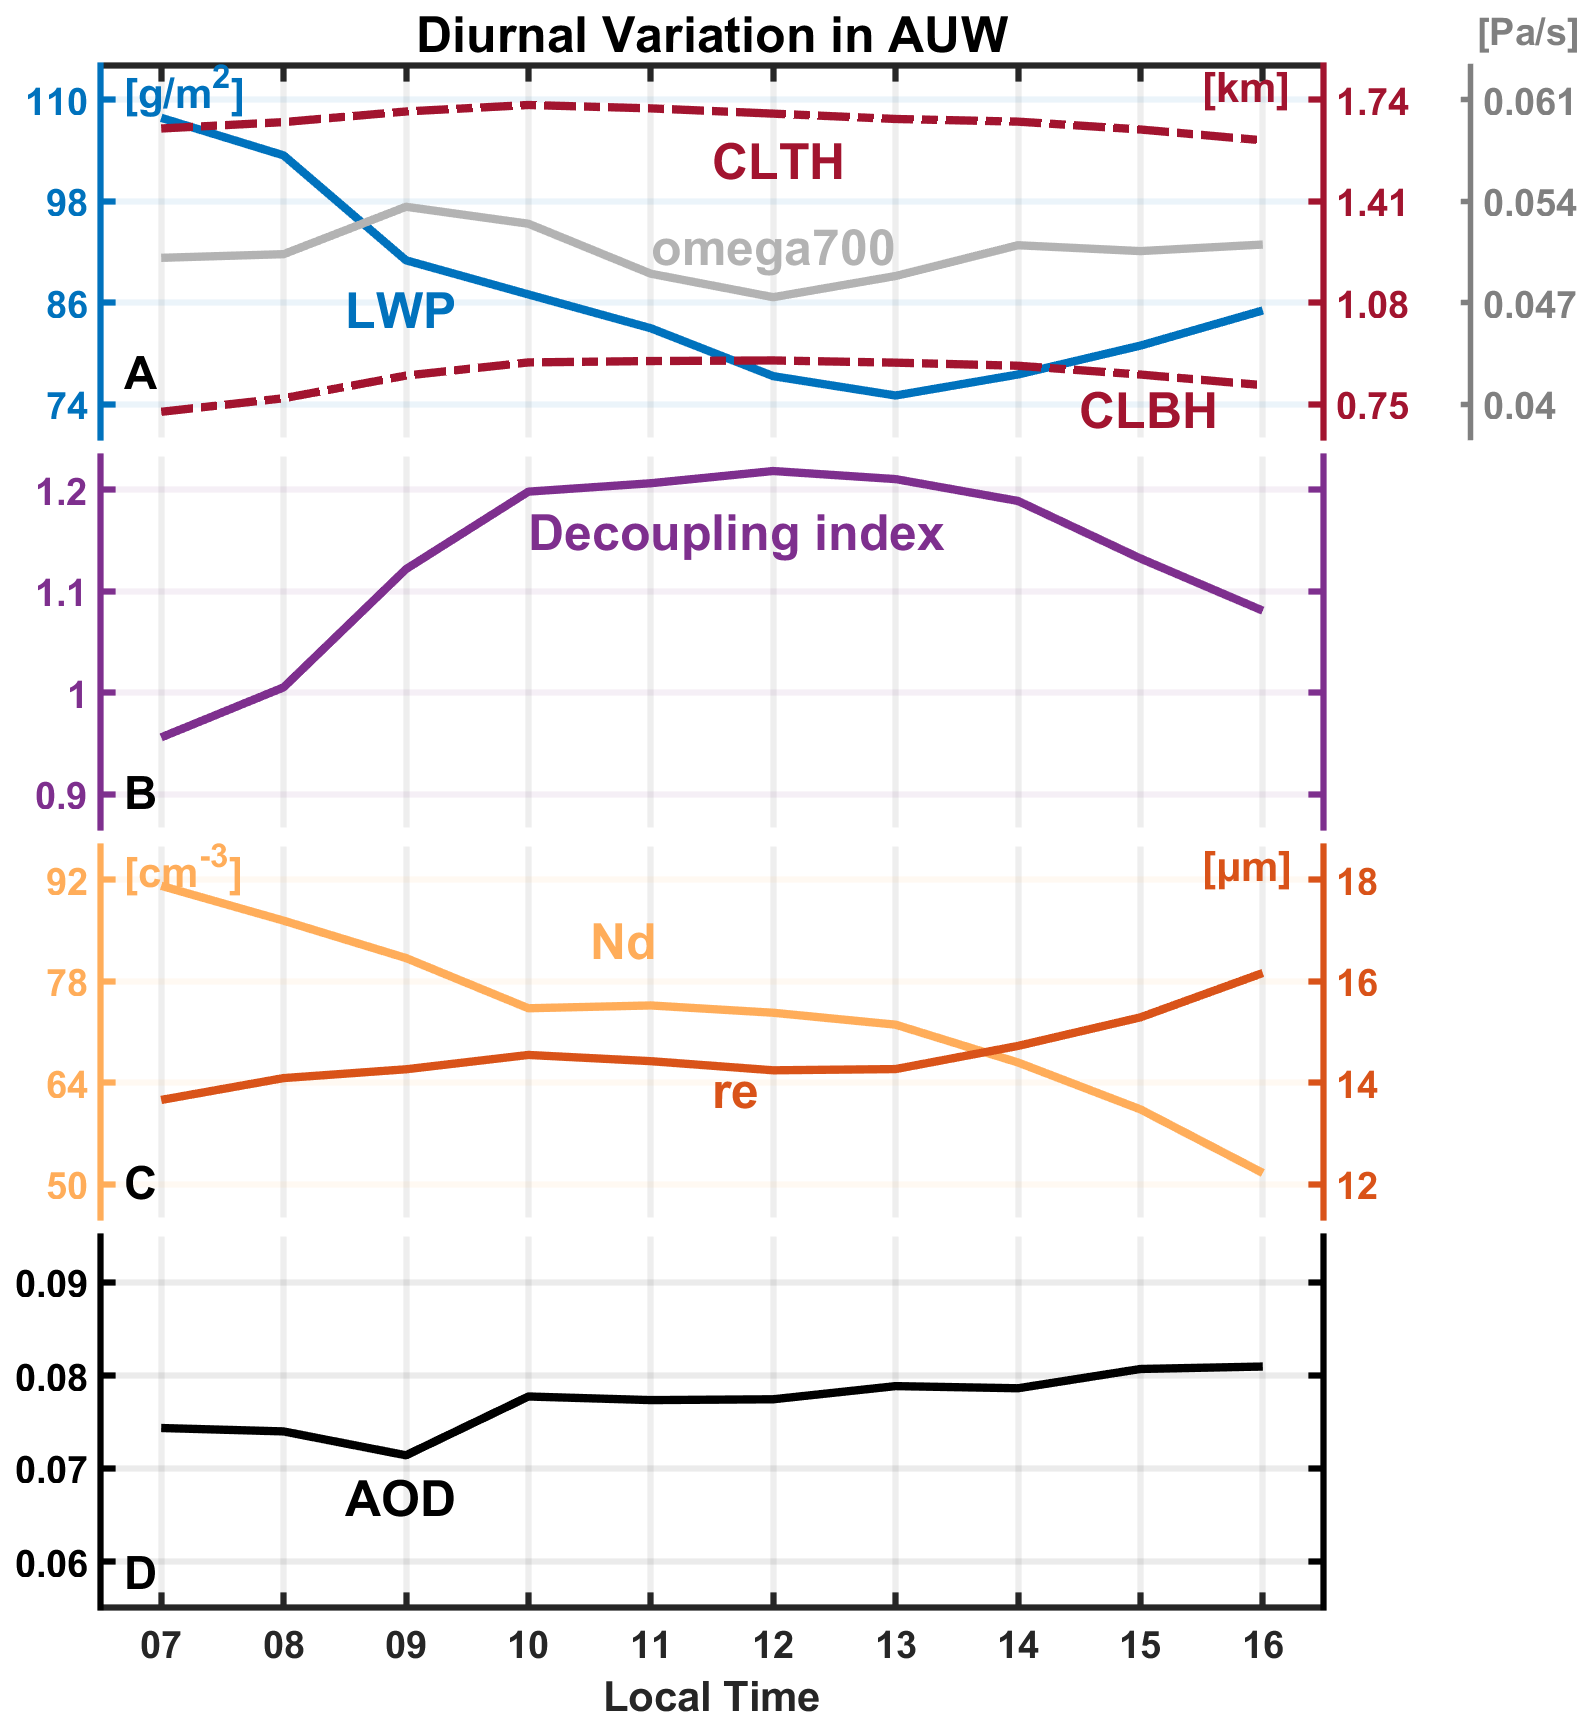
Figure 4Diurnal patterns in the AUW region. (A) Cloud liquid water path (LWP), cloud-top height (CLTH), cloud base height (CLBH), and vertical velocity on 700 hPa (omega700, positive values indicate downdraft) from ERA5 reanalysis. (B) Decoupling index in the AUW region. (C) Cloud droplet number concentration (Nd) and effective radius (re). (D) Aerosol optical depth (AOD).
Here, we present auxiliary verification for of the decoupling process. Following Kazil et al. (2017), the decoupling index is quantified by the relative position between the CLBH and the lifting condensation level (LCL). A larger index implies a stronger degree of decoupling:
LCL is derived from ERA5 reanalysis following Wood and Bretherton (2006). According to Fig. 4B, the decoupling index increases before noon then decreases, indicating the decoupling process discussed above.
Nd continually declines from 07:00 to 16:00 LT and re does not change significantly before 12:00 LT and then rises. In contrast, there is no evident diurnal variation of AOD in the AUW, which is reasonable in the remote ocean area but insufficient to explain the diurnal variations of Nd and re. This suggests that other factors rather than aerosols may be responsible for the diurnal variations of Nd and re over the AUW region. Combining the nature of the decoupling process and diurnal patterns of cloud properties in Fig. 4, we discuss the possible mechanisms for the diurnal variation of Nd and re based on earlier cloud microphysics studies. According to Verlinden and de Szoeke (2018), the shortwave heating counteracts longwave cooling during daytime, resulting in weakening of cloud-top entrainment. Meanwhile, the decoupling cuts off moisture transport and suppresses condensational growth. The combination of these two processes may lead to little variations in re before 12:00 LT. Additionally, the decoupling process leads to the suppression of both surface moisture transport and cloud base updrafts, which may in turn reduce the supersaturation and hence the number of activated cloud droplets. This may explain the continuous decrease in Nd before 13:00 LT. Furthermore, according to the relationship between CLTH, large-scale subsidence (ws, always negative), and entrainment rate (we) in the mixed-layer model framework (Painemal et al., 2013), we explain the variations after 12:00 LT. Given the weak diurnal variation of ws over the open ocean (∼ 0.047 to ∼ 0.054 Pa s−1, gray line in Fig. 4A), the observed decrease in CLTH after 12:00 LT is likely attributed to a weakening of we. During this period, the condensational growth by the reconstructed water vapor supply will enhance re. Meanwhile, the coalescence process, enhanced by an increase in re leads to a decrease in Nd. This process could be more dominant than the increase in activated cloud droplets caused by water vapor reestablishment for an increase in Nd to be observed in this study.
Based on the diurnal mechanisms of MBL discussed above, the diurnal LWP adjustment pattern is primarily a consequence of the influence of these diurnal-related mechanisms on the relationship between Nd and LWP. In the AUW region, the diurnal variations of the overall LWP adjustments (black line in Fig. 3B) and cloud thickness (blue line in Fig. 3B) demonstrate a strong consistency with a turning point at 13:00 LT. In the morning, thicker clouds occur in a well-mixed boundary layer with stronger cloud-top entrainment and sufficient upward moisture transport (Lu et al., 2023; Zheng et al., 2018b). Therefore, LWP is less sensitive to entrainment-feedbacks with increasing Nd in thicker clouds. LWP adjustments become more negative with the gradual thinning of clouds. This can be attributed to the weaker moisture transport and cloud-top entrainment in the decoupling boundary layer. As a result, the entrainment feedback with increasing Nd has a greater influence on LWP in thinner clouds, corresponding to more negative LWP adjustments. Qiu et al. (2024) also discovered the important role of thick-thin cloud transitions in the diurnal variation of LWP adjustments. Rosenfeld et al. (2019) pointed out that cloud thickness (H) constrained most of the meteorological impacts, and Nd explained nearly half of the LWP variability for a given H. We further constrain LWP adjustments in different H intervals (Fig. S19B). Negative LWP adjustments become weaker as H increases (Fig. S19B). Our results suggest that the physical processes under different H conditions appear to determine how LWP changes with Nd, rather than H itself.
Rosenfeld et al. (2019) demonstrated an overall positive LWP adjustment when separating H. The discrepancy may arise from their focus on samples in convective cores (top 10 % of cloud optical thickness), which are closer to adiabatic, whereas our samples suggest more exchange with the free atmosphere. Considering H from the passive satellite product is based on an empirical relationship, we further validated the conclusion using the 2B-GEOPROF-LIDAR product from CloudSat-CALIPSO, where H is directly calculated by the cloud base height (CBH) and cloud top height (CTH) of single-layer cloud samples (Fig. S20). The consistent pattern of increasing LWP adjustment with H from both datasets supports the robustness of our conclusion.
In contrast, H cannot explain the diurnal variation of LWP adjustments in the ECS region (Fig. S19E), even when the spatial variability is considered (Fig. S21). This is likely attributed to different cloud regimes and complex meteorological covariations in the ECS region. Therefore, we attempt to explain the diurnal characteristics of LWP adjustments based on the boundary layer mechanisms in the ECS region.
The sharp SST gradient in the ECS region (shown in Fig. S4A) leads to a distinct transition in boundary layer thermodynamic structure and cloud properties from the coast to offshore areas (Liu et al., 2016). Following Rosenfeld et al. (2019), we categorize the clouds into three regimes, i.e., Sc (LTS > 18 K), Sc to Cu transition (14 K ≤ LTS ≤ 18 K), and Cu (LTS < 14 K) (Fig. S4B, C, and D). Sc presents over a cooler sea surface along the coast (Fig. S4A and B). The coastal distribution suggests that most of Sc may be advected from the Sc region in the southeast Chinese plain (Klein and Hartmann, 1993). According to the cloud advection scheme by Miller et al. (2018), cloud advection can be approximated as a translation of the cloud field with the wind field. The advection height is assumed to correspond to the height of the cloud top. Based on the 700 hPa wind field (Fig. S4A), it is plausible that Sc in the ECS region is possibly advected from the southeast Chinese plain. As air moves offshore, the cloud layer decouples with the surface mixed layer over the warmer sea surface – a process known as the “deepening-warming mechanism” (Albrecht et al., 1995). In this decoupled boundary layer, Cu forms in the moist and unstable subcloud layer and rises to the upper cloud layer, resulting in a locally cumulus-coupled MBL.
Under this condition, MBL is never fully coupled but exhibits local cumulus coupling. According to Zheng et al. (2018a), the formation of Cu beneath the Sc will render local coupling by feeding moisture into the upper cloud layer, thus causing a positive skewness of the probability density function (PDF) of LWP. Therefore, the skewness of the LWP PDF can be used to estimate the cumulus coupling in this region:
where E is the expected value, μ and σ is the mean and standard deviation of x, respectively. Positive skewness indicates more data tends to be distributed to the right, and vice versa.
For diurnal variations in the ECS in Fig. 5, there is a general decrease in LWP before 12:00 LT, followed by an increase. This is in contrast to the pronounced cloud thinning observed in the AUW region due to the decoupling of MBL by solar heating. In the ECS region, the overall change of LWP is not significant (less than 10 g m−2). Since MBL is never fully coupled, these minor observed changes are mainly caused by local cumulus coupling. The variations of LWP and LWP skewness exhibit a strong consistency. We also calculate the coefficient of variation (cv) of CLOT to represent the uniformity of each cloud sample. cv is defined as the standard deviation (σ) divided by the mean (μ):
The smaller the cv is, the less dispersion there is among the cloud pixels in the cloud sample, resulting in a more uniform sample. It turns out that the cloud layer is influenced primarily by the strength of cumulus coupling, rather than other factors.
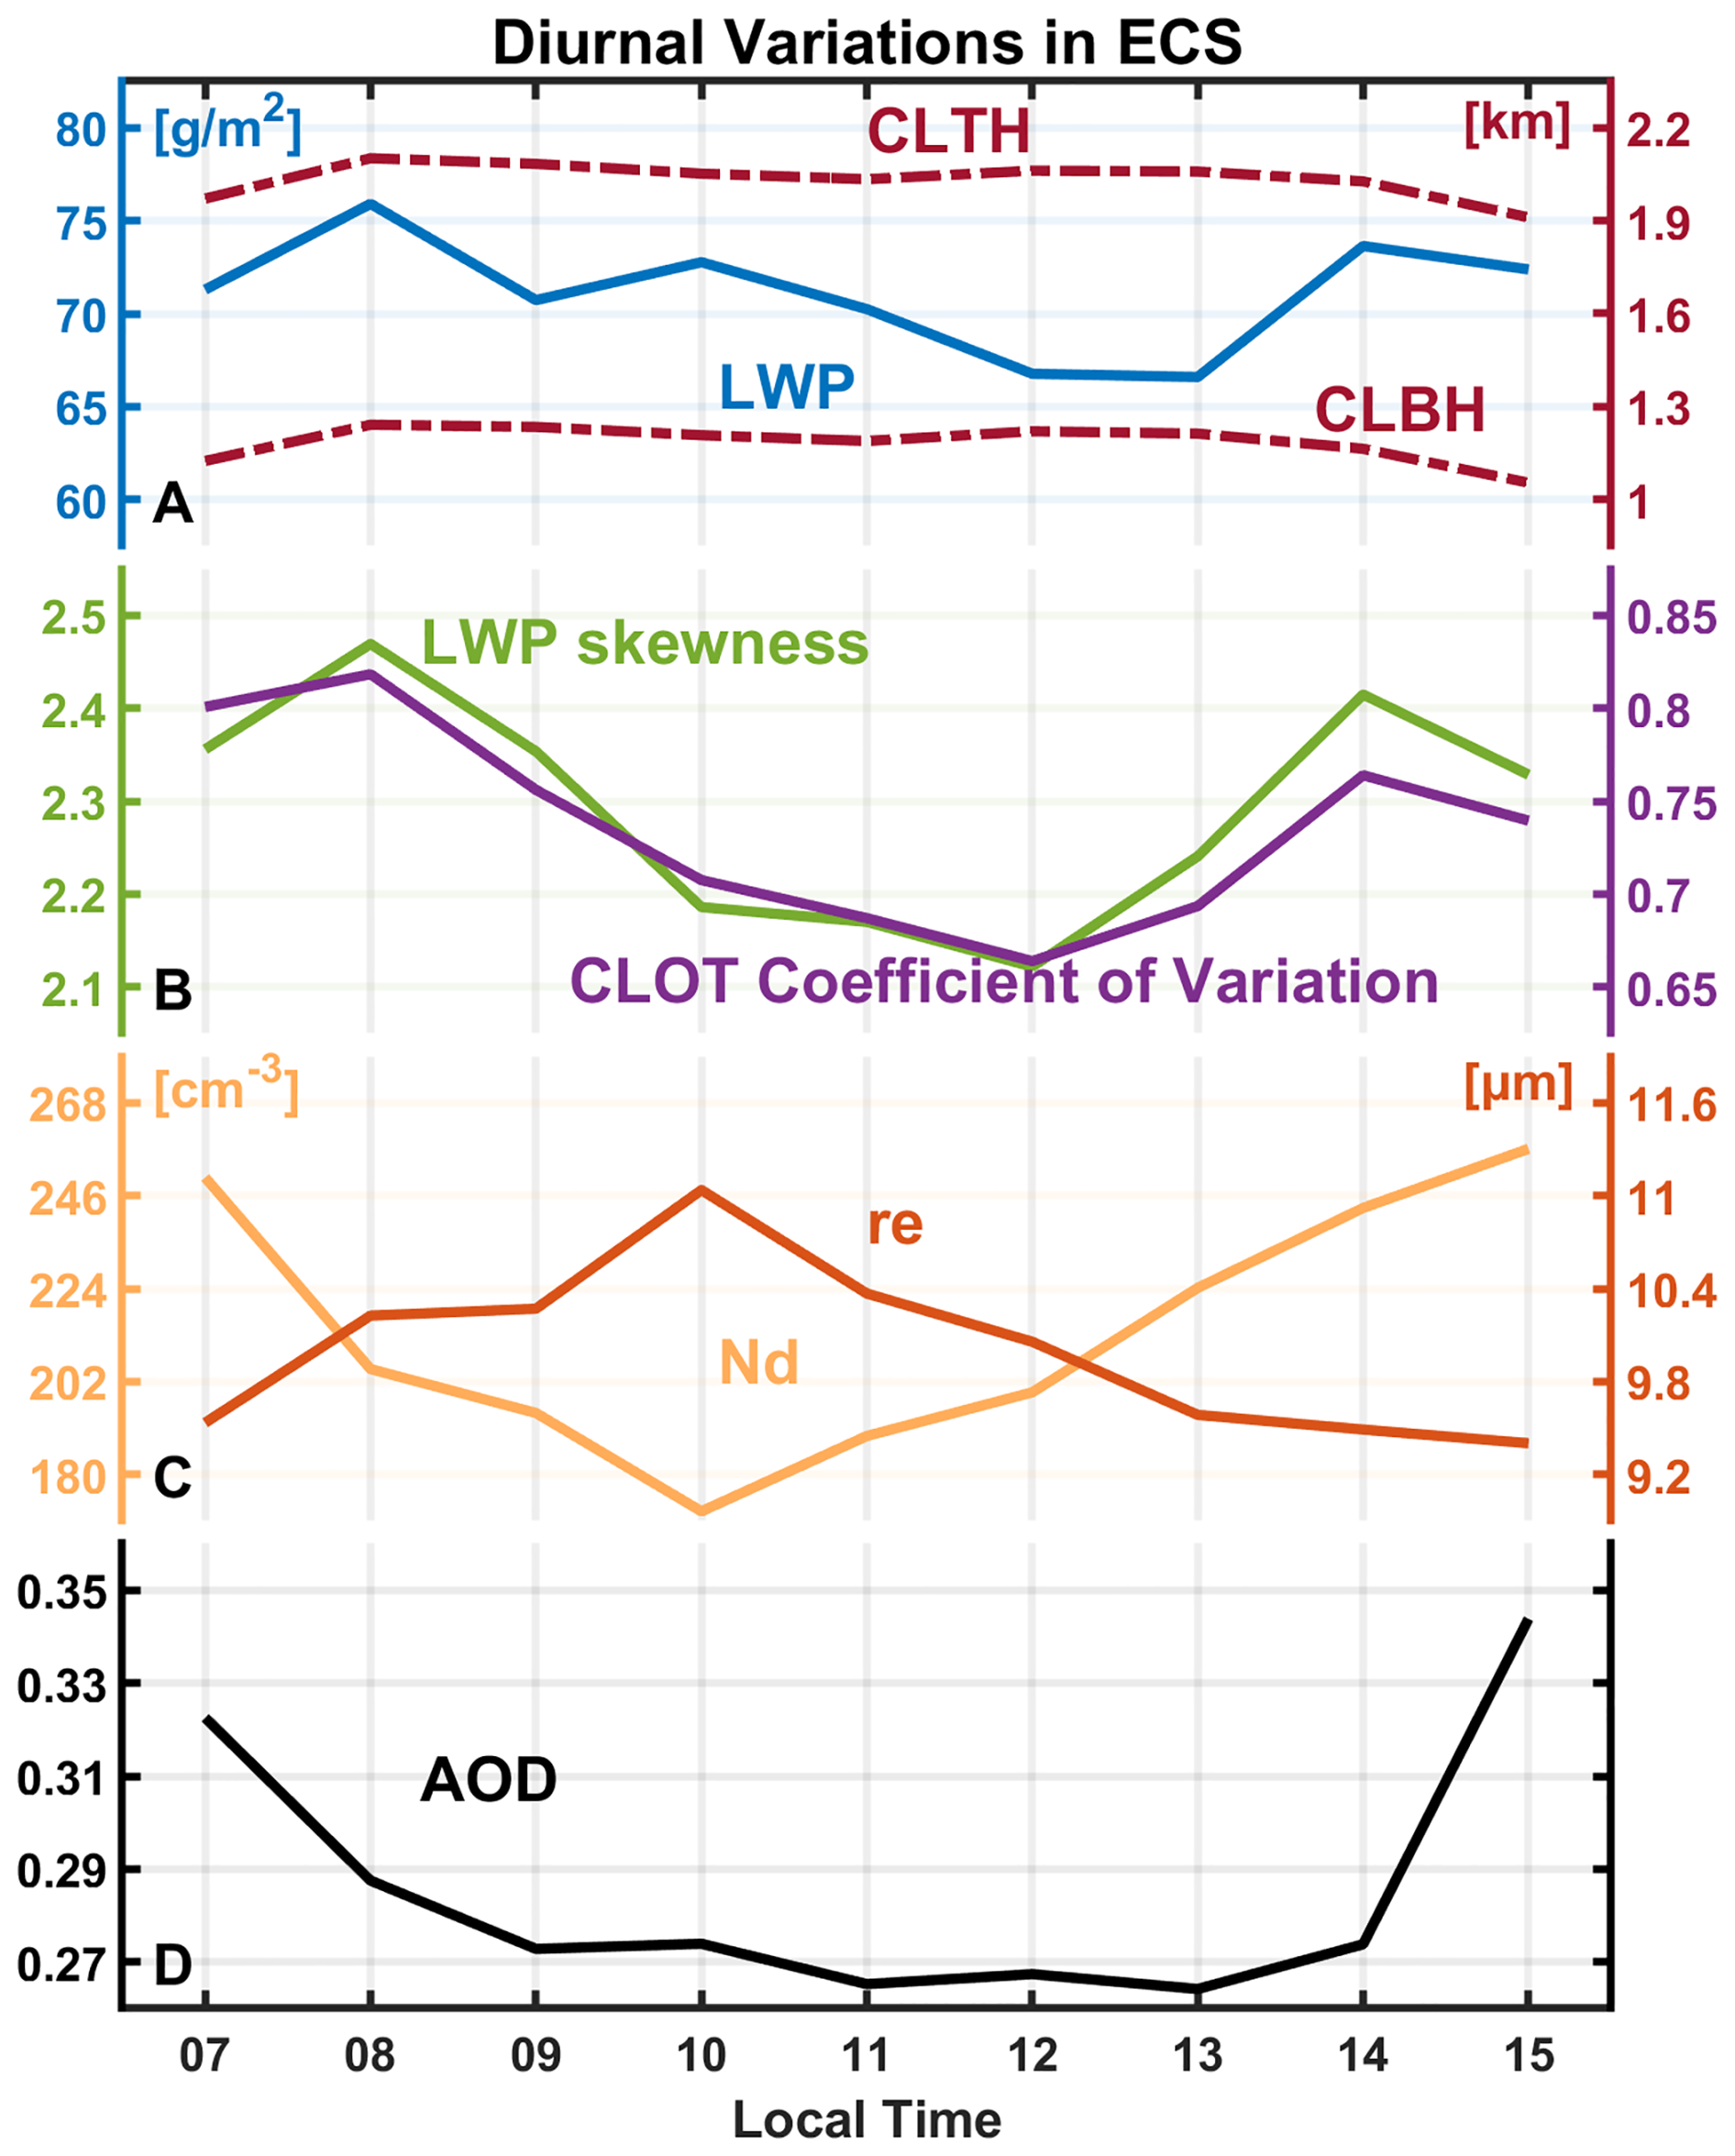
Figure 5Diurnal patterns in the ECS region. (A) Cloud liquid water path (LWP), cloud-top height (CLTH) and cloud base height (CLBH). (B) LWP skewness and coefficient of variation (cv) of cloud optical depth (CLOT) in the AUW region. (C) Cloud droplet number concentration (Nd) and effective radius (re). (D) Aerosol optical depth (AOD).
In the ECS region, the weakest cumulus activity occurs at 12:00 LT (the lowest LWP skewness in Fig. 5B), which may be attributed to solar insolation. In the Sc to Cu transition region, the decoupled cloud layer and subcloud layer are often separated by a stable transition layer, which has been widely observed by the Atlantic Stratocumulus Transition Experiment (ASTEX) conducted over the northeast Atlantic Ocean. Based on ASTEX, Rogers et al. (1995) suggested that the shortwave radiation would hinder convection during daytime by increasing the stability of the transition layer. Miller et al. (1998) extended this theory to the diurnal variations and hypothesized that the diurnal variation of Cu development was regulated by the stability of the transition layer.
In terms of microphysical properties,Nd in the ECS decreases before 10:00 LT and then increases. Variations of re are just the opposite except insignificant change since 13:00 LT. The crucial mechanism leading to such changes may be attributed to the weakest entrainment drying at 10:00 LT, resulting in the highest values of re and the lowest values of Nd. Such diurnal variations in entrainment have also been observed in other coastal areas. Caldwell et al. (2005) reported the weakest entrainment rate at 11:00 LT during the East Pacific Investigation of Climate (EPIC) stratocumulus cruise in 2001. Painemal et al. (2017) found the minimum of entrainment occurred between 09:00–11:00 LT over the northeast Pacific region, attributing the diurnal pattern to the turbulence caused by long-wave radiative cooling. Additionally, other factors may also contribute to the diurnal variations of Nd and re. For example, the changes before 10:00 LT may include the impacts of reducing aerosol loadings. Subsidence from both cloud top and bottom occurred after 13:00 LT may limit the entrainment and the continuous decline of re. Cumulus coupling may also contribute to the increase of Nd. Martin et al. (1995) found a local increase in Nd induced by the intrusion of cumulus clouds during ASTEX.
Based on the above mechanisms, the diurnal variation of LWP in the ECS region is relatively small, yet Nd exhibits a distinct diurnal pattern. Changes in Nd determine the slope of LWP adjustments at the ascending and descending branches of the V shape that correspond to the spatial variability. The Nd turning point between the two stages exhibits the same diurnal variation as the average Nd (Fig. S12). Before noon, a decrease in Nd weakens the positive branch (blue line in Fig. 3D), while the negative branch intensifies (purple line in Fig. 3D). Collectively, the two branches determine the diurnal variation of the overall LWP adjustments.
Given that the samples span four years across all seasons, a sensitivity analysis was conducted to assess the impact of seasonal variations. Overall, the diurnal LWP adjustment pattern is not sensitive to seasonal changes in the AUW region (black lines in Figs. S13F–S16F compared to Fig. 3D). Since the AUW region is a persistent stratocumulus area, the diurnal variations of cloud thickness remain consistent across all seasons, with the thickest clouds in the morning and the thinnest in the early afternoon, followed by a slow increase. It suggests that the decoupling process in the persistent Sc region is insensitive to the seasonal changes, leading to similar patterns of LWP adjustments. The ECS region exhibits seasonal differences (Figs. S13–S16). Among the total samples (173 181), spring, summer, autumn, and winter account for 31 %, 3 %, 22 %, and 44 %, respectively. Due to the limited summer samples (3 %), their results are statistically insignificant, especially after eliminating the samples with precipitation by applying the threshold (GPM = 0 mm h−1). The LWP adjustments in other seasons exhibit similar diurnal patterns and magnitudes, peaking at noon (black lines in Figs. S13F, S15–S16F). This similarity may be due to the weak seasonal variations in the diurnal patterns of LWP and Nd (not shown). The diurnal patterns of the ascending branch of the V shape during spring and winter align with the overall results (blue lines in Figs. S13F and S16F compared to Fig. 3D). The Nd minimum occurring at 10:00 LT coincides with the weakest positive LWP adjustments in the ascending branch. Among all seasons, autumn exhibits the lowest Nd, corresponding to the weakest positive LWP adjustments in the ascending branch (∼ 50 %/31 % lower than spring/winter) and the largest diurnal fluctuations (Fig. S15F). This may be attributed to the weakest cold-air advection during autumn (Fig. S22). The diurnal pattern of the descending branch in spring differs from other seasons (purple line in Fig. S13F), possibly due to the diurnal variation of entrainment rate which can be illustrated by the variation of CLTH. Here, based on the relationship between CLTH, ws (always negative) and entrainment rate (we) (Painemal et al., 2017), the diurnal variations of we can be qualitatively analyzed with the diurnal variations of CLTH and large-scale subsidence (ws) (Fig. S17). Before 13:00 LT, the variation of large-scale subsidence is unrelated to CLTH, thus the change in CLTH can only be attributed to the entrainment rate. The entrainment rate weakens before 11:00 LT, leading to a weakening of the negative LWP adjustments. It then strengthens until 13:00 LT, which enhances the negative LWP adjustments. After 13:00 LT, the observed decrease in CLTH is mainly attributed to an increase in large-scale subsidence. The enhanced subsidence further suppresses the entrainment rate, thereby weakening the negative LWP adjustments.
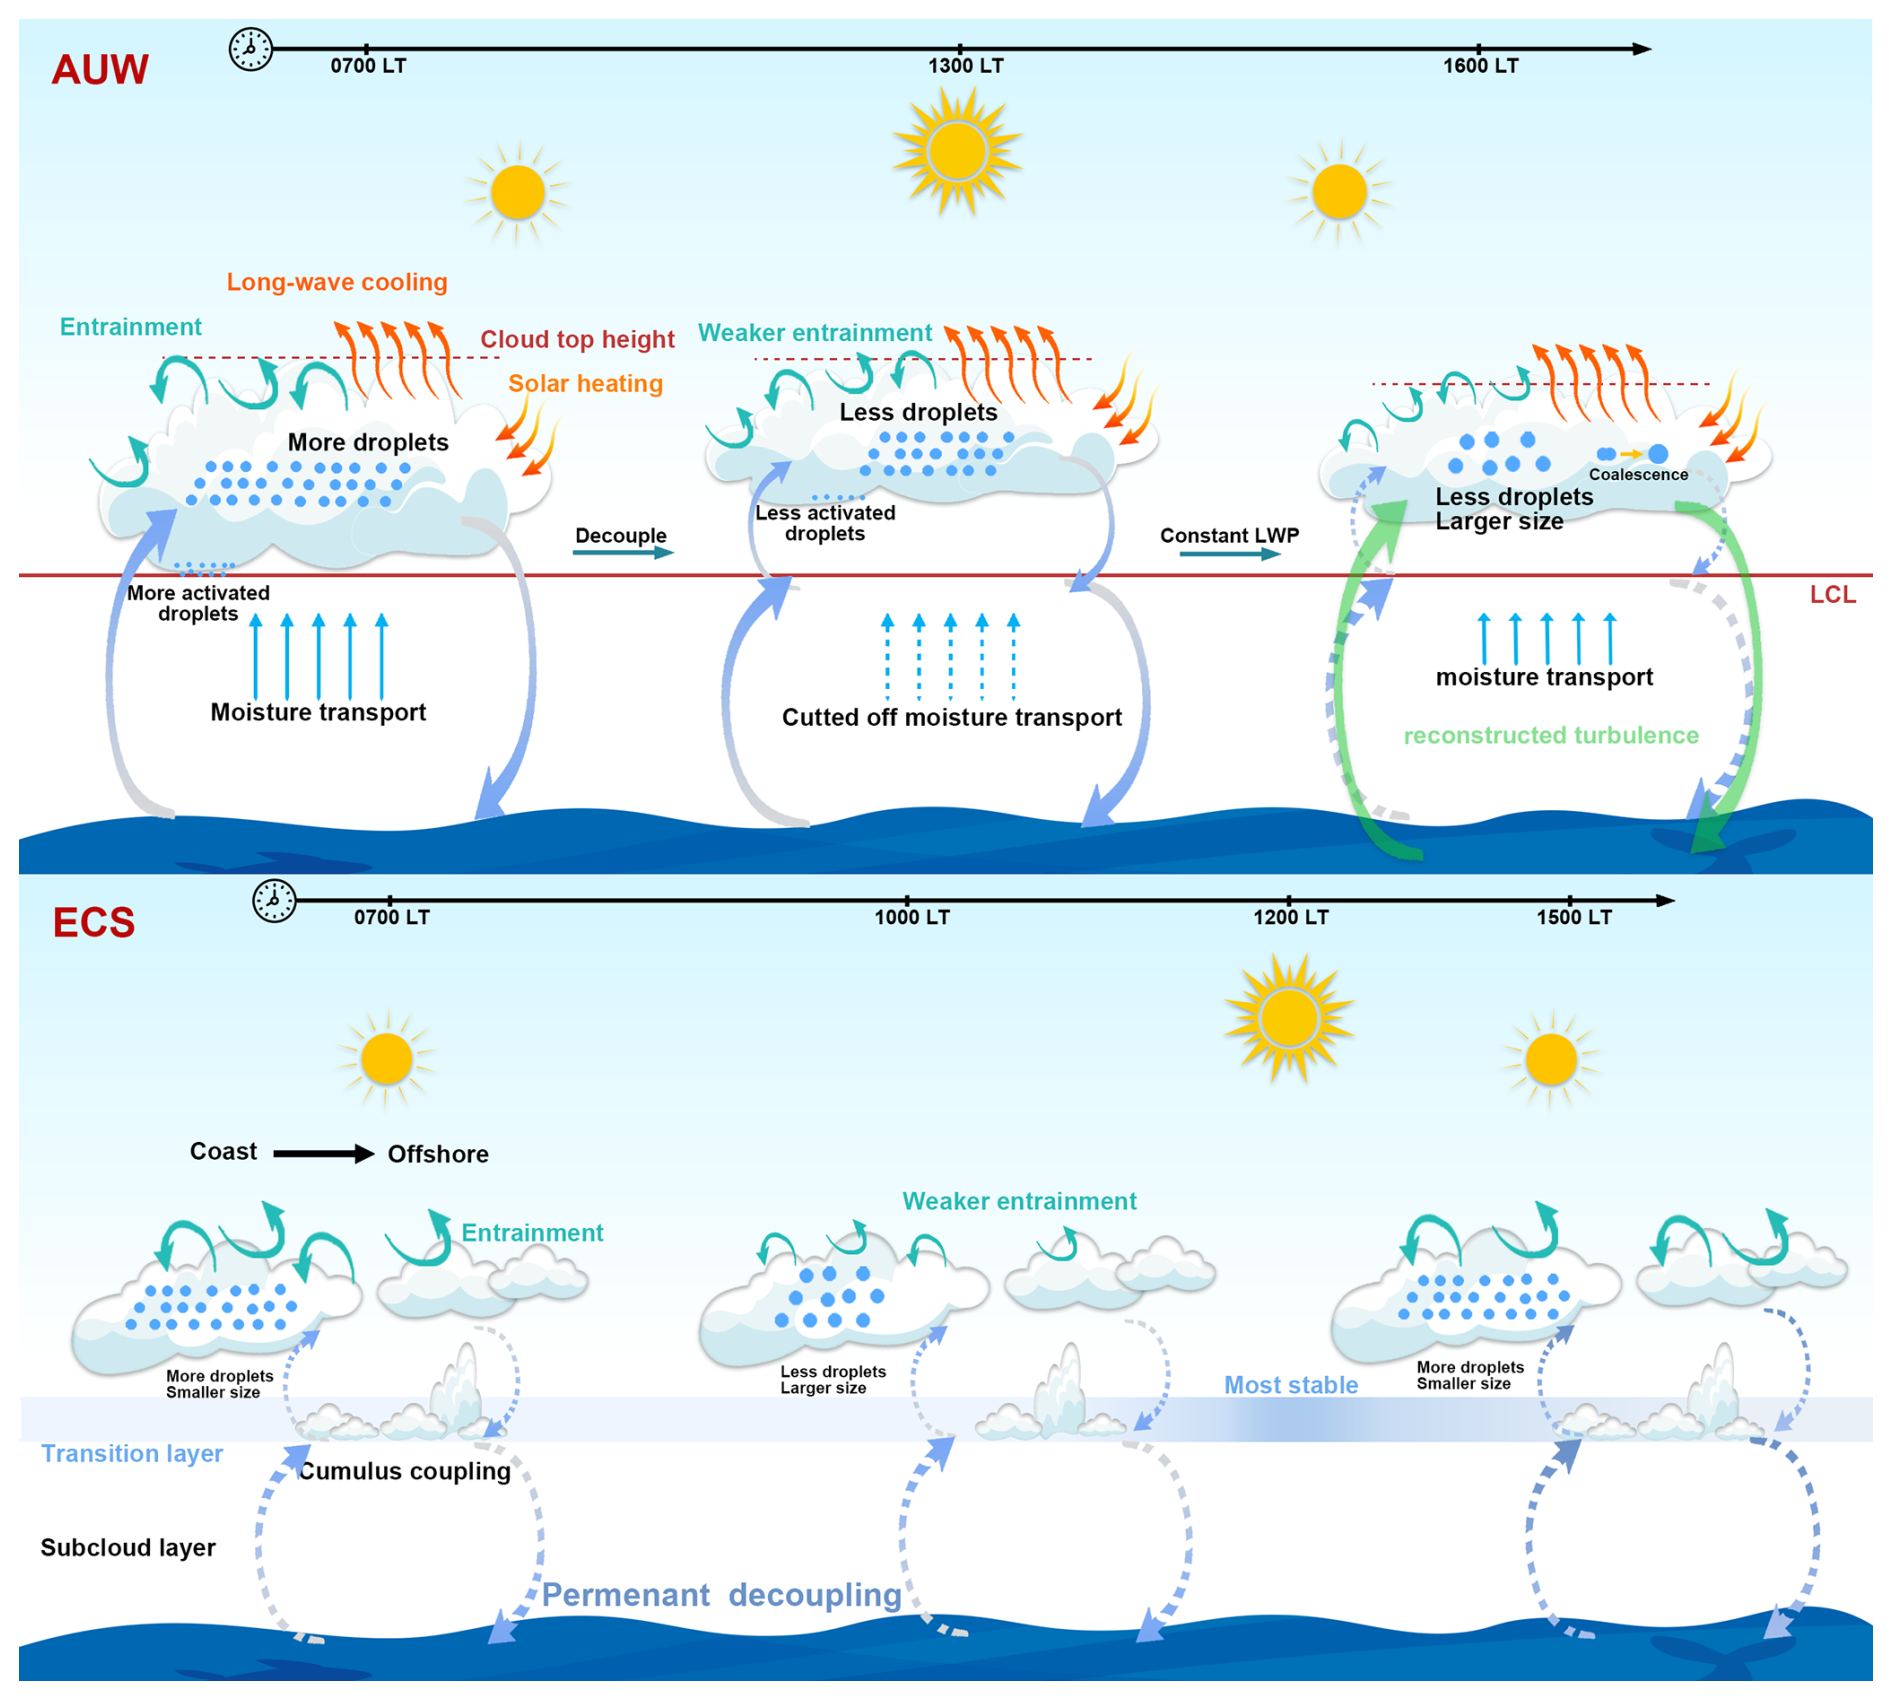
Figure 6Schematics of diurnal dominant mechanisms observed in the AUW and ECS. See text for details. Only the primary mechanisms are presented, while the relatively unimportant ones are omitted. Note that we represent the lifting condensation level (LCL) and transition layer at the same altitude for intuition. However, this depiction does not imply that their heights remain constant throughout the diurnal variation.
To summarize, Fig. 6 depicts schematics of the dominant mechanisms in the two regions. In the AUW region, the primary mechanism behind the diurnal variation of LWP adjustments is associated with the cloud thickness driven by MBL decoupling. The diurnal variation of LWP adjustments in the ECS region is jointly determined by the ascending and descending branches of the V shape, which is linked to the microphysical processes responsible for the diurnal variations of Nd (e.g., entrainment drying). Failure to accurately capture these diurnal variations in LWP adjustments and the underlying physical processes in observational studies may result in substantial inaccuracies in the quantification of regional and global LWP adjustments, and the associated radiative forcing.
As discussed above, regional geostationary observations reveal the significant impact of regional diurnal dynamic processes on LWP adjustments, ranging from −0.41 to −0.27 in the AUW and from −0.11 to 0.21 in the ECS. Assuming a constant LWP adjustment based on polar-orbiting snapshots, rather than considering its diurnal variations will ultimately affect the estimation of the aerosol indirect effect. The cloud albedo (Ac) susceptibility to aerosols perturbations is estimated as (Bellouin et al. 2020):
where S is the sensitivity of cloud albedo to Nd. Ac is calculated from τ based on a general expression for two-stream approximation solution (Glenn et al., 2020):
The first term of Eq. (6) refers to the changes in albedo due to the changes in Nd, while holding the LWP (i.e. Twomey effect). The second term, which accounts for LWP adjustment, can regulate the Twomey effect. The Twomey effect is completely offset when equals . Figure 7 shows the diurnal variations of S, calculated with Eq. (6) using the diurnal variations of both Ac and LWP adjustments. To isolate their individual influence, S was calculated using MODIS-averaged value for either Ac or LWP adjustments while retaining the diurnal variation for the other (Fig. S18). Given the minimal diurnal fluctuation in , the diurnal variations of S are mainly controlled by LWP adjustments. According to Fig. 7, if S is evaluated only at fixed moments in the AUW region (e.g. the average value during MODIS overpasses for Terra at 10:30 LT and Aqua at 13:30 LT), the cooling effect of S is consistently underestimated before 11:00 LT, with a maximum bias of 89 % at 08:00 LT. At 13:00 LT, S even turns negative, suggesting that albedo decreases with increasingNd, which has been reported in previous studies (Zhang et al., 2022). The negative S is possibly linked to strong decoupling over the AUW region at 13:00 LT as discussed in Sect. 3.2. In the ECS region, the associated bias spans from a 32 % overestimation at 07:00 LT to a 37 % underestimation at 15:00 LT. The results highlight the critical need to account for diurnal variations of LWP adjustments when assessing the aerosol indirect effect. This growing consensus among researchers underscores the importance of incorporating geostationary observations or high-resolution simulations to better constrain the diurnal effects of LWP adjustments (Qiu et al., 2024; Rahu et al., 2022; Smalley et al., 2024).
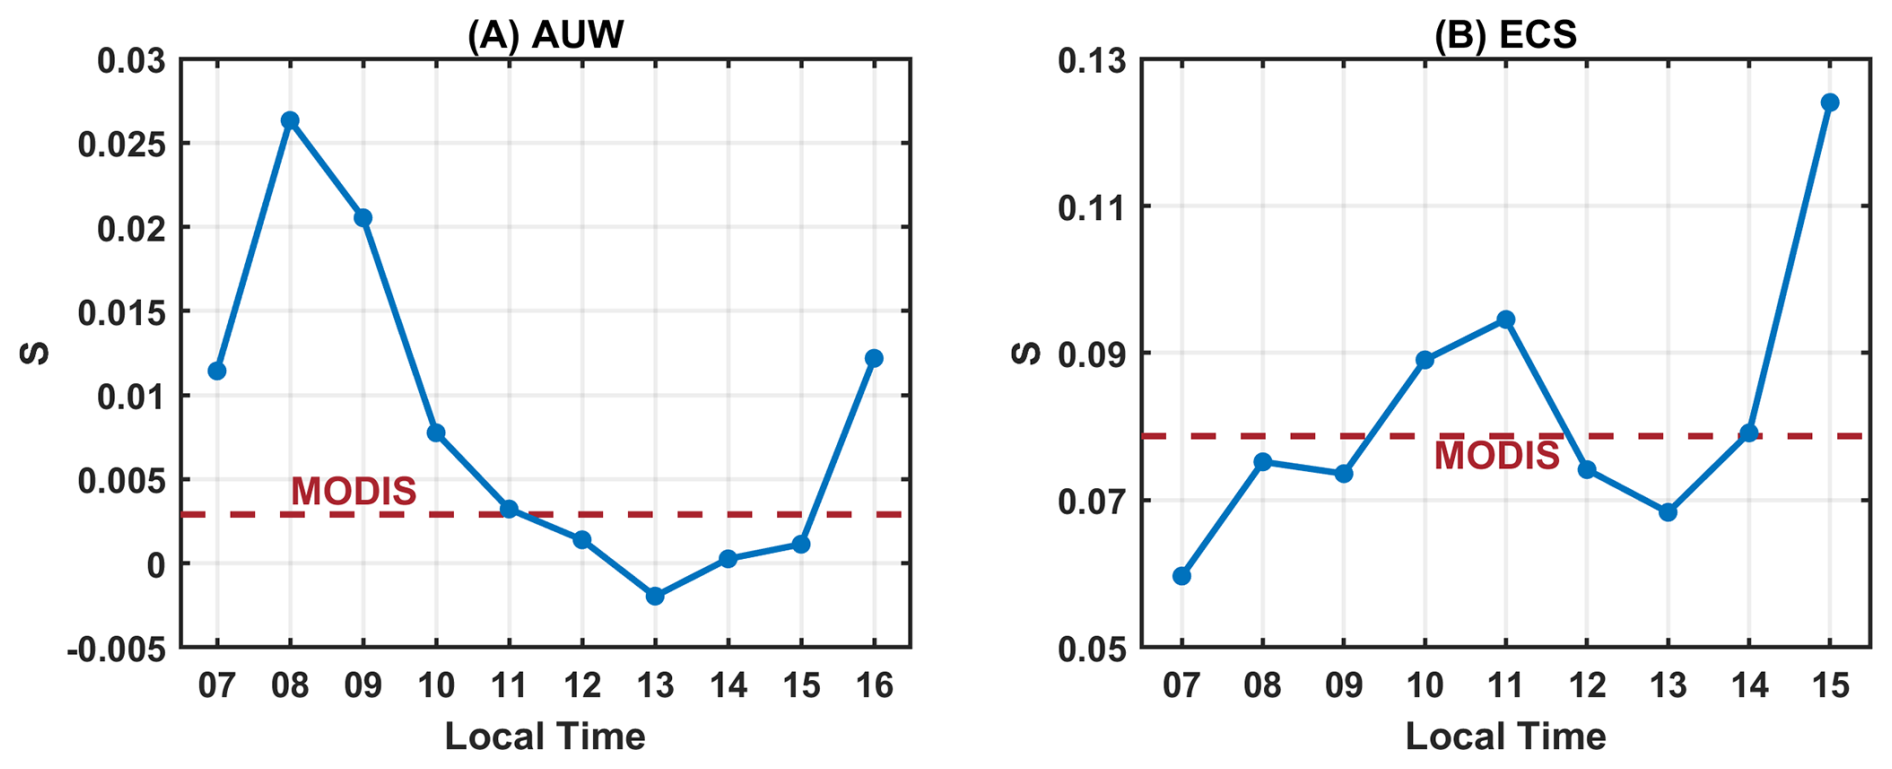
Figure 7The diurnal variations of S calculated by Eq. (6) in the (A) AUW and (B) ECS (blue lines). The red dashed lines represent the average values during MODIS Terra (10:30 LT) and Aqua (13:30 LT) overpasses.
Our observed diurnal LWP adjustment pattern in the AUW region is consistent with Qiu et al. (2024)'s findings in the eastern North Atlantic, where thick-thin cloud transitions dominated daytime variability. However, the main drivers emphasized in the two studies are different. Our results suggest that the diurnal variations of LWP adjustments seem governed by the physical processes under differing H conditions. Consequently, we attribute the diurnal variations in LWP adjustments mainly to temporal changes in boundary layer dynamical conditions. Furthermore, we conduct the same analyses in the ECS region with a completely different environmental background and obtain entirely different results. The Nd-LWP relationship exhibits a V shape pattern due to the geographical dependence of samples. This demonstrates that the significant regional differences in the diurnal variations of LWP adjustments, depending on aerosol loadings, cloud regimes and meteorological conditions.
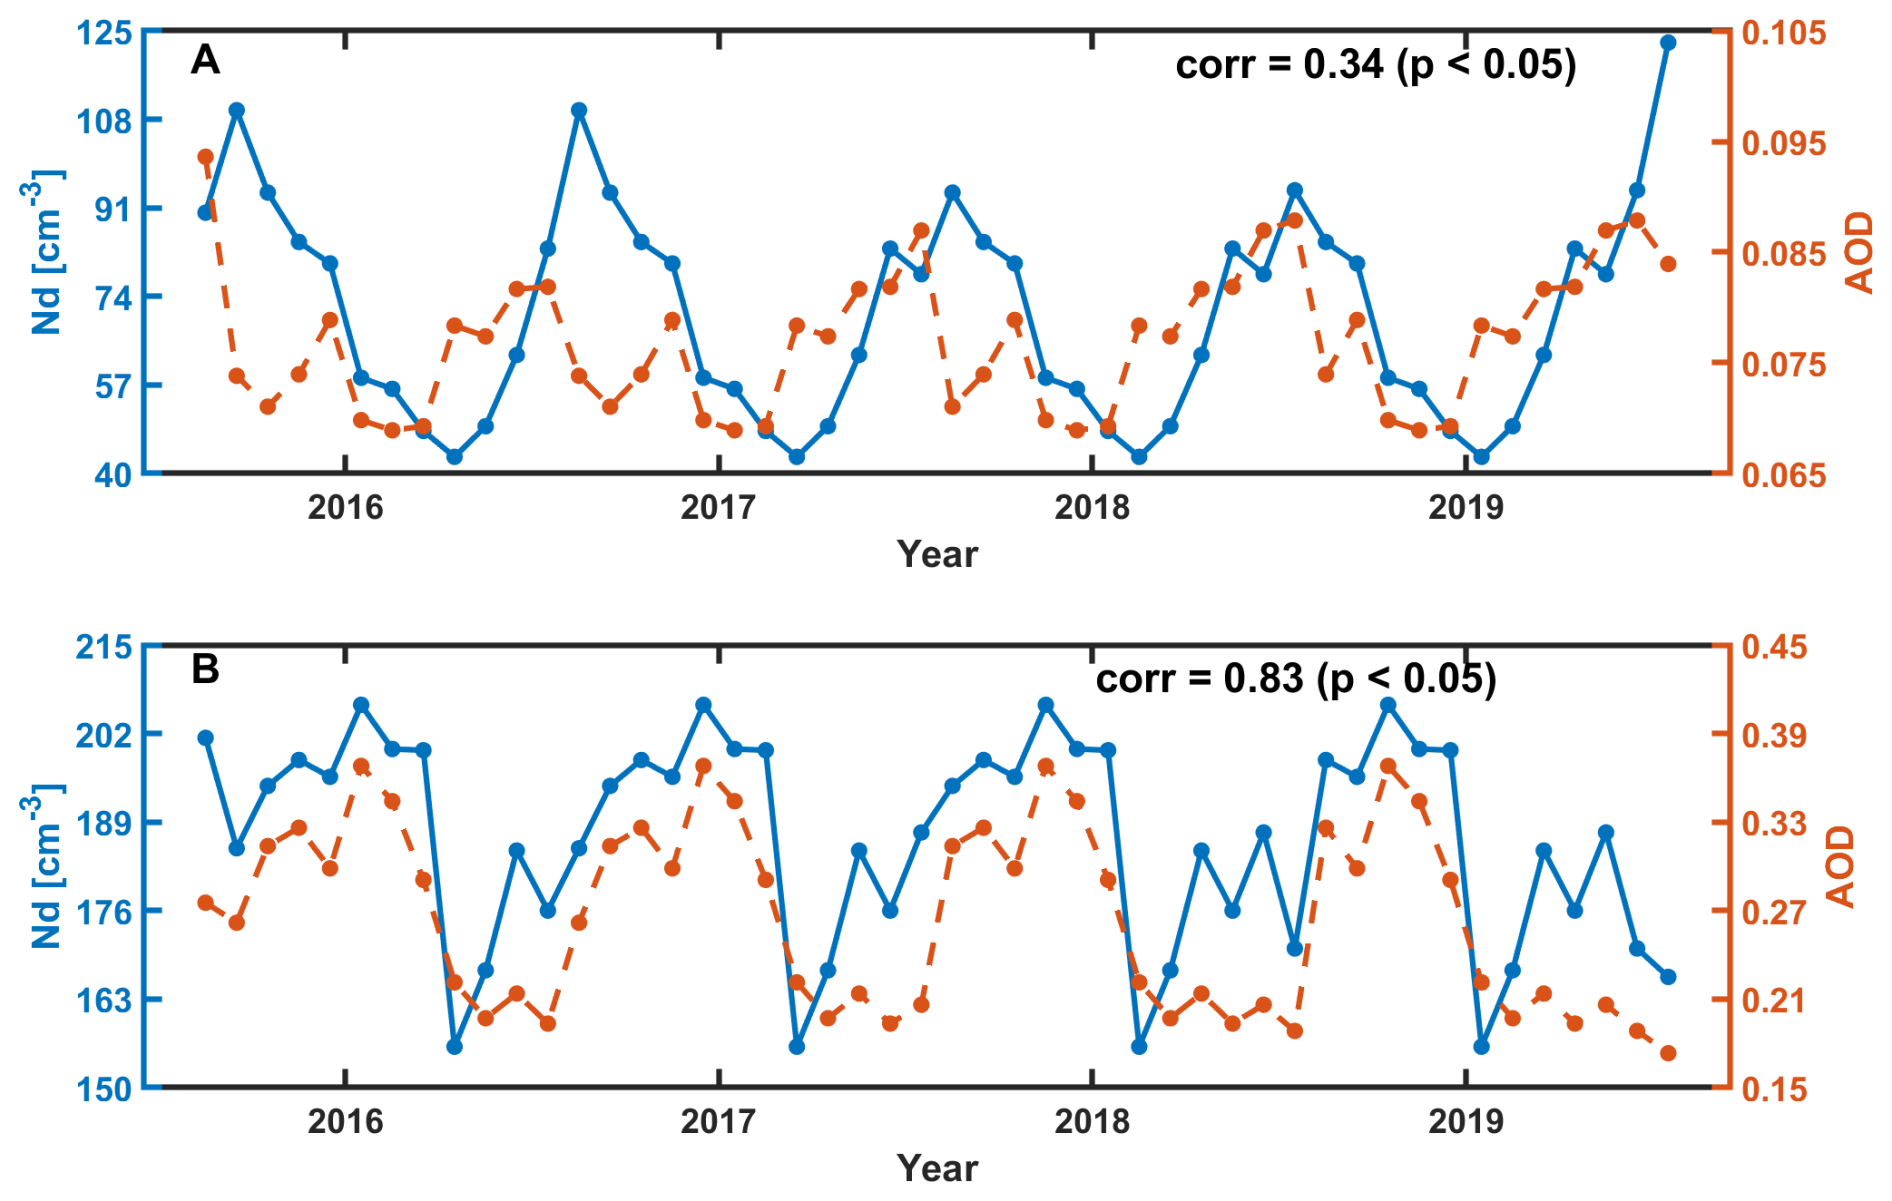
Figure 84-year long-term variations of Nd and aerosol optical depth (AOD) from MERRA-2 at 11:00 LT in the AUW (A) and ECS (B) region. The correlation coefficients (corr) between Nd and AOD are 0.34 and 0.83 (significant at the 95 % confidence level), respectively.
It is worth noting that our results also reveal diurnal variations of Nd, a core indicator in ACI, are also attributed to the MBL diurnal processes. While previous studies have analyzed the long-term variations of Nd, highlighting the key role of aerosols (Hu et al., 2021; Li et al., 2018; McCoy et al., 2015, 2018; Quaas et al., 2006), there is no good consistency between them in diurnal variations. This discrepancy may stem from previous polar-orbiting satellite observations at fixed times have overlooked the crucial role played by other physical mechanisms at different times. Figure 8 shows significant correlations observed between the 4-year long-term variations of AOD and Nd at 11:00 LT in both regions, particularly in the ECS with a correlation of 0.83. Meanwhile, both regions show the similar distribution patterns, with higherNd and smaller re near the continental coastal area, aligning with the average AOD spatial distribution (spatial correlation coefficients of 0.84 in the AUW and 0.91 in the ECS) (Fig. S1), suggesting a pronounced impact of anthropogenic activities on cloud microphysical properties on a long-term scale. Note that the correlations between AOD and Nd at certain fixed times are not statistically significant (not shown). This may be due to the relatively insignificant impact of aerosol effects at these moments, while other processes may exert a more pronounced influence. For example, strong boundary layer decoupling inhibits cloud droplet activations (Zeider et al., 2025). Mesoscale cloud organization can also introduce spatial heterogeneity in Nd independent of aerosol loading (Zhou and Feingold, 2023). Future research should broaden its scope to investigate the effects of other influencing factors on Nd at specific times, in addition to the role of aerosols. Moreover, in the context of global warming, whether these physical processes will be affected and consequently contribute to variations of Nd deserves further investigation.
Several limitations should be acknowledged in this study. First, the time-dependence of LWP adjustments we discussed differs from the cloud evolution process, emphasizing diurnal variations caused by changes in dominant mechanisms at different times rather than tracking the evolution of individual clouds. This approach may introduce uncertainties into our results since the full cloud life cycle and evolution are not the same with diurnal variations. The full cloud lifetime evolution associated with LWP adjustments is not within the scope of this study and warrants further exploration. Additionally, given the scarcity of observational data at fine scales, certain mechanisms are indirectly inferred from the observational index, which needs further microphysical-process-based in-situ observations as well as model simulations. Finally, uncertainties of retrievals have been discussed in Data and Methods, which provides further context for the limitations of this study.
This study reveals the diurnal variations of LWP adjustments and the possible mechanisms contributing to these variations in two specific regions with significant differences in cloud regimes, environmental conditions, and aerosol loadings. Important findings from this investigation are as follows:
-
In the AUW region, the overall negative LWP adjustments decrease from −0.27 to −0.41 before 13:00 LT and then increase to −0.34. The diurnal variations of LWP adjustments are insensitive to seasonality. Negative LWP adjustments become weaker as cloud thickness increases. The diurnal pattern is primarily associated with variations of cloud thickness induced by decoupling process of MBL.
-
In the ECS region, LWP increases at highNd (> ∼ 300 cm−3), leading to a V shape pattern of Nd-LWP relationship. Our results demonstrate the V shape is the manifestation of spatial variability in the ECS region. Specifically, the ECS serves as a coastal transition zone, experiencing the combined effects of continental and oceanic air masses. Coastal samples show a pronounced LWP increase with Nd, particularly for Nd > ∼ 300 cm−3, while offshore samples exhibit a negative Nd-LWP relationship, with most Nd values below ∼ 300 cm−3. The unique behaviour of LWP increasing at high Nd is attributed to the influence of northerly cold-air advection from the continent during the cold seasons (75 % of samples are from spring and winter). The aerosol-rich, relatively cold and dry air from continent reduces the stability of the sub-cloud layer, triggering the release of water vapor into the boundary layer and subsequently promoting cloud droplet activation and development of thicker clouds. These processes collectively lead to an increase in both Nd and LWP, resulting in a positive LWP adjustment at high Nd. The diurnal variations of LWP adjustments exhibit seasonal differences. Samples from winter and spring dominate the overall variations (accounting for 75 % of the total samples). The diurnal LWP adjustment pattern is determined by the combined diurnal variations of the ascending and descending branches of the V shape, which is likely attributed to the diurnal variation of Nd induced by entrainment.
-
The results indicate an underestimation of the cloud albedo sensitivity to aerosol perturbations by up to 89 % in the AUW region, while in the ECS region, the bias ranges from a 32 % overestimation at 07:00 LT to a 37 % underestimation at 15:00 LT. Furthermore, our results quantify the regional impact of boundary layer dynamic conditions on LWP adjustments. For example, the diurnal decoupling process in the AUW region results in a 219 % variation of LWP adjustments within the daytime relative to the daily mean (the diurnal variation range divided by the daily mean), assuming other conditions remain relatively unchanged.
Our research provides a detailed discussion for the diurnal variations of LWP adjustments and how they are influenced by existed boundary layer mechanisms. We underscore the importance of fully considering the covariations with environmental conditions, indicating different potential influencing factors on cloud brightening and radiative forcing in terms of the regional and diurnal daytime scale. It is a highly time-dependent variable lacking quantification and should be taken into consideration of future research in aerosol indirect effects on climate.
The datasets that support this study are all available to the public. The SatCORPS Himawari-8 product is available at https://asdc.larc.nasa.gov/project/CERES (last access: 27 November 2025). The MERRA-2 product is available at https://doi.org/10.5067/KLICLTZ8EM9D (GMAO, 2015). The GPM_3IMERGHHV07 is available at https://doi.org/10.5067/GPM/IMERG/3B-HH/07 (Huffman et al., 2023). ERA5 reanalysis data are available at https://cds.climate.copernicus.eu/ (last access: 27 November 2025). All data are available in the main text or the Supplement.
The supplement related to this article is available online at https://doi.org/10.5194/acp-25-17455-2025-supplement.
JiaL and YaW performed the analysis and organized the original manuscript. JimL and YaW conceptualized the study and reviewed the manuscript. WZ assisted in data analysis and validation. LZ and YuW assisted in the investigation and the final review and editing of the manuscript.
The contact author has declared that none of the authors has any competing interests.
Publisher's note: Copernicus Publications remains neutral with regard to jurisdictional claims made in the text, published maps, institutional affiliations, or any other geographical representation in this paper. While Copernicus Publications makes every effort to include appropriate place names, the final responsibility lies with the authors. Views expressed in the text are those of the authors and do not necessarily reflect the views of the publisher.
We would like to acknowledge ChatGPT for its role in polishing the language for the text. We would like to acknowledge Freepik for supporting icons used in our schematics (http://www.freepik.com, last access: 27 November 2025).
This research has been supported by the Key Program of the National Natural Science Foundation of China (42430601), the Major Program of the National Natural Science Foundation of China (42090030), the National Natural Science Foundation of China (42175087), and the Science and Technology Project of Gansu Province (Outstanding Youth Fund, 24JRRA386).
This paper was edited by Yi Huang and reviewed by three anonymous referees.
Ackerman, A. S., Kirkpatrick, M. P., Stevens, D. E., and Toon, O. B.: The impact of humidity above stratiform clouds on indirect aerosol climate forcing, Nature, 432, 1014–1017, https://doi.org/10.1038/nature03174, 2004.
Albrecht, B. A.: Aerosols, Cloud Microphysics, and Fractional Cloudiness, Science, 245, 1227–1230, https://doi.org/10.1126/science.245.4923.1227, 1989.
Albrecht, B. A., Bretherton, C. S., Johnson, D., Scubert, W. H., and Frisch, A. S.: The Atlantic Stratocumulus Transition Experiment – ASTEX, Bulletin of the American Meteorological Society, 76, 889–904, https://doi.org/10.1175/1520-0477(1995)076<0889:TASTE>2.0.CO;2, 1995.
Bellouin, N., Quaas, J., Gryspeerdt, E., Kinne, S., Stier, P., Watson-Parris, D., Boucher, O., Carslaw, K. S., Christensen, M., Daniau, A.-L., Dufresne, J.-L., Feingold, G., Fiedler, S., Forster, P., Gettelman, A., Haywood, J. M., Lohmann, U., Malavelle, F., Mauritsen, T., McCoy, D. T., Myhre, G., Mülmenstädt, J., Neubauer, D., Possner, A., Rugenstein, M., Sato, Y., Schulz, M., Schwartz, S. E., Sourdeval, O., Storelvmo, T., Toll, V., Winker, D., and Stevens, B.: Bounding Global Aerosol Radiative Forcing of Climate Change, Rev. Geophys., 58, https://doi.org/10.1029/2019RG000660, 2020.
Bender, F. A.-M., Frey, L., McCoy, D. T., Grosvenor, D. P., and Mohrmann, J. K.: Assessment of aerosol–cloud–radiation correlations in satellite observations, climate models and reanalysis, Clim. Dyn., 52, 4371–4392, https://doi.org/10.1007/s00382-018-4384-z, 2019.
Bennartz, R.: Global assessment of marine boundary layer cloud droplet number concentration from satellite, J. Geophys. Res., 112, D02201, https://doi.org/10.1029/2006JD007547, 2007.
Bennartz, R. and Rausch, J.: Global and regional estimates of warm cloud droplet number concentration based on 13 years of AQUA-MODIS observations, Atmos. Chem. Phys., 17, 9815–9836, https://doi.org/10.5194/acp-17-9815-2017, 2017.
Boers, R., Acarreta, J. R., and Gras, J. L.: Satellite monitoring of the first indirect aerosol effect: Retrieval of the droplet concentration of water clouds, Journal of Geophysical Research: Atmospheres, 111, https://doi.org/10.1029/2005JD006838, 2006.
Bougeault, P.: The Diurnal Cycle of the Marine Stratocumulus Layer: A Higher-Order Model Study, Journal of the Atmospheric Sciences, 42, 2826–2843, https://doi.org/10.1175/1520-0469(1985)042<2826:TDCOTM>2.0.CO;2, 1985.
Brenguier, J.-L., Burnet, F., and Geoffroy, O.: Cloud optical thickness and liquid water path – does the k coefficient vary with droplet concentration?, Atmos. Chem. Phys., 11, 9771–9786, https://doi.org/10.5194/acp-11-9771-2011, 2011.
Bretherton, C. S., Uttal, T., Fairall, C. W., Yuter, S. E., Weller, R. A., Baumgardner, D., Comstock, K., Wood, R., and Raga, G. B.: The Epic 2001 Stratocumulus Study, Bulletin of the American Meteorological Society, 85, 967–978, https://doi.org/10.1175/BAMS-85-7-967, 2004.
Bretherton, C. S., Blossey, P. N., and Uchida, J.: Cloud droplet sedimentation, entrainment efficiency, and subtropical stratocumulus albedo, Geophysical Research Letters, 34, 2006GL027648, https://doi.org/10.1029/2006GL027648, 2007.
Buchard, V., Randles, C. A., Silva, A. M. da, Darmenov, A., Colarco, P. R., Govindaraju, R., Ferrare, R., Hair, J., Beyersdorf, A. J., Ziemba, L. D., and Yu, H.: The MERRA-2 Aerosol Reanalysis, 1980 Onward. Part II: Evaluation and Case Studies, Journal of Climate, 30, 6851–6872, https://doi.org/10.1175/JCLI-D-16-0613.1, 2017.
Caldwell, P., Bretherton, C. S., and Wood, R.: Mixed-Layer Budget Analysis of the Diurnal Cycle of Entrainment in Southeast Pacific Stratocumulus, Journal of the Atmospheric Sciences, 62, 3775–3791, https://doi.org/10.1175/JAS3561.1, 2005.
Chen, Y.-C., Christensen, M. W., Stephens, G. L., and Seinfeld, J. H.: Satellite-based estimate of global aerosol–cloud radiative forcing by marine warm clouds, Nature Geosci., 7, 643–646, https://doi.org/10.1038/ngeo2214, 2014.
Christensen, M. W. and Stephens, G. L.: Microphysical and macrophysical responses of marine stratocumulus polluted by underlying ships: Evidence of cloud deepening, J. Geophys. Res., 116, D03201, https://doi.org/10.1029/2010JD014638, 2011.
Coakley, J. A. and Walsh, C. D.: Limits to the Aerosol Indirect Radiative Effect Derived from Observations of Ship Tracks, Journal of the Atmospheric Sciences, 59, 668–680, https://doi.org/10.1175/1520-0469(2002)059<0668:LTTAIR>2.0.CO;2, 2002.
Duynkerke, P. G. and Hignett, P.: Simulation of Diurnal Variation in a Stratocumulus-capped Marine Boundary Layer during FIRE, Monthly Weather Review, 121, 3291–3300, https://doi.org/10.1175/1520-0493(1993)121<3291:SODVIA>2.0.CO;2, 1993.
Feingold, G., Ghate, V. P., Russell, L. M., Blossey, P., Cantrell, W., Christensen, M. W., Diamond, M. S., Gettelman, A., Glassmeier, F., Gryspeerdt, E., Haywood, J., Hoffmann, F., Kaul, C. M., Lebsock, M., McComiskey, A. C., McCoy, D. T., Ming, Y., Mülmenstädt, J., Possner, A., Prabhakaran, P., Quinn, P. K., Schmidt, K. S., Shaw, R. A., Singer, C. E., Sorooshian, A., Toll, V., Wan, J. S., Wood, R., Yang, F., Zhang, J., and Zheng, X.: Physical science research needed to evaluate the viability and risks of marine cloud brightening, Sci. Adv., 10, eadi8594, https://doi.org/10.1126/sciadv.adi8594, 2024.
Fons, E., Runge, J., Neubauer, D., and Lohmann, U.: Stratocumulus adjustments to aerosol perturbations disentangled with a causal approach, npj Clim. Atmos. Sci., 6, 130, https://doi.org/10.1038/s41612-023-00452-w, 2023.
George, R. C. and Wood, R.: Subseasonal variability of low cloud radiative properties over the southeast Pacific Ocean, Atmos. Chem. Phys., 10, 4047–4063, https://doi.org/10.5194/acp-10-4047-2010, 2010.
Ghosh, S., Osborne, S., and Smith, M. H.: On the importance of cumulus penetration on the microphysical and optical properties of stratocumulus clouds, Atmos. Chem. Phys., 5, 755–765, https://doi.org/10.5194/acp-5-755-2005, 2005.
Glassmeier, F., Hoffmann, F., Johnson, J. S., Yamaguchi, T., Carslaw, K. S., and Feingold, G.: Aerosol-cloud-climate cooling overestimated by ship-track data, Science, 371, 485–489, https://doi.org/10.1126/science.abd3980, 2021.
Glenn, I. B., Feingold, G., Gristey, J. J., and Yamaguchi, T.: Quantification of the Radiative Effect of Aerosol–Cloud Interactions in Shallow Continental Cumulus Clouds, J. Atmos. Sci., 77, 2905–2920, https://doi.org/10.1175/JAS-D-19-0269.1, 2020.
Global Modeling and Assimilation Office (GMAO): MERRA-2 tavg1_2d_aer_Nx: 2d,1-Hourly,Time-averaged,Single-Level,Assimilation,Aerosol Diagnostics V5.12.4, Goddard Earth Sciences Data and Information Services Center (GES DISC), Greenbelt, MD, USA [data set], https://doi.org/10.5067/KLICLTZ8EM9D, 2015.
Goren, T., Choudhury, G., Kretzschmar, J., and McCoy, I.: Co-variability drives the inverted-V sensitivity between liquid water path and droplet concentrations, Atmos. Chem. Phys., 25, 3413–3423, https://doi.org/10.5194/acp-25-3413-2025, 2025.
Grosvenor, D. P., Sourdeval, O., Zuidema, P., Ackerman, A., Alexandrov, M. D., Bennartz, R., Boers, R., Cairns, B., Chiu, J. C., Christensen, M., Deneke, H., Diamond, M., Feingold, G., Fridlind, A., Hünerbein, A., Knist, C., Kollias, P., Marshak, A., McCoy, D., Merk, D., Painemal, D., Rausch, J., Rosenfeld, D., Russchenberg, H., Seifert, P., Sinclair, K., Stier, P., van Diedenhoven, B., Wendisch, M., Werner, F., Wood, R., Zhang, Z., and Quaas, J.: Remote Sensing of Droplet Number Concentration in Warm Clouds: A Review of the Current State of Knowledge and Perspectives, Reviews of Geophysics, 56, 409–453, https://doi.org/10.1029/2017RG000593, 2018.
Gryspeerdt, E., Goren, T., Sourdeval, O., Quaas, J., Mülmenstädt, J., Dipu, S., Unglaub, C., Gettelman, A., and Christensen, M.: Constraining the aerosol influence on cloud liquid water path, Atmos. Chem. Phys., 19, 5331–5347, https://doi.org/10.5194/acp-19-5331-2019, 2019.
Gryspeerdt, E., Goren, T., and Smith, T. W. P.: Observing the timescales of aerosol–cloud interactions in snapshot satellite images, Atmos. Chem. Phys., 21, 6093–6109, https://doi.org/10.5194/acp-21-6093-2021, 2021.
Gryspeerdt, E., Glassmeier, F., Feingold, G., Hoffmann, F., and Murray-Watson, R. J.: Observing short-timescale cloud development to constrain aerosol–cloud interactions, Atmos. Chem. Phys., 22, 11727–11738, https://doi.org/10.5194/acp-22-11727-2022, 2022a.
Gryspeerdt, E., McCoy, D. T., Crosbie, E., Moore, R. H., Nott, G. J., Painemal, D., Small-Griswold, J., Sorooshian, A., and Ziemba, L.: The impact of sampling strategy on the cloud droplet number concentration estimated from satellite data, Atmos. Meas. Tech., 15, 3875–3892, https://doi.org/10.5194/amt-15-3875-2022, 2022b.
Gryspeerdt, E., Povey, A. C., Grainger, R. G., Hasekamp, O., Hsu, N. C., Mulcahy, J. P., Sayer, A. M., and Sorooshian, A.: Uncertainty in aerosol–cloud radiative forcing is driven by clean conditions, Atmos. Chem. Phys., 23, 4115–4122, https://doi.org/10.5194/acp-23-4115-2023, 2023.
Hersbach, H., Bell, B., Berrisford, P., Hirahara, S., Horányi, A., Muñoz-Sabater, J., Nicolas, J., Peubey, C., Radu, R., Schepers, D., Simmons, A., Soci, C., Abdalla, S., Abellan, X., Balsamo, G., Bechtold, P., Biavati, G., Bidlot, J., Bonavita, M., De Chiara, G., Dahlgren, P., Dee, D., Diamantakis, M., Dragani, R., Flemming, J., Forbes, R., Fuentes, M., Geer, A., Haimberger, L., Healy, S., Hogan, R. J., Hólm, E., Janisková, M., Keeley, S., Laloyaux, P., Lopez, P., Lupu, C., Radnoti, G., de Rosnay, P., Rozum, I., Vamborg, F., Villaume, S., and Thépaut, J.-N.: The ERA5 global reanalysis, Quarterly Journal of the Royal Meteorological Society, 146, 1999–2049, https://doi.org/10.1002/qj.3803, 2020.
Heus, T., Dijk, G. van, Jonker, H. J. J., and Akker, H. E. A. V. den: Mixing in Shallow Cumulus Clouds Studied by Lagrangian Particle Tracking, J. Atmos. Sci., 65, 2581–2597, https://doi.org/10.1175/2008JAS2572.1, 2008.
Hu, Y., Lu, X., Zhai, P.-W., Hostetler, C. A., Hair, J. W., Cairns, B., Sun, W., Stamnes, S., Omar, A., Baize, R., Videen, G., Mace, J., McCoy, D. T., McCoy, I. L., and Wood, R.: Liquid Phase Cloud Microphysical Property Estimates From CALIPSO Measurements, Front. Remote Sens., 2, https://doi.org/10.3389/frsen.2021.724615, 2021.
Huffman, G. J., Bolvin, D. T., Braithwaite, D., Hsu, K.-L., Joyce, R. J., Kidd, C., Nelkin, E. J., Sorooshian, S., Stocker, E. F., Tan, J., Wolff, D. B., and Xie, P.: Integrated Multi-satellite Retrievals for the Global Precipitation Measurement (GPM) Mission (IMERG), in: Satellite Precipitation Measurement: Volume 1, edited by: Levizzani, V., Kidd, C., Kirschbaum, D. B., Kummerow, C. D., Nakamura, K., and Turk, F. J., Springer International Publishing, Cham, 343–353, https://doi.org/10.1007/978-3-030-24568-9_19, 2020.
Huffman, G. J., Stocker, E. F., Bolvin, D. T., Nelkin, E. J., and Tan, J.: GPM IMERG Final Precipitation L3 Half Hourly 0.1 degree x 0.1 degree V07, Goddard Earth Sciences Data and Information Services Center (GES DISC), Greenbelt, MD [data set], https://doi.org/10.5067/GPM/IMERG/3B-HH/07, 2023.
IPCC: The Earth's Energy Budget, Climate Feedbacks and Climate Sensitivity, in: Climate Change 2021 – The Physical Science Basis: Working Group I Contribution to the Sixth Assessment Report of the Intergovernmental Panel on Climate Change, Cambridge University Press, 923–1054, https://doi.org/10.1017/9781009157896.009, 2023.
Jian, B., Li, J., Wang, G., Zhao, Y., Li, Y., Wang, J., Zhang, M., and Huang, J.: Evaluation of the CMIP6 marine subtropical stratocumulus cloud albedo and its controlling factors, Atmos. Chem. Phys., 21, 9809–9828, https://doi.org/10.5194/acp-21-9809-2021, 2021.
Jiang, X., Su, H., Jiang, J. H., Neelin, J. D., Wu, L., Tsushima, Y., and Elsaesser, G.: Muted extratropical low cloud seasonal cycle is closely linked to underestimated climate sensitivity in models, Nat. Commun., 14, 5586, https://doi.org/10.1038/s41467-023-41360-0, 2023.
Kang, L., Marchand, R., and Smith, W.: Evaluation of MODIS and Himawari-8 Low Clouds Retrievals Over the Southern Ocean With In Situ Measurements From the SOCRATES Campaign, Earth and Space Science, 8, https://doi.org/10.1029/2020EA001397, 2021.
Kazil, J., Yamaguchi, T., and Feingold, G.: Mesoscale organization, entrainment, and the properties of a closed-cell stratocumulus cloud, Journal of Advances in Modeling Earth Systems, 9, 2214–2229, https://doi.org/10.1002/2017MS001072, 2017.
Klein, S. A. and Hartmann, D. L.: The Seasonal Cycle of Low Stratiform Clouds, Journal of Climate, 6, 1587–1606, https://doi.org/10.1175/1520-0442(1993)006<1587:TSCOLS>2.0.CO;2, 1993.
Li, J., Jian, B., Huang, J., Hu, Y., Zhao, C., Kawamoto, K., Liao, S., and Wu, M.: Long-term variation of cloud droplet number concentrations from space-based Lidar, Remote Sensing of Environment, 213, 144–161, https://doi.org/10.1016/j.rse.2018.05.011, 2018.
Liu, J.-W., Xie, S.-P., Yang, S., and Zhang, S.-P.: Low-Cloud Transitions across the Kuroshio Front in the East China Sea, Journal of Climate, 29, 4429–4443, https://doi.org/10.1175/JCLI-D-15-0589.1, 2016.
Long, J., Wang, Y., Zhang, S., and Liu, J.: Transition of Low Clouds in the East China Sea and Kuroshio Region in Winter: A Regional Atmospheric Model Study, Journal of Geophysical Research: Atmospheres, 125, e2020JD032509, https://doi.org/10.1029/2020JD032509, 2020.
Lu, X., Mao, F., Rosenfeld, D., Zhu, Y., Zang, L., Pan, Z., and Gong, W.: The Temperature Control of Cloud Adiabatic Fraction and Coverage, Geophysical Research Letters, 50, e2023GL105831, https://doi.org/10.1029/2023GL105831, 2023.
Martin, G. M., Johnson, D. W., and Spice, A.: The Measurement and Parameterization of Effective Radius of Droplets in Warm Stratocumulus Clouds, Journal of the Atmospheric Sciences, 51, 1823–1842, https://doi.org/10.1175/1520-0469(1994)051<1823:TMAPOE>2.0.CO;2, 1994.
Martin, G. M., Johnson, D. W., Rogers, D. P., Jonas, P. R., Minnis, P., and Hegg, D. A.: Observations of the Interaction between Cumulus Clouds and Warm Stratocumulus Clouds in the Marine Boundary Layer during ASTEX, Journal of the Atmospheric Sciences, 52, 2902–2922, https://doi.org/10.1175/1520-0469(1995)052<2902:OOTIBC>2.0.CO;2, 1995.
McCoy, D. T., Burrows, S. M., Wood, R., Grosvenor, D. P., Elliott, S. M., Ma, P.-L., Rasch, P. J., and Hartmann, D. L.: Natural aerosols explain seasonal and spatial patterns of Southern Ocean cloud albedo, Sci. Adv., 1, e1500157, https://doi.org/10.1126/sciadv.1500157, 2015.
McCoy, D. T., Bender, F. A.-M., Grosvenor, D. P., Mohrmann, J. K., Hartmann, D. L., Wood, R., and Field, P. R.: Predicting decadal trends in cloud droplet number concentration using reanalysis and satellite data, Atmos. Chem. Phys., 18, 2035–2047, https://doi.org/10.5194/acp-18-2035-2018, 2018.
Mechoso, C. R., Wood, R., Weller, R., Bretherton, C. S., Clarke, A. D., Coe, H., Fairall, C., Farrar, J. T., Feingold, G., Garreaud, R., Grados, C., McWilliams, J., Szoeke, S. P. de, Yuter, S. E., and Zuidema, P.: Ocean–Cloud–Atmosphere–Land Interactions in the Southeastern Pacific: The VOCALS Program, Bulletin of the American Meteorological Society, 95, 357–375, https://doi.org/10.1175/BAMS-D-11-00246.1, 2014.
Mellado, J. P.: Cloud-Top Entrainment in Stratocumulus Clouds, Annu. Rev. Fluid Mech., 49, 145–169, https://doi.org/10.1146/annurev-fluid-010816-060231, 2017.
Michibata, T., Suzuki, K., Sato, Y., and Takemura, T.: The source of discrepancies in aerosol–cloud–precipitation interactions between GCM and A-Train retrievals, Atmos. Chem. Phys., 16, 15413–15424, https://doi.org/10.5194/acp-16-15413-2016, 2016.
Miller, M. A., Jensen, M. P., and Clothiaux, E. E.: Diurnal Cloud and Thermodynamic Variations in the Stratocumulus Transition Regime: A Case Study Using In Situ and Remote Sensors, Journal of the Atmospheric Sciences, 55, 2294–2310, https://doi.org/10.1175/1520-0469(1998)055<2294:DCATVI>2.0.CO;2, 1998.
Miller, S. D., Rogers, M. A., Haynes, J. M., Sengupta, M., and Heidinger, A. K.: Short-term solar irradiance forecasting via satellite/model coupling, Solar Energy, 168, 102–117, https://doi.org/10.1016/j.solener.2017.11.049, 2018.
Min, Q., Joseph, E., Lin, Y., Min, L., Yin, B., Daum, P. H., Kleinman, L. I., Wang, J., and Lee, Y.-N.: Comparison of MODIS cloud microphysical properties with in-situ measurements over the Southeast Pacific, Atmos. Chem. Phys., 12, 11261–11273, https://doi.org/10.5194/acp-12-11261-2012, 2012.
Minnis, P., Sun-Mack, S., Young, D. F., Heck, P. W., Garber, D. P., Chen, Y., Spangenberg, D. A., Arduini, R. F., Trepte, Q. Z., Smith, W. L., Ayers, J. K., Gibson, S. C., Miller, W. F., Hong, G., Chakrapani, V., Takano, Y., Liou, K.-N., Xie, Y., and Yang, P.: CERES Edition-2 Cloud Property Retrievals Using TRMM VIRS and Terra and Aqua MODIS Data – Part I: Algorithms, IEEE Trans. Geosci. Remote Sensing, 49, 4374–4400, https://doi.org/10.1109/TGRS.2011.2144601, 2011.
Minnis, P., Sun-Mack, S., Chen, Y., Chang, F.-L., Yost, C. R., Smith, W. L., Heck, P. W., Arduini, R. F., Bedka, S. T., Yi, Y., Hong, G., Jin, Z., Painemal, D., Palikonda, R., Scarino, B. R., Spangenberg, D. A., Smith, R. A., Trepte, Q. Z., Yang, P., and Xie, Y.: CERES MODIS Cloud Product Retrievals for Edition 4 – Part I: Algorithm Changes, IEEE Transactions on Geoscience and Remote Sensing, 59, 2744–2780, https://doi.org/10.1109/TGRS.2020.3008866, 2021.
NASA/LARC/SD/ASDC: SatCORPS CERES GEO Edition 4 Himawari-8 Northern Hemisphere Version 1.2, NASA Langley Atmospheric Science Data Center DAAC [data set], https://doi.org/10.5067/HIM08/CERES/GEO_ED4_NH_V01.2, 2018a.
NASA/LARC/SD/ASDC: SatCORPS CERES GEO Edition 4 Himawari-8 Southern Hemisphere Version 1.2, NASA Langley Atmospheric Science Data Center DAAC [data set], https://doi.org/10.5067/HIM08/CERES/GEO_ED4_SH_V01.2, 2018b.
Painemal, D. and Zuidema, P.: Assessment of MODIS cloud effective radius and optical thickness retrievals over the Southeast Pacific with VOCALS-REx in situ measurements, Journal of Geophysical Research: Atmospheres, 116, https://doi.org/10.1029/2011JD016155, 2011.
Painemal, D., Minnis, P., and O'Neill, L.: The Diurnal Cycle of Cloud-Top Height and Cloud Cover over the Southeastern Pacific as Observed by GOES-10, Journal of the Atmospheric Sciences, 70, 2393–2408, https://doi.org/10.1175/JAS-D-12-0325.1, 2013.
Painemal, D., Xu, K., Palikonda, R., and Minnis, P.: Entrainment rate diurnal cycle in marine stratiform clouds estimated from geostationary satellite retrievals and a meteorological forecast model, Geophysical Research Letters, 44, 7482–7489, https://doi.org/10.1002/2017GL074481, 2017.
Qiu, S., Zheng, X., Painemal, D., Terai, C. R., and Zhou, X.: Daytime variation in the aerosol indirect effect for warm marine boundary layer clouds in the eastern North Atlantic, Atmos. Chem. Phys., 24, 2913–2935, https://doi.org/10.5194/acp-24-2913-2024, 2024.
Qu, X., Hall, A., Klein, S. A., and DeAngelis, A. M.: Positive tropical marine low-cloud cover feedback inferred from cloud-controlling factors, Geophys. Res. Lett., 42, 7767–7775, https://doi.org/10.1002/2015GL065627, 2015.
Quaas, J., Boucher, O., and Lohmann, U.: Constraining the total aerosol indirect effect in the LMDZ and ECHAM4 GCMs using MODIS satellite data, Atmos. Chem. Phys., 6, 947–955, https://doi.org/10.5194/acp-6-947-2006, 2006.
Rahu, J., Trofimov, H., Post, P., and Toll, V.: Diurnal Evolution of Cloud Water Responses to Aerosols, J. Geophys. Res. Atmospheres, 127, https://doi.org/10.1029/2021JD035091, 2022.
Rogers, D. P., Yang, X., Norris, P. M., Johnson, D. W., Martin, G. M., Friehe, C. A., and Berger, B. W.: Diurnal Evolution of the Cloud-Topped Marine Boundary Layer. Part I: Nocturnal Stratocumulus Development, Journal of the Atmospheric Sciences, 52, 2953–2966, https://doi.org/10.1175/1520-0469(1995)052<2953:DEOTCT>2.0.CO;2, 1995.
Rosenfeld, D., Wang, H., and Rasch, P. J.: The roles of cloud drop effective radius and LWP in determining rain properties in marine stratocumulus, Geophysical Research Letters, 39, https://doi.org/10.1029/2012GL052028, 2012.
Rosenfeld, D., Zhu, Y., Wang, M., Zheng, Y., Goren, T., and Yu, S.: Aerosol-driven droplet concentrations dominate coverage and water of oceanic low-level clouds, Science, 363, eaav0566, https://doi.org/10.1126/science.aav0566, 2019.
Rosenfeld, D., Kokhanovsky, A., Goren, T., Gryspeerdt, E., Hasekamp, O., Jia, H., Lopatin, A., Quaas, J., Pan, Z., and Sourdeval, O.: Frontiers in Satellite-Based Estimates of Cloud-Mediated Aerosol Forcing, Reviews of Geophysics, 61, e2022RG000799, https://doi.org/10.1029/2022RG000799, 2023.
Scott, R. C., Myers, T. A., Norris, J. R., Zelinka, M. D., Klein, S. A., Sun, M., and Doelling, D. R.: Observed Sensitivity of Low-Cloud Radiative Effects to Meteorological Perturbations over the Global Oceans, Journal of Climate, 33, 7717–7734, https://doi.org/10.1175/JCLI-D-19-1028.1, 2020.
Slingo, A., Nicholls, S., and Schmetz, J.: Aircraft observations of marine stratocumulus during JASIN, Quart. J. Royal Meteoro. Soc., 108, 833–856, https://doi.org/10.1002/qj.49710845807, 1982.
Small, J. D., Chuang, P. Y., Feingold, G., and Jiang, H.: Can aerosol decrease cloud lifetime?, Geophys. Res. Lett., 36, L16806, https://doi.org/10.1029/2009GL038888, 2009.
Small, J. D., Chuang, P. Y., and Jonsson, H. H.: Microphysical imprint of entrainment in warm cumulus, Tellus B: Chemical and Physical Meteorology, 65, https://doi.org/10.3402/tellusb.v65i0.19922, 2013.
Smalley, K. M., Lebsock, M. D., and Eastman, R.: Diurnal Patterns in the Observed Cloud Liquid Water Path Response to Droplet Number Perturbations, Geophysical Research Letters, 51, e2023GL107323, https://doi.org/10.1029/2023GL107323, 2024.
Sun-Mack, S., Minnis, P., Chen, Y., Kato, S., Yi, Y., Gibson, S. C., Heck, P. W., and Winker, D. M.: Regional Apparent Boundary Layer Lapse Rates Determined from CALIPSO and MODIS Data for Cloud-Height Determination, Journal of Applied Meteorology and Climatology, 53, 990–1011, https://doi.org/10.1175/JAMC-D-13-081.1, 2014.
Toll, V., Christensen, M., Quaas, J., and Bellouin, N.: Weak average liquid-cloud-water response to anthropogenic aerosols, Nature, 572, 51–55, https://doi.org/10.1038/s41586-019-1423-9, 2019.
Trepte, Q. Z., Minnis, P., Sun-Mack, S., Yost, C. R., Chen, Y., Jin, Z., Hong, G., Chang, F.-L., Smith, W. L., Bedka, K. M., and Chee, T. L.: Global Cloud Detection for CERES Edition 4 Using Terra and Aqua MODIS Data, IEEE Transactions on Geoscience and Remote Sensing, 57, 9410–9449, https://doi.org/10.1109/TGRS.2019.2926620, 2019.
Trofimov, H., Bellouin, N., and Toll, V.: Large-Scale Industrial Cloud Perturbations Confirm Bidirectional Cloud Water Responses to Anthropogenic Aerosols, J. Geophys. Res. Atmospheres, 125, https://doi.org/10.1029/2020JD032575, 2020.
Twomey, S.: The Influence of Pollution on the Shortwave Albedo of Clouds, Journal of the Atmospheric Sciences, 34, 1149–1152, https://doi.org/10.1175/1520-0469(1977)034<1149:TIOPOT>2.0.CO;2, 1977.
Verlinden, K. L. and de Szoeke, S. P.: Simulating Radiative Fluxes through Southeastern Pacific Stratocumulus Clouds during VOCALS-REx, Journal of Atmospheric and Oceanic Technology, 35, 821–836, https://doi.org/10.1175/JTECH-D-17-0169.1, 2018.
Wang, Y., Zhao, C., McFarquhar, G. M., Wu, W., Reeves, M., and Li, J.: Dispersion of Droplet Size Distributions in Supercooled Non-precipitating Stratocumulus from Aircraft Observations Obtained during the Southern Ocean Cloud Radiation Aerosol Transport Experimental Study, Journal of Geophysical Research: Atmospheres, 126, e2020JD033720, https://doi.org/10.1029/2020JD033720, 2021.
Wilcox, E. M.: Stratocumulus cloud thickening beneath layers of absorbing smoke aerosol, Atmos. Chem. Phys., 10, 11769–11777, https://doi.org/10.5194/acp-10-11769-2010, 2010.
Wood, R.: Drizzle in Stratiform Boundary Layer Clouds. Part I: Vertical and Horizontal Structure, J. Atmos. Sci., 62, 3011–3033, https://doi.org/10.1175/JAS3529.1, 2005.
Wood, R. and Bretherton, C. S.: On the Relationship between Stratiform Low Cloud Cover and Lower-Tropospheric Stability, Journal of Climate, 19, 6425–6432, https://doi.org/10.1175/JCLI3988.1, 2006.
Wood, R. and Hartmann, D. L.: Spatial Variability of Liquid Water Path in Marine Low Cloud: The Importance of Mesoscale Cellular Convection, Journal of Climate, 19, 1748–1764, https://doi.org/10.1175/JCLI3702.1, 2006.
Wood, R., Bretherton, C. S., and Hartmann, D. L.: Diurnal cycle of liquid water path over the subtropical and tropical oceans: diurnal cycle of liquid water path, Geophys. Res. Lett., 29, 7-1-7–4, https://doi.org/10.1029/2002GL015371, 2002.
Zeider, K., McCauley, K., Dmitrovic, S., Siu, L. W., Choi, Y., Crosbie, E. C., DiGangi, J. P., Diskin, G. S., Kirschler, S., Nowak, J. B., Shook, M. A., Thornhill, K. L., Voigt, C., Winstead, E. L., Ziemba, L. D., Zuidema, P., and Sorooshian, A.: Sensitivity of aerosol and cloud properties to coupling strength of marine boundary layer clouds over the northwest Atlantic, Atmos. Chem. Phys., 25, 2407–2422, https://doi.org/10.5194/acp-25-2407-2025, 2025.
Zhang, J., Zhou, X., Goren, T., and Feingold, G.: Albedo susceptibility of northeastern Pacific stratocumulus: the role of covarying meteorological conditions, Atmos. Chem. Phys., 22, 861–880, https://doi.org/10.5194/acp-22-861-2022, 2022.
Zhang, X., Wang, H., Che, H.-Z., Tan, S.-C., Yao, X.-P., Peng, Y., and Shi, G.-Y.: Radiative forcing of the aerosol-cloud interaction in seriously polluted East China and East China Sea, Atmospheric Research, 252, 105405, https://doi.org/10.1016/j.atmosres.2020.105405, 2021.
Zheng, Y., Rosenfeld, D., and Li, Z.: Estimating the Decoupling Degree of Subtropical Marine Stratocumulus Decks From Satellite, Geophysical Research Letters, 45, 12560–12568, https://doi.org/10.1029/2018GL078382, 2018a.
Zheng, Y., Rosenfeld, D., and Li, Z.: The Relationships Between Cloud Top Radiative Cooling Rates, Surface Latent Heat Fluxes, and Cloud-Base Heights in Marine Stratocumulus, Journal of Geophysical Research: Atmospheres, 123, 11678–11690, https://doi.org/10.1029/2018JD028579, 2018b.
Zhou, X. and Feingold, G.: Impacts of Mesoscale Cloud Organization on Aerosol-Induced Cloud Water Adjustment and Cloud Brightness, Geophysical Research Letters, 50, e2023GL103417, https://doi.org/10.1029/2023GL103417, 2023.
The requested paper has a corresponding corrigendum published. Please read the corrigendum first before downloading the article.
- Article
(3992 KB) - Full-text XML
- Corrigendum
-
Supplement
(3336 KB) - BibTeX
- EndNote